
Submitted:
12 December 2024
Posted:
13 December 2024
You are already at the latest version
Abstract
Monitoring creatinine levels in urine helps to recognize kidney dysfunction. In this research we have developed a photocurable membrane for the detection of serum creatinine. Using a system based on field-effect transistors, we carried out comparative tests of creatinine recognition in solutions prepared in different matrices. The device was able to detect creatinine in water, synthetic urine and pH 4 buffer from the lowest concentration tested (3 mmol L-1), covering values between 21 % and 31 % within the range of creatinine variation for healthy individuals (3-27 mmol L-1) with measurement linearity of 97 %. The LOD achieved in the test was 1.31 mmol L-1 under flow conditions. With LOQs between 4.34 mmol L-1 and 24.13 mmol L-1. The system performed very well in the measurements, with hysteresis ranging from 1.1 % to 8.6 % for the different matrices tested. Up to 90 days after manufacture, the sensor still maintained more than 70% of its initial response, even when used periodically during the first week and when stored unused at -18 ºC, it was able to maintain 96.7 % of its initial response. The device used in the flow test only had a useful life of three days due to membrane saturation, which was not reversible. In the interference test, the membrane was also shown to respond to the urea molecule, but in a different response window, which allowed the contributions of the two molecules to be differentiated. EGFETs can be used to identify variations in creatinine concentration and can help in therapeutic decision-making.
Keywords:
EGFET
; creatinine
; sensors
; potentiometric detection
; 3D printing
; UV membrane
Introduction
Devices integrated into microfluidic chips allow for low consumption of reagents and samples, with a simplified recognition process and the possibility of automation and application in various locations. Among the research into integrated sensors, those that operate by field effect have gained special attention with detection chips formed from Extended Gate Field Effect Transistors - EGFETs. They are a promising alternative because they are easy to handle and can be used for a wide range of detections due to their extended gate and high input signal sensitivity [1,2].
Potentiometric configurations using EGFETs integrated into microfluidic chips have already been reported in the literature as a strategy to overcome fluid handling complexities, increase recognition sensitivity and reduce noise of electronic origin[3,4,5,6,7,8]. These devices have mostly been applied on the detection of the hydrogen potential (pH) of different sample media [9,10,11,12,13,14,15,16,17,18]. The operating principle of EGFETs can also be used to build sensors for purposes such as detecting markers of kidney dysfunction.
The prevalence of kidney dysfunction worldwide has shown a worrying annual rise [19]. It is known that in developed countries at least 10 % of the population has some form of renal dysfunction. This does not refer to a specific disease, but to a pathological condition caused by kidney disease or other factors that are not only associated with the kidneys [20].
In situations where the kidney's filtering and reabsorption functions are mainly compromised by some illness, the tissue chemistry of this organ is altered, which causes variations in glomerular filtration rates (GFR), which is the main indicator of the clinical stages of kidney dysfunction [21]. GFR estimation is monitored using serum creatinine levels (2-amino-1-methyl-5H-imidazol-4-one), which is one of the end products of protein metabolism in humans and the gold standard for recognizing kidney dysfunction [22].
The main technique for detecting kidney disease is renal tissue biopsy. However, they are usually avoided clinically because they carry a high risk of bleeding [21]. There are also other techniques used to recognize markers of kidney dysfunction, such as Magnetic Resonance Imaging, Magnetic Resonance Spectroscopy, Mass Spectrometry, Spectrophotometry and others. These techniques are expensive, time-consuming and some require a lot of sample dilution, which can lead to errors in the measurements [19,20,23].
Due to different factors, less than 10 % of people discover that they have kidney dysfunction in the early stages when treatment is most effective [21]. This is worrying because kidney damage is present in complications of diseases such as Alzheimer's, Parkinson's, cancer, diabetes, cardiovascular disease and multiple sclerosis [23,24]. In medical centers, patients with some type of kidney impairment are also more likely to have a cardiovascular event, multiple organ failure, bone disease, anemia, uremia, as well as longer hospital stays when undergoing any invasive medical procedures [21,25,26].
In recent years, researchers have proposed non-invasive detection methods such as the monitoring of metabolites in urine due to its many components that can be used as a possible matrix for the detection of degenerations, mainly renal [23]. Monitoring urine-based markers when compared to blood-based markers has some advantages such as non-invasive collection, less influence from circadian rhythm, meal consumption, stress and also a longer storage period without significant degradation that makes it impossible to recognize various clinical species [23].
Creatinine is present in both blood and urine [21,22,27,28,29,30]. As kidney function declines, i.e. there is a risk of death due to the kidneys not being able to perform their function in the body, creatinine levels in human urine also decrease, indicating that glomerular filtration rates are declining [43]. Although the rate of creatinine in the body is influenced by factors such as gender, body mass, height, among others, it is estimated that a stable range is between 3-27 mmol L-1 and a daily urinary decline of between 21 % and 31 % in these values would be indicative of a loss of kidney function [20,31,32]. As well as indicating kidney problems, this marker is also relevant for assessing thyroid function and muscle damage given the significant decreases in muscle mass in samples that are indicated by a creatinine range below 3 mmol L-1 [33] .
In the literature, a relatively inexpensive approach to creatinine detection has been sensors [33,34,35]. Most of the sensors discussed in the literature, however, assess creatinine concentration from an additional ammonium analysis or by a priori removal of ammonium for subsequent target recognition [27,32]. Directly identifying the concentration of creatinine in biological fluids such as urine therefore presents a research need. In addition, electrochemical biosensors in the literature have used a negative working potential in an attempt to avoid interfering species such as urea and other inorganic salts that coexist with creatinine in urine samples. This low electrode potential makes it impossible to carry out these analyses in real biological fluids [20,27].
Designing a device capable of distinguishing creatinine at a positive electrode potential applicable to real biological samples is a task that requires further study. Such scientific investment would enable the population to have rapid access to pathology tests, as well as to the response to examinations and the start of appropriate therapeutic treatments. At the same time, sudden changes in the clinical condition of patients are also factors that require agility in methods for recognizing metabolites that are markers of dysfunction. This is especially true if we consider the elderly or premature children, which can also contribute to regular monitoring [36].
Inexpensive, fast-response and sensitive biosensors can help monitor creatinine levels and are an accurate and reliable strategy for detecting kidney dysfunction. The main objective of this research was to develop a membrane in a gate of the Extended Gate Field Effect Transistors and integrated to microfluidic chip for identify serum creatinine in urine.
EGFETs have already been reported in the literature and applied in various applications, but never reported in research such as that carried out in this study. The results obtained in the EGFET tests were compared with results in the literature and chemical analyses carried out in the laboratory using the Capillary Electrophoresis technique with a Capacitively Coupled Contactless Conductivity Detection (C4D).
Materials and Methods
All reagents were of analytical grade and were used as received, unless otherwise indicated. Hydrochloric acid (HCl), potassium chloride (KCl) and sodium hydroxide (NaOH) from Synth (Brazil); Clear V4 acrylic resin from FormLabs (United States) and Clear Anycubic resin (China) were used; L-Histidine (L-His, >99 %), 2-(N-morpholino)ethanesulfonic acid (MES, >99 %), Potassium tetrakis[3,5- bis(trifluoromethyl)phenyl] borate (C32H12BF24K, >95 %), buffer solution, synthetic urine, crystallized anhydrous creatinine (98 %), deuterated chloroform (CDCl3), chloroform, methanol, pyrrole, pure acetone and powdered graphite were purchased from Sigma Aldrich (Brazil). Mesooctamethylcalix[4]pyrrole was synthesised by our group.
Creatinine samples were prepared in DI 18.2 MΩ cm water at 25 ºC, in commercial buffer solution with pH 4 and in 10 times diluted commercial synthetic urine. The creatinine concentrations in the matrices were 3, 5, 9, 12, 15, 17, 21, 24 and 27 mmol L-1.
Microfluidic chip
The microfluidic chip was manufactured using a Phrozen Sonic Mini 8 K 3D printer (China). The software used to create the 3D object was Fusion 360 Autodesk (San Rafael, USA). The software used to control the 3D printing and slicing of the object was Chitubox version 1.8 and the resin used for printing was Anycubic Clear (405 nm). The model used had a single-channel structure with sample inlet and outlet, which allowed efficient delivery of liquid to the electrodes placed at the side walls of the channel. The design of the chip and its characterization can be found in the Supplementary Material.
The reference electrode used for the tests was Ag/AgCl in a 3.0 mol L-1 potassium chloride. A detection membrane was made as the indicator electrode, as explained in the following section.
Creatinine Sensing Membrane: Construction and Characterization
To find the best ratio between the recognition species and the conductive membrane, we produced the paste using a mixture of FormLabs resin and graphite (8/9) as described in a previous work [37] and then added 10 mg of mesooctamethylcalix[4]pyrrole (OMCP).
We used ratios of 1:5, 1:10, 1:20, 1:30 and 1:40 between the conductive paste and the OMCP and used a copper wire as an electrical contact. The mixture was left to cure in a UV projection machine for 7 hours to harden the membrane. This configuration is referred to throughout the text as Mg1:5, Mg1:10, Mg1:20, Mg1:30 and Mg1:40, respectively.
Surface measurements of the sensor membrane were carried out to ascertain its structural properties in order to identify how the composition could affect its functioning. To do this, we carried out Attenuated Total Reflectance Fourier Transform Infrared Vibrational Spectroscopy (ATR-FTIR), which helped to obtain information on the molecular configuration and interactive structure of the membrane.
After obtaining information on the best ratio between conductive paste and recognition species, we added potassium tetrakis[3,5-bis(trifluoromethyl)phenyl] borate (KTPB) as an ion exchanger in an amount equivalent to 1/3 (in milligrams) of OMCP. Once weighed, the equivalent quantities were mixed in the following order: acrylic resin, OMCP, KTPB and finally powdered graphite. At each junction, we mixed the components by hand until they were visually well integrated. We then coated the copper wires with the prepared mixture and took them to the curing machine with 340-405 nm UV projection for 9 hours. Scanning Electron Microscopy was carried out to obtain information on the morphology of the membrane with the addition of each component.
Commercial MOS transistor
The commercial model 2N4351 (Motorola), which is a device with all four terminals (body, drain, source and gate) totally isolated, was the commercial MOSFET device model chosen for this research.
Before use, the electrical performance of the candidate MOSFETs was evaluated. Only commercial MOSFETs that passed the tests and showed similar performance in source-drain current and threshold voltage characteristics were considered for the experiments.
Measurements
Equipments such as voltage sources (Minipa MPL 3303M, China), a digital multimeter (Minipa ET-2517 true RMS, China), a syringe pump (Harvard Apparatus, USA), a Semiconductor Characterizer System (KI 4200 MPSMU, Keithley USA), copper wires and electrical interconnectors were used to carry out the measurements, arranged as shown in the Supplementary Material.
We carried out 2 types of measurements in solution for responses in the triode and saturation region of the MOS. These were (1) variation in the voltage between the gate and source (VGS) and between source and drain (VDS) measurement with the working and reference electrodes immersed in solutions contained in a beaker. The data from these measurements are referred to throughout the text as static measurements (SM). The VGS quoted in the measurements with fixed VDS refers to the potential applied to the reference electrode in relation to the indicator electrode; (2) same procedure as for measurement 1, with the electrodes positioned in the channel of the manufactured microchip and 500 μL/min flow injected by syringe pump. The data from this measurement is referred to throughout the text as flow measurements (FM).
In addition to analyzing the disturbance to the source-drain current caused by the different concentrations of the solutions, transfer characteristic curves (IDS-VT) were used as another method of investigating the response to the analytes, analyzing the threshold voltage caused by each concentration of the samples.
Sensor Evaluation Parameters
Source-drain current (IDS) and threshold voltage (VT) curves as a function of solution concentration were constructed from the average value of triplicate measurements for each solution concentration. The sensitivity in drain-source current was described as the variation of the linear curve when plotting the square root of IDS in the saturation region versus the concentration of the samples. The voltage in voltage was calculated as the variation of the linear curve when plotting VT versus the concentration of the solutions. We used Origin 8.1 to plot the graphs and obtain information from the curves. We used the triple signal-to-noise ratio to calculate the limit of detection (LOD) and limit of quantification (LOQ).
The linear fit of the current and voltage versus concentration curves provided us with the linearity of the measurement. R2 values closer to 1 indicated that the measurement was more linear, consequently having a higher percentage when multiplied by 100. We constructed the measurement data curve and calculated the linearity for the different solutions using Origin 8.1.
The sensor's hysteresis was measured by the IDS variation when the sensor was tested in the initial 15 mmol L-1 concentration sequence and then at 3, 5, 9, 12, 17, 21, 24 and 27 mmol L-1 of creatinine, where tests were again carried out in the 15 mmol L-1 solution during the concentration intervals. The hysteresis calculation used Equation 1 below,
where Vx(1) is the value of the current measured at the first concentration of 15 mmol L-1, i.e. at the start of the sequence, and Vx(n) is the value measured at the end of the sequence. Multiplying the value by 100 gives the hysteresis percentage.
For the stability test, the sensor was stored at -18 ºC and subsequently tested on the 1st, 3rd, 7th, 75th and 90th days after manufacture, at creatinine concentrations between 3 mmol L-1 and 27 mmol L-1.
The following section discusses the results of the tests described in our methodology.
Results and Discussions
Initially, to make the creatinine recognition membrane, we varied the ratio of recognition species to conductive paste by 1:40, 1:30, 1:20, 1:10 and 1:5. Figure 1 below shows the behavior of the membranes in the analyte solutions.
The groups N-H of the OMCP structure attract the oxygen atoms of creatinine to the cavity of the recognition molecule. The charged surface groups form an electrical structure at the membrane-solution interface. A change in the concentration of the solution alters the equilibrium state in the membrane, resulting in a change in electrical properties and surface potential [34].
The ratios 1:40 to 1:10 showed linear range up to at least a concentration of 10-3 mol L-1 of creatinine. The Mg.1:5 mixture showed the best linearity value in the measurement, with a significant extension of the linear response up to 10-5 mol L-1 being the greatest of all the proportions tested. After a concentration of 10-5 mol L-1, the membrane saturated and there was no significant IDS current variation in the sensor response, as can be seen in Figure 1. The results indicated that the ratio between the recognition species and the graphite-based conductive paste influenced the analytical response.
Based on this data, we decided to look at the Attenuated Total Reflection Fourier Transform Infrared Spectrum (ATR-FTIR) for all the membranes. We also carried out this test for the sample with only the graphite-based conductive paste and only with the synthesized OMCP. The spectra are shown in Figure 2a and 2b below.
For the conductive paste sample without OMCP, the spectrum in Figure 2 does not show a band in the 3440-3450 cm-1 region, which is characteristic of the N-H stretching of OMCP. This also occurs in the 1:40 and 1:30 ratios, where no bands can be seen in this region. At Mg.1:20 there is a small N-H band which increases dramatically up to Mg.1:5. This could be the cause of the better linear response in the measurements.
In order to obtain high-resolution images for evaluating the membrane's microstructural characteristics, we used Scanning Electron Microscopy (SEM) as the basic technique.
The following SEM image, Figure 3, shows the surface of the detection membrane throughout its manufacture, demonstrating the different contributions of each component to the morphology of the final membrane.
The photocurable resin, in Figure 3a, showed a homogeneous, smooth surface, without irregularities, with a more compact structure, as is expected for resins used to make objects by 3D printing. When joined with powdered graphite, Figure 3b, the structure begins to show a structural difference. This shows the morphology of stacked graphite flakes. The flake-like morphology is expected when the proportion of graphite in a mixture is high. In Figure 3c, the addition of OMCP showed significant white staining, demonstrating that the graphite skeleton that remains visible now has particles of the recognition species. Aggregation between the parts, however, does not appear to have been evenly distributed on the membrane surface, with agglomerations at some points. In Figure 3d, the resin with the OMCP and KTPB particles is cured covering the graphite skeleton and the graphite flakes become significantly smaller. The aggregation between all the parts is now more visible and the membrane now has a highly irregular surface, with cracks and voids [38,39,40,41,42,43]. The unevenness of the membrane shows that the components are so well mixed and that the curing of the resin has not caused the surface to have resin-only characteristics, as in Figure 3a. However, some areas of the membrane which are not reported in Figure 3d, have shown smoother characteristics. These smoother areas may decrease the sensitivity of the membrane.
Using creatinine concentrations within the range of 3 - 27 mmol L-1 with a variation between 21 % and 31 % in these values, we checked how the IDS current varied for the samples in pH 4 buffer, water and synthetic urine using the membrane shown in Figure 3d. Figure 4 below is a compilation of the behavior obtained for the tests in the different matrices tested.
In order to function as an EGFET, the OMCP must bind to the protonated form of creatinine in the solutions, which leads to charge separation across the membrane interface, culminating in a variation in current and voltage [44,45].
The OMCP has a well-defined cavity that exhibits charge complementarity with the positively charged creatinine. Its endofunctional cavity ensures greater selectivity for the species. Due to the more displaced nature of the positive charge on the target molecule, its interaction with the OMCP occurs through hydrogen bonding forces and cooperative effects of CH-π interactions [34,46].
The chemical interaction that occurs between creatinine in solution and the membrane's MCPO can be briefly explained by the establishment of hydrogen bonds between creatinine's oxygen and the N-H protons present in the MCPO cavity, which can act as a heteroditopic receptor [34]. Once trapped, the molecule causes a variation in the potential on the surface of the working electrode which is detected by the MOS from a variation in the device's IDS current and its intensity is proportional to the concentration of creatinine in the sample.
In the attraction between creatinine's OMP and oxygen protons to the cavity of the recognition molecule, the charged surface groups form an electrical structure at the electrode-solution interface. A change in concentration alters the equilibrium state in the membrane, resulting in a change in electrical properties and surface potential [46].
In the static measurements, the current sensitivity for the measurements was 0.8442 (mA)1/2 mmol-1 L with a linearity of 92.8 % for solutions in water and 0.8390 (mA)1/2 mmol-1 L with 90.3 % linearity for urine solutions. In the buffer, the current sensitivity was 0.9625 (mA)1/2 mmol-1 L with a linearity of 85.1 %. In these measurements, the sensor achieved detection of the minimum concentration tested, which was 3 mmol L-1. For the flow system, the current sensitivity was 2.6819 (mA)1/2 mmol-1 L with a linearity of 88.2 % for the water solutions and 0.8529 (mA)1/2 mmol-1 L with 91.8 % linearity for synthetic urine solutions. For the pH 4 buffer, the sensor reached 0.9589 (mA)1/2 mmol-1 L with a linearity of 97.0 %, with minimum detection at a concentration of 3 mmol L-1 in all cases.
In Figure 4c, the behavior of the sensitivity values in current can be explained by the fact that in water (pH 7) there is more of a neutral state of the molecule than in cation, causing the response to be lower in this matrix than in the buffer (pH 4). In urine solutions, the response decreases because in this case the creatinine molecule is not alone in the solution and can be influenced by other species present in the commercial matrix [34,46].
In the flow test, Figure 4d, the current behavior varies, with creatinine in water having the highest sensitivity of all the samples. This was not expected, since in the pH 4 buffer, due to the molecule being in an acidic environment below its pKa = 4.8, there should be the most protonated state of creatinine. And the distribution of the species would be responsible for modulating the charge. What may have occurred is a widening of the source-drain channel for measurements in water, which influenced the analytical response [44,45,46].
The LOD calculated on the basis of the linear fit of the measurements for the water samples in the SM was 4.9 mmol L-1 and in the FM was 6.5 mmol L-1 for the IDS measurements. For urine, the LODs were 5.5 mmol L-1 in SM and 5.3 mmol L-1 in FM. For the pH 4 buffer, the LODs were 6.3 mmol L-1 in SM and 1.3 mmol L-1 in FM. The LOQs were 16.2 mmol L-1 in SM and 21.4 mmol L-1 in FM for the water solution and 18.4 mmol L-1 in SM and 17.5 mmol L-1 in the same test for urine. In the buffer, the LOQs were 20.9 mmol L-1 in SM and 4.3 mmol L-1 in FM.
Comparing the responses, we see that the greatest linearity occurred for the current measurement of the buffer solution in the flow test. But the greatest sensitivity occurred in the FM water test. The sensitivity values for urine in the flow and static tests were equivalent, while for the water test the sensitivity varied drastically when the experimental conditions were varied. This variation may have been caused by the possible saturation of the recognition membrane or by the strangulation of the MOS source-drain channel due to the flow of solution in contact with the membrane.
In the voltage sensitivity values highlighted from this point onwards, we must consider that they were much lower than those determined by the Nernst equation, since the variation in the concentrations of the samples were not in decades and were very close concentration values.
Figure 5 shows the detection behavior given by the IDS-VT relationship.
The voltage sensitivity for these measurements was 5.63 mV mmol-1 L for solutions in water with a linearity of 89.2 %. For solutions in urine, it was 1.58 mV mmol-1 L with a linearity of 95.3 %. For solutions in buffer, it was 2.6 mV mmol-1 L with a linearity of 91.0 %. The voltage sensitivity for flow measurements was 3.5 mV mmol-1 L for solutions in water with a linearity of 81.9 %. For urine solutions, it was 0.71 mV mmol-1 L with a linearity of 96.2 %. In buffer, the values were 2.0 mV mmol-1 L with a linearity of 93.8 %. In flow, only the samples prepared in urine were able to linearly cover the entire test concentration range. For the water samples, the sensitivity in flow only covered concentrations of 5-24 mmol L-1 and for the buffer this value was 12-27 mmol L-1. In the buffer, it was possible to verify the inversion phenomenon, when the surface inverts the type of charge that modulates the loading of the MOS input signal [47].
Based on the linear fit of the measurements for the water samples, the LOD for SM was 6.1 mmol L-1 and 7.2 mmol.L-1 for FM. In the urine test it was 3.9 mmol L-1 for SM and 4.2 mmol L-1 for FM. In the buffer test, it was 5.2 mmol L-1 in SM and 4.9 mmol L-1 in FM. The LOQs were 20.4 mmol L-1 in SM and 24.1 mmol L-1 in FM for water, 13.1 mmol L-1 in SM and 14.0 mmol L-1 in FM for urine and 17.2 mmol L-1 in SM and 16.2 mmol L-1 in FM for buffer.
In the flow measurements, the voltage sensitivity was higher for the samples prepared in water. For these samples and the urine samples, the variation in the type of test (SM or FM) led to a reduction in sensitivity of around 50 % between the static test and the no-flow test. The voltage sensitivity for the buffer was equivalent in both tests. A comparative table of sensitivity values and other parameters can be found in the Supplementary Material, where it is possible to compare the data with other creatinine detection studies [48,49,50,51,52,53,54,55,56,57,58,59,60,61,62,63,64,65].
The sensor stability results showed a low rate of deviation in the responses to the static measurements in the water tests, 28.2 % between the first and last day for the VT test and 5.4 % for the IDS values. For the urine tests, the values were 39.8 % and 31.0 %, respectively. On the other hand, in the buffer it was 32.0 % VT and 21.3 % for IDS. From day seven to day 75, the sensor was stored at -18 ºC, unused, and under these conditions it showed a variation in responses of only 3.3 %. These data indicated that the greatest losses in the sensor's responses were related to its use in the measurements.
The deviation rates for the sensor used in the flow measurements were 85.8 % for water, 43.7 % for urine and 49.8 % for buffer in the IDS responses and 39.7 %, 92.2 % and 69.1 % for buffer in the VT responses, respectively, between the first and third day of analysis. Due to the high rates of variation even with storage at low temperatures, the flow measurement configuration was only used in the tests on the first and third day, and was discarded for the other measurements on subsequent days.
As for hysteresis, this was only tested for the static measurement device, showing 8.6 % variation in the water solutions, 1.1 % for the urine tests and 3.2 % for the pH 4 buffer solution. Figure 6 below shows the hysteresis behavior in the different matrices.
As can be seen in Figure 6 above, the hysteresis for the higher concentrations was lower than in the intervals for concentrations below 15 mM (up to test no. 5). This is due to the stability of the measurements for values above the one chosen (15 mM) [34,46].
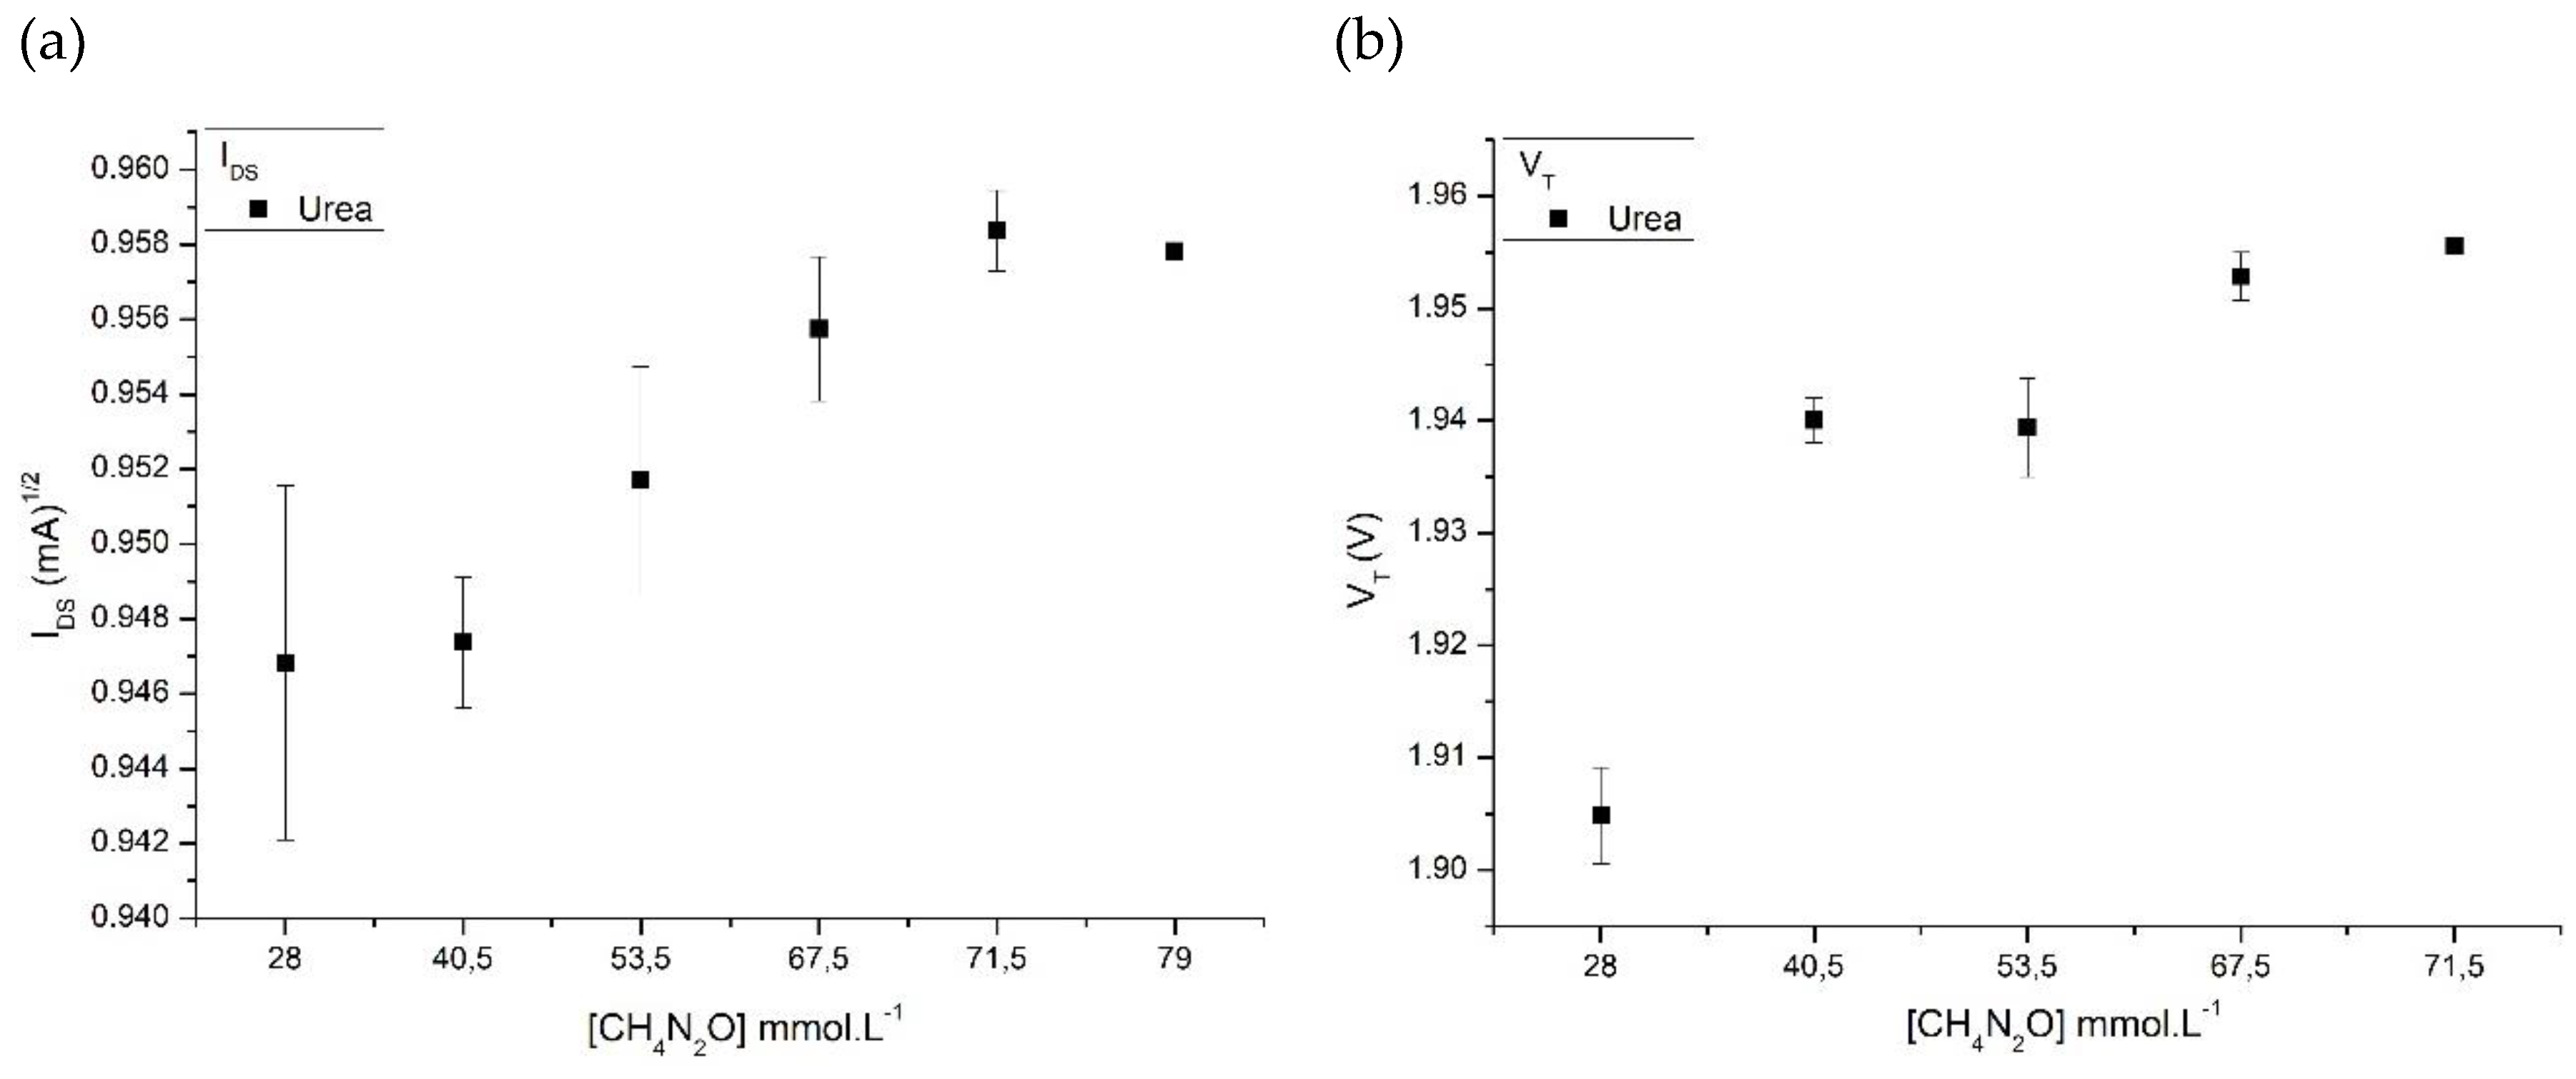
The selectivity of the sensor was tested with concentrations of urea, since it is one of the predominant species in human urine. According to the literature, urine can contain from 28 mmol L-1 to 79 mmol L-1 of urea, so we used six points between these initial and final values. In the test, carried out in triplicate, Figure 7 below shows the current and threshold voltage behavior of the membrane in relation to the different concentrations of urea.
The membrane also showed a response to urea, but behaved differently from creatinine detection in terms of the current measurement range and voltage. The current behavior increased with increasing urea concentration instead of a decrease as occurs for creatinine. In addition, the detection range of urea VT is much lower than the values obtained with creatinine, even though there is a large variation in concentration between the respective samples. This means that the two species can be graphically differentiated. However, the selectivity of the membrane, as the data shows, is not efficient for detecting creatinine alone.
The results of the Capillary Electrophoresis test using the C4D detector for the creatinine samples prepared in water, urine and buffer are discussed in the Supplementary Material.
Conclusion
In this research we sought to develop a device that could measure the variation of creatinine in water, urine and buffer from static and dynamic measurements in which we investigated the behavior of a field-effect transistor with extended gate in the detection of this analyte from the responses of variations in the IDS current and in the gate threshold voltage VT of a commercial MOS. The results obtained demonstrated the feasibility of the recognition system. The membrane showed good linearity in the measurements with excellent current and voltage sensitivity values, even in the small concentration variation window.
The sensor used in the static measurements showed a response of over 70% up to at least 90 days after it was made, even though it was used in three different measurements during the first week. This response is even greater when we consider storing the device at low temperatures.
The sensor in the flow system showed good detection results on the first day of testing, but there was a considerable loss of analytical response on the third day of use. This showed the unfeasibility of the flow system for comparative measurements and prolonged use. We believe, however, that this is related to the size of the electrode, which has few points of interaction between the recognition species and the sample, which could be improved with a new microfluidic chip configuration and a new measurement method that considers a smaller amount of flow or cleaning of the electrode between measurements. Optimizations in the measurement configuration for future use could also lead to better LOD values for static measurements.
Overall, the use of EGFETs for creatinine detection has proven to be a versatile, simple and inexpensive tool that can be adapted to a portable sensor. In the present study, we also present a new way of fabricating the membrane for recognition of this analyte using UV properties, which makes steps such as the immobilization of the recognition species on the transduction surface quickly achievable.
Supplementary Material
The following supporting information can be downloaded at the website of this paper posted on Preprints.org.
References
- [1] Mello, H. J. N. P. D., Bueno, P. R. & Mulato, M. Comparingglucose and urea enzymatic electrochemical and optical biosensors based on polyaniline thin films. Anal. Methods, 12, 4199–4210, (2020). [CrossRef]
- [2] Chiang, J.-L., Shang, Y.-G., B. K. Yadlapalli, F.-P. Yu, and Wuu, D.-S. Ga2o3nanorod-based extended-gate field-effect transistors for ph sensing. Materials Science and Engineering: B, 276, 115542, (2022). [CrossRef]
- [3] Niu, P., Jiang, J., Liu, K., Wang, S., Jing, J., Xu, T., Wang, T., Liu, Y. & Liu. T. Fiber-integrated wgm optofluidic chip enhanced by microwavephotonic analyzer for cardiac biomarker detection with ultra-high resolution. Biosensors and Bioelectronics, 208, 114238, (2022). [CrossRef]
- [4] Sinha, A., Tai, T.-Y., Li, K.-H., Gopinathan, P., Chung, Y.-D., Sarangadharan, I., Ma, H.-P., Huang, P.-C., Shiesh, S.-C., Wang, Y.-L. & Lee, G.-B. An integrated microfluidic system with field-effect-transistor sensor arrays for detecting multiple cardiovascular biomarkers from clinical samples. Biosensors and Bioelectronics, 129, 155–163, (2019). [CrossRef]
- [5] Laliberte, K., Scott, P., Khan, N. I., Mahmud, M. S. & Song, E. A wearable graphene transistor-based biosensor for monitoring il-6 biomarker. Microelectronic Engineering, 262, 111835, (2022). [CrossRef]
- [6] Song, P., Fu, H., Wang, Y., Chen, C., Ou, P. Rashid, R. T. Duan, S. Song, J. Mi, Z. & Liu, X. A microfluidic field-effect transistor biosensor with rolled-up indium nitridemicrotubes. Biosensors and Bioelectronics, 190, 113264, (2021). [CrossRef]
- [7] Chou, C.-H., Lim, J.-C., Lai, Y.-H., Chen, Y.-T., Lo, Y.-H. & Huang, J.-J. Characterizations of protein-ligand reaction kinetics by transistor-microfluidic integrated sensors. Analytica Chimica Acta, 1110, 1–10, (2020). [CrossRef]
- [8] Chen, T.-Y., Yang, T.-H., Wu, N.-T., Chen, Y.-T. & Huang, J.-J. Transient analysis of streptavidin-biotin complex detection using an igzo thin film transistor-based biosensor integrated with a microfluidic channel. Sensors and Actuators B: Chemical, 244, 642–648 (2017). [CrossRef]
- [9] Khizir H. A. & Abbas, T. A.-H. Hydrothermal synthesis of tio2 nanorods as sensing membrane for extended-gate field-effect transistor (egfet) ph sensing applications. Sensors and Actuators A: Physical, 333, 113231, (2022). [CrossRef]
- [10] Manjakkal, L., Sakthivel, B., Gopalakrishnan, N. & Dahiya, R. Printed flexibleelectrochemical ph sensors based on cuo nanorods,” Sensors and Actuators B: Chemical, 263, 50–58, (2018). [CrossRef]
- [11] Casimero, C., McConville, A., Fearon, J.-J., Lawrence, C. L. C., Taylor, M., Smith, R. B. & Davis, J. Sensor systems for bacterial reactors: A newflavin-phenol composite film for the in situ voltammetric measurement of ph. Analytica Chimica Acta, 1027, 1–8, (2018). [CrossRef]
- [12] Cho W.-J. & Lim, C.-M. Sensing properties of separative paper-based extended-gate ion-sensitive field-effect transistor for cost effective ph sensor applications. Solid-State Electronics, 140, 96–99, (2018). [CrossRef]
- [13] Rasheed, H. S., Ahmed, N. M. & Matjafri, M. Ag metal mid layer based on newsensing multilayers structure extended gate field effect transistor (eg-fet) for ph sensor. Materials Science in Semiconductor Processing, 74, 51–56, (2018). [CrossRef]
- [14] Slewa, L. H., Abbas, T. A. & Ahmed, N. M. Synthesis of quantum dot porous silicon as extended gate field effect transistor (egfet) for a ph sensor application. Materials Science in Semiconductor Processing, 100, 167–174, (2019). [CrossRef]
- [15] Kang, J.-W. & Cho, W.-J. Achieving enhanced ph sensitivity using capacitive coupling in extended gate fet sensors with various high-k sensing films. Solid-State Electronics, 152, 29–32, (2019). [CrossRef]
- [16] Bazilah, A., Awang, Z., Shariffudin, S. S., Hamid, N. H. & Herman, S. H. Sensing and physical properties of zno nanostructures membrane. Materials Today: Proceedings, 16, 1864–1870, (2019). [CrossRef]
- [17] Ahmed, N. M., Sabah, F. A., Kabaa, E. & Myint, M. T. Z. Single- and double-thread activated carbon fibers for ph sensing. Materials Chemistry and Physics, 221, 288–294, (2019). [CrossRef]
- [18] Chung, W.-Y., Silverio, A. A., Tsai, V. F., Cheng, C., Chang, S.-Y., Ming-Ying, Z., Kao, C.-Y., Chen, S.-Y., Pijanowska, D. G., Rustia, D. & Lo, Y.-W. An implementation of an electronic tongue system based on a multi-sensor potentiometric readout circuit with embedded calibration and temperaturecompensation. Microelectronics Journal, 57, 1–12, (2016). [CrossRef]
- [19] Pundir, C., Kumar, P. & Jaiwal, R. Biosensing methods for determination of creatinine: A review. Biosensors and Bioelectronics, 126, 707–724, (2019). [CrossRef]
- [20] Dong, Y., Luo, X., Liu, Y., Yan, C., Li, H., Lv, J., Yang, L. & Cui, Y. Adisposable printed amperometric biosensor for clinical evaluation of creatinine inrenal function detection. Talanta, 248, 123592, (2022). [CrossRef]
- [21] Humphries, T. L., Vesey, D. A., Galloway, G. J., Gobe, G. C. & Francis, R. S. Identifying disease progression in chronic kidney disease using proton magneticresonance spectroscopy. Progress in Nuclear Magnetic Resonance Spectroscopy, 134-135, 52–64, (2023). [CrossRef]
- [22] Mak, R. H. & Abitbol,bC. L. Standardized urine biomarkers in assessing neonatal kidney function: are we there yet?. Jornal de Pediatria, 97, 5, 476–477, (2021). [CrossRef]
- [23] Balhara, N., Devi, M., Balda, A., Phour, M. & Giri, A. Urine; a new promisingbiological fluid to act as a non-invasive biomarker for different human diseases. URINE, 5, 40–52, (2023). [CrossRef]
- [24] Lorente, D. G., Lorente, J. G. & Usach, T. S. Repeticion de lamedicion de creatinina serica en atencion primaria: no todos tienen insuficienciarenal crônica. Nefrologia, 35, 4, 395–402, (2015). [CrossRef]
- [25] Nkuipou-Kenfack ,E., Latosinska, A., Yang, W.Y., Fournier M.C., Blet, A., Mujaj, B., Thijs, L., Feliot, E., Gayat, E., Mischak, H., Staessen, J.A., Mebazaa, A., Zhang, Z.Y., French & European Outcome Registry in Intensive Care Unit Investigators. A novel urinary biomarker predicts 1-year mortality after discharge from intensive care. Crit Care, 24, 1, 10, (2020). [CrossRef]
- [26] Askenazi, D. J. No matter the hemisphere or language, neonatal acute kidney injury is common and is associated with poor outcomes. Jornal de Pediatria, 99, 3, 203–204, (2023). [CrossRef]
- [27] Stasyuk, N., Zakalskiy, A., Nogala, W., Gawinkowski, S., Ratajczyk, T., Bonarowska, M., Demkiv, O., Zakalska, O., & Gonchar, M. A reagentless amperometric biosensor for creatinine assay based on recombinant creatinine deiminase and n-methylhydantoin-sensitive cocu nanocomposite. Sensors and Actuators B: Chemical, 393, 134276, (2023). [CrossRef]
- [28] Rumpel, J., Spray, B. J., Chock, V. Y., Kirkley, M. J., Slagle, C. L., Frymoyer, A., Cho, S.-H., Gist, K. M., Blaszak, R., Poindexter, B. & Courtney, S. E. Urinebiomarkers for the assessment of acute kidney injury in neonates with hypoxic ischemic encephalopathy receiving therapeutic hypothermia. The Journal of Pediatrics, 241, 133–140.e3, (2022). [CrossRef]
- [29] Moraes, L. H. A., Krebs, V. L. J., Koch, V. H. K., Magalhaes, N. A. M. & Carvalho, W. B. Risk factors of acute kidney injury in very low birth weight infantsin a tertiary neonatal intensive care unit. Jornal de Pediatria, 99, 3, 235–240, (2023). [CrossRef]
- [30] Barrio, R. C., Agustin, J. A., Manzano, M. C., Garcıa-Rubira, J. C., Fernandez-Ortiz, A., Vilacosta, I. & Macaya, C. In-hospital prognostic value of glomerular filtration rate inpatients with acute coronary syndrome and a normal creatinine level. Revista Espanola de Cardiologia (English Edition), 60, 7, 714–719, (2007). https://pubmed.ncbi.nlm.nih.gov/17663855/.
- [31] Ashakirin, S. N., Zaid, M. H. M., Haniff, M. A. S. M., Masood, A. & Wee., M.F. M. R. Sensitive electrochemical detection of creatinine based on electrodeposited molecular imprinting polymer modified screen printed carbon electrode. Measurement, 210, 112502, (2023). [CrossRef]
- [32] Gonzalez-Gallardo, C. L., Arjona, N., Álvarez-Contreras, L., & Guerra-Balcázar, M. Electrochemical creatinine detection for advanced point-of-care sensing devices: a review. RSC Advances, 12, 47, 30785-30802, (2022). [CrossRef]
- [33] Jadhav, R. B., Patil, T. & Tiwari, A. P. Trends in sensing of creatinine by electrochemical and optical biosensors. Applied Surface Science Advances, 19, 100567, (2024). [CrossRef]
- [34] Guinovart, T., Hernandez-Alonso, D., Adriaenssens, L., Blondeau, P., Rius, F. X., Ballester, P. & Andrade, F. J. Characterization of a new ionophore-basedion-selective electrode for the potentiometric determination of creatinine in urine. Biosensors and Bioelectronics, 87, 587–592, (2017). [CrossRef]
- [35] Kukkar, D., Zhang, D., Jeon, B. & Kim, K.-H. Recent advances in wearablebiosensors for non-invasive monitoring of specific metabolites and electrolytes associated with chronic kidney disease: Performance evaluation and future challenges. TrAC Trends in Analytical Chemistry, 150, 116570, (2022). [CrossRef]
- [36] N.-J. M. M. Gohiya, P. Study of neonatal acute kidney injury based on kdigo criteria. Pediatrics and Neonatology, 63, 66–70, (2022). [CrossRef]
- [37] Costa, B. M. de C., Griveau, S., Bedioui, F., Orlye, F. d’, Silva, J. A. F. & Varenne, A. Stereolithography based 3d-printed microfluidic device with integratedelectrochemical detection. Electrochimica Acta, 407, 139888, (2022). [CrossRef]
- [38] Yörük, Ö., Uysal, D., Doğan, Ö. M. Carbon-assisted hydrogen production via electrolysis at intermediate temperatures: Impact of mineral composition, functional groups, and membrane effects on current density. Fuel, 380, 133268, (2025). [CrossRef]
- [39] Sacko, A., Nure, J. F., Motsa, M. M., Nyoni, H., Mamba, B., Nkambule, T., Msagati, T. A.M. Graphitic carbon nitride embedded in polymeric membrane from polyethylene terephthalate microplastic for water treatment. Journal of Water Process Engineering, 68, 106458, (2024). [CrossRef]
- [40] Wu, F., Li, X., Jiao, Y., Pan, C., Fan, G., Long, Y., Yang, H. Multifunctional flexible composite membrane based on nanocellulose-modified expanded graphite/electrostatically spun fiber network structure for solar thermal energy conversion. Energy Reports, 11, 4564-4571, (2024). [CrossRef]
- [41] Liu, H. Duan, P., Wu, Z., Liu, Y., Yan, Z., Zhong, Y., Wang, Y., Wang, X. Silicon/graphite/amorphous carbon composites as anode materials for lithium-ion battery with enhanced electrochemical performances. Materials Research Bulletin, 181, 113082, (2025). [CrossRef]
- [42] Hao, Y., Chen, D., Yang, G., Hu, S., Wang, S., Pei, P., Hao, J., Xu, X. N-doped porous graphite with multilevel pore defects and ultra-high conductivity anchoring Pt nanoparticles for proton exchange membrane water electrolyzers. Journal of Energy Chemistry, In press (2024). [CrossRef]
- [43] Song, C., Liu, M., Du, L., Chen, J., Meng, L., Li, H. Hu, J. Effect of grain size of graphite powder in carbon paper on the performance of proton exchange membrane fuel cell. Journal of Power Sources, 548, 2022, 232012, (2022). [CrossRef]
- [44] Corba, A., Sierra, A. F., Blondeau, P., Giussani, B., Riu, J., Ballester, P., Andrade, F. J. Potentiometric detection of creatinine in the presence of nicotine: Molecular recognition, sensing and quantification through multivariate regression. Talanta, 246, 123473, (2022). [CrossRef]
- [45] Guinovart, T., Hernández-Alonso, D., Adriaenssens, L., Blondeau, P., Martínez-Belmonte, M., Rius, F. X., Andrade, F. J., Ballester, P. Recognition and Sensing of Creatinine. Angewandte Chemie International Edition, 55, 7, 2435-2440. (2016). [CrossRef]
- [46] Lu, Y., Wang, S., He, S., Huang, Q., Zhao, C., Yu, S., Jiang, W., Yao, H., Wang, L., & Yang, L. An endo-functionalized molecular cage for selective potentiometric determination of creatinine. Chem. Sci. 15, 36, 14791-14797, (2024). [CrossRef]
- [47] Sedra A. S. & Smith, K. C. Microelectronic Circuits, 5th ed. Oxford University Press, (2004).
- [48] Ko, C., Tseng, C., Lu, S., Lee, C., Kim, S., & Fu, L. Handheld microfluidic multiple detection device for concurrent blood urea nitrogen and creatinine ratio determination using colorimetric approach. Sensors and Actuators B: Chemical, 422, 136585, (2025). [CrossRef]
- [49] Parra, L. M. H., Laucirica, G., Toimil-Molares, M. E., Marmisollé, W., & Azzaroni, O. Sensing creatinine in urine via the iontronic response of enzymatic single solid-state nanochannels, Biosensors and Bioelectronics, 268, 116893, (2025). [CrossRef]
- [50] Das, C., Raveendran, J., Bayry, J. & Rasheed, P. A. Selective and naked eye colorimetric detection of creatinine through aptamer-based target-induced passivation of gold nanoparticles. RSC Adv., 14, 46, 33784-33793 (2024). [CrossRef]
- [51] Chandhana J.P., Roshith M., Vasu, S. P., Kumar, D. V. R., Satheesh B. T.G., High aspect ratio copper nanowires modified screen-printed carbon electrode for interference-free non-enzymatic detection of serum creatinine in neutral médium. Journal of Electroanalytical Chemistry. 971, 118605, (2024). [CrossRef]
- [52] Peng, S., Yan, L., You, R., Lu, Y., Liu, Y. & Li, L. Cationic cellulose dispersed Ag NCs/C-CNF paper-based SERS substrate with high homogeneity for creatinine and uric acid detection. International Journal of Biological Macromolecules, 282, 136724, (2024). [CrossRef]
- [53] Saputra, E. A colorimetric detection of creatinine based-on EDTA capped-gold nanoparticles (EDTA-AuNPs): Digital image colorimetry. Sensors International, in press, 100286, (2024). [CrossRef]
- [54] Manikandan, R., Yoon, J., Lee, J. & Chang, S. Non-enzymatic disposable paper sensor for electrochemical detection of creatinine. Microchemical Journal, 204, 111114, (2024). [CrossRef]
- [55] Huang, J., Sokolikova, M., Ruiz-Gonzalez, A., Kong, Y., Wang, Y., Liu, Y., Xu, L., Wang, M., & Mattevi, C., Davenport, A., Lee, T. & Li, B. Ultrasensitive colorimetric detection of creatinine via its dual binding affinity for silver nanoparticles and silver ions. RSC Adv., 14, 13, 9114-9121 (2024). [CrossRef]
- [56] Sasikumar, T., Shanmugaraj, K., Nandhini, K., Kim, J. T., & Ilanchelian, M. Red-emitting copper nanoclusters for ultrasensitive and selective detection of creatinine and its application in portable smartphone-based paper strips and polymer thin film. Surfaces and Interfaces, 53, 105014, (2024). [CrossRef]
- [57] Zhang, Q., Yang, R., Liu, G., Jiang, S., Wang, J., Lin, J., Wang, T., Wang, J., Huang, Z. Smartphone-based low-cost and rapid quantitative detection of urinary creatinine with the Tyndall effect, Methods, 221, 12-17, (2024). [CrossRef]
- [58] Bajpai, S., Akien, G. R., & Toghill, K. E. An alkaline ferrocyanide non-enzymatic electrochemical sensor for creatinine detection. Electrochemistry Communications, 158, 107624, (2024). [CrossRef]
- [59] Tirkey, A. & Babu, P. J. Synthesis and characterization of citrate-capped gold nanoparticles and their application in selective detection of creatinine (A kidney biomarker), Sensors International, 5, 100252, (2024). [CrossRef]
- [60] Chhillar, M., Kukkar, D., Yadav, A. K. & Kim, K. Nitrogen doped carbon dots and gold nanoparticles mediated FRET for the detection of creatinine in human urine samples. Spectrochimica Acta Part A: Molecular and Biomolecular Spectroscopy, 321, 124752, (2024). [CrossRef]
- [61] Nazar, H. R. S., Ahmadi, V. & Nazar, A. R. S. Mach-Zehnder interferometer fiber optic sensor coated with UiO-66 metal organic framework for creatinine detection. Measurement, 225, 114015, (2024). [CrossRef]
- [62] Patel, M. R., Park, T. J., & Kailasa, S. K. Eu3+ ion-doped strontium vanadate perovskite quantum dots-based novel fluorescent nanosensor for selective detection of creatinine in biological samples. Journal of Photochemistry and Photobiology A: Chemistry, 449, 115376, (2024). [CrossRef]
- [63] Afshary, Hosein & Amiri, Mandana. A fast and highly selective ECL creatinine sensor for diagnosis of chronic kidney disease. Sens. Diagn. 3, 9, 1562-1570 (2024). [CrossRef]
- [64] Mishra, P., Gupta, P., Singh, B. P., Kedia, R., Shrivastava, S., Patra, A., Hwang, S., & Agrawal, V. V. Advancing paper microfluidics: A strategic approach for rapid fabrication of microfluidic paper-based analytical devices (µPADs) enabling in-vitro sensing of creatinine. Journal of Molecular Liquids, 411, 125707, (2024). [CrossRef]
- [65] Das, M., Chakraborty, T. & Kao, C. H. Sol-gel synthesized RexBi1-x-O thin films for electrochemical creatinine sensing: A facile fabrication approach. Materials Chemistry and Physics, 315, 128889, (2024). [CrossRef]
- [66] Grochocki, W., Markuszewski, M. J. & Quirino, J. P. Simultaneous determination of creatinine and acetate by capillary electrophoresis with contactless conductivity detector as a feasible approach for urinary tract infection diagnosis. Journal of Pharmaceutical and Biomedical Analysis, 137, 178-181, (2017). [CrossRef]
Figure 1.
Graph of IDs signals for different creatinine concentrations when the ratio between graphite-based conductive paste and OMCP was varied. VGS set at 3.5 V and VDS 5 V. Measurements made on 4 mL of sample. Linearity values up to 10-5 mol. L-1 for Mg1:5 and 10-3 mol L-1 for the other ratios.
Figure 1.
Graph of IDs signals for different creatinine concentrations when the ratio between graphite-based conductive paste and OMCP was varied. VGS set at 3.5 V and VDS 5 V. Measurements made on 4 mL of sample. Linearity values up to 10-5 mol. L-1 for Mg1:5 and 10-3 mol L-1 for the other ratios.
Figure 2.
Infrared spectra (ATR-FTIR). (a) Set of spectra for different proportions of OMCP + graphite-based conductive paste. (b) Highlight for the N-H stretching region of the spectrum.
Figure 2.
Infrared spectra (ATR-FTIR). (a) Set of spectra for different proportions of OMCP + graphite-based conductive paste. (b) Highlight for the N-H stretching region of the spectrum.
Figure 3.
SEM images of the surface of the materials. (a) FormLabs resin. (b) Conductive paste. (c) Conductive paste with OMCP. (d) Finished membrane.
Figure 3.
SEM images of the surface of the materials. (a) FormLabs resin. (b) Conductive paste. (c) Conductive paste with OMCP. (d) Finished membrane.
Figure 4.
IDS-VDS curves. (a) SM of creatinine in water, with emphasis on the 5 VDS region. (b) FM of creatinine in water. (c) Current sensitivity for SM. (d) Current sensitivity for FM.
Figure 4.
IDS-VDS curves. (a) SM of creatinine in water, with emphasis on the 5 VDS region. (b) FM of creatinine in water. (c) Current sensitivity for SM. (d) Current sensitivity for FM.
Figure 5.
IDS-VT curves. (a) SM for creatinine in water (b) FM for creatinine in urine. (c) Voltage sensitivity for SM. (d) Voltage sensitivity for FM.
Figure 5.
IDS-VT curves. (a) SM for creatinine in water (b) FM for creatinine in urine. (c) Voltage sensitivity for SM. (d) Voltage sensitivity for FM.
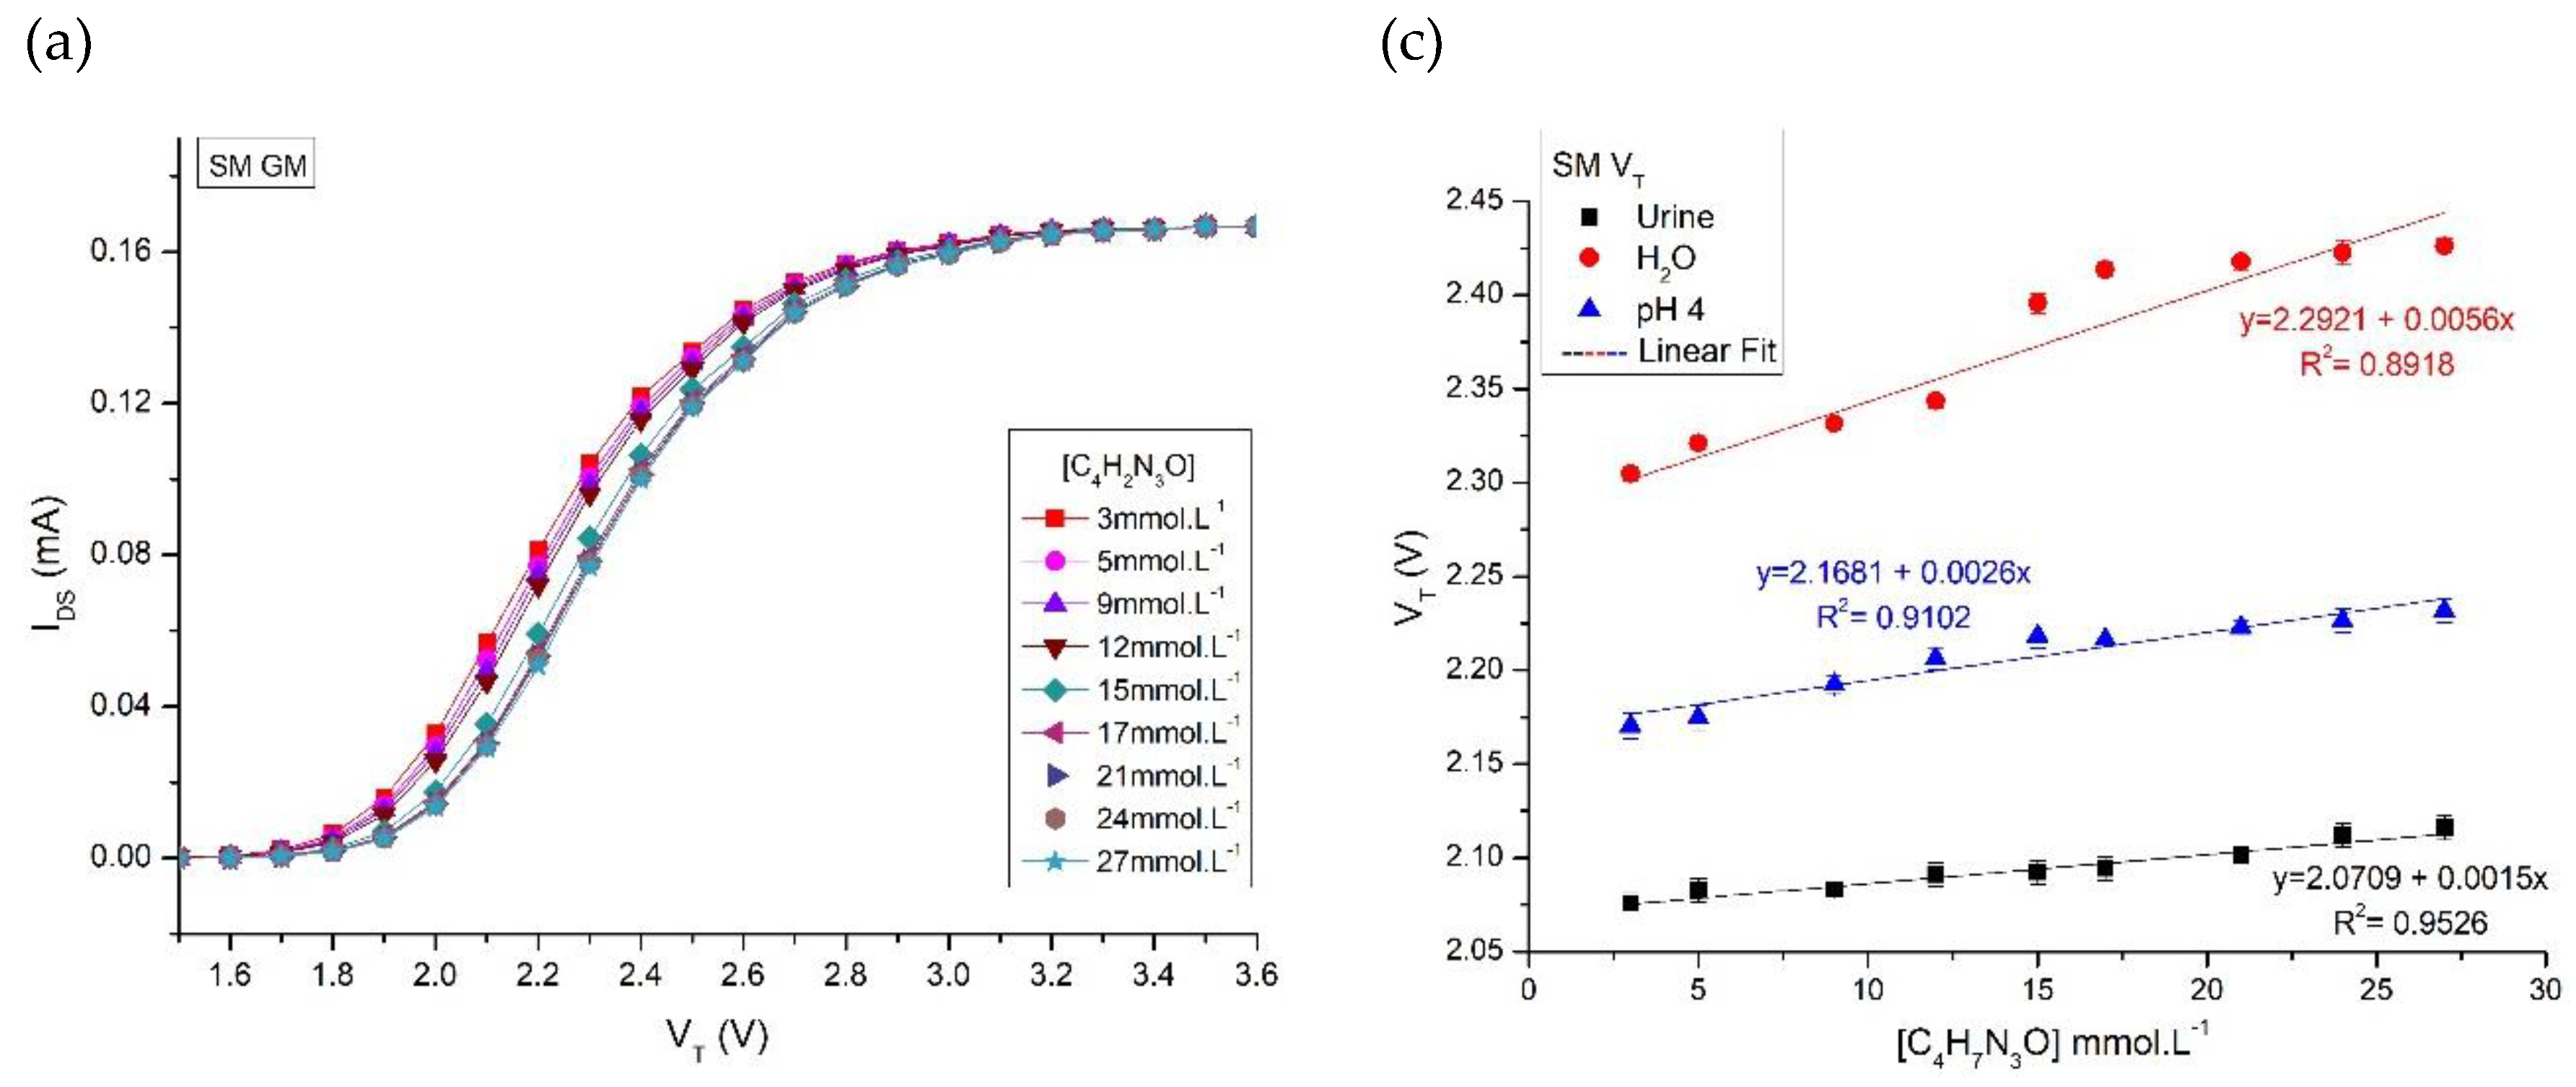
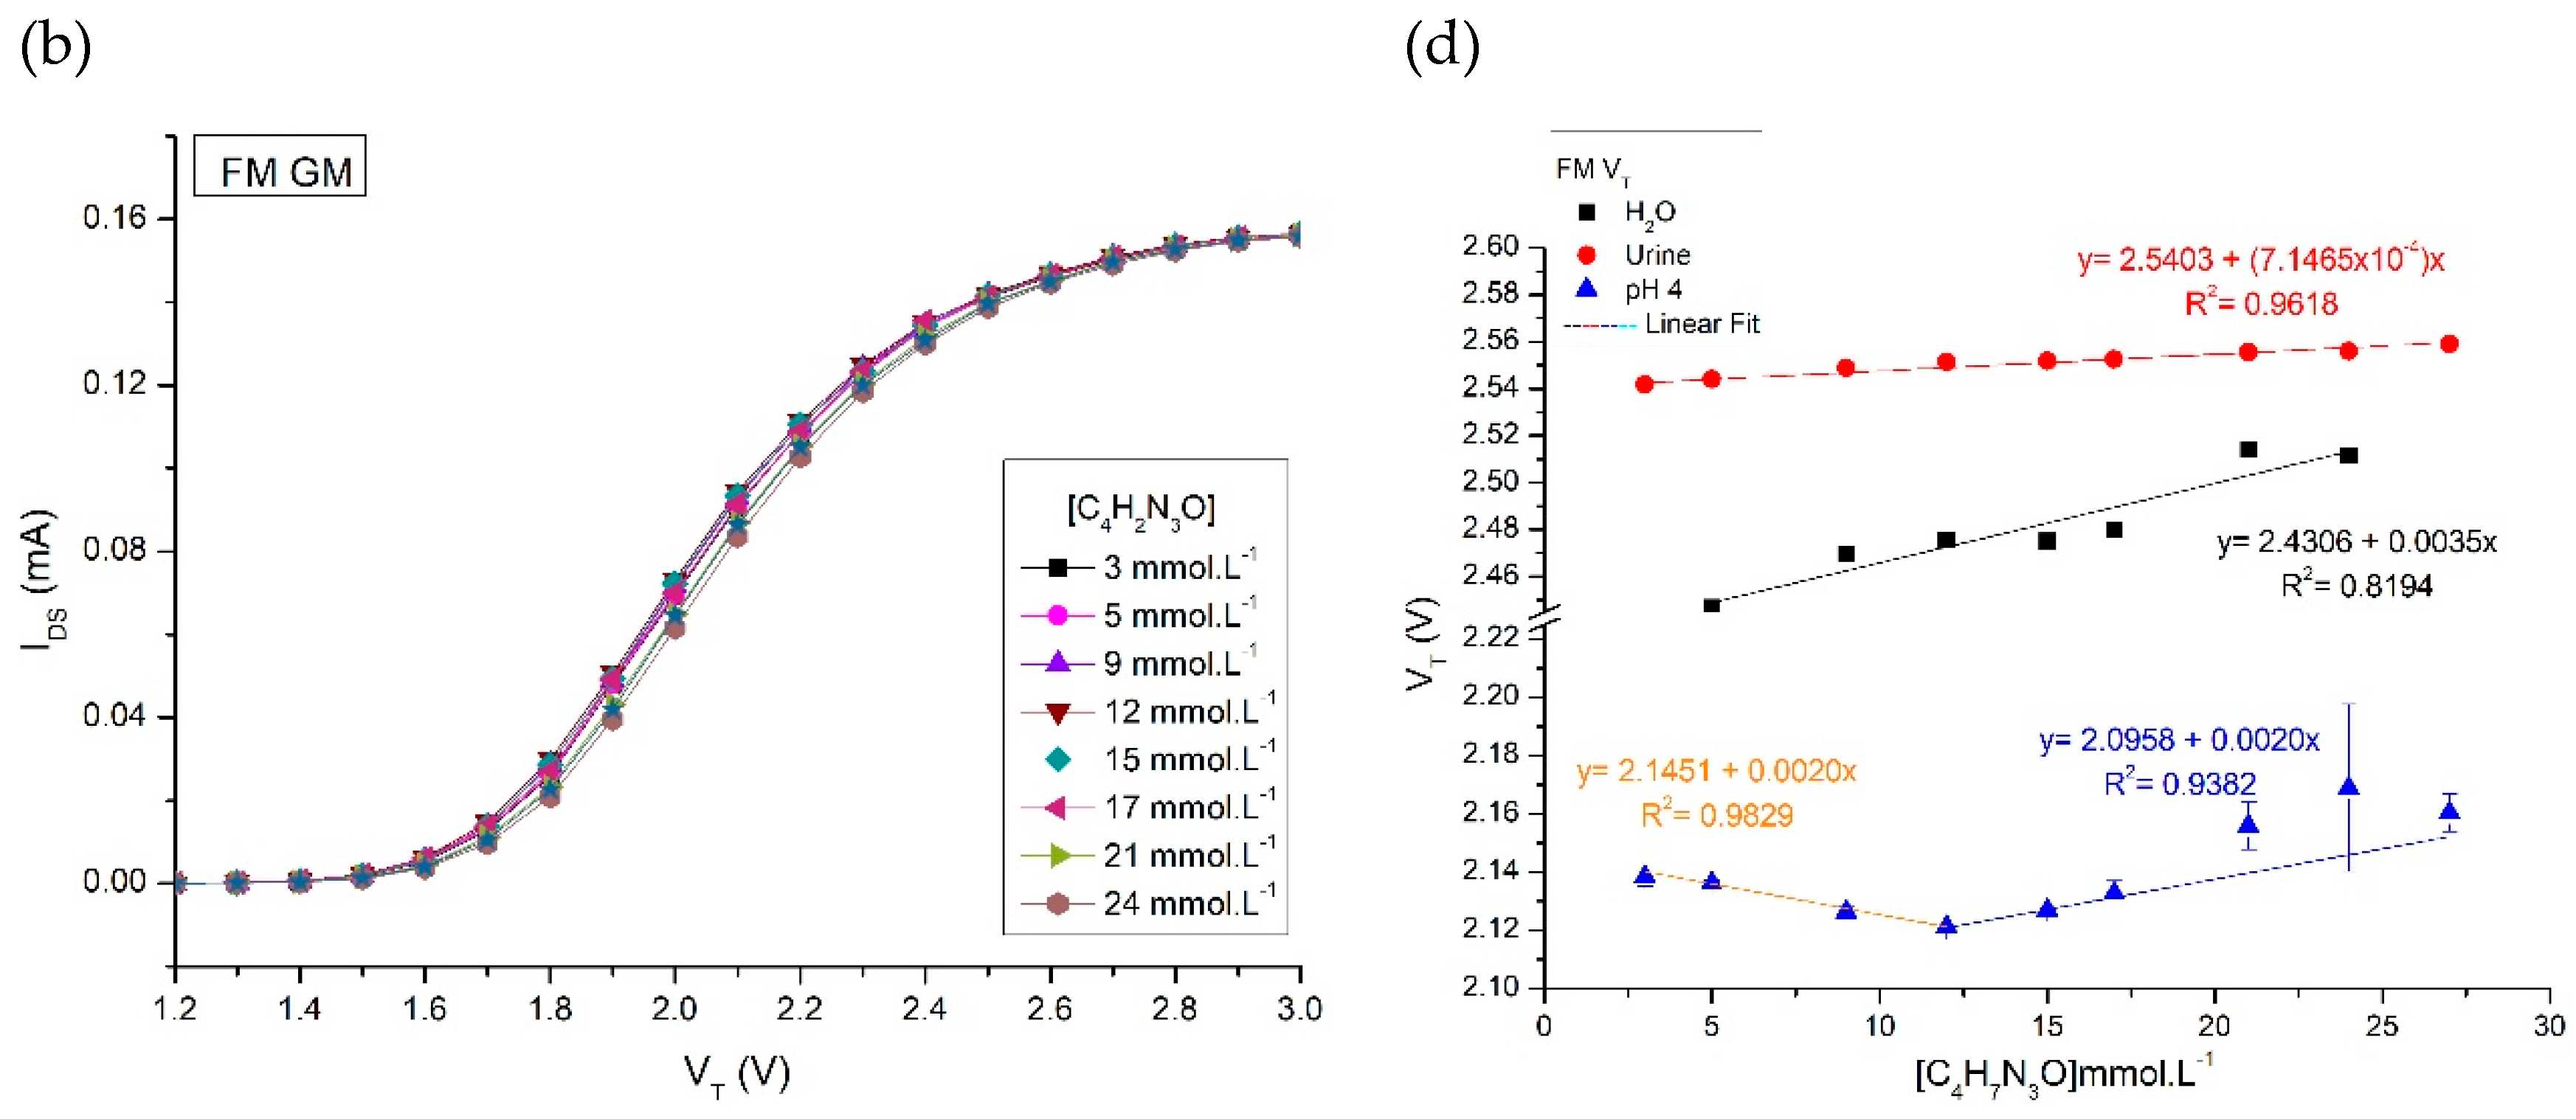
Figure 6.
Hysteresis for samples in water, urine and pH 4 buffer.
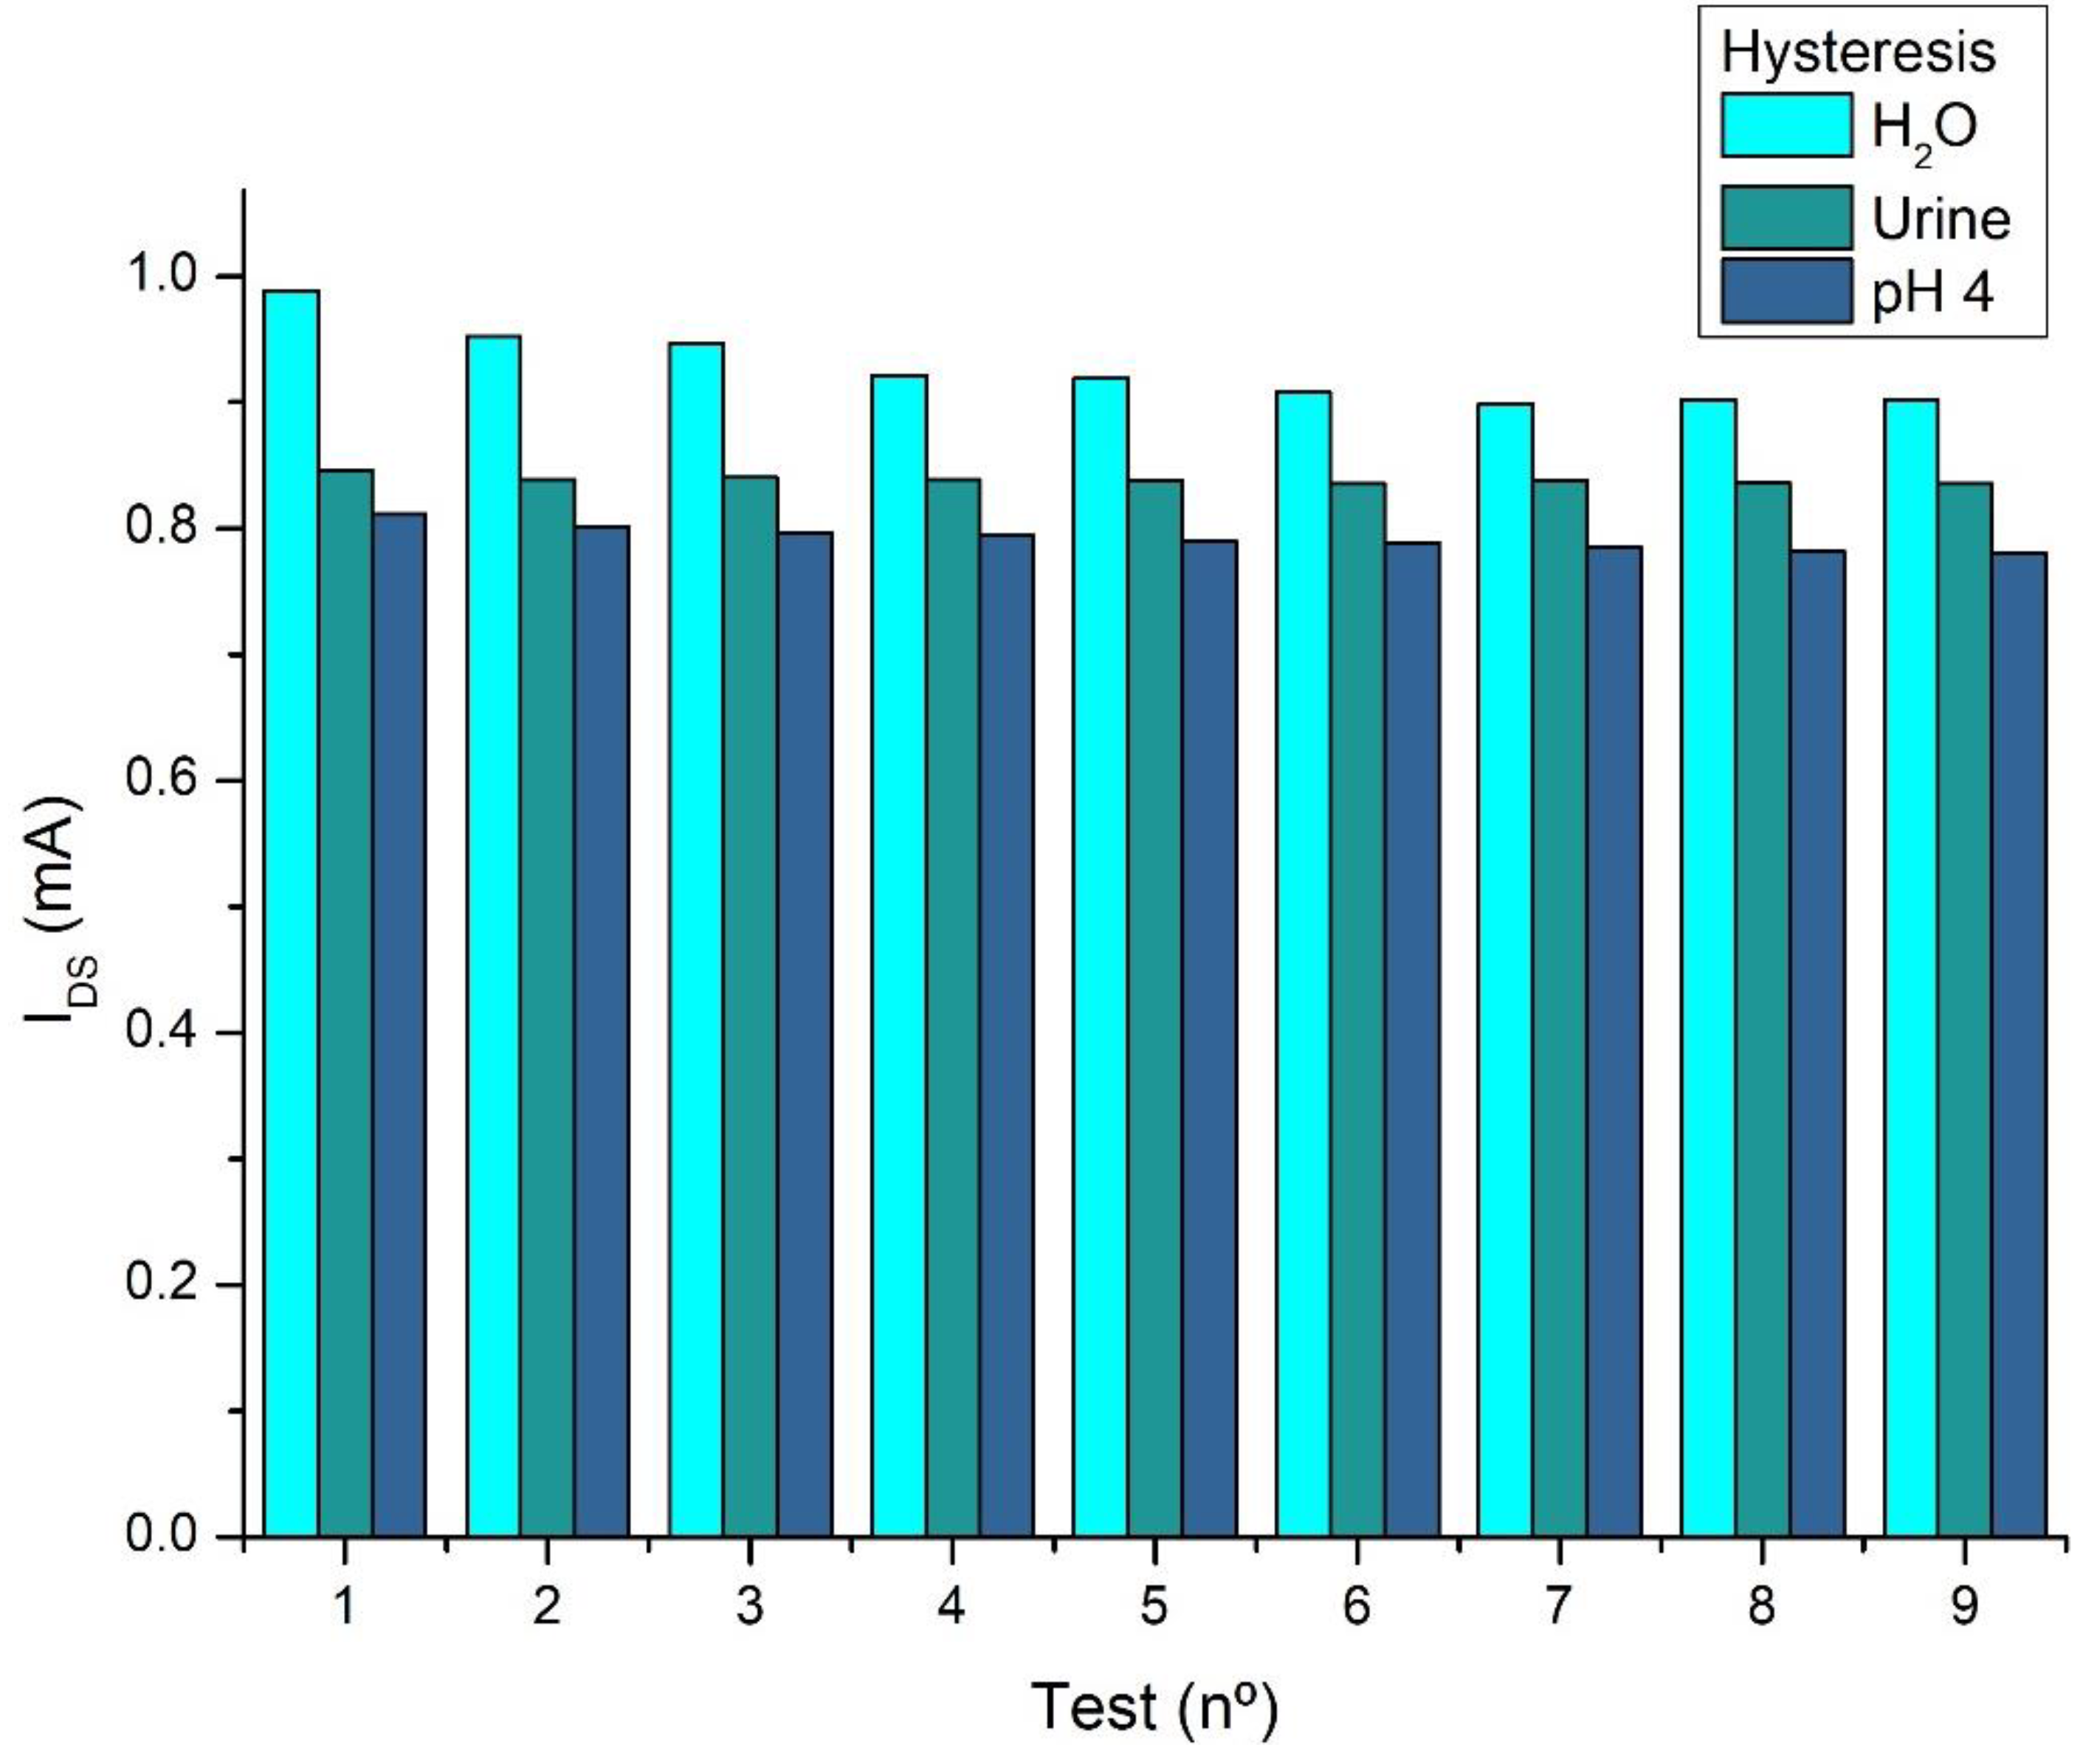
Figure 7.
Membrane selectivity to urea.
Disclaimer/Publisher’s Note: The statements, opinions and data contained in all publications are solely those of the individual author(s) and contributor(s) and not of MDPI and/or the editor(s). MDPI and/or the editor(s) disclaim responsibility for any injury to people or property resulting from any ideas, methods, instructions or products referred to in the content. |
© 2024 by the authors. Licensee MDPI, Basel, Switzerland. This article is an open access article distributed under the terms and conditions of the Creative Commons Attribution (CC BY) license (http://creativecommons.org/licenses/by/4.0/).
Copyright: This open access article is published under a Creative Commons CC BY 4.0 license, which permit the free download, distribution, and reuse, provided that the author and preprint are cited in any reuse.


