1. Introduction
Bottom water hypoxia and anoxia are common eutrophication problems in coastal waters of the Baltic Sea, where root cause is excessive inputs of nutrients. As a result, there is increased settling of organic matter, which increases oxygen (O
2) consumption [
1]. It is well known that release of phosphate-phosphorus from sediments can be drastically enhanced when bottom waters turn anoxic [
2,
3]. The phenomenon is called by internal phosphorus loading.
Over long-time scales, phosphorus can be considered the limiting nutrient of phytoplankton production in Baltic Sea, because atmospheric nitrogen is an endless source for N-fixing species [
4,
5] Nitrogen fixation brings more nitrogen to the system, turning it towards phosphorus limitation [
6]. Enhanced internal loading of phosphorus and inorganic nitrogen removal with increased hypoxia leads to lower nitrogen to phosphorus ratios, which are one of the main factors promoting nitrogen-fixing cyanobacteria blooms [
7].
The sediments in the rather shallow Baltic Sea play an important role for the transformation of organic to inorganic phosphorus and on long time scales for the removal of phosphorus from the biochemical cycling in the water column [
8]. In the marine phosphorus (P) cycle, dissolved inorganic phosphorus (DIP), particulate inorganic (PIP) and organic phosphorus (POP) and dissolved organic phosphorus (DOP) are the main P pools [
9]. Total phosphorus (TP) was in this study used as a proxy for nutrients available to the planktonic organisms. The basis for this assumption was that in a nutrient-constrained environment with significant turnover of N and P, like during the summer season in the northern Baltic Sea, inorganic nutrients are rapidly (within hours) assimilated by the organisms [
10].
The chlorophyll-a concentration, which indicates algal production during the ecological classification period, can used as an indicator for water quality. The ecological classification of coastal waters is primarily based on phytoplankton chlorophyll-a, and some other biological factors. A comprehensive assessment of water quality is made by combining information from all quality factors to evaluate the state of the water. If total nutrients are classified differently, phosphorus results are given priority [
11].
Although the eutrophication mechanisms of the Baltic Sea and the Archipelago Sea have been studied extensively e.g. [
12,
13,
14,
15], the assessment of internal phosphorus loading has received less attention. The magnitude of the actual internal phosphorus load in the Archipelago Sea has not been unambiguously estimated, or the estimates have appeared to be very high compared to other known nutrient loads [
15,
16,
17]. For example, Puttonen
et al. [
17] estimated that the amount of internal phosphorus loading in the Archipelago Sea area would be 3 200 t/a, nearly ten times higher compared to river loading (350 t/a).
In this study, I perform statistical calculations based on measured water quality data from years 2000-2024 in different monitoring stations which are located across different parts of the Archipelago Sea. The aim is to assess how much phosphorus has been transported from the bottom water layer to the surface layers during the biological production season for use in algal production. In other words, what is the magnitude of the effective internal phosphorus load in the Archipelago Sea.
The article also analyzes how the ecological status of the Archipelago Sea varies across its different parts, using surface water chlorophyll-a concentration, which reflects algal production, as an indicator during the ecological classification period. The seasonal dynamics of phosphorus are described using representative data from the intensive monitoring station at Seili, located in the middle archipelago.
Discussion
Concerns about the eutrophication of the Archipelago Sea have persisted for a long time [
24,
25], as the Water Framework Directive mandates that the goal of water management is to achieve good ecological status in all water bodies by 2027. This directive underscores the urgency of addressing nutrient pollution and implementing effective measures to reduce eutrophication, particularly in areas where nutrient loads remain high and ecological recovery is slow. It is generally believed that nutrient load reduction measures implemented within the catchment area could achieve significant improvements in the condition of the Archipelago Sea.
However, previous model analyses of the Archipelago Sea [
16] have concluded that that its good ecological status would be far from attainable in any sea area, nearby coastal region, or inner bay through unilateral local action conducted solely in the drainage basin. But according to [
25] through coordinated load reductions (joint action) between all the Baltic Sea countries (BSAP or higher efforts), good ecological status can be achieved in the Archipelago Sea except for the inner archipelago, river mouths, and inner bays. According to BSAP [
26] to reach good environmental status regarding eutrophication, the maximum input to the Baltic Sea that can be allowed is 792 209 tonnes of nitrogen and 21 716 tonnes of phosphorus annually. According to HELCOM reports, the total phosphorus load into the Baltic Sea has seen significant reductions over time. As of 2019, the load was 26 736 t/a, which still exceeds HELCOM's established Maximum Allowable Input (MAI) by 23%.
The reduction requirement for phosphorus inputs might seem modest when compared to the stringent good ecological status threshold set by HELCOM for the northern part of the Baltic Proper [
27]. This threshold, at 0.38 µmol/L (equivalent to 11.8 µg/L), reflects the phosphorus concentration necessary to maintain a balanced ecosystem with minimized eutrophication. On the southern edge of the Archipelago Sea, at the northern boundary of the Baltic Sea’s main basin, total phosphorus concentrations at the Utö monitoring station have averaged 19.8 µg/L in surface waters during ecological assessment periods in the 2000s. This is 68% above the HELCOM threshold. According to the ecological classification of coastal waters, the threshold for achieving good ecological status for total phosphorus in the southwestern outer archipelago is set at
15 µg/. According to HELCOM average of total phosphorus concentrations in 2016-2021 in Northern Proper has been 0.74 µmol/L, equivalent to 22.9 µg/L.
In Hyytiäinen's article [
25], the effects of nutrient load reductions were evaluated using the Finnish Environment Institute's FICOS model. This model has also been used to calculate area-specific load ceilings for achieving good ecological status in coastal waters [
16]. Since summer algal abundance most commonly limits the ability to achieve good ecological status in coastal waters [
28], the load ceilings are primarily based on achieving the threshold value of the indicator chlorophyll-a concentration. This indicator is a key measure of phytoplankton biomass and serves as a proxy for nutrient-induced eutrophication levels in aquatic ecosystems. When applying the FICOS model for calculating nutrient load ceilings, significant assumptions were made. According to the report [
16], when calculating these ceilings, it was assumed that airborne nutrient loads and the load from surrounding marine areas would decrease by 50%
. This assumption of a 50% reduction means that, in practice, the total phosphorus concentrations of the water in the surrounding areas would be 50% lower than their current levels. In addition, the FICOS model also assumes that internal loading would decrease in proportion to reductions in catchment area and point source loads. According to the modeling results, when all the aforementioned assumptions are met, a further 68% reduction in nutrient loads is still required to achieve good ecological status in the coastal waters.
In practice, the nutrient load reduction requirements derived from the FICOS model to achieve good ecological status in the Archipelago Sea appear to be unattainable. The model's demand for a 68% reduction in nutrient loads, combined with the additional assumptions on the reduction of internal and external loads, presents a challenge that is considered difficult to meet given current conditions. Therefore, it can indeed be somewhat perplexing to claim that certain parts of the Archipelago Sea have already reached good ecological status, especially considering that no significant changes in phosphorus concentrations of sea water or nutrient loads have occurred yet. Helminen and Inkala [
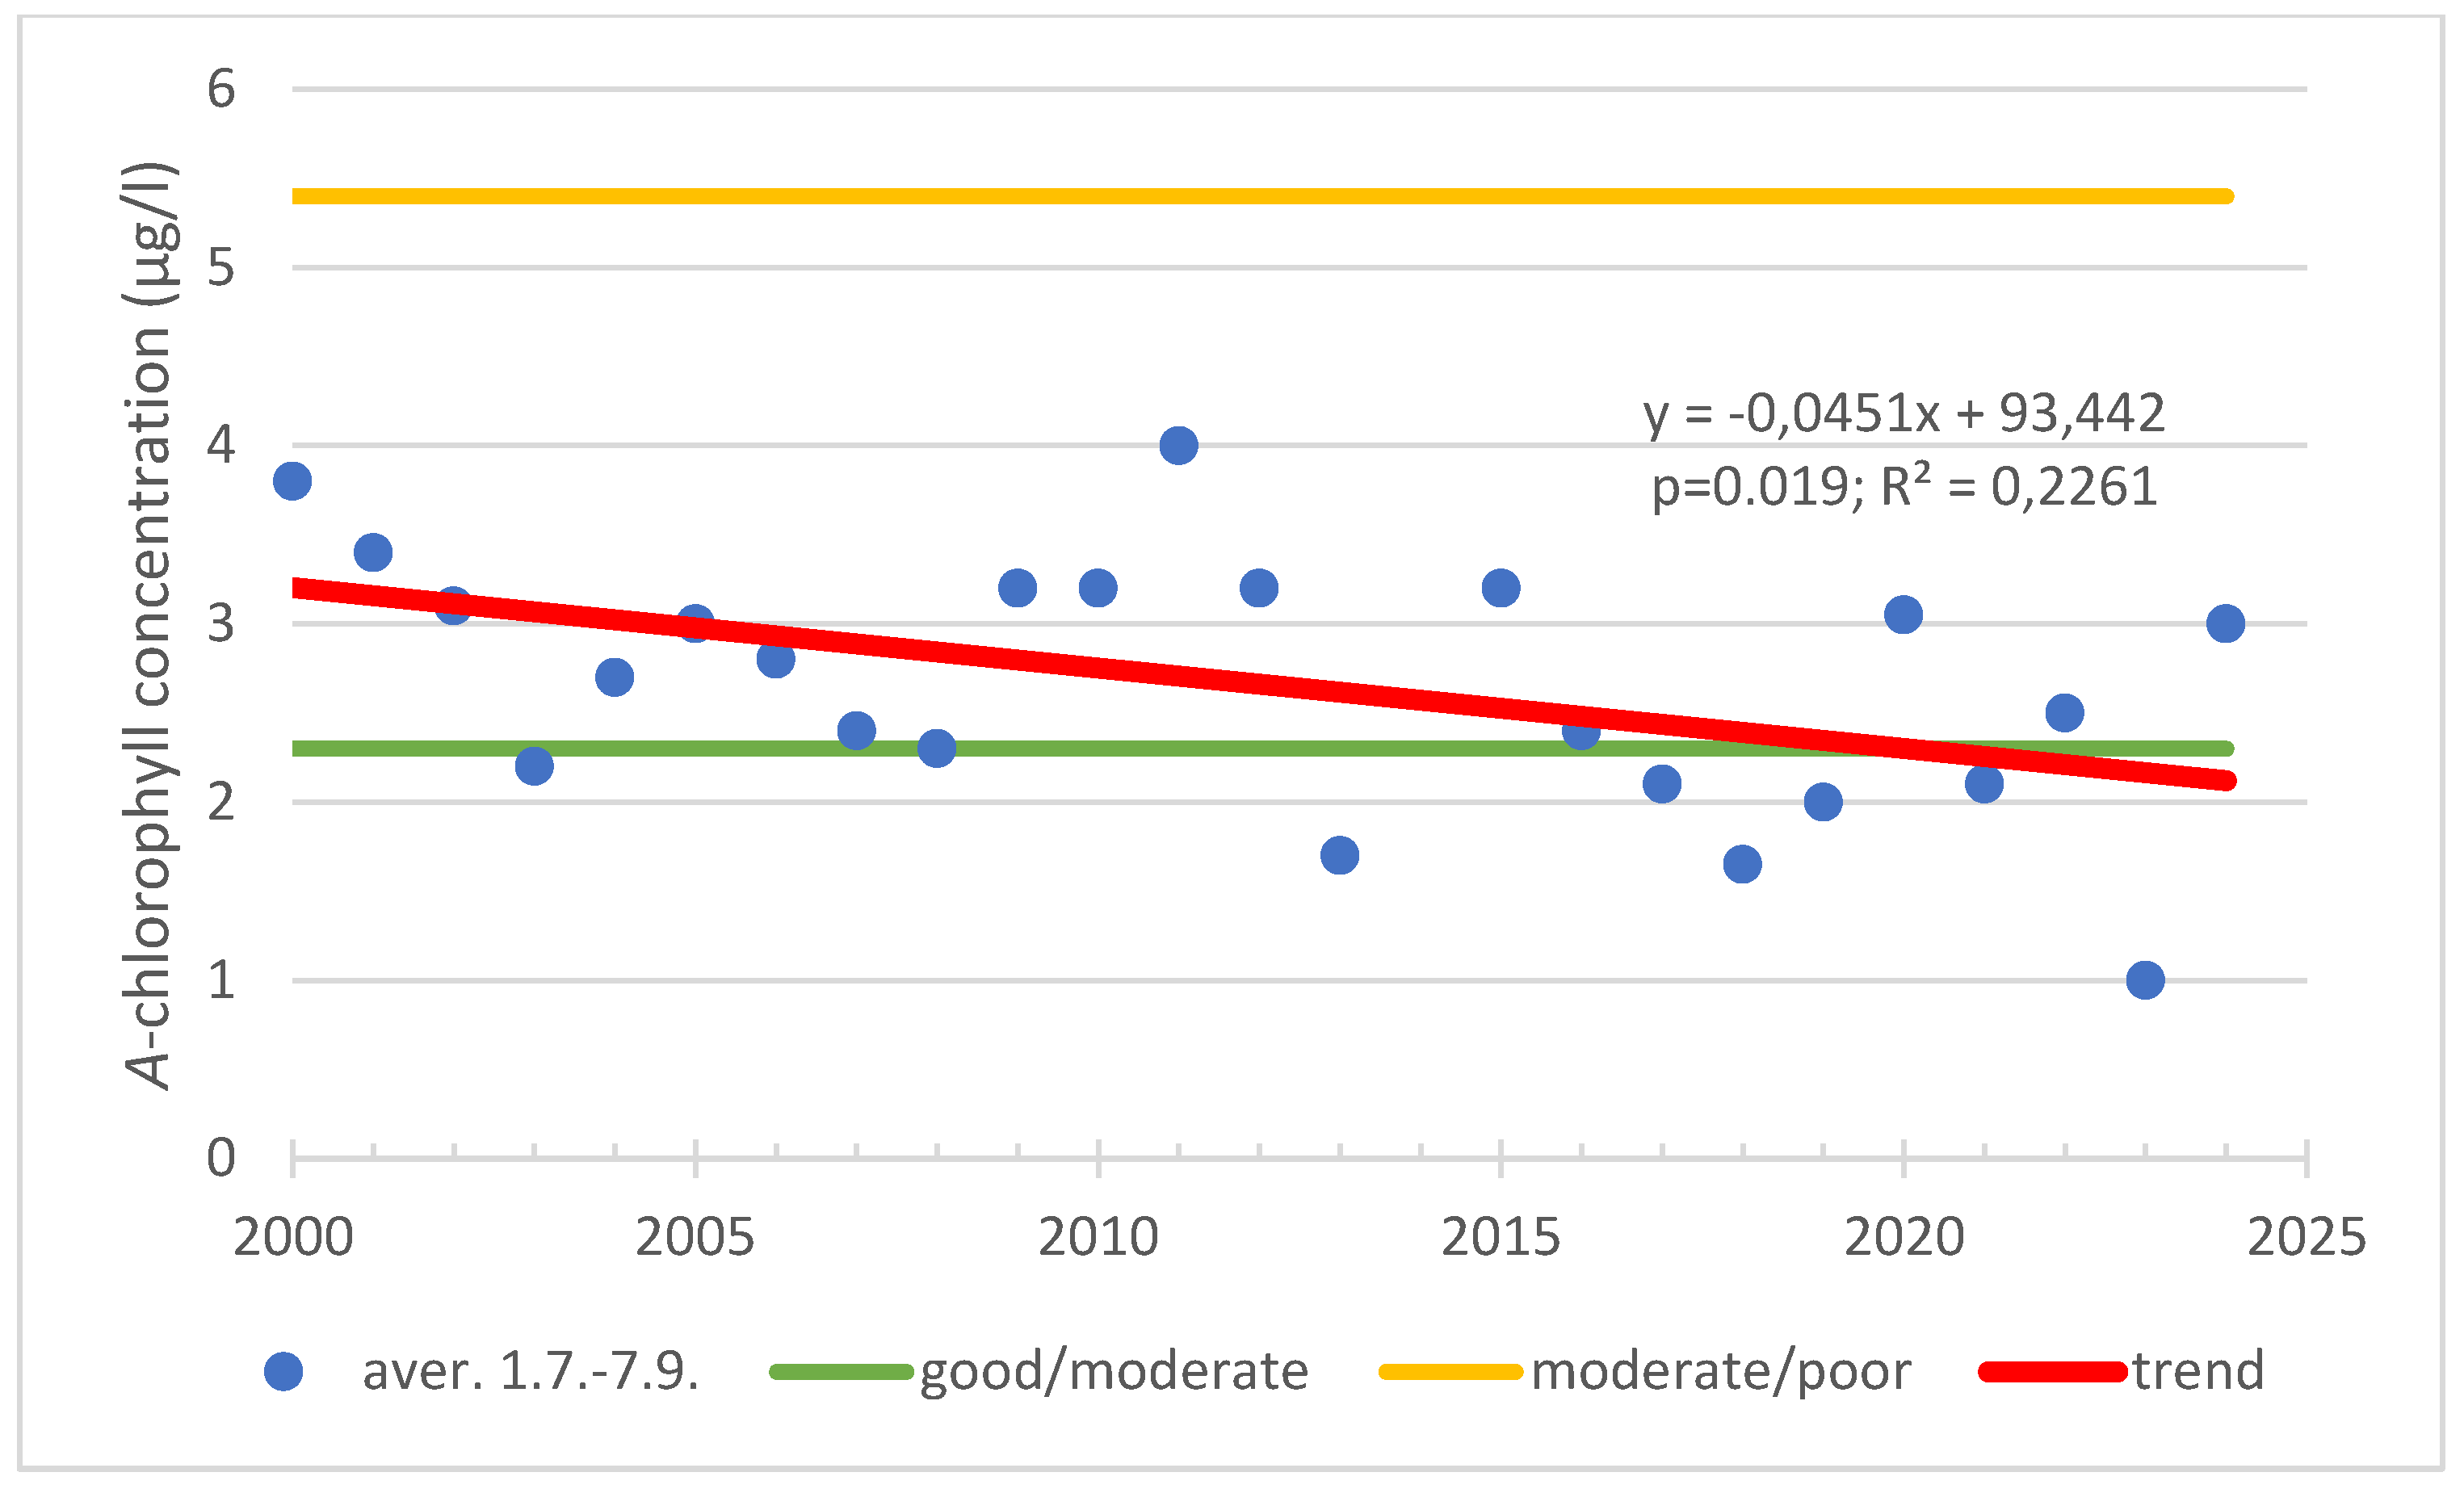
20] found that in the southern part of Kihti in the middle of the Archipelago Sea since 2010 the chlorophyll a concentration began to decrease to its current values: from 2018 to 2023, the average was only 2.0 µg/L, indicating a good status had been achieved. The decrease observed from 2010 to 2022 was statistically significant. A similar trend was observed in this study from the observation station
Kuml 155 measurement data (
Figure 1 and
Figure 7). From 2017 to 2024, the average of chlorophyll a concentration was 2.2 µg/L, indicating a
good status had been achieved. According to Helminen and Inkala [
20], the reduction in algal production observed in the central Archipelago Sea was due to a change in the background nutrient load coming from the Baltic Sea's main basin
. From 2015 to 2021, the net flow direction reversed, and water flowed from the Archipelago Sea to the Baltic proper in the surface layer. At the same time, the background loading of phosphorus entering the Archipelago Sea with the flows decreased significantly and the chlorophyll-a concentration decreased below the threshold for a good ecological status. Earlier in the 2000s, the net phosphorus load to the southern Archipelago Sea during the summer was around 120 t. According to modeling calculations, from 2015 to 2021, the net load had shifted to a phosphorus outflow of approximately 160 t during the summer [120].
In this study, no clear trend of change was observed in the surface water chlorophyll-a concentrations at the Seili station in the middle archipelago during the ecological assessment periods in the 2000s (
Figure 5). In Helminen and Inkala's study [
20], the time series for measurements began in 1983, when the monitoring at Seili station in the middle archipelago was first initiated. During the period from 1983 to 2023, the chlorophyll a concentration has steadily increased by approximately 0.6 µg/L per decade. In the inner archipelago, the ecological status of surface waters is classified as
poor, as indicated by both chlorophyll-a and total phosphorus concentrations (
Figure 3 and
Figure 10).
While changes in nutrient loads from the Baltic Sea’s main basin have contributed to a reduction in algal production in certain areas, such as the central Archipelago Sea, these improvements have not been as evident in the inland and middle archipelago regions. This disparity may be due to several factors, including internal nutrient cycling, where nutrients released from sediments continue to drive eutrophication, as well as diffuse loading that may have a greater impact on these areas. For example, the relative internal loading based on the amount of phosphorus reaching the upper surface layers (0–20 m), was highest in the inner archipelago, at 41 mg/m²/month. It was 1.6 times higher than in the middle archipelago and 7.5 times higher than in areas in the outer archipelago. In their modeling studies, researchers Miettunen
et al. [
29] have concluded that the middle archipelago is relatively sheltered and the water exchange with the outer archipelago is dependent on high wind events from the NW and SE directions. The inner archipelago is mostly sheltered and is under major influence from local riverine inputs. The FICOS model has also been used to estimate the relative contribution of different loading sources to water quality in various water bodies of the Archipelago Sea [
26]. According to the estimates, in the inner archipelago, the share of total phosphorus loading from river inflows from the catchment area is 0.38, and for dissolved phosphorus loading, it is 0.23. In the middle archipelago (Seili), these ratios are 0.07 and 0.03, respectively, and in the outer archipelago (Utö), they are 0.02 and 0.01.
The amount of internal loading in the Archipelago Sea has previously been estimated primarily through sediment quality studies combined with modeling efforts. However, these results have significant uncertainties, especially when assessing the proportion of phosphorus that actually reaches the biological production layer of the water column. In the FICOS model [
15], the input for internal phosphorus loading was based on an assessment of the amount of phosphorus that could be released over time from the surface layer of sediments into the overlying water. This estimate was derived from observational data on the forms of phosphorus present in the sediments. Specifically, the focus was on calculating the quantity of potentially mobile phosphorus—phosphorus that could be released under certain conditions, such as low oxygen levels or changes in redox conditions. According to the FICOS model, the total amount of internal phosphorus loading during the growth seasons (April–September) from 2006 to 2014 was estimated at 2402 tons. Of this, approximately half—1220 tons—was calculated to have reached the surface layer (0–10 meters). The FICOS model covers approximately the same land-facing area of the Archipelago Sea as examined in this study. However, the model assumes a larger area, with its total surface area being about 16% greater (7177 km²) compared to the area used in this study. In any case, the FICOS model estimates internal phosphorus loading to be approximately three times higher than the values found in this study. Furthermore, the estimated portion of phosphorus that reaches the surface layer (0-10 meters) in the FICOS model is more than six times greater than the corresponding estimate in this study.
Puttonen et al. [
17] present in their study O
2 status scenario, where the estimate of the potentially mobile P released from the reactive sediment surface of the soft, organic-rich sediments to the water resulted in an average release level of 0.56 g P m
-2, or an annual internal loading of 3200 t P from the entire 12 700 km
2 study area in the Archipelago Sea. The range of the internal P loading in the study area in this estimate was 0.01–3.7 g P m
-2 yr
-1. Under different scenarios (better and worse), the minimum and maximum phosphorus release rates from sediments were estimated at 0.31 and 0.64 g P m
-2, respectively, According to Puttonen et al. [
17], 78% of the annual internal nutrient loading occurs during the period from May 15 to October 15. This seasonal pattern is primarily driven by warmer water temperatures, which enhance biological activity and lead to increased release of phosphorus from sediments under low-oxygen conditions. In this study, the estimated internal phosphorus loading for the Archipelago Sea during the period from May 15 to October 15 was 0.219 g m² for the area from which phosphorus was assumed to be released (3617.2 km²). This corresponds to an annual loading estimate of 0.28 g m², which is close to the minimum estimate provided by Puttonen et al
. [
17], but only half of their average estimate. The annual internal loading estimate derived from this study is 1558 tons, which is about half the 3200 tons estimated by Puttonen et al. [
17].
Our annual internal phosphorus loading estimate derived is notably like the calculated phosphorus loss from the surface layer during and after the spring bloom, 1 518 tons. On an annual basis, it could therefore be said that the net effect of internal loading on the phosphorus budget is approximately zero. Sediments are a P sink in spring and a P source in summer and autumn. Most of the deep-water P release from sediments in summer–autumn appears to be derived from the settled spring bloom. When comparing estimates of internal loading, it's crucial to clarify what exactly is meant by internal loading in each context. In this study, the focus was primarily on assessing how much phosphorus from internal loading ends up in the biological production layer of the water column, which is essential for understanding its role in eutrophication and algal growth. Puttonen et al. [
17] emphasize that their estimates represent the amount of potentially mobile P stored in the sediments that can be released to the overlaying water in certain conditions and become (re)cycled at the sediment-water interface. They assume that only a part of it would eventually be mixed into the productive water layer, increasing algal production, while the rest is bound to (organic and inorganic) particulate material and deposited back to the sediment surface or transported horizontally to other areas.
Conclusions
The internal phosphorus load of the Archipelago Sea was estimated at 1 558 tons per year (t/a) in this study. During the biological production season, 299 tons, or 19%, of this load is transported to the surface layer (0-10 meters). During the spring bloom, an estimated 1 518 tons of phosphorus are removed from the surface layer with the sinking plankton mass. From the catchment area, an average of 350 tons of total phosphorus enters the Archipelago Sea annually via rivers, of which 97 tons is phosphate phosphorus (DIP) available for algae. Most of this is utilized during the spring bloom and sinks to the bottom along with it. Some portion of it returns to circulation during the summer.
These new assessments of the amounts of internal loading challenge the models applied in the Archipelago Sea and their conclusions regarding the need to reduce loading. Apparently, the model structures also need to be modified to account for the internal nutrient cycles of the marine ecosystem. Internal loading cannot simply be a static input.
At this point, it would be essential to investigate how much of the new phosphorus contributes to the internal cycling and whether reducing external loading can affect internal loading as commonly assumed. In Swedish coast Walve
et al. [
1] found that P release from historical deposits was apparently restricted to the first 10–20 years after the major P load reduction. Still, most of P release in summer and autumn is simply a recycling of P deposited by the sedimentation of the spring bloom.
Technical solutions to reduce internal loading in marine areas are practically limited and economically unfeasible. For example, bottom aeration or chemical treatment is not realistic because the seabed area to be treated in the Archipelago Sea spans 3,600 km². At best, internal loading has been successfully mitigated in lake environments, where the treated area has been around 1.5 km² [
30].
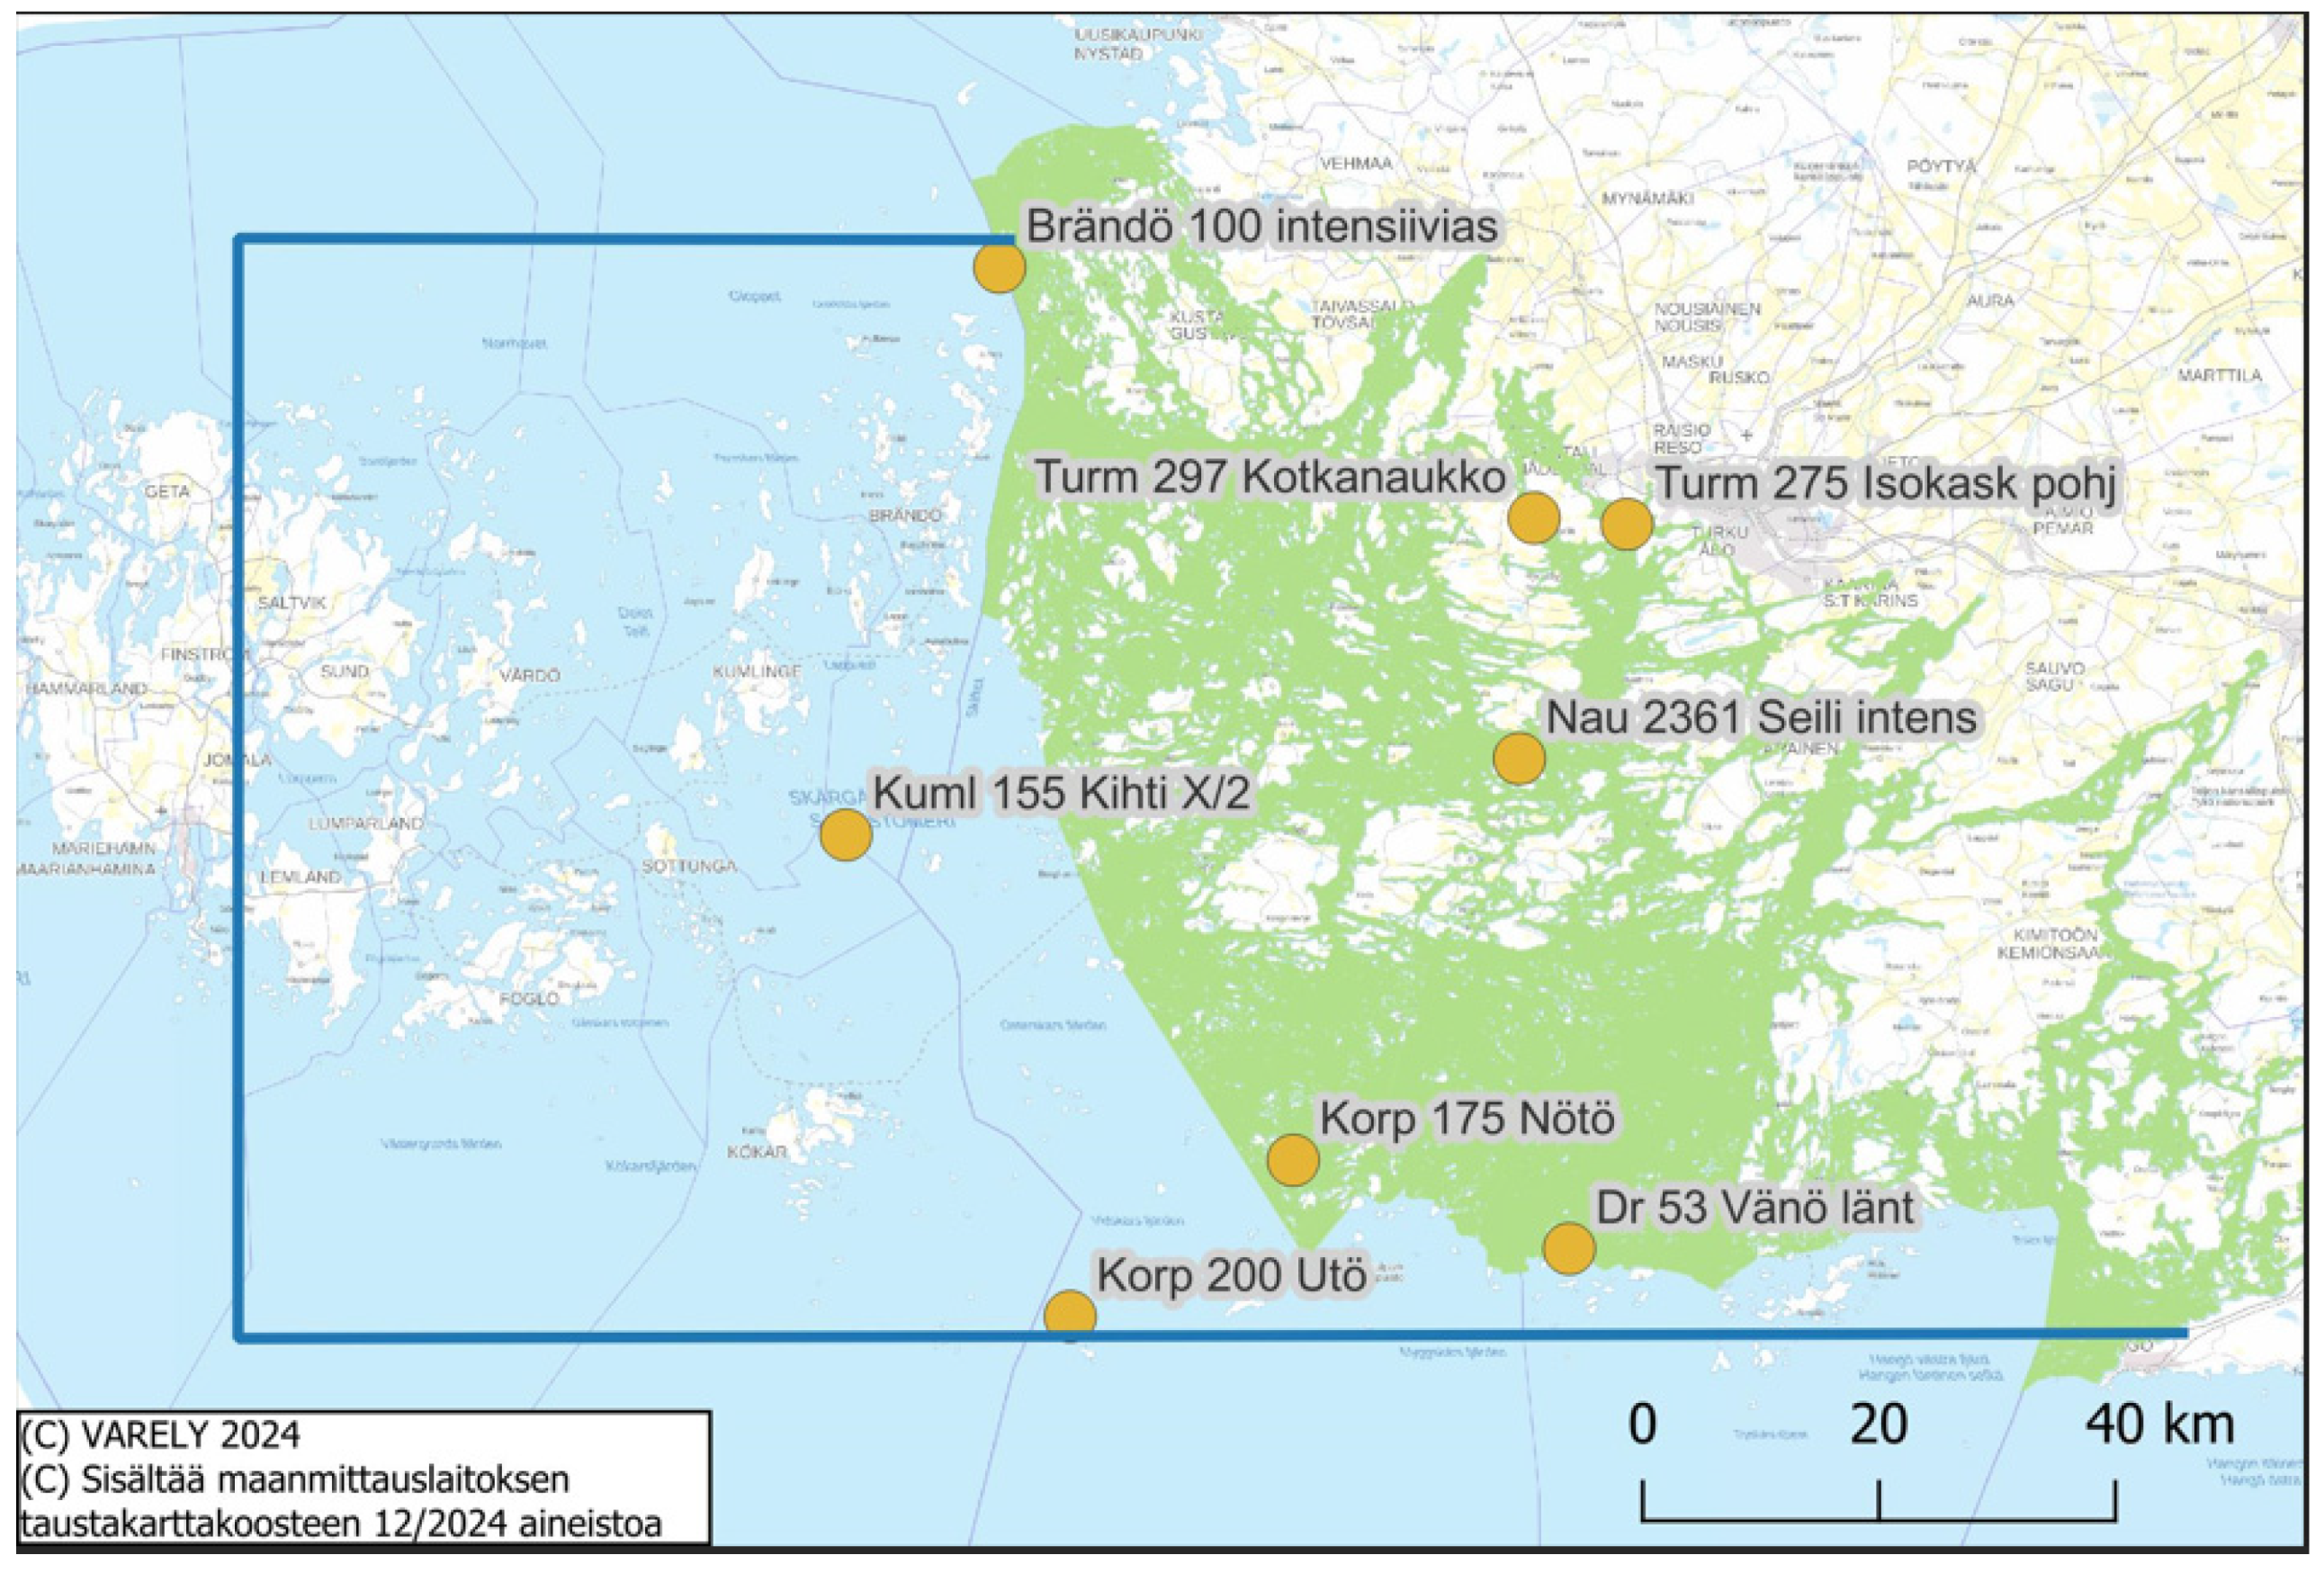
Figure 1.
Map of the Archipelago Sea and the locations of water quality monitoring stations. The blue line indicates the boundary of the Archipelago Sea, and green marks represent those mainland-side water bodies or parts of water bodies where internal loading is assumed to occur.
Figure 1.
Map of the Archipelago Sea and the locations of water quality monitoring stations. The blue line indicates the boundary of the Archipelago Sea, and green marks represent those mainland-side water bodies or parts of water bodies where internal loading is assumed to occur.
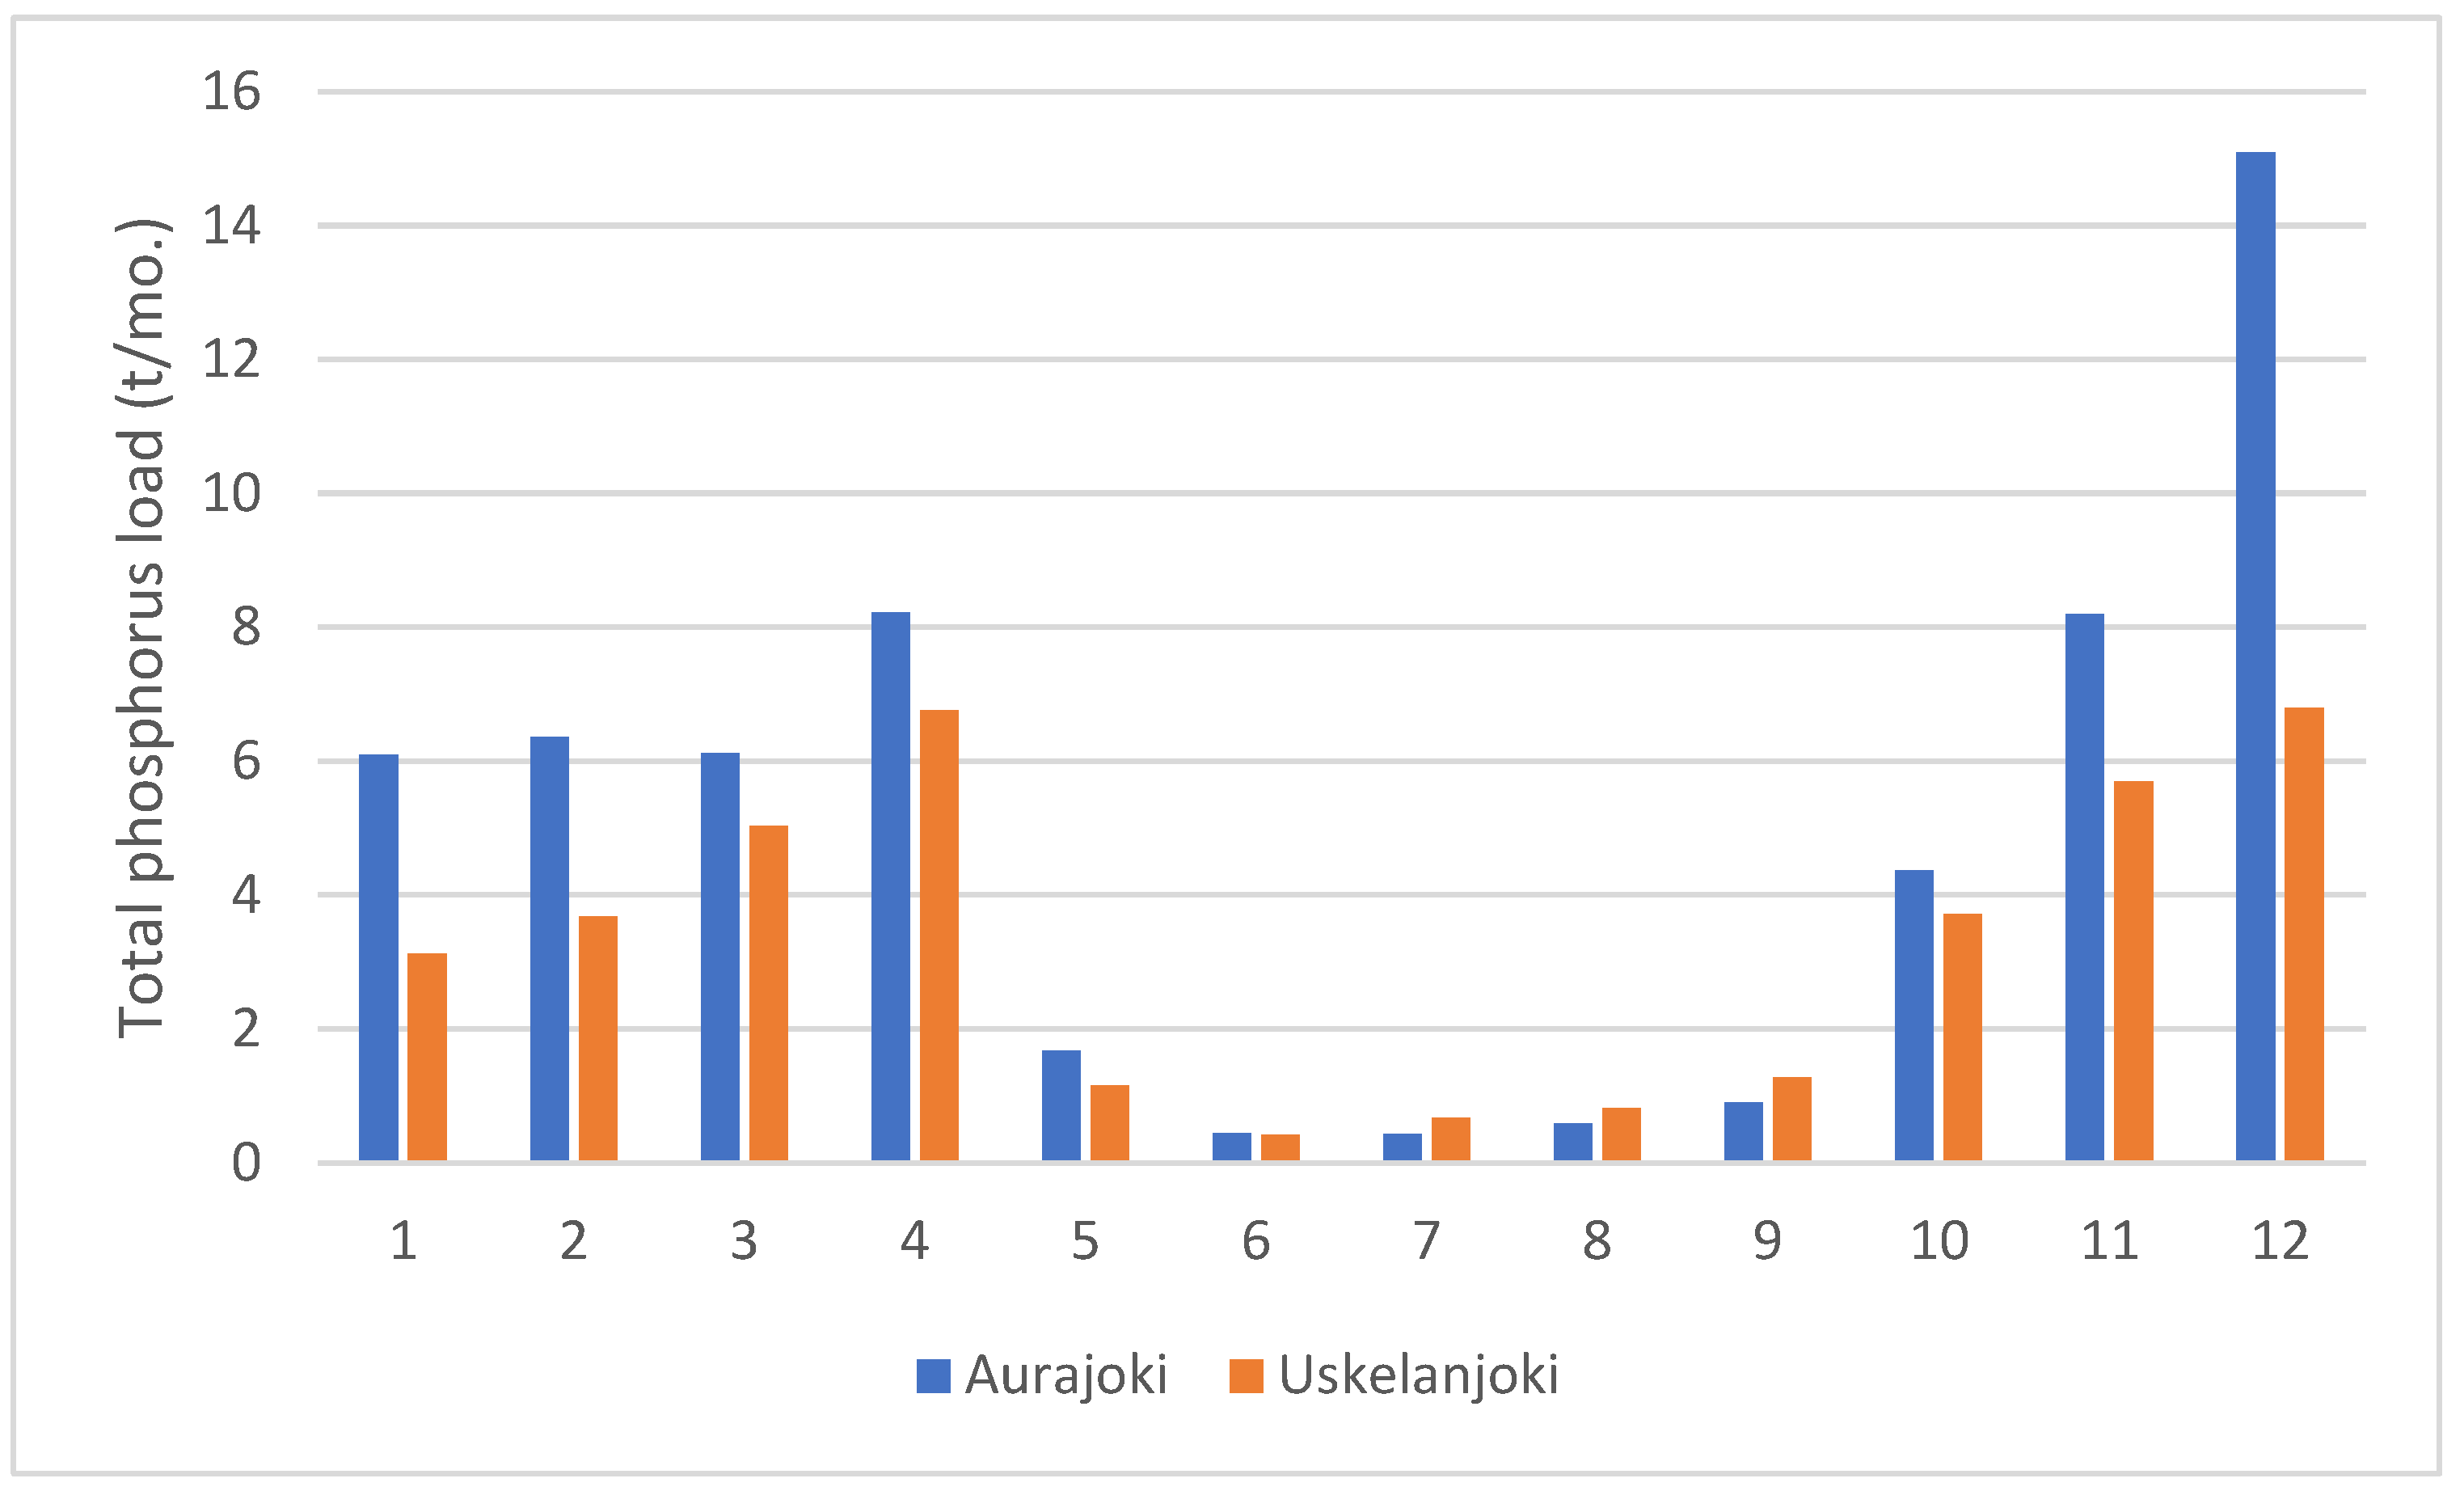
Figure 2.
The total phosphorus load (t/month) from the Aurajoki and Uskelanjoki rivers into the Archipelago Sea during different months (1-12).
Figure 2.
The total phosphorus load (t/month) from the Aurajoki and Uskelanjoki rivers into the Archipelago Sea during different months (1-12).
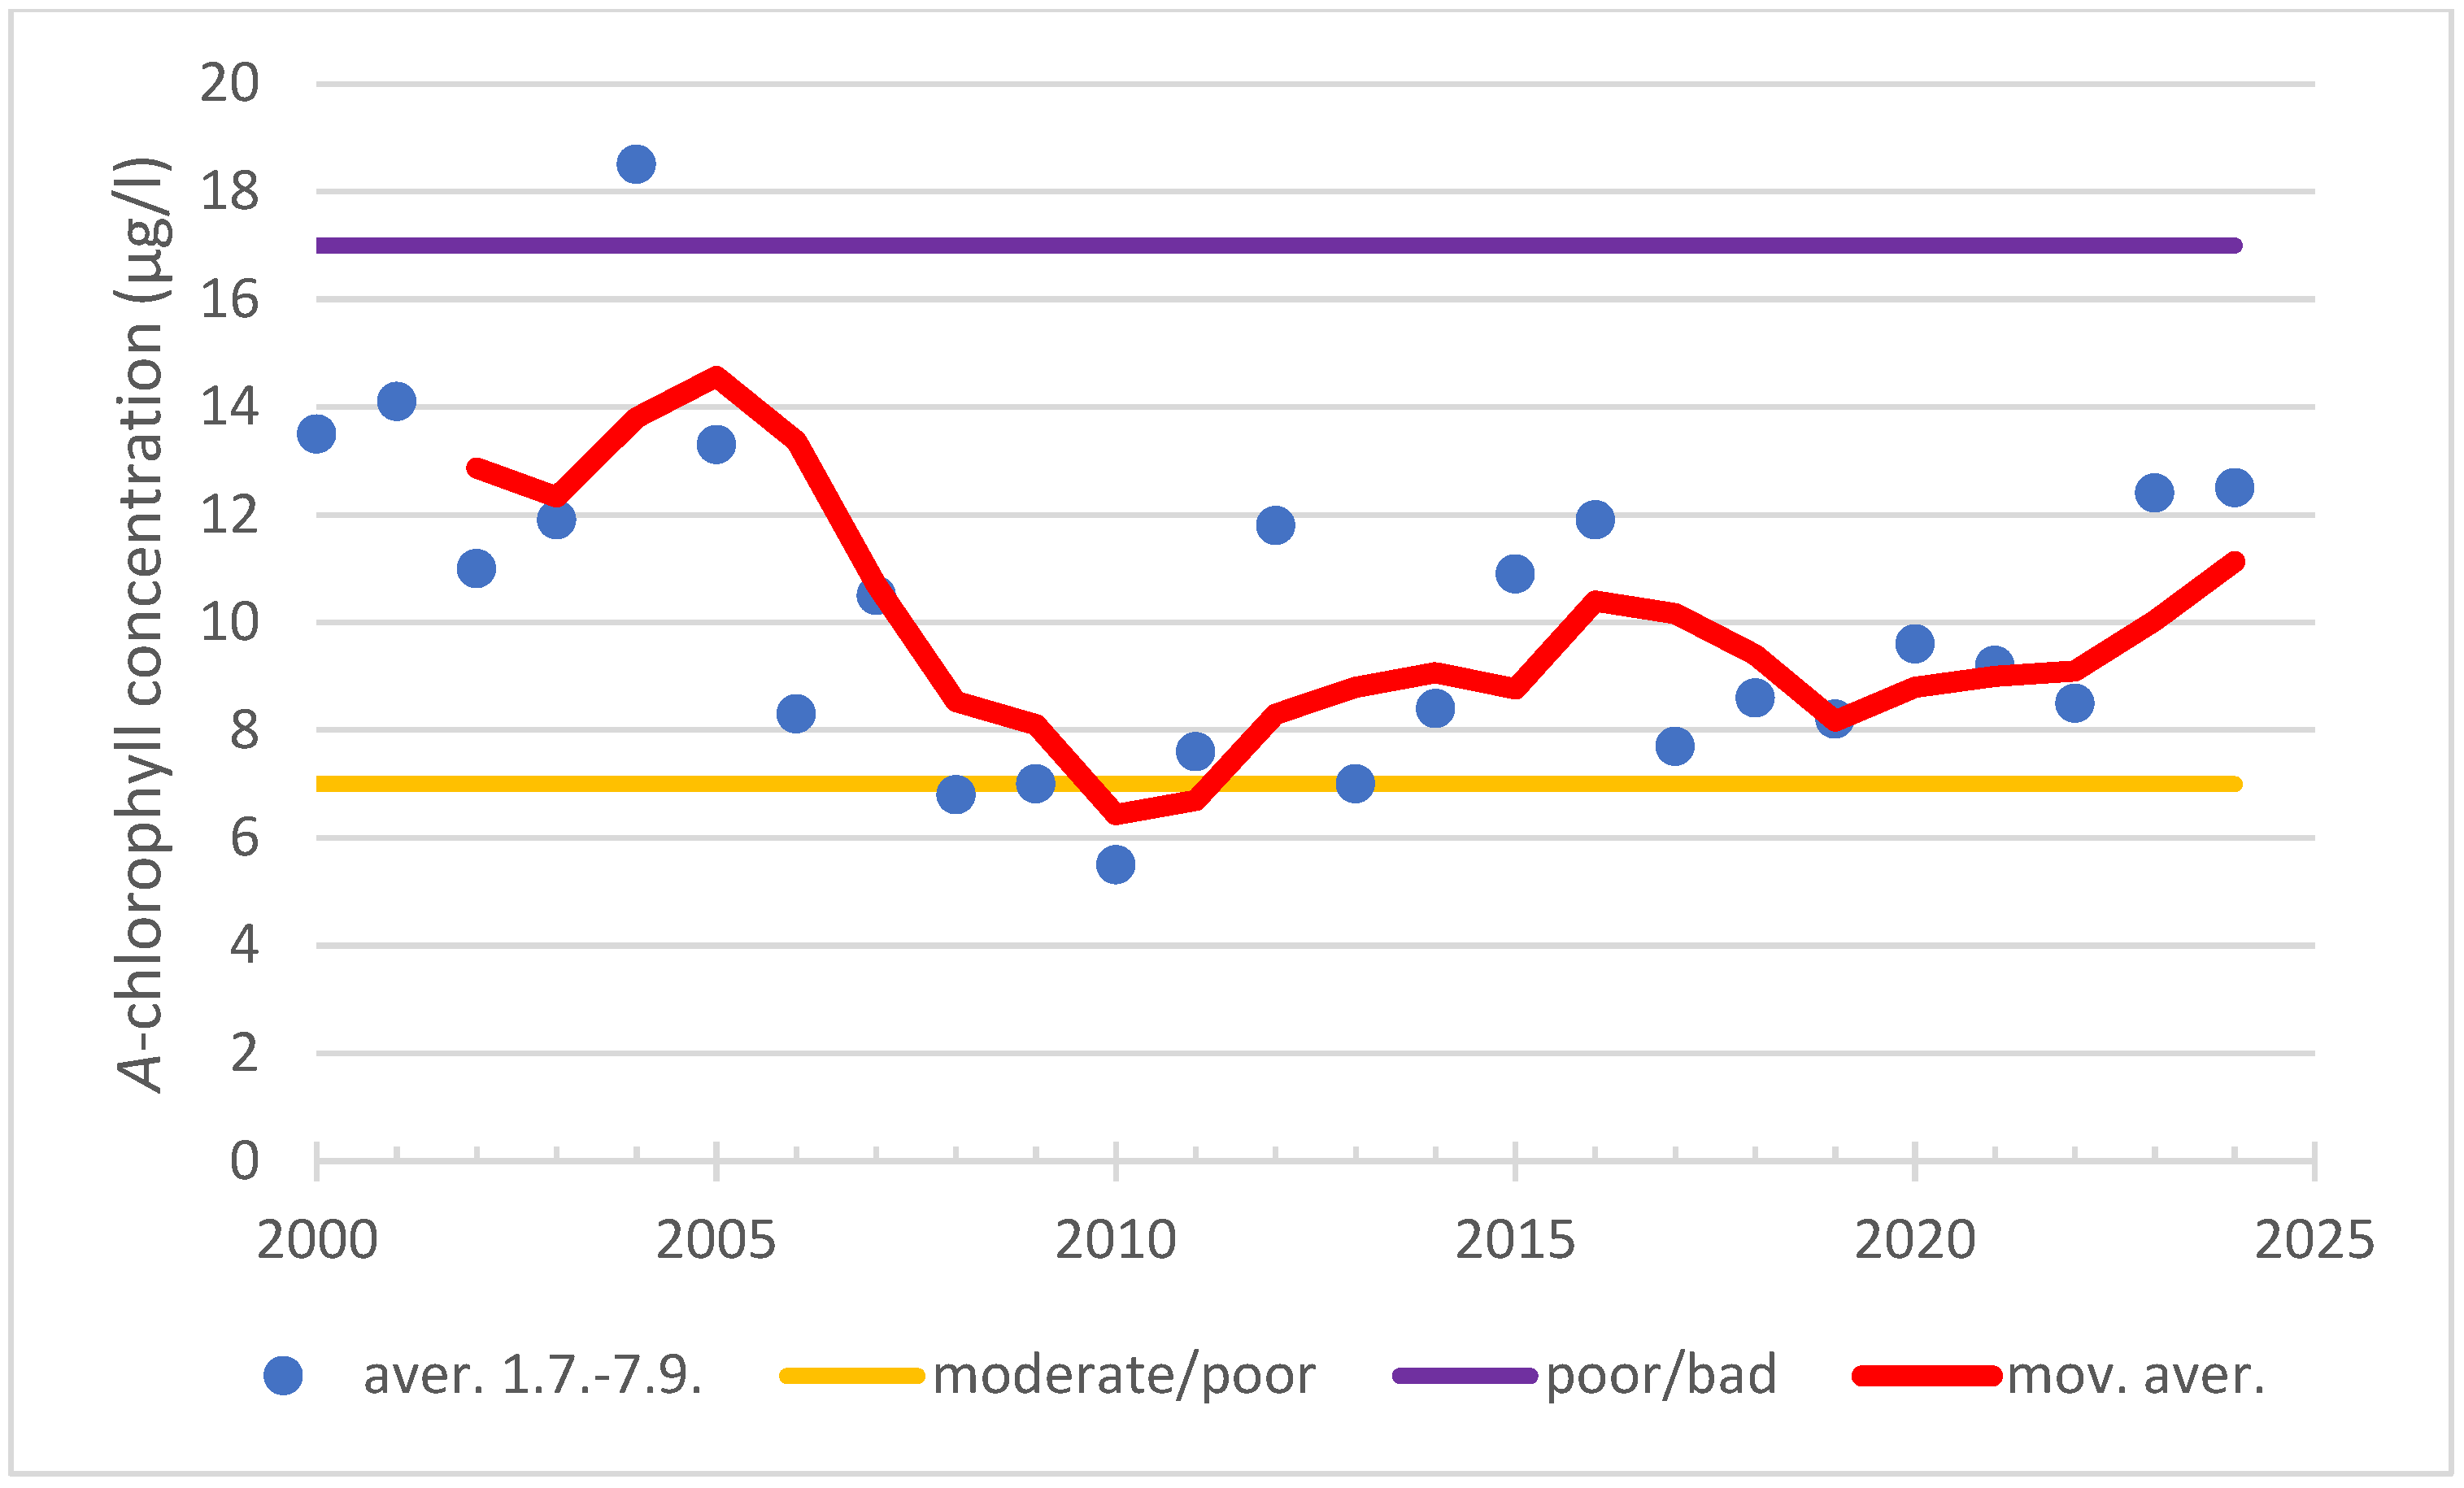
Figure 3.
The concentration of chlorophyll a (µg/L) in surface water (0–10 m) at observation station Turm 275 during the ecological classification period (1 July–7 September) from 2000 to 2024. The poor status lower threshold (moderate/poor) is 7.0 µg/L and upper (poor/bad) 17.0 µg/l. The red line indicates the moving average in the chlorophyll a concentration over the entire period under review.
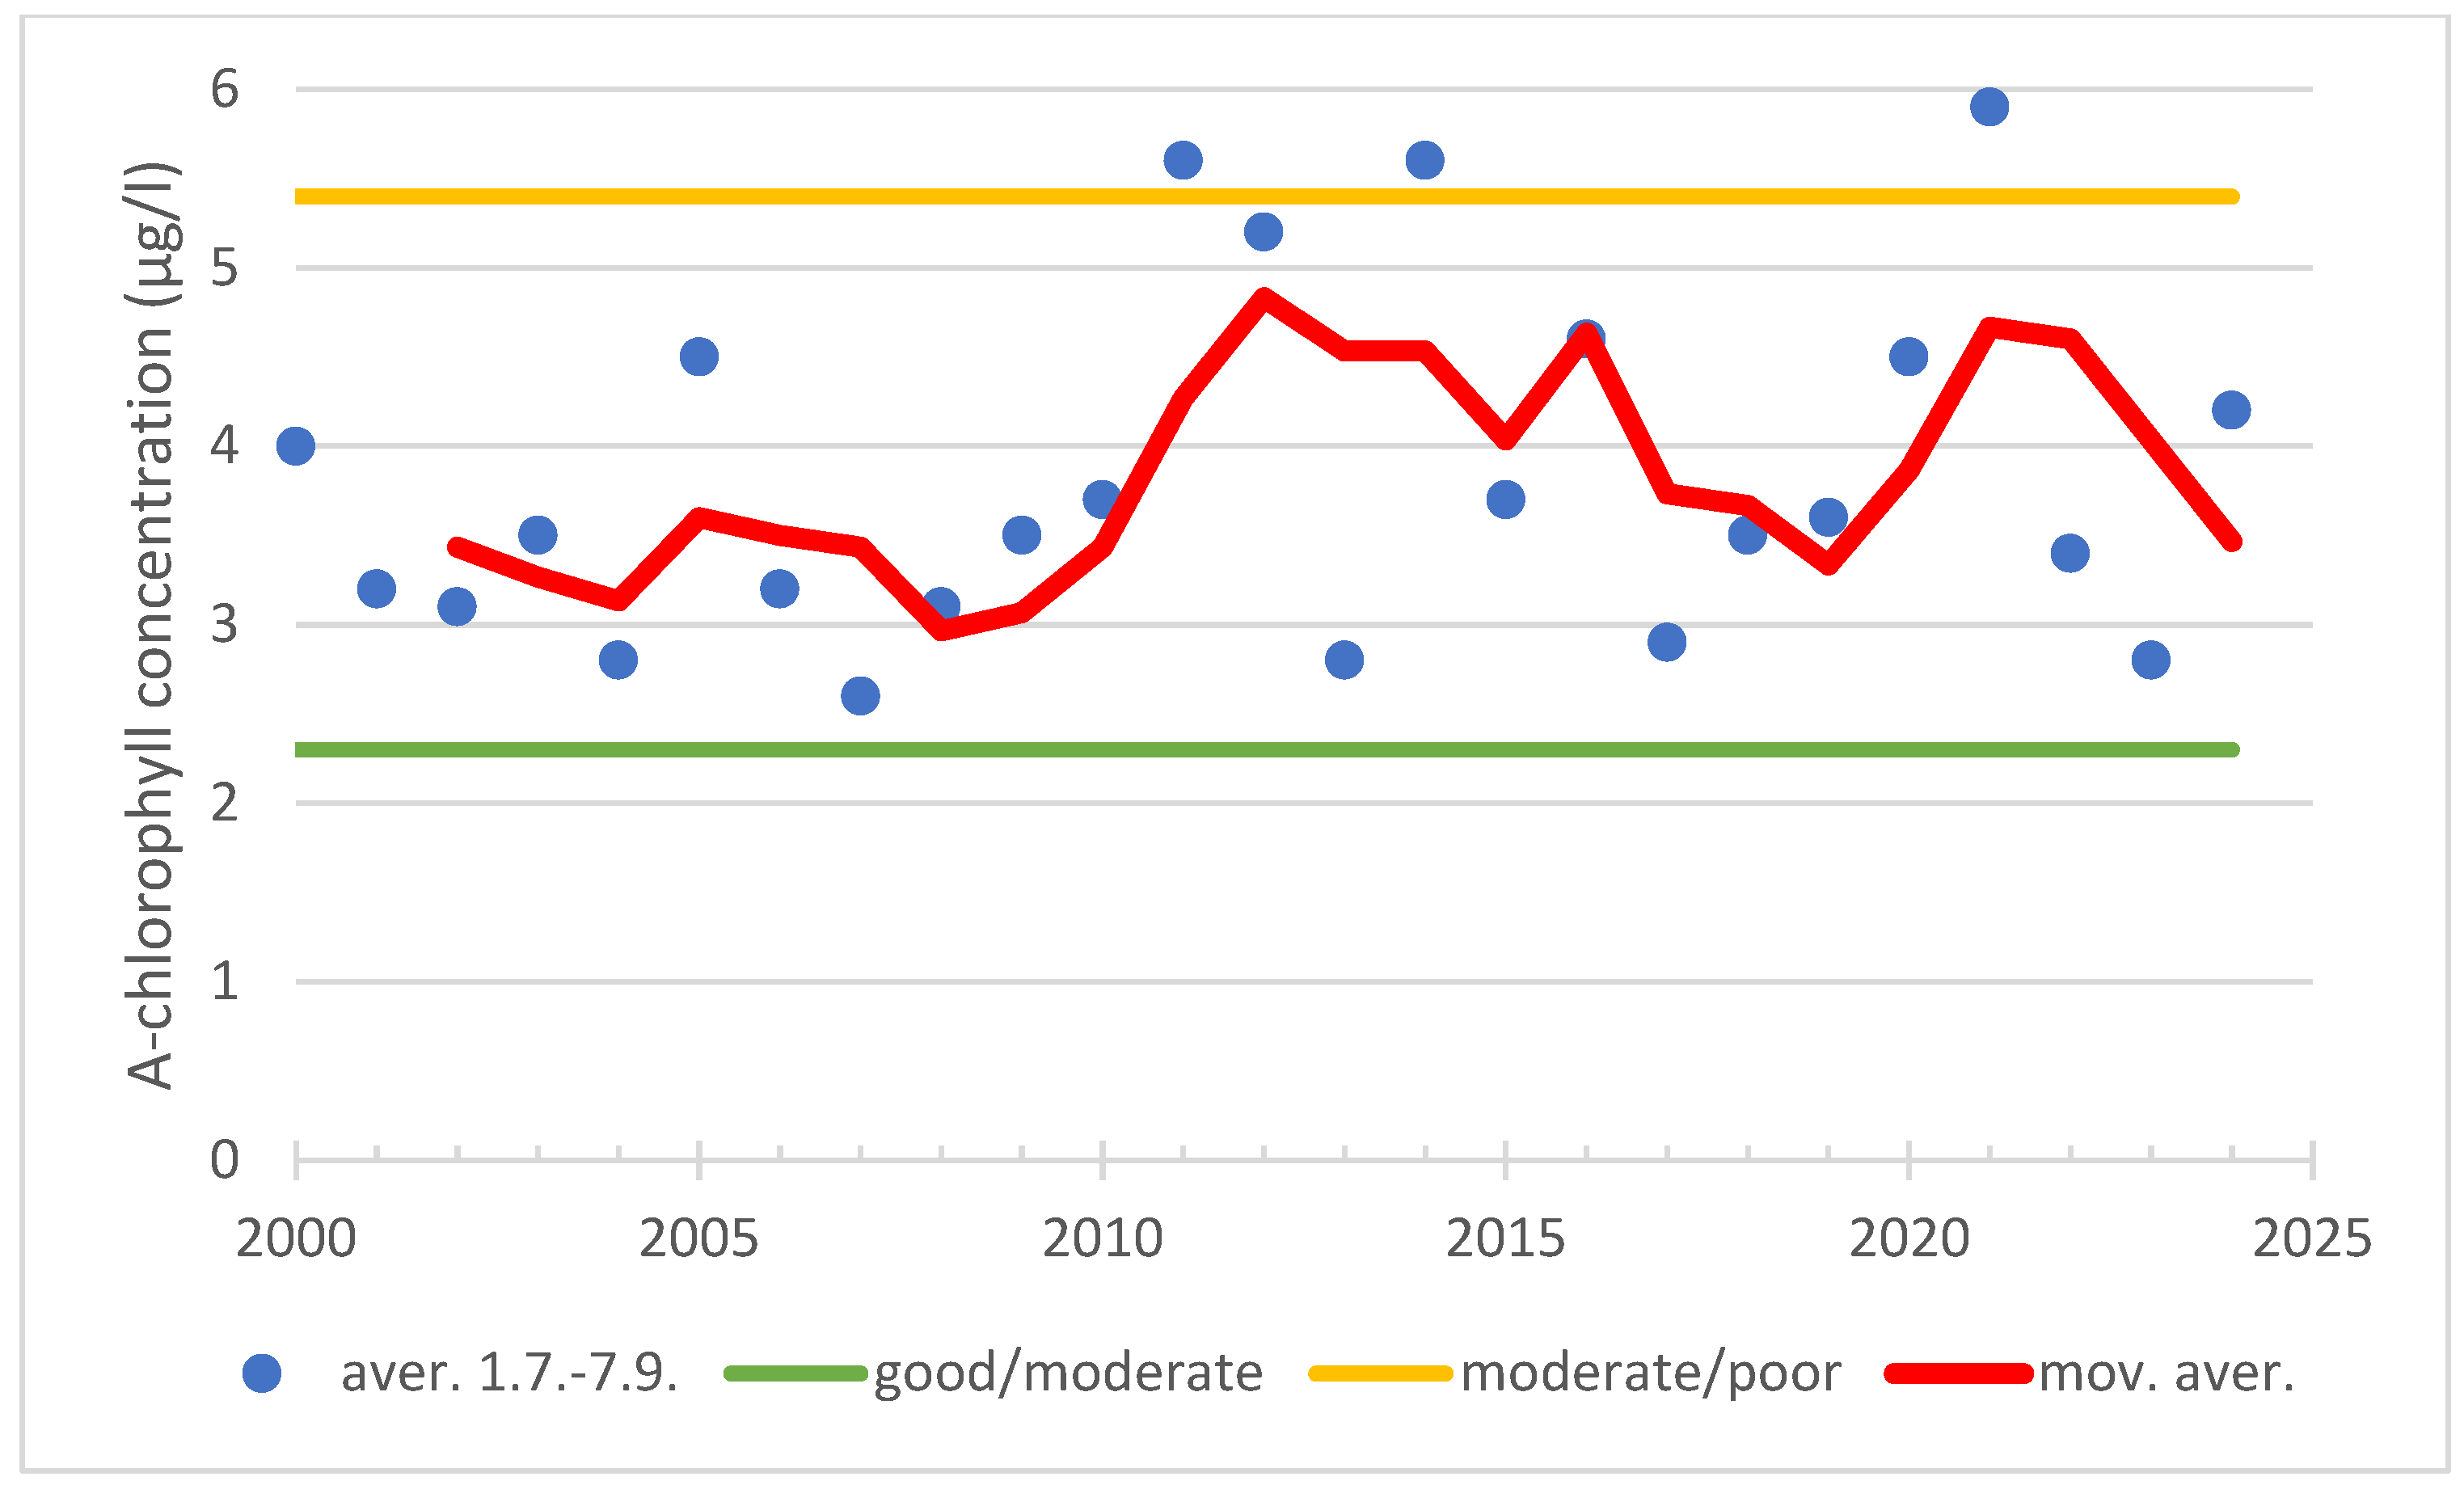
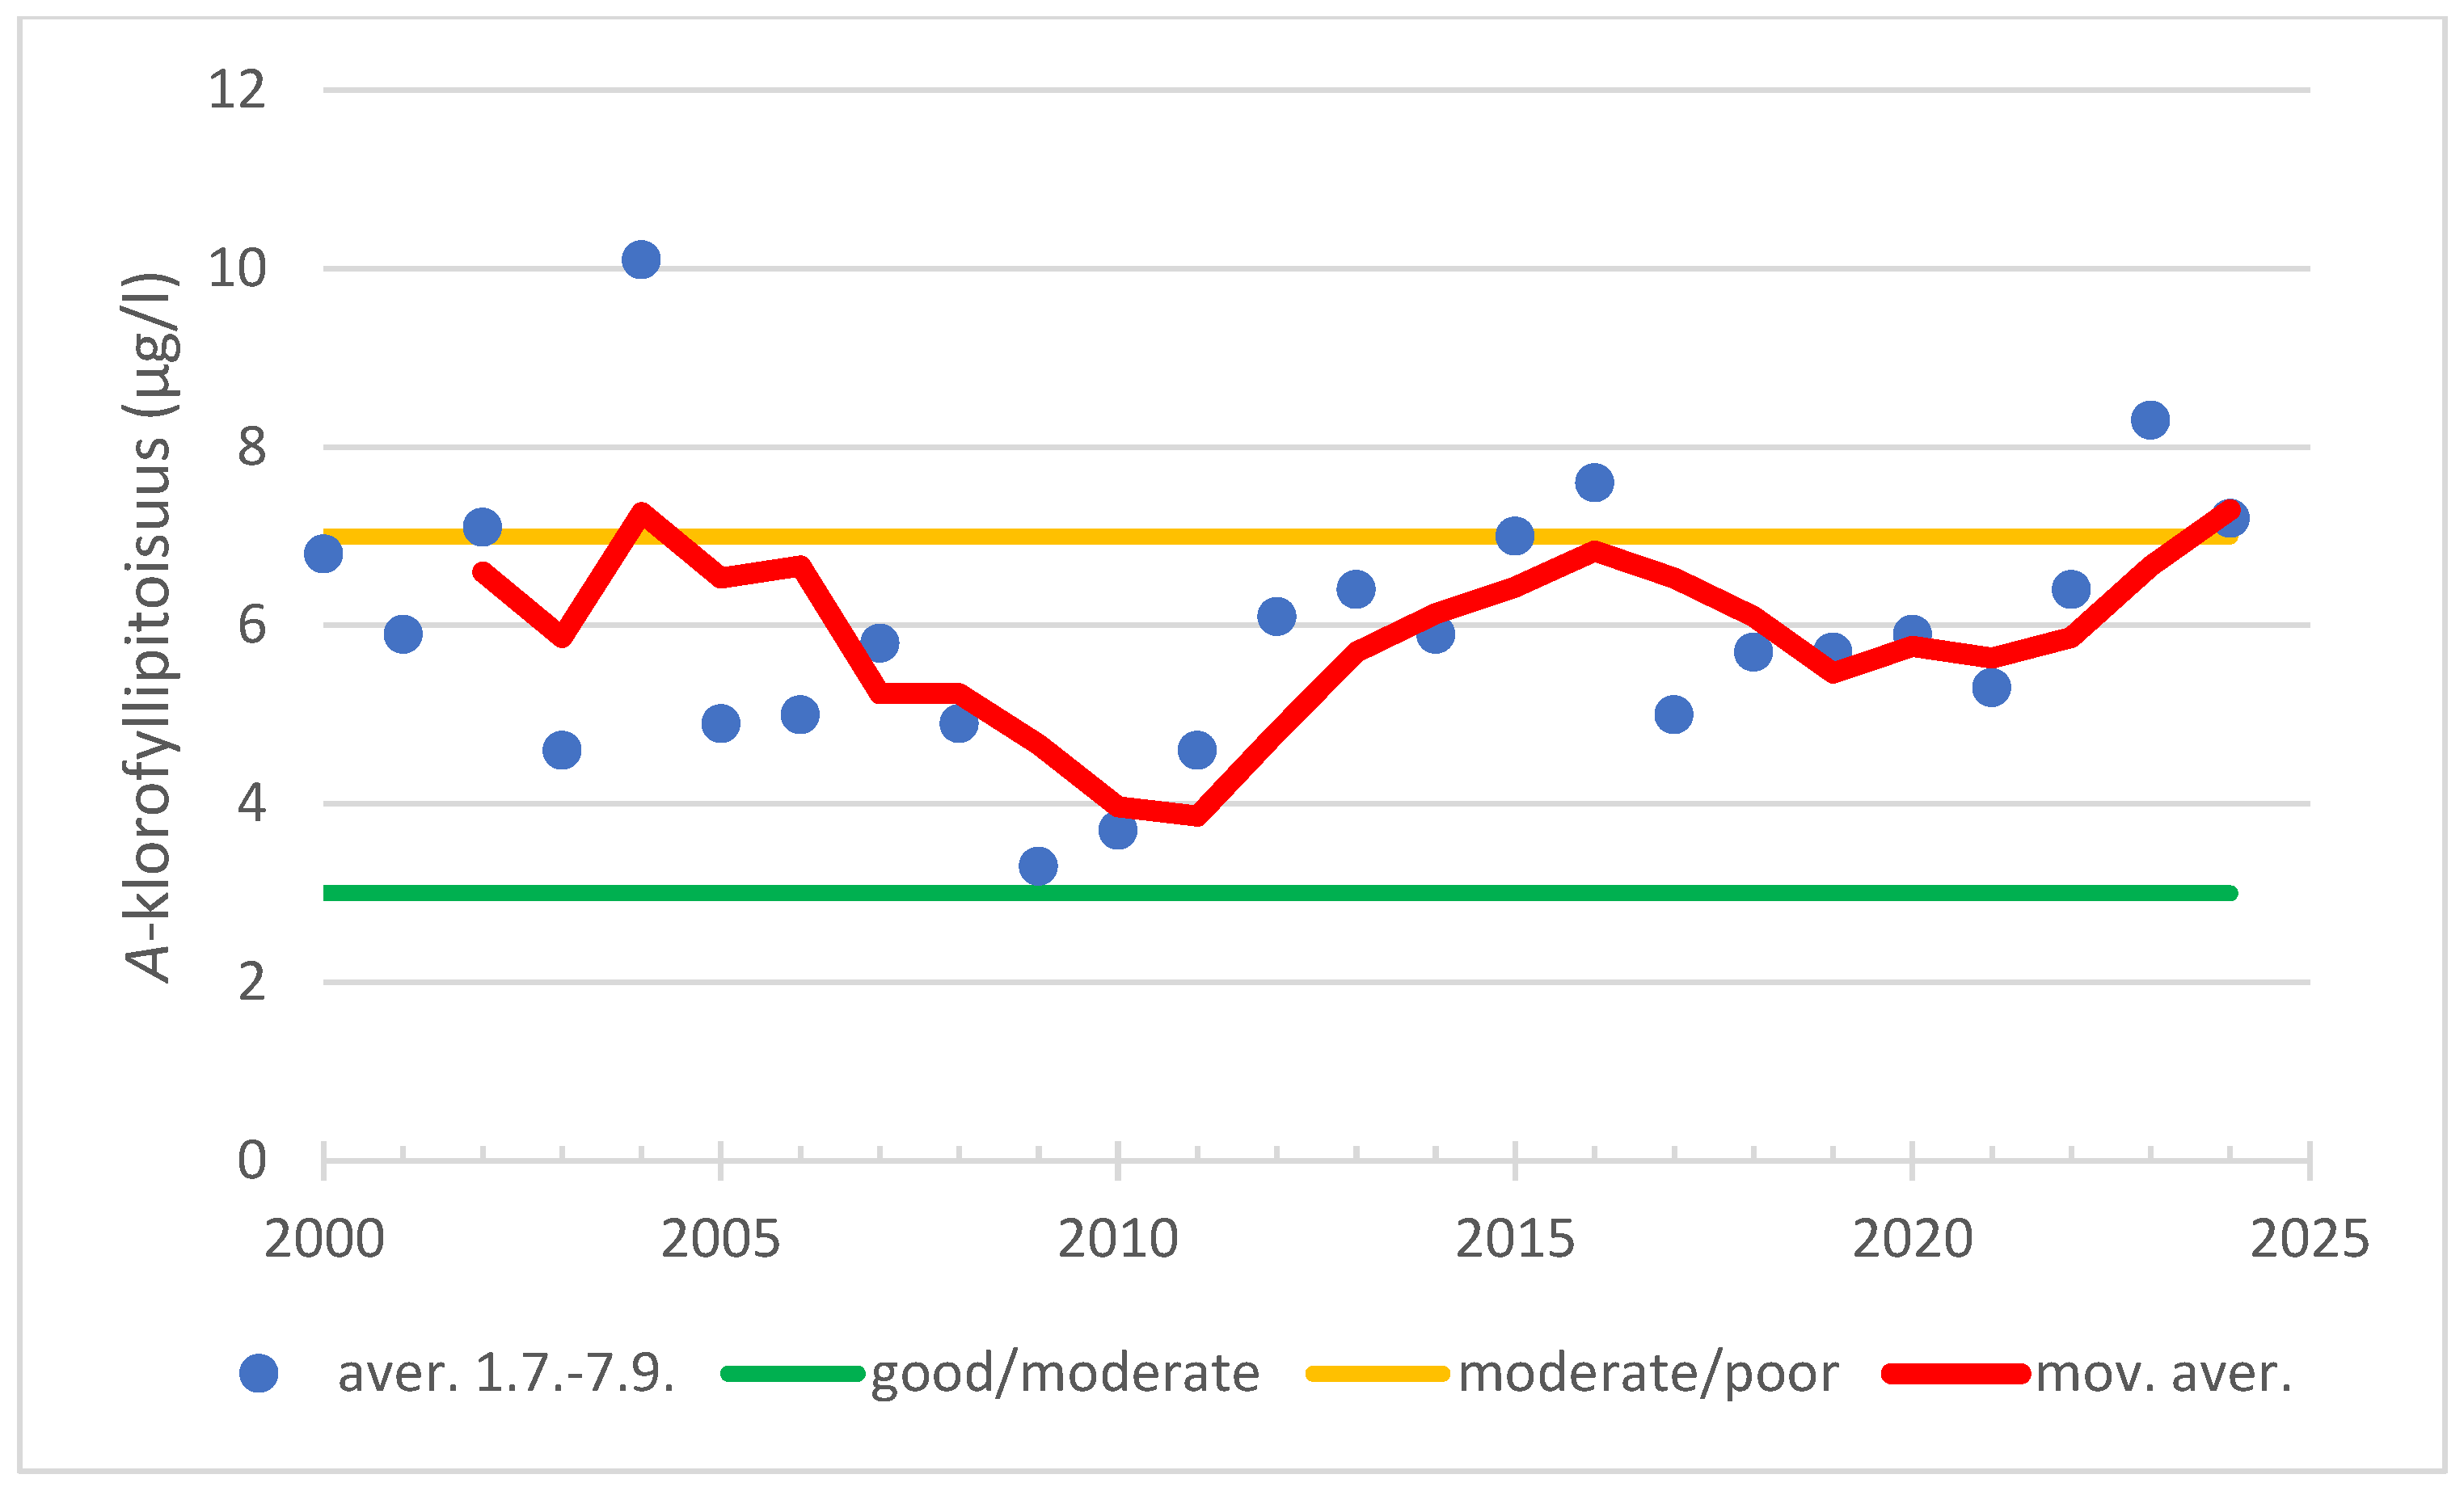
Figure 4.
The concentration of chlorophyll a (µg/L) in surface water (0–10 m) at observation station Turm 297 during the ecological classification period (1 July–7 September) from 2000 to 2024. The moderate status lower threshold (good/moderate) is 3.0 µg/L and upper (moderate/poor) 7.0 µg/l. The red line indicates the moving average in the chlorophyll a concentration over the entire period under review.
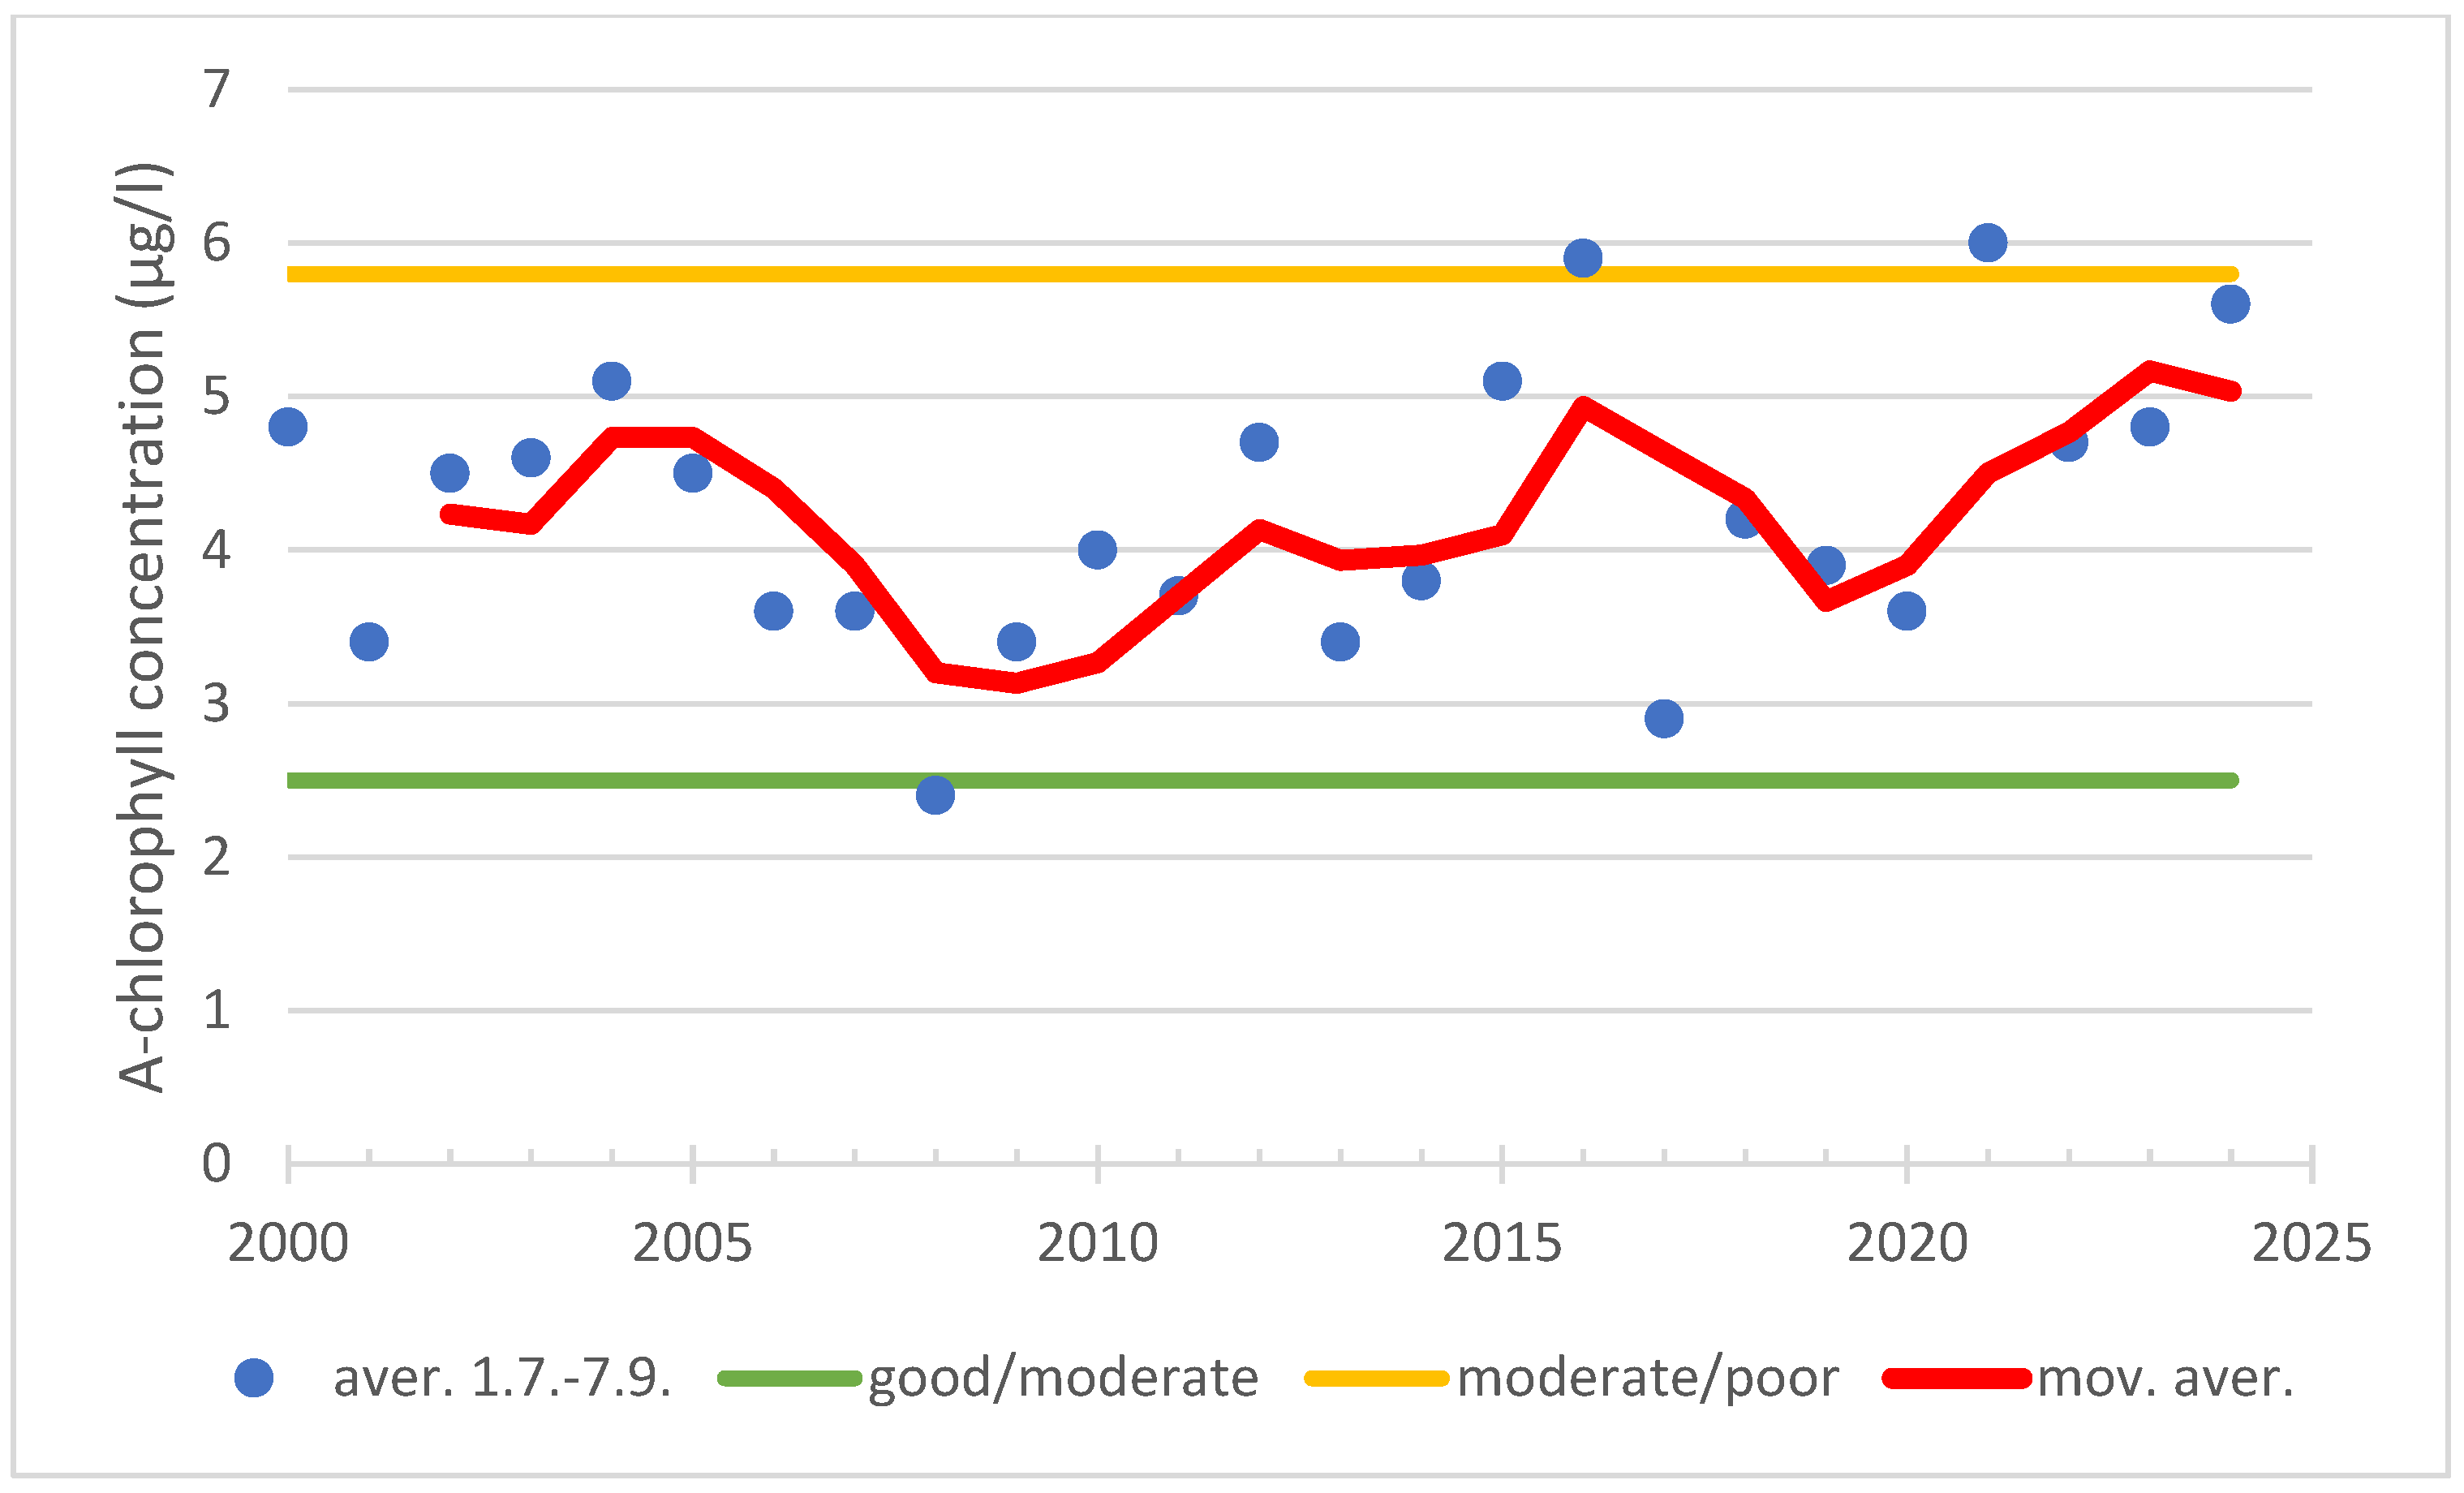
Figure 5.
The concentration of chlorophyll a (µg/L) in surface water (0–10 m) at observation station Seili during the ecological classification period (1 July–7 September) from 2000 to 2024. The good status lower threshold (good/moderate) is 2.5 µg/L, and upper (moderate/poor) one is 5.8 µg/L. The red line indicates the moving average in the chlorophyll a concentration over the entire period under review.
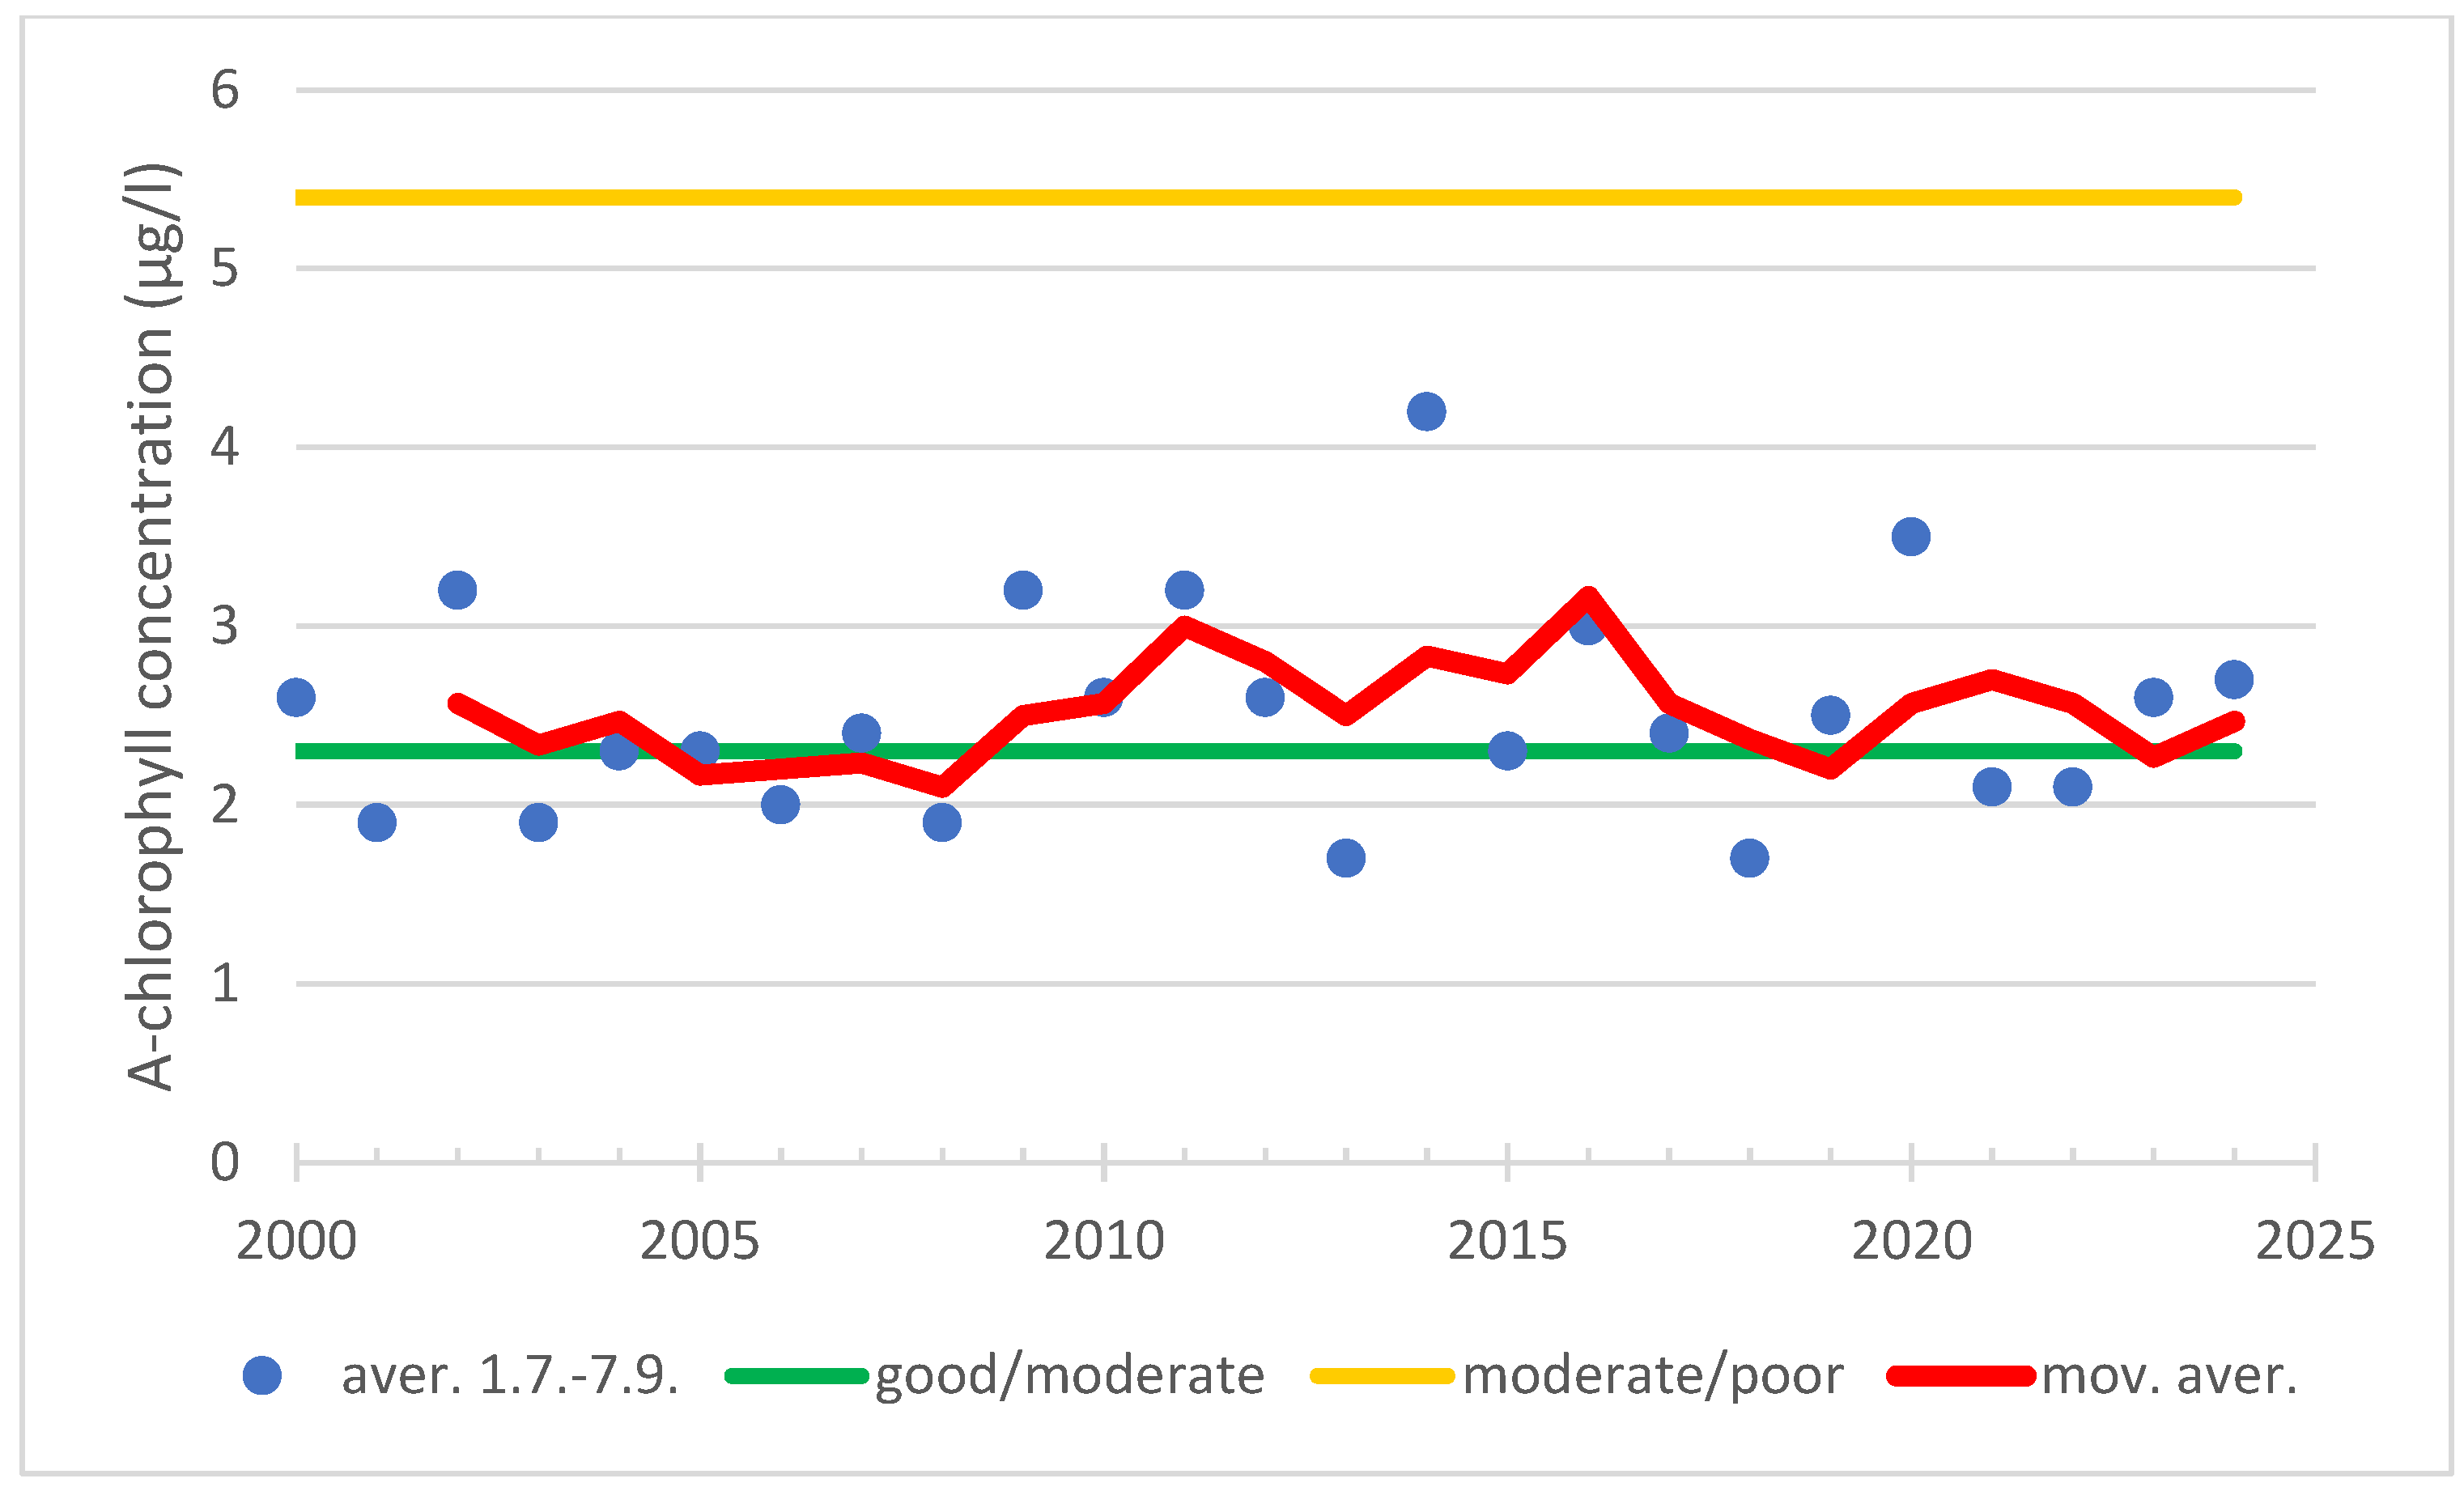
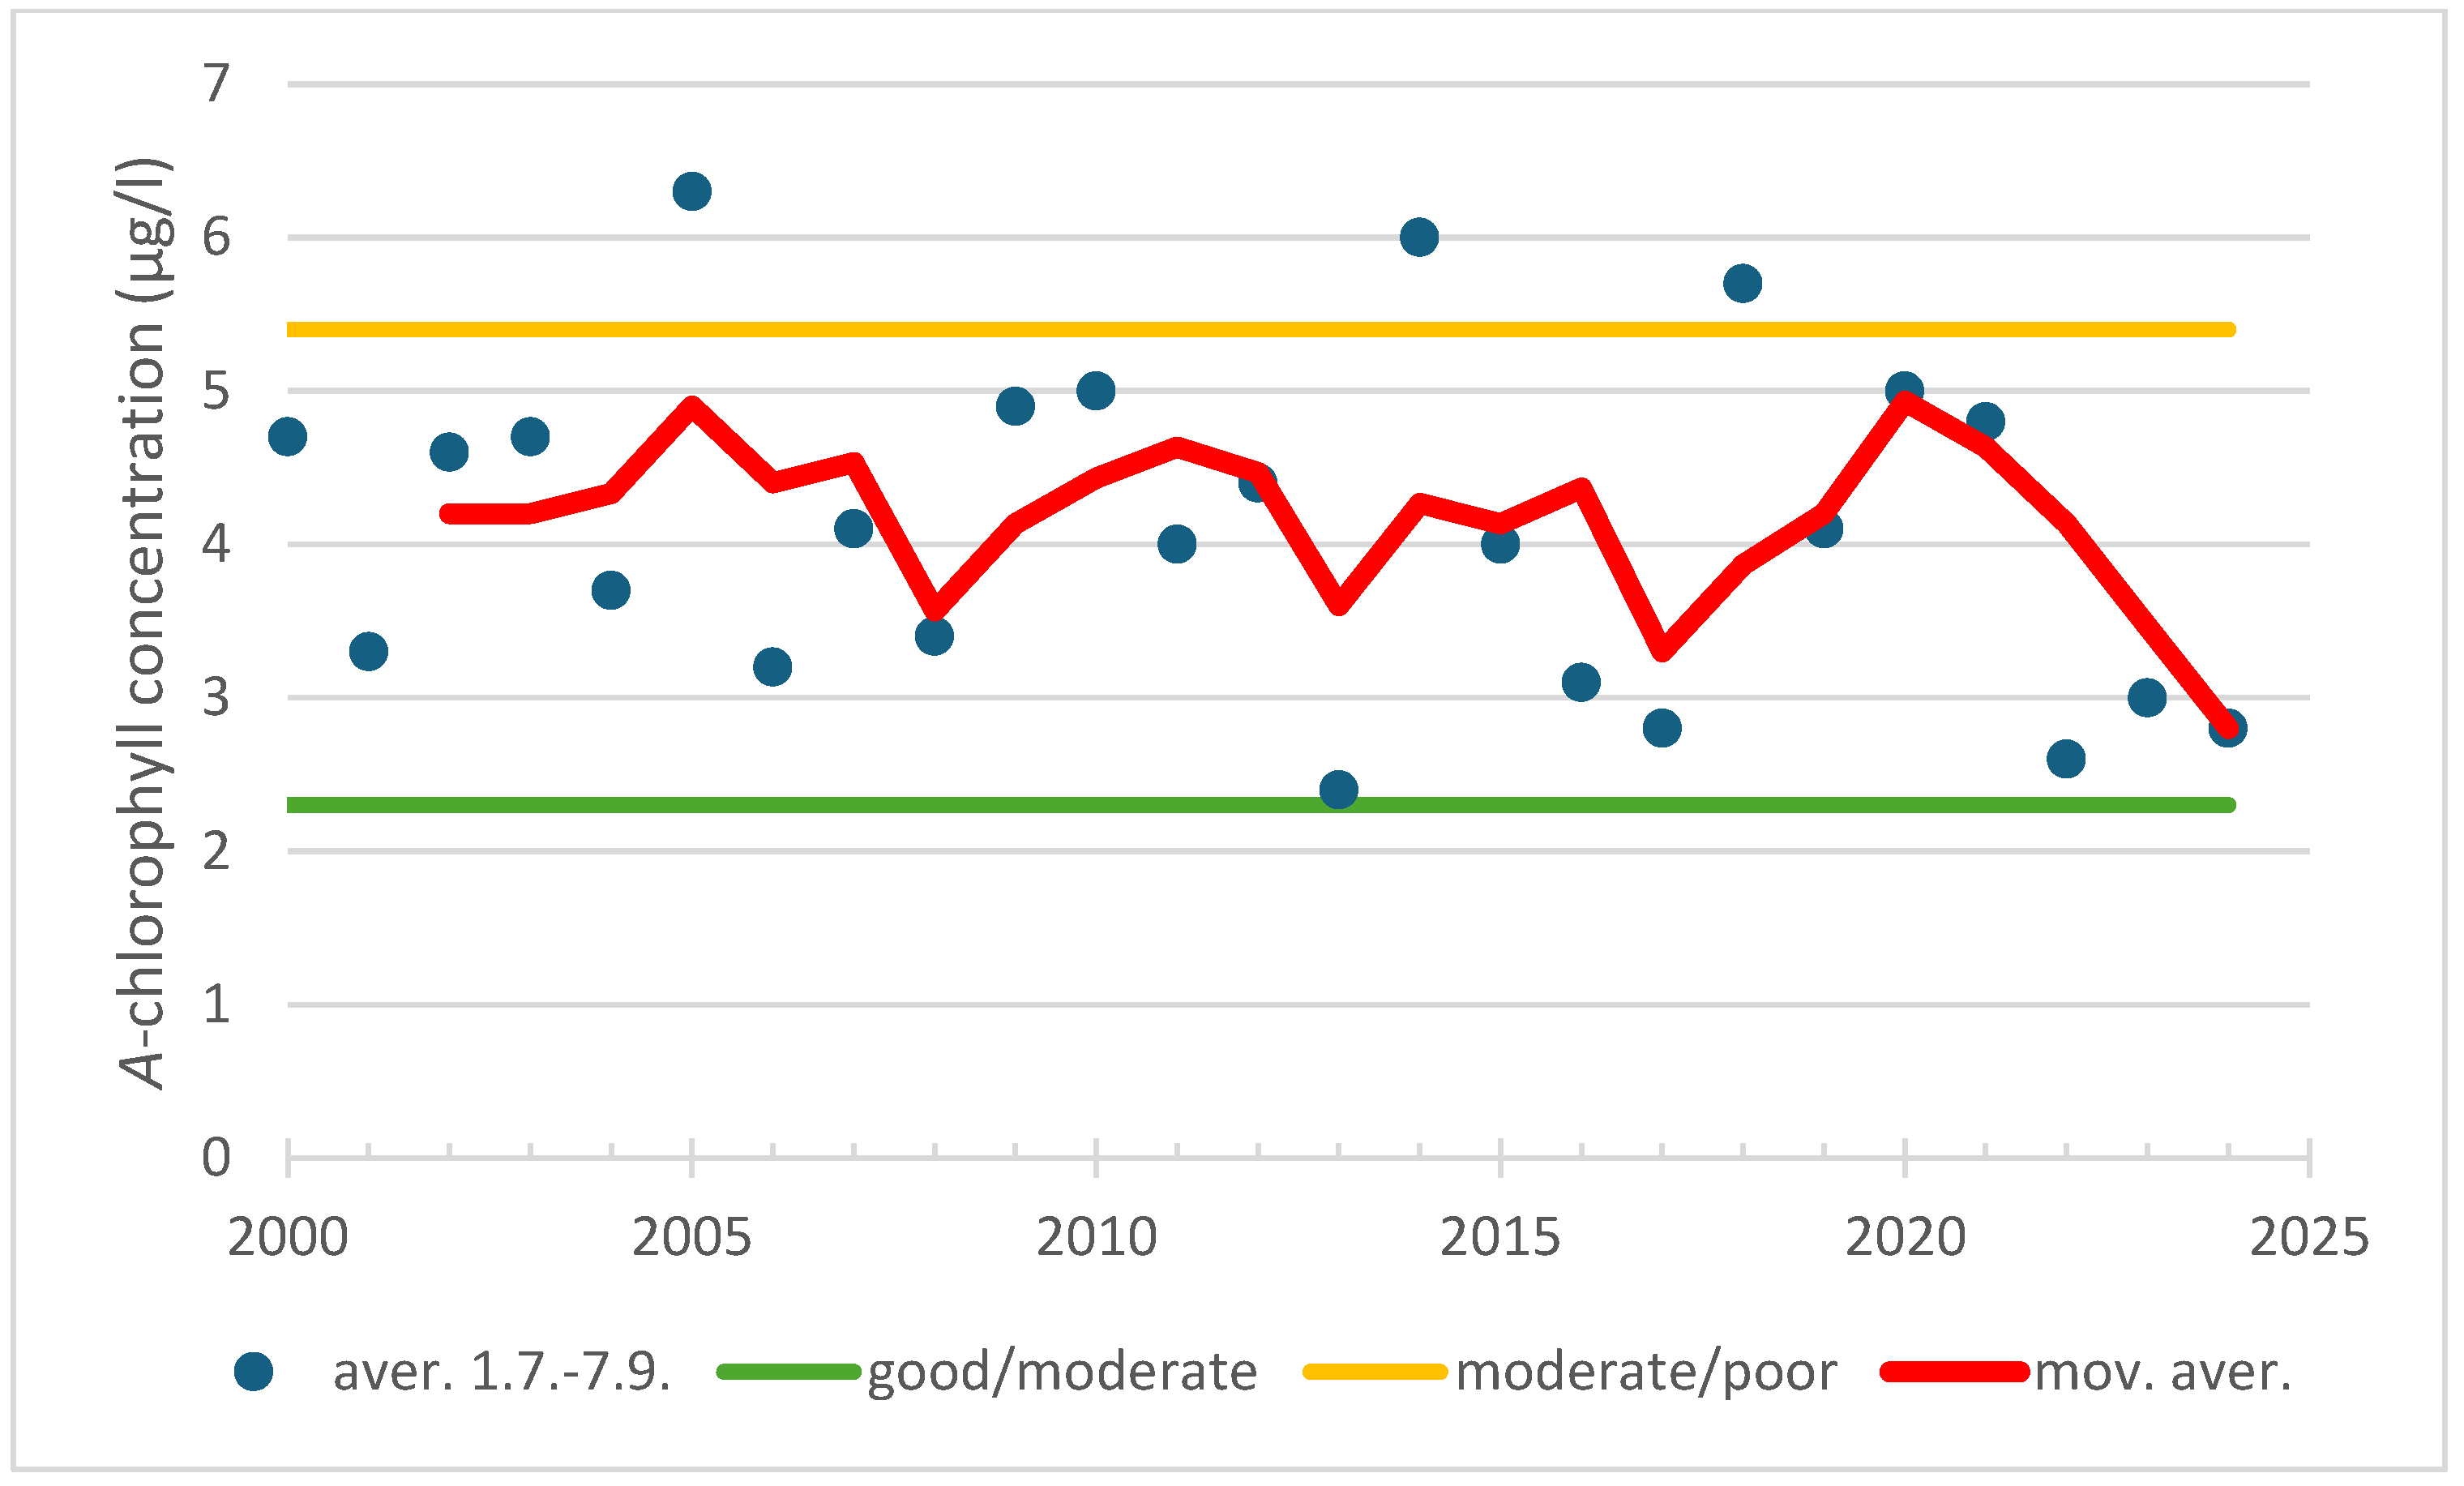
Figure 6.
The concentration of chlorophyll a (µg/L) in surface water (0–10 m) in combined data of observation stations Korp 175 Nötö and Dr 53 Vänö during the ecological classification period (1 July–7 September) from 2000 to 2024. The good status lower threshold (good/moderate) is 2.3 µg/L, and upper (moderate/poor) one is 5.4 µg/L. The red line indicates the moving average in the chlorophyll a concentration over the entire period under review.
Figure 7.
The concentration of chlorophyll a (µg/L) in surface water (0–10 m) at observation station Kuml 155 during the ecological classification period (1 July–7 September) from 2000 to 2024. The good status lower threshold (good/moderate) is 2.3 µg/L, and upper (moderate/poor) one is 5.4 µg/L. The red line indicates the decrease in the chlorophyll concentration over the entire period under review (p = 0.02; R2 = 0.23).
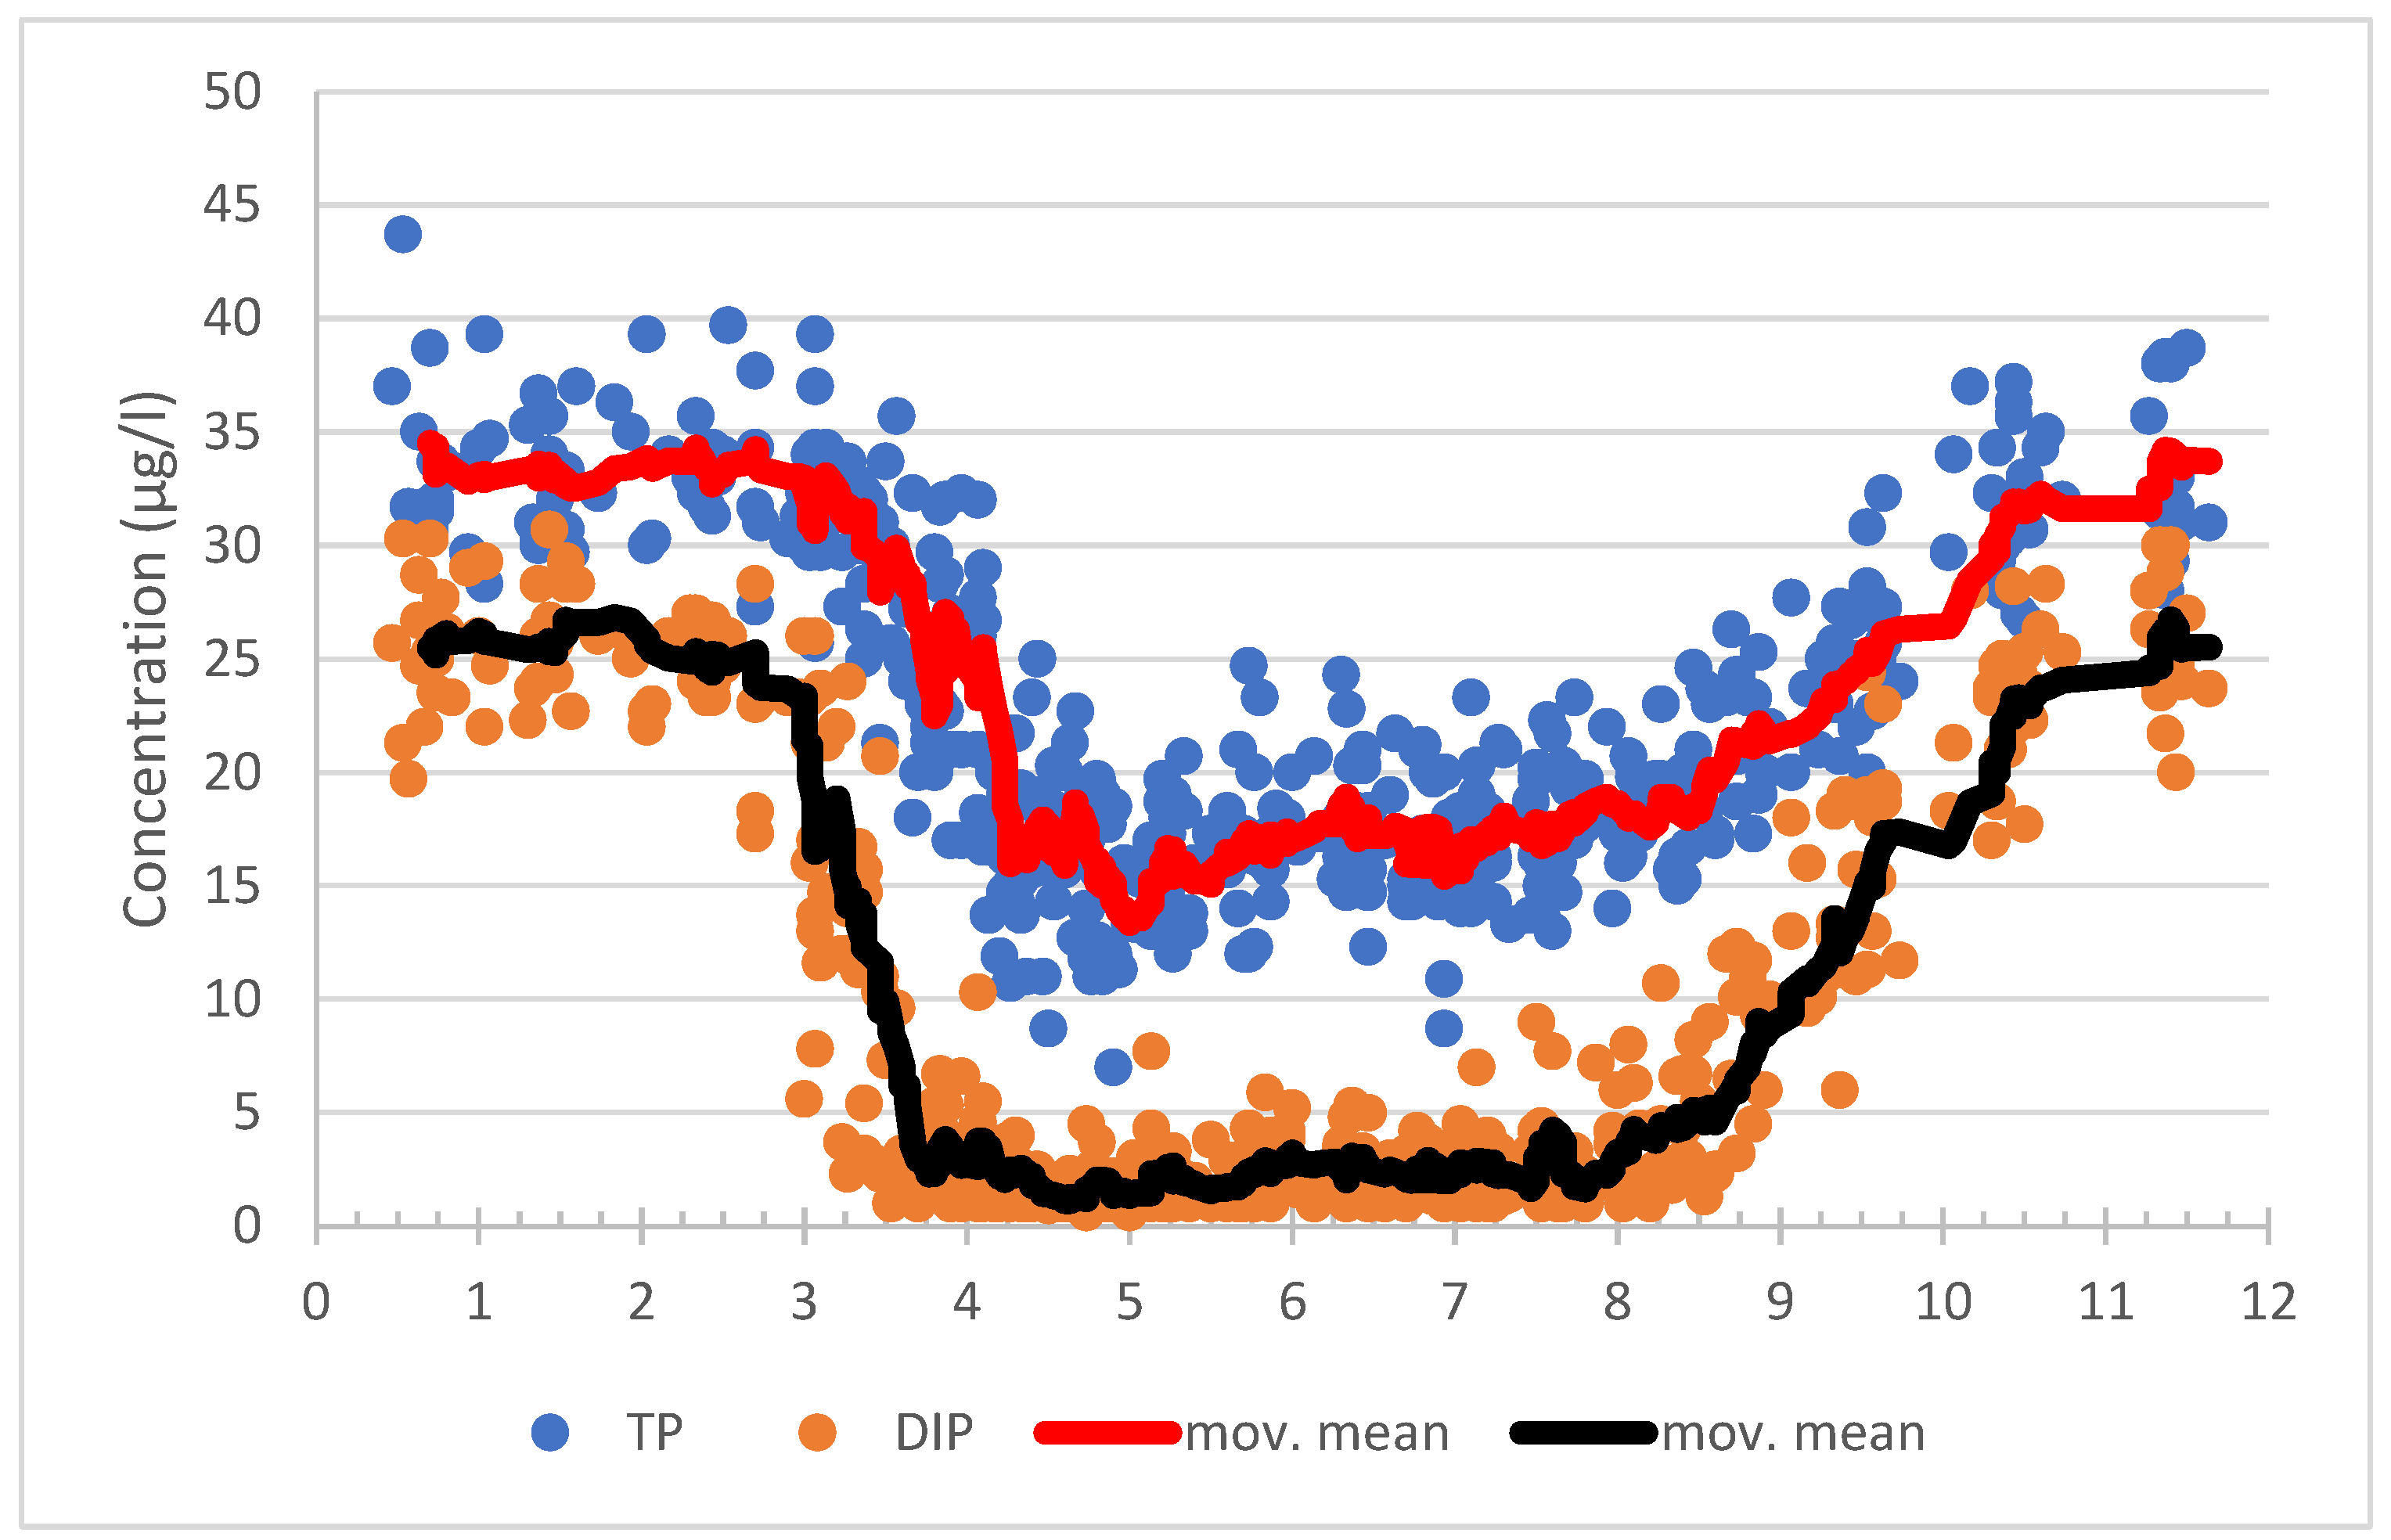
Figure 11.
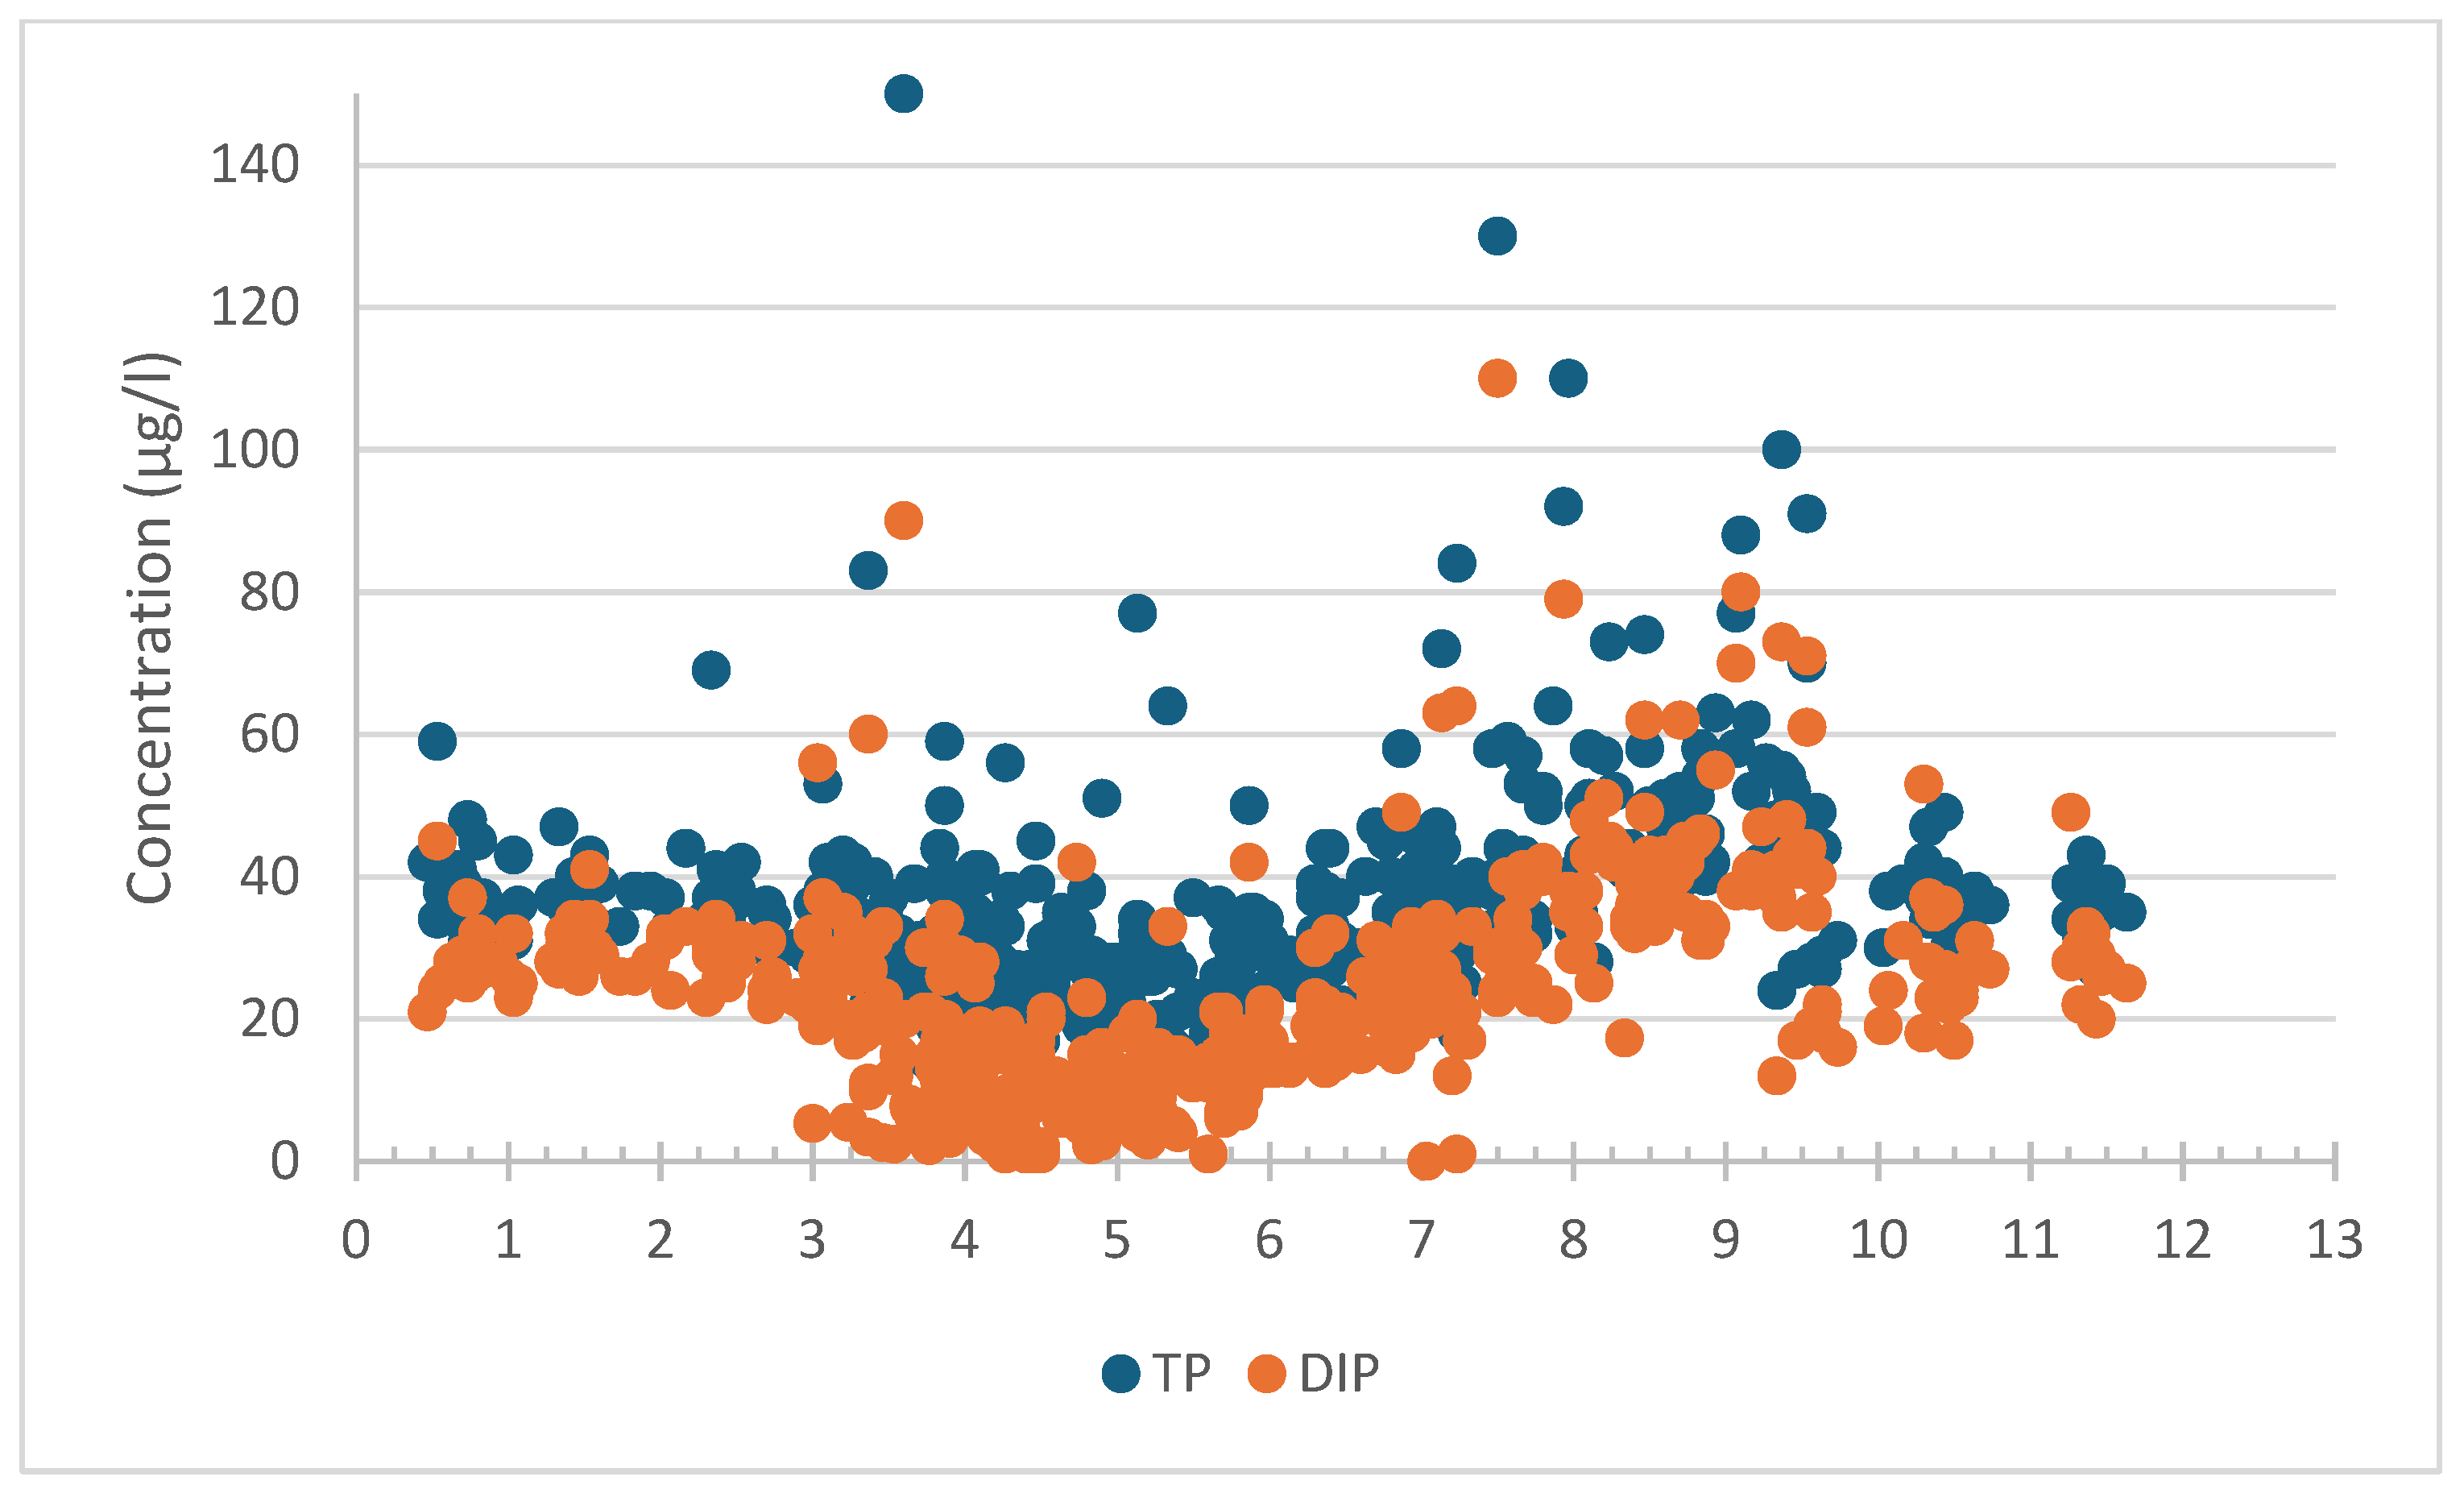
Total phosphorus (TP) and phosphate phosphorus (DIP) concentrations of sea water (µg/L) in observation station Seili in the Archipelago Sea in the surface layer (0-10 m) during the year (data from 2000-2024). The numbers on the x-axis refer to the months such that 0–1 represents January, and so on. 11-12 is December.
Figure 11.
Total phosphorus (TP) and phosphate phosphorus (DIP) concentrations of sea water (µg/L) in observation station Seili in the Archipelago Sea in the surface layer (0-10 m) during the year (data from 2000-2024). The numbers on the x-axis refer to the months such that 0–1 represents January, and so on. 11-12 is December.
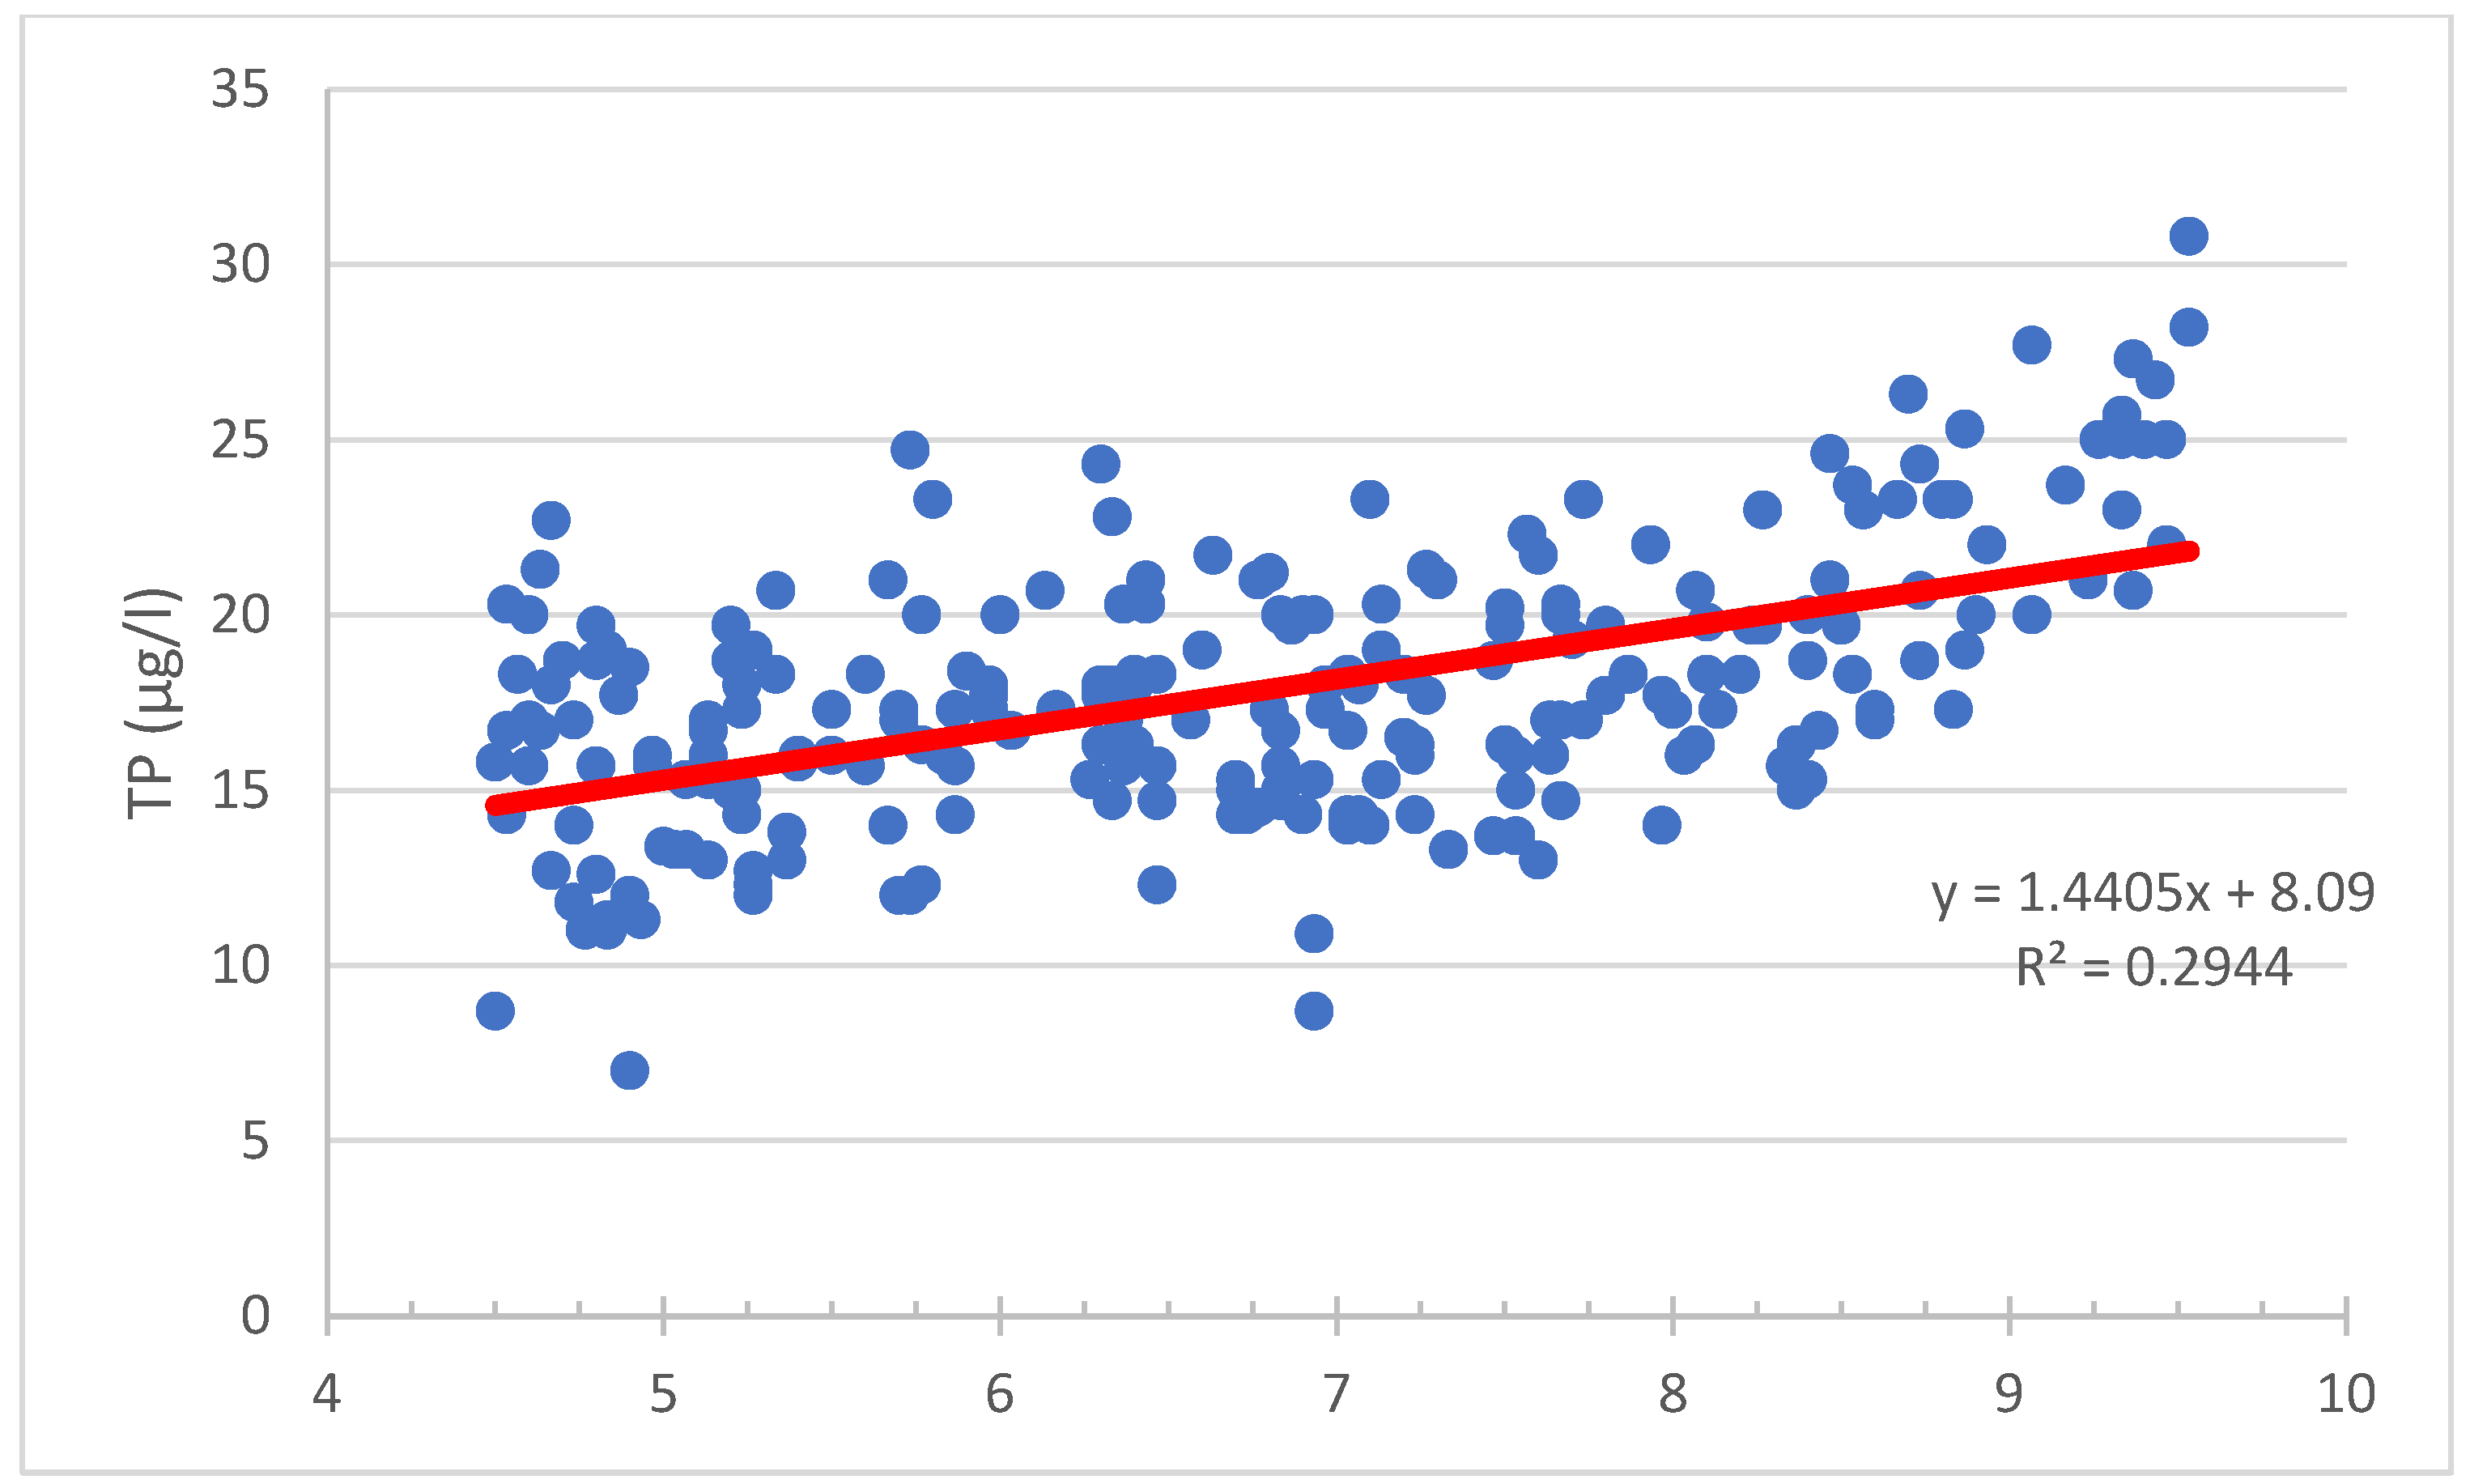
Figure 12.
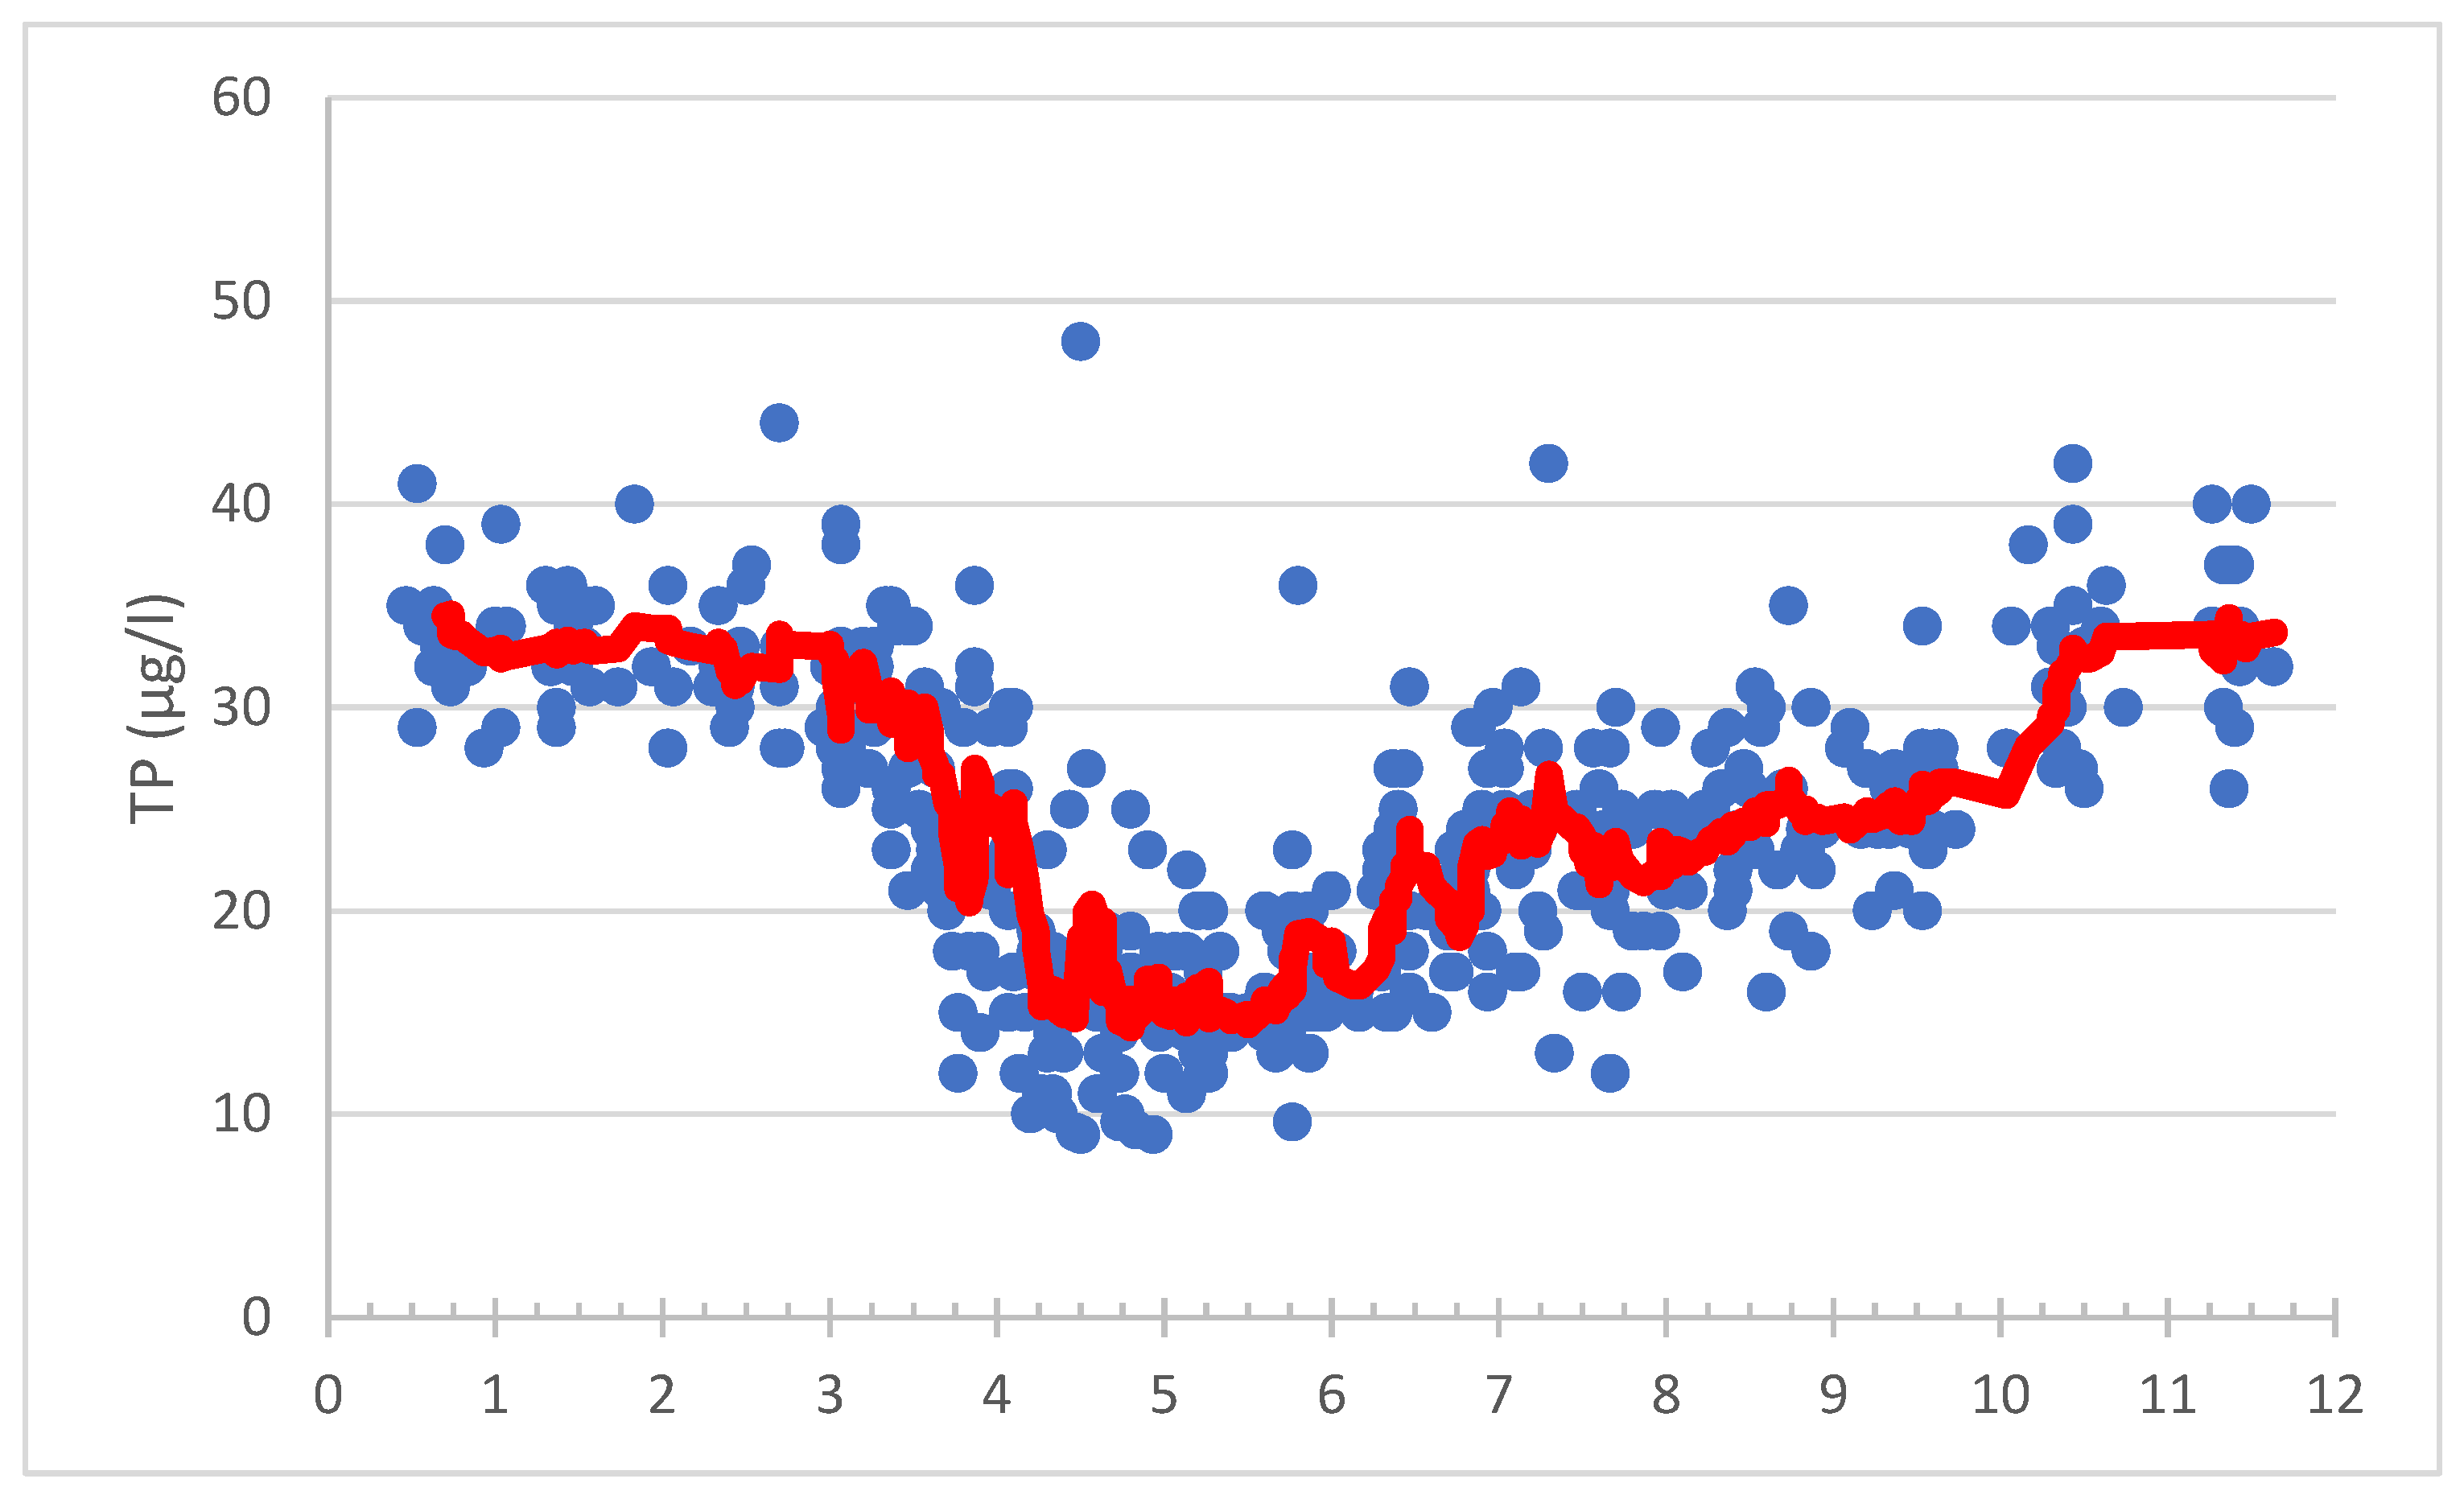
Total phosphorus (TP) concentrations of sea water (µg/L) in observation station Seili in the Archipelago Sea in the surface layer (0-10 m) during the period May 15–October 15 (data from 2000-2024). The numbers on the x-axis refer to the months such that 0–1 represents January, and so on. 11-12 is December. The red line indicates the increase in TP concentration over the entire period (p < 0.001; R2 = 0.29).
Figure 12.
Total phosphorus (TP) concentrations of sea water (µg/L) in observation station Seili in the Archipelago Sea in the surface layer (0-10 m) during the period May 15–October 15 (data from 2000-2024). The numbers on the x-axis refer to the months such that 0–1 represents January, and so on. 11-12 is December. The red line indicates the increase in TP concentration over the entire period (p < 0.001; R2 = 0.29).
Figure 13.
Total phosphorus (TP) concentrations of sea water (µg/L) in observation station Seili in the Archipelago Sea in the middle layer (10-20 m) during the period May 15–October 15 (data from 2000-2024).
Figure 13.
Total phosphorus (TP) concentrations of sea water (µg/L) in observation station Seili in the Archipelago Sea in the middle layer (10-20 m) during the period May 15–October 15 (data from 2000-2024).
Figure 14.
Total phosphorus (TP) and phosphate phosphorus (DIP) concentrations of sea water (µg/L) in observation station Seili in the Archipelago Sea near bottom (44-50 m) during the year (data from 2000-2024).
Figure 14.
Total phosphorus (TP) and phosphate phosphorus (DIP) concentrations of sea water (µg/L) in observation station Seili in the Archipelago Sea near bottom (44-50 m) during the year (data from 2000-2024).
Figure 15.
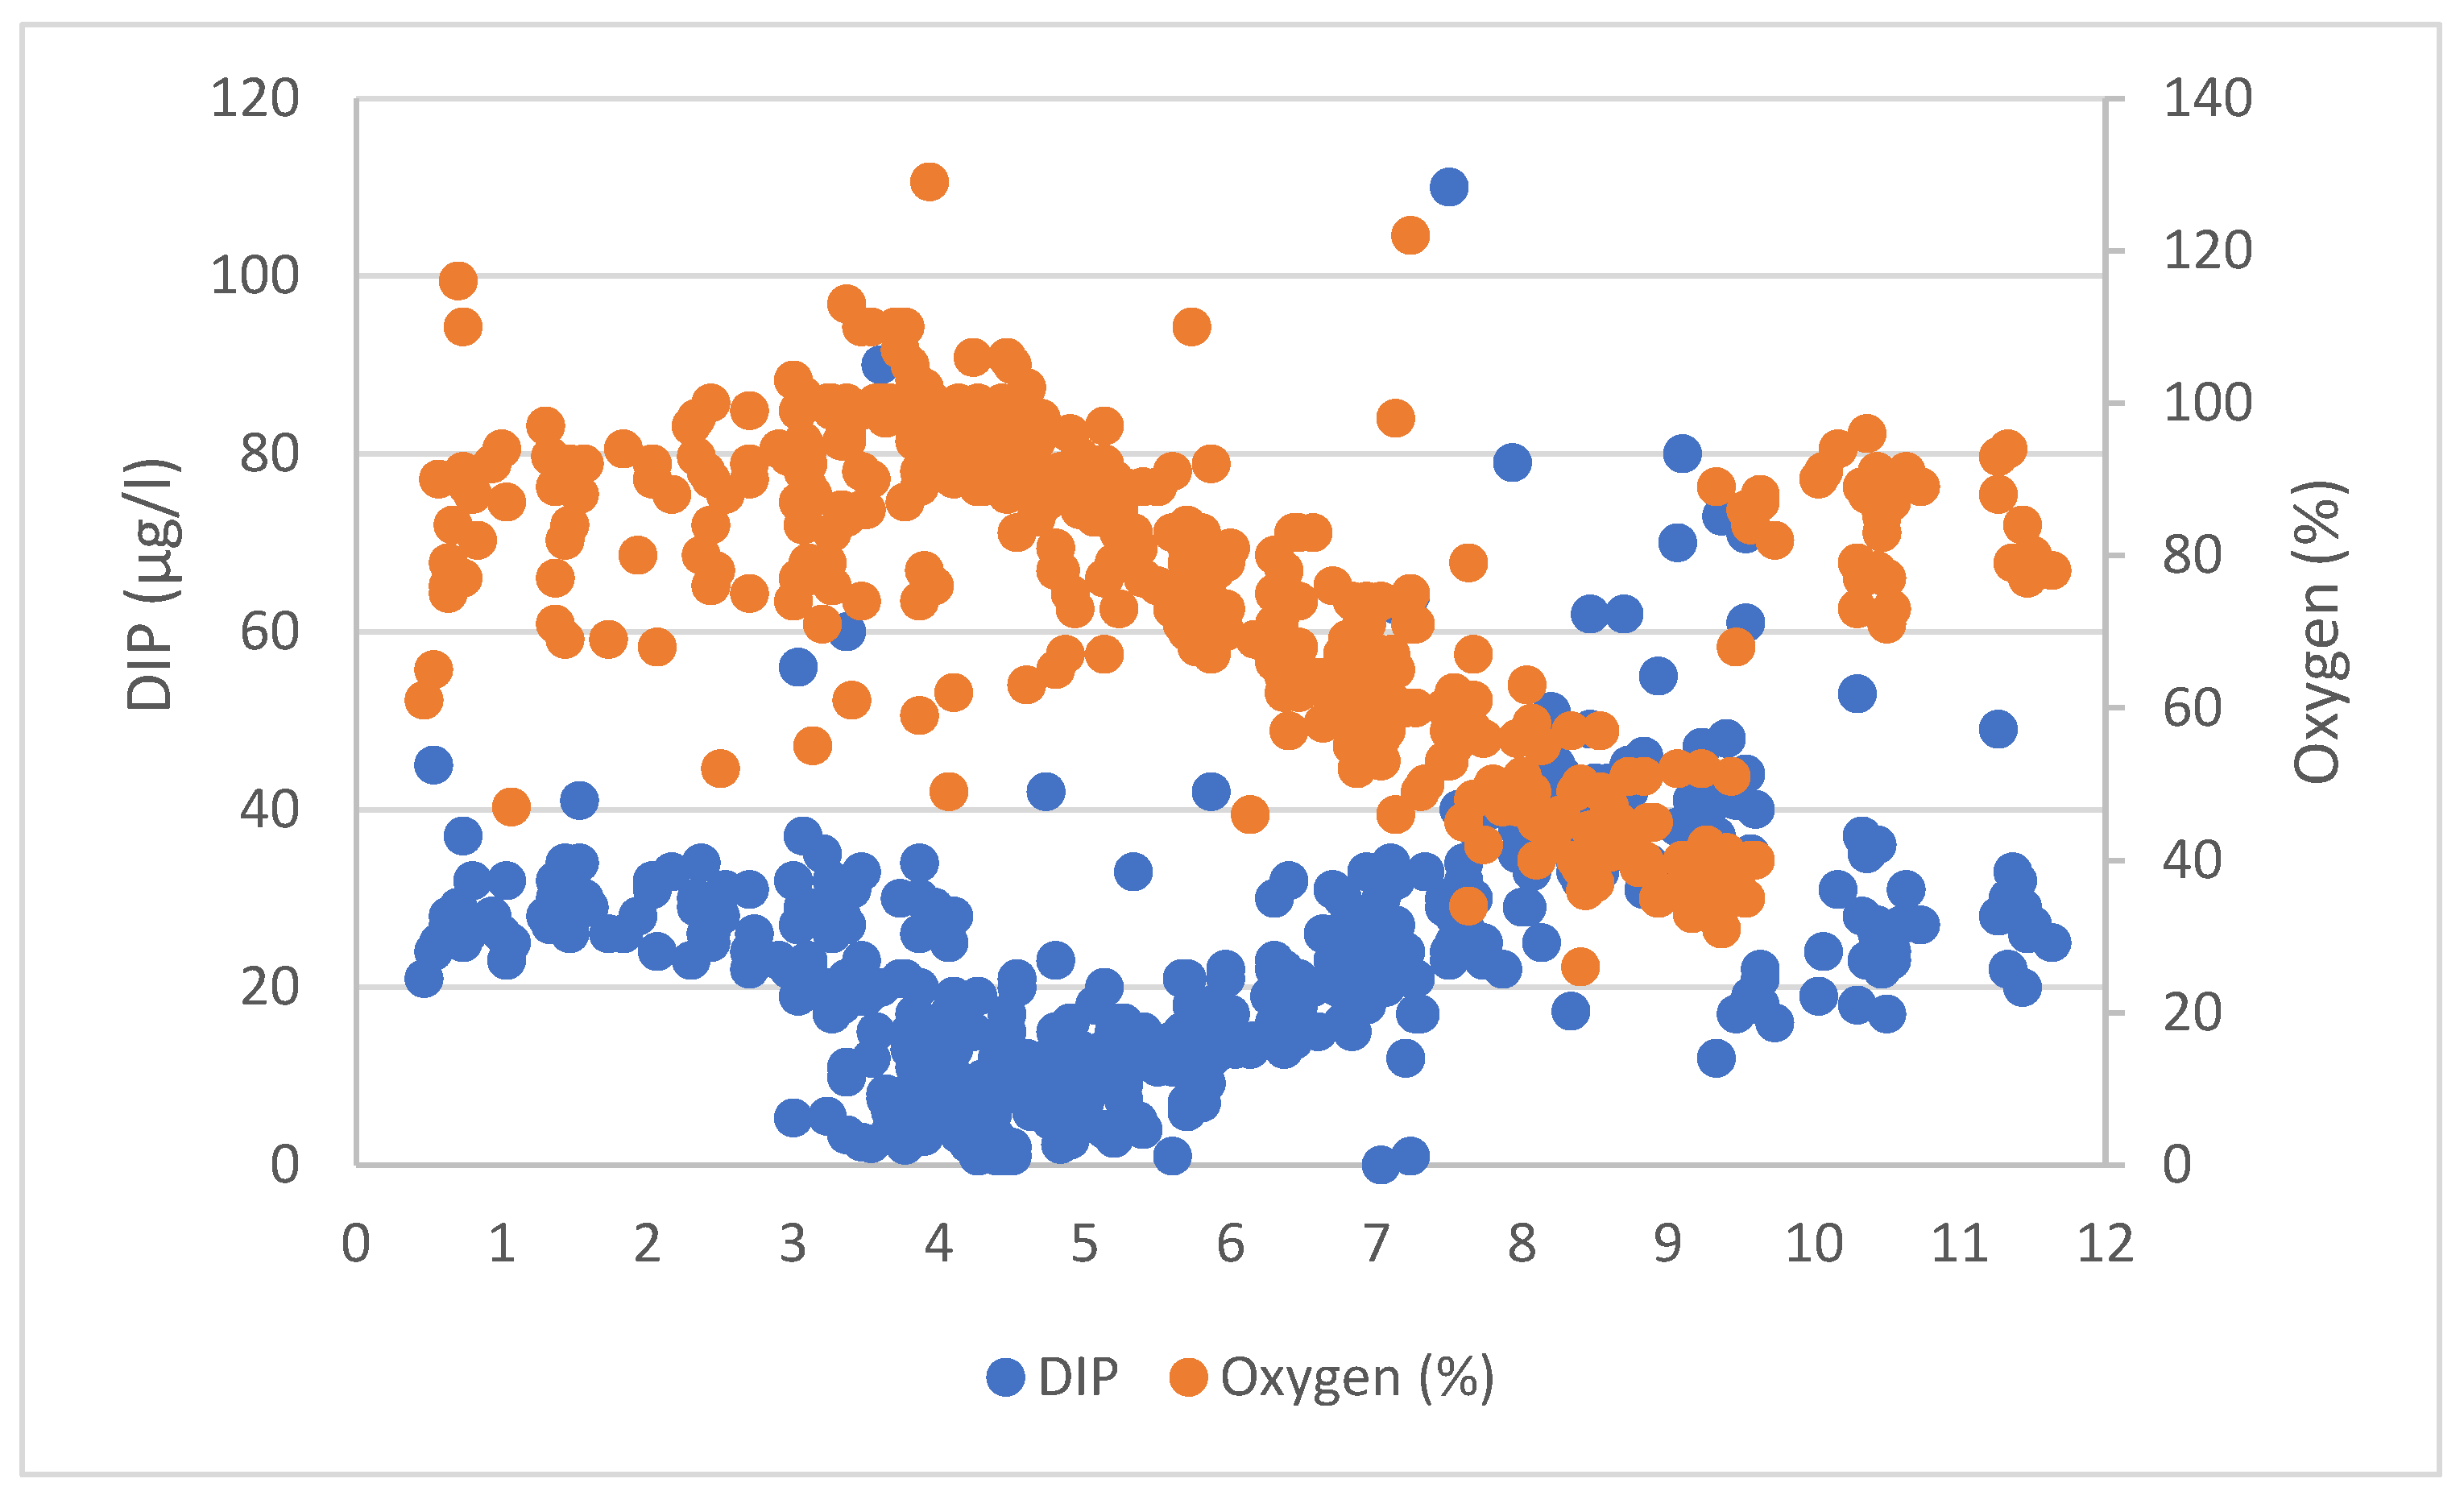
Phosphate phosphorus (DIP) concentrations of sea water (µg/L) and oxygen saturation rates (%) in observation station Seili in the Archipelago Sea near bottom (44-50 m) during the year (data from 2000-2024).
Figure 15.
Phosphate phosphorus (DIP) concentrations of sea water (µg/L) and oxygen saturation rates (%) in observation station Seili in the Archipelago Sea near bottom (44-50 m) during the year (data from 2000-2024).
Figure 16.
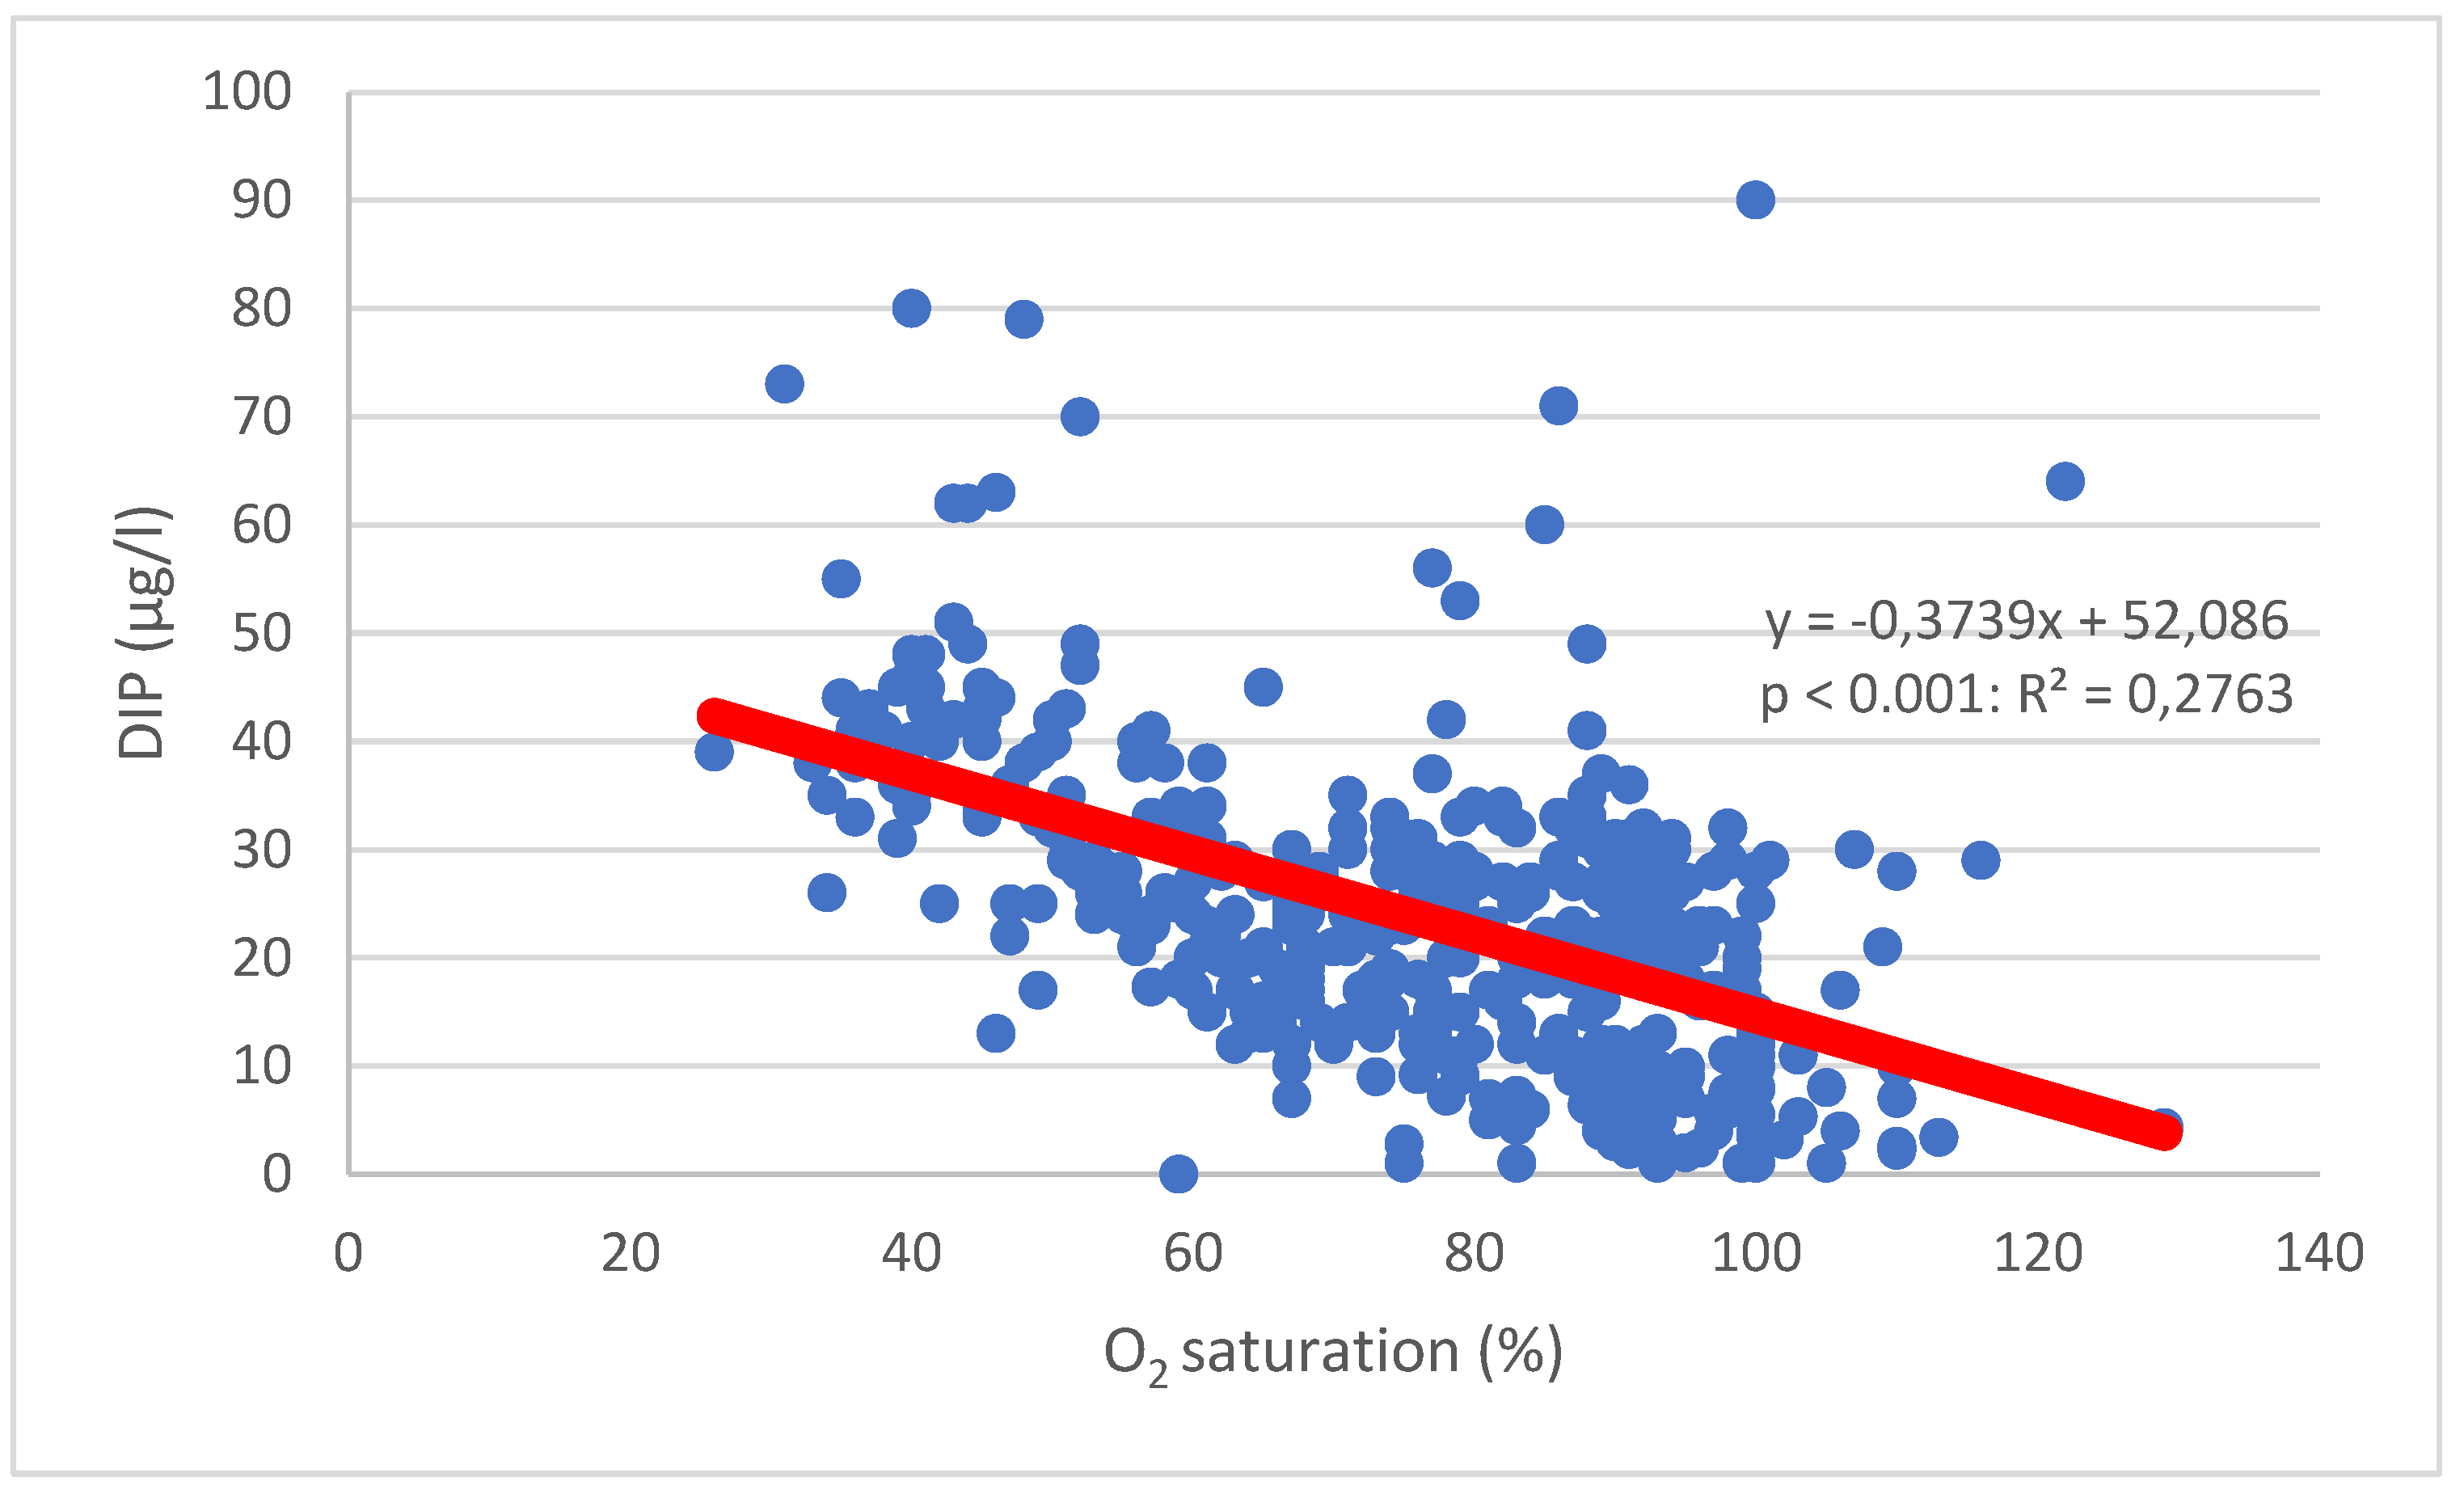
Relationhsip between phosphate phosphorus (DIP) concentrations of sea water (µg/L) and oxygen saturation rates (%) in observation station Seili in the Archipelago Sea near bottom (44-50 m) during the year (data from 2000-2024).
Figure 16.
Relationhsip between phosphate phosphorus (DIP) concentrations of sea water (µg/L) and oxygen saturation rates (%) in observation station Seili in the Archipelago Sea near bottom (44-50 m) during the year (data from 2000-2024).
Table 1.
The total phosphorus load from various sources into the mainland water bodies of the Archipelago Sea (6191 km2).
Table 1.
The total phosphorus load from various sources into the mainland water bodies of the Archipelago Sea (6191 km2).
| Source |
Load (t/a) |
| diffuse load |
350 |
| natural leaching |
97 |
| point source |
35 |
| atmospheirc deposition |
93 |
| Layers (m) |
Volume (km3) |
| 0-10 |
80,2 |
| 10-20 |
51,3 |
| 20-50 |
67,57 |
| 50-100 |
21,32 |
Table 2.
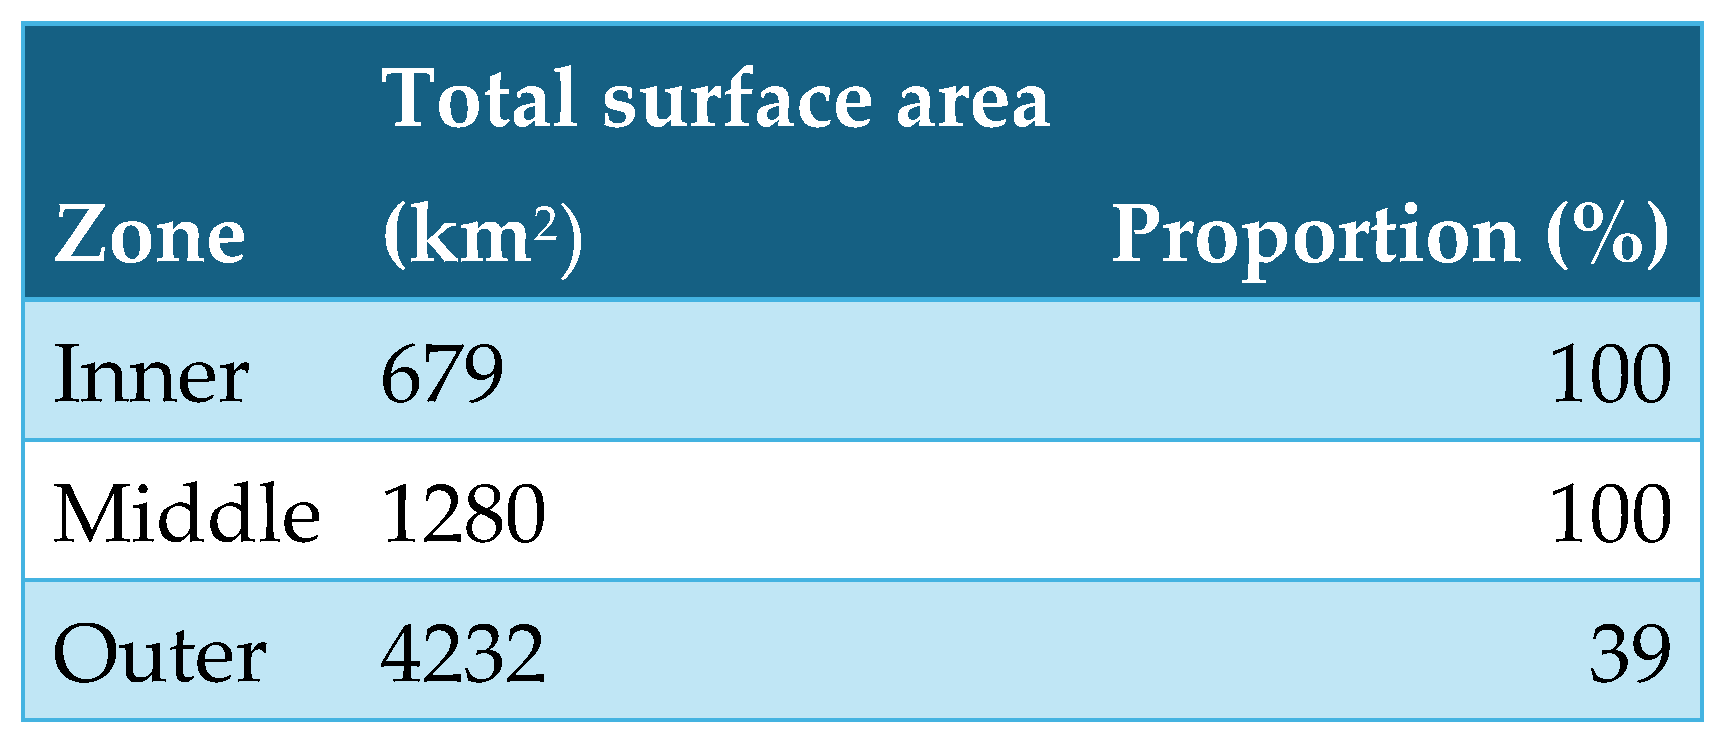
Surface areas of different water body types (inner, middle and outer) in the Archipelago Sea. Proportion (%) refers to the portion of the water body where internal loading is estimated to occur.
Table 2.
Surface areas of different water body types (inner, middle and outer) in the Archipelago Sea. Proportion (%) refers to the portion of the water body where internal loading is estimated to occur.
Table 3.
Surface areas of different water body types (inner, middle and outer) in the Archipelago Sea. Proportion (%) refers to the portion of the water body where internal loading is estimated to occur.Table 3. Summary of the regression equations used in the calculation of internal loading in different part (inner, middle and outer) of the Archipelago Sea during the period May 15–October 15 for the years 2000–2024. The abbreviations of observation stations (e.g. Turm275) refer to Figure XX, which shows their locations. Outer (out) represents the part of the outer archipelago where internal loading is not expected to occur.
| Layer (m) |
Inner |
Middle |
Outer (in) |
Outer (out) |
| |
Turm275 |
Seili |
Korp175+Dr53 |
Korp200 |
| 0–10 |
1.65 x + 21.3 (p<0.001;R2=0.11) |
1.44 x + 8.1 (p<0.001;R2=0.29) |
0.84 x +14 (p=0.02;R2=0.03) |
no significant |
| 0–20 |
no data |
2.38 x + 4.45 (p<0.001;R2=0.38) |
no significant |
|
| 20–50 |
|
5.54 x + 1.56 (p<0.001;R2=0.13) |
2.77 x + 6.8 (p<0.001;R2=0.20) |
|
| |
Turm297 |
|
Brändö |
|
| 0–10 |
1.15 x + 14.8 (p<0.001;R2=0.13) |
|
2.0 x + 2.8 (p<0.001;R2=0.45) |
|
| 0–20 |
5.4 x - 5.42 (p<0.001;R2=0.48) |
|
1.77 x + 6.3 (p<0.001;R2=0.25) |
|
| 20–50 |
|
|
1.48 x + 11.5 (p<0.01;R2=0.11) |
|
Table 4.
The calculated internal phosphorus load from May 15 to October 15 in different zones of the Archipelago Sea (inner, middle, and outer archipelago) and in different water layers, which cover 87% of the total volume. In the "outer" section, the numbers in parentheses refer to the codes of the water bodies. The area included in the calculation is shown in
Figure 1 with a green outline.
| Layers |
Inner |
Middle |
Outer (30-40) |
Outer (10-70) |
SUM |
| 0-10 m |
40.1 |
77.8 |
45.8 |
31.1 |
194.8 |
| 10-20 m |
99.1 |
82.4 |
ns. |
17.6 |
199.1 |
| 20-50 m |
|
252.0 |
126.3 |
19.4 |
397.7 |
| SUM |
139.2 |
412.2 |
172.1 |
68.1 |
791.6 |