
Submitted:
13 December 2024
Posted:
13 December 2024
You are already at the latest version
Abstract
This study investigates the application of convolutional neural networks (CNNs) for the classification and segmentation of parotid tumors. The classification process involves two stages: first, isolating the region of the parotid gland, and second, classifying it into one of three categories—mixed, malignant, or Warthin tumors. The Yolov7 method achieved an AP50 of 0.964 for the initial stage. Additionally, the data-efficient image transformers (DEIT) method was employed to classify parotid gland computerized tomographic images into mixed, Warthin, or malignant tumor categories. The classification accuracies were 0.923 for distinguishing between tumor presence and absence, 0.947 for differentiating malignant tumors from mixed and Warthin tumors, and 0.844 for distinguishing malignant from mixed tumors. To enhance diagnostic accuracy across all computerized tomographic slices for each patient or healthy participant, a decision tree mechanism based on the DEIT model was developed, aggregating classification results from individual slices. Furthermore, U-Net, U-Net++, TransUNet, and Swin-Unet models were independently applied to segment tumor images. Among 2,961 tumor images tested, TransUNet demonstrated superior performance, achieving an average Dice similarity coefficient of 0.921. Experimental results indicate that the combined classification and segmentation approach achieves an overall classification accuracy of 0.904 and a Dice similarity coefficient of 0.921.
Keywords:
YOLOv7
; Parotid tumors
; Tumor detection and classification
; Data-efficient image transformers
; TransUNet
; Swin Unet
1. Introduction
The parotid glands play a vital role in the human body by producing digestive enzymes. Among parotid gland disorders, tumors are the most prevalent, with parotid tumors being a common occurrence. Preoperative differentiation between benign and malignant parotid gland tumors is crucial for guiding treatment decisions, evaluating prognostic severity, and providing effective patient counseling [1,2]. Evidence indicates that 80% of parotid gland tumors are benign, while 20% are malignant. Traditional imaging techniques, such as computed tomography (CT), play a crucial role in classifying and segmenting parotid gland neoplasms for accurate diagnosis and treatment planning. However, these methods rely heavily on manual interpretation, which is time-intensive and susceptible to human error. The parotid gland, characterized by its rich fatty tissue, is distinctly contrasted with surrounding tissues and divided into superficial and deep lobes by the facial nerve. Its complex microstructure contributes to the wide variety of tumor types associated with parotid gland disorders. Benign tumors primarily include polymorphic adenomas (mixed tumors) and Warthin’s tumors, alongside less common types such as oncocytoma, basal cell carcinoma, and myoepithelioma. Malignant tumors, categorized into 22 types according to the World Health Organization (WHO), are most frequently mucoepidermoid carcinomas, followed by adenoid cystic carcinoma and acinic cell carcinoma [3].
Deep learning applications for determining the benign or malignant nature of tumors have been widely explored across various clinical specialties. Zhang et al. [4] utilized a modified convolutional neural network (CNN) to classify parotid gland tumors as benign or malignant, achieving an impressive accuracy of 97.78%. Similarly, Yuan et al. [5] applied the ResNet50 model to distinguish between pleomorphic and malignant tumors, attaining an accuracy of 90%. Hu et al. [6] employed ResNet50, VGG16, and DenseNet169 to classify tumors as benign or malignant independently. Among these, ResNet50 demonstrated superior performance, achieving an accuracy of 90.8%, sensitivity of 91.3%, specificity of 90.4%, and an AUC of 0.96. Onder et al. [7] used U-Net for parotid gland segmentation, achieving an AUC of 0.96. Xu et al. [8] applied Swin-Unet to segment the parotid gland in MRI images, achieving a Dice similarity coefficient of 0.8863. Similarly, Kawahara et al. [9] utilized Stepwise-Net to segment the brainstem, optic nerve, bilateral parotid glands, and bilateral submandibular glands. Their method outperformed U-Net, delivering superior results with a high Dice similarity coefficient.
Predicting the benign or malignant nature of parotid gland tumors before surgery is essential for effective surgical planning and reducing the risk of facial nerve damage. This study focuses on leveraging deep learning algorithms to segment and classify parotid glands and tumors in head and neck CT images. It introduces convolutional neural networks and transformer models, whose efficacy is validated through extensive experiments. By developing a predictive model tailored for Taiwanese patients and integrating it with the Picture Archiving and Communication System (PACS) commonly used in clinical practice, this approach aims to enhance the precision of CT image analysis. This approach provides clinicians with real-time surgical recommendations, improving decision-making processes and patient outcomes. Figure 1 illustrates the data preprocessing steps critical to the analytical pipeline. The dataset, consisting of images of the parotid gland region isolated using YOLOv7 [10], is first standardized to uniform image sizes. Subsequently, the collected CT images are divided and labeled into four classes: normal, malignant, Warthin tumors, and pleomorphic adenomas (mixed tumors). YOLOv7 is employed to extract the parotid gland regions as the optimal choice for this task. The DEIT algorithm is then utilized to classify disease status using a decision tree model (Figure 5). Finally, the TransUNet model is applied for the segmentation of parotid gland tumors.
2. Materials and Methods
2.1. Materials
In this study, head and neck CT images were sourced from the ENT CLINIC of National Cheng Kung University Hospital. All scans were performed using the SOMATOM Definition AS (Siemens, Germany) with the following parameters: tube current set to CARE Dose 4D quality reference at 180 mAs, tube voltage at 120 kVp, slice thickness and interval of 5 mm, and a display field of view of 22 cm. The scanning range extended from the skull’s base to the thoracic cavity’s entrance. Enhanced images were acquired following the intravenous injection of 60–100 mL of contrast agent (350 mg/mL; Xenetix®, Guerbet, Villepinte, Paris, France) at a rate of 2.0 mL/s, followed by 20 mL of normal saline. The captured images had a 512 × 512 resolution pixels with a pixel width of 0.41 mm. The experimental dataset comprised 4,183 CT images, of which 3,436 were labeled, while 747 remained unlabeled due to the absence of identifiable parotid glands. The dataset included 232 patients, consisting of 64 diagnosed with malignant tumors and 168 with benign tumors. The gender distribution was predominantly male, with a male-to-female ratio of 6:4; the average patient age was 66 years. An original CT image is presented in Figure 2a.
For this study, the LabelMe software [11] was used to assist physicians in annotating the locations of parotid glands and tumors, resulting in bounding boxes for each identified structure. The annotations were categorized into eight distinct classes: left parotid gland, right parotid gland, left malignant tumor, right malignant tumor, left mixed tumor (pleomorphic adenoma), right mixed tumor (pleomorphic adenoma), left Warthin tumor, and right Warthin tumor, as illustrated in Figure 2b. The diagnostic process for classifying tumor types considered factors such as lesion distribution, shape, density, and margins. Clinical observations have noted that pleomorphic adenomas (mixed tumors) carry a potential risk for malignant transformation, whereas Warthin tumors are associated with an extremely low likelihood of malignancy.
The annotations were saved as distinct bounding boxes in JSON format. Since the YOLO (You Only Look Once) framework requires input in a rectangular bounding box format, it was necessary to convert these JSON-formatted annotations into the TXT format compatible with YOLO. This conversion process involved identifying the smallest enclosing rectangles for each annotation in the JSON files and using these rectangular annotations for YOLO model training. Figure 3 illustrates the bounding boxes after conversion, demonstrating their compatibility with the YOLO format.
2.2. Methods
2.2.1. Experimental Data Preparation
All experimental CT image data were categorized based on tumor types identified in pathology reports. Each patient contributed an average of 20 parotid gland area images, with those having larger tumors contributing more images. On average, each patient had approximately six CT slices showing the tumor. The dataset comprised 4,349 images of parotid gland areas, including 1,455 images with tumors and 2,894 without tumors. Among the tumor images, 435 depicted malignant tumors, while 930 represented benign tumors. The benign tumors were further categorized into 420 pleomorphic adenomas (mixed tumors), 510 Warthin tumors, and 90 other tumor types. Due to the imbalance in the dataset—benign tumor images significantly outnumbering malignant tumor images, and images of glands without tumors being much more prevalent than those with tumors—data balancing was performed to ensure fair training. The balanced dataset included 1,506 images of glands without tumors and 1,455 images of glands with tumors, distributed as 930 benign and 435 malignant tumors. Of the benign tumor images, 420 were pleomorphic adenomas, and 510 were Warthin tumors, with the remaining 90 representing other tumor types.
To avoid mixing slices from the same patient in the training dataset, the data was split on a per-patient basis for four-fold cross-validation. Each fold used data from 191 patients for training and 25 for testing. Figure 4 illustrates the four distinct disease classes.
The implementation environment consisted of Ubuntu 20.4, an Intel(R) Core(TM) i7-10700k CPU @ 3.80GHz, an NVIDIA RTX 3090 GPU, and PyTorch 1.9.0. The preprocessing for scaphoid bone detection involved resizing images to a standardized resolution and applying the Contrast Limited Adaptive Histogram Equalization (CLAHE) [12] method to enhance contrast, improving image details and textures. The training process included iterations, with a batch size, an initial learning rate, and stochastic gradient descent (SGD) as the optimizer. Weight decay and momentum were set to and, respectively. During training, random horizontal flipping and contrast adjustment were incorporated as data augmentation techniques.
2.2.2. Detection of Parotid Glands
In the first phase of this study, six methods were evaluated for detecting the region of interest in parotid glands: CenterNet [13], EfficientDet [14], Faster-RCNN [15], YOLOv4 [16], YOLOv7, and SSD [17]. Except for SSD, which uses an input image size of 300×300, all other models utilized an input size of 512×512. CenterNet is a state-of-the-art object detection framework focusing on key point estimation and object detection in a single shot. By employing a center key point representation, it efficiently locates objects and their key points, offering high accuracy and precision. CenterNet has demonstrated remarkable performance on various object detection benchmarks, making it a widely used choice for applications requiring precise object localization and key point estimation. EfficientDet is a state-of-the-art object detection model is designed for efficiency and performance. It leverages a compound scaling method that balances resolution and network depth, enabling better resource utilization. EfficientDet achieves impressive results by combining efficient architectural design with advanced deep learning techniques, making it suitable for scalability and performance optimization tasks.
Faster R-CNN is a widely used object detection algorithm in deep learning. It is an enhanced version of the original R-CNN model. It incorporates Region Proposal Networks (RPN) to generate region proposals directly within the network, significantly improving processing speed and accuracy compared to its predecessors. This design enables Faster R-CNN to efficiently and effectively detect objects in images, making it a robust choice for various object detection tasks.
YOLO is a widely used real-time object detection algorithm that processes images in a single pass to detect objects. Unlike traditional methods that divide images into grids and classify each grid separately, YOLO predicts bounding boxes and probabilities for each grid cell simultaneously. This approach makes YOLO extremely fast and efficient, making it ideal for applications requiring real-time detection. YOLOv4 and YOLOv7 are advanced versions of YOLO, offering further enhancements in accuracy and speed. The Single Shot Multi Box Detector (SSD) is another popular object detection framework in deep learning, designed to detect multiple objects in an image using a single deep neural network. SSD achieves high speed and accuracy by incorporating convolutional layers at multiple scales to predict object classes and bounding boxes. Its efficiency makes it well-suited for real-time applications requiring precise detection of objects of varying sizes.
2.2.3. Classification Methods and Training Procedure
The image regions of the parotid gland vary in size, typically ranging from 30×30 to 100×100 pixels. Smaller image sizes can result in poor feature extraction during CNN training, and inconsistent sizes may cause program errors. To address these challenges, bilinear interpolation is employed to resize all region images to a consistent size of 128×128 pixels. Additionally, image augmentation techniques, including horizontal flipping, vertical flipping, and contrast adjustment, are applied to expand the training dataset and improve model robustness.
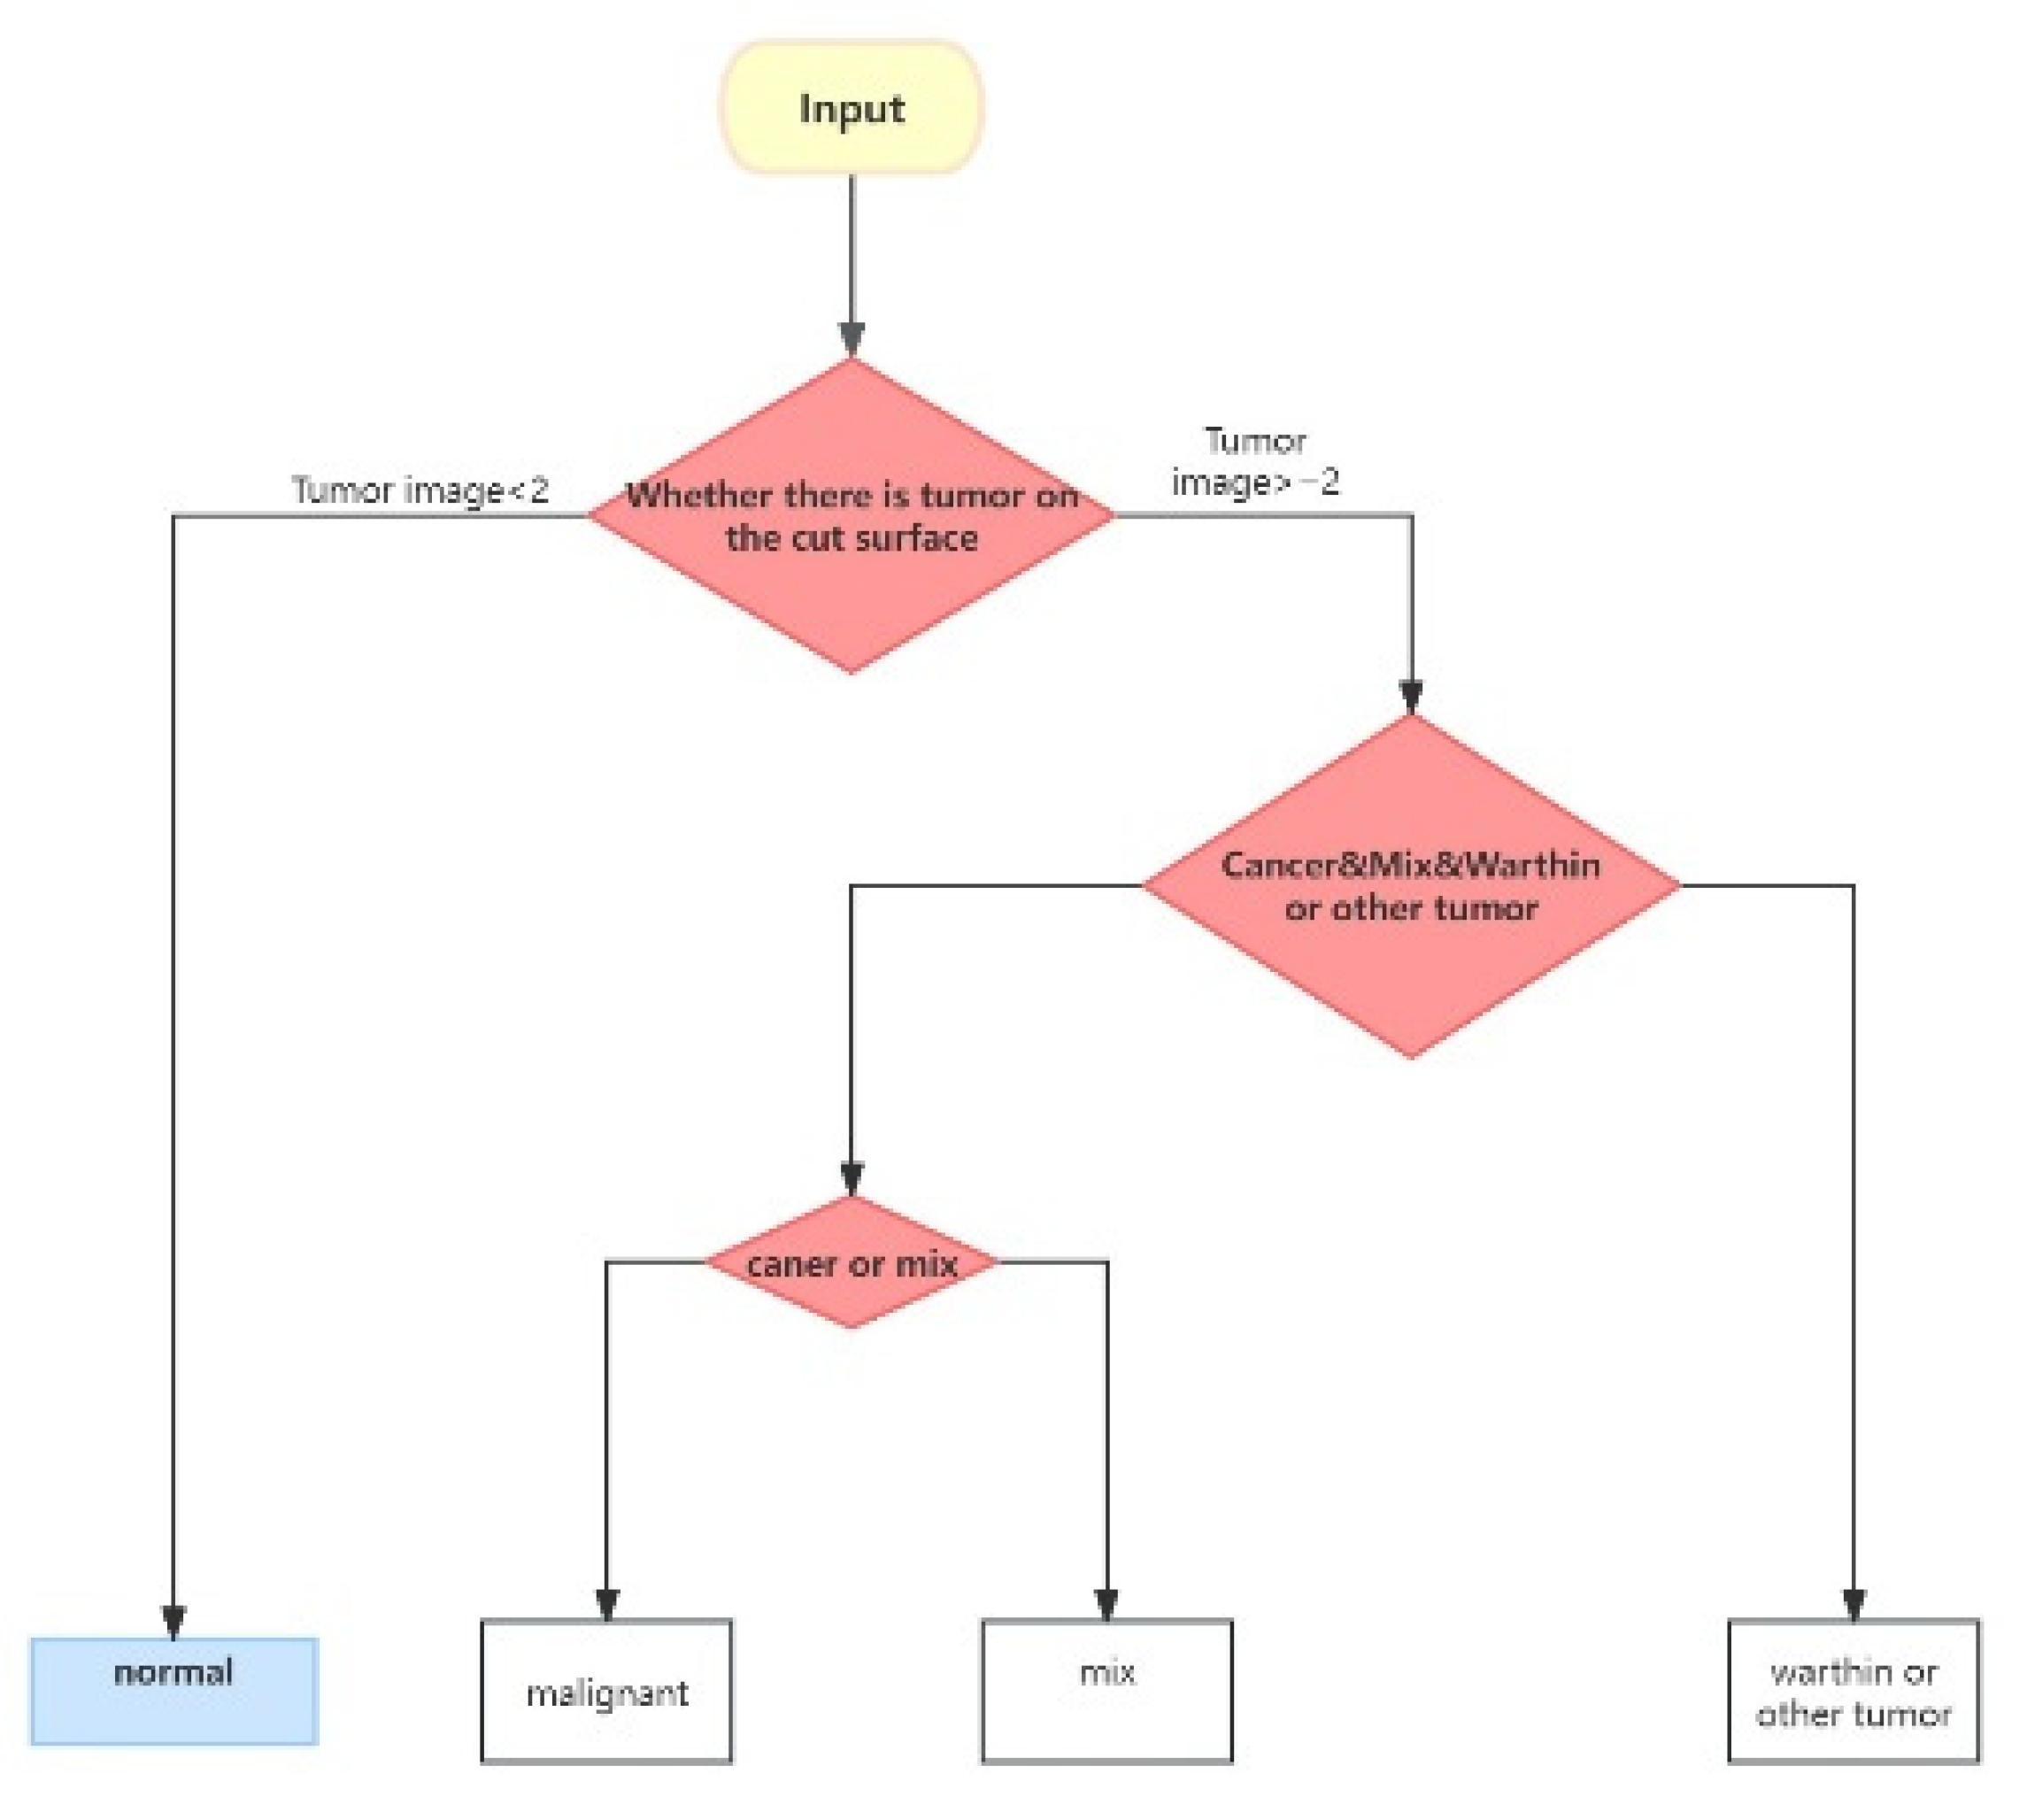
Clinically, surgical intervention is often required for both malignant and mixed tumors. In contrast, Warthin tumors, which have an extremely low probability of malignant transformation, typically do not necessitate surgical removal. As a result, binary classification proves effective in distinguishing cases that require surgical intervention from those that do not. In clinical practice, diagnoses are based on a comprehensive review of all CT slices for a patient rather than a single slice. This approach minimizes the risk of misdiagnosis, which may occur if a single slice is relied upon. Misdiagnoses can arise when certain slices fail to capture the tumor or when slices of a malignant tumor exhibit benign tissue that has not undergone malignant transformation. These challenges highlight the complexities and potential for error when analyzing individual slices, emphasizing the importance of patient-level evaluation for accurate diagnosis.
The classification process is divided into three distinct steps. First, the model evaluates each CT slice to determine the presence of a tumor. Following clinical diagnostic practices, a patient is classified as having a tumor if two or more slices indicate its presence; otherwise, the patient is considered tumor-free. In the second step, the model categorizes the detected tumor as Malignant, Mixed, or Warthin. Finally, the third step distinguishes between Malignant and Mixed tumors. Figure 5 provides a visual representation of this classification process.
The classification methods employ several CNN and transformer models, including ResNet-50, ResNet enhanced with CBAM [18] or BIFPN [19], Vision Transformer (ViT) [20], Swin Transformer (Swin-T) [21], Convolutional vision Transformer (CvT) [22], and Data-Efficient Image Transformers (DEIT) [23]. Hu et al. [6] demonstrated that ResNet-50 [24] is an effective method for distinguishing between benign and malignant tumors. ResNet-50 is a convolutional neural network with a deep architecture consisting of fifty layers. It is widely used for image classification tasks due to its robust design and the incorporation of skip connections, which mitigate the challenges of training deep neural networks by preventing gradient vanishing and enhancing learning efficiency. To enhance the capability of feature maps generated by ResNet-50, CBAM, and BIFPN are applied as extensions. Additionally, transformer-based methods have gained significant traction in image classification tasks. The ViT employs a Transformer architecture originally designed for natural language processing, adapting it for visual tasks. The CvT is a hybrid model that integrates features of CNNs and ViTs, leveraging the strengths of both architectures. CvT aims to improve performance in vision tasks, such as image classification, by embedding convolutional operations into the transformer architecture. The Shifted Window Transformer (Swin Transformer) is another transformer model designed to address standard transformers’ limitations in effectively processing image data. Meanwhile, Data-Efficient Image Transformers (DEIT) overcome the traditional challenges of Vision Transformers, particularly their reliance on large datasets to achieve competitive performance compared to CNNs. These methods are employed to classify various disease states and are combined to perform disease classifications, as illustrated in Figure 5.
Figure 5.
Flowchart of disease classification for all sliced images of a patient [31].
Figure 5.
Flowchart of disease classification for all sliced images of a patient [31].
2.2.4. Lesion Segmentation
Pleomorphic adenomas (mixed tumors), Warthin tumors, and malignant tumors exhibit distinct contour characteristics due to their differing disease profiles. Malignant tumors often present with blurred and irregular contours, while benign Warthin tumors generally have clearer and more defined outlines. To address these segmentation challenges, we trained several networks, including UNet [25], UNet++ [26], Swin-UNet [27], and TransUNet [28]. Swin-UNet combines the Swin Transformer’s and UNet architecture’s strengths, making it well-suited for semantic segmentation tasks in computer vision.
TransUNet is a hybrid architecture combining the transformer and UNet models, specifically designed for medical image segmentation tasks. It begins with a transformer encoder, which processes input image patches to capture global contextual information and long-range dependencies within the image. Following this, TransUNet integrates the Unet architecture, which consists of a contracting path (encoder) to extract features and an expanding path (decoder) for precise localization. Similar to the traditional Unet, TransUNet employs skip connections to link the encoder and decoder at various levels, preserving spatial information and enhancing segmentation performance.
By leveraging the transformer encoder’s ability to capture global features and Unet’s precision in localization, TransUNet achieves superior performance in medical image segmentation. The model is trained using supervised learning techniques, and in some cases, self-supervised pre-training is used to optimize segmentation performance. This study used 2,961 images of parotid gland areas, including three different types of tumors, were used as the dataset for four-fold cross-validation experiments on the segmentation network.
3. Experimantal Results and Discussion
3.1. Detection Results of Parotid Glands
In the first phase of this study, six methods were evaluated for detecting the position of the parotid glands: YOLOv4, YOLOv7, CenterNet, EfficientDet, Faster R-CNN, and SSD. Among these, SSD utilized an input image size of 300×300, while the remaining models used 512×512 input images. All models were trained using the Adam optimizer with a batch size of 2 over 300 iterations. The dataset consisted of 2,961 CT images, and four-fold cross-validation was employed to ensure robust evaluation. Experimental results demonstrated that YOLOv7 achieved the highest accuracy among the models, as detailed in Table 1.
Given its superior mean Average Precision (mAP) compared to the other evaluated models, YOLOv7 was selected as the primary model for this study. The bounding box outputs generated by YOLOv7 were used to isolate and crop the specified regions, which served as training data for the subsequent second and third phases of the research. Figure 6a shows an output image from YOLOv7, demonstrating its precision in identifying the target area, while Figure 6b depicts the cropped image focused on the parotid gland region.
3.2. Results of Disease Classification
Two clinical physicians were asked to classify the disease status based on visual observations. Their classifications achieved average accuracies of only 52.0% and 44.3%, highlighting the need for improved classification methods. This study explores the enhancement of classification capabilities through deep learning. Seven models were employed: ResNet, ResNet+BiFPN, ResNet+CBAM, ViT, Swin Transformer, CvT, and DEIT. ResNet+BiFPN and ResNet+CBAM utilized ResNet-50 as the backbone network to generate feature maps, which were further refined using BiFPN or CBAM to enhance classification performance. Table 2 presents binary classification results for tumor presence (with/without tumors). Among the models, DEIT achieved the highest accuracy rate of 92.3% in tumor classification.
Table 3 presents the classification results for malignant/mixed tumors and Warthin tumors, with the DEIT method achieving a correct classification rate of 94.7%. Additionally, Table 4 shows the classification results for malignant and mixed tumors, where DEIT outperformed the other methods but achieved an accuracy of only 84.4%. Across the three tables, it is evident that DEIT is the most effective method for classifying the three disease states. Using DEIT, the overall classification accuracy based on the flowchart of disease classifications in Figure 5 reached 90.4%.
3.3. Results of Lesion Segmentation
The segmentation of disease lesions in the parotid gland is a critical step in localizing tumors within head and neck computerized tomographic images. Four methods—UNet, UNet++, TransUNet, and Swin-Unet—were evaluated, and their results are summarized in Table 5. Among these, UNet++ demonstrated superior performance, achieving Dice similarity coefficients of 0.89 for malignant tumors, 0.93 for mixed tumors, and 0.94 for Warthin tumors. UNet and UNet++, both traditional convolutional neural networks, achieved average Dice similarity coefficients of 0.850 and 0.863, respectively. Swin-Unet, which replaces convolutional blocks in the UNet structure with transformer blocks, achieved an average Dice similarity coefficient of 0.86. However, TransUNet, which retains most of the convolutional blocks of UNet while replacing only one with transformer blocks, outperformed Swin-Unet, achieving an average Dice similarity coefficient of 0.92.
4. Conclusion
This paper presents a comprehensive study on using CNNs for segmenting parotid gland tumors and classifying their disease states. Six CNN models—YOLOv4, YOLOv7, CenterNet, EfficientDet, Faster R-CNN, and SSD—were employed to detect the parotid gland regions to achieve precise localization of parotid gland tumors. Experimental results revealed that YOLOv7 achieved the highest performance, with a precision of 0.98 under AP50. The detected regions were subsequently used for disease state classification and tumor segmentation. For disease classification, ResNet-50, ResNet+CBAM, and ResNet+BiFPN were applied. Experimental findings demonstrated that the BiFPN method significantly enhanced classification capabilities, achieving 85.267% accuracy for malignant/mixed and Warthin tumor classification and 82.163% for malignant versus mixed tumor classification. TransUNet was identified as the most effective method for tumor segmentation, achieving a Dice similarity coefficient of 0.92 for segmenting different tumor lesions. These results highlight the potential of CNNs and transformer-based architectures in improving the precision and accuracy of parotid gland tumor detection, classification, and segmentation.
Two noteworthy findings emerged from this study. Firstly, using ResNet-50 with BiFPN achieved an average accuracy of 83.725% for tumor classification. Secondly, TransUNet, which modifies a convolutional block into transformer blocks, achieved a Dice similarity coefficient of 0.92 for tumor segmentation. In future research, improving the classification and segmentation of parotid glands and their tumors remains an important focus. Recent advancements in three-dimensional image segmentation using transformer methods have shown significant progress. For instance, Shen et al. [29] and Wang et al. [30] proposed frameworks that integrate transformers into the bottleneck of a 3D decoder CNN, achieving effective semantic segmentation of brain tumors. Incorporating similar transformer-based approaches into future studies could potentially enhance the current results.
Author Contributions
Writing M.-H.H.; review and editing, M.-H.H. and H.-J.C.; validation, C.-C.C. and S. J. and H.-J.C.; supervision, M.–H.H.; project administration and funding acquisition; C.-C.C, All authors have read and agreed to the published version of the manuscript.
Funding
This research was supported by the Ministry of Science and Technology, ROC (Project Numbers: NSC-111-2221-E-006-233-MY3 and NSC-113-2218-E-006-022) and National Cheng Kung University Hospital (Project Number: NCKUH-11302058)
Institutional Review Board Statement
This research clinically was reviewed and approved under Institutional Review Board No. B-ER-110-528 of National Cheng Kung University Hospital.
Informed Consent Statement
Informed consent was waived by the Institutional Review Board of
National Cheng Kung University Hospital. This research was conducted using unlinked and unidentifiable data, files, documents, and information. Additionally, this study does not involve any ethnic or group-specific interests.
Data Availability Statement
The original contributions presented in this study are included within the article. For further inquiries, please contact the corresponding author.
Conflicts of Interest
The authors declare no conflict of interest.
References
- Lyer, J., Hariharan, A., Cao, U.M.H., Wang, C.T.T., , Khayambashi M. P., Nuguyen L., and Tran S. D. (2021). An overview on the histogenesis and morphogenesis of parotid gland neoplasms and evolving diagnostic approaches. Malignants, 13(15), 3910.
- ARAUJO, A.L.D., DASILVA V.M., ROLDÁN D.G., LOPES M.A., MORAES M.C., KOWALSKI L.P., SANTOS-SILVA A.G. (2024). Deep Learning for salivary gland tumor classification. Oral Surgery, Oral Medicine, Oral Pathology and Oral Radiology. 137(6), 297.
- Speight P.M., & A William Barrett. Salivary gland tumours: diagnostic challenges and an update on the latest WHO classification. Diagnostic Histopathology. 26(4), 147-158.
- Zhang H.B., Lai H.C.,. Wang Y, et al. (2021). Research on the Classification of Benign and Malignant Parotid Tumors Based on Transfer Learning and a Convolutional Neural Network. IEEE Access, 9, 40360-40371.
- Yuan J., Fan Y., Lv X. et al. (2020). Research on the practical classification and privacy protection of CT images of parotid tumors based on ResNet50 model. Journal of Physics: Conference Series, 1576, 012040.
- Hu Z., Wang B., Pan X., Cao D., Gao A., Yang X., Chen Y., Lin Z. (2022). Using deep learning to distinguish malugnant from begin parotid tumors on plain computered tomography images. Fronties in Oncology, August. [CrossRef]
- Onder M., Cengiz Evli, Ezgi Türk, Orhan Kazan, İbrahim Şevki Bayrakdar, Özer Çelik, Andre Luiz Ferreira Costa, João Pedro Perez Gomes, Celso Massahiro Ogawa, Rohan Jagtap and Kaan Orhan, (2023). Deep-learning-based automatic segmentation of parotid gland on computed tomography images. Diagnosis, 13, 581.
- Xu Z., Dai Y. Liu F., Li S., Liu S., Shi L., Fu J. (2022). Parotid gland MRI segmentation based on Swin-Unet and multimodal images. arXiv preprint, arXiv:2206.03336v2.
- Kawahara D., Tsuneda M., Ozawa S., Okamoto., Nakamura M., Nishio T., Saito A., Nagata Y. (2022) Stepwise deep neural network for head and neck suto-wegmentation on CT images. Computers in Biology and Medicine, 143, 105295.
- Wang C.Y., Bochkovskiy A., Liao H.-Y. M. (2022). YOLOv7: Trainable bag-of-freebies sets new state-of-the-art for real-time object detectors. arXiv preprint, arXiv:2207.02696v1.
- Russell, B. C., Torralba, A., Murphy, K. P., & Freeman, W. T. (2008). LabelMe: A database and web-based tool for image annotation. International Journal of Computer Vision, 77(1), 157-173.
- Zuiderveld, K. (1994). Contrast limited adaptive histogram equalization. In Graphics Gems IV (pp. 474–485). Academic Press Professional, Inc.
- Duan K., Bai S., Xie L., Qi H., Huang Q., Tian Q.. (2019). CenterNet: Keypoint Triplets for Object Detection. arXiv preprint, arXiv:1904.08189.
- Tan M., Pang K., Le Q.V. (2019). EfficientDet: Scalable and Efficient Object Detection. arXiv preprint, arXiv:1911.09070.
- Ren S., He K., Girshick R., Sun J. (2015). Faster R-CNN: Towards Real-time Object Detection with Region Proposal Networks. arXiv:1506.01497.
- Bochkovskiy A., Wang C.Y., Liao H. -Y. M. (2020). YOLOv4: Optimal Speed and Accuracy of Object Detection. arXiv preprint, arXiv:1506.01497.
- Liu W., Anguelov D., Erhan D., Szegedy C., Reed C., Fu C.Y., Berg A.C. (2016). SSD: Single Shot MultiBox Detector. arXiv preprint, arXiv:1512.02325v5.
- Woo S., Park J., Lee J.Y., Kweon, I. S. (2018). CBAM: Convolutional Block Attention Module. In Proceedings of the European Conference on Computer Vision (ECCV) (pp. 3–19).
- Tan M., Pang R., Le Q.V. (2020). EfficientDet: Scalable and efficient object detection. In Proceedings of the IEEE/CVF Conference on Computer Vision and Pattern Recognition (CVPR) (pp. 10781–10790).
- Dosovitskiy A., Beyer L., Kolesnikov A., et al. (2021). An image is worth 16x16 words: Transformers for image recognition at scale. In Proceedings of the International Conference on Learning Representations (ICLR).
- Liu Z., Lin Y., Cao Y., et al. (2021). Swin Transformer: Hierarchical vision transformer using shifted windows. In Proceedings of the IEEE/CVF International Conference on Computer Vision (ICCV), (pp.10012–10022).
- Wu B., Xu C., Dai X., et al. (2021). CvT: Introducing convolutions to vision transformers. In Proceedings of the IEEE/CVF International Conference on Computer Vision (ICCV), (pp. 22–31).
- Touvron H., Cord, M. Douze, M., et al. (2021). Training data-efficient image transformers & distillation through attention. In Proceedings of the International Conference on Machine Learning (ICML), (pp. 10347–10357).
- He K., Zhang X., Ren S., Sun J. (2020). Deep Residual Learning for Image Recognition. arXiv preprint, arXiv:1512.03385.
- Ronneberger O., Fischer P., Brox T. (2015). U-Net: Convolutional N eworks for Biomedical Image Segmentation. arXiv preprint, arXiv:1505.04597.
- Zhou Z., Siddiquee M.M.R., Tajbakhsh N., Liang J. (2018). UNet++: A Nested U-Net Architecture for Medical Image Segmentation, arXiv preprint, arXiv:1807.10165.
- Cao H., Wang Y., Chen J., Jiang D., Zhang X., Tian Q., Wang M. (2021). Swin-Unet: Unet-like Pure Transformer for Medical Image Segmentation. arXiv preprint, arXiv:2105.05537.
- Chen J., Lu Y., Yu Q., Luo X., Adeli E., Wang Y., Lu L., Yuille A.L., Zhou Y. (2021). TransUNet: Transformers Make Strong Encoders for Medical Image Segmentation, arXiv preprint, arXiv:2102.04306.
- Shen X.M., Mao Liang, Yang Z.Y. Chai Z.K., Sun T.G., Xu Y., Sun Z.J. (2022). Deep learning-assisted diagnosis of parotid gland tumors by using contrast-enhanced CT imaging. Oral Disease, 29, 3325-3336. [CrossRef]
- Wang W, Chen C., Ding M., Li J., Yu H., Transbts Z.S. (2021). Multimodal brain tumor segmentation using transformer. arXiv preprint, arXiv:2103.04430.
- Chang C.C., Horng M.H., Jiang J.Y. Deep learning-based computerized tomographic imaging for differentiation and segmentation of parotid gland neoplasm, (2024), ECEI. [CrossRef]
Figure 1.
Flowchart illustrating the complete image processing pipeline using the CNN model.
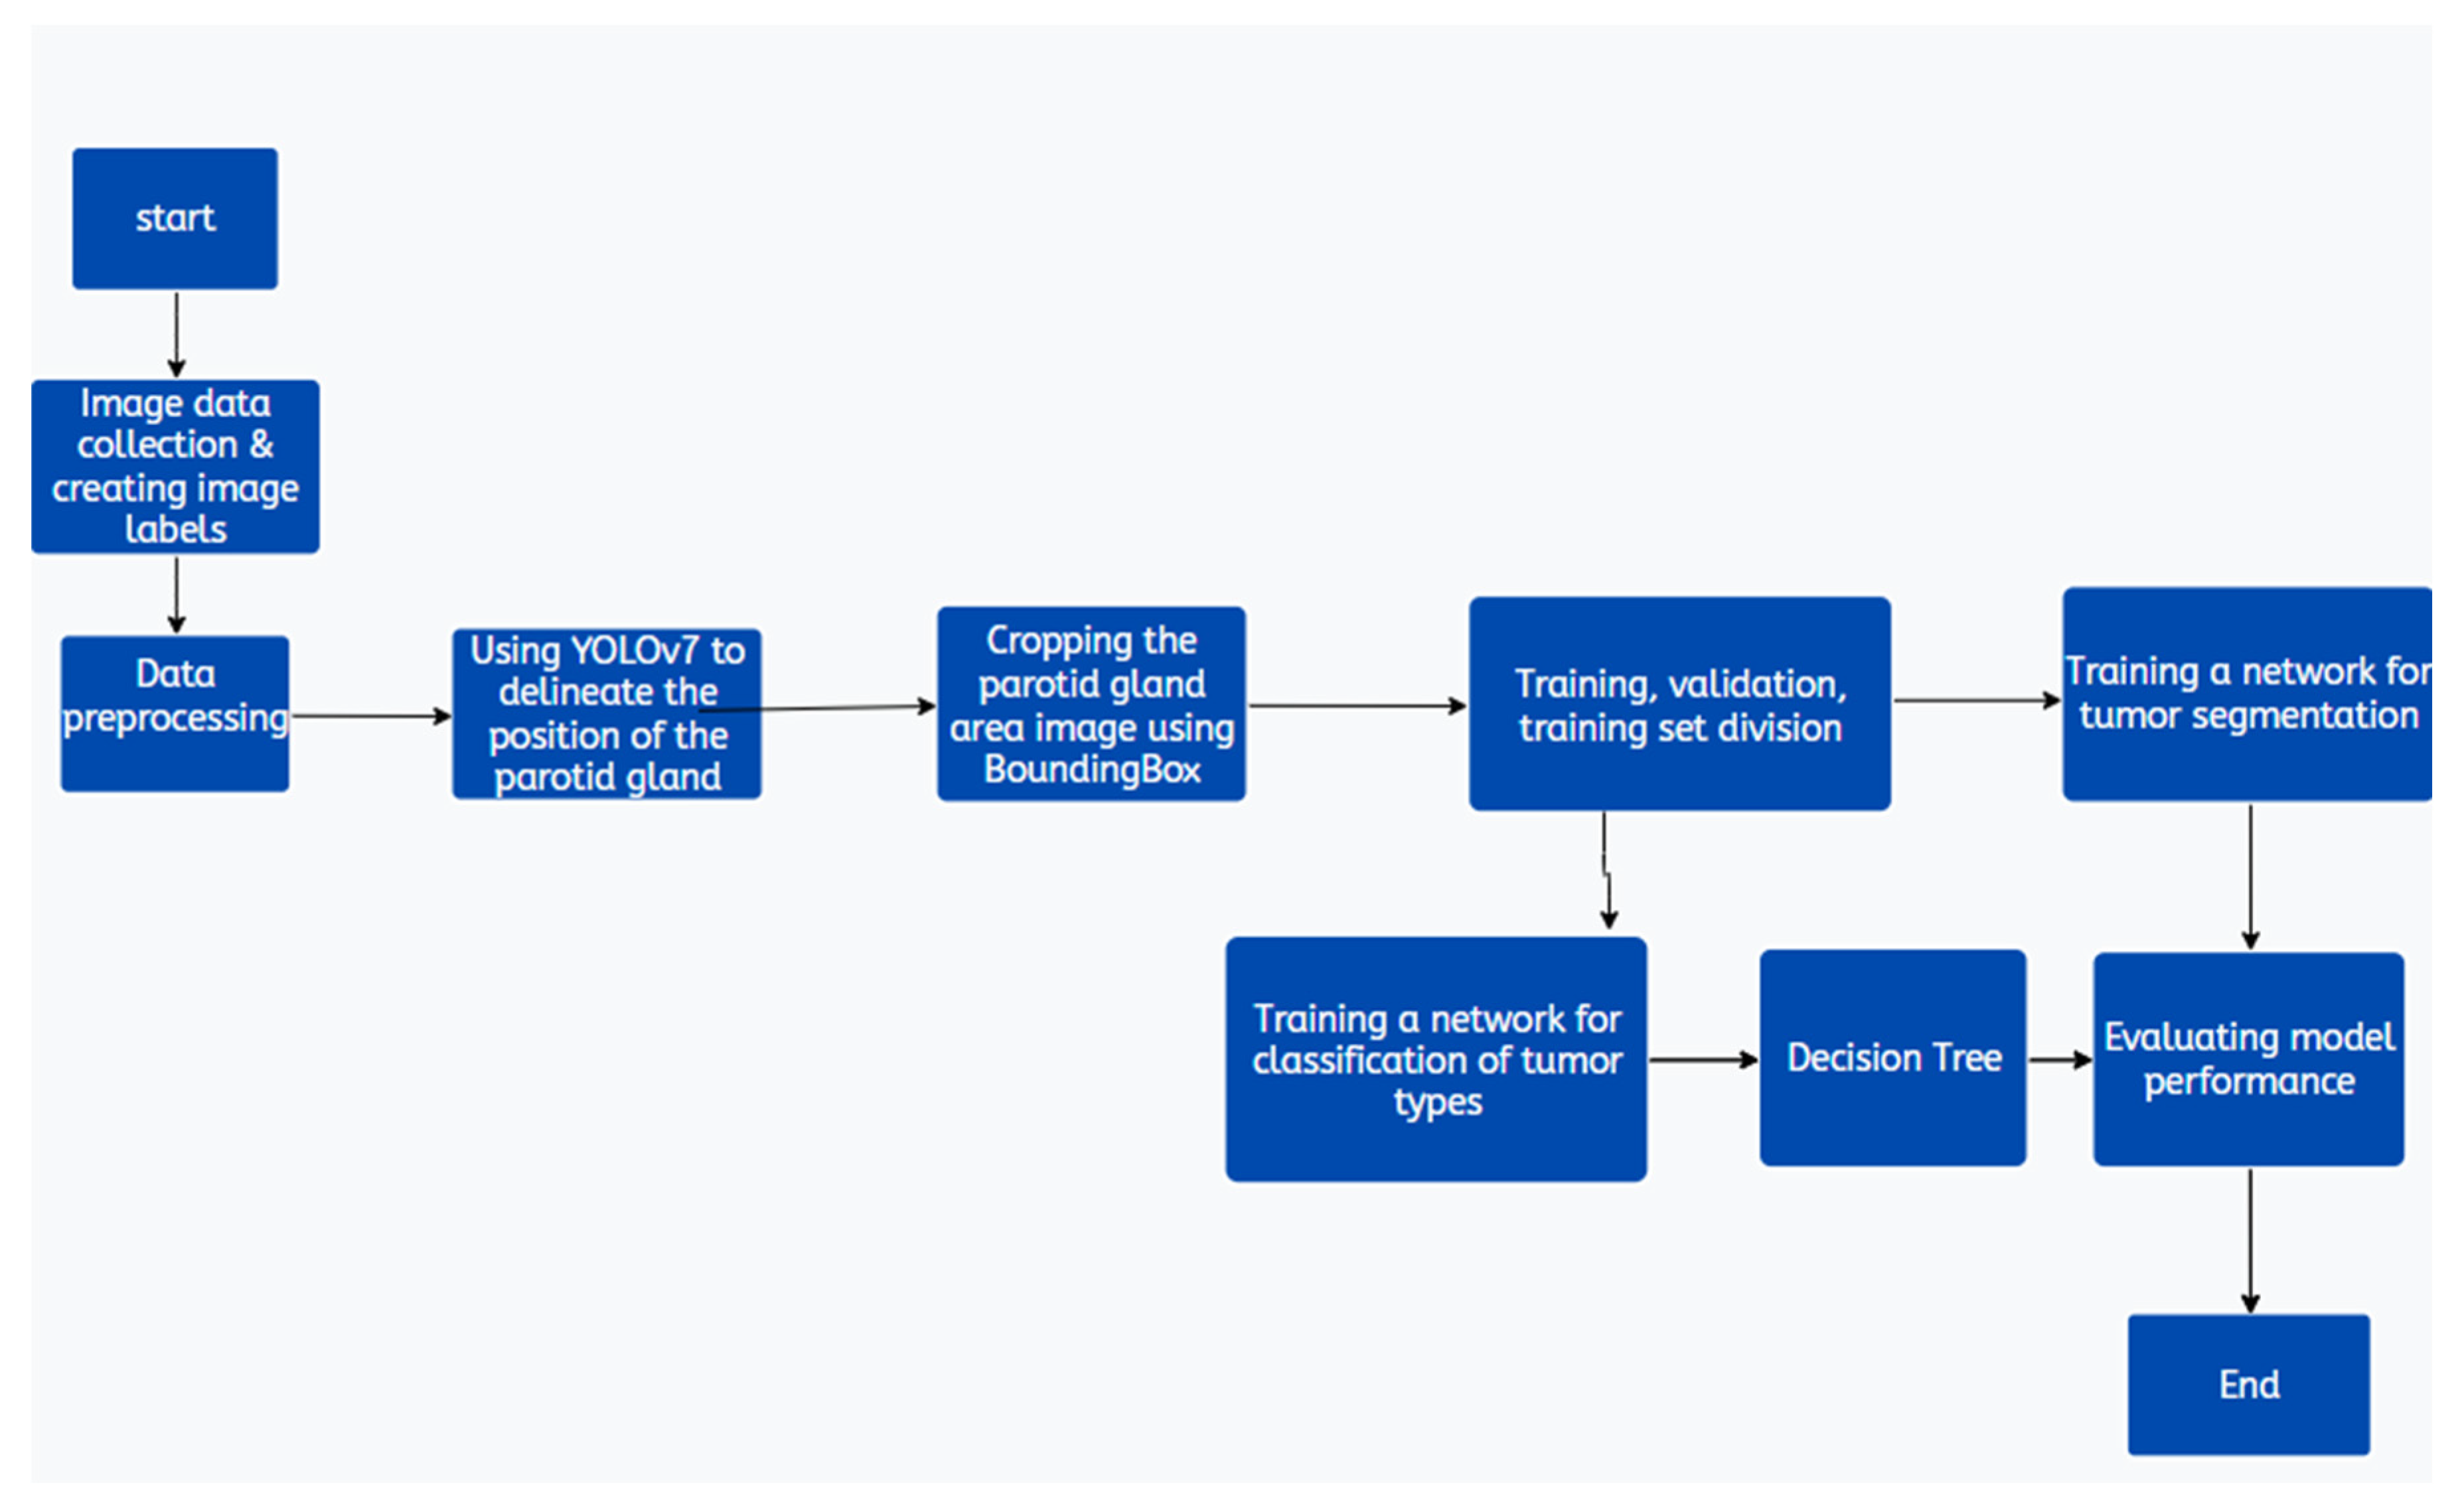
Figure 2.
(a). Original image. (b). Labeled CT image with annotated regions.
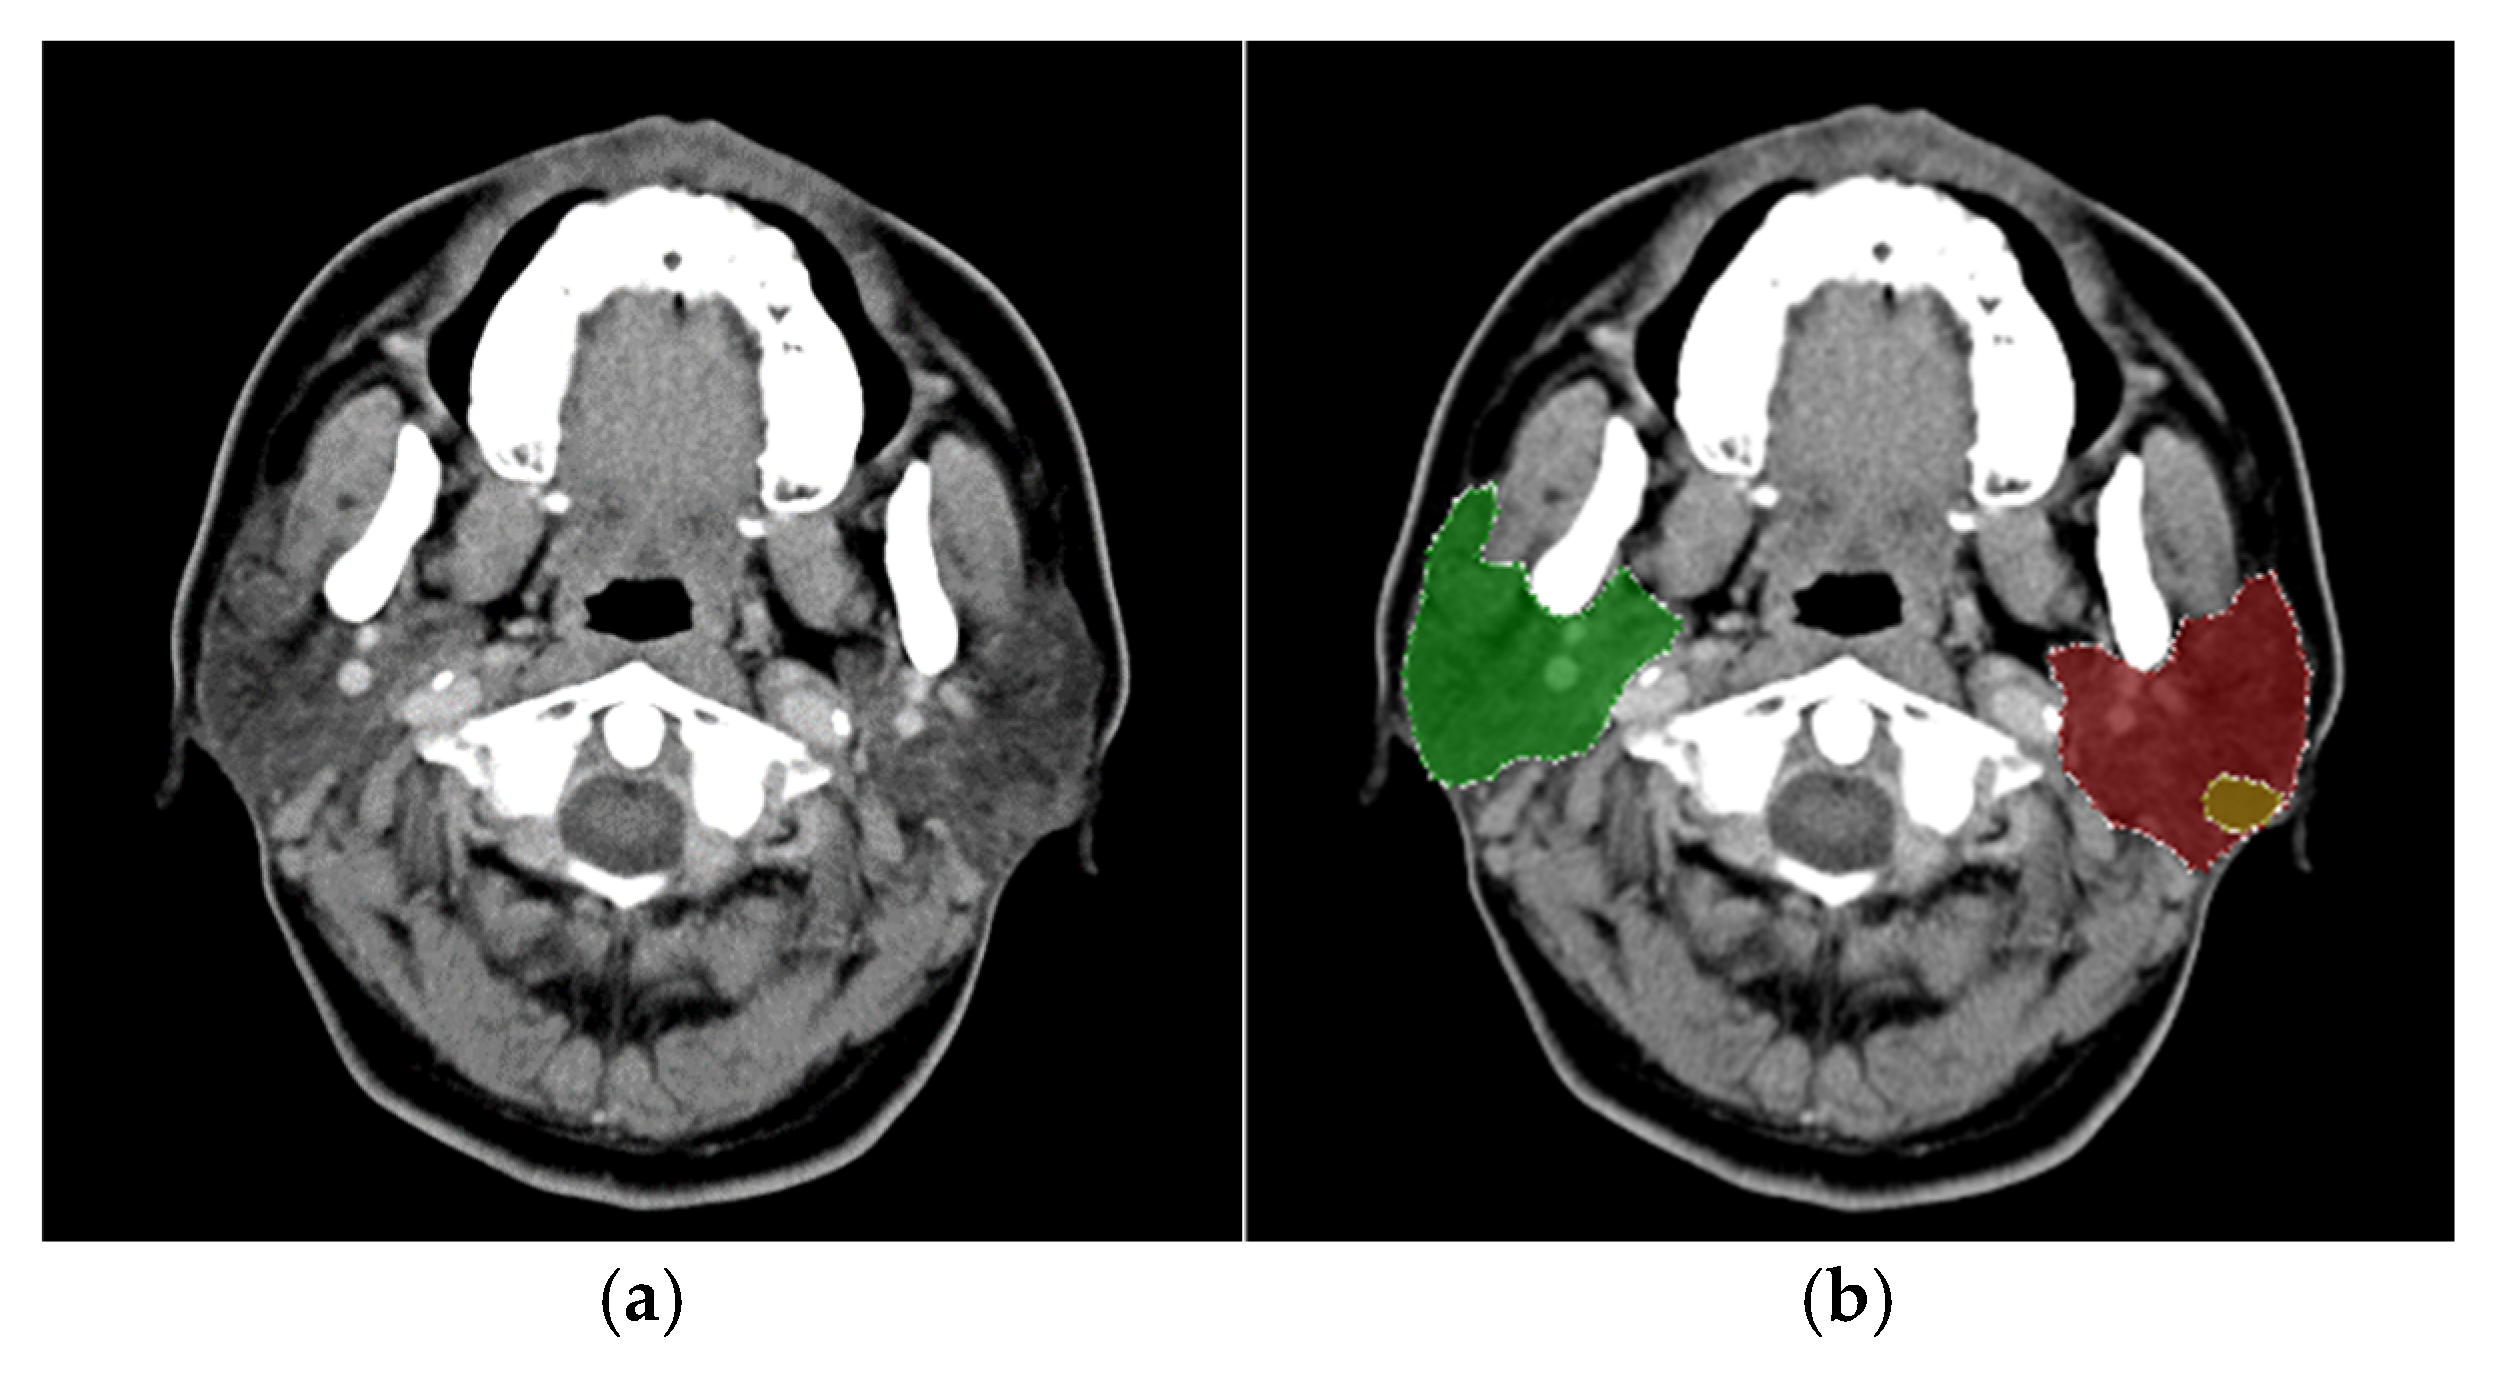
Figure 3.
Bounding box representation for the parotid gland region.
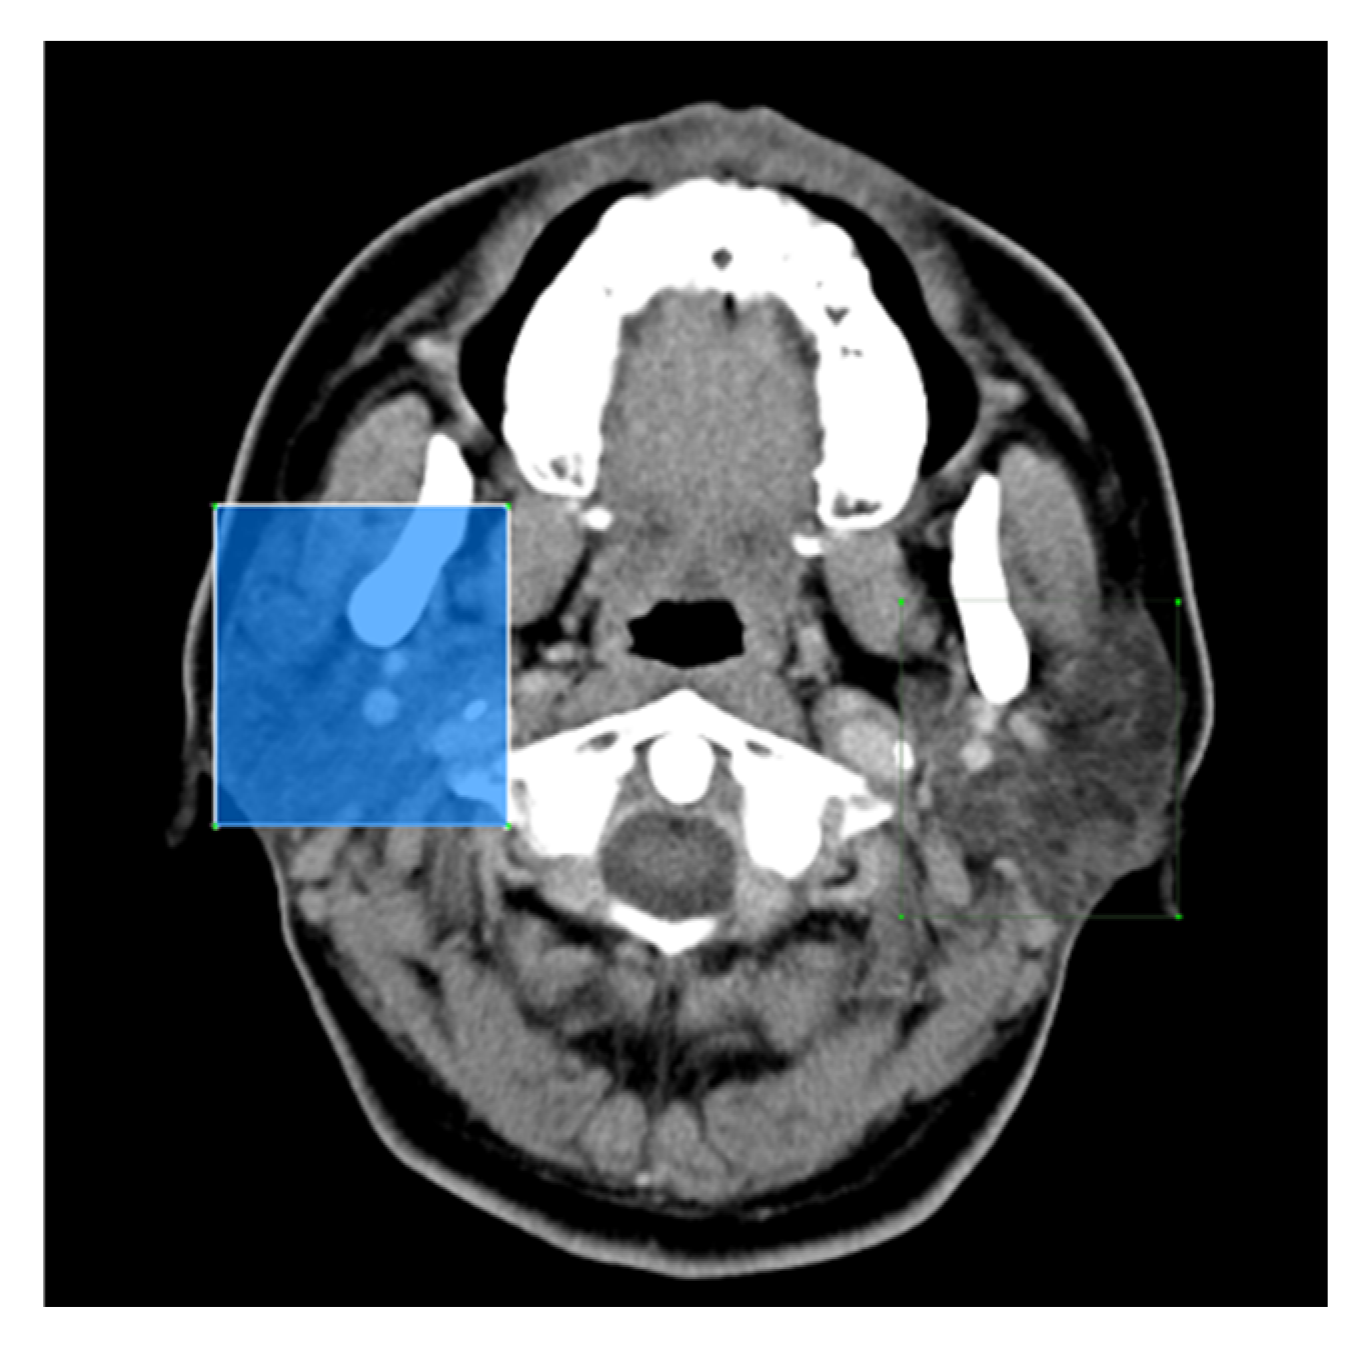
Figure 4.
Examples of different tumor image instances.
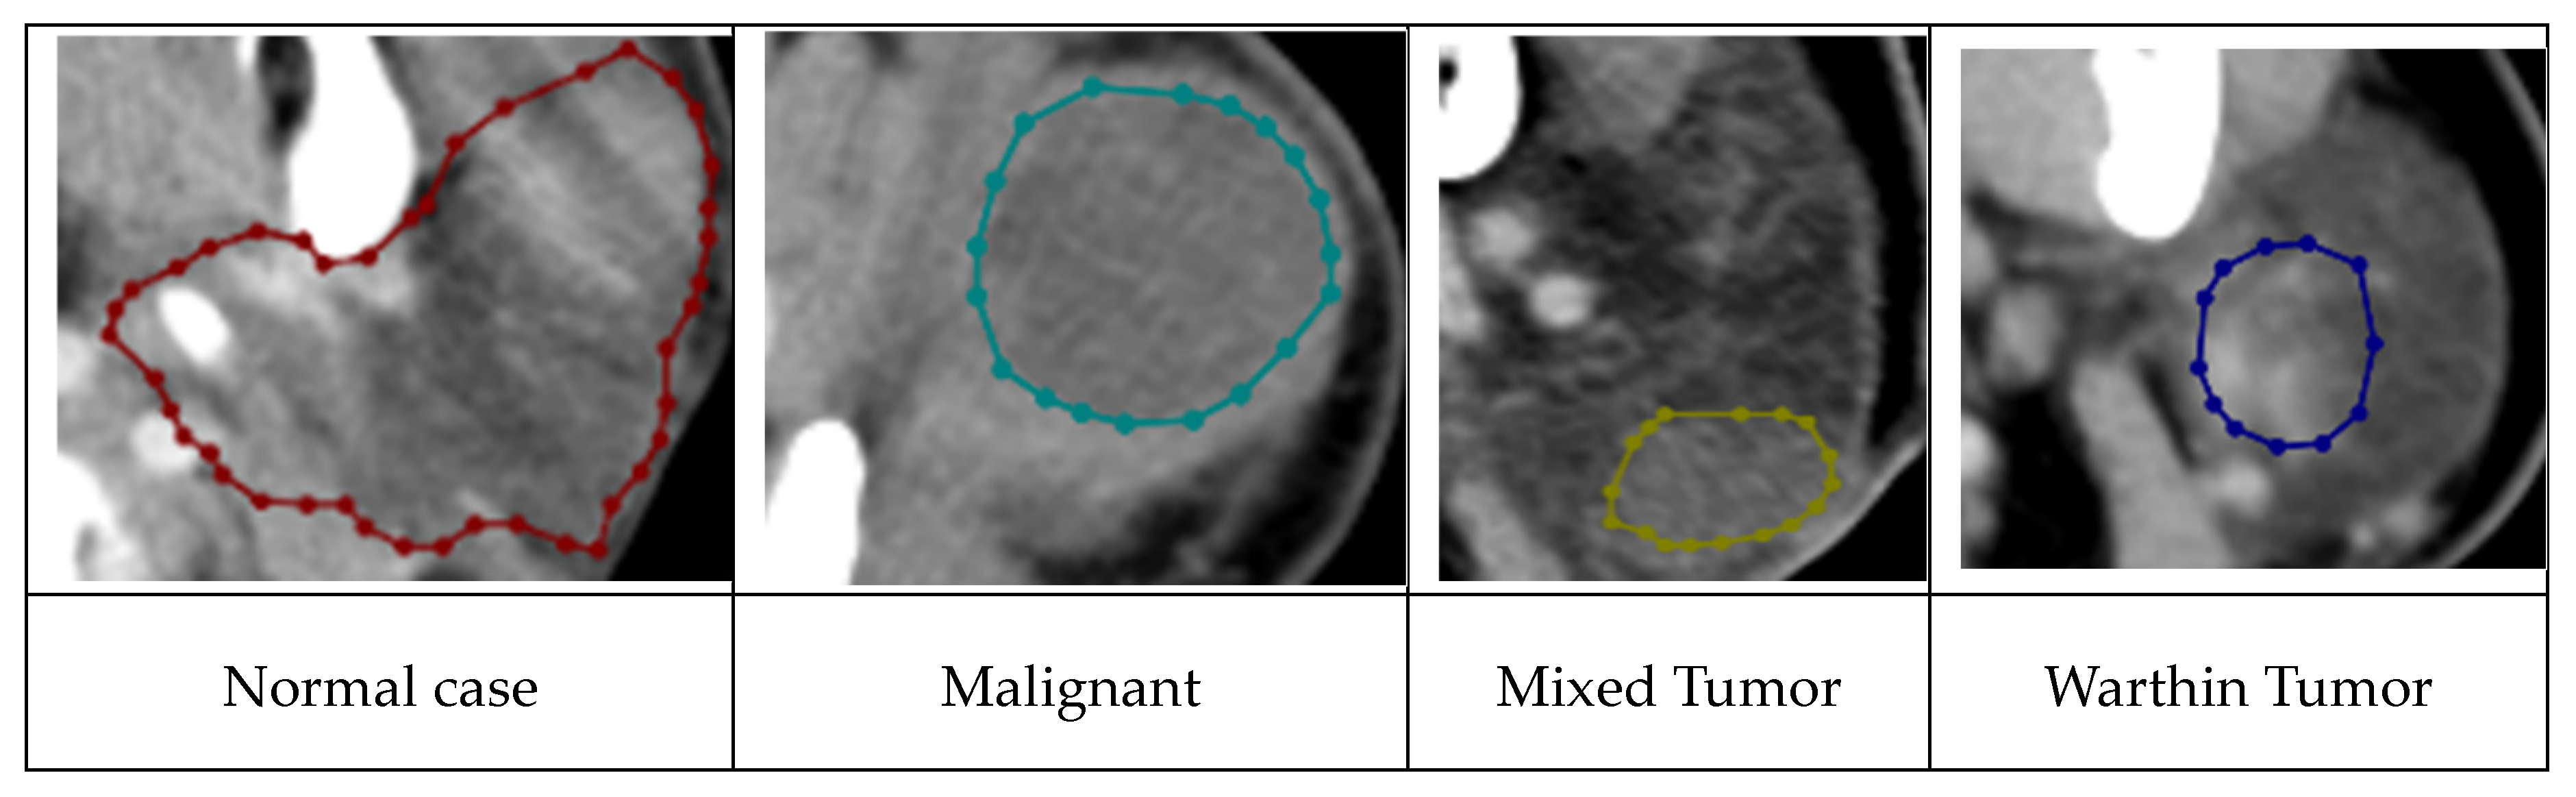
Figure 6.
(a). Output image from the YOLOv7 model. (b). Cropped image focusing on the parotid gland area.
Figure 6.
(a). Output image from the YOLOv7 model. (b). Cropped image focusing on the parotid gland area.
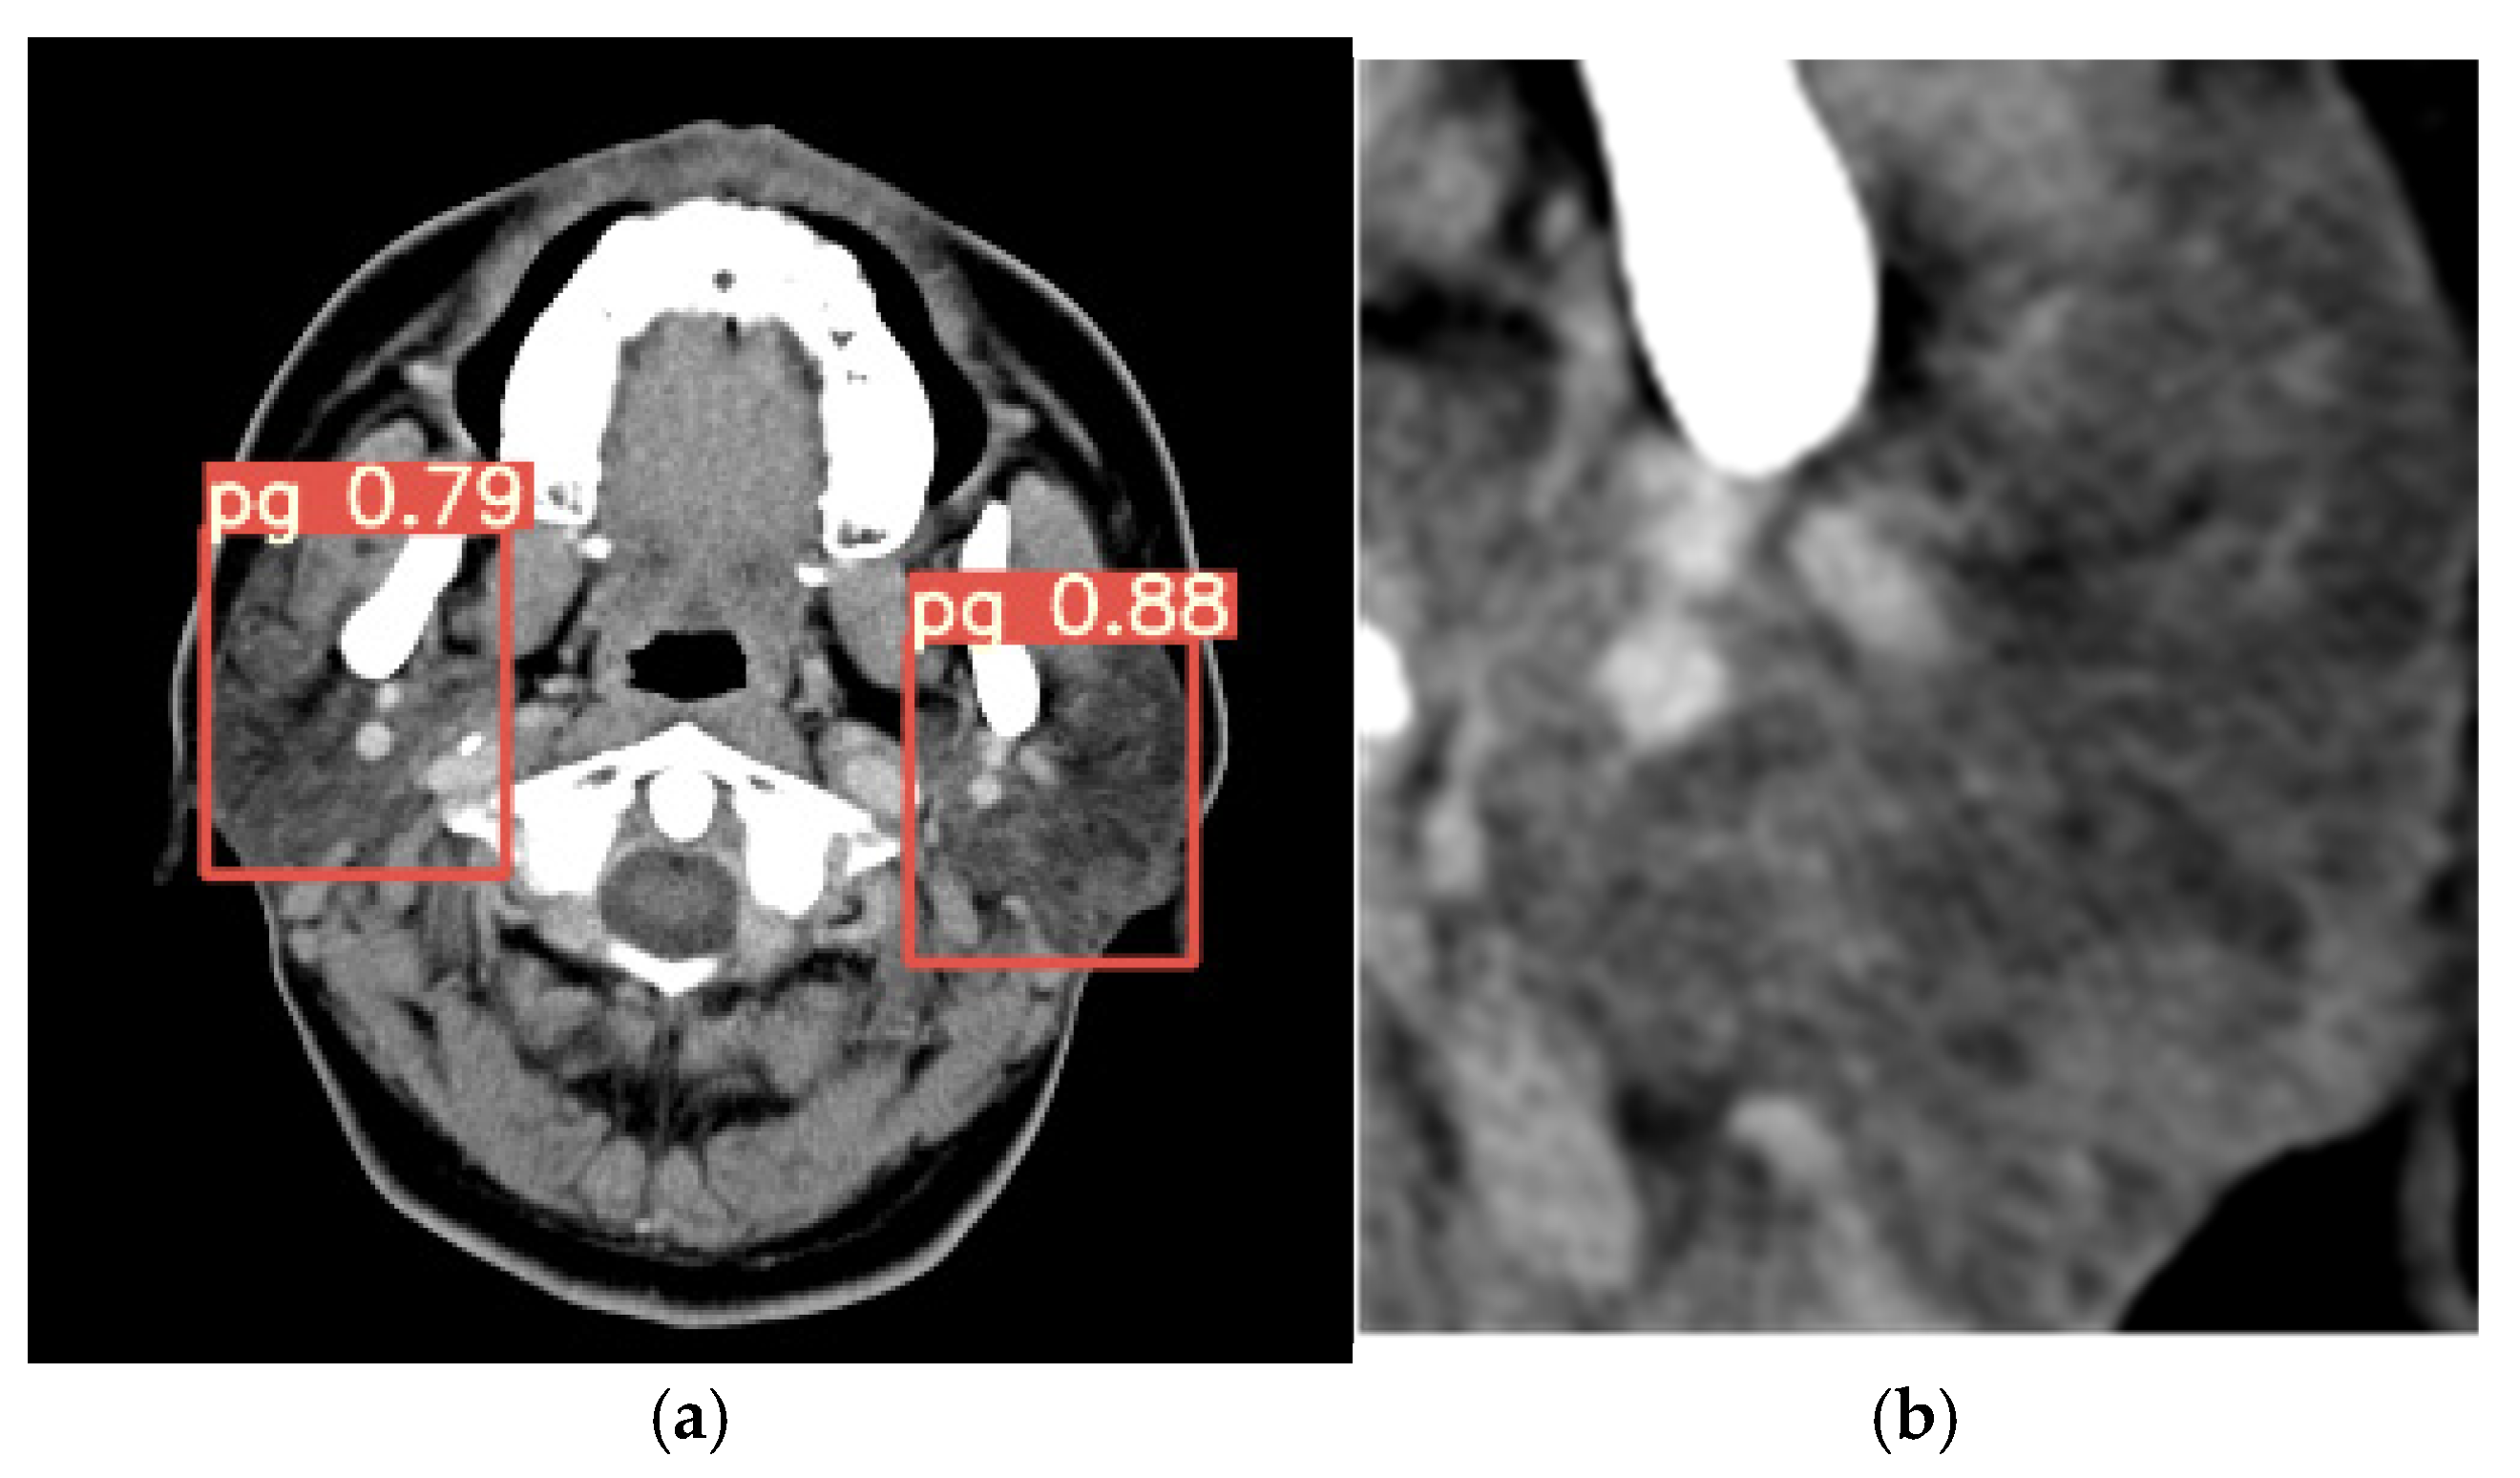

Table 1.
Experimental rresults for parotid gland area detection.
| Methods | AP50 (mean±S.D) |
| YOLOv4 | 0.9645±0.12 |
| VOLOv7 | 0.9801±0.13 |
| CenterNet | 0.9595±0.03 |
| EfficientDet | 0.9478±3.13 |
| Faster RCNN | 0.9575±0.02 |
| SSD | 0.8920±0.02 |
Table 2.
Accuracy results for tumor presence classification (with/without tumor) using different methods.
Table 2.
Accuracy results for tumor presence classification (with/without tumor) using different methods.
| Tumor classification (Methods) | Accuracy (%) (mean±s.d) |
| ResNet | 84.6±2.18 |
| ResNet+BiFPN | 87.2±0.76 |
| ResNet+CBAM | 86.7±2.88 |
| VIT | 78.9±1.2 |
| Swin_Transformer | 91.9±1.3 |
| CVT | 89.7±1.0 |
| DEIT | 92.3±1.2 |
Table 3.
Accuracy results for malignant/mixed and Warthin tumor classification.
| Classification of Warith and Malignant/Mixed tumors (method) | Accuracy (%) (mean±s.d) |
|---|---|
| ResNet | 92.1±1.8 |
| ResNet+BiFPN | 92.9±1.2 |
| ResNet+CBAM | 92.9±1.95 |
| VIT | 78.9±1.3 |
| Swin_Transform | 94.2±1.4 |
| CVT | 89.0±1.1 |
| DEIT | 94.7±0.74 |
Table 4.
Accuracy results for malignant and mixed tumor classification.
| Malignant and Mixed Tumor classification (method) | Accuracy (%) (mean±s.d) |
| ResNet | 83.5±3.6 |
| ResNet+BiFPN | 82.6±2.4 |
| ResNet+CBAM | 82.0±3.6 |
| VIT | 66.1±4.2 |
| Swin_Transform | 62.9±4.2 |
| CVT | 74.0±2.5 |
| DEIT | 84.4±2.3 |
Table 5.
Lesion segmentation results using Dice similarity coefficient.
| Dice similarity coefficient (mean±S.D) | malignant | Mixed | Warthin |
| Unet | 0.82±0.03 | 0.84±0.08 | 0.89±0.09 |
| Unet++ | 0.83±0.05 | 0.85±0.06 | 0.91±0.08 |
| Swin-Unet | 0.84±0.09 | 0.83±0.03 | 0.91±0.03 |
| TransUNet | 0.89±0.09 | 0.93±0.05 | 0.94±0.07 |
Disclaimer/Publisher’s Note: The statements, opinions and data contained in all publications are solely those of the individual author(s) and contributor(s) and not of MDPI and/or the editor(s). MDPI and/or the editor(s) disclaim responsibility for any injury to people or property resulting from any ideas, methods, instructions or products referred to in the content. |
© 2024 by the authors. Licensee MDPI, Basel, Switzerland. This article is an open access article distributed under the terms and conditions of the Creative Commons Attribution (CC BY) license (http://creativecommons.org/licenses/by/4.0/).
Copyright: This open access article is published under a Creative Commons CC BY 4.0 license, which permit the free download, distribution, and reuse, provided that the author and preprint are cited in any reuse.


