1. Introduction
A tropical cyclone (TC) is a large synoptic-scale weather system that originates over the warm ocean of the world and develops into a massive vertex composed of swirling winds, intense clouds, and torrential rains by drawing energy from the sea [
1]. Tropical cyclones (TCs) are deadly extreme weather events. They often bring gusty winds as they make landfall, leading to storm surges along the coastlines and direct damage to the lives and livestock. They can also produce extreme rainfall, leading to coastal and inland flooding, especially if rapidly intensified near the coasts. The modeling of tropical cyclones has improved significantly in recent years [
2]. However, the improvements have largely been made in track prediction. Skill in forecasting intensity is relatively low [
3], and accurate quantitative precipitation forecasts are still challenging [
4]. The success/failure of a model forecast can hinge upon the choice of parameterizations of physical processes within the model. During pre-monsoon season, tropical cyclones are the primary source of clouds and precipitation over the tropics. It is reported that clouds are the essential meteorological elements in the formation of tropical cyclones (TCs). The organized cluster of convective clouds around the central area of surface low-pressure over the sea surface helps in the development of the TC [
5,
6]. In fact, the energy required for a TC to intensify is acquired from the direct transfer of sensible heat and latent heat from the warm ocean surface via convection. The clouds in the inner regions of tropical cyclones are mostly cumulonimbus in nature and happen to be located within the spinning vortex and intricately connected with the dynamics of the cyclone itself. It is reported that while high-resolution core-physics models become more widely used, forecasting the probabilities of extreme weather and heavy precipitation at specific times and locations will become the feasible goal for land-falling cyclones [
7].
They originate in Inter Tropical Convergence Zone (ITCZ) over the ocean between 6° to 20° N of the equator. TCs normally travel in the north-to-northwesterly directions [
8]. One of the fundamental problems of forecasting the movement of tropical cyclones is that of their path change and forming recurvature [
9]. The understanding of the genesis of TCs during the pre-monsoon transition (PMT) over the BOB and its multiple changes of track due to warmer climates remain precisely inadequate. Some studies found that sea surface temperature (SST), 850hPa relative vorticity, the Coriolis force, vertical wind shear (VWS), conditional instability, and relative humidity (RH) mean in the lower to middle troposphere were very important factors impacting TC formation and development [
10,
11,
12].
The most common recurvature situation arises when an extra-tropical trough (ridge) approaches a storm from the west or when the storm moves west to northwest (northeast) toward a stationary or slowly moving trough. The formation and intensification of tropical cyclones is controlled by low-level relative humidity, vertical wind shear, low-level convergence, upper-level divergence, conditional instability, and sea surface temperature. TC Nargis developed over the BOB during the pre-monsoon season in late April and early May 2008 and went on to become the most devastating storm in the recorded history of Myanmar. It made landfall on the Ayeyarwady deltaic coast on 2 May 2008 as a category four cyclone on the Saffir-Simpson scale [
12,
13]. Mocha cyclone originated over the lower latitude of BoB in early May and made landfall over Myanmar. The cyclone affected Bangladesh and Myanmar’s coastal cities, including YangonMyanmar's largest city and former capital.
The TC is a nearly circular, warm-cored vortex, occupying the entire height of the troposphere and extending radially many hundreds of kilometers. Continually active clouds surround the storm's center and are organized as the eyewall and rain bands. This complex system of interacting physical processes has multiscale motions, and one of the most difficult aspects to understand is the movement of moist convection processes [
14]. The most important aspect of TC prediction is its movement. Through the efforts of many researchers over the decades, it appears that we now have a very good understanding of the physical mechanisms that control the displacement of a TC, referred to as steering flow [
15]
. Surface observations are not dense enough to accurately track a TC center, especially over the open oceans. However, surface observations can be important, particularly if they are located near the TC center. [
15] develop a simple estimate of the deep-layer steering, which could serve as a proxy for the actual TC motion.
The calculation for this parameter is known as the deep-layer mean (DLM) wind and is simply the mass-weighted average wind through some layer of the troposphere. However, the weaker storms typically have less vertical depth and a shallower layer of average (SLA) winds. Thus, SLA can be examined to assess the potential TC motion, as discussed in [
16]. The fidelity of the recent operational global NCUM model at NCMRWF analysis and forecast products are used to understand the recurvature dynamics for the Mocha cyclone. The overturning linkage and role of the WD were also analyzed and discussed. Furthermore, the dynamical features such as Q-vector and streering flow (SF) associated tracks derived from NCUM analysis validate with 24-, 72- and 120-hr forecast.
Chan [
17] documented that the track of TCs deviated from its typical path toward the west or northwest direction, referred to as TC curvature. The most prominent reasons determined for recurvature are the eastward-retreating mid-tropospheric process [
18]. Studies related to TC dynamics, including recurvature, have been conducted mostly for TCs over the Western North Pacific Ocean due to a large number of TC occurrences in that basin discussed in Akter and Tsuboki (2021). However, the TCs that occur in the BoB region are usually RI due to warm SST and cause massive destruction to coastal BIMSTEC countries such as India, Bangladesh, and Myanmar due to their geographical location, low-lying topography, high population density, socioeconomic conditions, and lack of resources [
19]. Thus, attention is still needed to know the tracks and RI in the recent two decades (2004-2023).
The present study discuused the climatology and landfall over BIMSTEC countries in
Section 2 and genesis conditions of Mocha cyclone.
Section 3 illustrates the data methodology. Moreover, the performance of UCUM model on Mocha cyclone intensity, cyclogenesis, Q-vector, SF, track and IVMT are discussed in
Section 4. Rainfall forecast and conclusions are presented in
Section 4 and
Section 5, respectively.
2. Pre-Monsoon Season Tropical Storms Climatology and Landfall over BIMSTEC Countries (Bangladesh, India, and Myanmar) During Recent Decades (2004-2023)
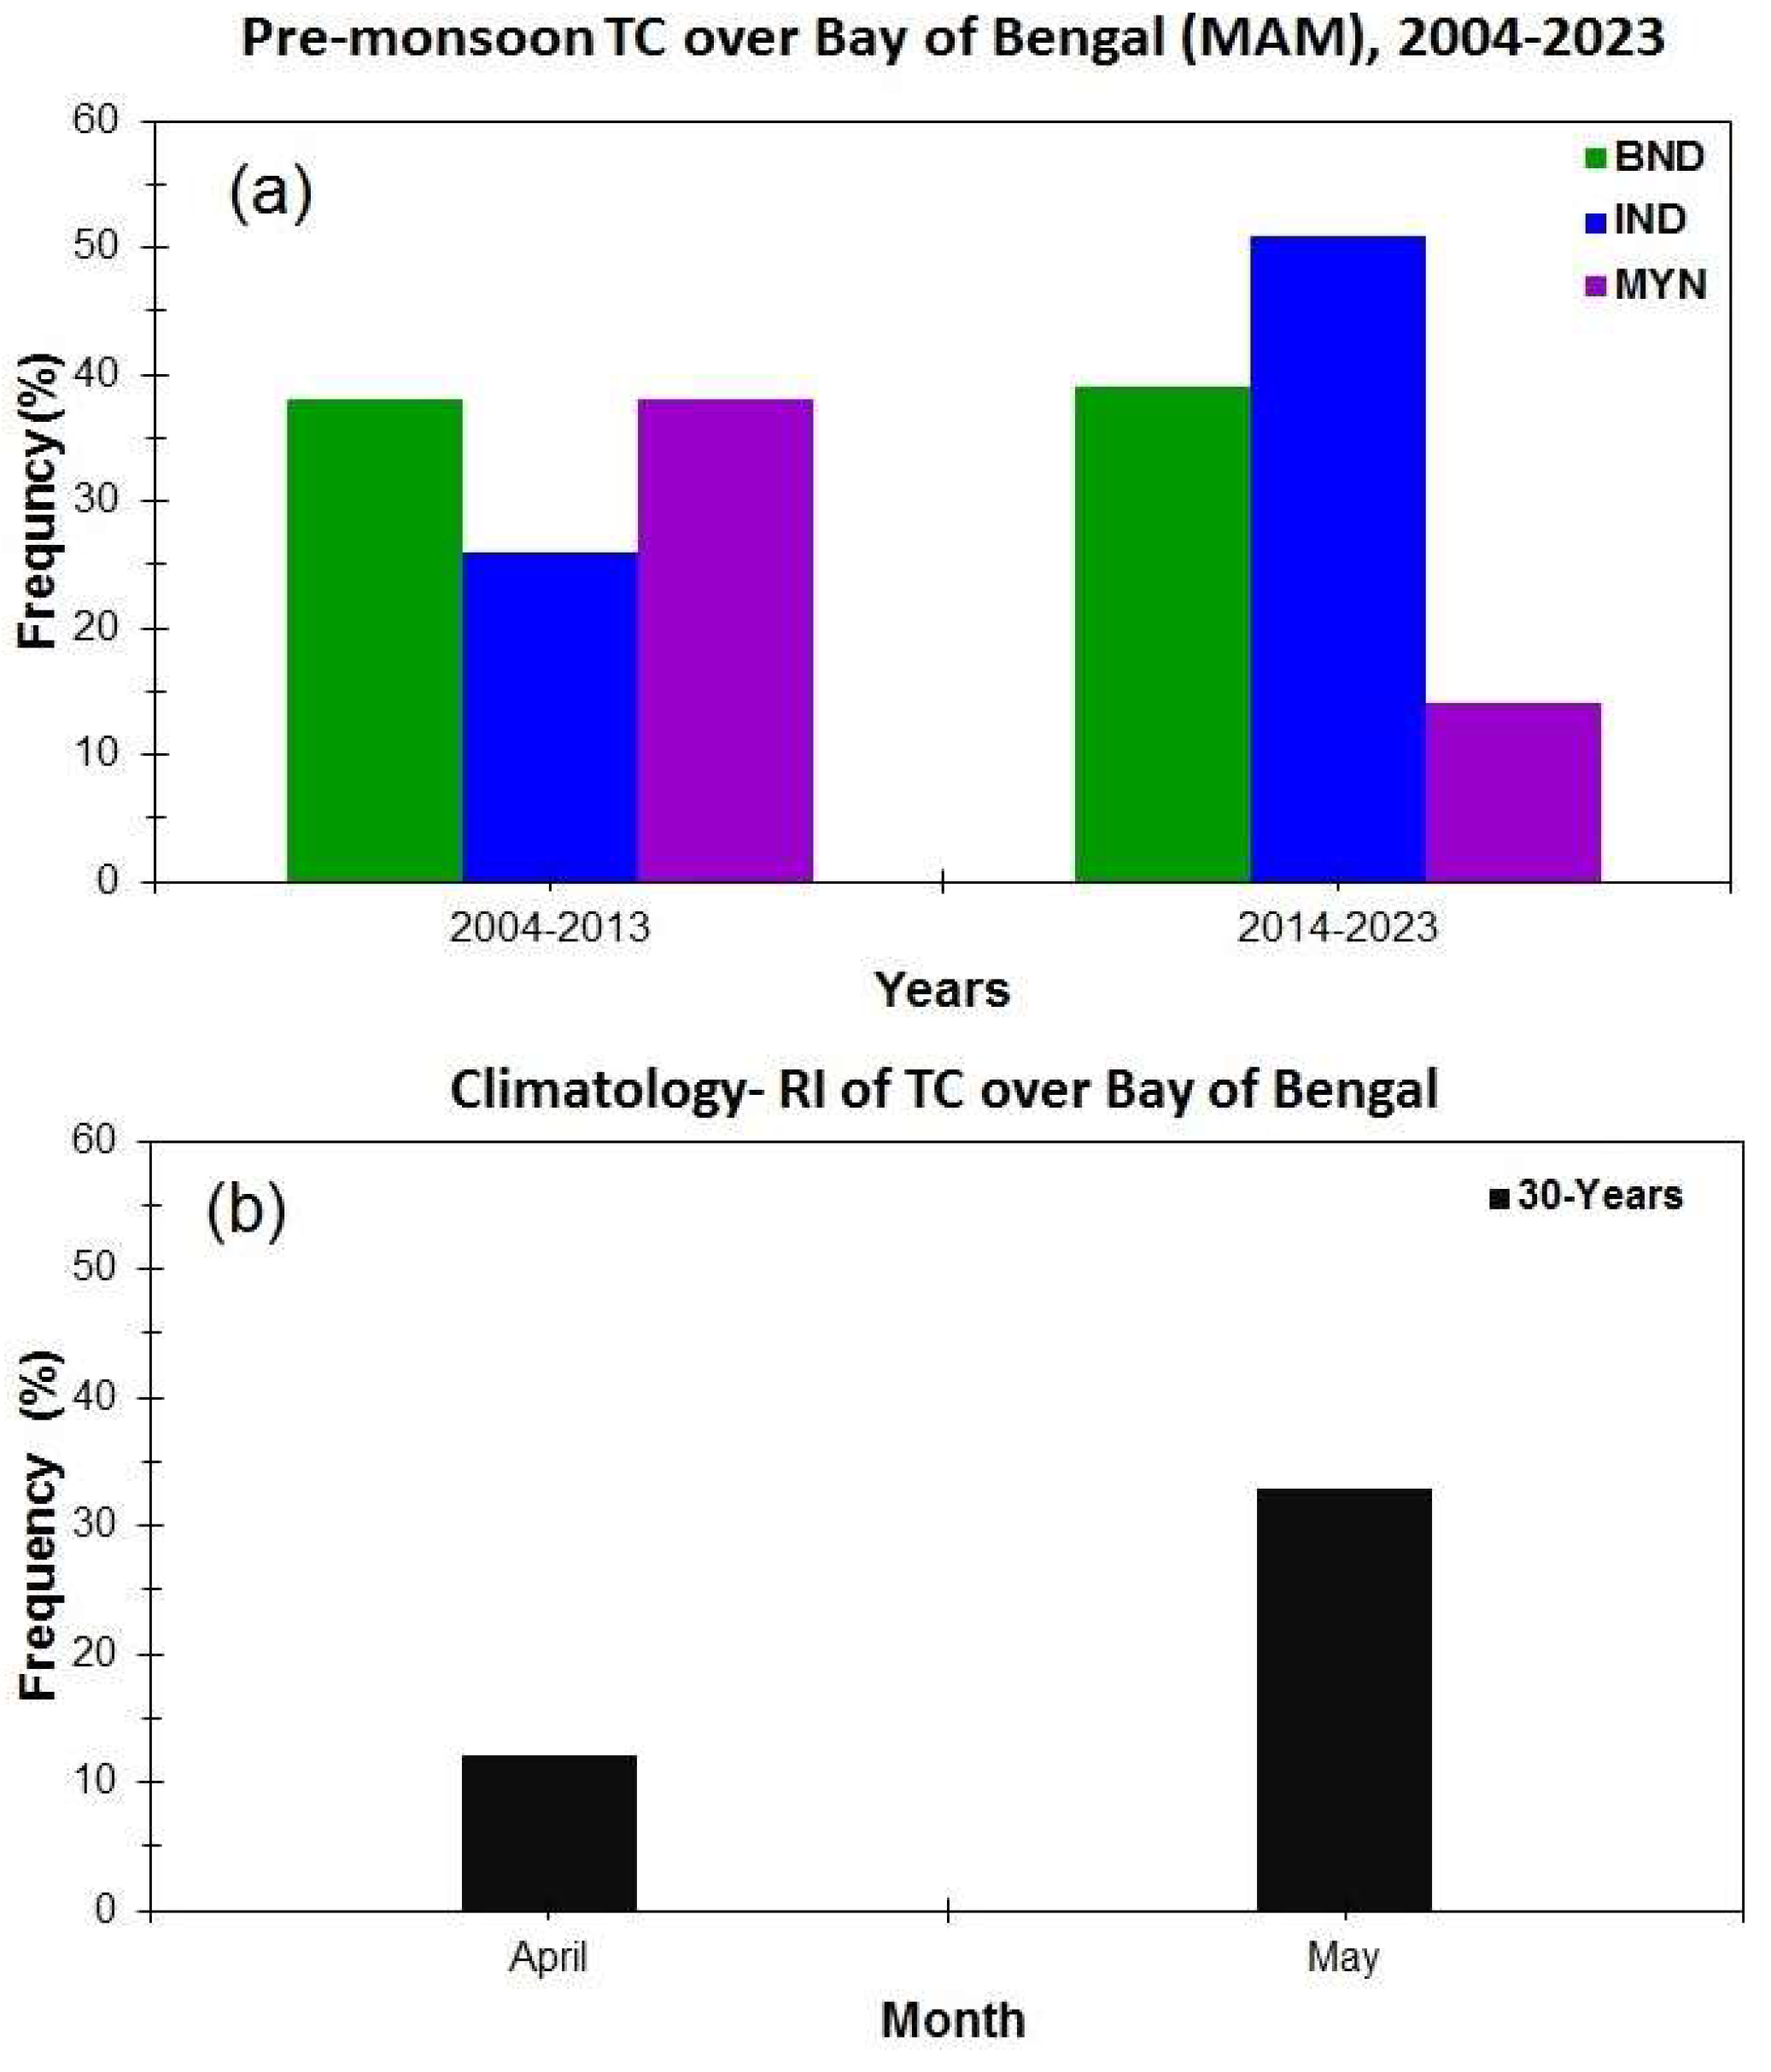
The BIMSTEC is a multilateral and regional organization made with the collaboration of seven countries (India, Bangladesh, Bhutan, Nepal, Myanmar, Thailand, and Sri Lanka), and weather and climate products are being prepared by the BIMSTEC centre for weather and climate (BCWC), NCMRWF and IMD , Govt. of India. The TCs variability during two recent decades (2004-2023) has analysed as which are made landfall over the BIMSTEC countries, particularly India, Bangladesh, and Myanmar. The frequency (%) during pre-monsoon season is shown in
Figure 1 (a). During the recent decades 2014-2023, the TC made landfall frequencies in 33%, 50%, and 12% of Bangladesh, India, and Myanmar, respectively. However, the TCs were mostly in the north and north-easterly direction in the past decades 2004-2013, and 27% of the number of TCs made landfall over the India region less as compared to Bangladesh and Myanmar. [
20,
21]. As per the IMD rapid intensification (RI) criteria, if the TC has persisted maximum sustained wind at 30 knots within 24 -hour referred to as RI, has been analyzed during 20 years (2004-2023) showing the maximum RI occurred in the month of May as compared to April as represented in
Figure 1 (b). Typically, the TC genesis occurs in the lower latitudes and rapidly intensifies over the higher latitudes [
22,
23].
2.1. Favourable Condition for the Genesis of Mocha
(a) Synoptic features
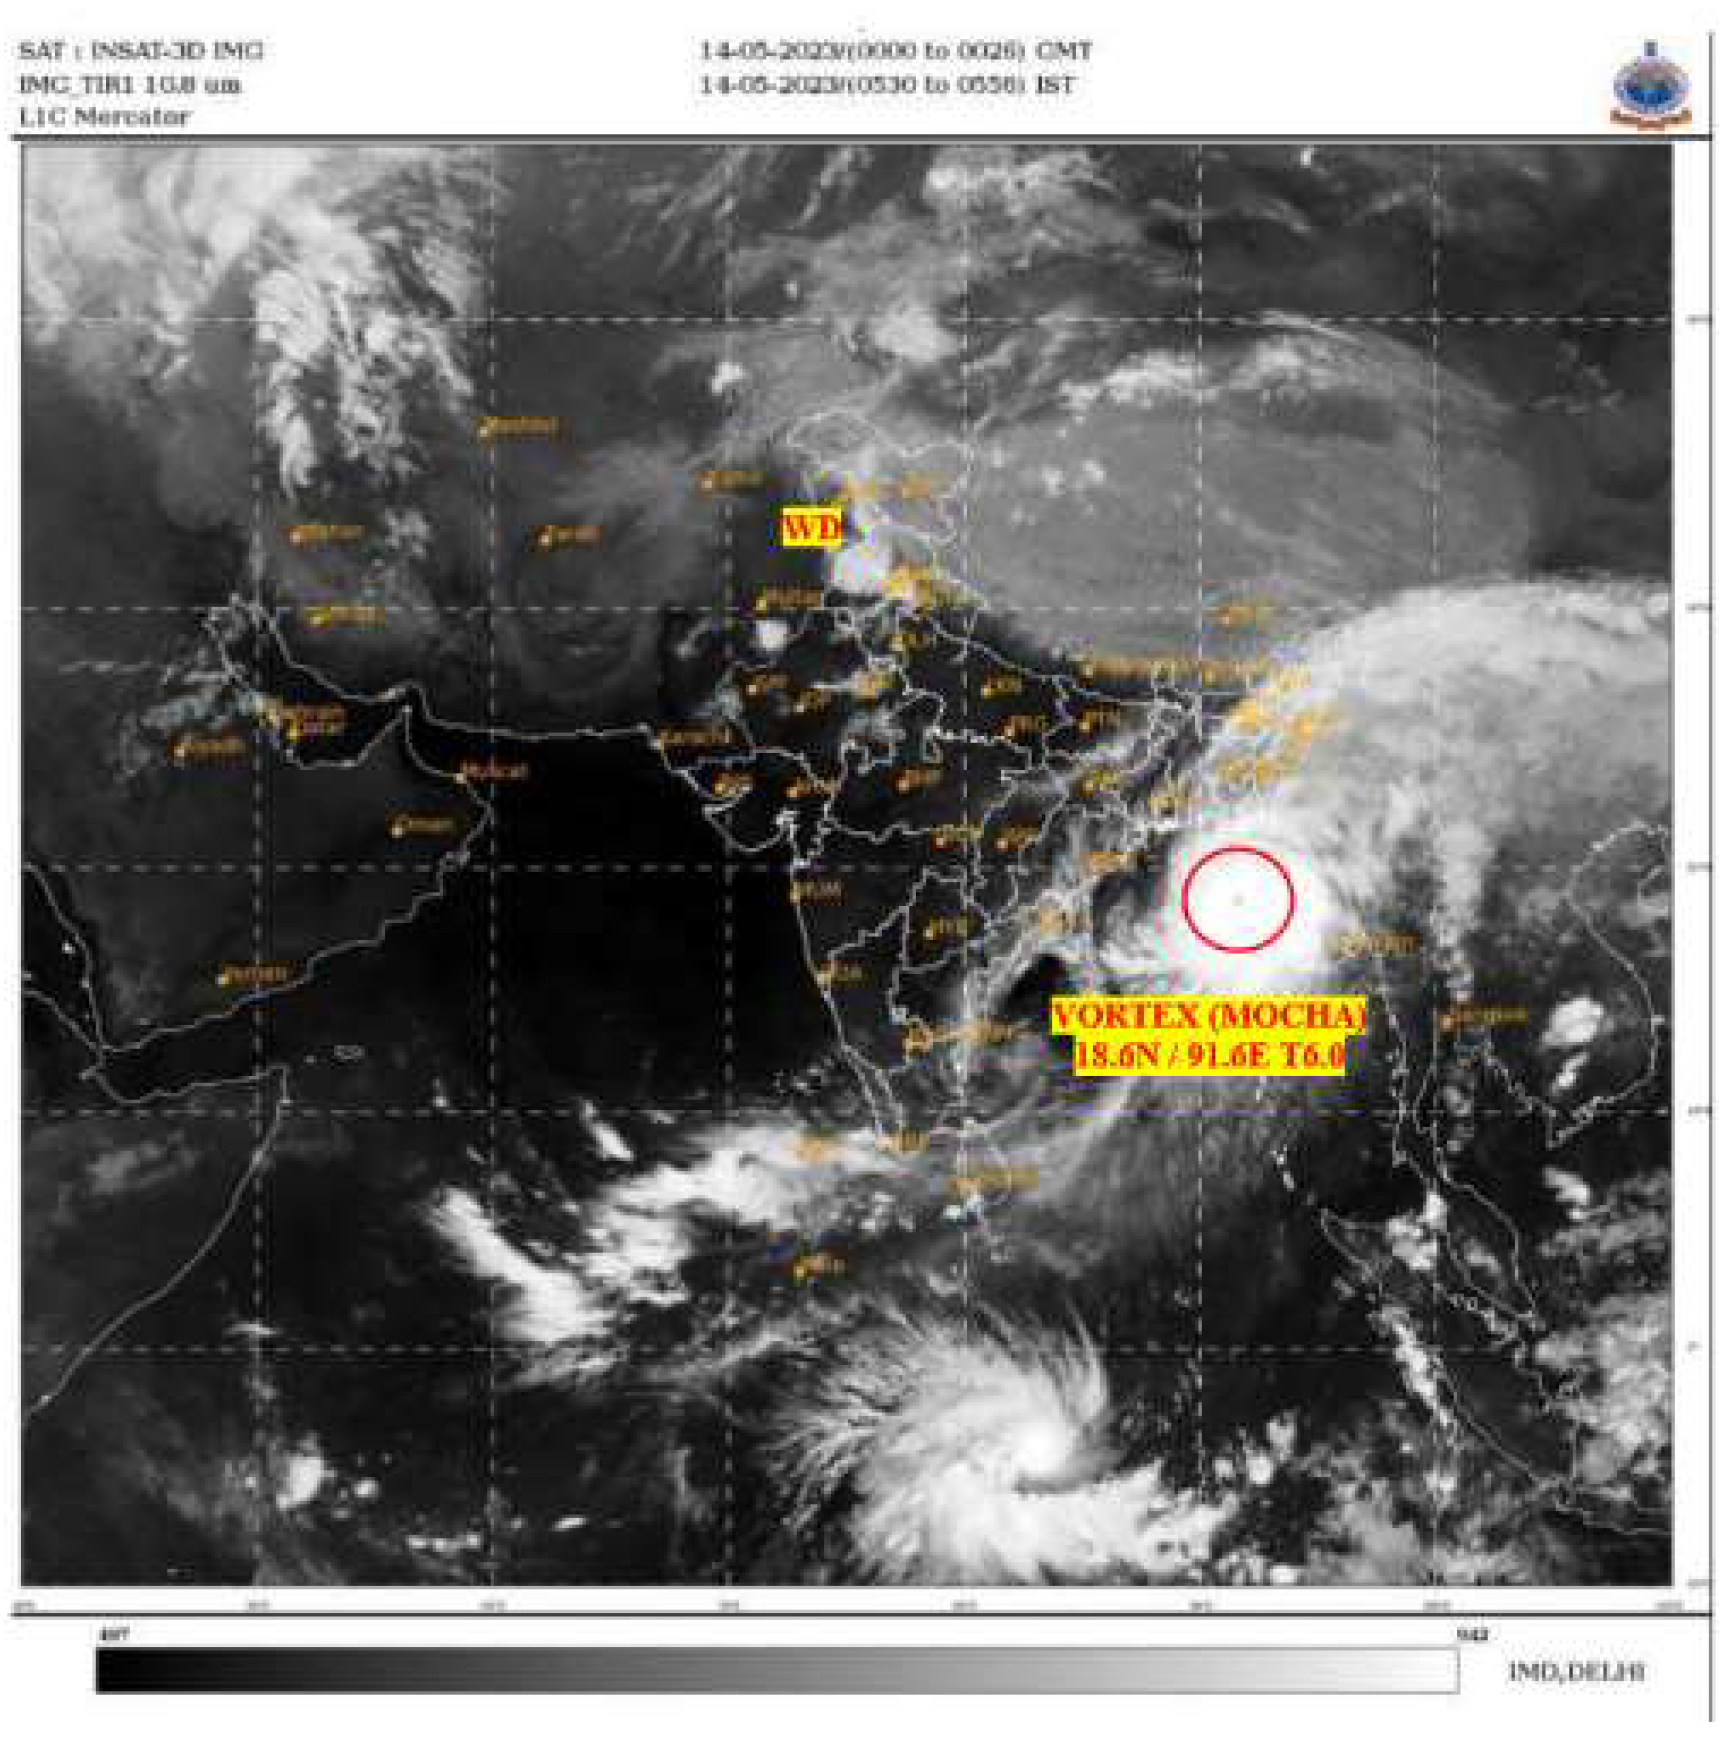
The low-pressure system formed at 00UTC of 09 May 2023 over the lower latitude of the BoB became a very severe cyclonic storm (ESCS) “Mokha,” pronounced as “Mocha”. The life cycle of Mocha cyclone 09-15 May moved northwesterly on 00 UTC of 11 May 2023. However, due to the influence of western disturbances, as existed over northwest India (30
o N; 55
o E) and adjoining Pakistan, the ESCS changed the track and moved northeast direction till 00 UTC on 14 May 2023 and made landfall on 06 UTC 14 May 2023. The satellite picture 06 UTC before the landfall, valid on 00 UTC of 14 May 2023, is shown in
Figure 2.
IMD reported that, initially Mocha has moved southeast direction over the Bay of Bengal and further moved north-northwestwards with a speed of 8 kmph and lay centered at 0830 hours IST of 11 May 2023 over the same region near latitude 11.4°N and longitude 88.0°E, about 510 km west-southwest of Port Blair, 1190 km south-southwest of Cox’s Bazar (Bangladesh) and 1100 km south-southwest of Sittwe (Myanmar). It is very likely to move north-northwestwards and gradually intensify into a severe cyclonic storm around the night of today, the 11 of May 2023. After that, it is likely to recurve gradually, move north-northeastwards from the 12 May 2023 morning, and intensify further into a very severe cyclonic storm around the 12 May evening over the central Bay of Bengal. It would reach its peak intensity around the 13 of May evening. It is likely to cross southeast Bangladesh and north Myanmar coasts between Cox’s Bazar (Bangladesh) and Kyaukpyu (Myanmar), close to Sittwe (Myanmar) around noon of 14 May, 2023 with maximum sustained wind speed of 140-150 kmph gusting to 165 kmph as reported by IMD, 2023.
(b) Ocean-atmospheric conditions
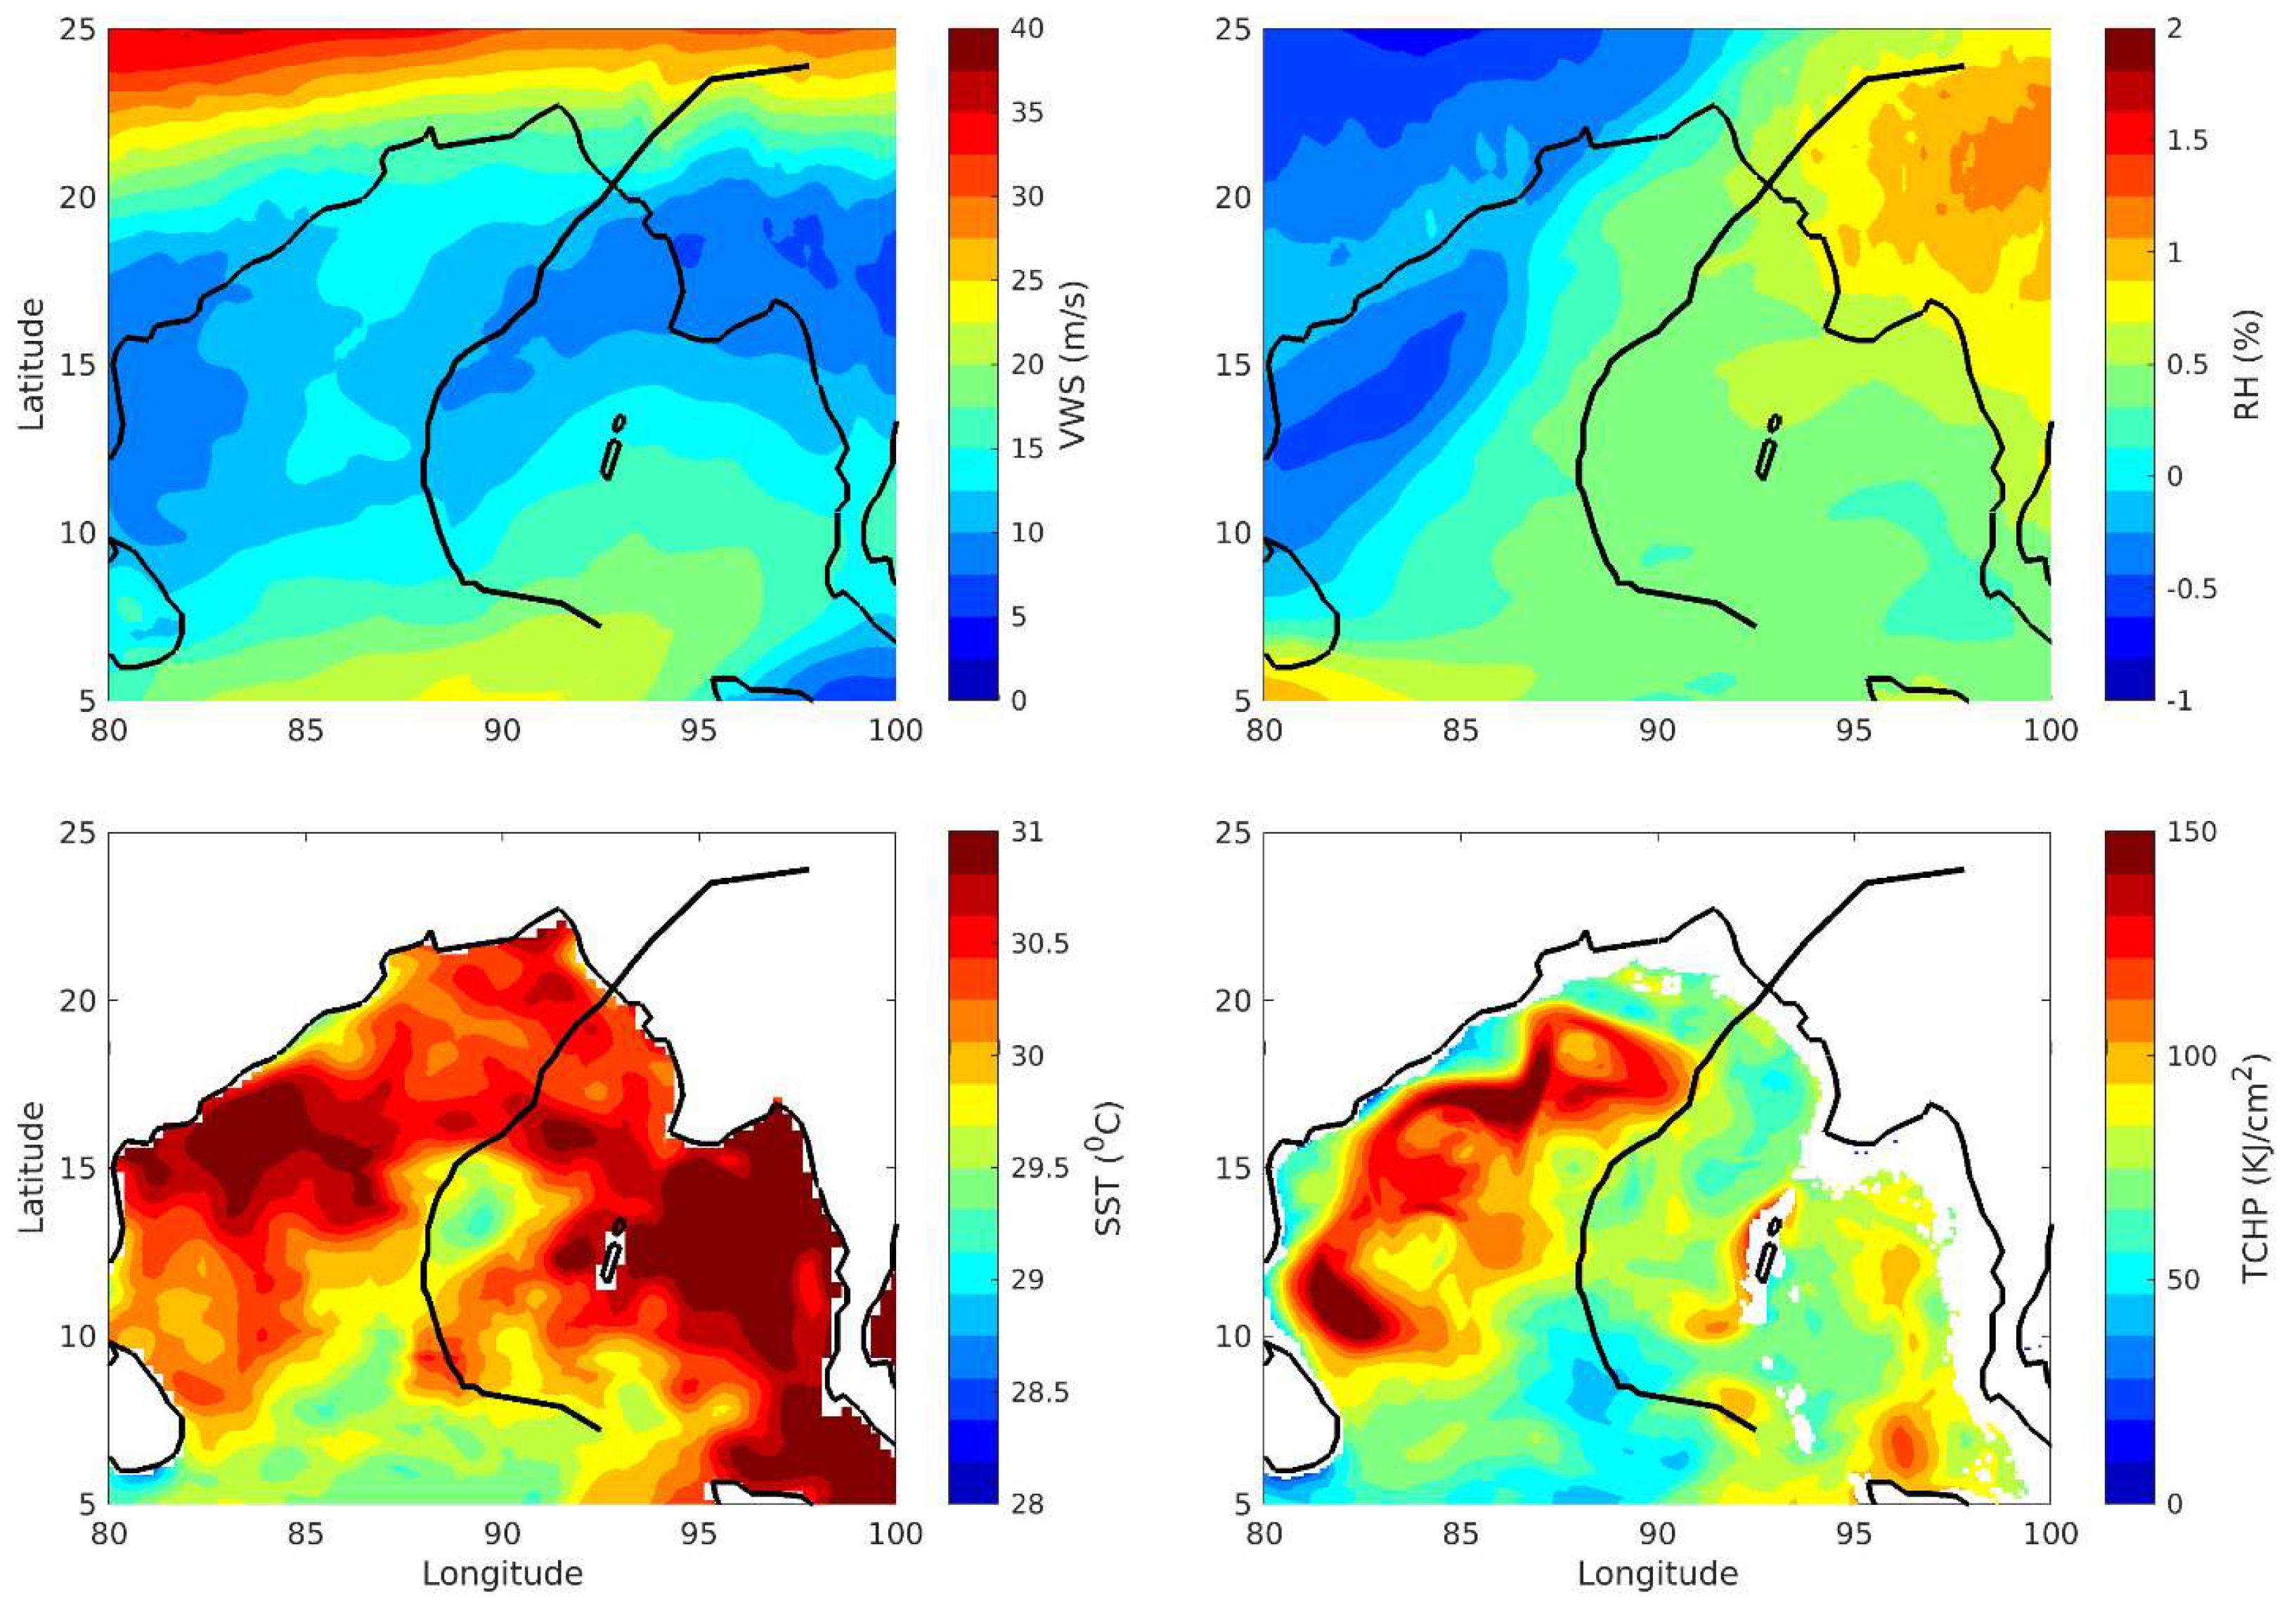
Tropical storms in the Bay of Bengal occur most frequently in post-monsoon (OND), with a secondary peak in pre-monsoon(MAM) seasons. Relatively warm SST conditions above 30°C creates thermodynamically unstable atmosphere and low tropospheric wind shears favor pre-monsoon cyclones development over the BoB. TC RI involves complex dynamic and thermodynamic processes and its interactions are discussed in [
24] and [
25] respectivily.
Figure 3.
Average (a) Vertical wind shear (ms-1), (b) relative humidity (%), SST (oC ), and TCHP (KJcm-2) during 9-15 May 2023, along with an observed track from IMD 9-15 May 2023.
Figure 3.
Average (a) Vertical wind shear (ms-1), (b) relative humidity (%), SST (oC ), and TCHP (KJcm-2) during 9-15 May 2023, along with an observed track from IMD 9-15 May 2023.
Previous studies by [
26] have shown that various large-scale atmospheric and oceanic environmental conditions, such as vertical wind shear (VWS), mid-level relative humidity, lrelative vorticity at 850 hPa, SST, TC heat potential (TCHP), and TC inner core process are significantly affect TC RI [
27,
28]. Specifically, any SST threshold > 26.6
oC is a necessary condition for the genesis of TC over BOB, but these conditions are not sufficient to be acceptable for the development of TC. The formulation based on SST and TCHP both have been used to understand sensitivity TC formation of Mocha cyclone. Mocha cyclone made landfall in North Myanmar – Southeast Bangladesh coasts between Kyaukpyu (Myanmar) and Cox’s Bazar (Bangladesh) on 06 UTC 14 May 2023 with sustained winds of approximately 210-220 km/h, equivalent to a category of 4 hurricane intensity. Moreover, Mocha cyclone brought approximately 64 cmd
-1 of rainfall and associate storm surge of 3–4 meters near Kyaukpyu and Sittwe port city. However, for cyclone Mocha case the SST was ~32
oC and TCHP > 100 KJ cm
-2 caused for RI and the last for 9-15 May 2023 as shown in Fig 2 (a-b). Correspondingly, the magnitude of VWS; ms
-1 and RH (%) shown in Fig 2 (c-d). In general, it has clearly seen that VWS relatively low around 10 ms
-1 and RH above 50 % during genesis stage valid on 09 May 2023. However, the Mocha developed as ESCS stage on 00 UTC of 13 May 2023, the RH has reached above 70% and VWS reached 16 ms
-1. During 00 UTC 15 May 2023 VWS and RH sharply decreased up to 5 ms
-1 and 30 % caused the rapid dissipation as shown in
Supplementary Figure S1. The combined influence of SST, TCHP, VWS and RH relatively remain very challenge for the prediction of TC as discussed in [
29].
3. Data and Methodology
Global NCUM-G is a seamless prediction system operational at NCMRWF Unified model (NCUM) numerical weather prediction (NWP) since 2017 and upgraded periodically as discussed in [
30]. The NCUM is based on the Unified Model (UM) system developed under the “UM Partnership” by UK Met Office, and MoES/NCMRWF-India. The NCUM system has been upgraded periodically to adapt to new scientific and technological developments for improving the global as well asregional NWP NCUM V6 has horizontal resolution of 12km and 70 levels (80 km) . The NCUM’s dynamical core solves compressible non-hydrostatic equations of motion with semi-lagrangian advection and semi-implicit time stepping. Sub-grid scale processes such as convection, boundary layer turbulence, radiation, cloud, microphysics, and orographic drag are represented by physical parameterization schemes, which have been improved perodically discussed in [
31].
The dynamical core, the so-called heart of the atmospheric models, is the component of the model that deals with the numerical solution of the primitive equations. Advanced “ENDGame” (Even Newer Dynamics for General atmospheric modelling of the environment) dynamical core is used in the model. Prediction of the future state of the atmosphere by the NWP model largely depends upon the initial condition (analysis) used by the model. The process of preparation of the “analysis” is known as Data Assimilation (DA). NCMRWF adapted the advanced 4D-Var data assimilation system of the UK Met Office for operational use in April 2012. In October 2016, the NCUM data assimilation system was upgraded to “Hybrid 4D-Var” (adapted from “UM Partnership”).
In this present study, we analysed NCUM-G produsts to understand the curvature of the Mocha cyclone toward the northeast, it made landfall over Myanmar, which is a very rare case after the Nargis cyclone in 2008 [
32]. The TC studies that made landfall in Myanmar are very limited. The NCUM global model's output can give a better understanding of the mechanism and cause of curvature and steering flow over BIMSTEC countries. The merged rainfall dataset followed by [
33] was used to validate the rainfall. For upper air observations radiosonde datasets at Chittagong meteorological station at latitude/longitude of 22.35
o N; 91.81
o E are used for the validations of NCUM analysis and forecast. However, IMD's best tracks CIRA (
https://rammb.cira.colostate.edu/) and marine Copernicus datasets and Copernicus datasets and are used to calculate tropical cyclone heat potential (TCHP) also used and discussed.
4. Performance of NCUM Analysis and Forecast for Mocha Cyclone at NCMRWF
4.1. Role of WD and Recurvature
A meaningful comparison to the use of the geopotential height (GPH) field at different pressure levels, the objective here is to understand the vortex location with respect to height.
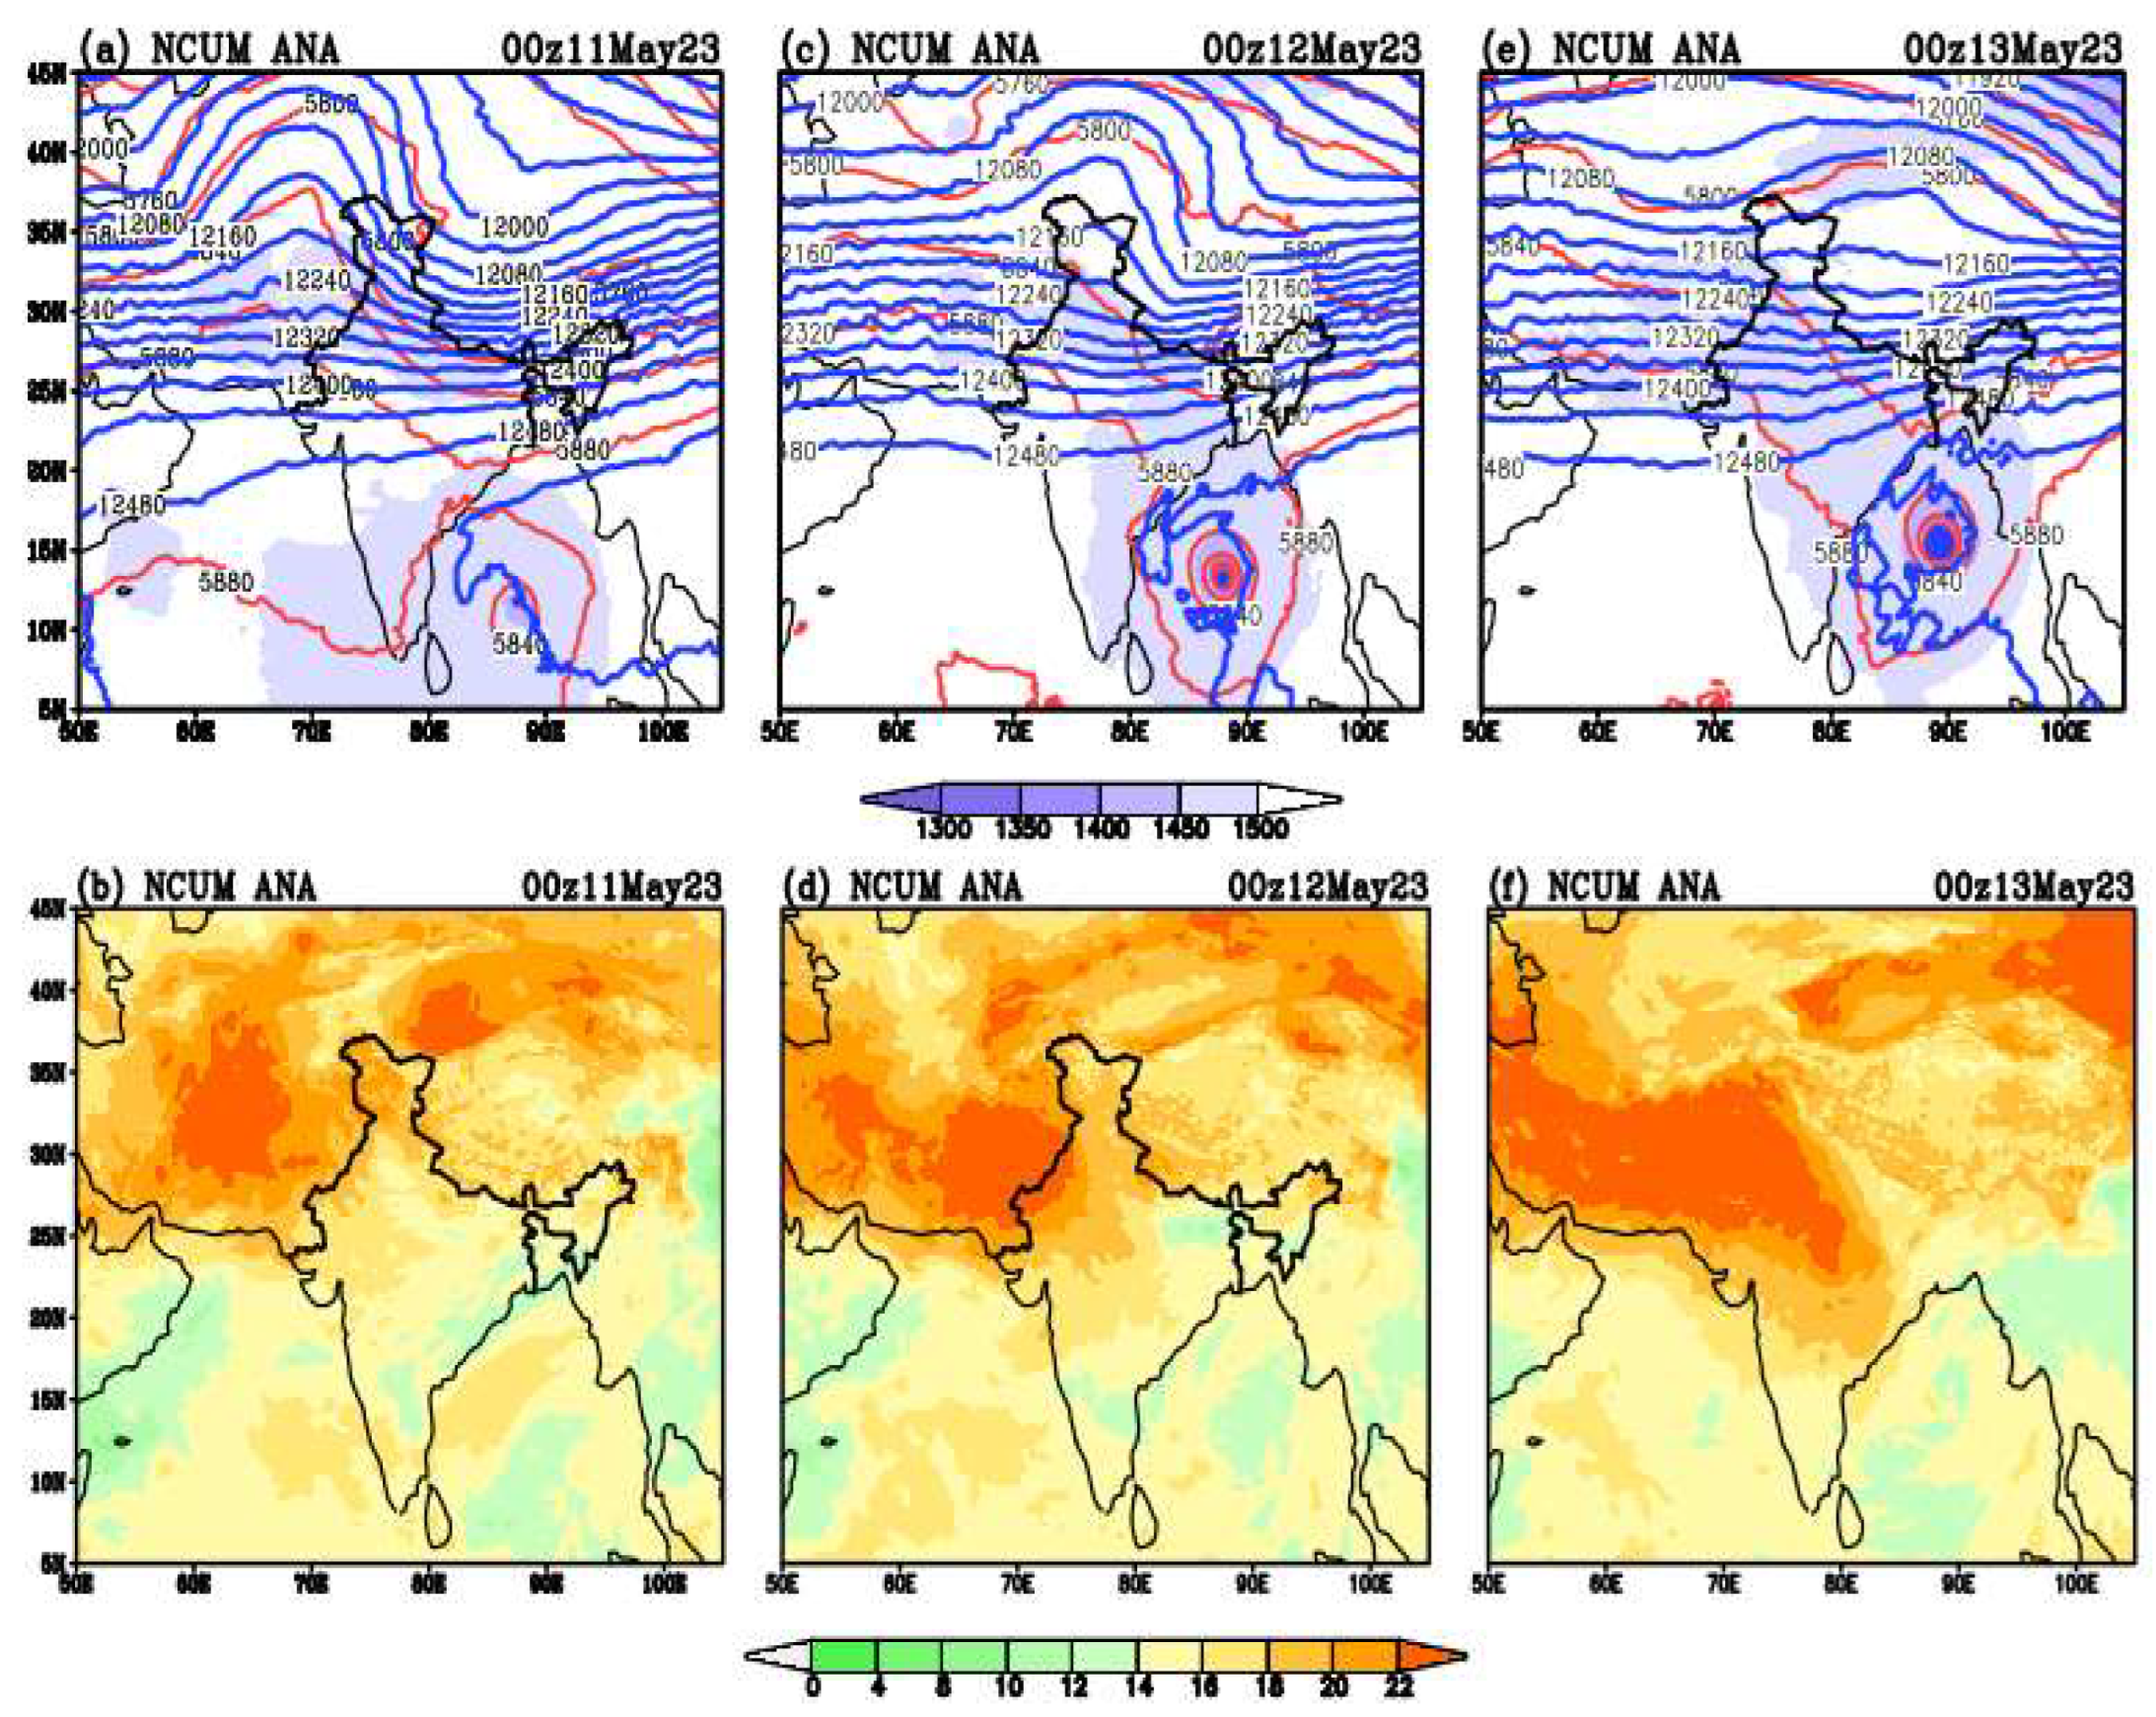
Figure 4 describes the NCUM analysis of GPH (m) and temperature (
oC) for the Mocha cyclone from 00 UTC from 11 to 13 May 2023. Mocha has exhibited multiple curvatures starting from the genesis, intensification, and landfall period. Thus,
Figure 4 in the lower panel represents the GPH field at 850 hPa (shaded), 500 hPa (contour; blue), and 200 hPa (contour; red) at different stages of Mocha. At 00 UTC of 11 May 2023, GPH showed a weak vortex minimum GPH field was about 1450 m over the BoB located at 10 N; 88 E, whereas significant ridge and trough persisted above 40 N over Pakistan and Nepal region. The next day, the ridge and trough shifted towards the northeast direction whereas the vortex intensified over the BoB at 11.0 N; 89.5 E, and minimum GPH was about 1400m, 4760m, and 12460 m at 850-, 500- and 200 hPa levels respectively as revealed in
Figure 4 (c).
Figure 4 (e) represents the very intensified vortex Mocha that moved in a northerly direction, and the ridge and trough over northern India were relatively weak and shifted further eastward direction. During 11-13 May 2023, initially, the GPH at 200 hPa was 12500 m, later increased to nearly 12540 m over the BoB, and the direction of GPH was north-south orientation, which guided the Mocha cyclone towards the north-northeast direction (
Figure 4e). Subsequently,
Figure 4 (lower panel) depicts the temperature difference between 700hPa and 500 hPa levels at 00 UTC of 11-13 May 2023. Since the Mocha cyclone has changed its track very efficiently, a simple and well-known method, such as the temperature difference between 700hPa and 500 hPa levels, can be used for forecasting the direction of movement for tropical cyclones. This method has been documented by [
34], which is apparently more appreciated and effective than the steering-level analyses adopted.
Fig 4 (b, d, and f) shows significantly warmer (22o C) over the north-western part of India around 30o N and 60o E progressing towards central India, which is objectively associated with a ridge at 500 and 200 hPa levels. A tongue-like structure of warming and lighter atmospheric temperature in the eastward direction explicitly accelerates to the Mocha cyclone movement towards the northeast direction. Moreover, the lowest GPH at 850 hPa persisted in central BoB, and the temperature was relatively less warm than in the surrounding regions.
4.2. Intensity and Rate of Cyclogenesis
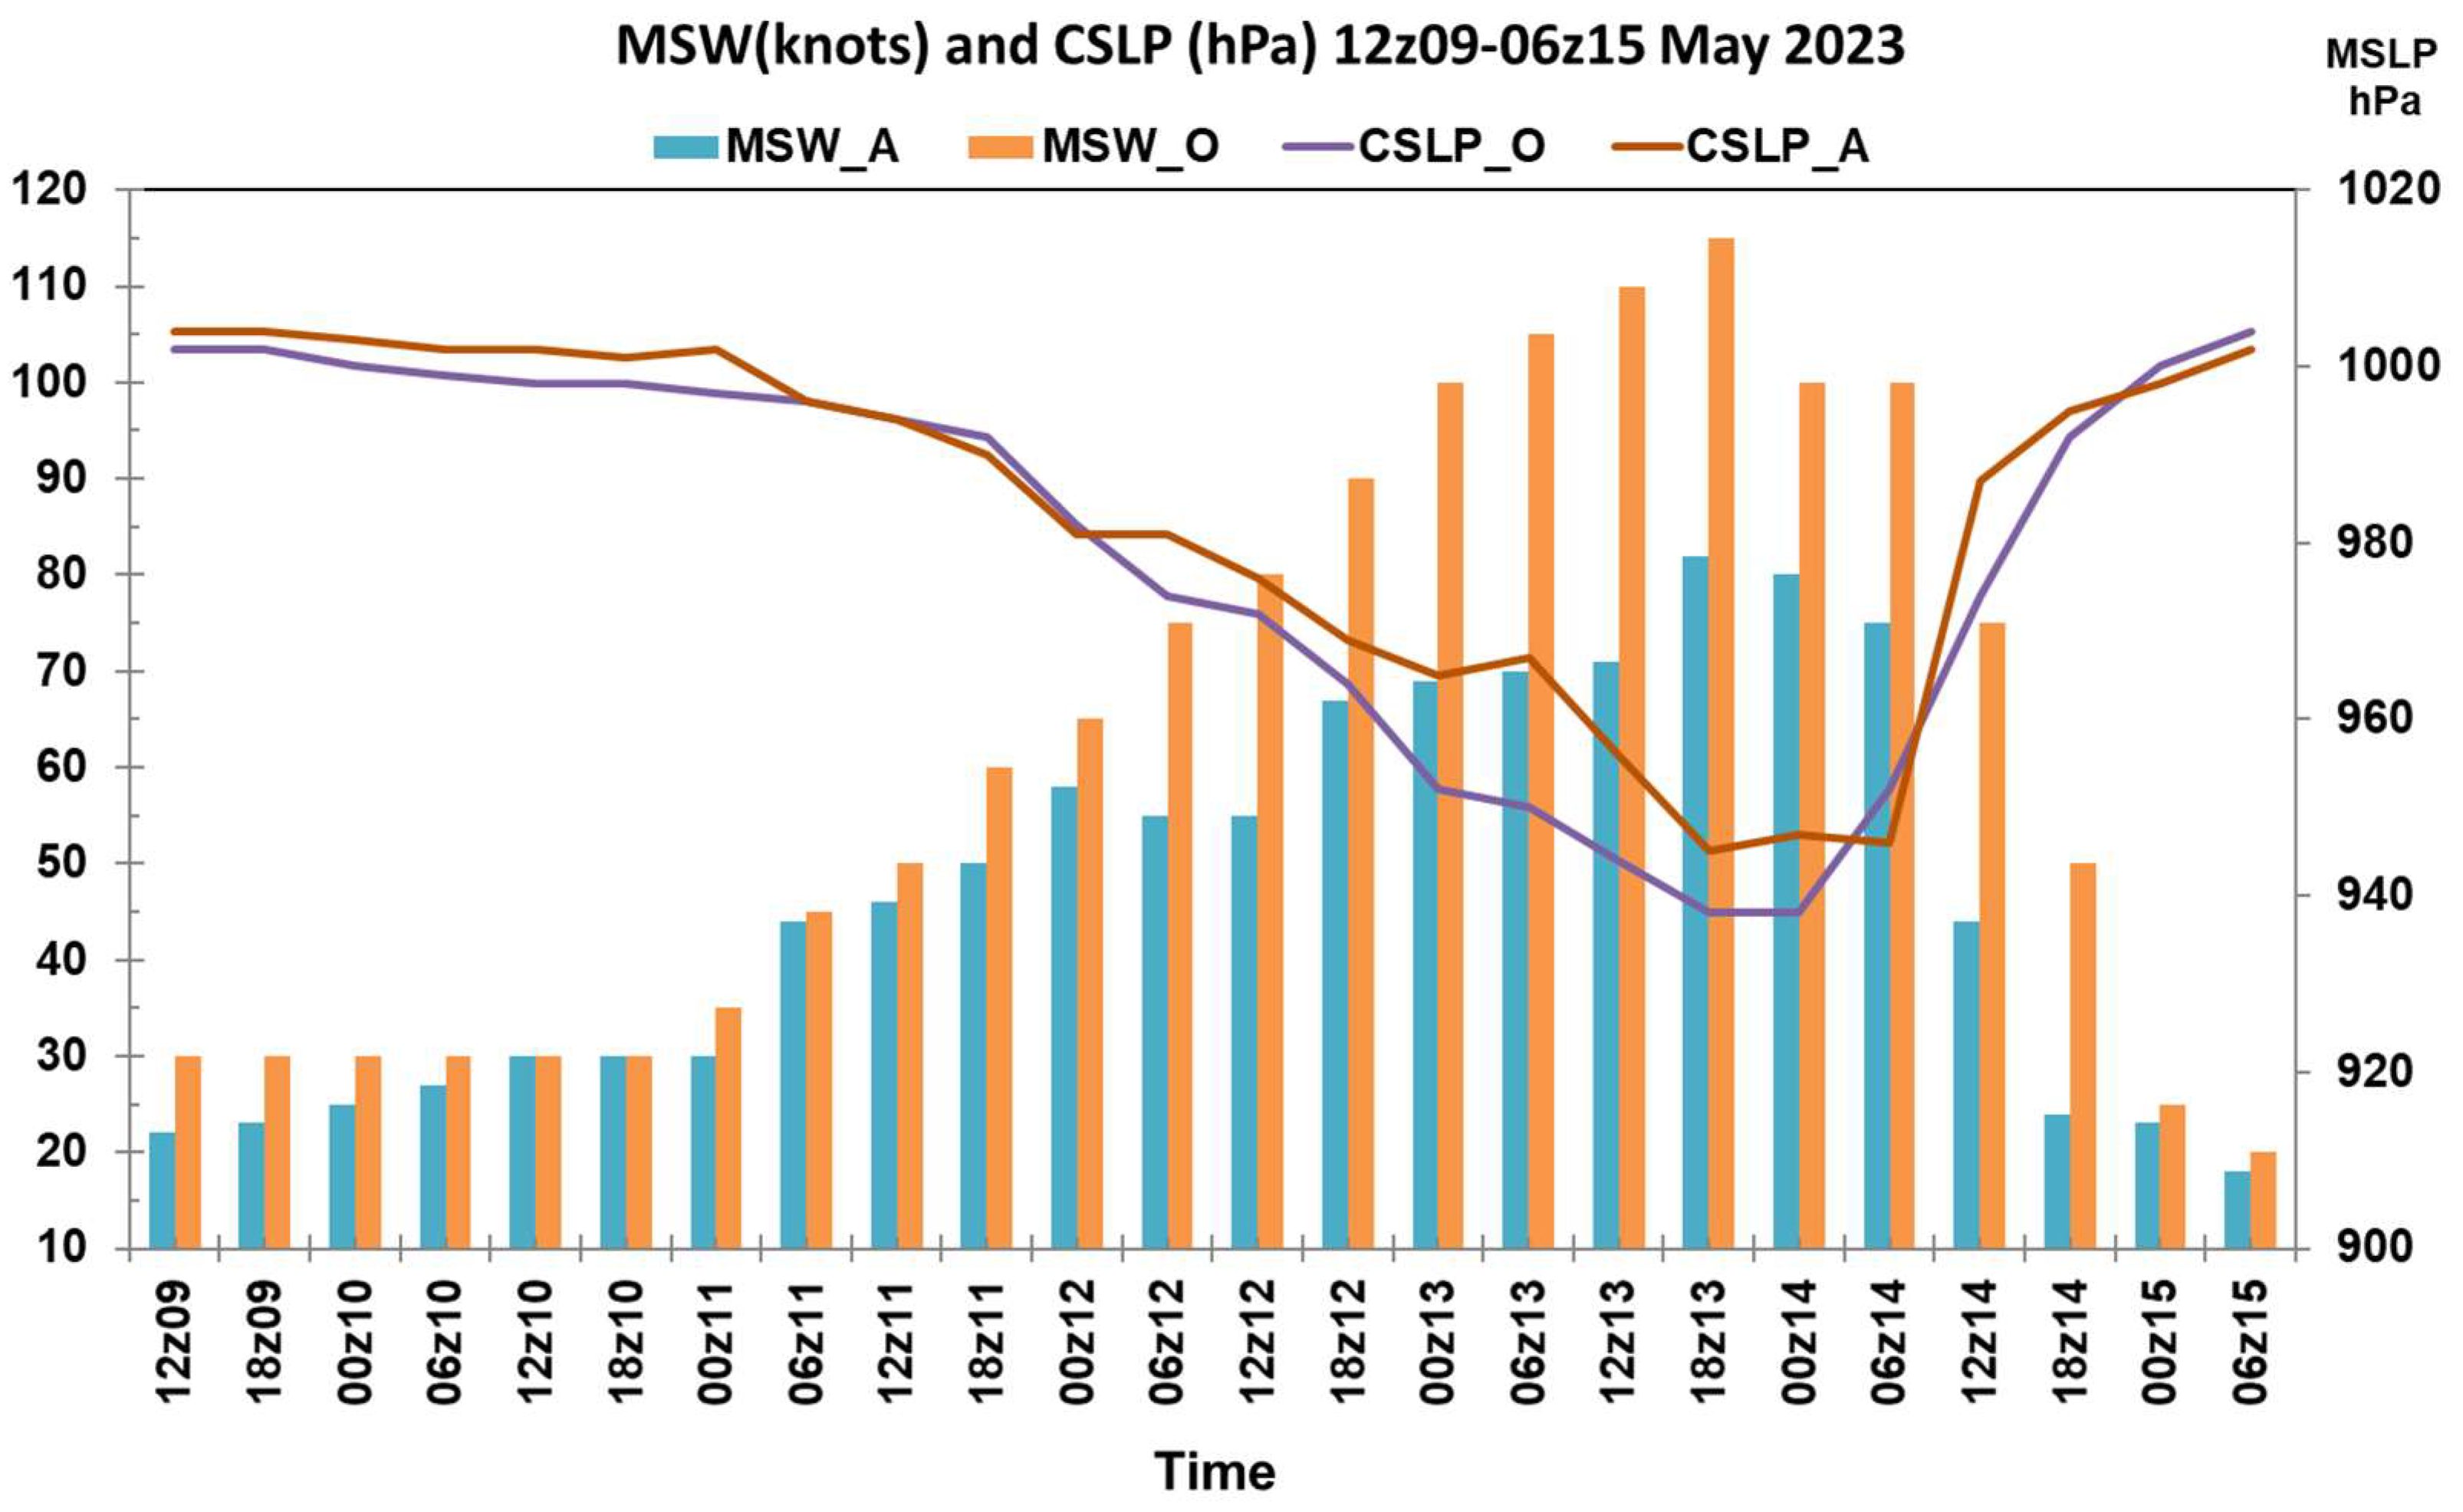
NCUM simulated MSLP and 10 m wind field of Mocha based on 00 UTC, 08 October 2013 initial conditions along with IMD observations are represented in
Figure 5. To understand the different stages of the Mocha cyclone and its intensity, the important parameters such as center sea level pressure (CSLP) and maximum sustained wind (MSW) during 9-15 May 2023 are analyzed and presented in
Figure 5 (a) and (b). For Mocha, the observed estimates indicate that the lowest pressure drops and MSW were about 938 hPa and 110 knots, respectively, at 00 UTC on 14 May 2023. Though the simulation of NCUM underestimates the peak intensity of both CSLP and MSW, the pressure drops, but the evolutions expressively agree with IMD values. The sea surface temperature (SST) around the cyclone center indicates the rapid intensification occurs over a wide range of SST > 28.0
oC along with the mean magnitudes of relative humidity ~79% [
35]. The CSLP fall averages at least 1 hPa h
−1 for 24 hr, causing the rapid intensification (RI) documented by [
36]. The RI is also considered to occur at the maximum sustained wind of (MSW) at least 30 knots in 24 hours, as reported by [
37,
38,
39]. The RI of tropical cyclones, referred to as cyclogenesis, is often associated with surface pressure falls by more than about 24 hPa per day, as discussed in [
36] considered in this study.
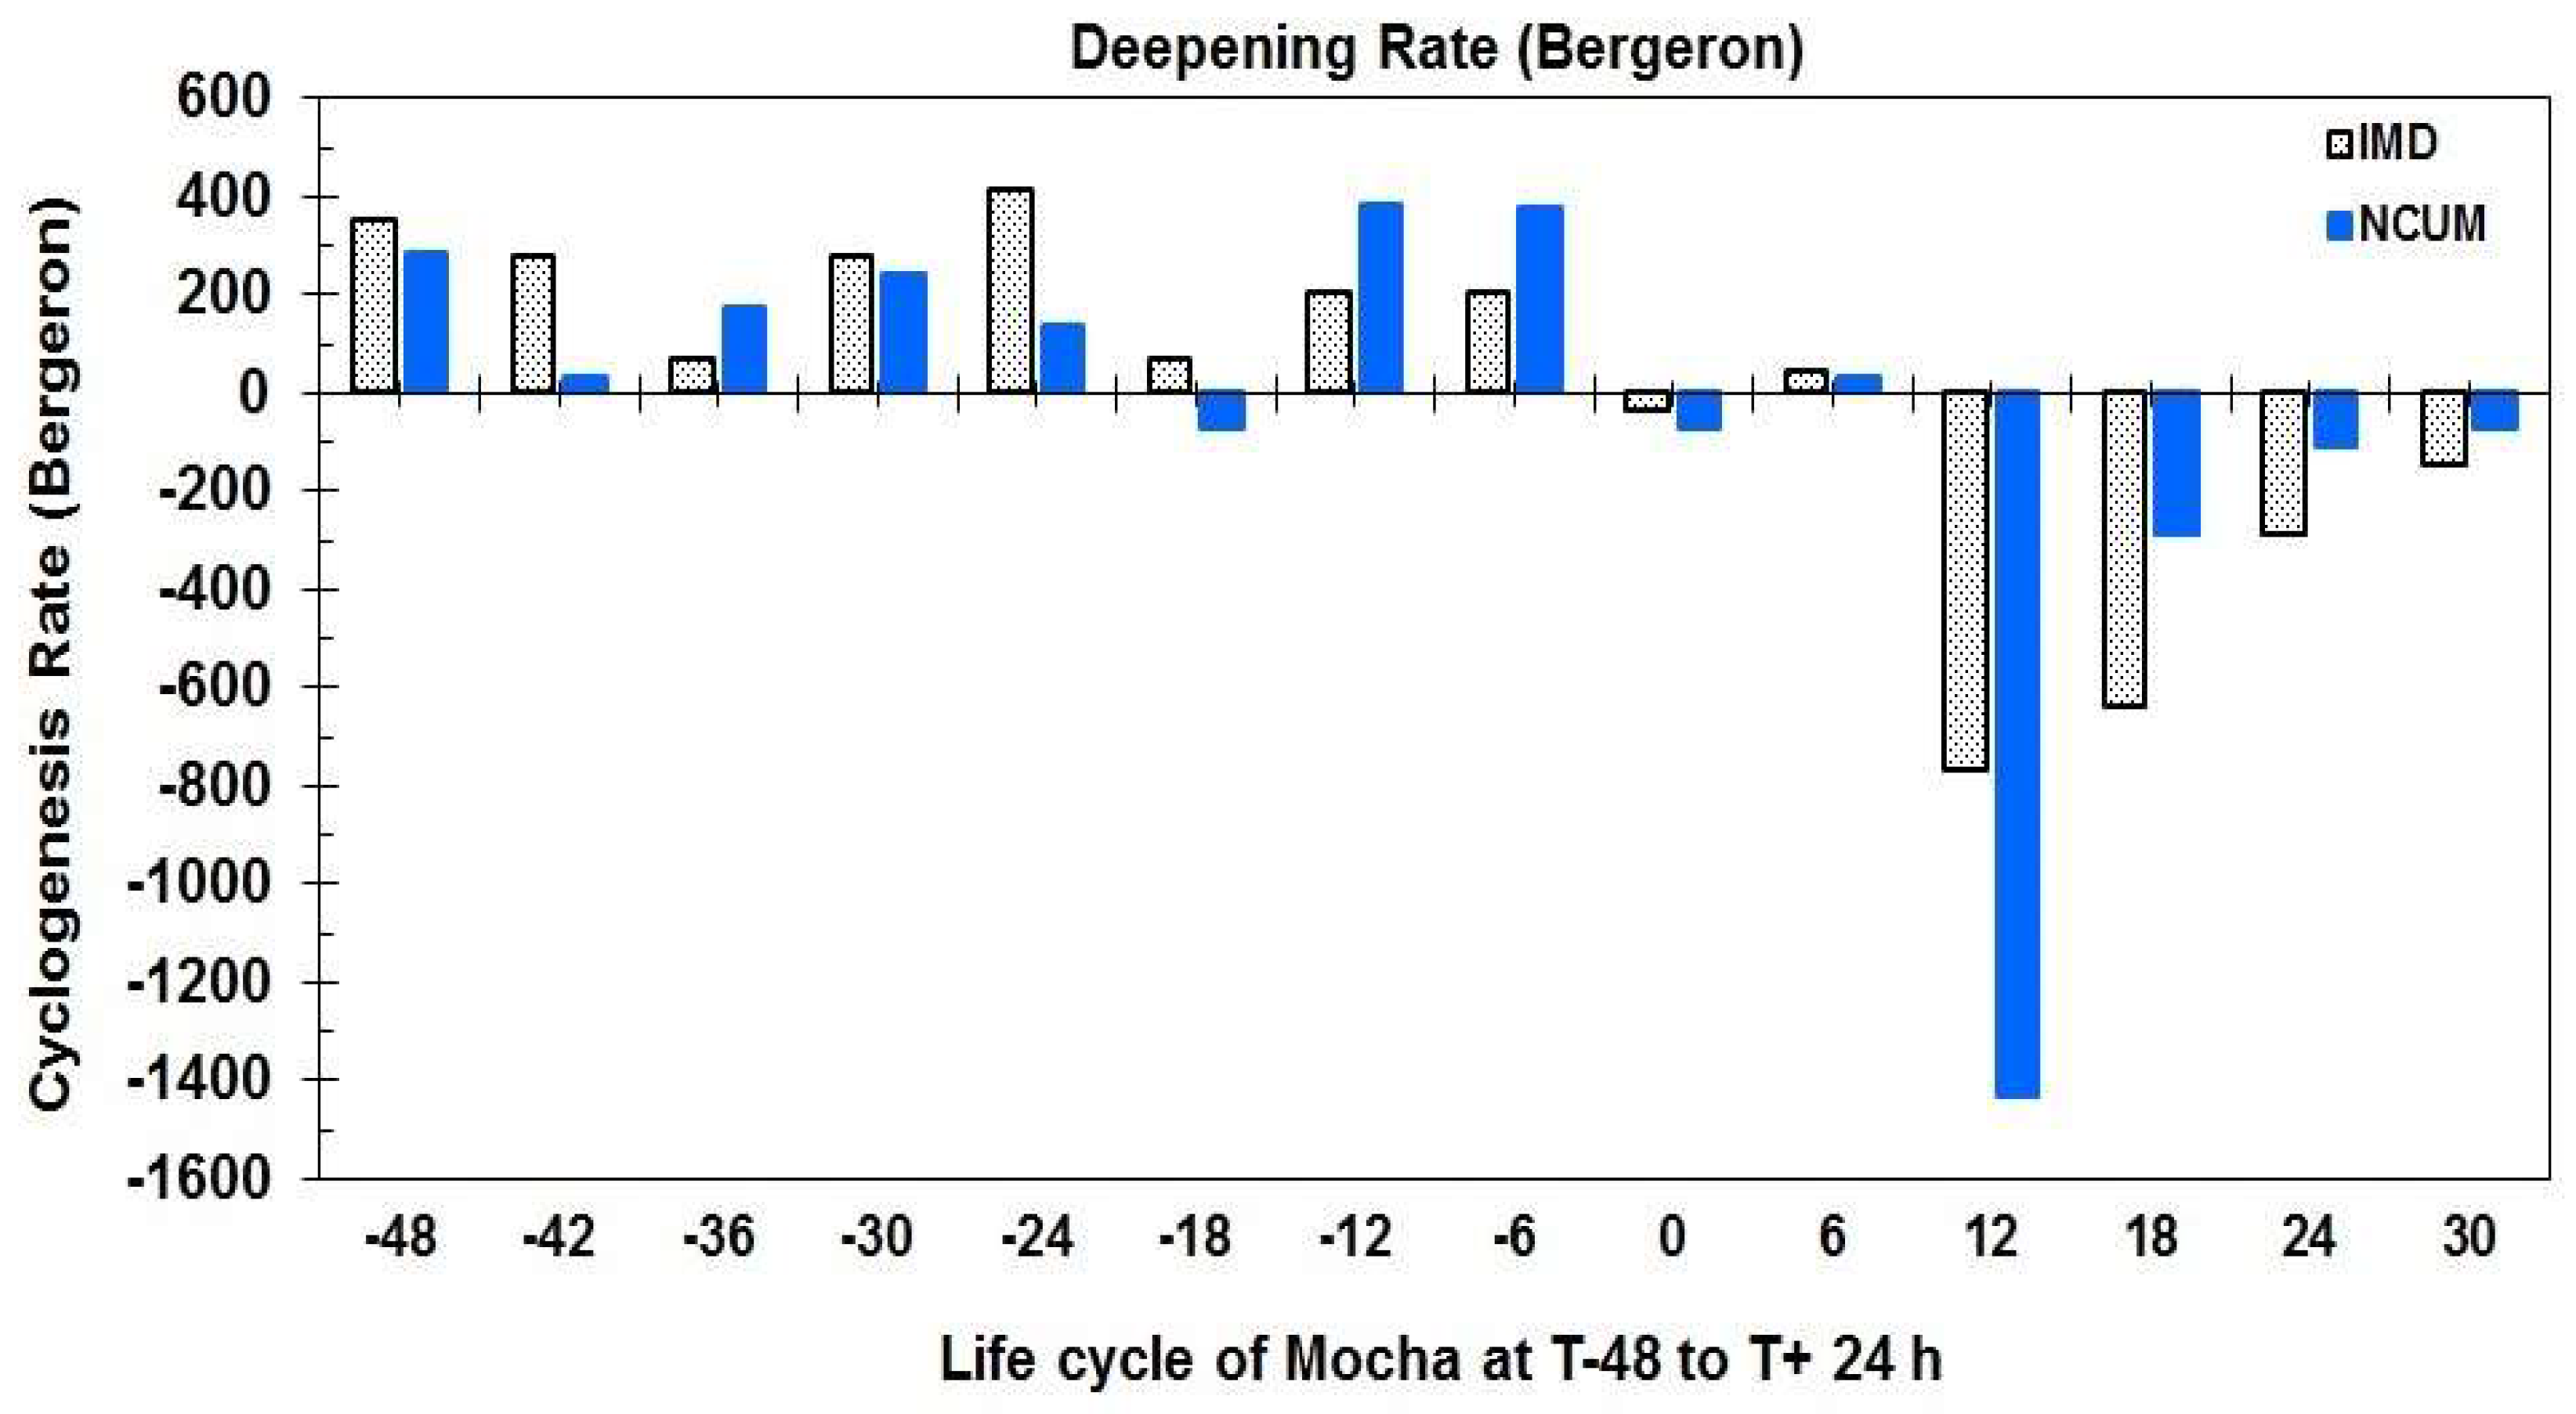
An explosively developing cyclone may perhaps disappear within 24hour after the initial appearance; therefore, 12-hour pressure changes are used in this paper to find the most deepening stage of Mocha.
Following by Yoshida and Asuma (2004); Fu et al., (2014), the maximum cyclogenesis rates have calculated assuming the 12h pressure changes instead of 24h as discussed in equation (1). The RI in terms of cyclogenesis of Mocha is calculated using the following definition as:
where t is the analysed time in hours, p is the central sea level pressure (hPa) and
is the latitudinal position of the cyclone centre. To analysis the cyclogenesis of the Mocha using MSLP field as discussed in equation (1) for different lead simulations of Mocha at 12h-intervals from SCS to ESCS stages, (cyclogenesis and landfall) from 00UTC 12 to 12 UTC 14 May 2023 that appeared over the BoB represented in
Figure 6. The time-series of deepening rate (Bergeron) derived from NCUM analysis validated with IMD observations in
Figure 6. The simulation evolution of deepening rate from the NCUM operational analysis indicates that NCUM initial conditions proficient of capturing the lowest cyclogenesis rate upto -60 Bergeron closely agreeing with IMD value valid on 00 UTC 14 May 2023. Moreover, the -48 and -24 h analysis valid for 00 UTC of 12 and 13 May 2023 produces a higher cyclogenesis rate and, in the series, has intermediate deepening values. For the cyclonic vortex Mocha, NCUM analysis represented sudden pressure drops was started during the 24 h of intensification (from 00 UTC 13 to 00 UTC 14 May 2023) as shown in the time series, and the TC had attained peak intensity between 12 UTC 14 and 06 UTC 15 May 2023 and gradually weakened thereafter. In the time series, the IC of NCUM presented with similar characteristics to IMD observations but successively higher CSLP and lower pressure drops, as shown in
Figure 2 and
Figure 3.
4.3. Circulations and Structure of Mocha During ESCS Stage
(a) MSLP, perceptible water content, and 10m-wind
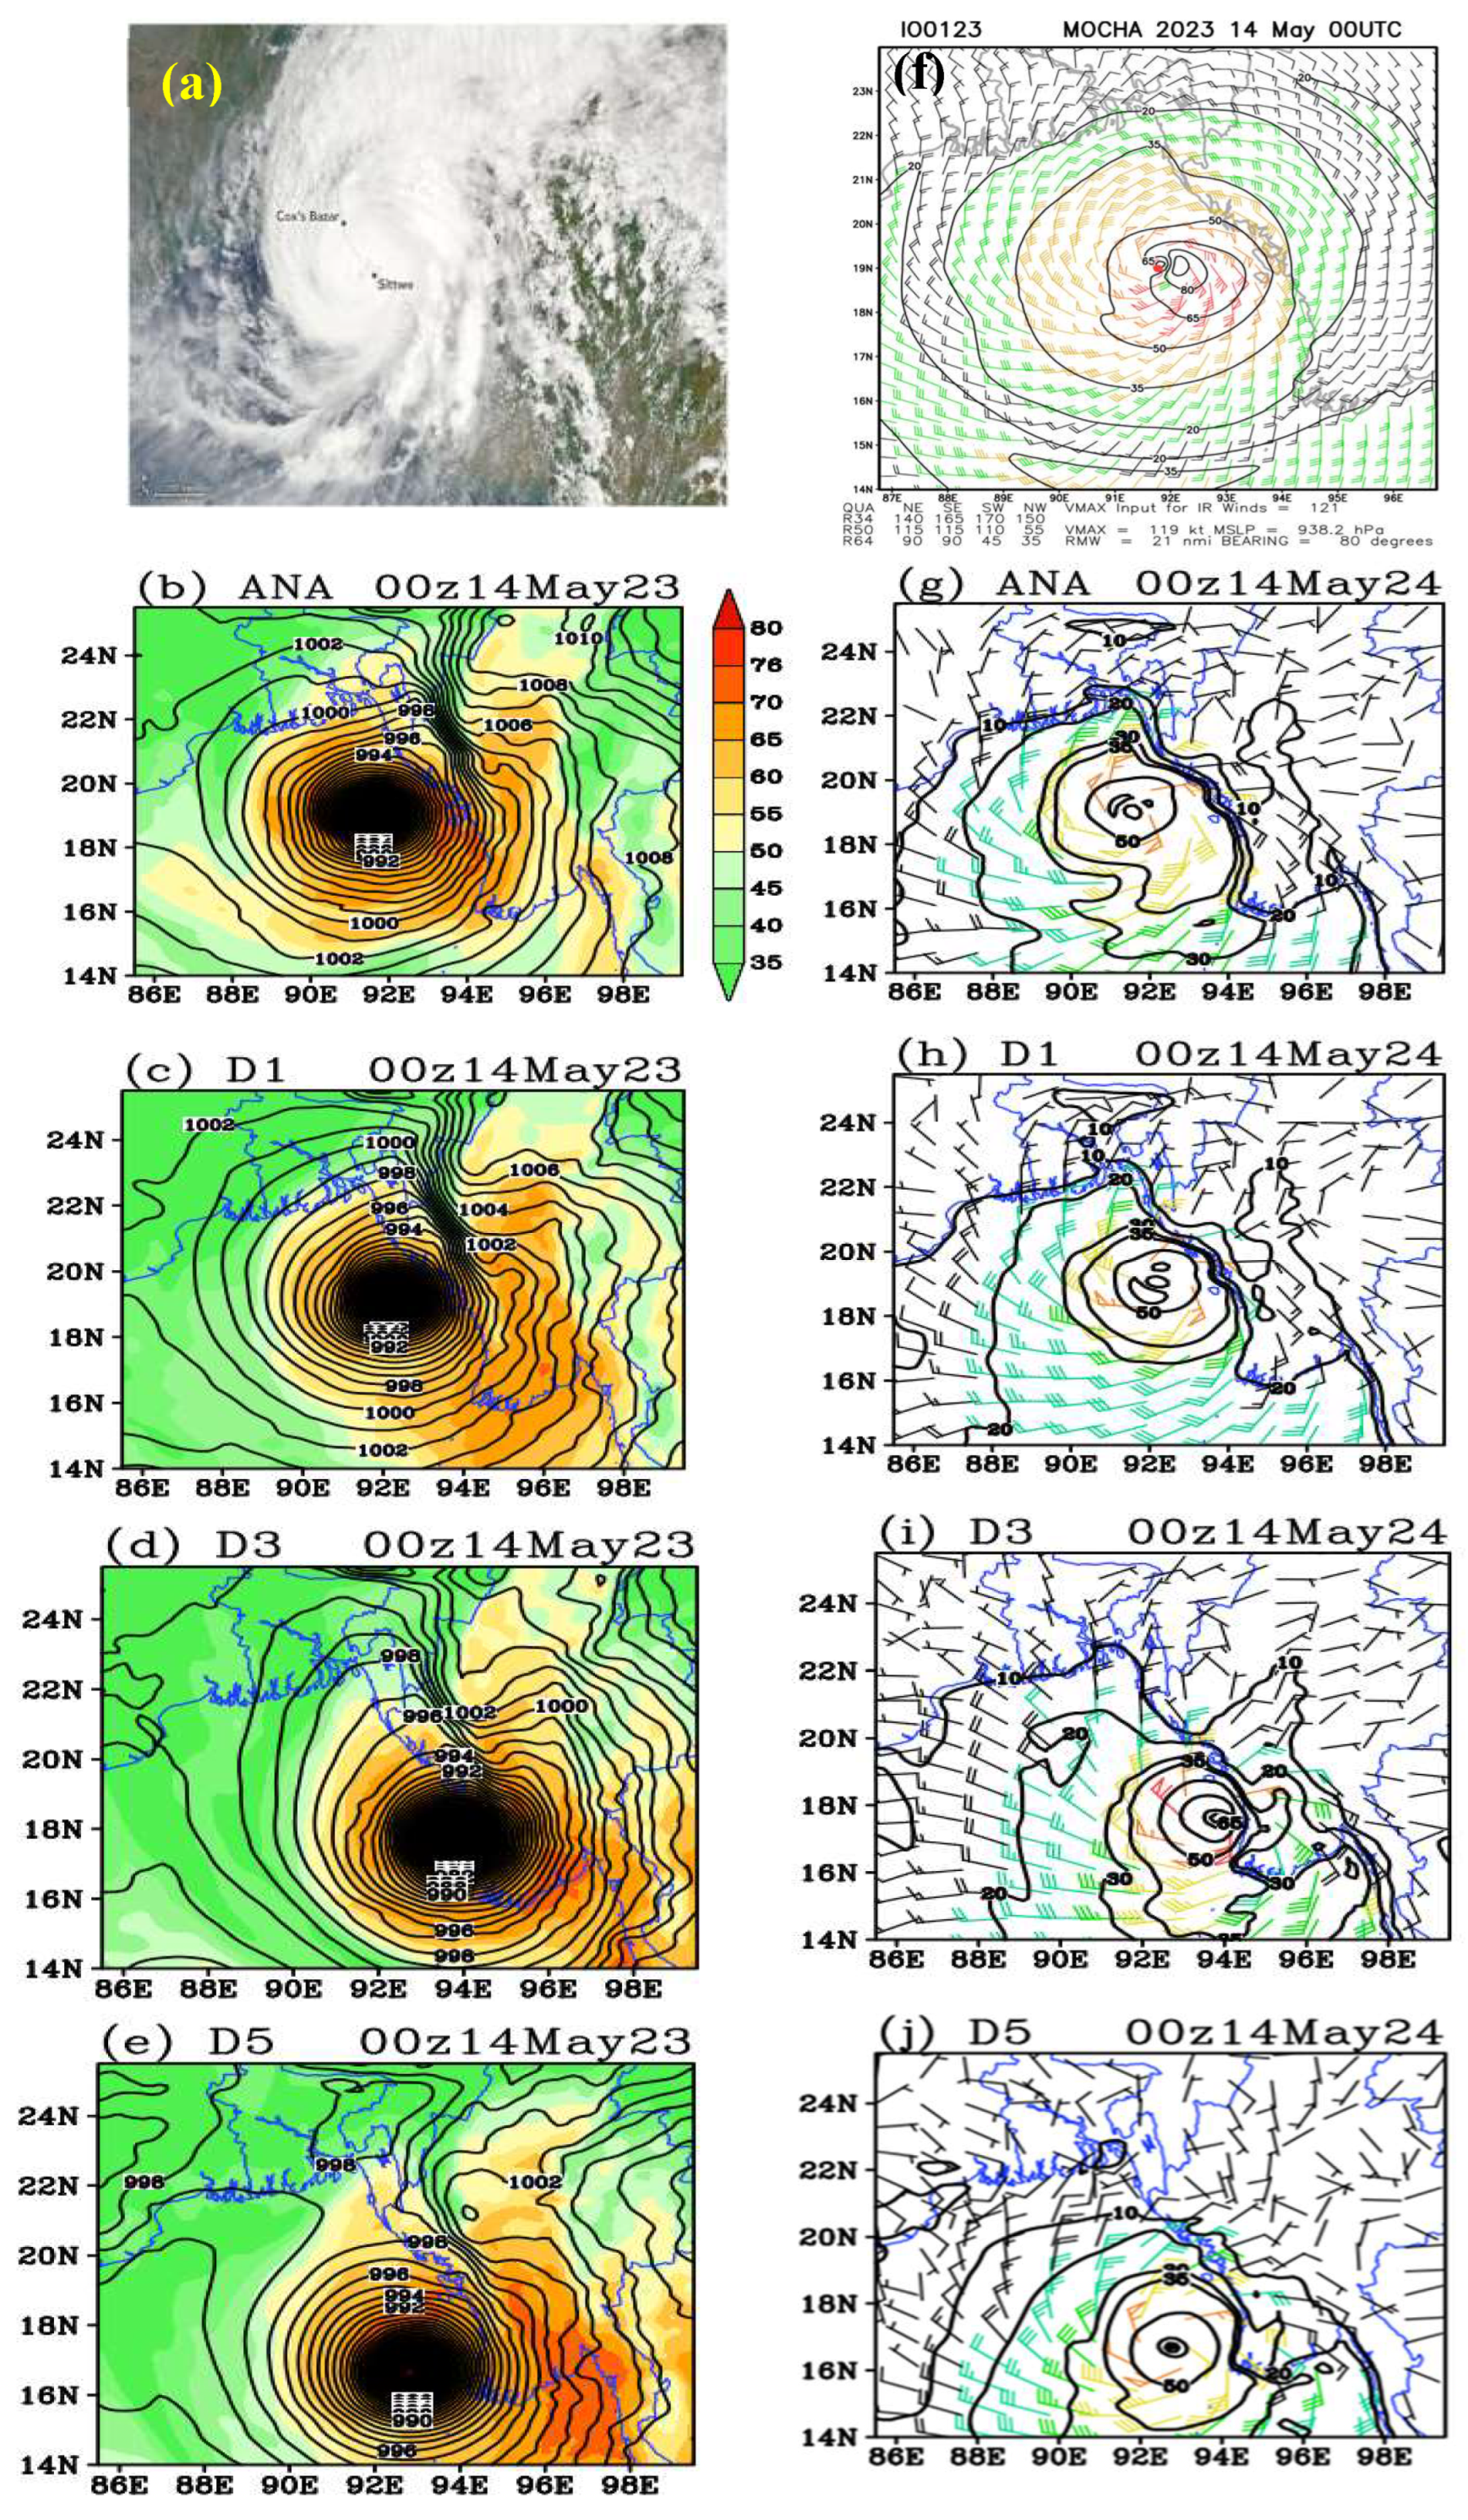
The observed cloud bands, when Mocha reaches the ESCS stage along with MSLP, precipitable water content (TPWC; shaded), and wind at 10m are presented in
Figure 7 (day-1, day-3, and day-5) 24-, 72-, and 120 hours valid on 00 UTC, 14 May 2023. The dense quantity of closed isobars (
Figure 7 c, e, g, i) following the heavier cloud distributions are represented in
Figure 7 (a). The Aqua Tera satellite pictures (NOAA, 2023) show heavily dense clouds aligned around the Mocha cyclone as shown in
Figure 7 (a). Similarly, the simulated organized close isobars (hPa) with the extension of isobars in the northeast and southeast sectors of the Myanmar coast indicate a broken comma structure. The maximum ~80 kg/Kg of total precipitable water content (TPWC; shaded) is revealed in NCUM analysis (
Figure 7b), closely agreeing with the structure of the Aqua Tera satellite image as shown in Figure (7a). Moreover, dense TPWC significantly supportive with lowest MSLP.
Interestingly, the lowest MSLP, along with maximum TPWC, is represented in 24-,72-, and 120-hour forecasts significantly following the wind flow pattern in
Figure 7 (f-j). The position of maximum intensity in terms of TPWC in the 120-hour forecast slightly deviated with location, as captured in the analysis in
Figure 7 (b). Indeed, the forecast 24-hour advance closely agreed with the analysis, whereas 72-and 120-hour forecasts deviated with only position rather than intensity, it can be understood that NCUM model forecast duration significantly depended on the accuracy and substantial improvements of advance data assimilation system, which can significantly improve the IC subsequently the forecast as discussed in [
40].
Subsequently, the comparisons of simulated wind (knots) from the NCUM analysis and different forecasts valid for 24-, 72-, and 120 hours closely agreeing with Aqua Tera cloud imagery and CIRA observations are represented in
Figure 7 (a) and (b). The analysis of 10m-wind indicates a more intensive cyclone revealed in NCUM analysis valid on 00UTC 14 May 2023, closely agreeing with CIRA observations (
Figure 7 b).
The wind near the center of the eyewall formation of Mocha cyclone was well-simulated in NCUM analysis and finely represents the 24-hour forecast (
Figure 7 c). However, the 72- and 120-hour forecasts could predict the same with feeble intense than analysis as well as CIRA observations. The 72- and 120-hour forecast differentiation as arias due to the use of ICs of 00UTC 11 May 2023 and 00UTC 9 May 2023 poorly captures the intensity than observation, while the position of the CSLP region aligns with the wind field mostly deviated from the observations that indicate slow movement of Mocha cyclone towards Myanmar coast.
(b) Wind 850 and 200 hPa
The wind near the center of the eyewall formation of Mocha cyclone was well-simulated in NCUM analysis and finely represents the 24-hour forecast (
Figure 7 c). However, the 72- and 120-hour forecasts could predict the same with feeble intense than analysis as well as CIRA observations. The 72- and 120-hour forecast differentiation as arias due to the use of ICs of 00UTC 11 May 2023 and 00UTC 9 May 2023 poorly captures the intensity than observation, while the position of the CSLP region aligns with the wind field mostly deviated from the observations that indicate slow movement of Mocha cyclone towards Myanmar coast.
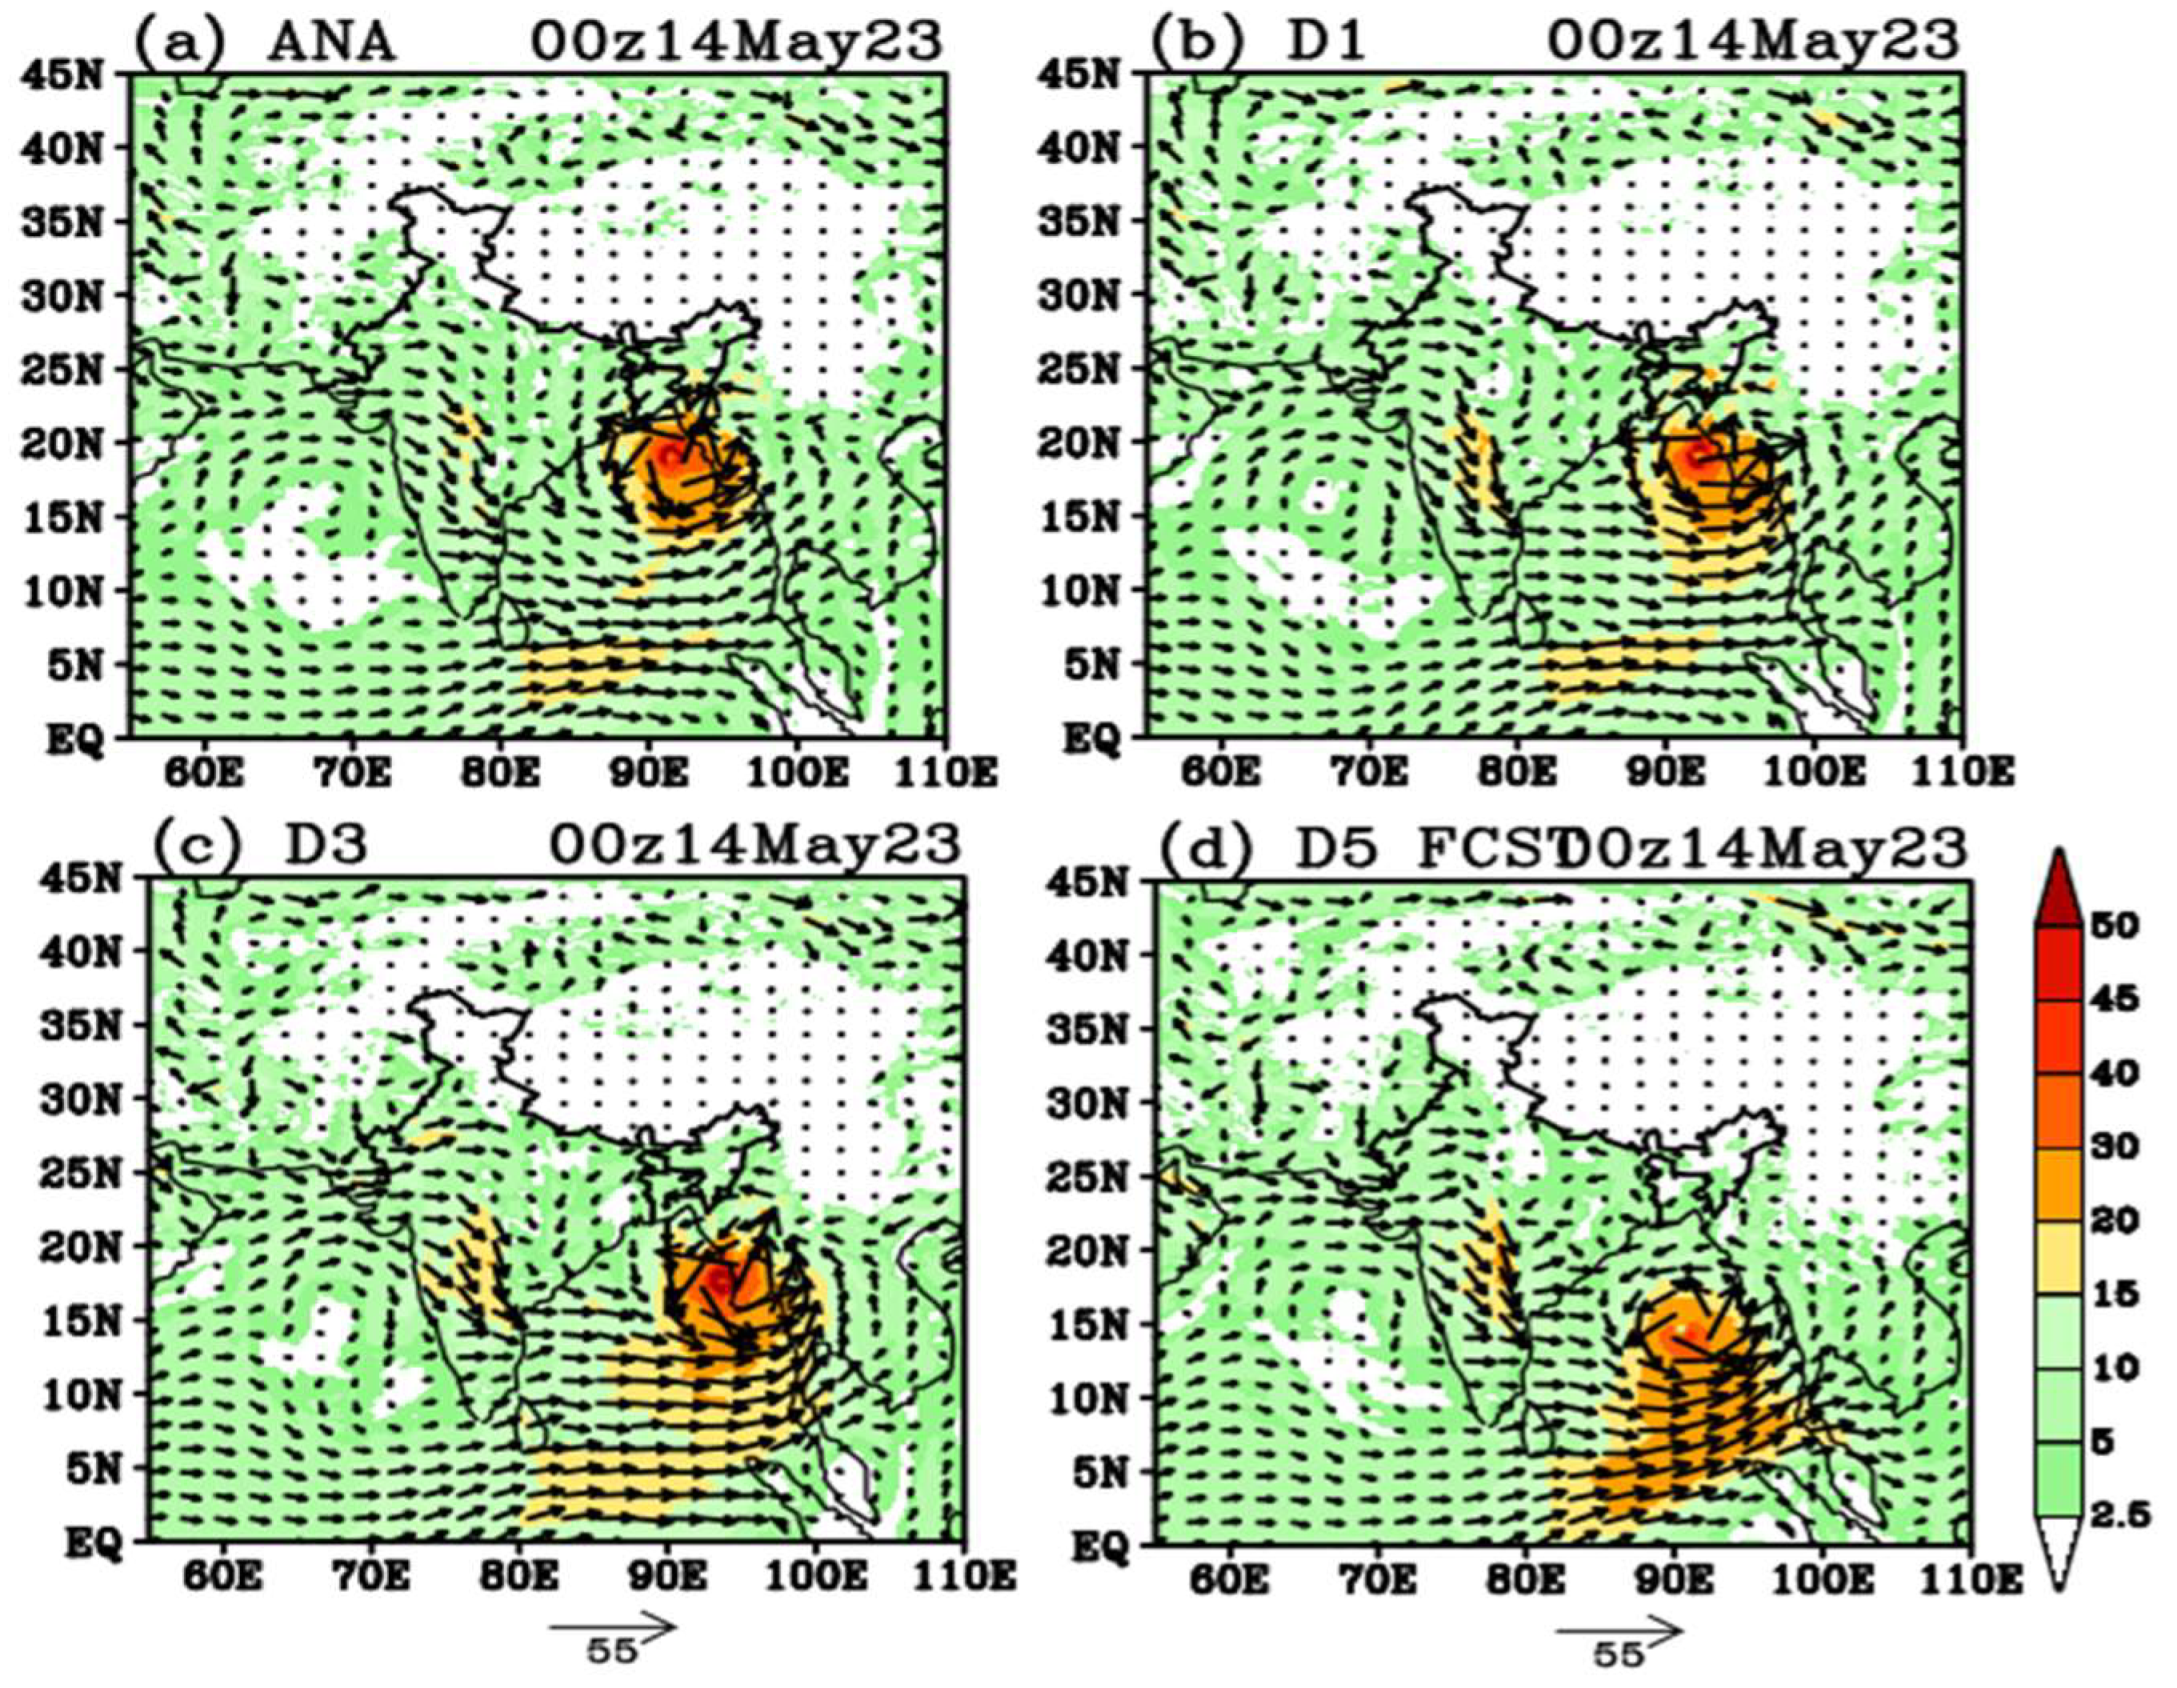
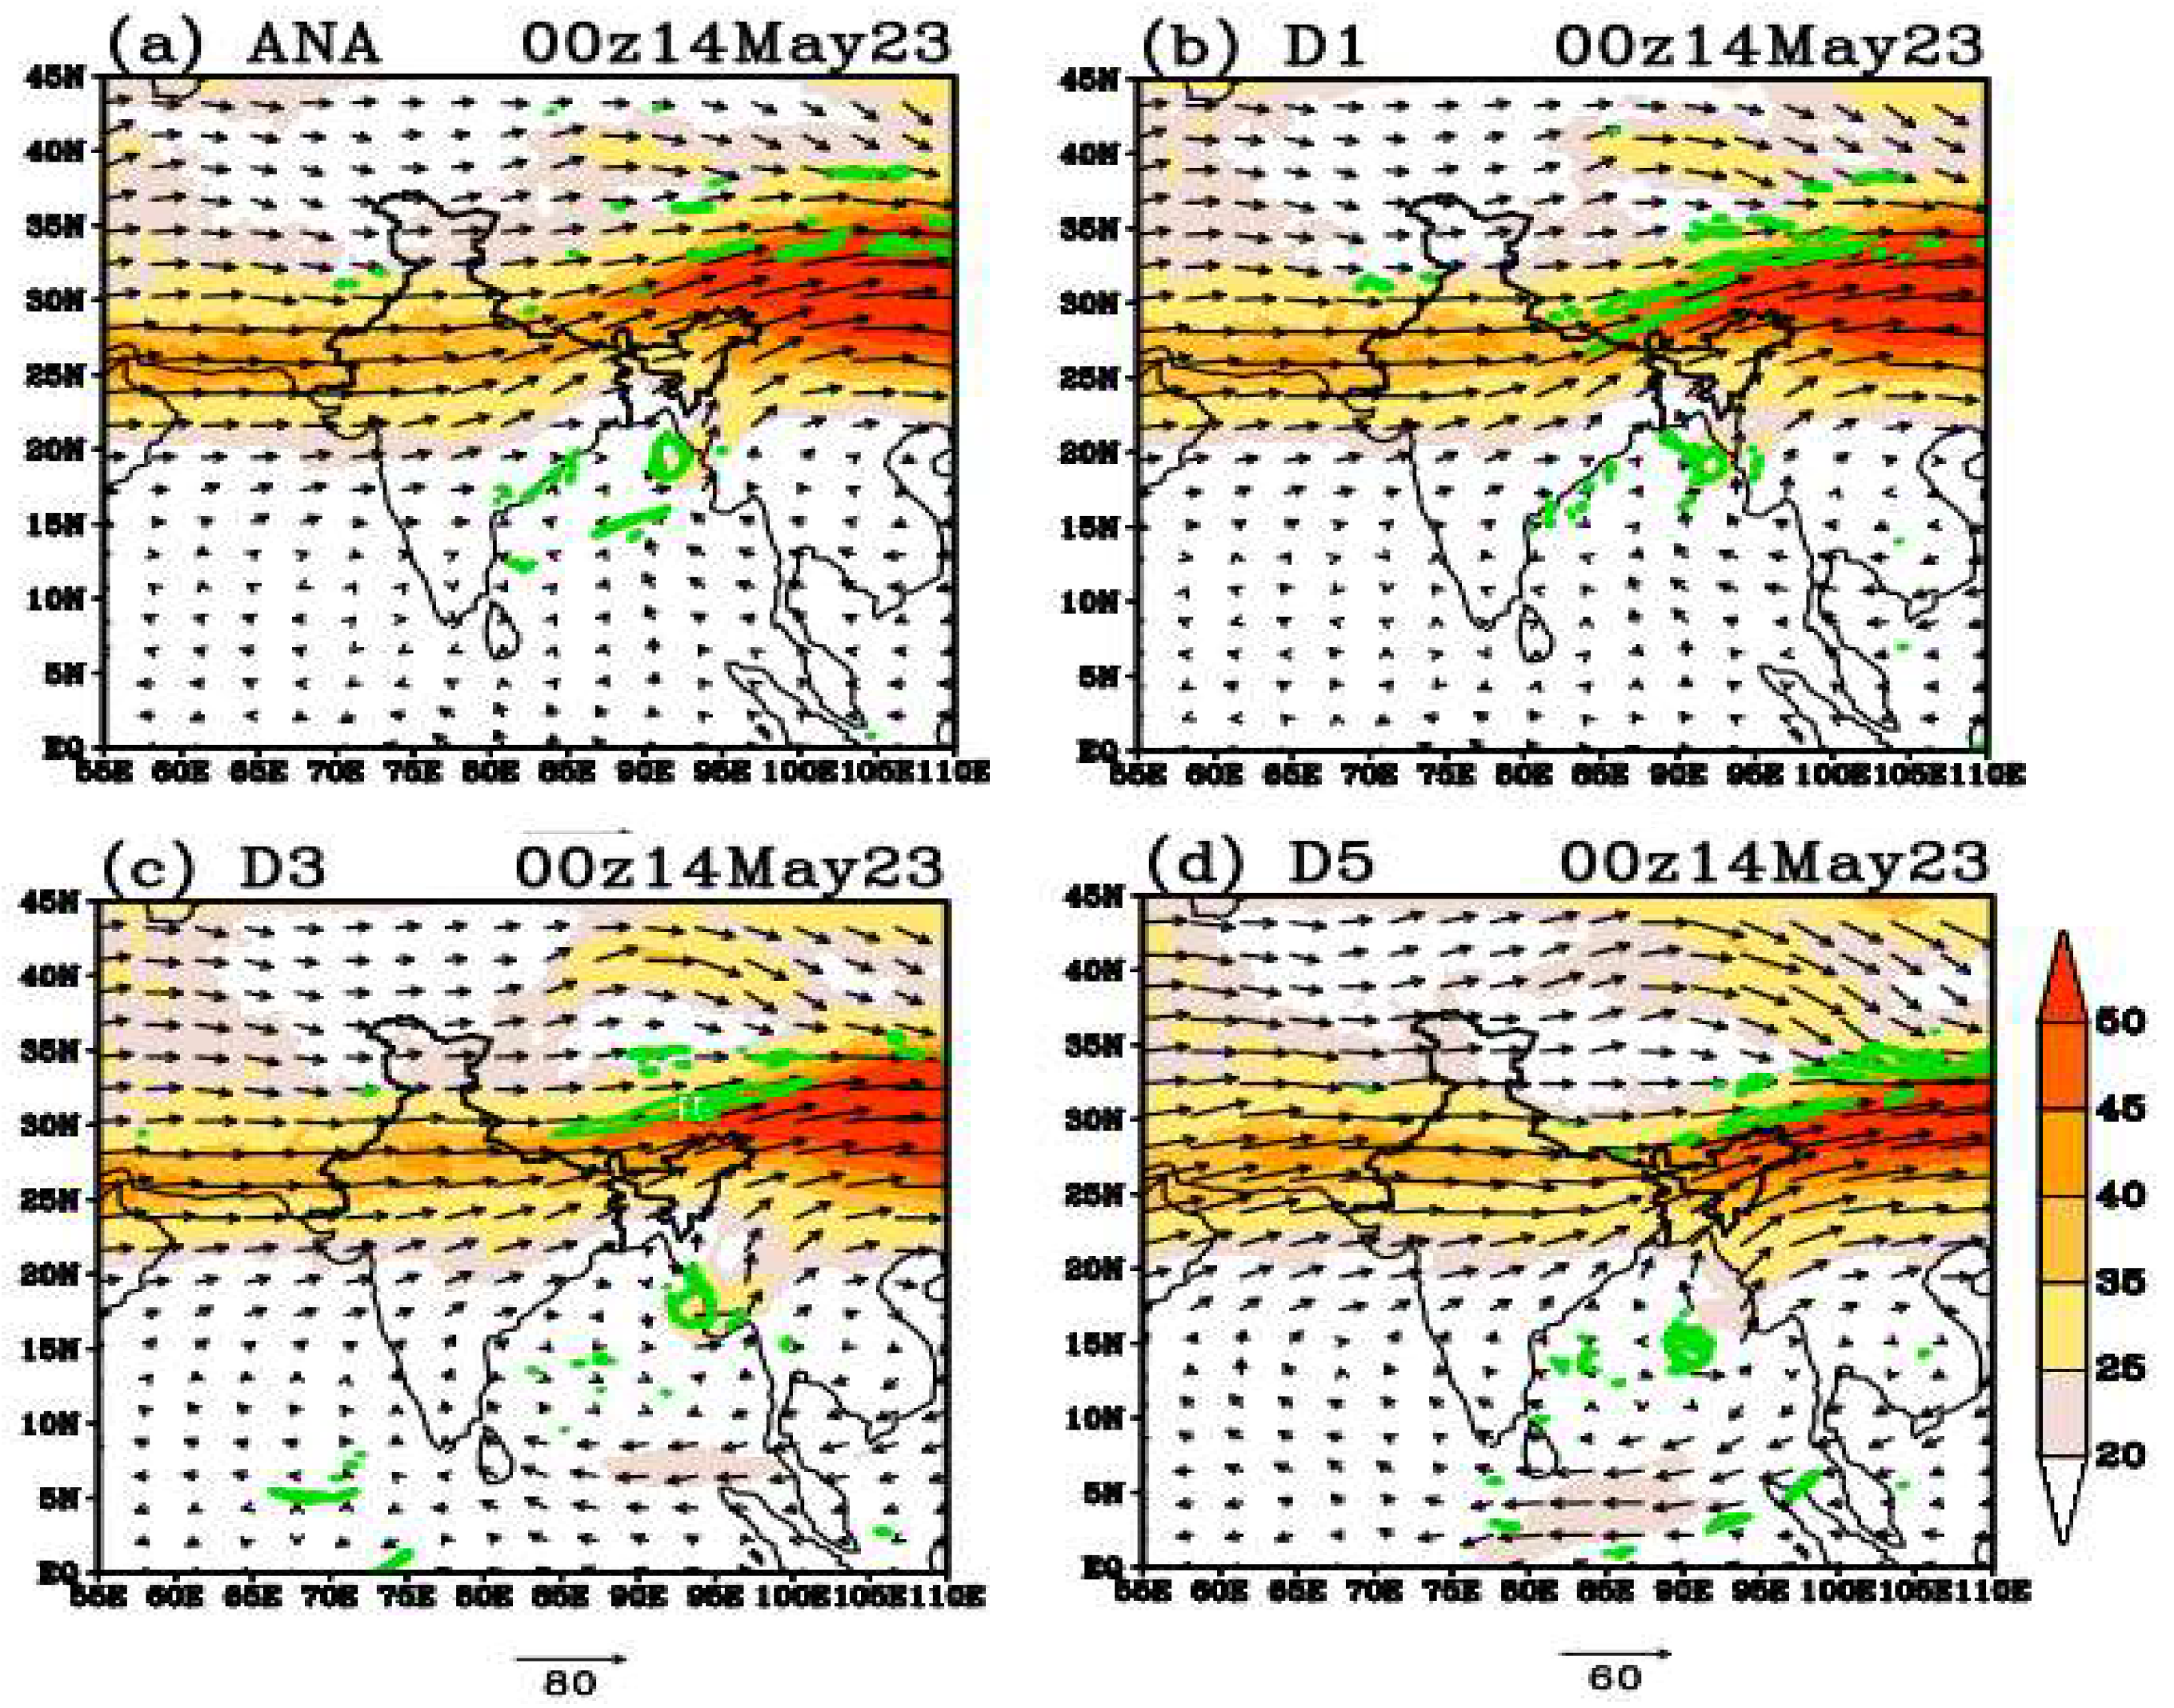
The wind speed (shaded; ms
-1) and direction at 850 hPa levels derived from NCUM analysis and 24-, 72- and 120-hour forecast are shown in
Figure 7 (a-d). The wind flow patterns over the BoB are intensified along the coast of Myanmar as represented in analysis (Fig 7 a); a similar representation of wind intensity is also revealed in 24- and 72-hour forecasts (
Figure 8 (b) and (c)). However, the 120-hour forecast showed less intensification and the location slight discrepancy from the analysis as the vortex slowly progressed towards the Myanmar coast, particularly located near central BoB around 15.2
o N; 90
o E.
In brevity, the intensity and position of the vortex with 24- and 72-hour forecasts closely agree with NCUM analysis (
Figure 8 a). Subsequently, Fig 8 (a-d) is the same as
Figure 7, but with wind field (shaded) and vorticity (contour; green) at 200 hPa level. The westerly flow pattern was significantly noticed above 20.0
o N and ridge over the Tibetan plateau. The maximum wind speed of 80 ms
-1 was significantly confined at 100
o E and further extended eastward directions. The wind speed and direction in 24-, 72-, and 120-hour forecasts closely resemble the analysis at 200hPa level, as shown in
Figure 8.
(c) Vertical structure
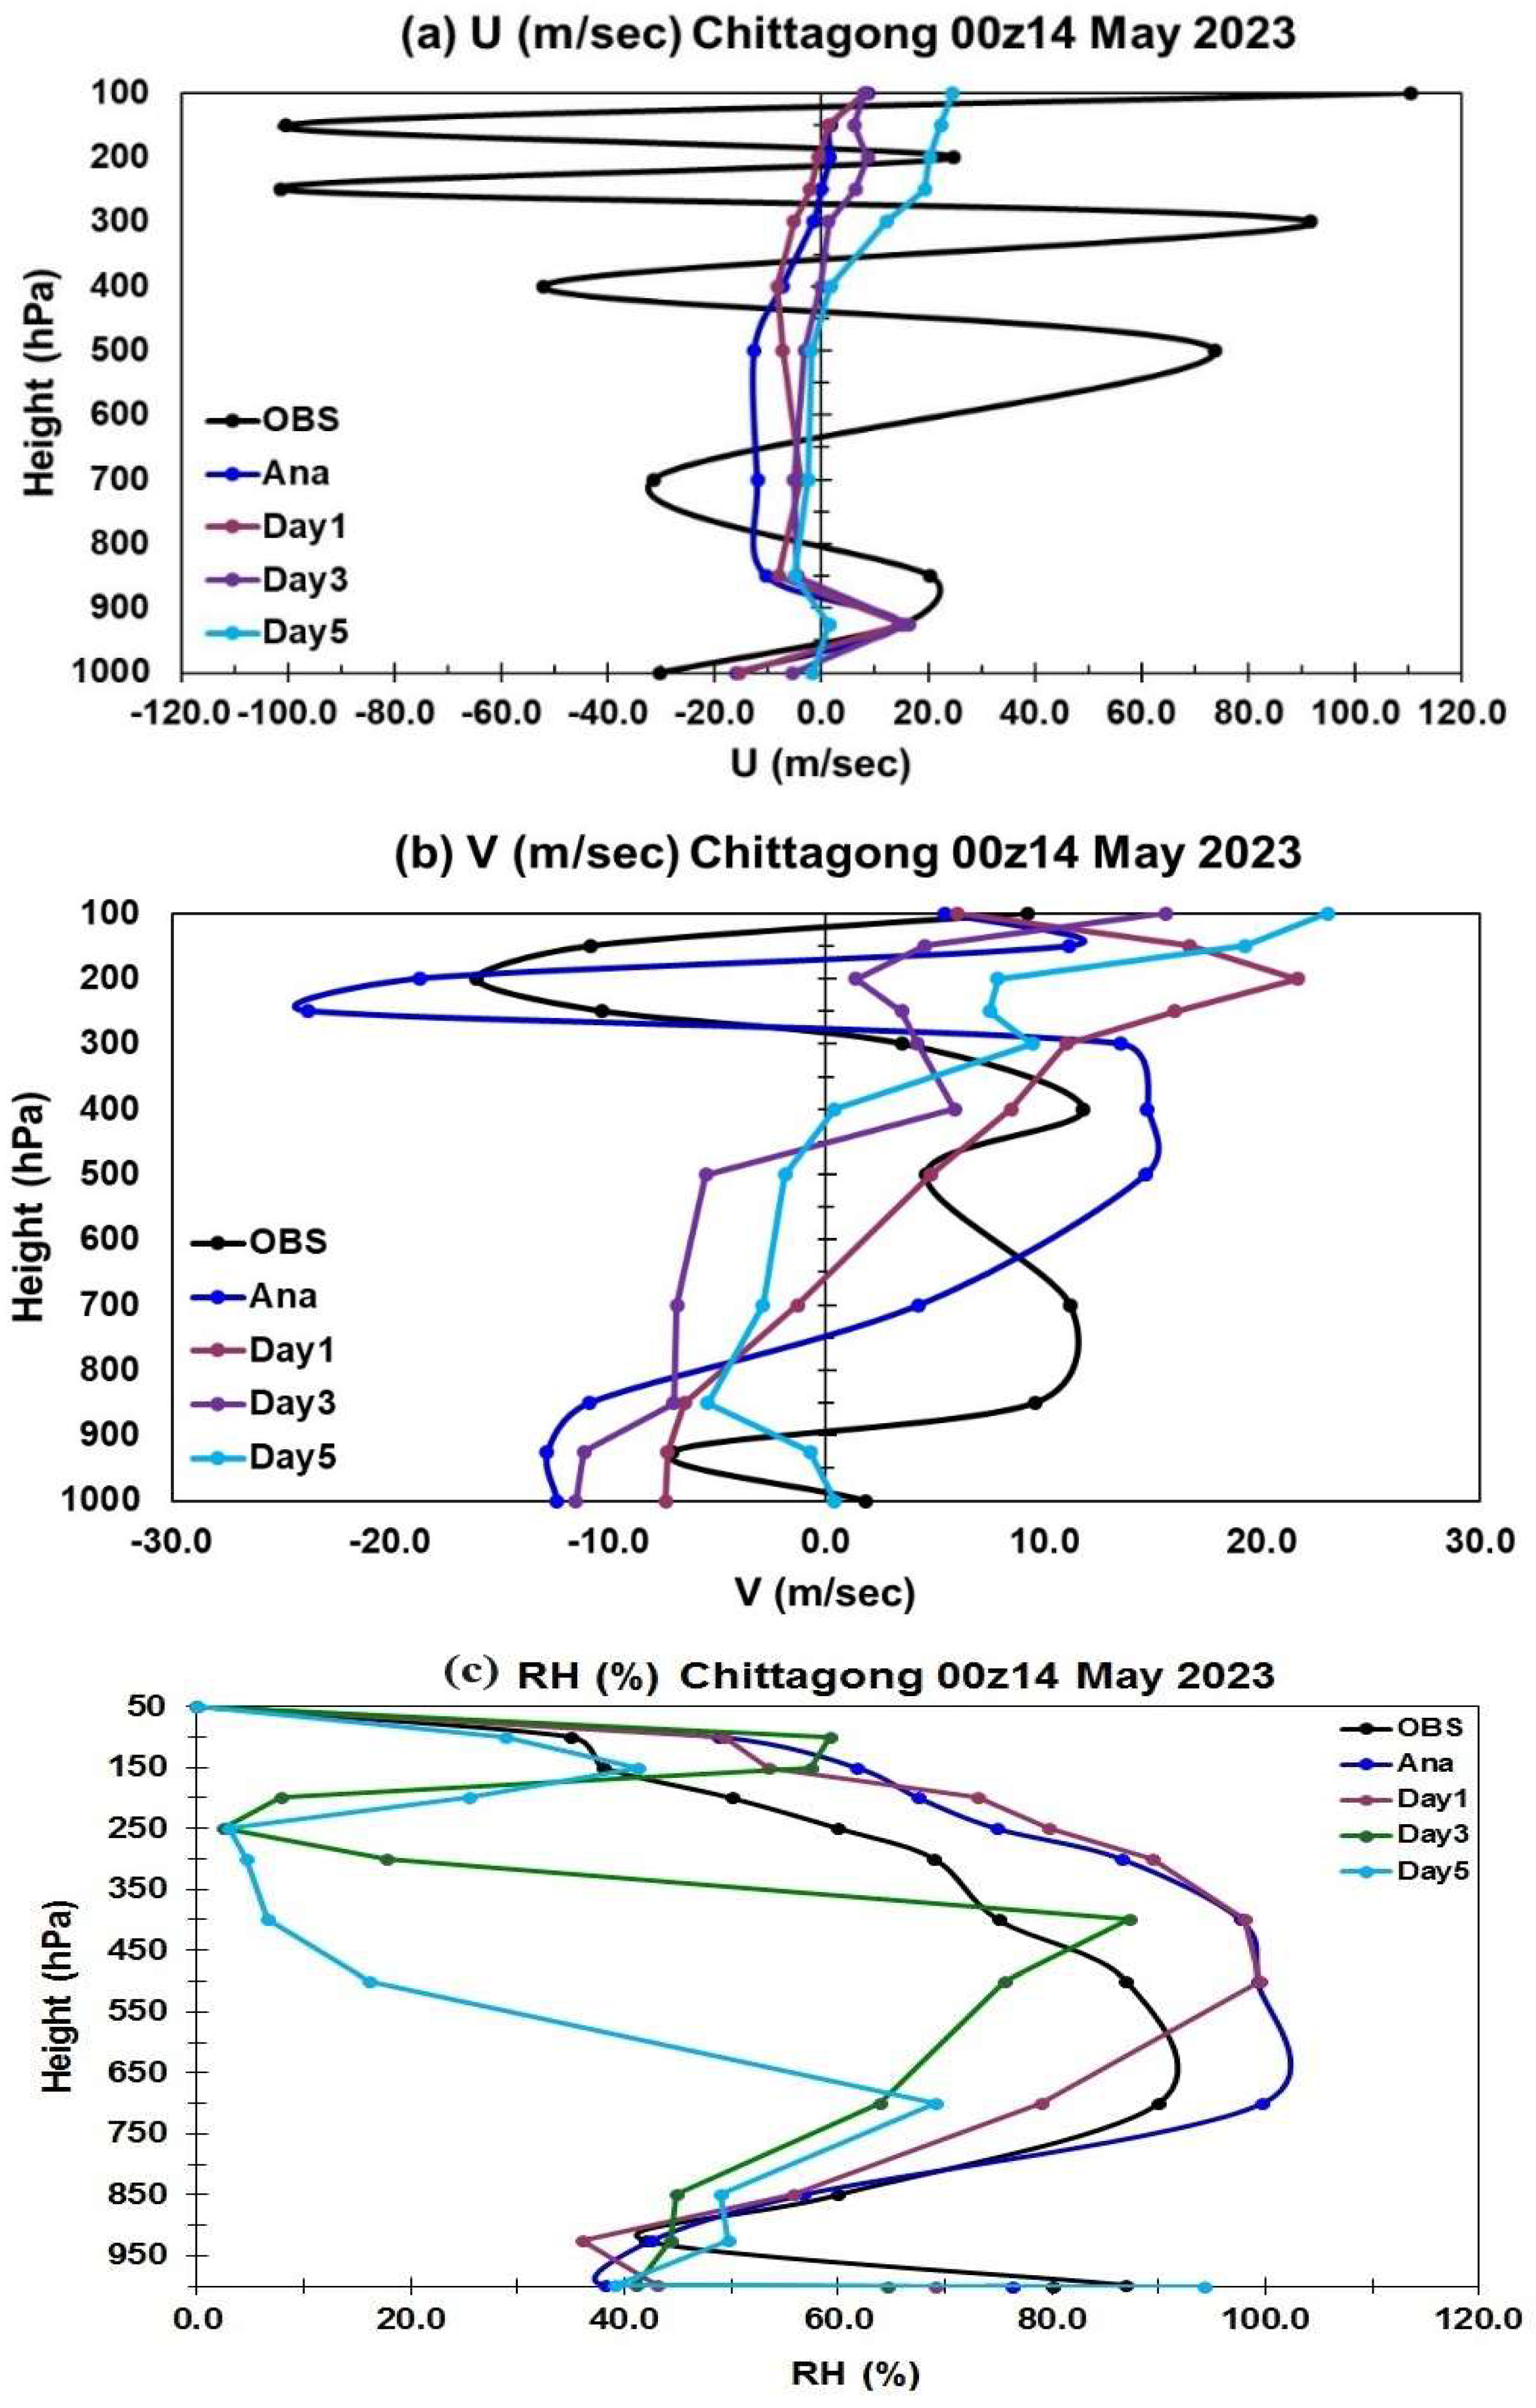
The dynamical characteristic of pre-monsoon storms during the landfall period is very important to study because of the RI stage of the Mocha cyclone, thus vertical structure is very important. In this section, a zonal cross-section of u and v wind components (ms
-1) along with relative humidity at the center of the Mocha are analyzed at Chittagong station to understand the core structures of the pre-monsoon storms shown in
Figure 10 (a-c). The 24-hour forecast u and v component based on ICs valid for 00UTC 14 May 2023, shows greater intensity than in 72- and 120-h lead time at lower tropospheric level (1000-800 hPa levels).
However, 72- and 120-hour wind component forecast above 800 hPa level neither match with observation nor with the analysis. The
Figure 10 (c) represents the relative humidity profile of the Mocha cyclone at ESCS stage showing above 80% of moisture from surface to middle atmosphere. The analysis and 24-hour forecast are successfully simulating the RH with an enhancement than observations. Anyone notice that, 72-hour forecast consistently coinside with the observations 300 hPa level and sharp decrease upper troposphere, whereas 120-hour forecast unable to represent as shown in analysis.
4.4. Dynamical Mechanism for Cyclogenesis and Multiple Recurvature
(a) Q-vector analysis
In an attempt to understand the dynamical mechanism which is responsible for surface cyclogenesis, associated with vertical motion fields discussed by [
41]. The convergence of the Q-vector identifies regions of quasi-geostrophic forcing for ascending motion. [
42] suggested that quasi-geostrophic diagnostic field divergence (Q-vector) fields, one of the most significant parameters, could be used to access vertical motion fields linked to precipitation.
Using a Q-vector also gives a more complete and meaningful solution of the direction of vertical motion, southerly flow, and warm advection induce an upward motion. In contrast, northerly flow and cold advection induce a downward motion. Moreover, for frictionless, these vertical motions are forced by differential vorticity advection, causing the low to be stretched and vorticity around the system to be increased ([
43]). The Q-vector convergence and Q vector demonstrate the potency of this upper-tropospheric wave in affecting lower- to middle-tropospheric ascent and associated surface cyclogenesis ([
44]). As per the ƒ-plane quasigeostrophic theory, the Q vector is defined as:
where, a constant reference value of the potential temperature, the horizontal geostrophic wind, the horizontal gradient operator on a constant pressure surface, and the potential temperature and is acceleration of gravity.
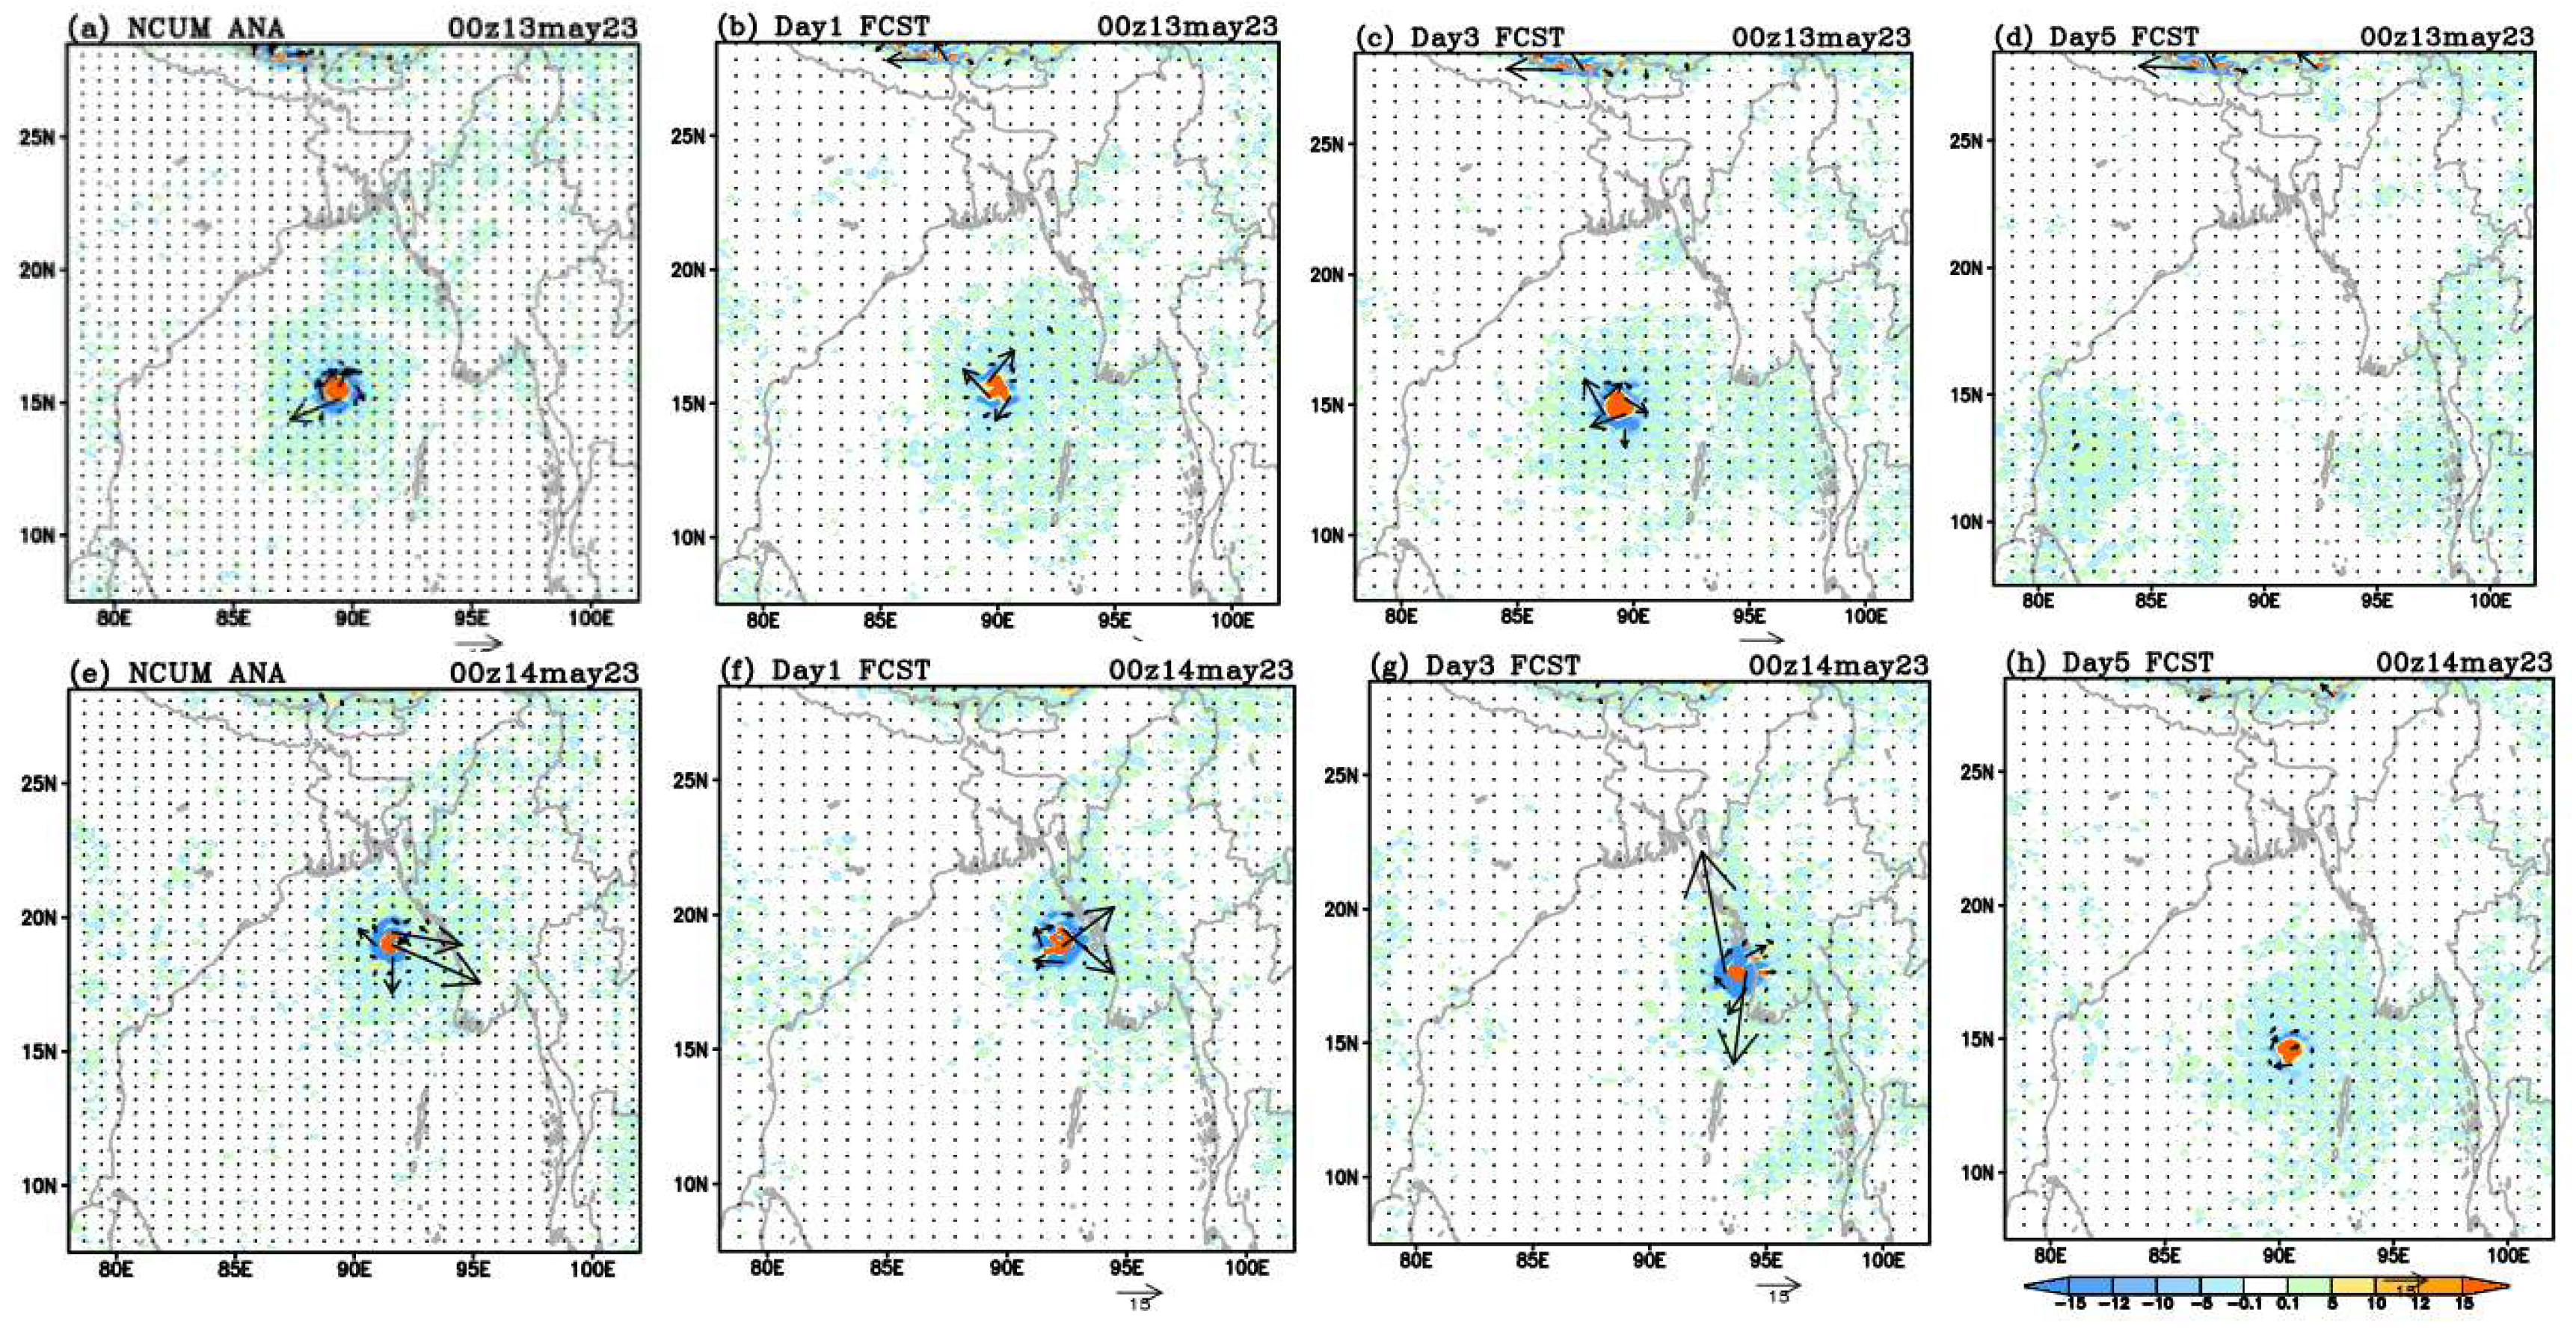
The column-averaged Q vectors and convergence at 850 hPa over the west sector and east sector represented in
Figure 11 (a-d) indicate the strength of the lower tropospheric ascent that affected and associated surface cyclogenesis on 00 UTC of 13-14 May 2023. The region of convergence and divergence is represented with positive and negative values of Q-vector in the upper panel of
Figure 11 (a-d) valid for 00 UTC 13 May 2023. The positive and negative Q-vector values are revealed at the center and surrounding the Mocha cyclone in analysis, 24-, and 72- hour forecast around 15 N; 90 E. That clearly indicates large-scale convergence surrounded by a divergence and subsidence of cold air on the southwest side of the Mocha on 00 UTC 13 May 2023, which comparatively resembles (MSLP) close isobars as discussed in
Figure 7 (b), but the convergence and divergence poorly depicted in 120-hour forecast in
Figure 11 (d). The lowe panel of
Figure 11 (e-h) shown the Q-vector valid on 00UTC 14 May 2023, However, the ascending of warm airflow is clearly indicated on the northeast side as well as surrounded by the low-pressure system that close to the Mynmar coast as depicted in analysis (
Figure 11e). Similar features of convergence and divergence along the westcoast of Myanmar in analysis, 24- and 72-hour forecast in
Figure 11 (e), (f) and (g), whereas 120-hour forecast couldn’t capture the same as analysis (
Figure 11h).
(b) Large-scale flow
The TC motion is mainly caused by the large-scale steering flow, as discussed by [
15]. If the flow in which a TC is embedded is gradually evolving, persistence can be important in forecasting of the TC track in the first 24 to 48-hour advance. Thus, an attempt has been made to analyze the steering flow (SF), as in the operational center, the global model is not designed explicitly to forecast the sudden changes of the TC track. The SF is a large-scale feature that can be used for TC forecast. Based on the intensity, the appropriate steering environment layers are determined, and details are discussed in [
16].
Where W850, W500, and W200 wind flow (ms-1) at 850, 500, and 200 hPa levels.
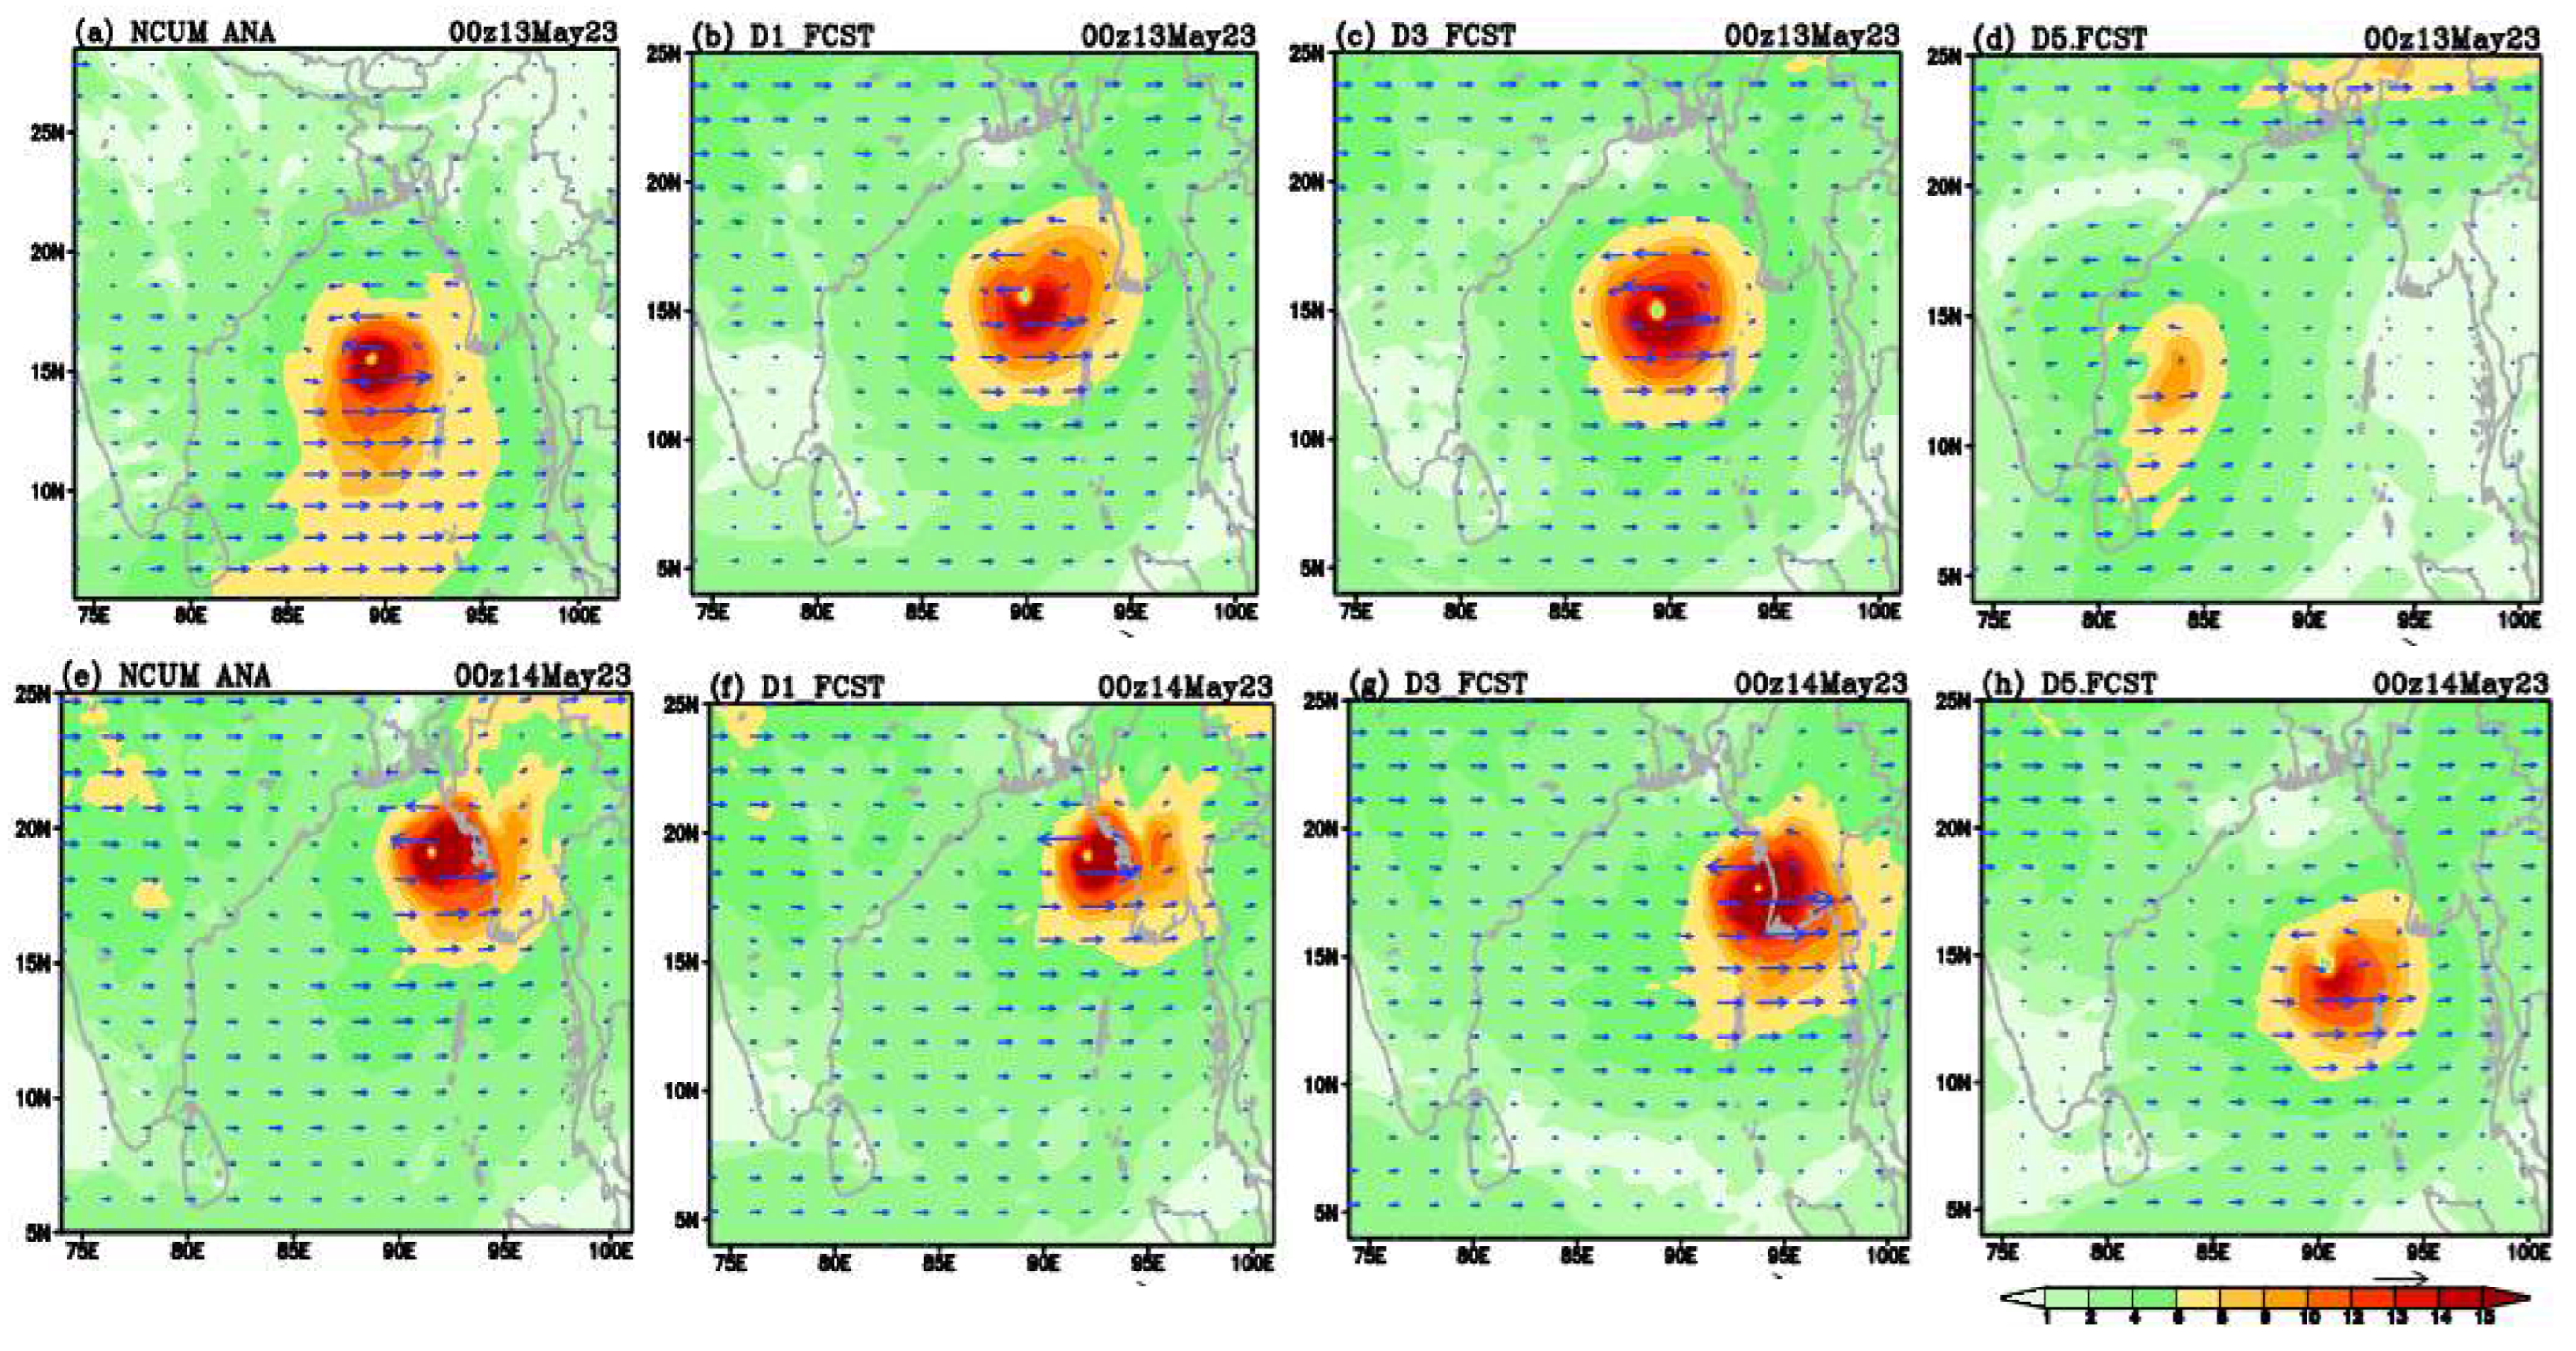
Figure 12 (a-d) and (e-h) represent the SF valid on 00 UTC of 13-14 May 2023. The upper panel of
Figure 12 (a-d) shows the SF of Mocha when it was at the VSCS stage, valid 00 UTC on 13 May 2023.
Figure 12 (a), the NCUM analysis clearly shows the well-organized and intense eastward SF and maximum intensity of 15 ms
-1 revealed in the NCUM operational analysis valid on 00 UTC13 May 2023. Similarly, the 24-, 72-, and 120-hour NCUM forecast of SF (
Figure 12 b, c, and d) comparatively agree with the analysis (
Figure 12a). Anyone can notice the SF features in the 24- and 72-hour forecasts are valid on 00 UTC 14 May 2023 well agreeing with the analysis. In contrast, the 120-hour forecast predicts the SF at Tamilnadu coast (
Figure 12d), far away from the vortex position as shown in the satellite Figure (2). The location and intensity of SF significantly deviated in the 120-hour forecast (
Figure 12h) valid on 00UTC 14 May 2023. The eyewall structure is clearly represented in 24- and 48-hour forecasts, as compared to the 120-hour forecasts; it may arise due to the quality of the initial conditions.
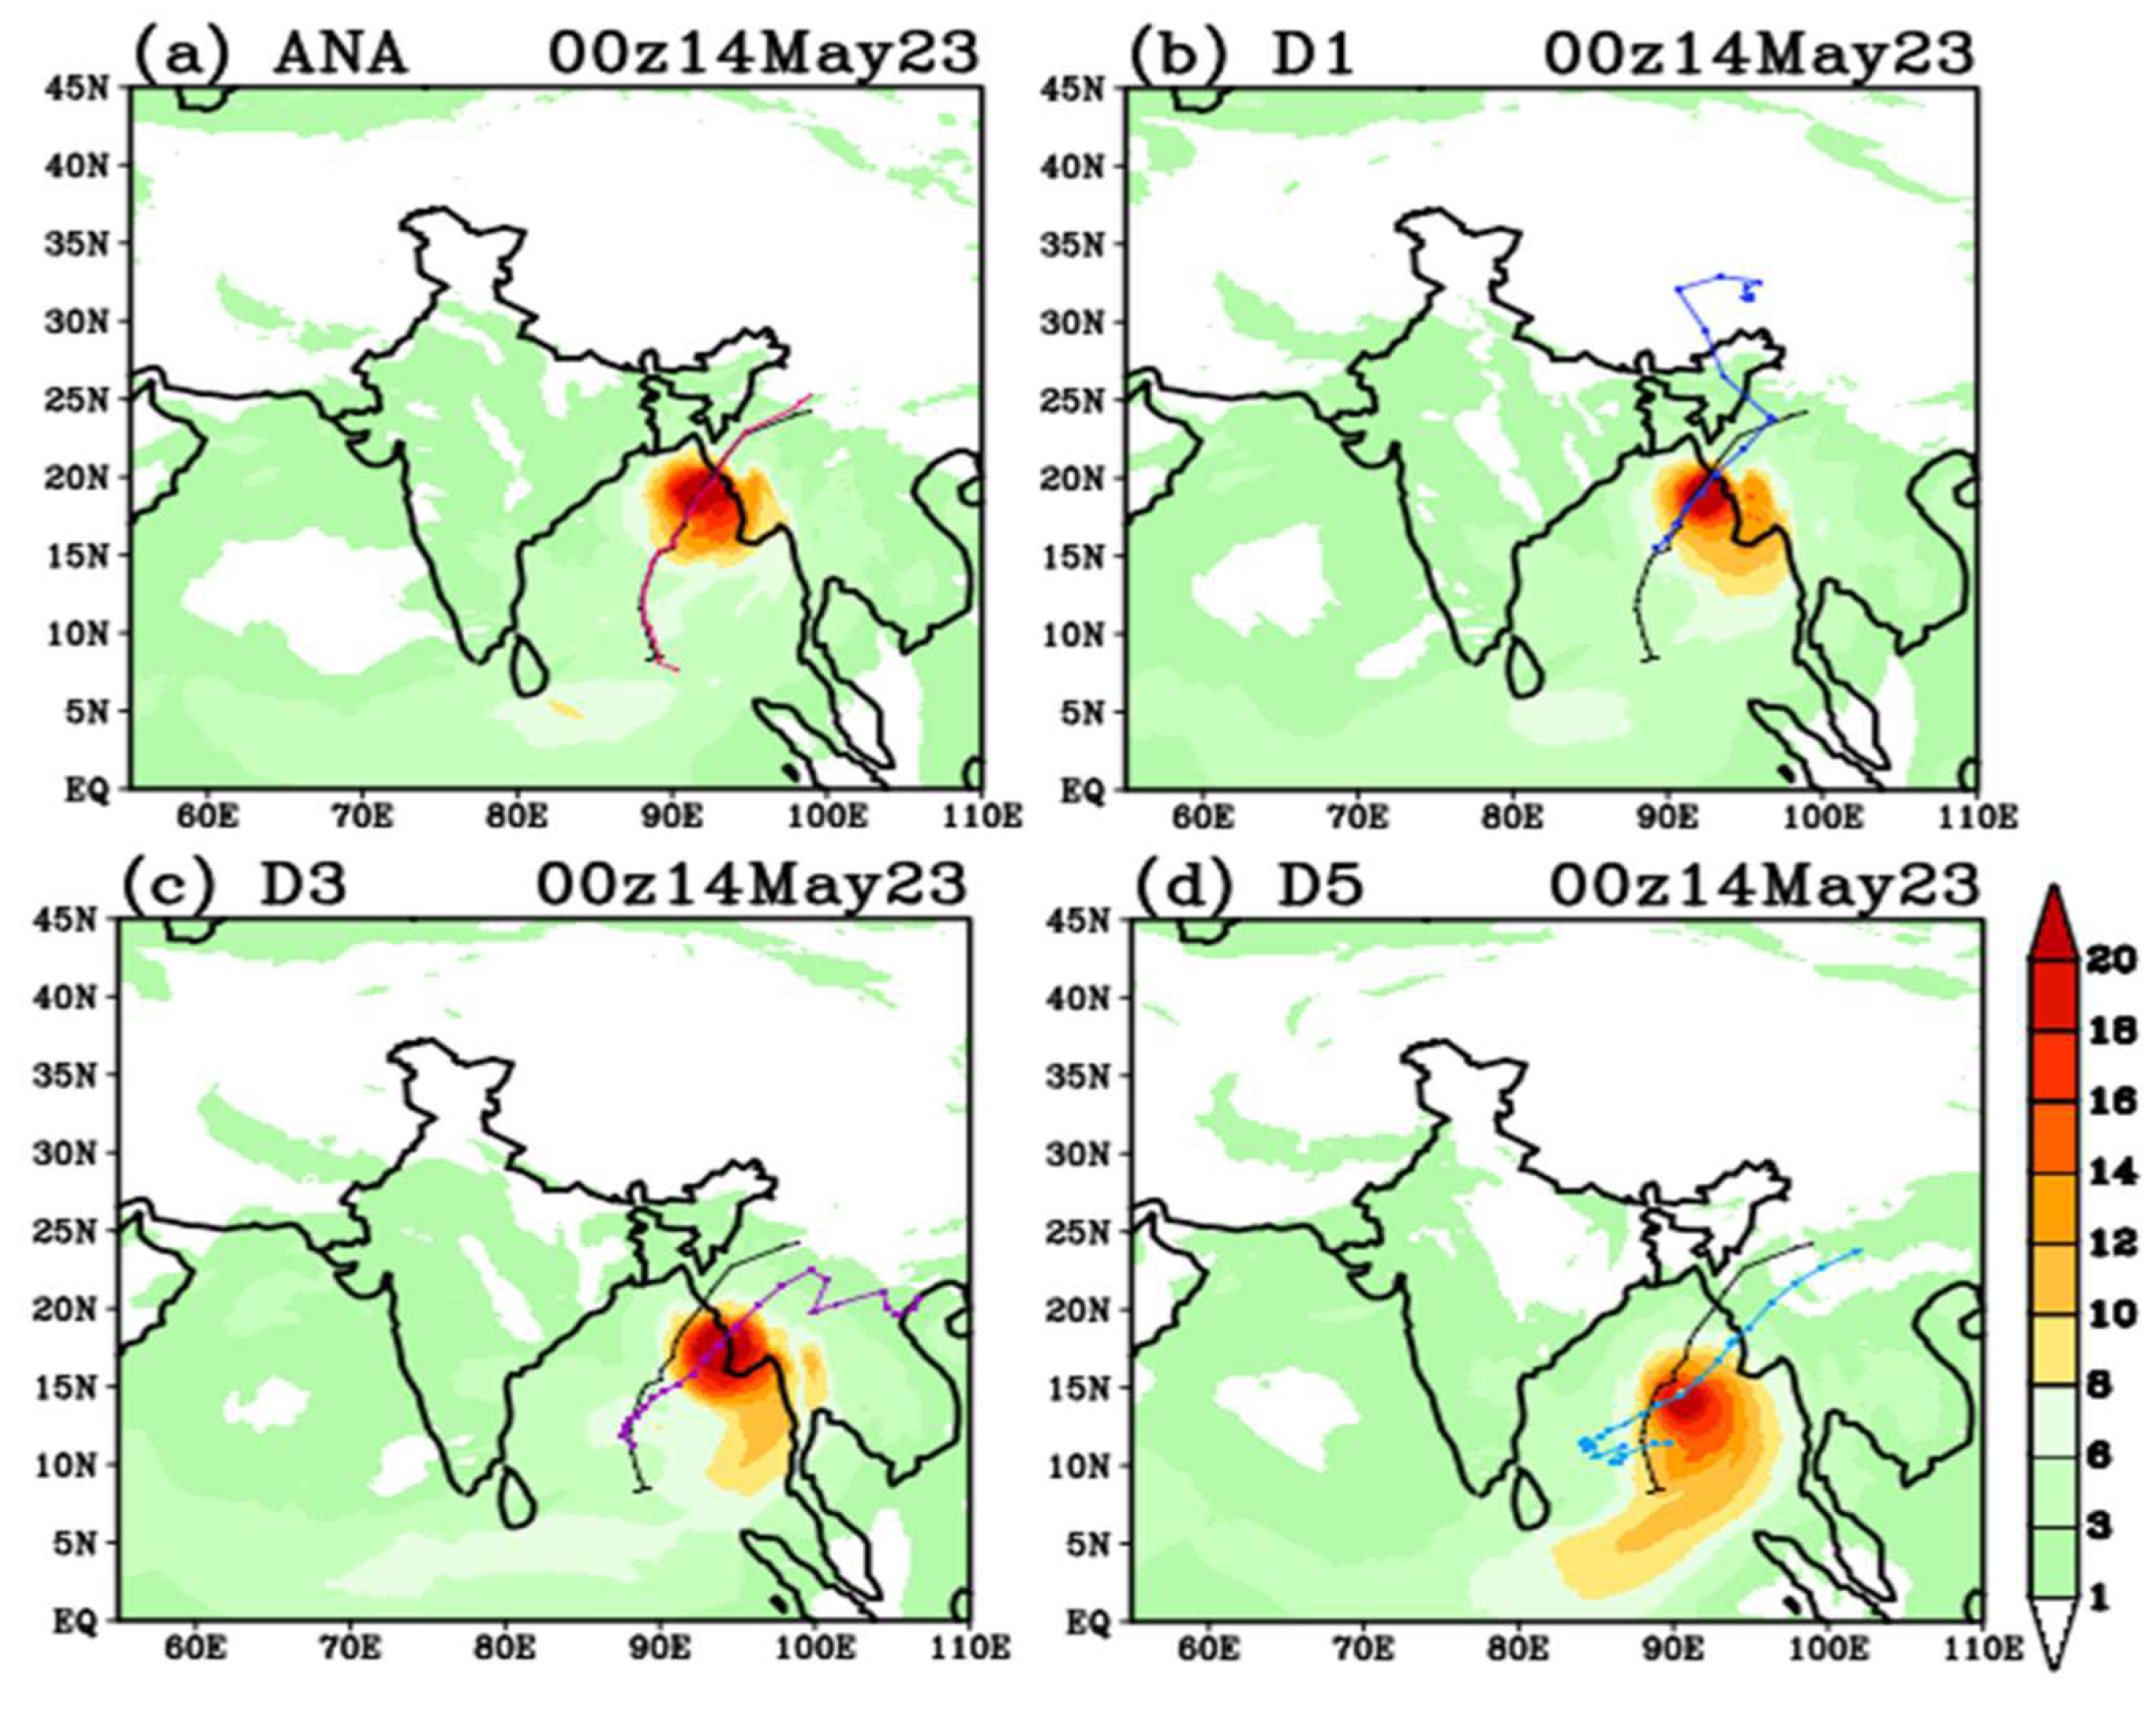
4.5. Track and Vertically Integrated Moisture Transport
The best positions observed are collected from IMD and New Delhi Regional Specialized Meteorological Centres for TC on a real-time basis. Moreover, the track of Mocha derived from NCUM operational model valid up to 120-hr forecast lead-time verified with IMD best track (9-14 May 2023). The direct positional error (PDE) measures how far from the predicted cyclone track the actual observed track is at the same time. Essentially, DPE calculates the straight-line distance between the forecast location and the actual location of the cyclone center as used in the UK Met Office ([
45]). The PDE represented in
Table 1 illustrates that error increases monotonically with respect to time due to the IC. The PDE fluctuates in the range of 25 to 197 km, whereas the landfall error is 6 km; it seems the NCUM model has commendable skill in the prediction of the track of the Mocha cyclone.
The overload of moisture transported by the wind flow from the Bay of Bengal played a crucial role in the copious rainfall activity over coastal Myanmar and adjoining regions. To explore this feature, vertically integrated moisture convergence (VIMC) in the lower troposphere levels (1000 hPa to 500 hPa) for the Mocha cyclone has been considered.
Figure 13 (a-d) represents the vertical integrated moisture (1000-500) hPa and GPH at 500 hPa derived from NCUM analysis and 24-, 72- and 120- hours forecast valid on 00UTC 14 May 2023, when Mocha cyclone is at VSCS stage. The maximum (>18 kg/m/s) magnitude of VIMT accumulated at the vicinity of the lowest CSLP, as revealed in the
Figure 6. During VSCS of Mocha cyclone, the highest moisture transport (18 kg/m/s) was observed along the coast of the Myanmar clearly represented in NCUM operational analysis in
Figure 13(a).
In that context, the 24-, 72-, and 120-hour forecasts of VIMT showed a similar intensity, but the 120-hour forecast slightly deviated in terms of locations, meaning it seems the vortex has moved relatively slower than the 24- and 72-hour forecasts. In contrast, the structure of VIMT is subsequently stronger, starting from the lower latitude of the BoB and moving in a south-westerly direction and accumulating along the Myanmar coast due to the lowest MSLP associated with the VSCS stage. The moisture transport is absent over the northeast states of India, and Bangladesh may prevail in heating conditions over that particular region. During Cyclone Mocha cyclone 9-15 May 2023, the heatwaves significantly intensified over the Indian region with an increase of 8
oC in maximum air temperature noticed during mature stage as well as post-cyclone periods, than pre-cyclonic period as discussed in [
46].
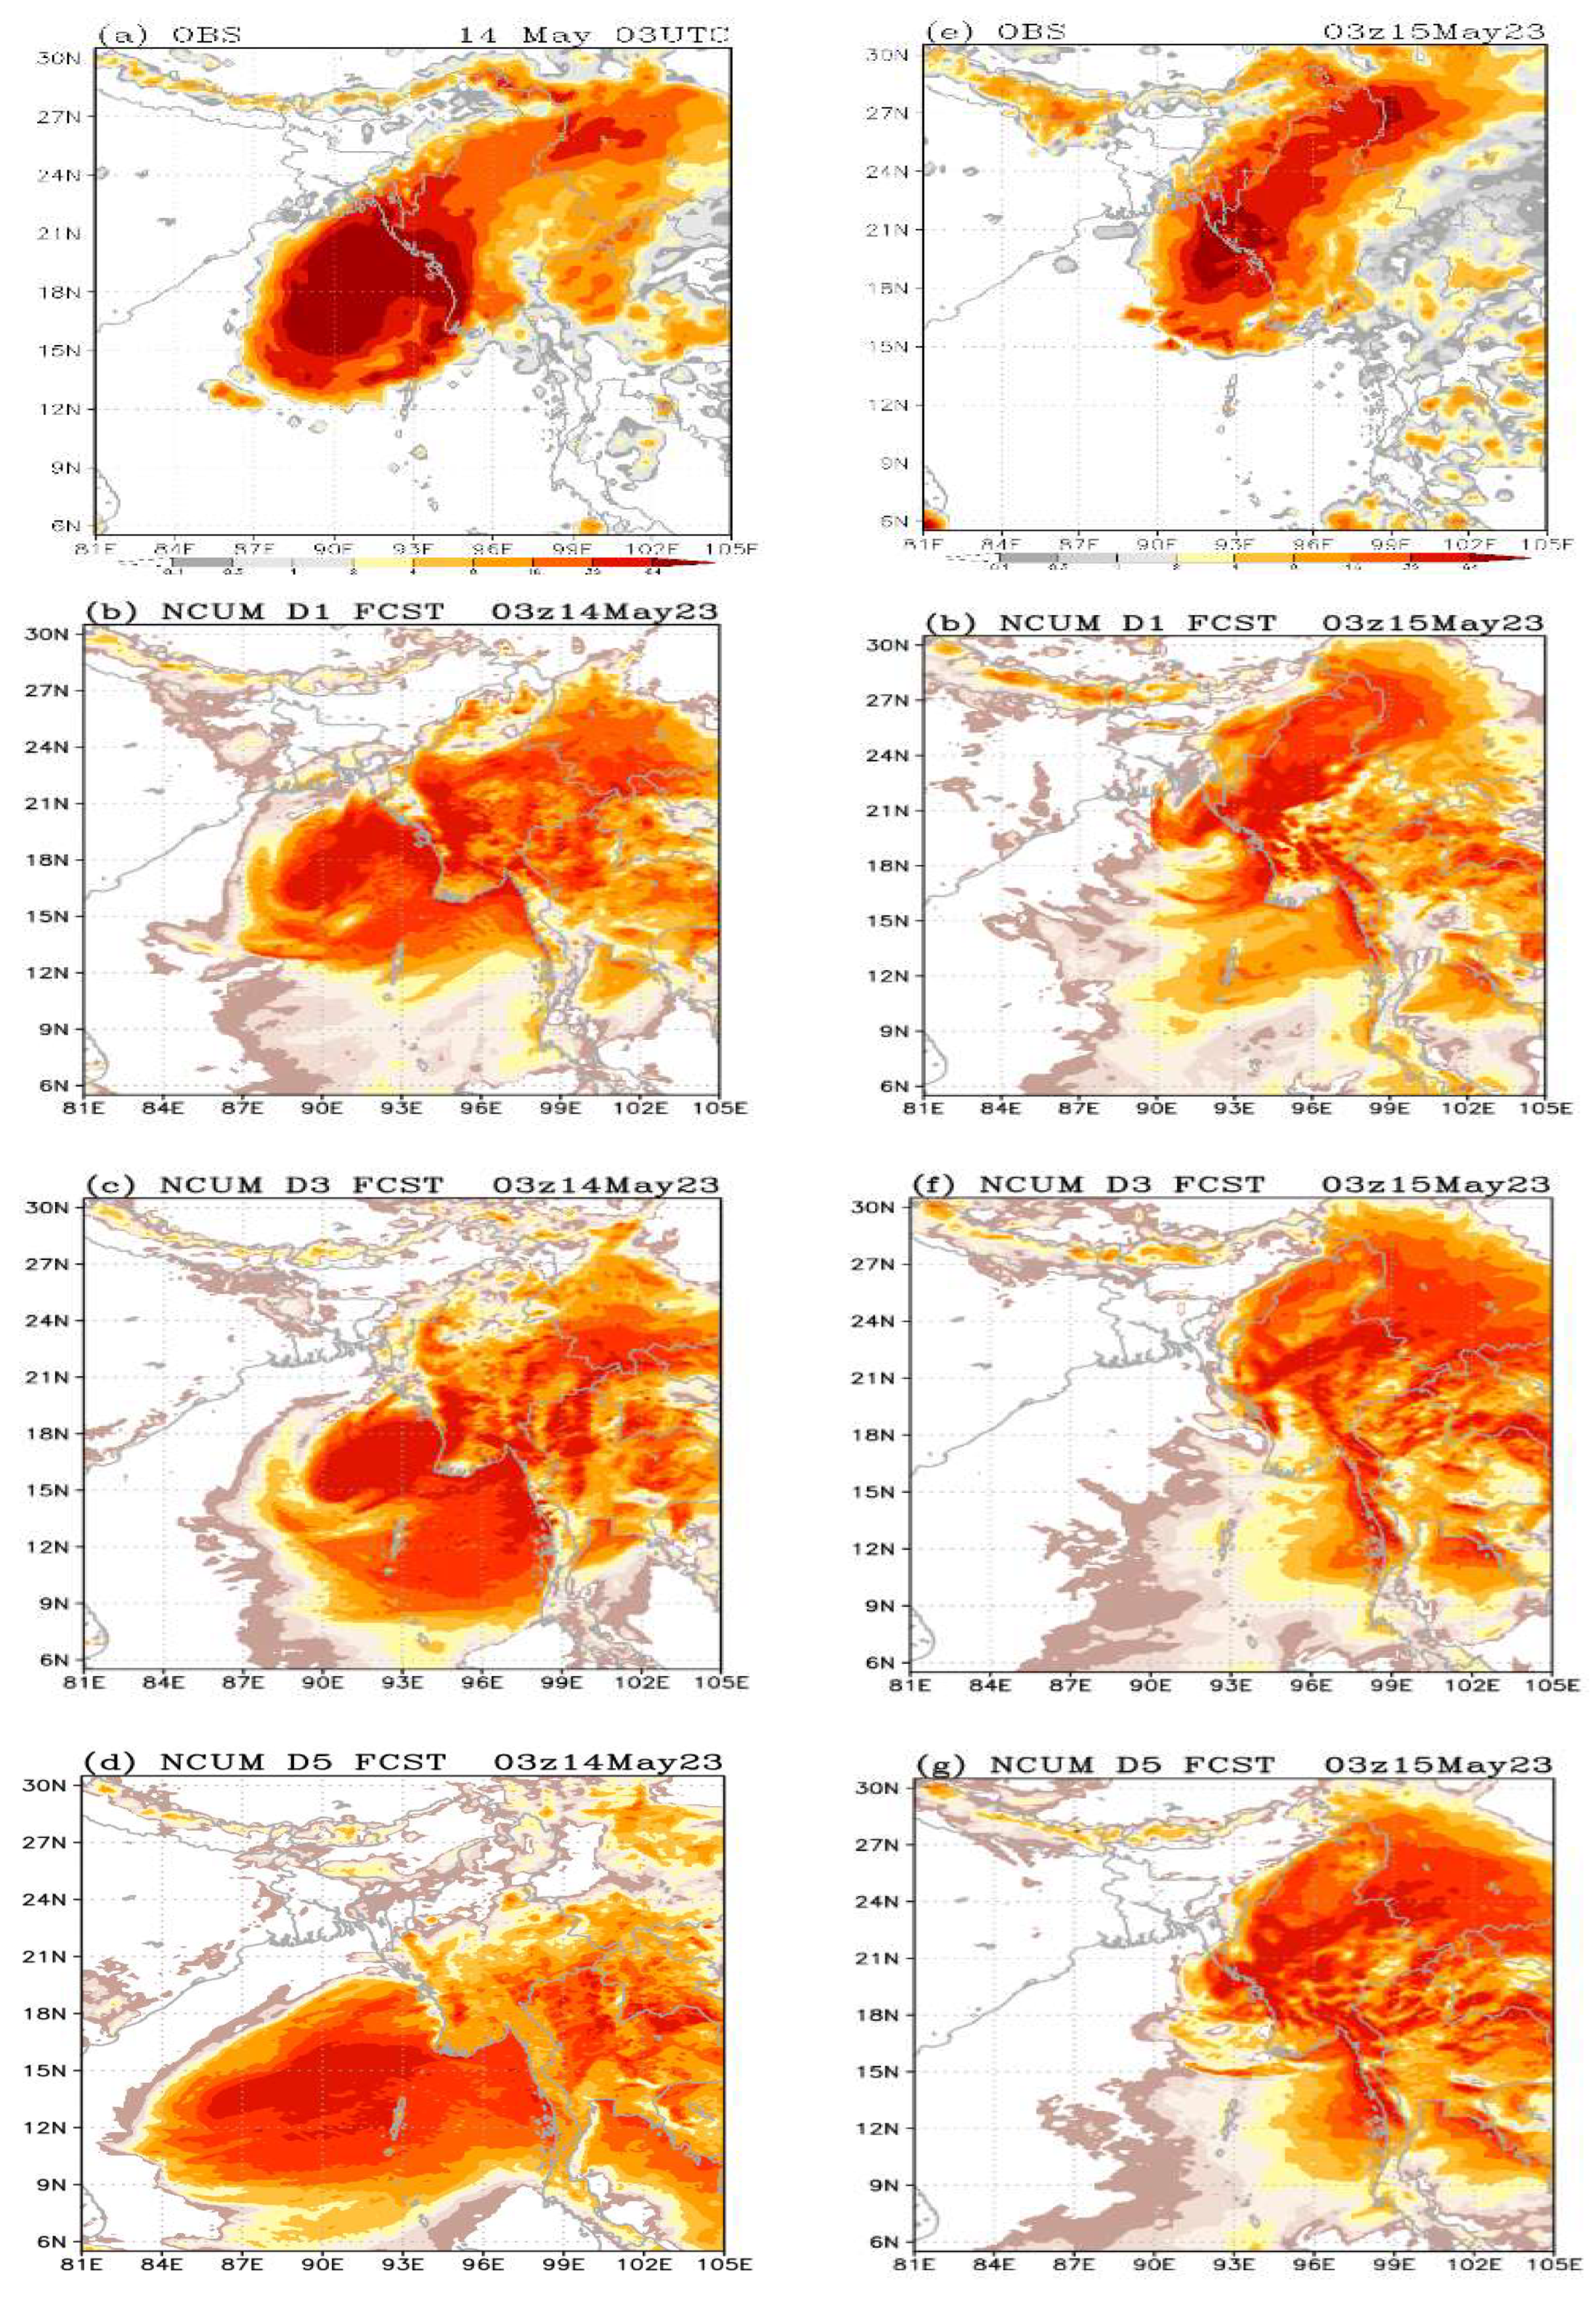
5. Rainfall
Cyclone Mocha made landfall on 14 May 06 UTC, and produced extensive rainfall over the southwest coast of the Myanmar region. The 24 h accumulated observed rainfall from IMD-NCMRWF merge analysis and NCUM-G model simulated rainfall for two corresponding days valid at 03 UTC of 14 and 15 May 2023.
Figure 14 (a) represents observed and 24-, 72- and 120-hour rainfall forecast from NCUM- global model rainfall valid at 03 UTC 14 May 2023 observed. Overall, the 24-, 72- and 120-hour forecast rainfall distributions valid for 03UTC of 14 May 2023 from the global model are well-agreeing (
Figure 14 b-d) with IMD-NCMWRD analysis as shown in
Figure 14 (a). Significantly, the 72- and 120-hours valid for 14 May 2023 simulate the intense of rainfall well over the oceanic regions rather than land, and 24h forecast is more efficient than 72- and 120-hour forecast.
Subsequently, 24- hour accumulated rainfall valid at 03 UTC 15 May 2023 from observation shows rainfall bands over northeast India and adjoin Myanmar region and the intensity has reduced as compared to the previous day. The simulations for 24-, 72- and 120-hour NCUM model forecasts revealed the rainfall pattern reasonably well by the model (left bottom panel). The 24-hour accumulated IMD-NCMWF merge analysis valid at 03 UTC on 15 May 2023 illustrates the heavy precipitation (>64cm) over the southwest peninsular tip and adequate rainfall (>32 cm) over southwest Myanmar.
In addition, the model slightly overpredicted the rainfall distribution over the land region, both spatially and in the southern part of Myanmar. However, the simulations based on 03 UTC 12- and 10- May 2023, ICs the 72- and 120-hour forecast indication that model could capable of forecasting the heavy to very heavy rainfall over the southwest of Myanmar region. The prediction of spatial pattern and rainfall intensity was very effectively represented, but the intensity was slightly overvalued in 72- and 120-hour forecasts. The very heavy rainfall over the ten-meteorological stations of Mynamar in
Table 2 shows 72- and 120-hour forecasts unable to agree with the observed value because the condensed rainbands are located in the Oceacin region rather than land, showing the slow movement of the Mocha cyclone.
6. Conclusions
In this study addressed the performance of the NCUM.V6 operational model on the Mocha cyclone is analyzed and discussed. The analysis and forecast of NCUM, such as MSLP, wind, and GPH at different levels, Q-vector, steering flow, rainfall, and vertical structure of Mocha are analyzed, and results are discussed. The genesis and RI of Mocha cyclone over the lower latitude of BoB during pre-monsson season was mainly due to the oceanic conditions SST warming > 29o C and TCPH 100 KJcm-2, whereas the VWS 15 ms-1 and RH 79%. The multiple curvature, such as northwest to northeast direction, was due to sub-tropical ridge and middle tropospheric warming associated with WD; these features were clearly revealed in operational NCUM analysis. The RI and cyclogenesis of the Mocha cyclone derived from the NCUM operational analysis closely agree with IMD observations.
The structure of Mocha cyclone VSCS has been analyzed from MSLP, 10-m wind, and TPWC through NCUM operational forecast, which shows that at VSCS of the vortex is well predicted both in 24-, 72-, and 120-hours forecast, but the representation in 120-hour NCUM forecast has significantly deviated with respect to the observations as well as NCUM analysis. The wind speed and direction at 850 and 200 hPa levels were well presented in the 24-, 72-, and 120-hour forecasts, agreeing with the NCUM analysis and CIRA observations. Moreover, the positive vorticity at 200 hPa level at 30o N and 90o E further accelerates the vortex from northerly to northweasterly directions. The vertical components of U, V, and RH (%) at Chittagong meteorological station derived NCUM analysis and forecast well agreeing RS observations up to lower tropospheric level, however the dry condition prevails in 72- and 120-hour forecast.
The NCUM model-derived analysis and forecasts of the convergence and divergence patterns are well represented in Q-vector analysis at 850 hPa level. Still, the 120-hour forecast cannot represent the same as in the analysis. The SF distribution is significantly well represented both in analysis and forecast, and the eyewall representations closely match with INSAT 3-D satellite pictures except the 120-hour forecast. The rainfall distribution along the coast of Myanmar in the operational NCUM model closely agrees with the IMD-NCMRWF merge analysis. Further, more TC curvature cases can be studied thoroughly better to understand the dynamics to understand the dynamics thoroughly better. In the future, pre-monsoon SST and atmosphere over the BoB and Indian land mass will be significantly warmer, which would be more challenging to forecasters. Therefore, Q-vector and SF may be appropriate to do the forecasters on an operational basis.
Supplementary Materials
The Figure S1.
Author Contributions
Conceptualization P.K.P., methodology, P.K.P.; R.A.; P.K.P software, P.K.P software; validation, PKP, LP, and SK.; formal analysis, PKP, LP, and SK; investigation, R.A., M.T and SD.; resources, RA; data curation, X.X.; writing—PKP original draft preparation, X.X.; writing—review and editing, PKP, RA, LP, and SA .; visualization, PKP.; supervision, RA.; project administration RA.
Data Availability Statement
The datasets generated by NCMRWF operational were analyzed/forecasted during the current study. These datasets are available from the corresponding author upon reasonable request.
Acknowledgments
This work is supported by the Ministry of Earth Sciences, Government of India. The author thanks all the individuals and technical teams of NCMRWF who have contributed to generating the model forecasts.
Conflicts of Interest
The authors declare that there are no conflicts of interest and competing interests reported in this paper.
References
- T.N. Krishnamurti, S. Jana, R. Krishnamurti, V. Kumar, R. Deepa, F. Papa, M.A. Bourassa, M.M. Ali, Monsoonal intraseasonal oscillations in the ocean heat content over the surface layers of the Bay of Bengal, Journal of Marine Systems 167 (2017) 19–32. [CrossRef]
- R. Ashrit, S. Kumar, A. Dube, T. Arulalan, S. Karunasagar, A. Routray, S. Mohandas, John.P. George, A.K. Mitra, Tropical cyclone forecast using NCMRWF Global (12 km) and regional (4 km) models, MAUSAM 72 (2021) 129–146. [CrossRef]
- R.L. Elsberry, T.D.B. Lambert, M.A. Boothe, Accuracy of Atlantic and Eastern North Pacific Tropical Cyclone Intensity Forecast Guidance, Weather and Forecasting 22 (2007) 747–762. [CrossRef]
- K. Cheung, Recent Advances in Research and Forecasting of Tropical Cyclone Rainfall, (n.d.).
- R.A. Houze, Mesoscale convective systems, Reviews of Geophysics 42 (2004) 2004RG000150. [CrossRef]
- D. Paul, J. Panda, A. Sarkar, S. Kumar, Y. Zhu, J. Collins, Comparing the atmospheric and ocean characteristics associated with two distinctly intensified pre-monsoon tropical cyclones over the Bay of Bengal, Quart J Royal Meteoro Soc 150 (2024) 1926–1952. [CrossRef]
- R.A. Houze, D.D. R.A. Houze, D.D. Churchill, Mesoscale Organization and Cloud Microphysics in a Bay of Bengal Depression, J. Atmos. Sci. 44 (1987) 1845–1868. [CrossRef]
- D.R. Sikka, Forecasting the movement of tropical cyclones in the Indian seas by non-divergent barotropic model, MAUSAM 26 (1975) 323–325. [CrossRef]
-
J.E. George, W.M. Gray, Tropical Cyclone Motion and Surrounding Parameter Relationships, J. Appl. Meteor. 15 (1976) 1252–1264. [CrossRef]
- W.M. Gray, GLOBAL VIEW OF THE ORIGIN OF TROPICAL DISTURBANCES AND STORMS, Mon. Wea. Rev. 96 (1968) 669–700. [CrossRef]
- M. DeMaria, J.A. Knaff, B.H. Connell, A Tropical Cyclone Genesis Parameter for the Tropical Atlantic, Wea. Forecasting 16 (2001) 219–233. [CrossRef]
- G. Lin, H. Chen, N. Hovius, M. Horng, S. Dadson, P. Meunier, M. Lines, Effects of earthquake and cyclone sequencing on landsliding and fluvial sediment transfer in a mountain catchment, Earth Surf Processes Landf 33 (2008) 1354–1373. [CrossRef]
- M.J. McPhaden, G.R. Foltz, T. Lee, V.S.N. Murty, M. Ravichandran, G.A. Vecchi, J. Vialard, J.D. Wiggert, L. Yu, Ocean-Atmosphere Interactions During Cyclone Nargis, EoS Transactions 90 (2009) 53–54. [CrossRef]
- K.V. Ooyama, Conceptual Evolution of the Theory and Modeling of the Tropical Cyclone, Journal of the Meteorological Society of Japan 60 (1982) 369–380. [CrossRef]
- T.B. Kimberlain, M.J. Breman, 3. Tropical Cyclone Motion, (n.d.).
- C.S. Velden, L.M. Leslie, The Basic Relationship between Tropical Cyclone Intensity and the Depth of the Environmental Steering Layer in the Australian Region, Wea. Forecasting 6 (1991) 244–253. [CrossRef]
- J.C.L. Chan, Interannual and interdecadal variations of tropical cyclone activity over the western North Pacific, Meteorol. Atmos. Phys. 89 (2005) 143–152. [CrossRef]
- T.-C. Chen, S.-Y. Wang, M.-C. Yen, A.J. Clark, Impact of the Intraseasonal Variability of the Western North Pacific Large-Scale Circulation on Tropical Cyclone Tracks, Weather and Forecasting 24 (2009) 646–666. [CrossRef]
- Rashmi, B.R. , 2022. BIMSTEC: Disaster Management as a Tool for Regional Cooperation. In BIMSTEC (pp. 188-198). Routledge India.
- R. Bhatla, R. Raj, M. Singh, Climatology of recurvature of tropical cyclone over Bay of Bengal and Arabian Sea, MAUSAM 69 (2018) 437–442. [CrossRef]
- M. Mohapatra, M. Sharma, Cyclone warning services in India during recent years: A review, Mausam 70 (2019) 635–666.
- M. Mohapatra, M. Sharma, S.S. Devi, S.V.J. Kumar, B.S. Sabade, Frequency of genesis and landfall of different categories of tropical cyclones over the North Indian Ocean, MAUSAM 72 (2021) 1–26. [CrossRef]
- S. Roose, R.S. Ajayamohan, P. Ray, P.R. Mohan, K. Mohanakumar, ENSO influence on Bay of Bengal cyclogenesis confined to low latitudes, Npj Clim Atmos Sci 5 (2022) 31. [CrossRef]
- J. Kaplan, M. DeMaria, J.A. Knaff, A Revised Tropical Cyclone Rapid Intensification Index for the Atlantic and Eastern North Pacific Basins, Weather and Forecasting 25 (2010) 220–241. [CrossRef]
- J. Kaplan, C.M. Rozoff, M. DeMaria, C.R. Sampson, J.P. Kossin, C.S. Velden, J.J. Cione, J.P. Dunion, J.A. Knaff, J.A. Zhang, J.F. Dostalek, J.D. Hawkins, T.F. Lee, J.E. Solbrig, Evaluating Environmental Impacts on Tropical Cyclone Rapid Intensification Predictability Utilizing Statistical Models, Weather and Forecasting 30 (2015) 1374–1396. [CrossRef]
- S.D. Kotal, S.K. Bhattacharya, S.K.R. Bhowmik, Development of NWP based objective Cyclone Prediction System (CPS) for North Indian Ocean Tropical Cyclones — Evaluation of performance, 3 (2014) 16. [CrossRef]
- Y. Wang, C.-C. Wu, Current understanding of tropical cyclone structure and intensity changes ? a review, Meteorol Atmos Phys 87 (2004) 257–278. [CrossRef]
- S. Chen, Y. Liu, T.R. Nathan, C. Davis, R. Torn, N. Sowa, C. Cheng, J. Chen, Modeling the effects of dust-radiative forcing on the movement of Hurricane Helene (2006), Quart J Royal Meteoro Soc 141 (2015) 2563–2570. [CrossRef]
- M. Bi, R. Wang, T. Li, X. Ge, Effects of vertical shear on intensification of tropical cyclones of different initial sizes, Front. Earth Sci. 11 (2023) 1106204. [CrossRef]
- S. Kumar, A. Jayakumar, M.T. Bushair, P. Buddhi, gibies george, A. Lodh, S.I. Rani, J.P. George, Implementation of New High Resolution NCUM Analysis-Forecast System in Mihir HPCS, NCMRWF, 2018. https://www.ncmrwf.gov.in/NCUM-Report-Aug2018_final.pdf.
- S. Kumar, A. Dube, S. Kumar, S.I. Rani, K. Sharma, S. Karunasagar, S. Mohandas, R. Ashrit, J.P. George, A.K. Mitra, Improved skill of NCMRWF Unified Model (NCUM-G) in forecasting tropical cyclones over NIO during 2015–2019, J Earth Syst Sci 131 (2022) 114. [CrossRef]
- S. Yokoi, Y. N. Takayabu, Environmental and External Factors in the Genesis of Tropical Cyclone Nargis in April 2008 over the Bay of Bengal, Journal of the Meteorological Society of Japan 88 (2010) 425–435. [CrossRef]
- A.K. Mitra, A.K. Bohra, M.N. Rajeevan, T.N. Krishnamurti, Daily Indian Precipitation Analysis Formed from a Merge of Rain-Gauge Data with the TRMM TMPA Satellite-Derived Rainfall Estimates, Journal of the Meteorological Society of Japan 87A (2009) 265–279. [CrossRef]
- On the movement of tropical cyclones, Eos Trans. AGU 27 (1946) 641–655. [CrossRef]
- D.V. Bhaskar Rao, D. Srinivas, G.C. Satyanarayana, Trends in the genesis and landfall locations of tropical cyclones over the Bay of Bengal in the current global warming era, J Earth Syst Sci 128 (2019) 194. [CrossRef]
- F. Sanders, J.R. Gyakum, Synoptic-Dynamic Climatology of the “Bomb,” Mon. Wea. Rev. 108 (1980) 1589–1606. [CrossRef]
- S.K.R. Bhowmik, An evaluation of cyclone genesis parameter over the Bay of Bengal using model analysis, MAUSAM 54 (2003) 351–358. [CrossRef]
- S.D. Kotal, S.K. Roy Bhowmik, P.K. Kundu, A. Das Kumar, A statistical cyclone intensity prediction (SCIP) model for the Bay of Bengal, J Earth Syst Sci 117 (2008) 157–168. [CrossRef]
- M. Mohapatra, G.S. Mandal, B.K. Bandyopadhyay, A. Tyagi, U.C. Mohanty, Classification of cyclone hazard prone districts of India, Nat Hazards 63 (2012) 1601–1620. [CrossRef]
- R. Ashrit, A. Dube, K. Sharma, H. Singh, S.K.A. Singh, S. Mohandas, S. Karunasagar, Forecasting of Severe Weather Events Over India, in: V.K. Gahalaut, M. Rajeevan (Eds.), Social and Economic Impact of Earth Sciences, Springer Nature Singapore, Singapore, 2023: pp. 97–120. [CrossRef]
- B.J. Hoskins, I. Draghici, H.C. Davies, A new look at the ω-equation, Quart J Royal Meteoro Soc 104 (1978) 31–38. [CrossRef]
- document, (n.d.).
- J.R. Holton, An introduction to dynamic meteorology, 4th edition, Elsevier Academic Press, Burlington, MA, 2004.
- J.E. Martin, J.A. Otkin, The Rapid Growth and Decay of an Extratropical Cyclone over the Central Pacific Ocean, Wea. Forecasting 19 (2004) 358–376. [CrossRef]
- J.T. Heming, Met Office Unified Model Tropical Cyclone Performance Following Major Changes to the Initialization Scheme and a Model Upgrade, Weather and Forecasting 31 (2016) 1433–1449. [CrossRef]
- S. Sharma, A. Kumar, A. Chakraborty, Intensification of heatwave conditions during Cyclone Mocha in 2023, Weather 79 (2024) 220–223. [CrossRef]
Figure 1.
(a) Frequency of tropical cyclones (%) crossing different countries viz. Bangladesh (green), India (blue), and Myanmar (purple) during the MAM season of 2004-2023; (b) Same as (a), but the climatology of rapid intensification of tropical cyclone cases from April to May derived from regional Specialized Meteorological Centre for tropical cyclone (RSMC), IMD (
https://rsmcnewdelhi.imd.gov.in/).
Figure 2.
Satellite INSAT-3 D image for Mocha cyclone valid on 00z 14 May 2023.
Figure 2.
Satellite INSAT-3 D image for Mocha cyclone valid on 00z 14 May 2023.
Figure 4.
Geopotential height field (m) at 850 (shaded), 500 (blue contour), and 200 (blue contour) hPa level and temperature (oC) difference in between 700 and 500 hPa levels for Mocha cyclone during 00 UTC 11 to 13 May 2023 derived from operational NCUM model.
Figure 4.
Geopotential height field (m) at 850 (shaded), 500 (blue contour), and 200 (blue contour) hPa level and temperature (oC) difference in between 700 and 500 hPa levels for Mocha cyclone during 00 UTC 11 to 13 May 2023 derived from operational NCUM model.
Figure 5.
Intensity simulation of Mocha cyclone MSLP (hPa) and 10-m maximum sustained wind (MSW; knots) derived from IMD and NCUM model during 9-15 May 2023.
Figure 5.
Intensity simulation of Mocha cyclone MSLP (hPa) and 10-m maximum sustained wind (MSW; knots) derived from IMD and NCUM model during 9-15 May 2023.
Figure 6.
Maximum deepening rates IMD and NCUM model during 00UTC 12 to 06 UTC 15 May 2023.
Figure 6.
Maximum deepening rates IMD and NCUM model during 00UTC 12 to 06 UTC 15 May 2023.
Figure 7.
Cloud distributions and wind flow pattern during ESCS stage of Mocha derived from (a) Aqua Tera satellite (f) CIRA observations valid on 00 UTC 14 May 2023. Figure (b, c, d, e) MSLP (hPa) and perceptible water content (shaded; kg/kg) derived from analysis, 24-, 72- and 120-hour lead forecast derived of NCUM operational model. Figure (g, h, i, &j) is the same as (b, c, d, & e), but for wind field (knots) at 12.5 km resolutions.
Figure 8.
Wind speed (shaded; ms-1) and direction at 850 (hPa) derived from NCUM (a) analysis, (b) 24-, (c) 72- and (d) 120-hour lead operational forecast at 12.5 km resolutions valid on 00 UTC 14 May 2023.
Figure 8.
Wind speed (shaded; ms-1) and direction at 850 (hPa) derived from NCUM (a) analysis, (b) 24-, (c) 72- and (d) 120-hour lead operational forecast at 12.5 km resolutions valid on 00 UTC 14 May 2023.
Figure 9.
Same as
Figure 8, but the wind flow pattern (shaded; ms
-1) and vorticity (contour; green) at 200 hPa levels are valid on 00 UTC 14 May 2023.
Figure 9.
Same as
Figure 8, but the wind flow pattern (shaded; ms
-1) and vorticity (contour; green) at 200 hPa levels are valid on 00 UTC 14 May 2023.
Figure 10.
Vertical profile of (a) u-, (b) v-component of wind (ms-1), and (c) relative humidity (%) derived at Chittagong meteorological station (22.37oN; 93.83oE) valid on 00 UTC 14 May 2023. .
Figure 10.
Vertical profile of (a) u-, (b) v-component of wind (ms-1), and (c) relative humidity (%) derived at Chittagong meteorological station (22.37oN; 93.83oE) valid on 00 UTC 14 May 2023. .
Figure 11.
Q-vectors and convergence at 850 hPa derived from NCUM (a) analysis, (b) 24-, (c) 72-, and (d) 120-hour forecast valid on 00 UTC 13 May 2024; (e-h) same as (a-d), but valid on 00 UTC 14 May 2024.
Figure 11.
Q-vectors and convergence at 850 hPa derived from NCUM (a) analysis, (b) 24-, (c) 72-, and (d) 120-hour forecast valid on 00 UTC 13 May 2024; (e-h) same as (a-d), but valid on 00 UTC 14 May 2024.
Figure 12.
Same as
Figure 10, but for steering flow derived from NCUM (a) analysis, (b) 24-, (c) 72-, and (d) 120-hour forecast valid on 00 UTC 13 May 2024; (e-h) same as (a-d), but valid on 00 UTC 14 May 2024.
Figure 12.
Same as
Figure 10, but for steering flow derived from NCUM (a) analysis, (b) 24-, (c) 72-, and (d) 120-hour forecast valid on 00 UTC 13 May 2024; (e-h) same as (a-d), but valid on 00 UTC 14 May 2024.
Figure 13.
IMD track along with NCUM analysis and forecast (24-, 72-, and 120-hour) during 9-14 May 2023; lower troposphere (1000-500 hPa) vertically integrated moisture convergence (VIMC) derived from NCUM analysis and 24-, 72- and 120- hours forecast valid on 00UTC 14 May 2023.
Figure 13.
IMD track along with NCUM analysis and forecast (24-, 72-, and 120-hour) during 9-14 May 2023; lower troposphere (1000-500 hPa) vertically integrated moisture convergence (VIMC) derived from NCUM analysis and 24-, 72- and 120- hours forecast valid on 00UTC 14 May 2023.
Figure 14.
Comparison of 24 h accumulated precipitation (mm/day) of Mocha at the ESCS stage derived from IMD-NCMRWF merge analysis (a) and NCUM model (b) 24-, (c) 72-, and (d) 120-hour forecast valid at 00 UTC, 14 May 2023; figures (e–g) are the same as (a–d), but valid at 00 UTC, 15 May 2023 respectively.
Table 1.
Direct positional error (DPE) and landfall error at 12-hour lead time during 9-14 May 2023.
Table 1.
Direct positional error (DPE) and landfall error at 12-hour lead time during 9-14 May 2023.
| Forecast lead-time |
IC 13-05-2023 |
IC 12-05- 2023 |
IC 11-05-2023 |
IC 10-05-2023 |
Average PDE (km) |
Landfall PDE (km) |
| 0 |
24.17 |
22.26 |
22.26 |
28 |
24.2 |
9 |
| 12 |
15.4 |
22.26 |
34.49 |
26 |
24.5 |
9 |
| 24 |
71.49 |
99.08 |
44.53 |
59.8 |
68.7 |
9 |
| 36 |
178.78 |
115.34 |
113.8 |
99.15 |
126.8 |
8 |
| 48 |
|
224.41 |
141.62 |
35.11 |
133.7 |
7 |
| 60 |
|
325.11 |
193.28 |
105.29 |
207.9 |
7 |
| 72 |
|
|
262.96 |
61.88 |
162.4 |
5 |
| 84 |
|
|
328.16 |
56.67 |
192.4 |
5 |
| 96 |
|
|
257.22 |
87.29 |
172.3 |
4 |
| 108 |
|
|
|
187.21 |
187.2 |
3 |
| 120 |
|
|
|
196.31 |
196.3 |
1 |
Table 2.
Rainfall (mmd-1 )over major stations of Myanmar affected by Mocha cyclone derived from observations and NCUM model 24-, 72-, 120 hours forecast valid on 03 UTC of 14 May and 15 May 2023.
Table 2.
Rainfall (mmd-1 )over major stations of Myanmar affected by Mocha cyclone derived from observations and NCUM model 24-, 72-, 120 hours forecast valid on 03 UTC of 14 May and 15 May 2023.
| |
|
|
03 UTC 14-05-2022 |
03 UTC 15-05-2022 |
| Stations |
Latitude |
Longitude |
Obs |
24 |
72 |
120 |
Obs |
24 |
72 |
120 |
| Sittwe |
20.16 |
92.86 |
76.35 |
88.86 |
0.22 |
0.01 |
74.25 |
64.50 |
7.49 |
3.2 |
| Pauktaw |
20.18 |
93.07 |
96.17 |
125.92 |
0.80 |
0.02 |
70.17 |
12.84 |
28.95 |
2.9 |
| Kyaukpyu |
19.43 |
93.55 |
81.61 |
101.50 |
0.36 |
0.01 |
41.82 |
54.77 |
17.32 |
0.8 |
| Munaung |
18.86 |
93.73 |
64.07 |
157.02 |
6.61 |
0.00 |
45.88 |
47.11 |
94.00 |
2.5 |
| Buthidaung |
20.86 |
92.52 |
81.49 |
33.73 |
0.20 |
0.00 |
60.55 |
142.72 |
6.21 |
0.8 |
| Matupi |
21.61 |
93.45 |
47.62 |
2.98 |
0.97 |
0.00 |
71.19 |
83.40 |
10.20 |
3.6 |
| Paletwa |
21.31 |
92.85 |
56.99 |
3.31 |
0.11 |
0.04 |
84.73 |
93.40 |
2.76 |
1.3 |
| Hakha |
22.65 |
93.61 |
45.49 |
19.78 |
0.05 |
0.04 |
42.97 |
34.45 |
19.16 |
0.2 |
| Lasho |
22.95 |
97.75 |
10.40 |
11.95 |
26.70 |
9.41 |
9.08 |
1.59 |
111.63 |
4.5 |
| Yangon |
16.84 |
96.18 |
16.88 |
6.88 |
42.03 |
0.07 |
1.53 |
52.46 |
5.88 |
6.1 |
|
Disclaimer/Publisher’s Note: The statements, opinions and data contained in all publications are solely those of the individual author(s) and contributor(s) and not of MDPI and/or the editor(s). MDPI and/or the editor(s) disclaim responsibility for any injury to people or property resulting from any ideas, methods, instructions or products referred to in the content. |
© 2024 by the authors. Licensee MDPI, Basel, Switzerland. This article is an open access article distributed under the terms and conditions of the Creative Commons Attribution (CC BY) license (http://creativecommons.org/licenses/by/4.0/).