
Submitted:
12 December 2024
Posted:
12 December 2024
You are already at the latest version
Abstract
Objectives: This retrospective cohort study aimed to compare and evaluate the 1-year stability of two Korean implant brands, Osstem and Toplan, both treated with alumina sandblasting and acid etching (SA) surface modification. Methods: This retrospective analysis evaluated patients with American Society of Anesthesiologists grade I or II, >20 years, with alveolar bone volume suitable for implant placement, who received immediate or delayed placement after extraction, and with Osstem (n=57) or Toplan (n=87) implant. The insertion torque value (ITV) measured on the day of implant placement and the implant stability quotient (ISQ) measured on the day of implant placement, 1 month post-surgery, and 2–3 months after implantation were analysed. Results: Both implants had significantly increased ISQs over time, and the ISQs did not significantly differ between Osstem and Toplan implants at any time point. Osstem implants showed significantly higher ISQs in D2 than in D3 bone, and in the mandible than in the maxilla at all time points. Toplan implants with diameter >4.0 mm showed higher initial ISQs. Osstem implants showed significant correlation between ITV and ISQ on the day of placement (r=0.349, p<0.01), but not at later time points. For Toplan implants, no significant correlation was confirmed between ITV and ISQ at any time point. At 1-year follow-up, both implants were still providing functional service. Conclusion: Osstem and Toplan implants with SA surface treatment showed a high level of stability for 1 year, and no significant difference in stability was observed between the two implants. Both implants are considered clinically reliable products.
Keywords:
dental implants
; implant stability quotient
; insertion torque value
1. Introduction
Dental implants are widely used to restore the function and aesthetics of lost teeth [1]. Implant success is determined by several factors. Implant shape, including length, diameter, shape, bone quality, and surgical method, can significantly impact implant success [2,3,4]. Therefore, to avoid implant failure, various parameters such as implant shape, patient bone quality, and surgical method should be considered. In addition, efforts are being made to enhance the surface area and hydrophilic surface treatments to improve the stability of the implants [5,6].
Surface treatment of an implant by roughening the surface of the implant using alumina and then forming stable irregularities through acid etching (SA) promotes bone fusion [6]. Implants with rough surfaces have larger surface areas than those with other processed surfaces, showing higher bone fusion and faster bone healing [7,8].
One method to evaluate the primary stability of an implant is to measure the insertion torque value (ITV; N/cm), which is an effective parameter of the degree of stability during implantation [9]. However, evaluating the overall bone fusion process of an implant is inaccurate, and whether there is a threshold level of ITV that can predict a successful implant is unclear [10].
One representative method of evaluating implant stability is the implant stability quotient (ISQ). The ISQ is an index used to evaluate the stiffness and deformation of an implant and a bone complex and measures the stability of an implant through resonance frequency analysis, and a higher ISQ score indicates higher stability. The ISQ device is easy to use in clinical practice and has high reliability; therefore, it is widely used to evaluate the stability of an implant [4,11].
This study aimed to evaluate the 1-year stability of two implant systems treated with an SA surface. The hypothesis was that there would be no significant difference in the 1-year stability between the two systems.
2. Materials and Methods
2.1. Study Design and Patient Data Collection
We retrospectively reviewed the medical data of patients who visited the G Dental Clinic in Dangjin, Chungcheongnam-do, between January 2022 and July 2023. G*Power version 3.1.9.7 (Heinrich-Heine-Universität Düsseldorf, Düsseldorf, Germany) confirmed a minimum sample size of 128, with an effect size=0.25, α=0.05, and power=0.80. Data collection was conducted in December 2023 and January 2024.
The inclusion criteria were healthy patients aged >20 years, with American Society of Anesthesiologists grade I or II, with occlusal relationship with normal occlusal in one tooth, with alveolar bone volume suitable for implant placement, and who underwent delayed (at least 2 months) implant placement after extraction or immediate implant placement after extraction. Those who were smoking more than 10 cigarettes per day, with systemic disease that may affect bone metabolism, with periodontal disease with confirmed overall swelling and bleeding in the gingiva, who were pregnant, who were using an immunosuppressant, who were undergoing head and neck radiotherapy, with uncontrolled diabetes, with contraindications for simple oral surgery, and who did not meet the follow-up baseline criteria were excluded. Only cases performed by a single dentist with >15 years of clinical experience were included in this study. Based on these criteria, 97 patients (average age, 53.74±11.87 years) were selected. Finally, 57 Osstem implants (Osstem TS III; Osstem Implant Co., Ltd, Seoul, South Korea) and 87 Toplan implants (Toplan T01; Toplan Co., Ltd, Seoul, South Korea) in the oral cavity were selected for the analysis.
Implants were classified according to the sex of the study participants, alveolar bone quality, implant placement location, implant placement timing, diameter, and length. Bone quality was classified as D1 to D4, according to Misch's classification method [12]. Implant lengths were 7.0 to 11.5 mm for Osstem and 7.0 to 12.0 mm for Toplan, and implant diameters were 4.0 to 5.0 mm for Osstem and 3.6 to 5.0 mm for Toplan (Table 1).
2.2. Implant Placement: Surgical Protocol
The surgical plan was established using cone beam computed tomography before the implant procedure. The length of the implant was conditioned by the height of the base of the bone, and the diameter of the implant was determined according to the width of the alveolar process. All surgeries were performed in the operating room using a completely aseptic protocol with infection control. The patient gargled with 10 mL of an oral cleaner containing 0.2% chlorhexidine for 1 minute before surgery, and extracorporeal disinfection was performed using cotton balls with povidone iodine and chlorhexidine.
The surgical site was anaesthetised with lidocaine hydrochloride with epinephrine injection (1:100,000; Huons Co., Ltd, Gyeonggi-do, South Korea) and articaine with epinephrine injection (1/100,000; Huons Co., Ltd), after which the mucosa-periosteal bone flap was elevated. If a lesion was observed around the tooth, it was removed using a surgical curette. The implant insertion process was performed according to the manufacturer’s instructions. The implant was placed 1 mm deeper than the bone level (1 mm subcrestal), and the healing abutment was installed after implantation. The patients were given the following medications after implant placement surgery: amoxicillin hydrate 500 mg and loxoprofen sodium hydrate 68.1 mg tid for 7 days, methylprednisolone 4 mg tid for 6 days, and esomeprazole magnesium trihydrate 22.25 mg od for 7 days. Prosthetic restorations were installed only if ISQ ≥60 was met 2–3 months after implant surgery.
2.3. Measurement of ITV
ITVs were measured using a torque wrench calibrated to newtons per centimetre at the time of implant placement. All implant insertion procedures were performed according to the manufacturer's instructions. The ITVs were recorded as soon as the final location within the bone was reached, and we investigated which of the following sections the ITV of the patient belongs to: <30, 30–40, 40–50, or >50 N/cm.
2.4. Measurement of Implant Stability Quotient
Resonance frequency analysis measurements of implant stability were performed using the ISQ device Osstell™ (Osstell AB, Stampgatan, Göteborg, Sweden), according to the manufacturer's instructions. Implant stability was expressed as ISQ. The ISQs were recorded in triplicate using Smartpeg™ (Osstell AB) fixed to the implant at a manufacturer-recommended torque of 4–6 N/cm. The primary, secondary, and tertiary measurements were performed on the day of implant placement (ISQ t1), 1 month after placement (ISQ t2), and 2–3 months after placement (ISQ t3), respectively. Measurements were obtained twice in the mesiodistal and buccolingual directions of the implant, and the average value was recorded.
2.5. Implant Survival and Failure
Implant survival was defined as an implant that remained in place at the 1-year follow-up appointment and supported the restoration. Implant failure was defined as the removal of dental implants at the 1-year follow-up appointment owing to loss of bone fusion, mobility, persistent pain, fractures, and/or extensive bone loss.
2.6. Statistical Analyses
Normal distribution of ISQs was confirmed using the Kolmogorov–Smirnov test. To determine the difference in ISQs between the Osstem and Toplan implants, an independent-samples t-test was performed. Differences in ISQs according to the implantation method, implant diameter, implant length, and bone mass were confirmed using the Kruskal–Wallis and Bonferroni correction post-hoc test or the Mann–Whitney test. Differences according to the number of ISQ measurements were confirmed using Friedman's analysis of variance and Wilcoxon signed-rank post-hoc tests. The correlation between ITV and ISQs was analysed using Spearman's rank correlation. All data analyses were performed with two-sided tests using SPSS version 29.0 (IBM Corp., Armonk, NY, USA), and p<0.05 was considered statistically significant.
3. Results
3.1. Classification by ITV
The classifications of the implants according to ITV were the following: Osstem implants: <30 N/cm, n=3; 30–40 N/cm, n=38; 40–50 N/cm, n=14; >50 N/cm, n=2; Toplan implants: <30 N/cm, n=3; 30–40 N/cm, n=65; 40–50 N/cm, n=15; >50 N/cm, n=4 (Table 2).
3.2. Comparison of Mean ISQ between Osstem and Toplan Implants
The comparison of the mean ISQs between Osstem and Toplan implants at three time points (implant placement date, 1 month post-surgery, and 2–3 months post-surgery) showed no statistically significant difference at any time point. Both implants showed significant increases in the ISQs over time (Table 3).
3.3. Changes in ISQs according to Measurement Timing and Factors
Osstem and Toplan implants differed among ISQ t1, ISQ t2, and ISQ t3 in all factors, except for the Osstem implant with a diameter ≤4.0 mm (p=0.002 or p<0.001). Osstem implants differed significantly in terms of bone quality and implant location between the ISQ t1 and ISQ t2 groups (p=0.001 and p<0.001, respectively). Toplan implants differed significantly in ISQ t1 depending on the diameter (p=0.021) (Table 4)
3.4. Correlation between ITV and ISQ
Significant correlations were found between ITV and ISQ t1 in Osstem implants (r=0.349, p<0.01), but no correlation was found between ITV and ISQ t1 in Toplan implants (r=0.026, p>0.05). In addition, for Osstem implants, significant correlations were found between ISQ t1 and ISQ t2 and between ISQ t2 and ISQ t3 (p<0.01) (Table 5). In Toplan implants, significant correlations were found between ISQ t1 and ISQ t2 (p<0.001), between ISQ t1 and ISQ t3 (p<0.001), and between ISQ t2 and ISQ t3 (p<0.001) (Table 6).
4. Discussion
SA surface treatment is an implant surface treatment technology that promotes fusion of the implant and alveolar bone [6]. In previous studies, implants with rough surfaces exhibited high bone fusion and rapid bone healing [7,8]. In this study, we compared and evaluated the stability of two Korean implants that underwent SA surface treatment in order to help consumers make an informed choice.
The primary stability of an implant is the immediate stability obtained upon implantation. It refers to the degree to which an implant is mechanically fixed to the bone and can be measured mainly using ITV and ISQ [9,11]. The initial stability of an implant is important because a higher initial stability leads to better bone adhesion and higher long-term success rate [11]. Therefore, to increase the initial stability of the implant, various variables such as the implant shape, patient bone quality, and surgical method should be considered. In this study, the ITV of Osstem implants showed a correlation with the ISQ during implantation, but there was no significant relationship with the ISQ thereafter. However, the ITV of the Toplan implants did not correlate with the ISQ value at any time point. The ITV has been recognised as a valid parameter for determining implant stability during implantation [11]. Greenstein and Cavallaro [9] reported that the tactile information obtained from surgical twist drills can help select the initial insertion torque to achieve implant stability. However, Lages et al. [13] argued that it is not possible to confirm whether there is a correlation between ITV and ISQ and whether it is an independent and incomparable method. When the results of previous studies and those of the present study are combined, it is believed that there are some limitations in verifying the initial stability through ITVs.
In this study, a significant increase in ISQs over time was observed in both the Osstem and Toplan implants. The Osstem implant had significantly higher ISQ t1 and ISQ t2 values in the D2 bone than in the D3 bone and significantly higher ISQs in the mandible than in the maxilla at all time points, suggesting that differences in bone quality and density have an effect on initial implant stability. For Toplan implants, the group with a diameter >4.0 mm had a higher initial ISQ than the group with a diameter ≤4.0 mm. This is consistent with a previous study showing that larger diameters increase the contact area between the bone and the implant, thereby improving primary stability [14].
The secondary stability is the stability at which implants and bones are biologically combined over time and are mainly formed during osseointegration. Osseointegration occurs as bone cells grow on the surface of the implant and generally proceeds for 1 to 3 months post-surgery [15]. Benic et al. [16] suggested ISQ ≥60–65 and ITV ≥20–45 N/cm as conditions for loading for single implant crown. In this study, both implants showed similar primary stability with Osstem (69.76±12.30) and Toplan (71.13±7.86) based on the ISQ on the day of implantation. In addition, the mean ISQs of the Toplan implants were slightly higher than those of the Osstem implants; however, this difference was not statistically significant, and both implants showed increased ISQs over time. Small differences in ISQs may be caused by minor differences in implant design or surface texture. However, SA surface treatment was consistent in both systems, which is likely a major factor contributing to osseointegration and initial stability. These results suggest that both systems are equivalent in terms of primary stability and are suitable for clinical use.
In addition, neither implant showed radiolucency around the fixture at the 1-year follow-up, and there were no cases of mobility or pain. One year after implantation, the implants were still providing functional services.
This study has limitations. It was difficult to sufficiently control for confounding variables because the study analysed retrospective data, and there were limitations in ensuring the accuracy and completeness of the study data. Therefore, in the future, a prospective study with more samples and additional studies are needed to evaluate the long-term clinical success rate of Korean implants.
5. Conclusions
Both Osstem and Toplan implants subjected to SA surface treatment showed a high level of primary stability when measured using ISQs. The primary stability did not significantly differ between the two implants, which is believed to provide credibility to the early loading and clinical use of both implants.
Author Contributions
Conceptualization, J.-H. M. and M.-J. C.; Methodology, S.-I. B., M.-J. C., J.-H. M.; Software, H.-G. J.; Validation, H.-G. J. and M.-J. C.; Formal Analysis, S.-I. B. and J.-H. M.; Investigation, M.-J. C.; Resources, M.-J. C.; Data Curation, S.-I. B.; Writing – Original Draft Preparation, S.-I. B.; Writing – Review & Editing, S.-I. B., J.-H. M., H.-G. J., J.-H. M.; Visualization, S.-I. B.; Supervision, J.-H. M.; Project Administration, J.-H. M. All authors have read and agreed to the published version of the manuscript.
Funding
This research received no external funding.
Institutional Review Board Statement
The study was conducted in accordance with the Declaration of Helsinki and approved by the Institutional Bioethics Committee of Cheongju University (1041107-202306-HR-007-01; 17 July 2023).
Informed Consent Statement
This study is a retrospective analysis, and therefore, obtaining written consent from patients was not required for the publication of this paper.
Data Availability Statement
The data presented in this study are available upon request from the corresponding author.
Conflicts of Interest
The authors declare no conflict of interest.
References
- Edelmayer, M.; Woletz, K.; Ulm, C.; Zechner, W.; Tepper, G. Patient information on treatment alternatives for missing single teeth—Systematic review. Eur J Oral Implantol. 2016, 9, 45-57. [CrossRef]
- Menini, M.; Bagnasco, F.; Calimodio, I.; Di Tullio, N.; Delucchi, F.; Baldi, D.; Pera, F. Influence of implant thread morphology on primary stability: A prospective clinical study. BioMed Research International. 2020, 2020, 6974050. [CrossRef]
- Oh, J.H.; Pyo, S.W.; Chang, J.S.; Kim, S.J.; Up to a 15-year survival rate and marginal bone resorption of 1780 implants with or without microthreads: A multi center retrospective study. Journal of Clinical Medicine. 2023, 12, 2425. [CrossRef]
- Lee, J.W.; Lim, Y.J.; Kim, B.J.; Koo, K.T. Early loading of mandibular molar single implants: 1 year results of a randomized controlled clinical trial. Materials. 2020, 13, 3912. [CrossRef]
- Lim, H.S.; Kim, S.G.; Oh, J.S. Comparison of clinical initial stability of hydroxy-apatite coated implant and sandblasted, large-grit and acid-etched implant. Maxillofacial Plastic and Reconstructive Surgery. 2012, 34, 112-116.
- Schupbach, P.; Glauser, R.; Bauer, S. Al2O3 particles on titanium dental implant systems following sandblasting and Acid-Etching process. International journal of biomaterials. 2019, 2019, 6318429.
- Buser, D.; Nydegger, T.; Hirt, H.P.; Cochran, D.L.; Nolte, L.P. Removal torque values of titanium implants in the maxilla of miniature pigs. Int J Oral Maxillofac Implants. 1998, 13, 611-619.
- Cochran, D.L.; Schenk, R.K.; Lussi, A.; Higginbottom, F.L.; Buser, D. Bone response to unloaded and loaded titanium implants with a sandblasted and acid-etched surface: A histometric study in the canine mandible. Journal of Biomedical Materials Research. 1998, 40, 1-11. [CrossRef]
- Greenstein, G.; Cavallaro, J. Implant insertion torque: Its role in achieving primary stability of restorable dental implants. Compend Contin Educ Dent. 2017, 38, 88-95.
- Berardini, M.; Trisi, P.; Sinjari, B.; Rutjes, A.W.; Caputi, S. The effects of high insertion torque versus low insertion torque on marginal bone resorption and implant failure rates: A systematic review with meta-analyses. Implant Dent. 2016, 25, 532-540.
- Bavetta, G.; Bavetta, G.; Randazzo, V.; Cavataio, A.; Paderni, C.; Grassia, V.; Dipalma, G.; Isacco, C.G.; Scarano, A.; Vito, D.D.; Cantore, S.; Ballini, A.; Inchingolo, F. A retrospective study on insertion torque and implant stability quotient (ISQ) as stability parameters for immediate loading of implants in fresh extraction sockets. BioMed Research International. 2019, 2019, 9720419. [CrossRef]
- Misch, C.E. Contemporary Implant Dentistry, Mosby Ltd, St. Louis, Missouri, 2008.
- Lages, F.S.; Douglas-de Oliveira, D.W.; Costa, F.O. Relationship between implant stability measurements obtained by insertion torque and resonance frequency analysis: A systematic review. Clin Implant Dent Relat Res. 2018, 20, 26-33. [CrossRef]
- Stoilov, M.; Shafaghi, R.; Stark, H.; Marder, M.; Kraus, D.; Enkling, N. Influence of Implant Macro-Design, -Length, and -Diameter on Primary Implant Stability Depending on Different Bone Qualities Using Standard Drilling Protocols—An In Vitro Analysis. Journal of Functional Biomaterials. 2023, 14, 469.
- Park, C.J.; Kim, D.G.; Cho, L.R. Initial changes of implant stability from installation during early bone healing. Journal of Dental Rehabilitation and Applied Science. 2013, 29, 272-279. [CrossRef]
- Benic, G.I.; Mir-Mari, J.; F Hämmerle, C.H. Loading protocols for single-implant crowns: A systematic review and meta-analysis. Int J Oral Maxillofac Implants. 2014, 29, 222-238. [CrossRef]

Table 1.
Comparison of the characteristics of the Osstem and Toplan implants used in this study.
| Characteristics | Osstem implant | Toplan implant |
|---|---|---|
| Manufacturer | Osstem Implant Co., Ltd | Toplan Co., Ltd |
| Model name | Osstem TS III | Toplan T01 |
| Body shape | 1.5° taper | Taper-straight-taper |
| Thread shape | Triangular thread | Triangular thread |
| Pitch height (mm) | 0.8 (double) | 0.9 (double) |
| Thread height (mm) | 0.45 | 0.4 |
Table 1.
Cont.
| Characteristics | Osstem implant | Toplan implant |
|---|---|---|
| Implant–abutment interface | Internal hex | Internal hex |
| Inclination angle of the thread flank (°) | 40 | 30 |
| Surface treatment | SA | SA |
| Microthreads | None | None |
| Figure of the implant | 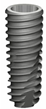 |
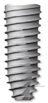 |
SA, sandblasting with alumina and acid etching. It was written based on the following: diameter, 4.0; length, 10 mm.
Table 2.
Classification of Osstem and Toplan implants by IVT.
| Classification of ITVs | Osstem implant (n=57) | Toplan implant (n=87) |
|---|---|---|
| <30 N/cm | 3 (5.26) | 3 (3.45) |
| 30–40 N/cm | 38 (66.67) | 65 (74.71) |
| 40–50 N/cm | 14 (24.56) | 15 (17.24) |
| >50 N/cm | 2 (3.51) | 4 (4.60) |
Values are presented as n (%). ITV, insertion torque value.
Table 3.
Comparison of mean ISQ of Osstem and Toplan implants.
| Groups | ISQ t1 | ISQ t2 | ISQ t3 | p-value† |
|---|---|---|---|---|
| Osstem implant (n=57) | 69.76±12.30 | 73.74±10.10 | 78.94±9.12 | <0.001 |
| Toplan implant (n=87) | 71.13±7.86 | 74.88±7.35 | 79.03±5.64 | <0.001 |
| p-value‡ | 0.416 | 0.462 | 0.944 |
Values are presented as mean±standard deviation. †p-values obtained from repeated-measures analysis of variance. ‡p-values obtained from independent samples t-test. ISQ t1, ISQ t2, and ISQ t3 are the implant stability quotients measured on the day of implant placement, 1 month post-surgery, and 2–3 months post-surgery, respectively.
Table 4.
Comparison of ISQs by factors and timing of measurement.
| n | Osstem implant | p-value† | n | Toplan implant | p-value† | ||||||
|---|---|---|---|---|---|---|---|---|---|---|---|
| ISQ t1 | ISQ t2 | ISQ t3 | ISQ t1 | ISQ t2 | ISQ t3 | ||||||
| Sex | Man | 33 | 71.00a (64.25, 5.00) |
76.00b (69.00, 0.50) |
82.00c (77.75, 5.50) |
<0.001 | 71 | 72.50a (69.00, 6.50) |
74.50b (70.00, 0.50) |
78.00c (75.00, 2.50) |
<0.001 |
| Woman | 24 | 72.50a (65.50, 79.38) |
73.25b (67.50, 2.00) |
76.50b (71.63, 5.63) |
0.002 | 16 | 72.50a (63.63, 9.50) |
75.50b (71.25, 0.00) |
80.75c (76.75, 5.00) |
<0.001 | |
| p-value‡ | 0.437 | 0.903 | 0.132 | 0.641 | 0.507 | 0.167 | |||||
| Bone type | D2 | 30 | 73.50a (70.38, 80.13) |
78.50b (71.50, 83.38) |
82.00c (77.88, 86.00) |
<0.001 | 42 | 74.25a (68.75, 9.50) |
77.00b (71.38, 80.50) |
80.00c (77.50, 2.13) |
<0.001 |
| D3 | 27 | 67.00a (56.50, 74.00) |
69.00a (66.00, 78.00) |
77.50b (71.00, 85.00) |
<0.001 | 45 | 72.00a (66.25, 5.00) |
72.50b (70.00, 80.00) |
77.00c (74.25, 5.75) |
<0.001 | |
| p-value‡ | 0.001 | 0.001 | 0.095 | 0.159 | 0.156 | 0.465 | |||||
| Implant location | Maxilla | 24 | 64.75a (56.13, 74.00) |
69.00a (65.25, 75.75) |
76.50b (71.00, 84.13) |
<0.001 | 45 | 72.00a (68.00, 5.00) |
74.00b (70.25, 80.00) |
78.00c (74.75, 5.75) |
<0.001 |
| Mandible | 33 | 73.00a (70.00, 79.75) |
78.50b (71.50, 82.75) |
82.00c (78.75, 86.00) |
<0.001 | 42 | 74.25a (67.00, 9.50) |
75.50b (70.75, 80.50) |
79.75c (75.38, 81.63) |
<0.001 | |
| p-value‡ | 0.001 | <0.001 | 0.027 | 0.219 | 0.743 | 0.643 | |||||
| Implant placement timing |
Immediately implanted | 27 | 71.00a (67.00, 75.00) |
76.00b (66.50, 81.00) |
80.00c (73.50, 82.50) |
<0.001 | 47 | 72.50a (68.50, 6.50) |
74.50b (71.00, 0.00) |
79.00c (75.00, 82.00) |
<0.001 |
| Delayed placement | 30 | 71.00a (63.13, 79.00) |
73.50b (68.88, 80.63) |
82.50c (77.50, 86.25) |
<0.001 | 40 | 72.00a (65.63, 6.50) |
75.00b (70.00, 2.38) |
80.25c (75.00, 84.75) |
<0.001 | |
| p-value‡ | 0.725 | 0.949 | 0.088 | 0.871 | 0.821 | 0.855 | |||||
| Implant diameter | ≤4.0 mm | 3 | 71.00a (60.00, 73.00) |
76.00a (43.00, 78.50) |
77.00a (42.50, 80.00) |
0.717 | 27 | 70.00a (62.00, 4.00) |
74.00b (69.50, 0.50) |
79.50c (75.00, 85.50) |
<0.001 |
| >4.0 mm | 54 | 71.00a (64.88, 77.50) |
74.50b (68.88, 81.00) |
81.25c (74.00, 86.00) |
<0.001 | 60 | 74.50a (69.13, 7.25) |
75.00b (71.13, 0.00) |
78.75c (75.00, 82.38) |
<0.001 | |
| p-value‡ | 0.579 | 0.532 | 0.138 | 0.021 | 0.666 | 0.797 | |||||
| Implant length | ≤10 mm | 17 | 70.00a (63.75, 77.50) |
72.00b (69.00, 80.50) |
81.00b (73.75, 85.50) |
<0.001 | 32 | 72.00a (64.25, 75.00) |
72.50b (70.00, 79.13) |
77.75c (75.00, 81.38) |
<0.001 |
| >10 mm | 40 | 71.25a (65.38, 77.38) |
76.00b (68.50, 80.88) |
80.50c (74.00, 85.75) |
<0.001 | 55 | 72.50a (68.50, 77.50) |
75.50b (71.00, 80.50) |
79.50c (75.00, 85.00) |
<0.001 | |
| p-value‡ | 0.663 | 0.972 | 0.727 | 0.197 | 0.137 | 0.420 | |||||
Values are presented as median (min, max). †p-value obtained by Friedman's analysis of variance. ‡p-value obtained by Mann–Whitney test. a,b,cDifferent letters indicate significant difference in Friedman's Wilcoxon signed-rank post-analysis. ISQ t1, ISQ t2, and ISQ t3 are the implant stability quotients measured on the day of implant placement, 1 month post-surgery, and 2–3 months post-surgery, respectively.
Table 5.
Correlation between ITV and ISQ in Osstem implant.
| ITV | ISQ t1 | ISQ t2 | ISQ t3 | |
|---|---|---|---|---|
| ITV | 1 | |||
| ISQ t1 | 0.349** | 1 | ||
| ISQ t2 | 0.204 | 0.666*** | 1 | |
| ISQ t3 | −0.190 | 0.202 | 0.340** | 1 |
*p<0.05, **p<0.01, ***p<0.001. Spearman's rank correlation analysis was used. ISQ t1, ISQ t2, and ISQ t3 are the implant stability quotients measured on the day of implant placement, 1 month post-surgery, and 2–3 months post-surgery, respectively.
Table 6.
Correlation between ITV and ISQs in Toplan implant.
| ITV | ISQ t1 | ISQ t2 | ISQ t3 | |
|---|---|---|---|---|
| ITV | 1 | |||
| ISQ t1 | 0.026 | 1 | ||
| ISQ t2 | −0.011 | 0.557*** | 1 | |
| ISQ t3 | 0.075 | 0.359*** | 0.781*** | 1 |
*p<0.05, **p<0.01, ***p<0.001. Spearman's rank correlation analysis was used. ISQ t1, ISQ t2, and ISQ t3 are the implant stability quotients measured on the day of implant placement, 1 month post-surgery, and 2–3 months post-surgery, respectively.
Disclaimer/Publisher’s Note: The statements, opinions and data contained in all publications are solely those of the individual author(s) and contributor(s) and not of MDPI and/or the editor(s). MDPI and/or the editor(s) disclaim responsibility for any injury to people or property resulting from any ideas, methods, instructions or products referred to in the content. |
© 2024 by the authors. Licensee MDPI, Basel, Switzerland. This article is an open access article distributed under the terms and conditions of the Creative Commons Attribution (CC BY) license (http://creativecommons.org/licenses/by/4.0/).
Copyright: This open access article is published under a Creative Commons CC BY 4.0 license, which permit the free download, distribution, and reuse, provided that the author and preprint are cited in any reuse.


