Submitted:
13 February 2025
Posted:
14 February 2025
You are already at the latest version
Abstract
Brain drain represents a critical challenge to global development, reflecting structural inequalities and tensions between mobility and rootedness. This study analyzes the determinants of skilled migration in 178 countries (2006-2022) using a regression model based on panel data, identifying six key variables: uneven economic development, quality of public services, external intervention, voice and accountability, rule of law, and political stability. Governance, particularly political stability and the rule of law, stands out as crucial for retaining talent, while external interventions and economic inequality exacerbate emigration. From a sociological perspective, migrants are active agents who transform transnational networks, challenging traditional notions of citizenship and belonging. Civil society organizations play a central role by facilitating sociocultural inclusion, mediating resettlement processes, and promoting brain circulation as an alternative to retention-focused models. Additionally, the study highlights the cultural and symbolic dimension of migration, revealing the impact of uprooting on communities of origin. Future research should explore how inclusive policies, digital nomadism, and remittances can reduce structural inequalities, strengthen the connection between migrants and their communities, and advance towards a sustainable and equitable mobility model.
Keywords:
brain migration
; worldwide governance
; structural inequalities
; unbalanced development
; global dynamics
; transnational relations
1. Introduction
1.1. International Human Mobility
Human mobility, as a complex and multifaceted process, is not only determined by economic or social factors, but also by citizenship, understood as a fundamental link between individuals and the State, which plays a crucial role in migratory flows and migration-related decisions. Citizenship, in this context, goes beyond simple legal status; it becomes a key to understanding the dynamics of inclusion and exclusion that migrants face in destination countries.
Migration, being influenced by the opportunities perceived in receiving countries, is closely linked to citizenship policies and the ways in which States manage belonging. Citizenship not only defines the rights and obligations of individuals within a territory but also regulates access to resources and opportunities that motivate migration. Migrants, when crossing borders, face political structures that grant or limit rights according to nationality, creating a system of stratification that profoundly affects their living conditions and well-being (De Haas, 2021).
The concept of political transnationalism highlights how migrants maintain political and cultural ties with their countries of origin while, at the same time, they must negotiate their belonging and rights in the receiving countries. Citizenship, understood from a transnational perspective, is not limited to affiliation with a single state, but encompasses multiple dimensions of belonging that influence the political and social identity of migrants (Bauböck, 2003). This interaction between different spheres of citizenship transforms not only the experiences of migrants, but also the political dynamics of countries of origin and destination, creating new forms of citizenship that cross borders and challenge traditional notions of nation-state.
Exclusion, for example, not only manifests itself in limited access to basic rights, such as health or education, but also materializes in migratory policies that restrict access to citizenship for certain groups. By establishing conditions that vary according to nationality, social status and gender, immigration laws reproduce structural inequalities. Migrants, especially those in an irregular situation, are often considered as “second-class citizens,” subject to externalization, privatization, and securitization policies that limit their mobility and access to fundamental rights (Spijkerboer, 2018). Thus, citizenship becomes a powerful tool to control who can move freely and who are excluded, deepening global divisions.
On the other hand, human mobility also has an internal dimension, related to citizenship in terms of the relative comparison between migrants and non-migrants. Access to opportunities outside the country of origin not only responds to the search for better income, but also to the need to improve one's relative position within the community or reference group. The decision to migrate, as shown in studies such as that of Stark & Taylor (1989), is based not only on a desire to achieve a higher absolute standard of living, but also on overcoming perceived inequalities within their own social, political and economic context.
Citizenship, in this sense, not only regulates access to resources within the national territory but also influences how migrants manage their transnational relationships. Remittances, for example, are not only an economic act, but a transnational practice that reflects structural inequalities between countries and the different types of citizenship that derive from them. Migrants, by sending money to their families in their countries of origin, are engaging in a political practice that reinforces their connection to their country of origin, while managing exclusion and uncertainty in their country of destination (Carling, 2008).
In conclusion, citizenship plays a central role in human mobility, not only as a tool for inclusion or exclusion within national frameworks, but as a determining factor that cuts across transnational relations, collective identities and conceptions of rights and belonging. Mobility is not only determined by the physical movements of people, but also by the legal, political and social links that connect them to various forms of citizenship, both in countries of origin and destination. As Massey et al. (1993) point out, citizenship, as a fundamental component of migratory processes, must be understood within a framework that integrates the structural, economic and political aspects of migration and addresses the inequalities that derive from the hierarchies of citizenship that regulate these flows.
1.2. Brain Drainage, Gain, and Circulation
Brain drain is a phenomenon that has been studied for more than 50 years, affects not only the human capital of countries, but also the identity and future of their citizens. As skilled professionals, such as scientists and physicians, seek better opportunities abroad, the impact of this migration goes beyond economics; it profoundly affects communities and the well-being of the people left behind (Docquier et al., 2012, Hillier et al 2020, Vega-Muñoz et al., 2021). The departure of these individuals creates gaps in the social fabric and in the systems that support the country's development, altering the quality of life of citizens.
This phenomenon generates two key effects: on the one hand, prospective migration can encourage people to invest more in their education, as they see greater opportunities abroad (Beine et al., 2001, Khan, 2021). However, when migration occurs, the effects are more problematic: the loss of professionals leads to a shortage of essential services and increases reliance on remittances, which negatively impacts the daily lives of families and local communities (Castro-Palaganas et al., 2017).
For this reason, to prevent the brain drain from affecting the quality of life of citizens, it is crucial that countries offer attractive working conditions, good salaries and work environments that foster satisfaction and career development within the country (Usman et al., 2022, Torrisi et al., 2020, Lanko, 2022). By creating these spaces, it contributes not only to economic development, but also to the well-being of society, preventing citizens from seeing migration as the only way out.
In a more positive approach, brain circulation, which involves not only migration but also the return of qualified professionals to their country, can benefit both individuals and communities. Returnees can share their experience and knowledge, becoming agents of change and helping to improve local conditions. This strengthens citizenship by connecting individuals to their country of origin, promoting international cooperation and the creation of scientific networks that favor common development (Velema, 2012; Jons, 2009).
In this context, policies that favor the attraction and retention of talent not only have an economic impact but are also an investment in the future of citizens. Promoting “brain circulation” would transform what is traditionally considered a drain into an opportunity to improve the quality of life and social development of all those involved, both inside and outside the country (Mao et al., 2022; Daugeliene et al., 2009). Policies that allow citizens to build and strengthen their future in their own country can be key to achieving a balance between talent that stays and talent that leaves, benefiting society as a whole.
Although a corpus of studies focusing on destination countries (Beverelli et al., 2019, Djajic et al, 2019, Abdelwahed et al., 2020) proposes the need for a change of focus in relation to the loss of advanced intellectual capital in source countries. And studies are currently reframing their orientation towards brain gain (Carrasco et al., 2019, Djajic et al, 2019, Staniscia et al., 2020, Boc, 2020, Max-well et al., 2020, Naito, et al., 2020), and ideas of migratory dynamics present in brain circulation (Carrasco et al., 2019, De-la-Vega-Hernandez et al., 2020, Staniscia et al., 2020, Boc, 2020, Kahn et al. 2019, Kramer et al., 2019, Li et al., 2020, Varma et al., 2020, Wang, et al., 2020). Quantitative empirical studies continue to focus on the brain drain and a limited number of determinants of the brain drain.
2. Literature Review
The brain drain phenomenon is a significant concern for many countries (Vega-Muñoz et al., 2021), as the migration of highly skilled individuals exacerbates structural inequalities and challenges social cohesion, placing emphasis on understanding its underlying determinants (Ienciu & Ienciu, 2015). These effects are tied to labor shortages and demographic shifts that disrupt the social fabric and economic sustainability of both sending and receiving societies (Thaut, 2009), and its determinants can be structured in social factors, both political and economic.
2.1. Political Factors and Citizenship: Implications of the Brain Drain
Brain drain is closely linked to political factors such as instability, corruption and lack of trust in institutions (Fetzer & Millan, 2015). Mistrust in the political system and corruption are key in the emigration of skilled professionals, especially in contexts of political crisis, conflict, and violence (Cooray & Schneider, 2016; Monekosso, 2014; Mainali, 2020, Subhani, Tajuddin, & Diah, 2018). In the health sector, political instability also motivates the emigration of professionals, which severely affects countries in crisis (Marchal & Kegels, 2003; Abou Hashish & Ashour, 2020).
Factors such as external intervention and destabilization in specific regions, such as Iraq and Afghanistan, intensify brain drain (Chee & Mu, 2021). In addition, governmental stability and a strong security apparatus are crucial to mitigate talent drain by fostering trust in local institutions (Vega-Muñoz et al., 2024b). In island countries, poor debt management affects the provision of essential services, while, in countries such as Yemen, conflict deteriorates higher education and exacerbates talent loss (Moloney, 2019; Al-Munifi & Aleryani, 2021). In contrast, in places like Canada, public policies of social cohesion help reduce emigration (Kesselman, 2001).
Research points out that emigration of highly skilled individuals is often motivated by political dissatisfaction, lack of trust in institutions and a general feeling of dissatisfaction with governance (Fakih & El Baba, 2023). Furthermore, Strielkowski et al. (2021) examine how geopolitical factors and multiculturalism influence brain drain, linking it to national security concerns and highlighting the strategic importance of retaining skilled labor. However, in Thailand, wage disparities encourage emigration, which weakens public services (Nittayaramphong & Tangcharoen-sathien, 1994). In Azerbaijan, reliance on public services influences migration decisions (Aliyev & Gasimov, 2023). Thus, in rural areas, the “triple helix” or collaboration between academia, government and industry to foster innovation and economic development improves services and favors talent retention (Leydesdorff & Etzkowitz, 1996; Knauer, 2009; Pejanovic et al., 2015). Finally, the limited sustainability of public systems complicates service provision in developing countries (Larsen, 2008). These findings underscore the importance of strengthening public services to reduce brain drain.
Some tangible examples of this phenomenon are found in sub-Saharan Africa, where corruption and weak institutions aggravate talent drain (Usman et al., 2022; Ndjobo & Simoes, 2021), while, in countries such as Greece and Serbia, corruption and university inefficiency accelerate academic emigration (Panagiotakopoulos, 2020). In Pakistan, brain drain reinforces structural inequalities and limits innovation (Khalid & Qureshi, 2020; Nadeem et al., 2021). Moreover, weak rule of law in developing countries is an obstacle to sustainable development (Barnett, Cummings & Vaaler, 2012). And the lack of a strong rule of law can stifle innovation and development, contributing to brain drain, as skilled professionals seek safer places with better conditions to invest their talent (Nadeem et al., 2021).
Also, cases such as Venezuela and Russia reflect how these dynamics perpetuate mass emigration and undermine essential sectors (Zea, 2020; Safina, 2015; Romanov, 2017). Simplice (2014) highlights that controlling corruption and investing in key sectors such as health are essential to stem the loss of human capital, while Simplice (2015) stresses that well-designed migration policies and strengthening human development are crucial to retain talent. Huang (2023) shows that the perception of stability determines emigration in contexts such as South Africa and the United States. In addition, corruption in social and migration systems in Zimbabwe, Africa and Asia-Pacific perpetuates the outflow of talent to developed countries (Mwapaura et al., 2022; Chand, 2019, Hugo, 2013).
Regarding the situation in China, one study suggests that urban amenities, such as public services and housing prices, are key to attracting talent and fostering development in the northeast of the country (Zhang, Hao, & Wang, 2024). Similarly, analysis of Canadian brain drain policy shows how political discourse on skills shortages becomes a discursive network that influences policy decisions (Goldberg, 2006). In Yemen, brain drain in academia is related to ineffective education policies and conflict (Muthanna & Sang, 2018).
Finally, student emigration in Albania and Romania, driven by economic and socio-political factors, also reflects a brain drain phenomenon that negatively affects local development (King & Gëdeshi, 2023, Iacob, 2018). The situation in Ukraine, aggravated by Russian aggression, underscores the importance of economic stability and structural reforms to improve economic security (Romanovska et al., 2022).
It can be said that the brain drain is linked to distrust in institutions, corruption and political instability. These factors affect citizenship by generating an environment of insecurity, which drives qualified professionals to emigrate. Lack of confidence in the political system limits development and innovation in countries, especially affecting sectors such as health and education.
2.2. Economic Development Factors Behind the Brain Drain
Another important factor contributing to brain drain is state fragility and regional imbalances. Seyoum and Camargo (2021) identify institutional weakness as a critical component that drives talent emigration and limits foreign direct investment. Carlsen and Bruggemann (2017) emphasize how these phenomena intensify problems such as economic deterioration and group grievances, affecting especially acutely during migration crises in Europe. For their part, Egyed and Zsibók (2023) propose that strengthening core economic activities could help reduce regional imbalances and mitigate the loss of talent.
Brain drain is mainly driven by economic factors, especially inequalities in employment and opportunities in countries of origin. Many skilled migrants seek better economic and employment prospects outside their countries due to economic crises or regional disparities (Hoti, 2009; Asso, 2021). Poverty in countries of origin also plays a crucial role, as it increases the intention to migrate, especially among the most vulnerable populations (Diallo, 2022).
Countries with greater economic stability and free markets have lower emigration rates, as skilled professionals prefer to stay where there are more opportunities and favorable conditions (Aarhus & Jakobsen, 2019). In contrast, receiving countries, with high demand for skilled labor, attract these migrants, despite offering relatively low wages, as the opportunity to improve their employment situation is significant (Thaut, 2009). Furthermore, Rogers (2008) highlights the negative impact of brain drain on economic growth. But, in the opposite direction, remittances sent by migrants are critical to the economies of their countries of origin, providing relief from joblessness and helping to improve national incomes (Thaut, 2009; Grigoryan & Khachatryan, 2022).
Wage and educational opportunities are another key motivation for emigration. Many emigrants seek better life prospects outside their countries, and labor and educational conditions in the receiving countries become determining factors in this process (Iqbala et al., 2020). For example, in Lithuania, after joining the EU, low wages and high unemployment accelerated the brain drain, affecting its economic development (Thaut, 2009).
Another factor contributing to the emigration of talent is institutional fragility and regional imbalances. State weakness, which translates into poor governance and lack of investment, limits economic development and generates higher emigration rates (Seyoum & Camargo, 2021). These problems are often intensified in times of migration crisis, such as in Europe, where economic and social tensions aggravate the situation (Carlsen & Bruggemann, 2017). Some experts, such as Egyed and Zsibók (2023), suggest that strengthening key economic activities in regions could help mitigate the loss of talent and reduce imbalances.
An example of how labor migration can have both a positive and negative impact is the case of Australia, which launched the Seasonal Worker Program (SWP) in 2012 to recruit Pacific labor in agriculture, with benefits for the countries and workers involved. In 2018, the program was extended to the Pacific Labour Scheme (PLS) for other sectors. In 2022, it was revamped as the Pacific Australia Labor Mobility (PALM), in response to worker shortages during the pandemic and geopolitical concerns. However, the program has raised concerns about exploitation and brain drain from Pacific Island Countries (PICS), mainly favoring Australian employers (Petrou & Connell, 2023).
While migration programs can benefit both sending and receiving countries, it is also critical to address inequalities and strengthen local economies to reduce the emigration of talent. Given that other social factors are at play and play a key role in the decision to migrate, especially social and territorial inequalities. Less developed regions, where there are strong social and economic disparities, are particularly prone to brain drain, as more skilled individuals seek better living conditions abroad (Asso, 2021). Young people from less affluent families, especially in rural or marginalized areas, are more susceptible to emigrate, due to the lack of job and educational opportunities in their country of origin (Dibeh et al., 2018).
Lack of access to quality education in sending countries also drives migration, as students and professionals in search of better educational opportunities move to countries with more advanced educational systems (Jovcheska, 2024, Subhani et al., 2018). In addition, living conditions and social expectations influence the decision to migrate, as people seek environments with higher quality of life, social stability and better opportunities for personal development (Fetzer & Millan, 2015). The existence of social networks and communities abroad also facilitates the decision to emigrate, as previous connections can reduce uncertainty and improve the chances of integration in the receiving country (Abou Hashish & Ashour, 2020).
Finally, strengthening domestic education could be a key strategy to mitigate the brain drain at the student stage, promoting development opportunities within the country itself (Kritz, 2015). Emigration, in many cases, is also a response to the lack of expectations of personal and professional improvement within the local social and economic context. Without leaving aside what Benhamou (2008) highlights how brain drain, linked to demographic pressures, aggravates problems such as migration due to desertification and mass migration in regions such as the Sahara, weakening local capacity to face challenges.
Thus, the brain drain drives by factors such as economic instability, poverty, and institutional weakness, especially affecting countries with high regional and social imbalances. Many skilled migrants seek better employment and educational opportunities in countries with high regional and social imbalances.
Indeed, the brain drain is a complex phenomenon that is directly linked to distrust in institutions, corruption and political and economic instability, factors that create an environment of insecurity that deeply affect citizens. These structural imbalances not only limit economic development but also impede innovation and growth in key sectors such as health and education. Institutional weaknesses and lack of confidence in the political system force many skilled professionals to emigrate in search of better jobs and educational opportunities in countries with more stable conditions. Poverty and strong social and regional imbalances further aggravate the situation, eroding the social fabric and making it difficult to build an active citizenry committed to the country's progress. Thus, the emigration of talent becomes a response to the lack of an adequate environment for economic development, being a clear reflection of the shortcomings that limit the welfare and integral development of society.
But it is of great importance to identify the beliefs that motivate the departure of potential emigrants, to design targeted policies to effectively manage skilled migration and reduce its negative impacts (Ramoo, Lee, & Yu, 2017, Vega-Muñoz et al., 2024). And this makes it relevant to consider as a research objective to comprehensively and comprehensively distinguish the reasons that determine the departure of escaped brains, to carry out actions that seem relevant to deal with this phenomenon. (See Figure 1).
3. Methods
Establishing the global determinants of Brain Drain (Human Flight and Brain Drain, E3) as in previous studies responds to causative variables such as (see Table 1, and details in Table A1 of Appendix A): Security Apparatus (C1), Economic Decline (E1), Uneven Economic Development (E2), Demographic Pressures (S1), External Intervention (X1), Voice and Accountability (G1), Political Stability and Absence of Violence/Terrorism (G2), Government Effectiveness (G3), Rule of Law (G5), and Control of Corruption (G6).
Then, null hypothesis: H0: β1 = β2 = β3 = β4 = β5 = β6 = β7 = β8 = β9 = β10 = β11 = 0, and alternative hypothesis: Ha: at least one βi ≠ 0 (i = 1, ..., 11).
As for the data under study, we have used a dataset available under the structure of global panel data on world governance (WGI) and state fragility (FSI) from 2006 to 2022 (Vega-Muñoz et al., 2024b). In particular, the FSI employs a mixed approach that combines qualitative and quantitative data to identify patterns and trends that may signal conflict risks. This process is based on global media analysis, international statistical data and expert qualitative review. Through three key phases – content analysis, quantitative data assessment and qualitative review – the results are triangulated to ensure accuracy and minimize bias (The Fund for Peace, 2025). Based on this dataset on 178 countries, we have applied multiple regression of equation 1:
E3 = β1*C1 + β2*E1 + β3*E2 + β4*P2 + β5*S1 + β6*X1 + β7*G1 + β8*G2 + β9*G3 + β10*G5 + β11*G6 + ε
The Human Flight and Brain Drain dependent variable E3 assesses the economic impact of the emigration of people, whether voluntary or forced, and its consequences on a country's development. This may include the emigration of the middle class and skilled professionals, such as entrepreneurs or doctors, who seek better opportunities due to the economic crisis in their country. It may also involve the forced displacement of intellectuals or professionals fleeing persecution or repression, which negatively affects the economy through the loss of skilled labor (The Fund for Peace, 2025, Vega-Muñoz et al., 2024b).
The dataset was treated by multiple linear regression with SPSS version 23 software (IBM, New York, NY, USA), using the stepwise method. For the incorporation of variables, the adjusted R-squared values (Chicco et al., 2021) were considered, but maintaining parsimony (McNeil, 1970) and without neglecting the multicollinearity results, expressed in terms of variance inflation factor (VIF) and condition indices. Multicollinearity is present when the VIF is greater than the range of 5 to 10 or the condition indices are greater than the range of 10 to 30 (Kim, 2019).
These opposite directions of the best values in the index variables, which come from the FSI and the WGI, imply that the betas (standardized coefficients) of each set of variables must have opposite signs in a model for it to make sense with respect to theoretical causality in brain drain. Likewise, the sets of FSI and WGI variables-indexes must have the same sign between them. Both conditions have been checked in each model explored before considering it a feasible model.
4. Results
Table 2 shows the summary of proposed models according to the regression coefficient (see details all explored models in Table A2 of Appendix B).
Complementarily, Table 3 shows the results of the Analysis of Variance (ANOVA) of the 10 models with adjusted R-squared greater than or equal 0.675 and reports the multicollinearity of these models. In this set of models, the importance of the variables Public Services (P2), X1, Uneven Economic Development (E2), Economic Decline (E1), Rule of Law (G5), Control of Corruption (G6), Security Apparatus (C1), Government Effectiveness (G3), Demographic Pressures (S1), stands out.
Table 3 shows that the 10 models present significant results in the F test. Thus, Figure 2 shows the adjusted R-squared values of the 10 models that do not present multicollinearity problems, it can be observed that model 4B achieves one of the highest R2 fit levels (67.9%), with only 4 explanatory variables of E3 (see Figure 2) and whose fit parameters are shown in Table 4.
By keeping the adjusted R-squared level close to 68%, model 4B gives a more parsimonious response to the independent variable, based on the variables: Public Services (P2), External Intervention (X1), Uneven Economic Development (E2), and Economic Decline (E1), the coefficients of model 6 are shown in detail in Table 5.
The model presents an adjusted R2 of 68% and therefore, brain drain is dependent on 4 variables. Thus, brain drain increases as the levels of Public Services (P2), External Intervention (X1), Uneven Economic Development (E2) and Economic Decline (E1) worsen (increase).
All 4 dependent variables are significant and there is no multicollinearity (details of the Condition Index in Table A3 of Appendix B). As for the normality of the errors, Figure 3 presents a histogram of the regression standardized residual with mean = -7.49*10-15 and a standard deviation of 0.999 (details of residuals statistics in Table A4 of Appendix B). The mean value of the standardized residuals is extremely close to zero, suggesting that, on average, there is no systematic bias in the errors of the ideal regression model, and the standard deviation close to 1 indicates that the residuals are uniformly distributed around the zero mean, suggesting that the errors have a standard dispersion in line with what is statistically expected.
5. Discussion
The proposed model establishes a relationship between brain drain and more specific variables than the traditional ones, such as Level of Development and Socio-Political Environment (Public Service and External Intervention) used by previous studies, such as those of Docquier et al. (2007), Foo (2011) and Ngoma et al. (2013), or the Economist Intelligence Unit's Quality of Life Index, added by Foo (2011). Our approach is closer to research such as that of Simplice (2015), who incorporates additional variables from the Global Development Index, such as Economic Considerations (Savings, Inflation and Population Growth), Political Considerations (Democracy and Control of Corruption), Physical Security (Freedom and Government Efficiency), Quality of Life (“Human Development” adjusted for inequality and Development Assistance), and Globalization (Foreign Investment and Trade Openness), as well as the study by Aliyev et al. (2023), which addresses variables such as perceived income sufficiency and life satisfaction.
Our work uses sociopolitical variables common to previous studies, such as Government Efficiency and Political Stability (Docquier et al., 2007, Foo, 2011, Ngoma et al., 2013, and Simplice, 2015), but also introduces additional variables, such as External Intervention, which turns out to be a particularity of our analysis. Like Simplice (2015), we have considered the measure of Physical Security. In addition, as in the work of Aliyev et al. (2023), our study addresses Unequal Economic Development and the relationship of citizens with the state through variables such as Public Services.
A key advantage of our model is the incorporation of data from 178 countries, which provides a broader global perspective on the socio-political and cultural dynamics driving skilled migration, in contrast to previous studies that have focused on fewer countries or have been limited to an economic focus. For example, Docquier et al. (2007) and Docquier & Marfouk (2006) analyzed 30 countries, with a primary focus on economic dimensions, while Simplice (2015) studied 24 countries, limiting himself to a similar analysis. Yakovlev and Steinkopf (2014) analyzed 144 countries, but their focus was restricted to medical brain drain, without exploring other sociocultural factors. Ngoma and Ismail (2013) addressed 102 countries, but used cross-sectional data, which did not allow capturing the complexity of migration as a phenomenon influenced by political, social and cultural dynamics. Our model seeks to fill this gap by emphasizing how structural inequalities, governance and socio-cultural factors interact to shape migration decisions.
As for the input variables, we have used a database (Vega et al., 2024b) that combines the Fragile States Index (Chee and Mu, 2021) and the Global Governance Indicators (Kizhakethalackal et al., 2015). In this regard, we have identified four beta predictors (βi) of our null hypothesis, for which we have no evidence to accept (the 4 are non-zero), recognizing the causality of variables present in other previous brain drain studies. These include variables already studied in brain drain research, such as:
- Public Services (P2), significantly influence migration decisions and the improvement of which could reduce emigration intentions as a key factor in attracting talent and fostering regional development, as studied by Aliyev & Gasimov (2023) in Azerbaijan and by Zhang et al, (2024) within China, highlighting the importance of these elements as determinants of brain drain.
- External Intervention (X1), as a determinant of brain drain, intensifies in contexts of instability and destabilization, as observed in countries such as Iraq and Afghanistan, where external intervention and terrorist attacks aggravate the conditions that contribute to brain drain (Chee & Mu, 2021). Thus, the most fragile states experience greater vulnerability, which favors the outflow of talent, further exacerbating the brain drain phenomenon (Chee & Mu, 2021),
- Uneven Economic Development (E2), which drives brain drain, as workers seek better opportunities abroad due to limited prospects at home, a phenomenon analyzed by Petrou & Connell (2023) in Oceania, where international mobility is influenced by unequal labor markets, and
- Economic Decline (E1) driven by state fragility and regional imbalances, is a key determinant of brain drain, as it limits labor opportunities and exacerbates social tensions, especially during migration crises, reinforcing the need to strengthen local economic activities to mitigate these effects (Seyoum & Camargo, 2021; Carlsen & Bruggemann, 2017; Egyed & Zsibók, 2023).
By integrating all these dimensions, our model provides a more complete understanding of brain drain, recognizing its relationship to global inequalities and the socio-political dynamics that influence migration decisions.
Although the concept of brain drain by definition incorporates bias in the selection of professionals (mainly physicians and health personnel, scientists and engineers), and the geographic and temporal coverage have been minimized given the dataset used. The measurement of brain drain, despite the complex methodological construction of E3 by The Fund for Peace, may be influenced by the lack of complete data on the emigration of professionals, which may lead to misinterpretations. In addition, cultural and political factors affect how the reasons for emigration are perceived, such as seeking better opportunities or fleeing persecution. And focusing mainly on the negative effects of brain drain, such as the loss of talent, without considering the long-term benefits, such as the return of professionals with international experience.
Future research should focus on adjusting migration models to consider economic development, trade blocks and geopolitical alliances to better understand how brain drain dynamics are influenced by socio-political variations of state stability. It is also essential to investigate how public policies, especially those focused on “brain gain” and “brain circulation,” can create fairer migration systems that benefit both sending and receiving countries and foster more inclusive global citizenship.
From a sociological perspective, in the future it is essential to study how inclusive policies, digital nomadism and remittances can act as mechanisms to reduce structural inequalities and strengthen transnational ties between migrants and their communities, promoting citizenship that transcends borders. Furthermore, diaspora-oriented policies should be analyzed to empower migrants as agents of change in their countries of origin, not only in terms of innovation and social cohesion, but also in the way they reconfigure their sense of citizenship.
Taken together, these forward-looking approaches can contribute to the creation of a more sustainable and inclusive model of international mobility that not only reduces inequalities but also reimagines migration and citizenship as transformative forces for global social development.
6. Conclusions
The model of brain drain determinants, after being subjected to the eleven-variable dependence test, demonstrates that the null hypothesis cannot be accepted for betas: β2, β3, β4, and β6. This reveals a set of four significant predictors that reflect the complex interplay of social, political, and economic forces driving skilled migration. These predictors highlight structural inequalities, governance challenges, and institutional deficiencies, emphasizing how systemic disparities influence individual mobility decisions and reshape the global distribution of talent. Thus, a set of four significant and parsimonious predictors based on panel data of 178 countries from 2006 to 2022 determines the brain drain dependence according to equation 2.
E3 = k + β4*P2 + β6*X1 + β3*E2 + β2*E1 + ε
With k, a base constant of the model and the following independent variables: Public Services (P2), External Intervention (X1), Uneven Economic Development (E2), Economic Decline (E1) and ε assume the residual errors. For the data set used the model is calibrated with normally distributed residual errors as follows in equation 3:
E3 = .259*P2 + .319*X1 + .185*E2 + .144*G1 + ε
The fact that the standardized residuals have a mean close to zero and a standard deviation of about 1 is an indication that the errors may follow a normal distribution. This is important because many hypothesis tests and the estimation of confidence intervals in regression depend on the assumption that the errors are normal. Additionally, the absence of systematic bias and adequate dispersion of the residuals suggest that the regression model is not making large or systematic errors in prediction, which is a sign that the model fits the data well.
Consequently, we can conclude that brain drain is influenced by four key variables that directly affect citizenship and social welfare. Brain drain tends to increase when state political and social stability factors worsen: Public Services (P2), External Intervention (X1), and economic development factors: Uneven Economic Development (E2) and Economic Decline (E1). Both categories of factors affect the quality of life and the sense of belonging of citizens, which drives emigration in search of better opportunities. Based on these four variables, brain drain can be managed by addressing each of them:
- Public services: improving the quality of education, healthcare, infrastructure and security can reduce emigration by making life in the home country more attractive.
- External intervention: promoting international cooperation programs, foreign investment and offering incentives to returned emigrants can help retain talent.
- Uneven economic development: encouraging development in disadvantaged regions, creating regional innovation clusters and promoting local entrepreneurship can reduce internal and external emigration.
- Economic decline: maintaining economic stability, creating jobs in key sectors and supporting economic diversification will generate more opportunities within the country, reducing the need to emigrate.
Thus, this study contributes to the understanding of the elements that affect the migration of highly skilled human capital and opens the way for future research that considers other variables that influence migratory movements from the perspective of citizenship.
Author Contributions
Conceptualization, A.V.-M and P.G.-G.d.M..; methodology, A.V.-M.; validation, N.C.-B.; formal analysis, A.V.-M.; data curation, A.V.-M., and N.C.-B.; writing—original draft preparation, A.V.-M. and N.C.-B.; writing—review and editing, A.V.-M. and P.G.-G.d.M.; supervision, P.G.-G.d.M.; project administration, A.V.-M. All authors have read and agreed to the published version of the manuscript.
Funding
The publication fee (APC) was partially financed by the Universidad Central de Chile (Code: APC2024) and Pontificia Universidad Católica de Valparaíso (Code: APC2024), through the publication incentive fund.
Institutional Review Board Statement
Not applicable.
Data Availability Statement
The original data presented in the study are openly available in Data in Brief at https://doi.org/10.1016/j.dib.2024.110167
Acknowledgments
The authors would like to thank the Doctoral Program in Political and Administration Sciences and International Relations (Faculty of Political Sciences and Sociology) at the Complutense University of Madrid (Spain), specifically at the research line “International relations: Dynamics of change in global society” for providing access to specialized bibliographic material.
Conflicts of Interest
The authors declare no conflicts of interest.
Appendix A

Table A1.
Description of the variables, potential determinants of Human Flight and Brain Drain.
| Variable | Operational Definitions by Vega-Muñoz et al. (2024b) |
|---|---|
| Human Flight and Brain Drain (E3) |
“Economic impact of human mobility (for economic or political reasons) and its consequences for a country’s development”. |
| Security Apparatus (C1) | “Threats to the security of a State, such as bombings, attacks and deaths in combat, rebel movements, riots, coups d’état or terrorism”. |
| Economic Decline (E1) | “Progressive economic decline patterns of society, as measured by per capita income, Gross National Product, unemployment rates, inflation, productivity, debt, poverty levels or business failures”. |
| Uneven Economic Development (E2) |
“Inequality within the economy, regardless of the actual economic performance, such as structural inequality based on group (racial, ethnic, religious, or other identity group) or based on education, economic status, or region (urban-rural divide)”. |
| Public Services (P2) | “Basic state functions serving the population, such as the essential services (health, education, water and sanitation, transportation infrastructure, electricity and energy, and Internet and connectivity), and the state’s capability to protect its citizens through effective police”. |
| Demographic Pressures (S1) | “Pressures on the State derived from the demographic dynamics of the population and its environment, related to the vital resources supply (food, access to drinking water and others), health, and those derived from extreme meteorological phenomena and environmental hazards”. |
| External Intervention (X1) | “Influence and impact of external actors on State functioning. Whether in security aspects, with covert or overt intervention in the internal affairs of a State at risk affecting the internal power balance, or with economic engagement by external actors creating economic dependence (large-scale loans, development projects or foreign aid, continuous budgetary support, control of finances or management of the State’s economic policy). Also considering humanitarian intervention, such as the deployment of an international peacekeeping mission”. |
| Voice and Accountability (G1) | “Citizen perception in a country regarding participation in government elections, freedom of expression, association, and the media”. |
| Political Stability and Absence of Violence/Terrorism (G2) | “Perception of political instability and/or politically motivated violence, including terrorism”. |
| Government Effectiveness (G3) | “Quality perception of public services and the civil service, and their independence from political pressures, the quality of policy formulation and implementation, and the credibility of the government’s commitment to those policies”. |
| Rule of Law (G5) | “Agents’ perceptions on trust and compliance with social rules, and in particular the quality of contractual compliance, property rights, the police, and the courts, as well as the likelihood of crime and violence”. |
| Control of Corruption (G6) | “Perception of the public power exercise for private benefit, including forms of small and large-scale corruption, as well as the "capture" of the state by elites and private interests”. |
Appendix B
Table A2.
Explored models summary for Human Flight and Brain Drain.
| Model | Predictors | R | R-Squared | Adjusted R-Squared | Std. Error of Estimation | Adequate Betas Sign | VIF ≤ 10 | Feasible Model |
|---|---|---|---|---|---|---|---|---|
| 1 | P2 | .776 | .602 | .601 | 1.296 | Yes | Yes | Yes |
| 2 | P2, X1 | .816 | .666 | .666 | 1.187 | Yes | Yes | Yes |
| 3 | P2, X1, E2 | .821 | .674 | .674 | 1.172 | Yes | Yes | Yes |
| 4A | P2, X1, E2, C1 | .821 | .674 | .674 | 1.172 | No | Yes | No |
| 4B | P2, X1, E2, E1 | .824 | .680 | .679 | 1.163 | Yes | Yes | Yes |
| 4C | P2, X1, E2, S1 | .821 | .675 | .674 | 1.172 | No | Yes | No |
| 4D | P2, X1, E2, G1 | .826 | .683 | .683 | 1.156 | No | Yes | No |
| 4E | P2, X1, E2, G2 | .825 | .680 | .680 | 1.162 | No | Yes | No |
| 4F | P2, X1, E2, G3 | .822 | .675 | .675 | 1.171 | Yes | Yes | Yes |
| 4G | P2, X1, E2, G5 | .822 | .676 | .676 | 1.169 | Yes | Yes | Yes |
| 4H | P2, X1, E2, G6 | .822 | .676 | .676 | 1.169 | Yes | Yes | Yes |
| 5B1 | P2, X1, E2, E1, C1 | .824 | .680 | .679 | 1.163 | Yes | Yes | Yes |
| 5B2 | P2, X1, E2, E1, S1 | .824 | .680 | .679 | 1.163 | No | Yes | No |
| 5B3 | P2, X1, E2, E1, G1 | .830 | .688 | .688 | 1.147 | No | Yes | No |
| 5B4 | P2, X1, E2, E1, G2 | .827 | .685 | .684 | 1.154 | No | Yes | No |
| 5B5 | P2, X1, E2, E1, G3 | .824 | .680 | .679 | 1.163 | Yes | Yes | Yes |
| 5B6 | P2, X1, E2, E1, G5 | .825 | .681 | .680 | 1.161 | Yes | Yes | Yes |
| 5B7 | P2, X1, E2, E1, G6 | .825 | .681 | .680 | 1.161 | Yes | Yes | Yes |
| 5F1 | P2, X1, E2, G3, C1 | .822 | .675 | .675 | 1.171 | No | Yes | No |
| 5F2 | P2, X1, E2, G3, E1 * | .824 | .680 | .679 | 1.163 | Yes | Yes | Yes |
| 5F3 | P2, X1, E2, G3, S1 | .824 | .675 | .674 | 1.171 | No | Yes | No |
| 5F4 | P2, X1, E2, G3, G1 | .830 | .689 | .689 | 1.145 | No | Yes | No |
| 5F5 | P2, X1, E2, G3, G2 | .826 | .682 | .682 | 1.158 | No | Yes | No |
| 5F6 | P2, X1, E2, G3, G5 | .823 | .677 | .676 | 1.168 | No | No (G3, G5) | No |
| 5F7 | P2, X1, E2, G3, G6 | .822 | .676 | .676 | 1.169 | No | No (G3) | No |
| 5G1 | P2, X1, E2, G5, C1 | .823 | .677 | .676 | 1.168 | No | Yes | No |
| 5G2 | P2, X1, E2, G5, E1 * | .825 | .681 | .680 | 1.161 | Yes | Yes | Yes |
| 5G3 | P2, X1, E2, G5, S1 | .822 | .676 | .676 | 1.169 | No | No (P2) | No |
| 5G4 | P2, X1, E2, G5, G1 | .835 | .698 | .698 | 1.129 | No | Yes | No |
| 5G5 | P2, X1, E2, G5, G2 | .829 | .687 | .686 | 1.150 | No | Yes | No |
| 5G6 | P2, X1, E2, G5, G3 | .823 | .677 | .676 | 1.168 | No | No (G3, G5) | No |
| 5G7 | P2, X1, E2, G5, G6 | .822 | .676 | .676 | 1.169 | Yes | No (G5) | No |
| 5H1 | P2, X1, E2, G6, C1 | .823 | .677 | .676 | 1.168 | No | Yes | No |
| 5H2 | P2, X1, E2, G6, E1 * | .825 | .681 | .680 | 1.161 | Yes | Yes | Yes |
| 5H3 | P2, X1, E2, G6, S1 | .822 | .676 | .676 | 1.169 | No | Yes | No |
| 5H4 | P2, X1, E2, G6, G1 | .833 | .695 | .694 | 1.135 | No | Yes | No |
| 5H5 | P2, X1, E2, G6, G2 | .829 | .687 | .686 | 1.150 | No | Yes | No |
| 5H6 | P2, X1, E2, G6, G3 * | .822 | .676 | .676 | 1.169 | No | No (G3) | No |
| 5H7 | P2, X1, E2, G6, G5 * | .822 | .676 | .676 | 1.169 | Yes | No (G5) | No |
| 6B11 | P2, X1, E2, E1, C1, S1 | .824 | .680 | .679 | 1.163 | No | No (P2) | No |
| 6B12 | P2, X1, E2, E1, C1, G1 | .832 | .690 | .689 | 1.144 | No | Yes | No |
| 6B13 | P2, X1, E2, E1, C1, G2 | .829 | .688 | .687 | 1.148 | No | Yes | No |
| 6B14 | P2, X1, E2, E1, C1, G3 | .824 | .680 | .679 | 1.163 | No | Yes | No |
| 6B15 | P2, X1, E2, E1, C1, G5 | .825 | .681 | .680 | 1.161 | No | Yes | No |
| 6B16 | P2, X1, E2, E1, C1, G6 | .825 | .681 | .680 | 1.161 | No | Yes | No |
| 6B51 | P2, X1, E2, E1, G3, C1 * | .824 | .680 | .679 | 1.163 | No | Yes | No |
| 6B52 | P2, X1, E2, E1, G3, S1 | .824 | .680 | .679 | 1.163 | No | No (P2) | No |
| 6B53 | P2, X1, E2, E1, G3, G1 | .832 | .692 | .691 | 1.141 | No | Yes | No |
| 6B54 | P2, X1, E2, E1, G3, G2 | .828 | .685 | .685 | 1.152 | No | Yes | No |
| 6B55 | P2, X1, E2, E1, G3, G5 | .826 | .682 | .681 | 1.159 | No | No (G3, G5) | No |
| 6B56 | P2, X1, E2, E1, G3, G6 | .826 | .682 | .681 | 1.159 | No | No (G3) | No |
| 6B61 | P2, X1, E2, E1, G5, C1 * | .825 | .681 | .680 | 1.161 | No | Yes | No |
| 6B62 | P2, X1, E2, E1, G5, S1 | .825 | .681 | .680 | 1.161 | No | No (P2) | No |
| 6B63 | P2, X1, E2, E1, G5, G1 | .837 | .700 | .700 | 1.125 | No | Yes | No |
| 6B64 | P2, X1, E2, E1, G5, G2 | .830 | .690 | .689 | 1.145 | No | Yes | No |
| 6B65 | P2, X1, E2, E1, G5, G3 * | .826 | .682 | .681 | 1.159 | No | No (G3, G5) | No |
| 6B66 | P2, X1, E2, E1, G5, G6 | .825 | .681 | .680 | 1.161 | Yes | No (G5) | No |
| 6B71 | P2, X1, E2, E1, G6, C1 | .825 | .681 | .680 | 1.161 | No | Yes | No |
| 6B72 | P2, X1, E2, E1, G6, S1 | .825 | .681 | .680 | 1.161 | No | No (P2) | No |
| 6B73 | P2, X1, E2, E1, G6, G1 | .835 | .698 | .697 | 1.129 | No | Yes | No |
| 6B74 | P2, X1, E2, E1, G6, G2 | .831 | .690 | .689 | 1.144 | No | Yes | No |
| 6B75 | P2, X1, E2, E1, G6, G3 | .826 | .682 | .681 | 1.159 | No | No (G3) | No |
| 6B76 | P2, X1, E2, E1, G6, G5 | .825 | .681 | .680 | 1.161 | No | No (G5, G6) | No |
| 11 | C1, E1, E2, P2, S1, X1, G1, G2, G3, G5, G6 | .845 | .715 | .714 | 1.099 | No | No (P2, G3, G5, G6) | No |
| 10A | C1, E1, E2, S1, X1, G1, G2, G3, G5, G6 | .844 | .712 | .711 | 1.103 | No | No (G3, G5, G6) | No |
| 10B | C1, E1, E2, P2, S1, X1, G1, G2, G5, G6 | .844 | .713 | .712 | 1.102 | No | No (P2, G5) | No |
| 10C | C1, E1, E2, P2, S1, X1, G1, G2, G3, G6 | .842 | .709 | .709 | 1.108 | No | No (P2, G3) | No |
| 10D | C1, E1, E2, P2, S1, X1, G1, G2, G3, G5 | .844 | .712 | .711 | 1.103 | No | No (P2, G3, G5) | No |
| 9A1 | C1, E1, E2, S1, X1, G1, G2, G5, G6 | .843 | .711 | .710 | 1.105 | No | No (G5) | No |
| 9A2 | C1, E1, E2, S1, X1, G1, G2, G3, G6 | .841 | .707 | .706 | 1.113 | No | No (G3) | No |
| 9A3 | C1, E1, E2, S1, X1, G1, G2, G3, G5 | .842 | .710 | .709 | 1.108 | No | No (G3, G5) | No |
| 9B1 | C1, E1, E2, S1, X1, G1, G2, G5, G6 | .843 | .711 | .710 | 1.105 | No | No (G5) | No |
| 9B2 | C1, E1, E2, P2, S1, X1, G1, G2, G6 | .842 | .709 | 709 | 1.108 | No | No (P2) | No |
| 9C1 | C1, E1, E2, S1, X1, G1, G2, G3, G6 | .841 | .707 | .706 | 1.113 | No | No (G3, G6) | No |
| 9C2 | C1, E1, E2, P2, S1, X1, G1, G2, G6 | .842 | .709 | .709 | 1.108 | No | No (P2) | No |
| 9D1 | C1, E1, E2, S1, X1, G1, G2, G3, G5 | .842 | .710 | .709 | 1.108 | No | No (G3, G5) | No |
| 9D2 | C1, E1, E2, P2, S1, X1, G1, G2, G5 | .843 | .711 | .710 | 1.105 | No | No (P2) | No |
| 9D3 | C1, E1, E2, P2, S1, X1, G1, G2, G3 | .837 | .701 | .700 | 1.125 | No | No (P2) | No |
| 8A11 | C1, E1, E2, S1, X1, G1, G2, G6 | .841 | .707 | .706 | 1.113 | No (G1, G2) | Yes | No |
| 8A21 | C1, E1, E2, S1, X1, G1, G2, G6 * | .841 | .707 | .706 | 1.113 | No (G1, G2) | Yes | No |
| 8A31 | C1, E1, E2, S1, X1, G1, G2, G5 | .842 | .709 | .709 | 1.108 | No (G1, G2) | Yes | No |
| 8A32 | C1, E1, E2, S1, X1, G1, G2, G3 | .835 | .697 | .696 | 1.131 | No (G1, G2) | Yes | No |
| 8B11 | C1, E1, E2, S1, X1, G1, G2, G6 * | .841 | .707 | .706 | 1.113 | No (G1, G2) | Yes | No |
| 8B21 | C1, E1, E2, S1, X1, G1, G2, G6 * | .841 | .707 | .706 | 1.113 | No (G1, G2) | Yes | No |
| 8C11 | C1, E1, E2, S1, X1, G1, G2, G6 * | .841 | .707 | .706 | 1.113 | No (G1, G2) | Yes | No |
| 8C12 | C1, E1, E2, S1, X1, G1, G2, G3 * | .835 | .697 | .696 | 1.131 | No (G1, G2) | Yes | No |
| 8C21 | C1, E1, E2, S1, X1, G1, G2, G6 * | .841 | .707 | .706 | 1.113 | No (G1, G2) | Yes | No |
| 8D11 | C1, E1, E2, S1, X1, G1, G2, G5 * | .842 | .709 | .709 | 1.108 | No (G1, G2) | Yes | No |
| 8D12 | C1, E1, E2, S1, X1, G1, G2, G3 * | .835 | .697 | .696 | 1.131 | No (G1, G2) | Yes | No |
| 8D21 | C1, E1, E2, S1, X1, G1, G2, G5 * | .842 | .709 | .709 | 1.108 | No (G1, G2) | Yes | No |
| 8D31 | C1, E1, E2, S1, X1, G1, G2, G3 * | .835 | .697 | .696 | 1.131 | No (G1, G2) | Yes | No |
| 7A111 | C1, E1, E2, S1, X1, G2, G6 | .828 | .686 | .686 | 1.151 | No (G2) | Yes | No |
| 7A112 | C1, E1, E2, S1, X1, G1, G6 | .834 | .696 | .695 | 1.133 | No (G1) | Yes | No |
| 7A311 | C1, E1, E2, S1, X1, G2, G5 | .828 | .686 | .685 | 1.152 | No (G2) | Yes | No |
| 7A312 | C1, E1, E2, S1, X1, G1, G5 | .836 | .699 | .698 | 1.127 | No (G1) | Yes | No |
| 7A321 | C1, E1, E2, S1, X1, G2, G3 | .826 | .682 | .681 | 1.159 | No (G2) | Yes | No |
| 7A321 | C1, E1, E2, S1, X1, G1, G3 | .831 | .690 | .689 | 1.145 | No (G1) | Yes | No |
| 6A1111 | C1, E1, E2, S1, X1, G6 | .822 | .676 | .675 | 1.170 | No (C1) | Yes | No |
| 6A1121 | C1, E1, E2, S1, X1, G6 * | .822 | .676 | .675 | 1.170 | No (C1) | Yes | No |
| 6A3111 | C1, E1, E2, S1, X1, G5 | .822 | .676 | .675 | 1.170 | No (C1) | Yes | No |
| 6A3121 | C1, E1, E2, S1, X1, G5 * | .822 | .676 | .675 | 1.170 | No (C1) | Yes | No |
| 6A3211 | C1, E1, E2, S1, X1, G3 | .821 | .673 | .673 | 1.174 | Yes | Yes | Yes |
| 6A3211 | C1, E1, E2, S1, X1, G3 * | .821 | .673 | .673 | 1.174 | Yes | Yes | Yes |
| 5A11111 | E1, E2, S1, X1, G6 | .822 | .676 | .675 | 1.170 | Yes | Yes | Yes |
| 5A11211 | E1, E2, S1, X1, G6 * | .822 | .676 | .675 | 1.170 | Yes | Yes | Yes |
| 5A31111 | E1, E2, S1, X1, G5 | .822 | .675 | .675 | 1.170 | Yes | Yes | Yes |
| 5A31211 | E1, E2, S1, X1, G5 * | .822 | .675 | .675 | 1.170 | Yes | Yes | Yes |
Table A3.
Collinearity Diagnostics Model 4B for the dependent variable Human Flight and Brain Drain.
Table A3.
Collinearity Diagnostics Model 4B for the dependent variable Human Flight and Brain Drain.
| Dimension | Eigenvalue | Condition Index | Variance Proportions | ||||
|---|---|---|---|---|---|---|---|
| (Constant) | P2 | X1 | E2 | E1 | |||
| 1 | 4.816 | 1.000 | .00 | .00 | .00 | .00 | .00 |
| 2 | .097 | 7.039 | .53 | .05 | .05 | .00 | .00 |
| 3 | .046 | 10.204 | .01 | .10 | .51 | .19 | .03 |
| 4 | .027 | 13.352 | .00 | .07 | .39 | .28 | .45 |
| 5 | .014 | 18.848 | .46 | .78 | .05 | .53 | .53 |
Table A4.
Residuals Statistics Model 4B for the dependent variable Human Flight and Brain Drain.
| Minimum | Maximum | Mean | Std. Deviation | N | |
|---|---|---|---|---|---|
| Predicted Value | 1.472 | 8.824 | 5.540 | 1.692 | 2989 |
| Residual | -4.242 | 3.983 | .000 | 1.162 | 2989 |
| Std. Predicted Value | -2.404 | 1.941 | .000 | 1.000 | 2989 |
| Std. Residual | -3.649 | 3.426 | .000 | .999 | 2989 |
References
- Aarhus, J.H.; Jakobsen, T.G. Rewards of reforms: Can economic freedom and reforms in developing countries reduce the brain drain? Int. Area Stud. Rev. 2019, 22, 327–347. [Google Scholar] [CrossRef]
- Abdelwahed, A.; Goujon, A.; Jiang, L. The Migration Intentions of Young Egyptians. Sustainability 2020, 12, 9803. [Google Scholar] [CrossRef]
- Abou Hashish, E.; Ashour, H.M. Determinants and mitigating factors of the brain drain among Egyptian nurses: A mixed-methods study. J. Res. Nurs. 2020, 25, 699–719. [Google Scholar] [CrossRef] [PubMed]
- Aliyev, K.; Gasimov, I. Trust in government and intention to emigrate in a post-soviet country: evidence from Azerbaijan. Econ. Sociol. 2023, 16, 199–213. [Google Scholar] [CrossRef]
- AlMunifi, A.A.; Aleryani, A.Y. Internal efficiency of higher education system in armed conflict-affected countries: Yemen case. Int. J. Educ. Dev. 2021, 83, 102394. [Google Scholar] [CrossRef]
- Asso, P.F. New perspectives on old inequalities: Italy’s north-south divide. Territ. Polit. Gov. 2021, 9, 346–364. [Google Scholar] [CrossRef]
- Barnett, M.; Cummings, M.; Vaaler, P. The social dividends of diaspora: Migrants, remittances, and changes in home-country rule of law. Proc. Int. Assoc. Bus. Soc. 2012, 23, 147–159. [Google Scholar]
- Bauböck, R. Towards a political theory of migrant transnationalism. Int. Migr. Rev. 2003, 37, 700–723. [Google Scholar] [CrossRef]
- Beine, M.; Docquier, F.; Rapoport, H. Brain drain and economic growth: theory and evidence J. Dev. Econ. 2001, 64, 275–289. [Google Scholar] [CrossRef]
- Benhamou, K. Capacity building for sustainable energy access in the Sahel/Sahara region: Wind energy as catalyst for regional development. Nato sci peace secur. 2008, 241–249. [Google Scholar] [CrossRef]
- Beverelli, C.; Orefice, G. Migration deflection: The role of Preferential Trade Agreements. Reg. Sci. Urban Econ. 2019, 79, 103469. [Google Scholar] [CrossRef]
- Boc, E. Brain drain in the EU: Local and regional public policies and good practices. Transylv. Rev. Adm. Sci. 2020, 23–39. [Google Scholar] [CrossRef]
- Carling, J The human dynamics of migrant transnationalism. Ethn. Racial Stud. 2008, 31, 1452–1477. [CrossRef]
- Carlsen, L.; Bruggemann, R. Fragile State Index: Trends and Developments. A Partial Order Data Analysis. Soc. Indic. Res. 2017, 133, 1–14. [Google Scholar] [CrossRef]
- Carrasco, R.; Ruiz-Castillo, J. Spatial mobility in elite academic institutions in economics: The case of Spain. Series-J. Span. Econ. Assoc. 2019, 10, 141–172. [Google Scholar] [CrossRef]
- Castro-Palaganas, E.; Spitzer, D.L.; Kabamalan, M.M.; Sanchez, M.C.; Caricativo, R.; Runnels, V.; Labonte, R.; Murphy, G.T.; Bourgeault, I.L. An examination of the causes, consequences, and policy responses to the migration of highly trained health personnel from the Philippines: the high cost of living/leaving-a mixed method study. Hum. Resour. Health. 2017, 15, 25. [Google Scholar] [CrossRef]
- Chand, M. Brain drain, brain circulation, and the African diaspora in the United States. J. Afr. Bus. 2019, 20, 6–19. [Google Scholar] [CrossRef]
- Chee, L.; Mu, F. Spatiotemporal characteristics and driving forces of attacks in the Belt and Road Initiative countries. PLoS One 2021, 16. [Google Scholar] [CrossRef]
- Chicco, D.; Warrens, M.J.; Jurman, G. The coefficient of determination R-squared is more informative than SMAPE, MAE, MAPE, MSE and RMSE in regression analysis evaluation. PeerJ Comput. Sci. 2021, 7, e623. [Google Scholar] [CrossRef]
- Cooray, A.; Schneider, F. Does corruption promote emigration? An empirical examination. J. Popul. Econ. 2016, 29, 293–310. [Google Scholar] [CrossRef]
- Daugeliene, R. , and Marcinkeviciene, R. Brain Circulation: Theoretical Considerations. Inz. Ekon. 2009, 3, 49–57. [Google Scholar]
- De Haas, H. A theory of migration: the aspirations-capabilities framework. Comp. Migr. Stud. 2021, 9, 8. [Google Scholar] [CrossRef] [PubMed]
- De-la-Vega-Hernández, I.M.; Barcellos-de-Paula, L. The quintuple helix innovation model and brain circulation in central, emerging and peripheral countries. Kybernetes 2020, 49, 2241–2262. [Google Scholar] [CrossRef]
- Diallo, M.A. Subjectand migration intentions abroad: The case of Senegal. Afr. Dev. Rev. 2022, 34, 410–424. [Google Scholar] [CrossRef]
- Dibeh, G.; Fakhri, A.; Marrouch, W. Decision to emigrate amongst the youth in Lebanon. Int. Migr. 2018, 56, 5–22. [Google Scholar] [CrossRef]
- Djajic, S.; Docquier, F.; Michael, M.S. Optimal education policy and human capital accumulation in the context of brain drain. J. Demogr. Econ. 2019, 85, 271–303. [Google Scholar] [CrossRef]
- Docquier, F.; Marfouk, A. (2006). International migration by education attainment, 1990-2000. In C. Ozden, & M. Schiff (Eds.), International Migration, Remittances and the Brain Drain (pp. 151–200). Palgrave Macmillan.
- Docquier, F.; Rapoport, H. Globalization, Brain Drain, and Development. J. Econ. Lit. 2012, 50, 681–730. [Google Scholar] [CrossRef]
- Docquier, F.; Lohest, O.; Marfouk, A. Brain drain in developing countries. World Bank Econ. Rev. 2007, 21, 193–218. [Google Scholar] [CrossRef]
- Egyed, I.; Zsibók, Z. Exploring firm performance in Central and Eastern European regions: A foundational approach. Hung. Geogr. Bull. 2023, 72. [Google Scholar] [CrossRef]
- Fakih, A.; El Baba, M. The willingness to emigrate in six MENA countries: The role of past revolutionary stress. Int. Migr. 2023, 61, 201–220. [Google Scholar] [CrossRef]
- Fetzer, J.S.; Millen, B.A. The Causes of Emigration from Singapore: How Much Is Still Political? Crit. Asian Stud. 2015, 47, 462–476. [Google Scholar] [CrossRef]
- Foo, G. Quantifying the Malaysian Brain Drain and an Investigation of its Key Determinants. Malays. J. Econ. Stud. 2011, 48, 93–116. [Google Scholar]
- Goldberg, M.P. Discursive policy webs in a globalisation era: A discussion of access to professions and trades for immigrant professionals in Ontario, Canada. Glob. Soc. Educ. 2006, 4, 77–102. [Google Scholar] [CrossRef]
- Grigoryan, A.; Khachatryan, S. Remittances and emigration intentions: Evidence from Armenia. Int. Migr. 2022, 60, 198–234. [Google Scholar] [CrossRef]
- Hillier, C.; Sano, Y.; Zarifa, D.; Haan, M. Will They Stay or Will They Go? Examining the Brain Drain in Canada's Provincial North. Can. Rev. Sociol. 2020, 57, 174–196. [Google Scholar] [CrossRef]
- Hoti, A. Determinants of emigration and its economic consequences: Evidence from Kosova. SE. Eur. Black Sea Stud. 2009, 9, 435–458. [Google Scholar] [CrossRef]
- Huang, X.N. Immigrant Skill Selection: A Case Study of South Africa and the USA. J. Knowl. Econ. 2023, 14, 101567. [Google Scholar] [CrossRef]
- Hugo, G. Migration and development in Asia and a role for Australia. J. Intercult. Stud. 2013, 34, 141–159. [Google Scholar] [CrossRef]
- Iacob, R. Brain drain phenomenon in Romania: What comes in line after corruption? A quantitative analysis of the determinant causes of Romanian skilled migration. Rom. J. Commun. Public Relat. 2018, 20, 53–78. [Google Scholar]
- Ienciu, N.M.; Ienciu, A. Brain drain in Central and Eastern Europe: New insights on the role of public policy. SE. Eur. Black Sea Stud. 2015, 15, 281–299. [Google Scholar] [CrossRef]
- Iqbala, K.; Peng, H.; Hafeez, M.; Wang, Y.C.; Khurshid, L.I.; CY. The current wave and determinants of brain drain migration from China. Hum. Syst. Manag. 2020, 39, 455–468. [Google Scholar] [CrossRef]
- Jons, H. 'Brain circulation' and transnational knowledge networks: studying long-term effects of academic mobility to Germany 1954-2000. Glob. Netw. 2009, 9, 315–338. [Google Scholar] [CrossRef]
- Jovcheska, S. Exploring corruption in higher education: A case study of brain drain in North Macedonia. Int. J. Educ. Dev. 2024, 107. [Google Scholar] [CrossRef]
- Kahn, M.; Gamedze, T.; Oghenetega, J. Mobility of sub-Saharan Africa doctoral graduates from South African universities—A tracer study. Int. J. Educ. Dev. 2019, 68, 9–14. [Google Scholar] [CrossRef]
- Kesselman, J.R. Policy implications of brain drain from Canada. Can. Public Policy 2001, 27, 73–93. [Google Scholar] [CrossRef]
- Khalid, M.U.; Qureshi, J.A. The strategic role of public policies in technological innovation in Pakistan and lessons learnt from advanced countries: A comparative literature review. J. Organ. Behav. Res. 2020, 5, 212–232. [Google Scholar]
- Khan, J. European academic brain drain: A meta-synthesis. Eur. J. Educ. 2021, 56, 265–278. [Google Scholar] [CrossRef]
- Kim, J.H. Multicollinearity and misleading statistical results. Korean J. Anesthesiol 2019, 72, 558–569. [Google Scholar] [CrossRef]
- King, R.; Gëdeshi, I. Albanian students abroad: A potential brain drain? Cent. East. Eur. Migr. Rev. 2023, 12, 73–97. [Google Scholar] [CrossRef]
- Kizhakethalackal, E.T.; Mukherjee, D.; Alvi, E. Count-data Analysis of physician Emigration from Developing Countries: A Note. Econ. Bull. 2015, 35, 1177–1184. [Google Scholar]
- Knauer, H. Strategic Approach Idea for Innovation Performance in Declining Rural Hinterland Areas. Rural development. 2009, 74, 74–78. [Google Scholar] [CrossRef]
- Kramer, B.; Zent, R. Diaspora linkages benefit both sides: A single partnership experience. Glob. Health Action 2019, 12, 1645558. [Google Scholar] [CrossRef] [PubMed]
- Kritz, M.M. International student mobility and tertiary education capacity in Africa. Int. Migr. 2015, 53, 29–49. [Google Scholar] [CrossRef]
- Lanati, M.; Thiele, R. Aid for health, economic growth, and the emigration of medical workers. J. Int. Dev. 2021, 33, 1112–1140. [Google Scholar] [CrossRef]
- Lanko, D. Fear of Brain Drain: Russian Academic Community on Internationalization of Education. J. Stud. Int. Educ. 2022, 26, 640–655. [Google Scholar] [CrossRef]
- Larsen, C.H. The fragile environments of inexpensive CD4+T-cell enumeration in the least developed countries: Strategies for accessible support. Cytom. Part B-Clin. Cytom. 2008, 748, S107–S116. [Google Scholar] [CrossRef]
- Levitin, C. Yeltsin voices concern over 'brain-drain'. Nature 1997, 390, 32–33. [Google Scholar] [CrossRef]
- Leydesdorff, L. & Etzkowitz, H. Emergence of a Triple Helix of university—industry—government relations, Sci. Public Policy 1996, 23, 279–286. [Google Scholar] [CrossRef]
- Li, W.; Lo, L.; Lu, Y.X.; Tan, Y.N.; Lu, Z. Intellectual migration: Considering China. J. Ethn. Migr. Stud. 2020, 47, 2833–2853. [Google Scholar] [CrossRef]
- Mainali, B.R. Brain drain and higher education in Nepal. Rout res high educ 2020, 87–99. [Google Scholar]
- Mao, Y.B.; Latukha, M.; Selivanovskikh, L. From brain drain to brain gain in emerging markets: exploring the new agenda for global talent management in talent migration. Eur. J. Int. Manag. 2022, 17, 564–582. [Google Scholar] [CrossRef]
- Marchal, B.; Kegels, G. Health workforce imbalances in times of globalization: Brain drain or professional mobility? Int. J. Health Plann. Manag. 2003, 18, S89–S101. [Google Scholar] [CrossRef] [PubMed]
- Massey, D.S.; Arango, J.; Hugo, G.; Kouaouci, A.; Pellegrino, A.; Taylor, J.E. Theories of international migration: A review and appraisal. Population and Development Review 1993, 19, 431–466. [Google Scholar] [CrossRef]
- Maxwell, T.W.; Chophel, D. The impact and outcomes of (non-education) doctorates: The case of an emerging Bhutan. High Educ. 2020, 80, 1081–1102. [Google Scholar] [CrossRef]
- McNeil, K.A. Meeting the goals of research with multiple linear regression. Multivar. Behav. Res. 1970, 5, 375–386. [Google Scholar] [CrossRef]
- Moloney, K. Debt administration in small island-states. Aust. J. Public Adm. 2019, 78, 325–340. [Google Scholar] [CrossRef]
- Monekosso, G.L. A brief history of medical education in Sub-Saharan Africa. Acad. Med. 2014, 89, S11–S15. [Google Scholar] [CrossRef]
- Muthanna, A.; Sang, G.Y. Brain drain in higher education: Critical voices on teacher education in Yemen. Lond. Rev. Educ. 2018, 16, 296–307. [Google Scholar] [CrossRef]
- Mwapaura, K.; Chikoko, W.; Nyabeze, K.; Kabonga, I.; Zvokuomba, K. Provision of child protection services in Zimbabwe: Review of the human rights perspective. Cogent Soc. Sci. 2022, 8. [Google Scholar] [CrossRef]
- Nadeem, M.A.; Liu, Z.Y.; Younis, A.; Asghar, F.; Ghani, U.; Xu, Y. How governance structure, terrorism, and internationalization affect innovation: Evidence from Pakistan. Technol. Anal. Strateg. Manag. 2021, 33, 670–684. [Google Scholar] [CrossRef]
- Naito, T.; Zhao, L.X. Capital accumulation through studying abroad and return migration. Econ. Model. 2020, 87, 185–196. [Google Scholar] [CrossRef]
- Ndjobo, P.M.N.; Simoes, N.C. Institutions and brain drain: The role of business start-up regulations. Afr. J. Sci. Technol. Innov. Dev. 2021, 13, 807–815. [Google Scholar] [CrossRef]
- Ngoma, AL.; Ismail, N.W. The determinants of brain drain in developing countries. Int. J. Soc. Econ. 2013, 40, 744–754. [Google Scholar] [CrossRef]
- Nittayaramphong, S.; Tangcharoensathien, V. Thailand - private health-care out of control. Health Policy Plan. 1994, 9, 31–40. [Google Scholar]
- Panagiotakopoulos, A. Investigating the factors affecting brain drain in Greece: Looking beyond the obvious. World J. Entrep. Manag. Sustain. Dev. 2020, 16, 207–218. [Google Scholar] [CrossRef]
- Pejanovic, R.; Grubic-Nesic, L.; Birovljev, J.; Sedlak, O. Three missions of universities and the university-industry-state government triade. ICERI Proc. 2015, 6111–6118. [Google Scholar]
- Petrou, K.; Connell, J. Our 'Pacific family'. Heroes, guests, workers or a precariat? Aust. Geogr. 2023, 54, 125–135. [Google Scholar] [CrossRef]
- Ramoo, B.; Lee, C.Y.; Yu, C.M. Eliciting salient beliefs of engineers in Malaysia on migrating abroad. Migr. Lett. 2017, 14, 221–236. [Google Scholar] [CrossRef]
- Rogers, M.L. Directly unproductive schooling: How country characteristics affect the impact of schooling on growth. Eur. Econ. Rev. 2008, 52, 356–385. [Google Scholar] [CrossRef]
- Romanov, E.V. What capitalism does Russia need? Methodological guidelines of the new industrialization. Econ. Soc. Chang. 2017, 10, 90–108. [Google Scholar] [CrossRef]
- Romanovska, Y.; Kozachenko, G.; Pogorelov, Y.; Pomazun, O.; Redko, K. Problems of development of economic security in Ukraine: Challenges and opportunities. Financ. Credit Act. 2022, 5, 249–257. [Google Scholar] [CrossRef]
- Safina, D. Favouritism and nepotism in an organization: Causes and effects. Proc. Econ. Financ. 2015, 23, 630–634. [Google Scholar] [CrossRef]
- Seyoum, B.; Camargo, A. State fragility and foreign direct investment: The mediating roles of human flight and economic decline. Thunderbird Int. Bus. Rev. 2021, 63, 159–174. [Google Scholar] [CrossRef]
- Simplice, A. Globalization and health worker crisis: what do wealth-effects tell us? Int. J. Soc. Econ. 2014, 41. [Google Scholar] [CrossRef]
- Simplice, A. Determinants of health professionals' migration in Africa: a WHO based assessment. Int. J. Soc. Econ. 2015, 42, 666–686. [Google Scholar] [CrossRef]
- Spijkerboer, T. The Global Mobility Infrastructure: Reconceptualising the Externalisation of Migration Control Eur. J. Migr. Law. 2018, 20, 452–469. [Google Scholar] [CrossRef]
- Staniscia, B.; Deravignone, L.; Gonzalez-Martin, B.; Pumares, P. Youth mobility and the development of human capital: Is there a Southern European model? J. Ethn. Migr. Stud. 2020. [Google Scholar] [CrossRef]
- Stark, O.; Taylor, J.E. Relative Deprivation and International Migration. Demography 1989, 26, 1–14. [Google Scholar] [CrossRef]
- Strielkowski, W.; Niño-Amézquita, L.; Kalyana, S. Geopolitics and multicultural environment as the determinants of personnel security. Manag. Res. Pract. 2021, 13, 17–31. [Google Scholar]
- Subhani, Z.H.; Tajuddin, N.A.; Diah, N.M. Muslim migration to the West: The case of the Muslim minority in India. Al-Shajarah 2018, 173–193. [Google Scholar]
- Thaut, L. EU Integration & Emigration Consequences: The Case of Lithuania. Int. Migr. 2009, 47, 191–233. [Google Scholar] [CrossRef]
- The Fund for Peace. Fragile States Index. (2025). Available in: https://fragilestatesindex.org/. (Accessed on 13 February 2025).
- Torrisi, B.; Pernagallo, G. Investigating the relationship between job satisfaction and academic brain drain: the Italian case. Scientometrics 2020, 124, 925–952. [Google Scholar] [CrossRef]
- Usman, M.A.M.; Ozdeser, H.; Cavusoglu, B.; Aliyu, U.S. On the sustainable economic growth in Sub-Saharan Africa: Do remittances, human capital flight, and brain drain matter? Sustainability 2022, 14. [Google Scholar] [CrossRef]
- Varma, A.; Tung, R. Lure of country of origin: An exploratory study of ex-host country nationals in India. Pers. Rev. 2020, 49, 1487–1501. [Google Scholar] [CrossRef]
- Vega-Muñoz, A.; Gónzalez-Gómez-del-Miño, P.; Espinosa-Cristia, J.F. Recognizing New Trends in Brain Drain Studies in the Framework of Global Sustainability. Sustainability 2021, 13, 3195. [Google Scholar] [CrossRef]
- Vega-Muñoz, A.; González-Gómez-del-Miño, P.; Salazar-Sepúlveda, G. Scoping review about well-being in the ‘brain migration’ studies. MethodsX 2024, 13, 103068. [Google Scholar] [CrossRef]
- Vega-Muñoz, A.; González-Gómez-del-Miño, P.; Salazar-Sepúlveda, G. Global panel data on World governance and state fragility from 2006 to 2022. Data Brief 2024, 53. [Google Scholar] [CrossRef]
- Velema, T.A. The contingent nature of brain gain and brain circulation: their foreign context and the impact of return scientists on the scientific community in their country of origin. Scientometrics 2012, 93, 893–913. [Google Scholar] [CrossRef]
- Wang, J.; Zhang, X. The geopolitics of knowledge circulation: The situated agency of mimicking in/beyond China. Eurasian Geogr. Econ. 2020, 61, 740–762. [Google Scholar] [CrossRef]
- Yakovlev, P.; Steinkopf, T. Can Economic Freedom Cure Medical Brain Drain?, J. Priv. Enterp. 2014, 29, 97–117. [Google Scholar]
- Zea, D.G. Brain drain in Venezuela: The scope of the human capital crisis. Hum. Resour. Dev. Int. 2020, 23, 188–195. [Google Scholar] [CrossRef]
- Zhang, J.; Hao, F.L.; Wang, S.J. Spatiotemporal Characteristics and Influencing Factors of Talent Inflow in Northeast China from the Perspective of Urban Amenity. J. Urban Plan. Dev. 2024, 150, 5024011. [Google Scholar] [CrossRef]
Figure 1.
Theorical determinants of brain drain.
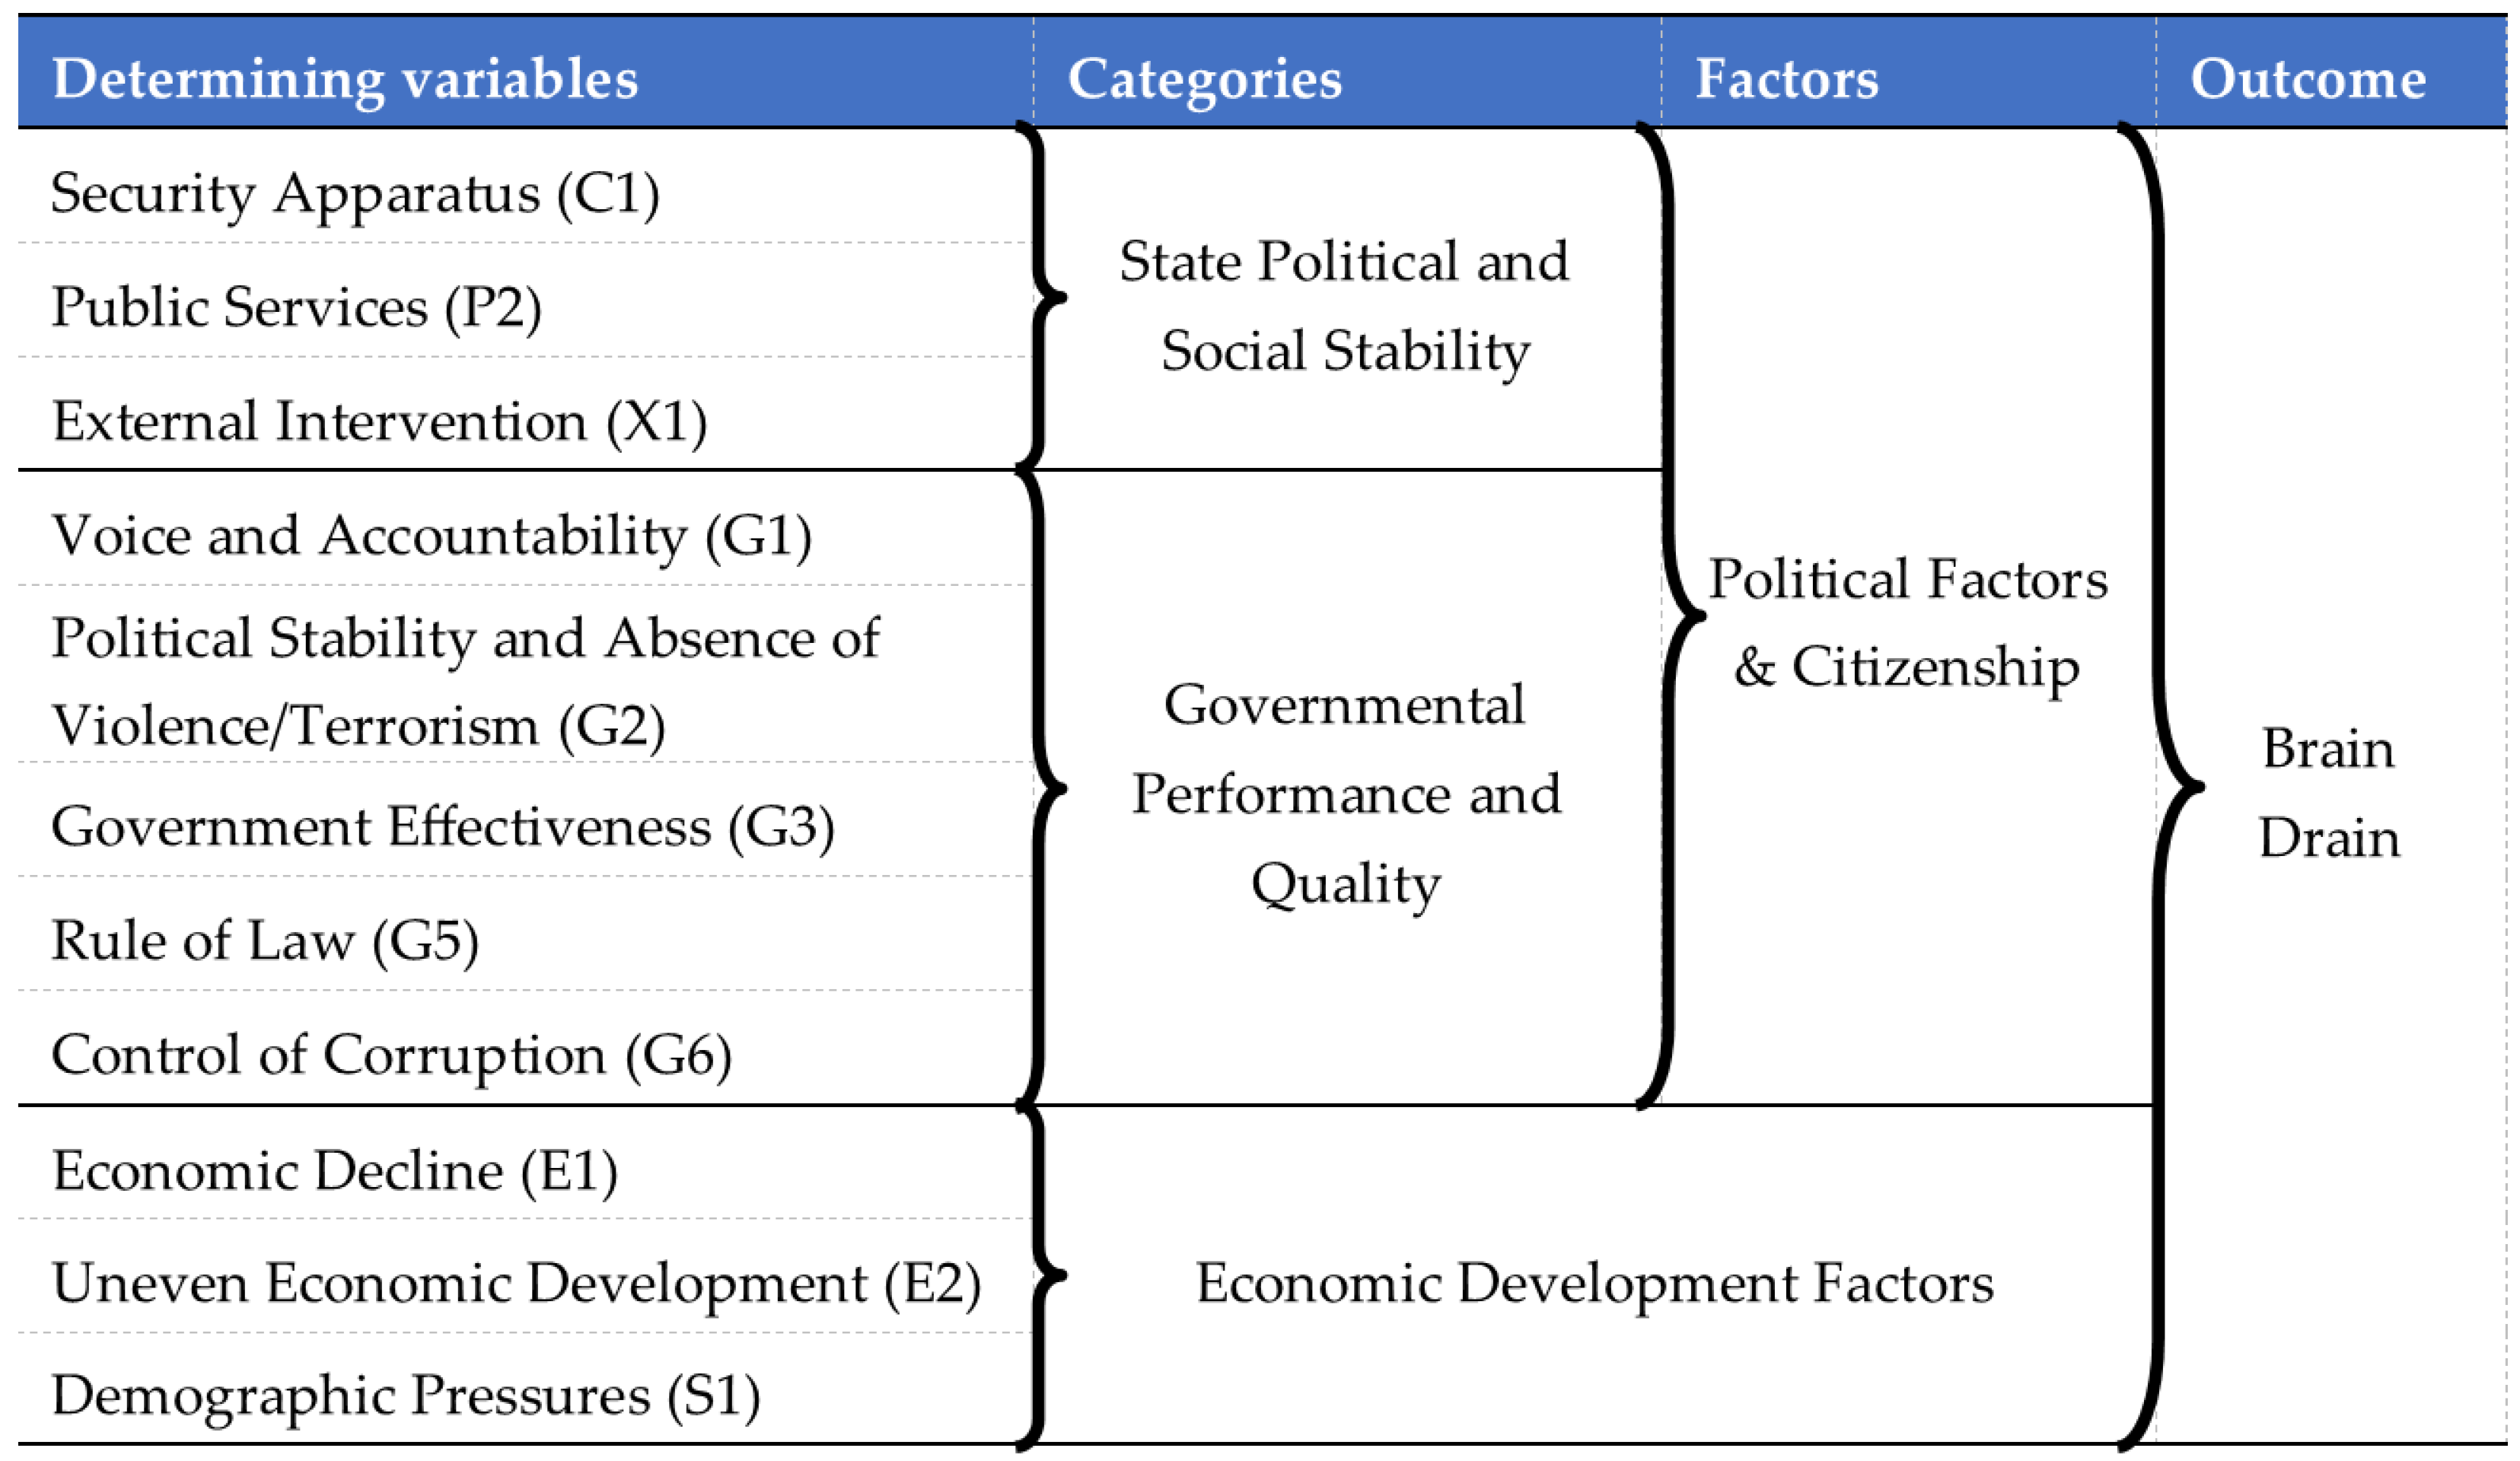
Figure 2.
Adjusted R-squared and number of independent variables.
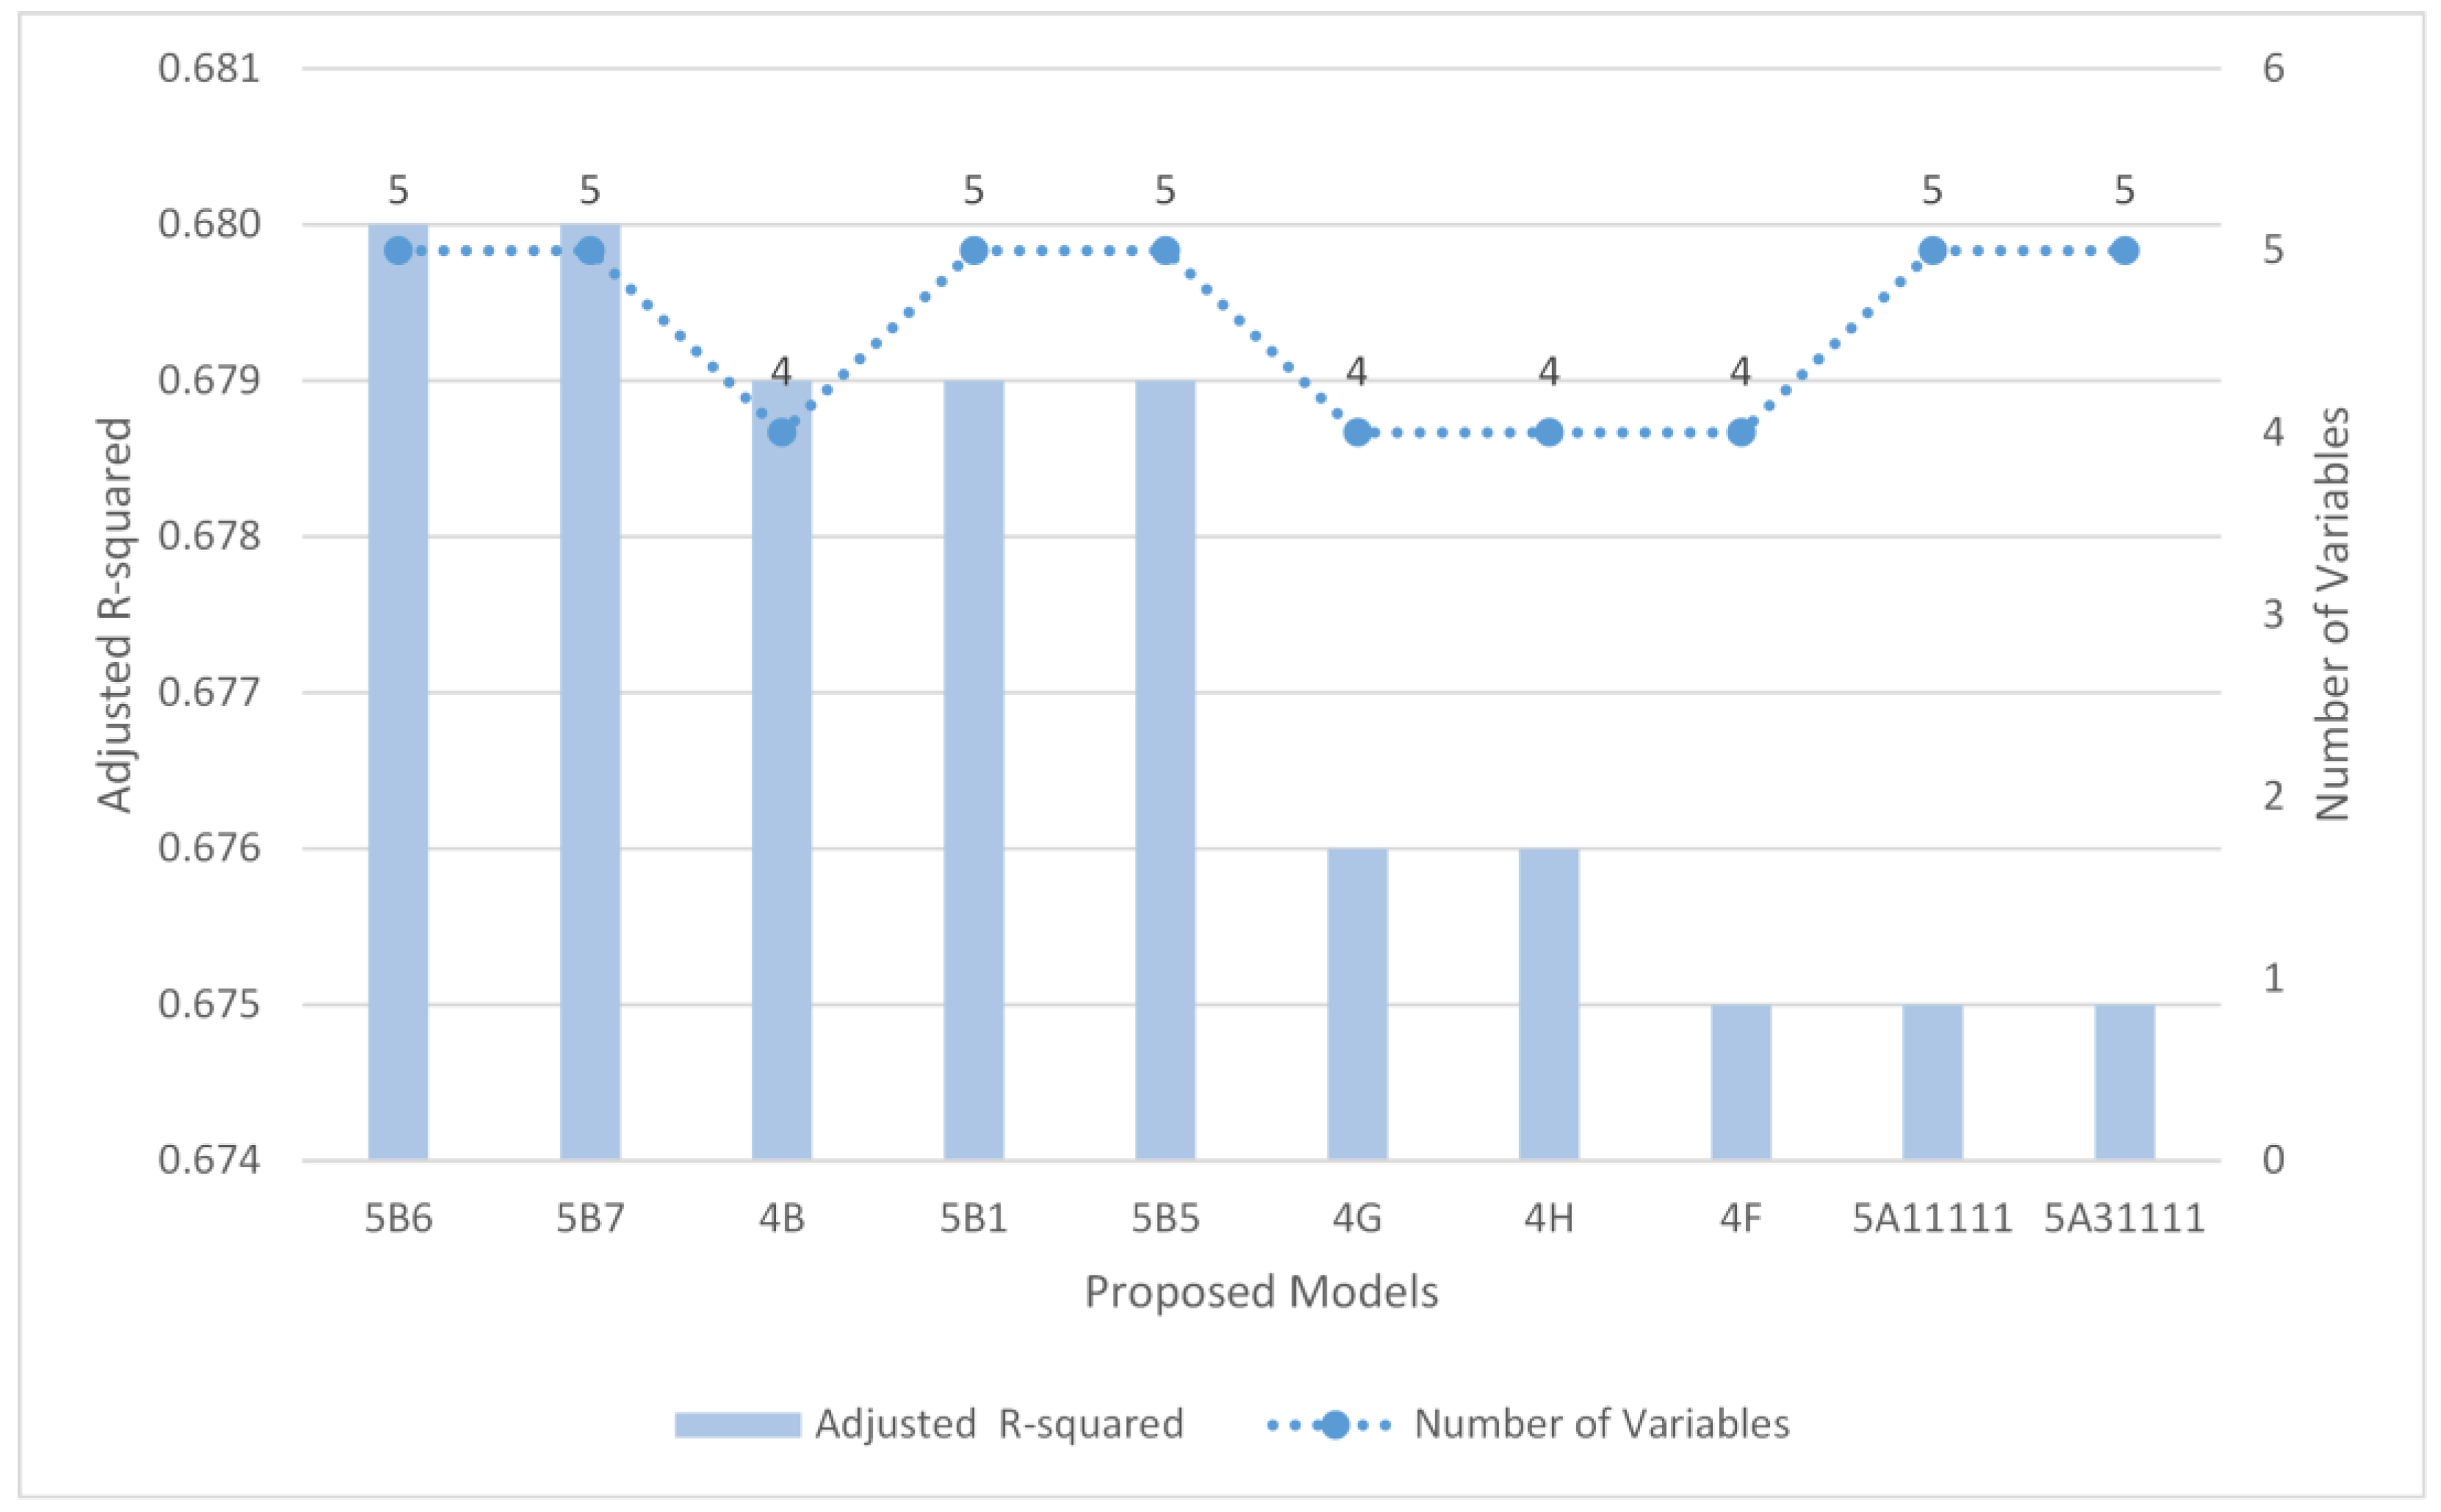
Figure 3.
Histogram of regression standardized residual for the dependent variable Human Flight and Brain Drain.
Figure 3.
Histogram of regression standardized residual for the dependent variable Human Flight and Brain Drain.
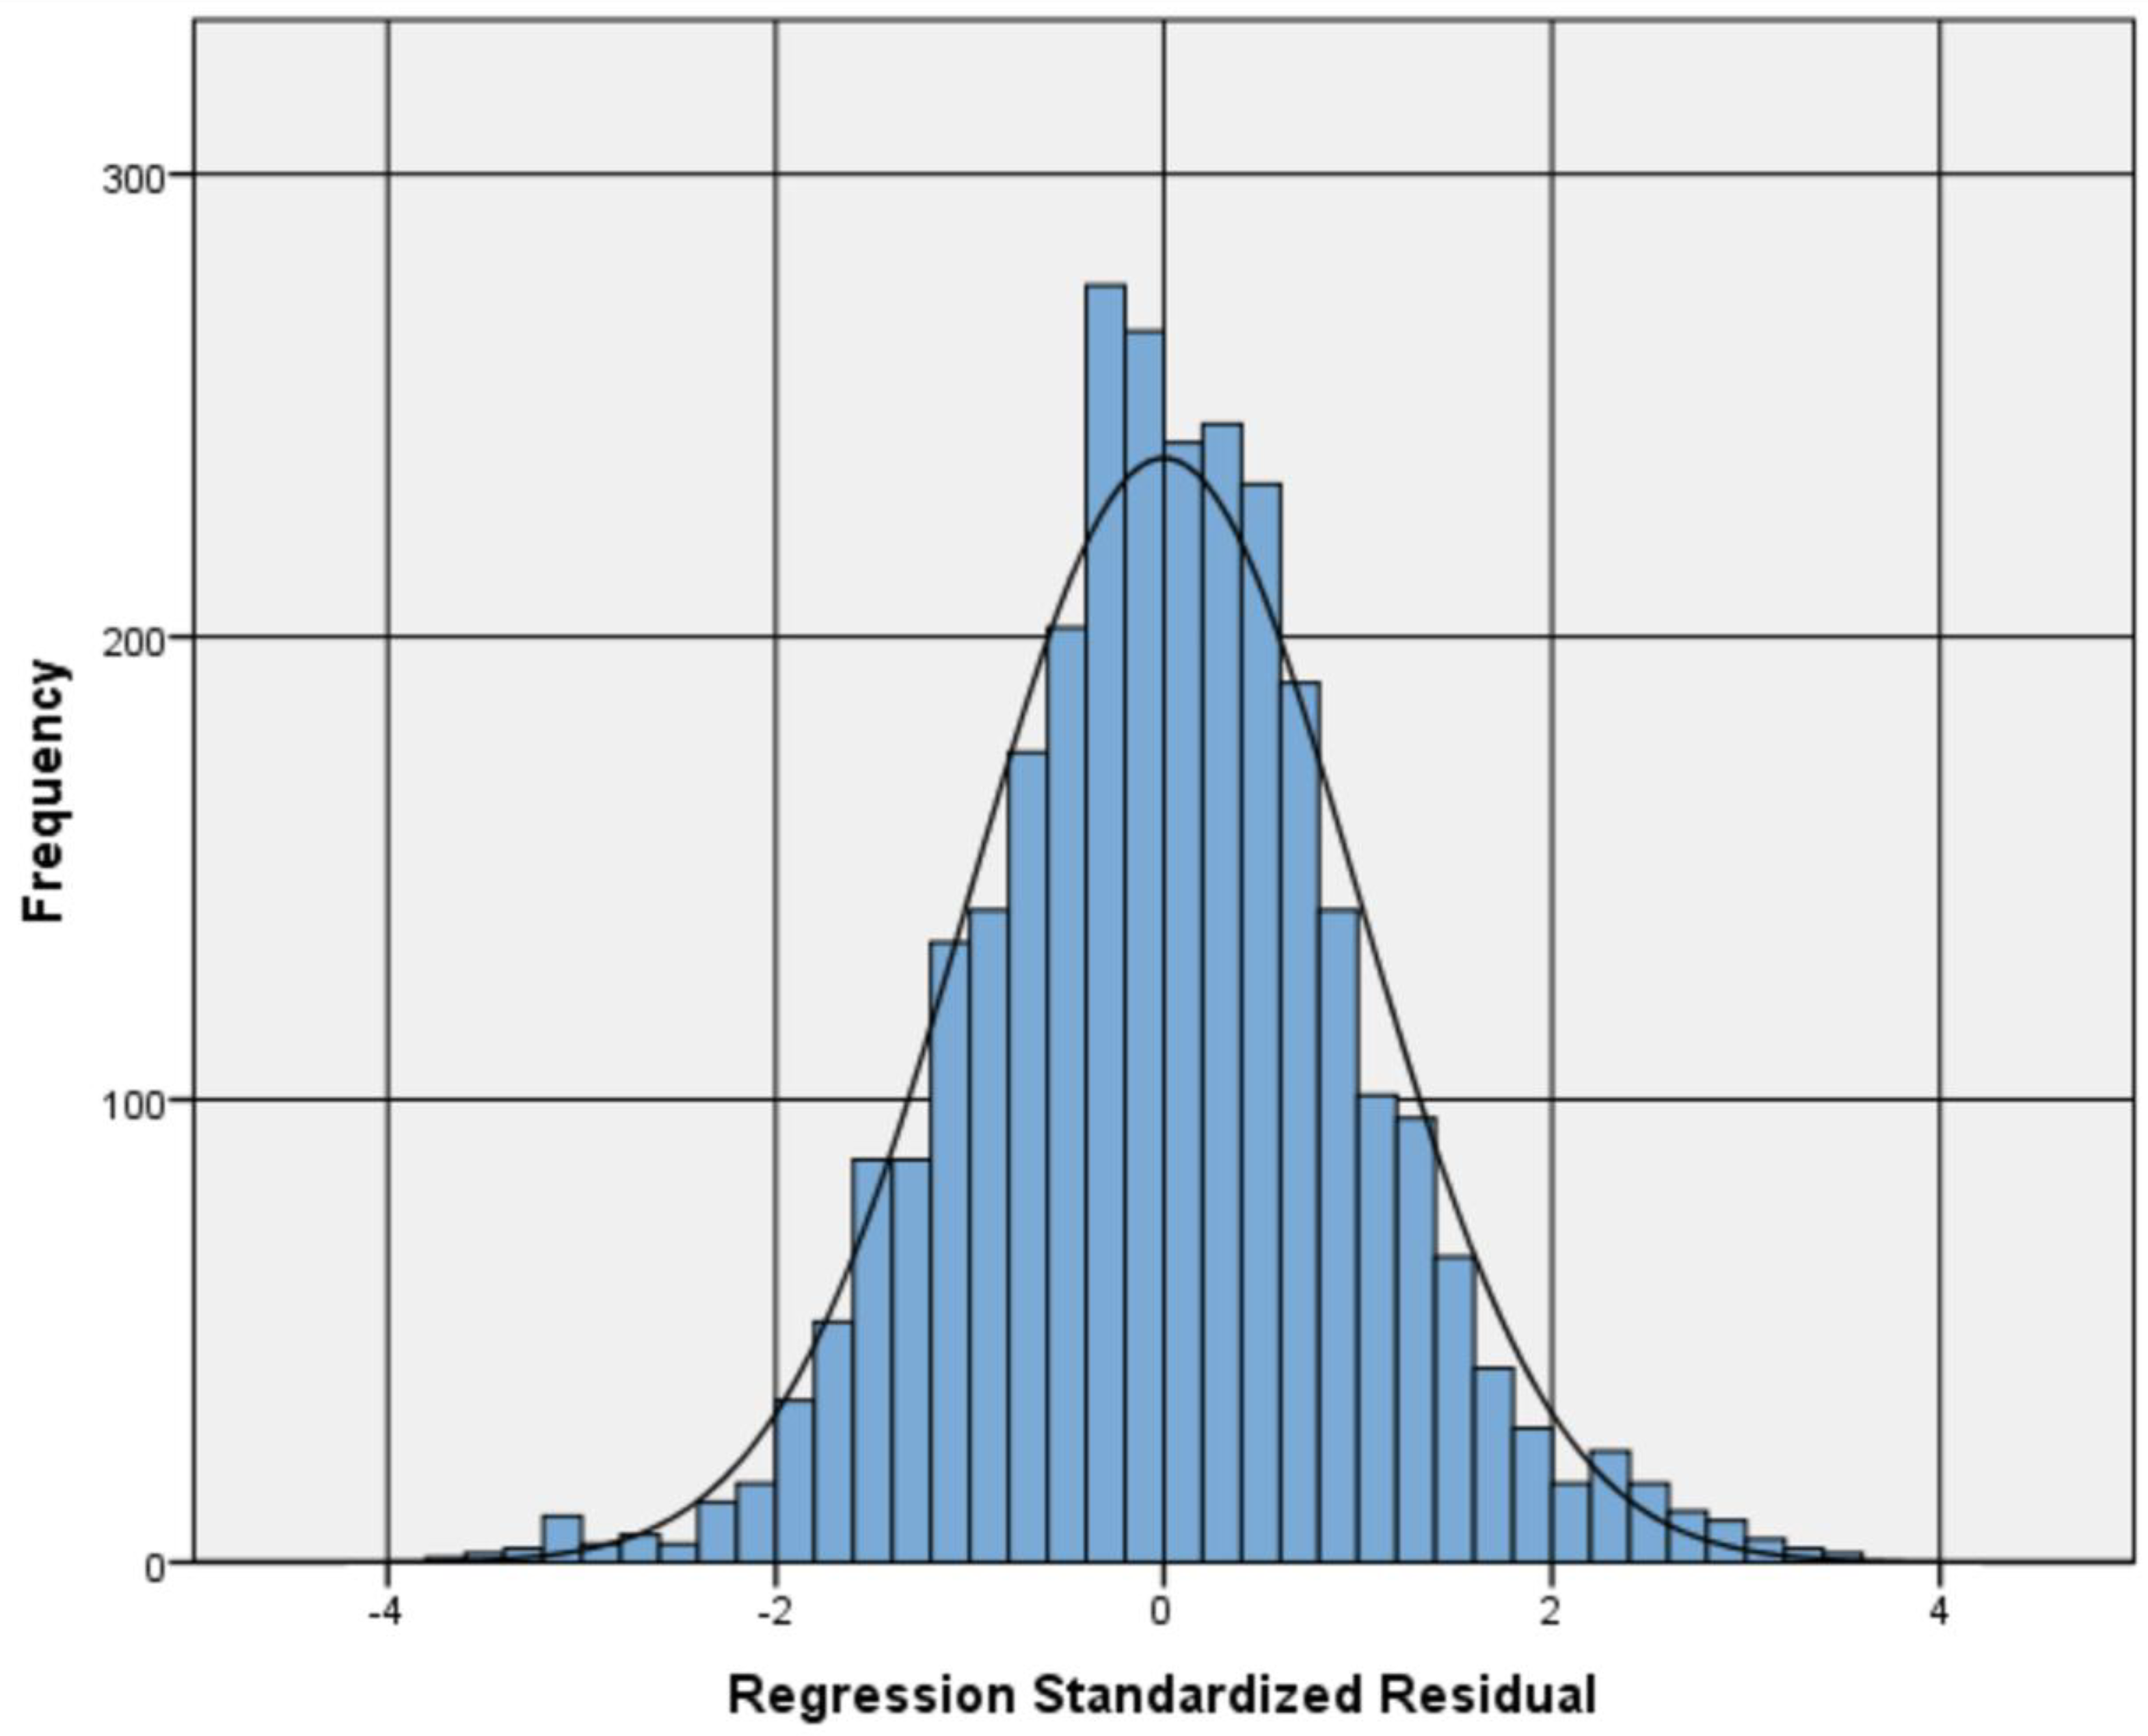
Table 1.
Description of study variables.
| Variable | Origin | N | Min | Max | Mean | Standard deviation | Pearson correlationwith E3 |
|---|---|---|---|---|---|---|---|
| Human Flight and Brain Drain (E3) | FSI | 2989 | 0.4* | 10.0 | 5.540 | 2.05 | 1.00 |
| Security Apparatus (C1) | FSI | 2989 | 0.3* | 10.0 | 5.623 | 2.35 | 0.69 |
| Economic Decline (E1) | FSI | 2989 | 1.0* | 10.0 | 5.708 | 1.95 | 0.74 |
| Uneven Economic Development (E2) | FSI | 2989 | 0.5* | 10.0 | 6.150 | 2.07 | 0.72 |
| Public Services (P2) | FSI | 2989 | 0.6* | 10.0 | 5.617 | 2.49 | 0.78 |
| Demographic Pressures (S1) | FSI | 2989 | 0.7* | 10.0 | 6.039 | 2.27 | 0.74 |
| External Intervention (X1) | FSI | 2989 | 0.3* | 10.00 | 5.699 | 2.38 | 0.75 |
| Voice and Accountability (G1) | WGI | 2989 | -2.3 | 2.8* | -.138 | 1.01 | -0.46 |
| Political Stability and Absence of Violence/Terrorism (G2) | WGI | 2989 | -3.3 | 1.6* | -.170 | .97 | -0.53 |
| Government Effectiveness (G3) | WGI | 2989 | -2.4 | 2.5* | -.107 | 1.00 | -0.73 |
| Rule of Law (G5) | WGI | 2989 | -2.6 | 2.1* | -.151 | 1.00 | -0.72 |
| Control of Corruption (G6) | WGI | 2989 | -1.9 | 2.5* | -.124 | 1.01 | -0.65 |
* Best value (Vega-Muñoz et al., 2024b).
Table 2.
Proposed models summary.
| Model | Number of Variables | Predictors | R | R-squared | Adjusted R-squared | Std. error of estimation | Adequate Betas sign | VIF ≤ 10 | Feasible model |
|---|---|---|---|---|---|---|---|---|---|
| 5B6 | 5 | P2, X1, E2, E1, G5 | .825 | .681 | .680 | 1.161 | Yes | Yes | Yes |
| 5B7 | 5 | P2, X1, E2, E1, G6 | .825 | .681 | .680 | 1.161 | Yes | Yes | Yes |
| 4B | 4 | P2, X1, E2, E1 | .824 | .680 | .679 | 1.163 | Yes | Yes | Yes |
| 5B1 | 5 | P2, X1, E2, E1, C1 | .824 | .680 | .679 | 1.163 | Yes | Yes | Yes |
| 5B5 | 5 | P2, X1, E2, E1, G3 | .824 | .680 | .679 | 1.163 | Yes | Yes | Yes |
| 4G | 4 | P2, X1, E2, G5 | .822 | .676 | .676 | 1.169 | Yes | Yes | Yes |
| 4H | 4 | P2, X1, E2, G6 | .822 | .676 | .676 | 1.169 | Yes | Yes | Yes |
| 4F | 4 | P2, X1, E2, G3 | .822 | .675 | .675 | 1.171 | Yes | Yes | Yes |
| 5A11111 | 5 | E1, E2, S1, X1, G6 | .822 | .676 | .675 | 1.170 | Yes | Yes | Yes |
| 5A31111 | 5 | E1, E2, S1, X1, G5 | .822 | .675 | .675 | 1.170 | Yes | Yes | Yes |
| 3 | 3 | P2, X1, E2 | .821 | .674 | .674 | 1.172 | Yes | Yes | Yes |
| 6A3211 | 6 | C1, E1, E2, S1, X1, G3 | .821 | .673 | .673 | 1.174 | Yes | Yes | Yes |
| 2 | 2 | P2, X1 | .816 | .666 | .666 | 1.187 | Yes | Yes | Yes |
| 1 | 1 | P2 | .776 | .602 | .601 | 1.296 | Yes | Yes | Yes |
Table 3.
ANOVA and Multicollinearity report for the dependent variable Human Flight and Brain Drain.
Table 3.
ANOVA and Multicollinearity report for the dependent variable Human Flight and Brain Drain.
| Model | Sum of squares | Df | Mean Square | F test | Sig. | VIF > 10 | Condition index > 30 | |
|---|---|---|---|---|---|---|---|---|
| 5B6 | Regression | 8567.034 | 5 | 1713.407 | 1271.065 | .000 | No | No (19.250) |
| Residual | 4021.110 | 2983 | 1.348 | |||||
| Total | 12588.144 | 2988 | ||||||
| 5B7 | Regression | 8568.817 | 5 | 1713.763 | 1271.893 | .000 | No | No (19.126) |
| Residual | 4019.327 | 2983 | 1.347 | |||||
| Total | 12588.144 | 2988 | ||||||
| 4B | Regression | 8554.814 | 4 | 2138.703 | 1582.288 | .000 | No | No (18.848) |
| Residual | 4033.330 | 2984 | 1.352 | |||||
| Total | 12588.144 | 2988 | ||||||
| 5B1 | Regression | 8554.818 | 5 | 1710.964 | 1265.409 | .000 | No | No (20.806) |
| Residual | 4033.325 | 2983 | 1.352 | |||||
| Total | 12588.144 | 2988 | ||||||
| 5B5 | Regression | 8554.988 | 5 | 1711.000 | 1265.492 | .000 | No | No (19.304) |
| Residual | 4033.146 | 2983 | 1.352 | |||||
| Total | 12588.144 | 2988 | ||||||
| 4G | Regression | 8512.631 | 4 | 2128.158 | 1558.190 | .000 | No | No (14.744) |
| Residual | 4075.513 | 2984 | 1.366 | |||||
| Total | 12588.144 | 2988 | ||||||
| 4H | Regression | 8511.166 | 4 | 2127.792 | 1557.362 | .000 | No | No (14.684) |
| Residual | 4076.977 | 2984 | 1.366 | |||||
| Total | 12588.144 | 2988 | ||||||
| 4F | Regression | 8496.959 | 4 | 2124.240 | 1549.363 | .000 | No | No (15.104) |
| Residual | 4091.185 | 2984 | 1.371 | |||||
| Total | 12588.144 | 2988 | ||||||
| 5A11111 | Regression | 8503.904 | 5 | 1700.781 | 1242.197 | .000 | No | No (18.518) |
| Residual | 4084.240 | 2983 | 1.369 | |||||
| Total | 12588.144 | 2988 | ||||||
| 5A31111 | Regression | 8502.805 | 5 | 1700.561 | 1241.702 | .000 | No | No (18.760) |
| Residual | 4085.339 | 2983 | 1.370 | |||||
| Total | 12588.144 | 2988 | ||||||
Table 4.
Selection Model for the dependent variable Human Flight and Brain Drain.
| Model | Sum of Squares | df | Root Mean Square | F Test | Sig. | R | R-Squared | AdjustedR-Squared | Standard Error of Estimation |
|
|---|---|---|---|---|---|---|---|---|---|---|
| Model 4B:P2, X1, E2, E1. | Regression | 8554.814 | 4 | 2138.703 | 1582.288 | .000 | .824 | .680 | .679 | 1.163 |
| Residual | 4033.330 | 2984 | 1.352 | |||||||
| Total | 12588.144 | 2988 | ||||||||
Table 5.
Coefficients Model 4B for the dependent variable Human Flight and Brain Drain.
| Model 4B | UnstandardizedCoefficients | Standardized Coefficients | t | Sig. | 95.0% Confidence Interval for B |
Collinearity Statistics | |||
|---|---|---|---|---|---|---|---|---|---|
| B | Std. Error | Beta | Lower Bound | Upper Bound | Tolerance | VIF | |||
| (Constant) | .781 | .079 | 9.827 | .000 | .644 | .934 | |||
| Public Services (P2) | .214 | .021 | .259 | 10.285 | .000 | .174 | .256 | .169 | 5.908 |
| External Intervention (X1) | .275 | .016 | .319 | 17.699 | .000 | .239 | .309 | .331 | 3.020 |
| Uneven Economic Development (E2) | .184 | .019 | .185 | 9.628 | .000 | .145 | .219 | .292 | 3.429 |
| Economic Decline (E1) | .151 | .022 | .144 | 6.894 | .000 | .103 | .198 | .246 | 4.062 |
Disclaimer/Publisher’s Note: The statements, opinions and data contained in all publications are solely those of the individual author(s) and contributor(s) and not of MDPI and/or the editor(s). MDPI and/or the editor(s) disclaim responsibility for any injury to people or property resulting from any ideas, methods, instructions or products referred to in the content. |
© 2025 by the authors. Licensee MDPI, Basel, Switzerland. This article is an open access article distributed under the terms and conditions of the Creative Commons Attribution (CC BY) license (http://creativecommons.org/licenses/by/4.0/).
Copyright: This open access article is published under a Creative Commons CC BY 4.0 license, which permit the free download, distribution, and reuse, provided that the author and preprint are cited in any reuse.


