Submitted:
10 December 2024
Posted:
12 December 2024
Read the latest preprint version here
Abstract
The brain drain phenomenon represents a significant challenge to global development, especially in developing countries. This study examines the determinants of brain drain in 178 countries between 2006 and 2022. Through a panel data analysis that integrates indicators of governance and state fragility, a multiple linear regression model is employed to assess the influence of socioeconomic and political variables on the migration of skilled personnel. The results identify six key variables: uneven economic development, quality of public services, external intervention, voice and accountability, rule of law and political stability. Among these, governance, particularly political stability and rule of law, emerges as a crucial factor for talent retention, while external interventions tend to exacerbate brain drain as an expression of instability. The study also highlights how the quality of public services can reduce emigration intentions, while economic inequalities drive migration to regions with better opportunities. With an adjusted R-squared above 70%, the proposed parsimonious model provides a robust framework for understanding the dynamics of brain drain in the global context. These findings are essential for designing effective public policies to mitigate talent emigration, promote economic equality and strengthen governance. Future research should focus on exploring regional and economic variations, with emphasis on the implementation of specific policies to counteract the adverse effects of this phenomenon.
Keywords:
Brain Migration
; Worldwide Governance
; Uneven Economic Development
; Global Dynamics
1. Introduction
The brain drain phenomenon is a concern for many countries (Vega-Muñoz et al., 2021), because higher skills migration negatively affects development and puts the focus on establishing its determinants (Ienciu & Ienciu, 2015). These negative effects are related to labor scarcity and demographic challenges (Thaut, 2009).
While differences in employment and economic opportunities are the main drivers of high-skill emigration (Hoti, 2009). This phenomenon is intensified by territorial inequalities and economic crises (Asso, 2021). Clearly, in this migration type, poverty increases the intention to migrate (Diallo, 2022). But, in developing countries, economic freedom also plays a role, since higher levels of economic freedom decrease this type of migration (Aarhus & Jakobsen, 2019).
Political factors, such as dissatisfaction and the desire for greater democracy, are superimposed on economic factors, influencing the brain drain (Fetzer & Millan, 2015). Other studies indicate that the increased emigration of highly educated people has dissatisfaction, lack of trust and political dissatisfaction as its main motivators (Fakih & El Baba, 2023). Finally, Strielkowski et al. (2021) study geopolitical factors and multiculturalism, linking brain drain with national security, and thus the need to protect a country's skilled labor force. Which can be gravitating in sectors such as healthcare (Marchal & Kegels, 2003), although healthcare professionals also have their motivations tied to economic reasons (Abou Hashish & Ashour, 2020, Lanati & Thiele, 2021).
On the one hand, at origin, low wages, unemployment, an underdeveloped economy and labor mobility facilities are combined, and on the other hand, at destination, mainly the demand for cheap labor (Thaut, 2009). Studies such as Dibeh et al. (2018) typify the brain drain more prone to migrate as young people from less prosperous families, living in poor regions and mainly unemployed. As a result, the brain drain produces relief from the lack of job openings for skilled workers and increases national income from remittances (Thaut, 2009). These same remittances in turn facilitate highly skilled migration to developed countries (Grigoryan & Khachatryan, 2022).
Additionally, Iqbala et al. (2020) explore the reasons for the brain drain, pointing out that high salaries outside the country, better opportunities and education are the main factors. From the educational sphere, strengthening the internal educational capacity would be a way to mitigate the brain drain at the student stage (Kritz, 2015). But it is of great importance to identify the beliefs that motivate the departure of potential emigrants, to design targeted policies to effectively manage skilled migration and reduce its negative impacts (Ramoo, Lee, & Yu, 2017, Vega-Muñoz et al., 2024).
Benhamou (2008) highlights how brain drain, linked to demographic pressures, aggravates problems such as migration due to desertification and mass migration in regions such as the Sahara, weakening local capacity to face challenges. At a global level, Vega-Muñoz et al. (2024b) point out that economic inequality and internal displacements contribute directly to this phenomenon, requiring comprehensive approaches for its mitigation. Thaut (2009) analyzes how in Lithuania factors such as unemployment and low wages, after its accession to the EU, intensify the brain drain, affecting its development.
Another important factor contributing to brain drain is state fragility and regional imbalances. Seyoum and Camargo (2021) identify institutional weakness as a critical component that drives talent emigration and limits foreign direct investment. Carlsen and Bruggemann (2017) emphasize how these phenomena intensify problems such as economic deterioration and group grievances, affecting especially acutely during migration crises in Europe. For their part, Egyed and Zsibók (2023) propose that strengthening core economic activities could help reduce regional imbalances and mitigate the loss of talent.
External intervention and government effectiveness are intrinsically related to brain drain, given their impact on local stability and opportunities (Vega-Muñoz et al., 2024b). And Chee and Mu (2021) emphasize that external intervention, by destabilizing regions, fosters the displacement of skilled talent by amplifying conflicts and weakening institutions, and reinforce this perspective by associating such intervention with the increase in terrorist attacks, creating hostile environments that drive emigration. On the other hand, Simplice (2014) points out that controlling corruption and investing in key sectors such as health are essential to curb the loss of human capital, while Simplice (2015) stresses that well-designed migration policies and strengthening human development are crucial to retain talent. These studies underline that effective governance, free from destabilizing external interference, is fundamental to mitigate brain drain and generate sustainable environments that incentivize professionals to stay in their countries of origin.
Other studies point to political instability, violence, and terrorism as influencing the brain drain. Subhani, Tajuddin, and Diah (2018) note that these conditions in India have driven out-migration of skilled Muslims. And Vega-Muñoz et al. (2024b) highlight that insecurity weakens social cohesion and encourages migration. Meanwhile, Huang (2023) shows that the perception of stability determines emigration in contexts such as South Africa and the United States. And Monekosso (2014) links conflicts in sub-Saharan Africa with the outflow of health professionals. Stability is thus key to stemming this loss of talent.
To maintain governmental stability, the rule of law becomes a key element for sustainable development and stability in developing countries. Barnett, Cummings and Vaaler (2012) point out that remittances can strengthen it, partially mitigating the effects of brain drain. And Vega-Muñoz et al. (2024b) identify it as essential for governance and stability, while Nadeem et al. (2021) warn that its weakness slows innovation and investment. Strengthening the rule of law is fundamental for combating corruption and fostering sustainable development.
Also, governmental stability allows for a solid security apparatus, fundamental to mitigate brain drain by ensuring stability and trust in local institutions. Vega-Muñoz et al. (2024b) identify it as a key element in governance, highlighting its importance in retaining talent and promoting safe environments. And Chee and Mu (2021) highlight its relevance in the Silk Belt and Road Initiative (BRI), where security failures have intensified terrorism in regions such as Iraq and Afghanistan, showing the need to strengthen these systems to reduce risks and promote stability.
In turn, in island states, poor debt management restricts essential services (Moloney, 2019). While in Yemen, conflicts deteriorate higher education, aggravating the loss of qualified talent (AlMunifi & Aleryani, 2021). On the contrary, in Canada, public policies strengthen social cohesion and reduce emigration (Kesselman, 2001). Globally, public services are key to stability and governance (Vega-Muñoz et al., 2024b). However, in Thailand, wage disparities promote out-migration, weakening public services (Nittayaramphong & Tangcharoensathien, 1994). And in Azerbaijan, trust in public services influences migration decisions (Aliyev & Gasimov, 2023). Thus, in rural areas, the triple helix improves services and fosters talent retention (Knauer, 2009). Finally, the limited sustainability of public systems complicates service provision in developing countries (Larsen, 2008). These findings underscore the importance of strengthening public services to reduce brain drain.
An incident factor identified in several studies is corruption, which weakens institutions and restricts opportunities, intensifying the brain drain. In Nepal, nepotism and lack of labor transparency encourage the emigration of skilled professionals (Mainali, 2020), while in North Macedonia and India, corruption in higher education and religious discrimination directly affect talent retention (Jovcheska, 2024; Subhani et al., 2018). In sub-Saharan Africa, corruption and weak institutions hinder development and aggravate the loss of human talent (Usman et al., 2022; Ndjobo & Simoes, 2021). Cases such as Venezuela and Russia reflect how these dynamics perpetuate mass emigration and undermine essential sectors (Zea, 2020; Safina, 2015; Romanov, 2017).
Finally, empirical studies corroborate this relationship. Cooray & Schneider (2016) link increased corruption with higher rates of skilled emigration, while Rogers (2008) highlights its negative impact on eco-nomic growth. In Greece and Serbia, political corruption and university inefficiency accelerate academic out-migration (Panagiotakopoulos, 2020; Pejanovic et al., 2015), and in Pakistan, they reinforce structural inequalities and limit innovation (Khalid & Qureshi, 2020; Nadeem et al., 2021). In addition, corruption in social and migration systems in Zimbabwe, Africa and Asia-Pacific perpetuates the outflow of talent to developed countries (Mwapaura et al., 2022; Chand, 2019; Hugo, 2013). Furthermore, Monekosso (2014) highlights the persistent challenges in African medical education, underlining the need to combat corruption to stem the brain drain and enhance sustainable development.
2. Methods
Establishing the global determinants of Brain Drain (Human Flight and Brain Drain, E3) as in previous studies responds to causative variables such as: Security Apparatus (C1) (Chee & Mu, 2021), Economic Decline (E1) (Seyoum & Camargo, 2021, Carlsen & Bruggemann, 2017, Egyed & Zsibók, 2023), Uneven Economic Development (E2) (Petrou & Connell, 2023), Public Services (P2) (Knauer, 2009, Aliyev & Gasimov, 2023, Zhang, Hao & Wang, 2024), Demographic Pressures (S1) (Benhamou, 2008, Thaut, 2009), External Intervention (X1) (Chee & Mu, 2021), Voice and Accountability (G1) (Goldberg, 2006, Muthanna & Sang, 2018), Political Stability and Absence of Violence/Terrorism (G2) (Monekosso, 2014, Subhani, Tajuddin, & Diah, 2018, Huang, 2023), Government Effectiveness (G3) (Simplice, 2014, 2015) , Rule of Law (G5) (Barnett, Cummings & Vaaler, 2012, Nadeem et al. , 2021), and Control of Corruption (G6) (King & Gëdeshi, 2023; Safina, 2015; Iacob, 2018; Romanovska et al., 2022; Monekosso, 2014; Hugo, 2013; Romanov, 2017; Pejanovic et al., 2015).
Then, null hypothesis: H0: β1 = β2 = β3 = β4 = β5 = β6 = β7 = β8 = β9 = β10 = β11 = 0, and alternative hypothesis: Ha: at least one βi ≠ 0 (i = 1, ..., 11).
As for the data under study, we have used a dataset available under the structure of global panel data on world governance and state fragility from 2006 to 2022 (Vega-Muñoz et al., 2024b). Based on this dataset on 178 countries, we have applied multiple regression of equation 1:
E3 = β1*C1 + β2*E1 + β3*E2 + β4*P2 + β5*S1 + β6*X1 + β7*G1 + β8*G2 + β9*G3 + β10*G5 + β11*G6 + ε
The data were treated by multiple linear regression with SPSS version 23 software (IBM, New York, NY, USA), using the stepwise method. For the incorporation of variables, the adjusted R-squared values (Chicco et al., 2021) were considered, but maintaining parsimony (McNeil, 1970) and without neglecting the multicollinearity results, expressed in terms of variance inflation factor (VIF) and condition indices. Multicollinearity is present when the VIF is greater than the range of 5 to 10 or the condition indices are greater than the range of 10 to 30 (Kim, 2019).

Table 1.
Description of study variables.
| Variable | N | Mean | Standard deviation | Pearson correlation with E3 |
|---|---|---|---|---|
| Human Flight and Brain Drain (E3) | 2989 | 5.540 | 2.05 | 1.00 |
| Security Apparatus (C1) | 2989 | 5.623 | 2.35 | 0.69 |
| Economic Decline (E1) | 2989 | 5.708 | 1.95 | 0.74 |
| Uneven Economic Development (E2) | 2989 | 6.150 | 2.07 | 0.72 |
| Public Services (P2) | 2989 | 5.617 | 2.49 | 0.78 |
| Demographic Pressures (S1) | 2989 | 6.039 | 2.27 | 0.74 |
| External Intervention (X1) | 2989 | 5.699 | 2.38 | 0.75 |
| Voice and Accountability (G1) | 2989 | -.138 | 1.01 | -0.46 |
| Political Stability and Absence of Violence/Terrorism (G2) | 2989 | -.170 | .97 | -0.53 |
| Government Effectiveness (G3) | 2989 | -.107 | 1.00 | -0.73 |
| Rule of Law (G5) | 2989 | -.151 | 1.00 | -0.72 |
| Control of Corruption (G6) | 2989 | -.124 | 1.01 | -0.65 |
3. Results
Table 2 shows the summary of proposed models according to the regression coefficient.
Complementarily, Table 3 shows the results of the Analysis of Variance (ANOVA) of the 11 models and reports the multicollinearity of these models.
Table 3 shows that the 11 models present significant results in the F test, but three of these models report multicollinearity problems (models 9, 10 and 11). Figure 1 shows the adjusted R-squared values of the 8 models that do not present multicollinearity problems, given the logarithmic growth that this statistic presents with the incorporation of new variables, we have considered contrasting the 3 models with the highest adjusted R-squared: models 6, 7 and 8, all of which exceed 70% of fit (see Figure 1) and whose fit parameters are shown in Table 4.
By keeping the adjusted R-squared level above 70%, model 6 gives a more parsimonious response to the independent variable, based on the variables: Public Services (P2), External Intervention (X1), Uneven Economic Development (E2), Voice and Accountability (G1), Rule of Law (G5), Political Stability and Absence of Violence/Terrorism (G2), the coefficients of model 6 are shown in detail in table 5.
All 6 dependent variables are significant and there is no multicollinearity (details of the Condition Index in Table A1 of Appendix A). As for the normality of the errors, Figure 2 presents a histogram of the regression standardized residual with mean = -8.11*10-15 and a standard deviation of 0.999 (details of residuals statistics in Table A2 of Appendix A).
4. Discussion
Our model of brain drain determinants considers information from 178 countries, giving a more panoramic global view than previous studies by Docquier et al. (2007) based on data from 30 countries (Docquier & Marfouk, 2006), and Simplice (2015) with data from 24 countries. And while the work of Yakovlev and Steinkopf (2014) analyzes data from 144 countries, they focus exclusively on Medical Brain Drain. Additionally, the work of Ngoma and Ismail (2013) analyzes brain drain in general for 102 countries but uses cross-sectional data.
As for the input variables, we have considered a base that makes a merge (Vega et al., 2024b), on the one hand, incorporates the Fragile States Index Indicators used by Chee and Mu (2021), and on the other hand, the World Governance Indicators also studied by Kizhakethalackal et al. (2015).
The six beta predictors (βi) of our null hypothesis, for which we have no evidence to accept (the 6 are non-zero), recognizing the causality of variables present in other previous brain drain studies: 1) Uneven Economic Development (E2) and mobility in the face of unequal labor markets studied by Petrou & Connell (2023) in Oceania, 2) Public Services (P2) whose development would reverse emigration intentions studied by Aliyev & Gasimov (2023) in Azerbaijan and by Zhang et al, (2024) within China, 3) External Intervention (X1) (Chee & Mu, 2021), in studying the brain drain in the framework of terrorist attacks in the countries of the “Silk Road Economic Belt” and the “21st Century Maritime Silk Road” (BRI countries), 4) Voice and Accountability (G1) in the study of the 'skills shortage' in Canada (Goldberg, 2006), 5) Political Stability and Absence of Violence/Terrorism (G2) where it is shown that greater political stability could help prevent the flight of highly skilled talent from developing countries. (Huang, 2023), and 6) Rule of Law (G5) where the lack of a strong rule of law may contribute to the emigration of highly skilled people affecting innovation and economic development. (Nadeem et al., 2021).
Additionally, we have established a dependence of the brain drain on more specific variables than the Level of development and Sociopolitical environment (Political stability and Government effectiveness) used by Docquier et al (2007), Foo (2011), and Ngoma et al (2013), or the Quality of Living Index of the Economist Intelligence Unit added by Foo (2011). Thus, our work is closer to works such as Simplice (2015) who incorporates in his study additional variables from the World Development Index, such as: Economic considerations (Savings, Inflation, and Population growth), Political considerations (Democracy, and Control of corruption), Physical security (Freedom, and Government effectiveness), Quality of life (Inequality adjusted human development, and Development assistance), and Globalization (Foreign investment, and Trade openness), and Aliyev et al (2023), who use as dependent variables perceived income adequacy, life satisfaction, and trust in government.
In this sense, our research uses as sociopolitical variables common to the works of Docquier et al (2007), Foo (2011), and Ngoma et al (2013) the Government Effectiveness and Political Stability (and Absence of Violence/Terrorism). In the case of Simplice (2015), our measure of Security Apparatus, External Intervention and Absence of Violence/Terrorist aligns with his Physical security dimension, as well as Economic Decline with his Economics consideration dimension. Finally in the case of Aliyev et al. (2023), our consideration for Uneven Economic Development is close to their perceived income adequacy variable, and their measure of trust in government approximates the set of variables that measure the relationship of citizens with the state (Public Services, Voice and Accountability, Rule of Law, and Control of Corruption).
Thus, when considering only the variables that our model includes as parsimoniously significant, we find variables directly or tangentially studied in Brain Drain research: Political Stability and Absence of Violence/Terrorism (Docquier et al., 2007, Foo, 2011, Ngoma et al., 2013, and Simplice, 2015), Uneven Economic Development, Public Services, Voice and Accountability, Rule of Law (Aliyev et al., 2023), to which External Intervention is added as a particularity of our work.
5. Conclusions
The model of brain drains determinants, after being subjected to the eleven-variable dependence test, has established that the null hypothesis cannot be accepted for betas: β3, β4, β6, β7, β8 and β10. Thus, a set of six significant and parsimonious predictors based on panel data of 178 countries from 2006 to 2022 determines the brain drain dependence according to equation 2.
E3 = k + β4*P2 + β6*X1 + β3*E2 + β7*G1 + β10*G5 + β8*G2 + ε
With k, a base constant of the model and the following independent variables: Public Services (P2), External Intervention (X1), Uneven Economic Development (E2), Voice and Accountability (G1), Rule of Law (G5), Political Stability and Absence of Violence/Terrorism (G2) and ε assume the residual errors. For the data set used the model is calibrated with normally distributed residual errors as follows in equation 3:
E3 = 1.343 + .262*P2 + .379*X1 + .183*E2 + .228*G1 + -.367*G5 + .138*G2 + ε
Future lines of research can delve into recalibrations of the model for different sets of countries according to levels of economic development, trade blocks and geopolitical blocks, and cross-sectional years in the panel data. In addition to delving into the management of these determinants in the field of public policy, in particular brain gain and brain circulation programs, and both the phenomenon of digital nomadism and the economic implications of remittances and diaspora policies.
Author Contributions
Conceptualization, A.V.-M and P.G.-G.d.M..; methodology, A.V.-M.; validation, N.C.-B.; formal analysis, A.V.-M.; data curation, A.V.-M., and N.C.-B.; writing—original draft preparation, A.V.-M. and N.C.-B.; writing—review and editing, A.V.-M. and P.G.-G.d.M.; supervision, P.G.-G.d.M.; project administration, A.V.-M. All authors have read and agreed to the published version of the manuscript.
Funding
The publication fee (APC) was partially financed by the Universidad Central de Chile (Code: APC2024) and Pontificia Universidad Católica de Valparaíso (Code: APC2024), through the publication incentive fund.
Informed Consent Statement
Not applicable.
Data Availability Statement
The original data presented in the study are openly available in Data in Brief at https://doi.org/10.1016/j.dib.2024.110167.
Acknowledgments
The authors would like to thank the Doctoral Program in Political and Administration Sciences and International Relations (Faculty of Political Sciences and Sociology) at the Complutense University of Madrid (Spain), specifically at the research line “International relations: Dynamics of change in global society” for providing access to specialized bibliographic material.
Conflicts of Interest
The authors declare no conflicts of interest.
Appendix A
Table A1.
Collinearity Diagnostics Model 6 for the dependent variable Human Flight and Brain Drain.
| Dimension | Eigenvalue | Condition Index | Variance Proportions | ||||||
|---|---|---|---|---|---|---|---|---|---|
| (Constant) | P2 | X1 | E2 | G1 | G2 | G5 | |||
| 1 | 4.496 | 1.000 | .00 | .00 | .00 | .00 | .01 | .01 | .00 |
| 2 | 1.882 | 1.546 | .00 | .00 | .00 | .00 | .05 | .05 | .02 |
| 3 | .353 | 3.568 | .00 | .00 | .00 | .00 | .44 | .61 | .00 |
| 4 | .180 | 4.995 | .01 | .00 | .00 | .00 | .46 | .31 | .47 |
| 5 | .045 | 9.954 | .01 | .05 | .89 | .12 | .00 | .01 | .00 |
| 6 | .025 | 13.367 | .91 | .25 | .05 | .07 | .03 | .01 | .49 |
| 7 | .018 | 15.724 | .07 | .70 | .05 | .81 | .02 | .00 | .02 |
Table A2.
Residuals Statistics Model 6 for the dependent variable Human Flight and Brain Drain.
| Minimum | Maximum | Mean | Std. Deviation | N | |
|---|---|---|---|---|---|
| Predicted Value | 1.314 | 8.813 | 5.540 | 1.724 | 2989 |
| Std. Predicted Value | -2.450 | 1.898 | .000 | 1.000 | 2989 |
| Standard Error of Predicted Value | .024 | .116 | .052 | .013 | 2989 |
| Adjusted Predicted Value | 1.313 | 8.816 | 5.540 | 1.724 | 2989 |
| Residual | -4.551 | 3.810 | .0000 | 1.114 | 2989 |
| Std. Residual | -4.083 | 3.418 | .000 | .999 | 2989 |
| Stud. Residual | -4.086 | 3.430 | .000 | 1.000 | 2989 |
| Deleted Residual | -4.557 | 3.836 | -.0001 | 1.116 | 2989 |
| Stud. Deleted Residual | -4.097 | 3.436 | .000 | 1.001 | 2989 |
| Mahal. Distance | .435 | 31.509 | 5.998 | 3.577 | 2989 |
| Cook's Distance | .000 | .012 | .000 | .001 | 2989 |
| Centered Leverage Value | .000 | .011 | .002 | .001 | 2989 |
References
- Aarhus, J. H., & Jakobsen, T. G. (2019). Rewards of reforms: Can economic freedom and reforms in developing countries reduce the brain drain? Int. Area Stud. Rev., 22, 327–347. [CrossRef]
- Abou Hashish, E., & Ashour, H. M. (2020). Determinants and mitigating factors of the brain drain among Egyptian nurses: A mixed-methods study. J. Res. Nurs., 25, 699–719. [CrossRef]
- Aliyev, K., & Gasimov, I. (2023). Trust in government and intention to emigrate in a post-soviet country: evidence from Azerbaijan. Econ. Sociol., 16(1), 199-213. [CrossRef]
- AlMunifi, A. A., & Aleryani, A. Y. (2021). Internal efficiency of higher education system in armed conflict-affected countries: Yemen case. Int. J. Educ. Dev., 83, 102394. [CrossRef]
- Asso, P. F. (2021). New perspectives on old inequalities: Italy’s north-south divide. Territ. Polit. Gov., 9, 346–364. [CrossRef]
- Barnett, M., Cummings, M., & Vaaler, P. (2012). The social dividends of diaspora: Migrants, remittances, and changes in home-country rule of law. Proc. Int. Assoc. Bus. Soc., 23(1), 147–159.
- Benhamou, K. (2008). Capacity building for sustainable energy access in the Sahel/Sahara region: Wind energy as catalyst for regional development. Nato sci peace secur. [CrossRef]
- Carlsen, L., & Bruggemann, R. (2017). Fragile State Index: Trends and Developments. A Partial Order Data Analysis. Soc. Indic. Res., 133(1), 1–14. [CrossRef]
- Chand, M. (2019). Brain drain, brain circulation, and the African diaspora in the United States. J. Afr. Bus., 20(1), 6–19. [CrossRef]
- Chee, L., & Mu, F. (2021). Spatiotemporal characteristics and driving forces of attacks in the Belt and Road Initiative countries. PLoS One, 16(3). [CrossRef]
- Chicco, D., Warrens, M.J., Jurman, G. (2021). The coefficient of determination R-squared is more informative than SMAPE, MAE, MAPE, MSE and RMSE in regression analysis evaluation. PeerJ Comput. Sci., 7, e623. [CrossRef]
- Cooray, A., & Schneider, F. (2016). Does corruption promote emigration? An empirical examination. J. Popul. Econ., 29(1), 293–310. [CrossRef]
- Diallo, M. A. (2022). Subjectand migration intentions abroad: The case of Senegal. Afr. Dev. Rev., 34, 410–424. [CrossRef]
- Dibeh, G., Fakhri, A., & Marrouch, W. (2018). Decision to emigrate amongst the youth in Lebanon. Int. Migr., 56, 5–22. [CrossRef]
- Docquier, F., & Marfouk, A. (2006). International migration by education attainment, 1990-2000. In C. Ozden, & M. Schiff (Eds.), International Migration, Remittances and the Brain Drain (pp. 151-200). Palgrave Macmillan.
- Docquier, F., Lohest, O., & Marfouk, A. (2007). Brain drain in developing countries. World Bank Econ. Rev., 21(2), 193-218. [CrossRef]
- Egyed, I., & Zsibók, Z. (2023). Exploring firm performance in Central and Eastern European regions: A foundational approach. Hung. Geogr. Bull., 72(3). [CrossRef]
- Fakih, A., & El Baba, M. (2023). The willingness to emigrate in six MENA countries: The role of past revolutionary stress. Int. Migr., 61, 201–220. [CrossRef]
- Fetzer, J. S., & Millen, B. A. (2015). The Causes of Emigration from Singapore: How Much Is Still Political? Crit. Asian Stud., 47, 462–476. [CrossRef]
- Foo, G. (2011). Quantifying the Malaysian Brain Drain and an Investigation of its Key Determinants. Malays. J. Econ. Stud., 48(2), 93-116.
- Goldberg, M. P. (2006). Discursive policy webs in a globalisation era: A discussion of access to professions and trades for immigrant professionals in Ontario, Canada. Glob. Soc. Educ., 4(1), 77–102. [CrossRef]
- Grigoryan, A., & Khachatryan, S. (2022). Remittances and emigration intentions: Evidence from Armenia. Int. Migr., 60, 198–234. [CrossRef]
- Hoti, A. (2009). Determinants of emigration and its economic consequences: Evidence from Kosova. SE. Eur. Black Sea Stud., 9, 435–458. [CrossRef]
- https://doi.org/ 10.1108/IJSE-12-2013-0288.
- Huang, X. N. (2023). Immigrant Skill Selection: A Case Study of South Africa and the USA. J. Knowl. Econ., 14, 101567. [CrossRef]
- Hugo, G. (2013). Migration and development in Asia and a role for Australia. J. Intercult. Stud., 34(2), 141–159. [CrossRef]
- Iacob, R. (2018). Brain drain phenomenon in Romania: What comes in line after corruption? A quantitative analysis of the determinant causes of Romanian skilled migration. Rom. J. Commun. Public Relat., 20, 53–78.
- Ienciu, N. M., & Ienciu, A. (2015). Brain drain in Central and Eastern Europe: New insights on the role of public policy. SE. Eur. Black Sea Stud., 15, 281–299. [CrossRef]
- Iqbala, K., Peng, H., Hafeez, M., Wang, Y. C., Khurshid, L. I., & CY. (2020). The current wave and determinants of brain drain migration from China. Hum. Syst. Manag., 39, 455–468. [CrossRef]
- Jovcheska, S. (2024). Exploring corruption in higher education: A case study of brain drain in North Macedonia. Int. J. Educ. Dev., 107. [CrossRef]
- Kesselman, J. R. (2001). Policy implications of brain drain from Canada. Can. Public Policy, 27(3), 73–93. [CrossRef]
- Khalid, M. U., & Qureshi, J. A. (2020). The strategic role of public policies in technological innovation in Pakistan and lessons learnt from advanced countries: A comparative literature review. J. Organ. Behav. Res., 5(1), 212–232.
- Kim, J.H. (2019). Multicollinearity and misleading statistical results. Korean J. Anesthesiol, 72(6), 558-569. [CrossRef]
- King, R., & Gëdeshi, I. (2023). Albanian students abroad: A potential brain drain? Cent. East. Eur. Migr. Rev., 12, 73–97. [CrossRef]
- Kizhakethalackal, E.T., Mukherjee, D., & Alvi, E. (2015). Count-data Analysis of physician Emigration from Developing Countries: A Note. Econ. Bull., 35(2), 1177-1184.
- Knauer, H. (2009). Strategic Approach Idea for Innovation Performance in Declining Rural Hinterland Areas. Rural development., 74–78.
- Kritz, M. M. (2015). International student mobility and tertiary education capacity in Africa. Int. Migr., 53, 29–49. [CrossRef]
- Lanati, M., & Thiele, R. (2021). Aid for health, economic growth, and the emigration of medical workers. J. Int. Dev., 33, 1112–1140. [CrossRef]
- Larsen, C. H. (2008). The fragile environments of inexpensive CD4+T-cell enumeration in the least developed countries: Strategies for accessible support. Cytom. Part B-Clin. Cytom., 748, S107–S116. [CrossRef]
- Levitin, C. (1997). Yeltsin voices concern over 'brain-drain'. Nature, 390(6658), 32–33.
- Mainali, B. R. (2020). Brain drain and higher education in Nepal. Rout res high educ, 87–99.
- Marchal, B., & Kegels, G. (2003). Health workforce imbalances in times of globalization: Brain drain or professional mobility? Int. J. Health Plann. Manag., 18. S89- S101. [CrossRef]
- McNeil, K.A. (1970). Meeting the goals of research with multiple linear regression. Multivar. Behav. Res., 5(3), 375-386. [CrossRef]
- Moloney, K. (2019). Debt administration in small island-states. Aust. J. Public Adm., 78(3), 325–340. [CrossRef]
- Monekosso, G. L. (2014). A brief history of medical education in Sub-Saharan Africa. Acad. Med., 89(8), S11–S1. [CrossRef]
- Muthanna, A., & Sang, G. Y. (2018). Brain drain in higher education: Critical voices on teacher education in Yemen. Lond. Rev. Educ., 16(1), 296–307.
- Mwapaura, K., Chikoko, W., Nyabeze, K., Kabonga, I., & Zvokuomba, K. (2022). Provision of child protection services in Zimbabwe: Review of the human rights perspective. Cogent Soc. Sci., 8(1). [CrossRef]
- Nadeem, M. A., Liu, Z. Y., Younis, A., Asghar, F., Ghani, U., & Xu, Y. (2021). How governance structure, terrorism, and internationalization affect innovation: Evidence from Pakistan. Technol. Anal. Strateg. Manag., 33(6), 670–684. [CrossRef]
- Ndjobo, P. M. N., & Simoes, N. C. (2021). Institutions and brain drain: The role of business start-up regulations. Afr. J. Sci. Technol. Innov. Dev., 13(7), 807–815. [CrossRef]
- Ngoma, AL., & Ismail, N.W. (2013). The determinants of brain drain in developing countries. Int. J. Soc. Econ., 40(8), 744-754. [CrossRef]
- Nittayaramphong, S., & Tangcharoensathien, V. (1994). Thailand - private health-care out of control. Health Policy Plan. 9(6), 31–40.
- Panagiotakopoulos, A. (2020). Investigating the factors affecting brain drain in Greece: Looking beyond the obvious. World J. Entrep. Manag. Sustain. Dev., 16(3), 207–218. [CrossRef]
- Pejanovic, R., Grubic-Nesic, L., Birovljev, J., & Sedlak, O. (2015). Three missions of universities and the university-industry-state government triade. ICERI Proc., 6111–6118.
- Petrou, K., & Connell, J. (2023). Our 'Pacific family'. Heroes, guests, workers or a precariat?. Aust. Geogr., 54(2), 125-135. [CrossRef]
- Ramoo, B., Lee, C. Y., & Yu, C. M. (2017). Eliciting salient beliefs of engineers in Malaysia on migrating abroad. Migr. Lett., 14, 221–236.
- Rogers, M. L. (2008). Directly unproductive schooling: How country characteristics affect the impact of schooling on growth. Eur. Econ. Rev., 52(2), 356–385. [CrossRef]
- Romanov, E. V. (2017). What capitalism does Russia need? Methodological guidelines of the new industrialization. Econ. Soc. Chang., 10(2), 90–108. [CrossRef]
- Romanovska, Y., Kozachenko, G., Pogorelov, Y., Pomazun, O., & Redko, K. (2022). Problems of development of economic security in Ukraine: Challenges and opportunities. Financ. Credit Act., 5, 249–257. [CrossRef]
- Safina, D. (2015). Favouritism and nepotism in an organization: Causes and effects. Proc. Econ. Financ., 23, 630–634. [CrossRef]
- Seyoum y Camargo (2021).
- Simplice, A. (2014). Globalization and health worker crisis: what do wealth-effects tell us? Int. J. Soc. Econ., 41.
- Simplice, A. (2015). Determinants of health professionals' migration in Africa: a WHO based assessment. Int. J. Soc. Econ., 42(7), 666-686. [CrossRef]
- Strielkowski, W., Niño-Amézquita, L., & Kalyana, S. (2021). Geopolitics and multicultural environment as the determinants of personnel security. Manag. Res. Pract., 13, 17–31.
- Subhani, Z. H., Tajuddin, N. A., & Diah, N. M. (2018). Muslim migration to the West: The case of the Muslim minority in India. Al-Shajarah, 173–193.
- Thaut, L. (2009). EU Integration & Emigration Consequences: The Case of Lithuania. Int. Migr., 47, 191–233. [CrossRef]
- Usman, M. A. M., Ozdeser, H., Cavusoglu, B., & Aliyu, U. S. (2022). On the sustainable economic growth in Sub-Saharan Africa: Do remittances, human capital flight, and brain drain matter? Sustainability, 14(4). [CrossRef]
- Vega-Muñoz, A., Gónzalez-Gómez-del-Miño, P., & Espinosa-Cristia, J. F. (2021). Recognizing New Trends in Brain Drain Studies in the Framework of Global Sustainability. Sustainability, 13(6), 3195. [CrossRef]
- Vega-Muñoz, A., González-Gómez-del-Miño, P., Salazar-Sepúlveda, G. (2024). Scoping review about well-being in the ‘brain migration’ studies. MethodsX, 13, 103068. [CrossRef]
- Vega-Muñoz, A., González-Gómez-del-Miño, P., & Salazar-Sepúlveda, G. (2024b). Global panel data on World governance and state fragility from 2006 to 2022. Data Brief, 53. [CrossRef]
- Yakovlev, P., & Steinkopf, T. (2014). Can Economic Freedom Cure Medical Brain Drain?, J. Priv. Enterp., 29(3), 97-117.
- Zea, D. G. (2020). Brain drain in Venezuela: The scope of the human capital crisis. Hum. Resour. Dev. Int., 23(2), 188–195. [CrossRef]
- Zhang, J., Hao, F,L., & Wang, S.J. (2024). Spatiotemporal Characteristics and Influencing Factors of Talent Inflow in Northeast China from the Perspective of Urban Amenity. J. Urban Plan. Dev., 150(2), 5024011. [CrossRef]
Figure 1.
Adjusted R-squared growth.
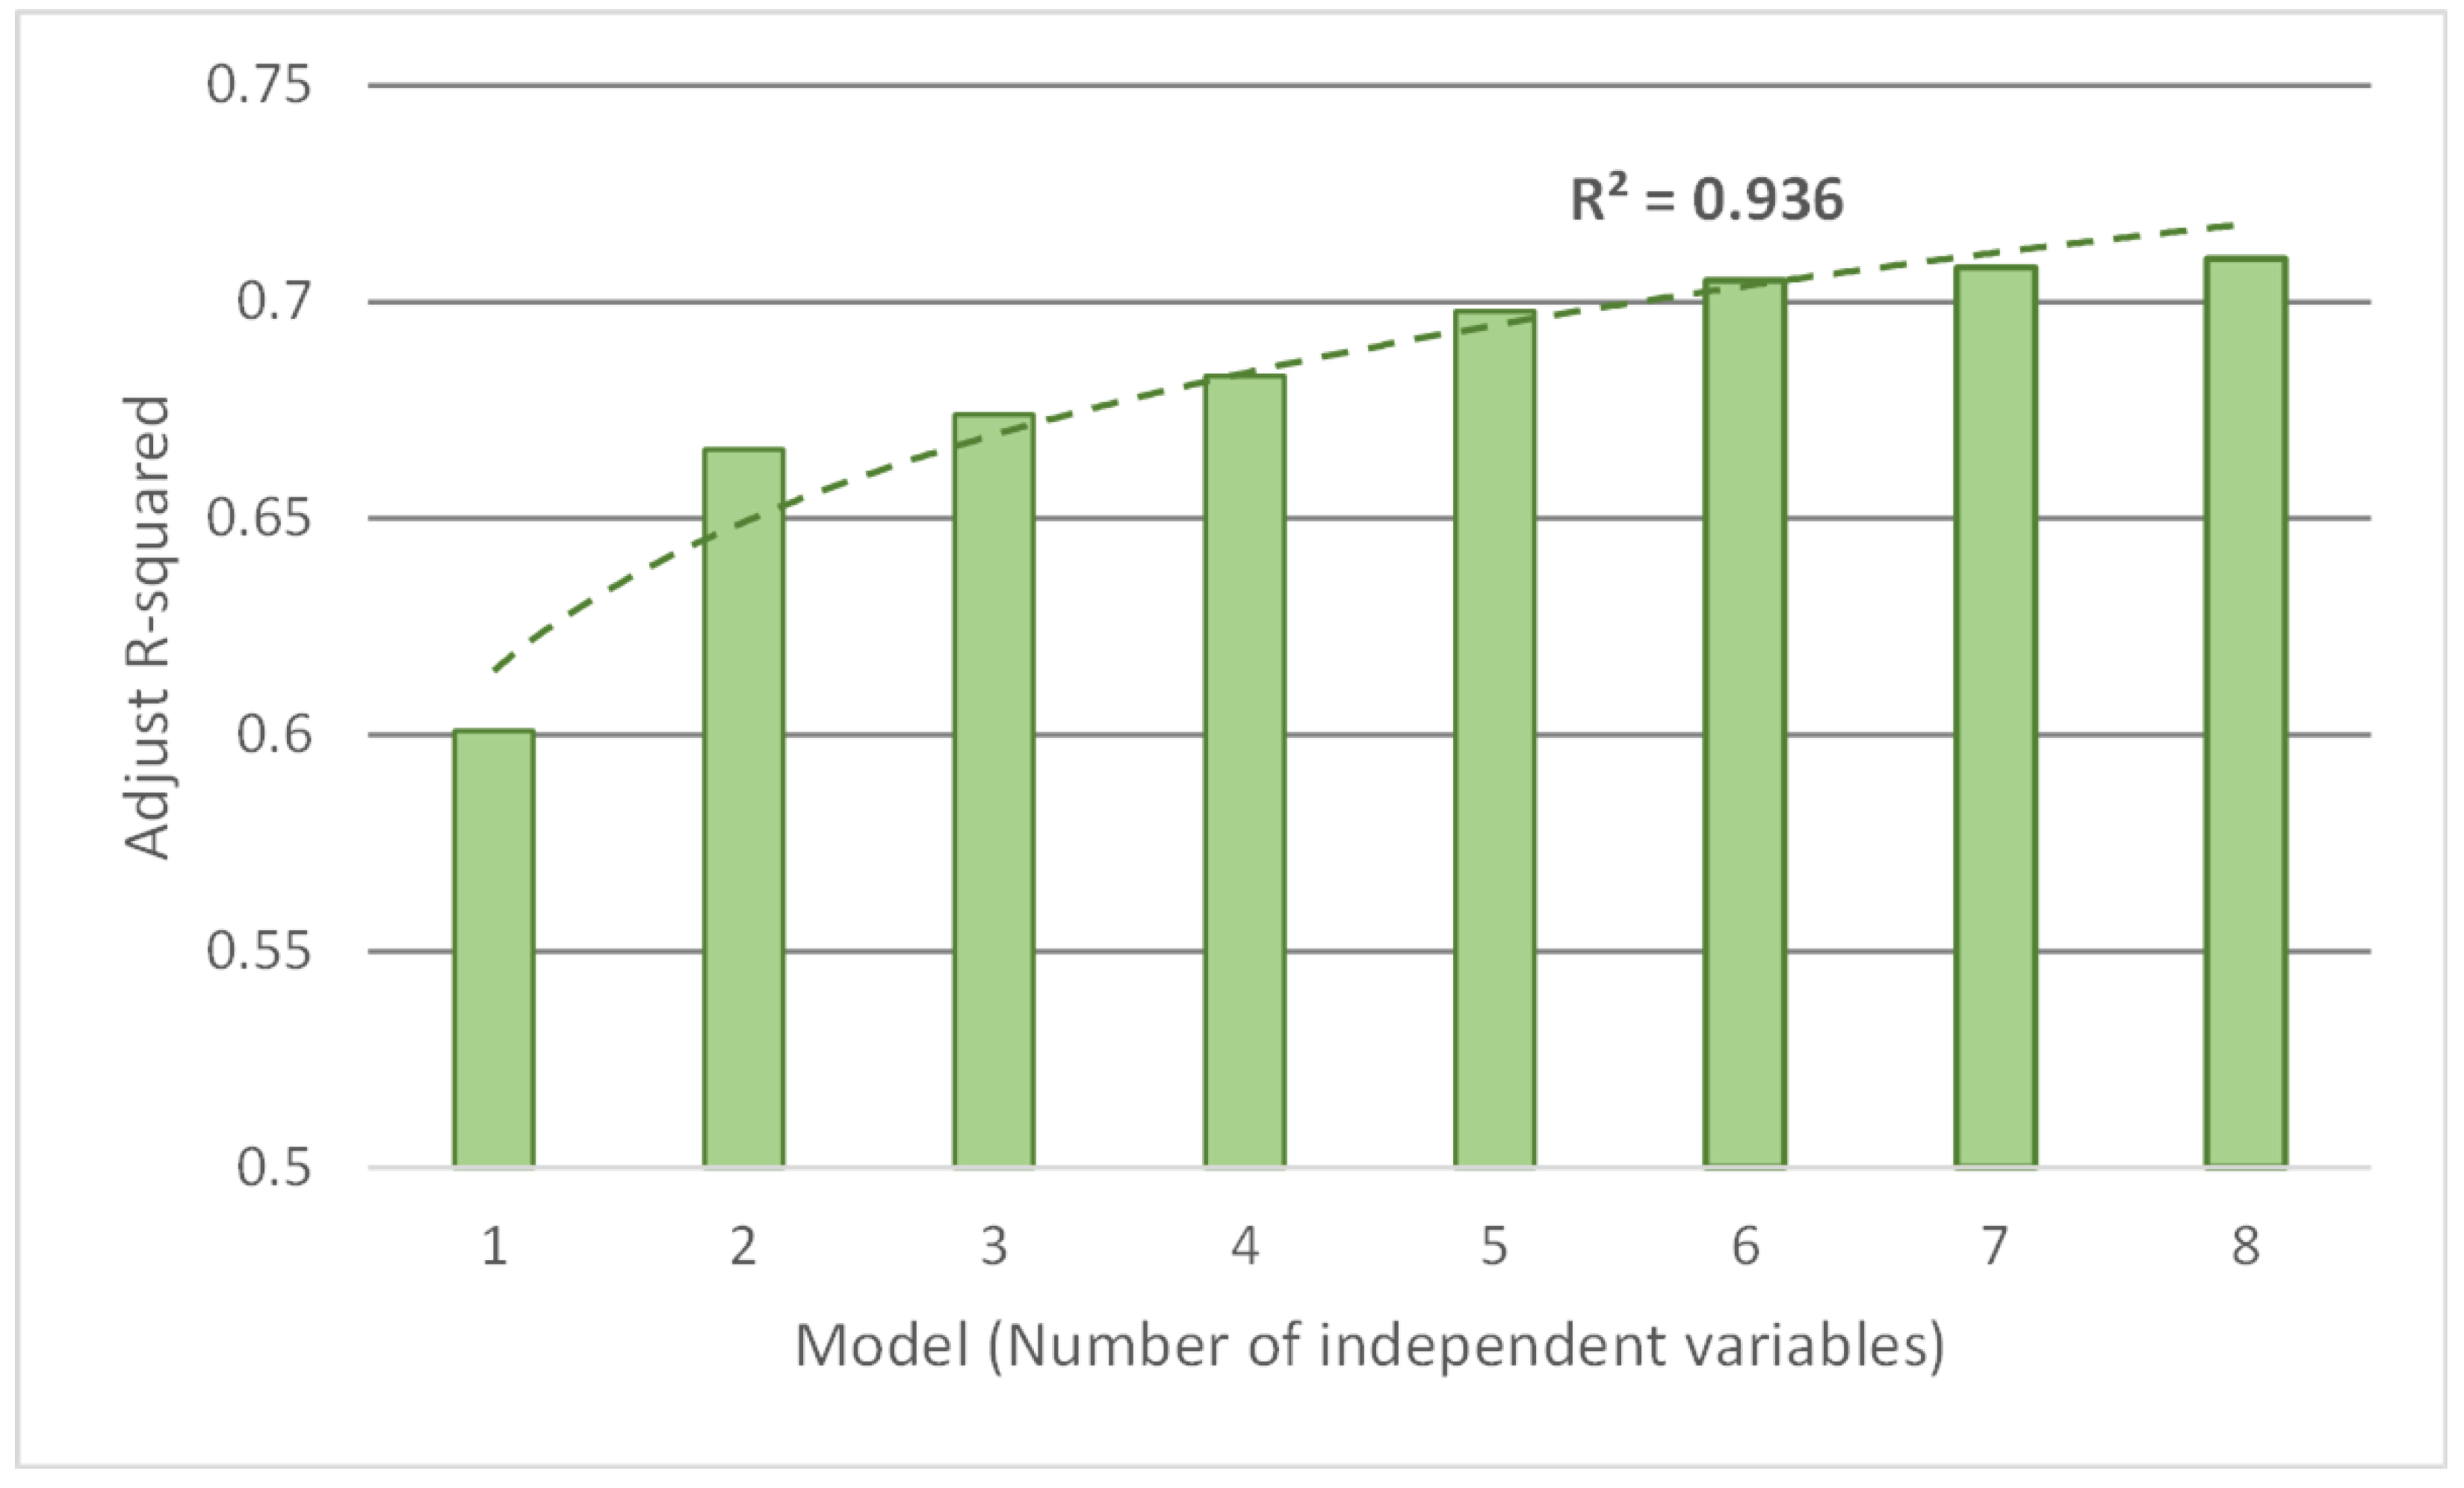
Figure 2.
Histogram of regression standardized residual for the dependent variable Human Flight and Brain Drain.
Figure 2.
Histogram of regression standardized residual for the dependent variable Human Flight and Brain Drain.
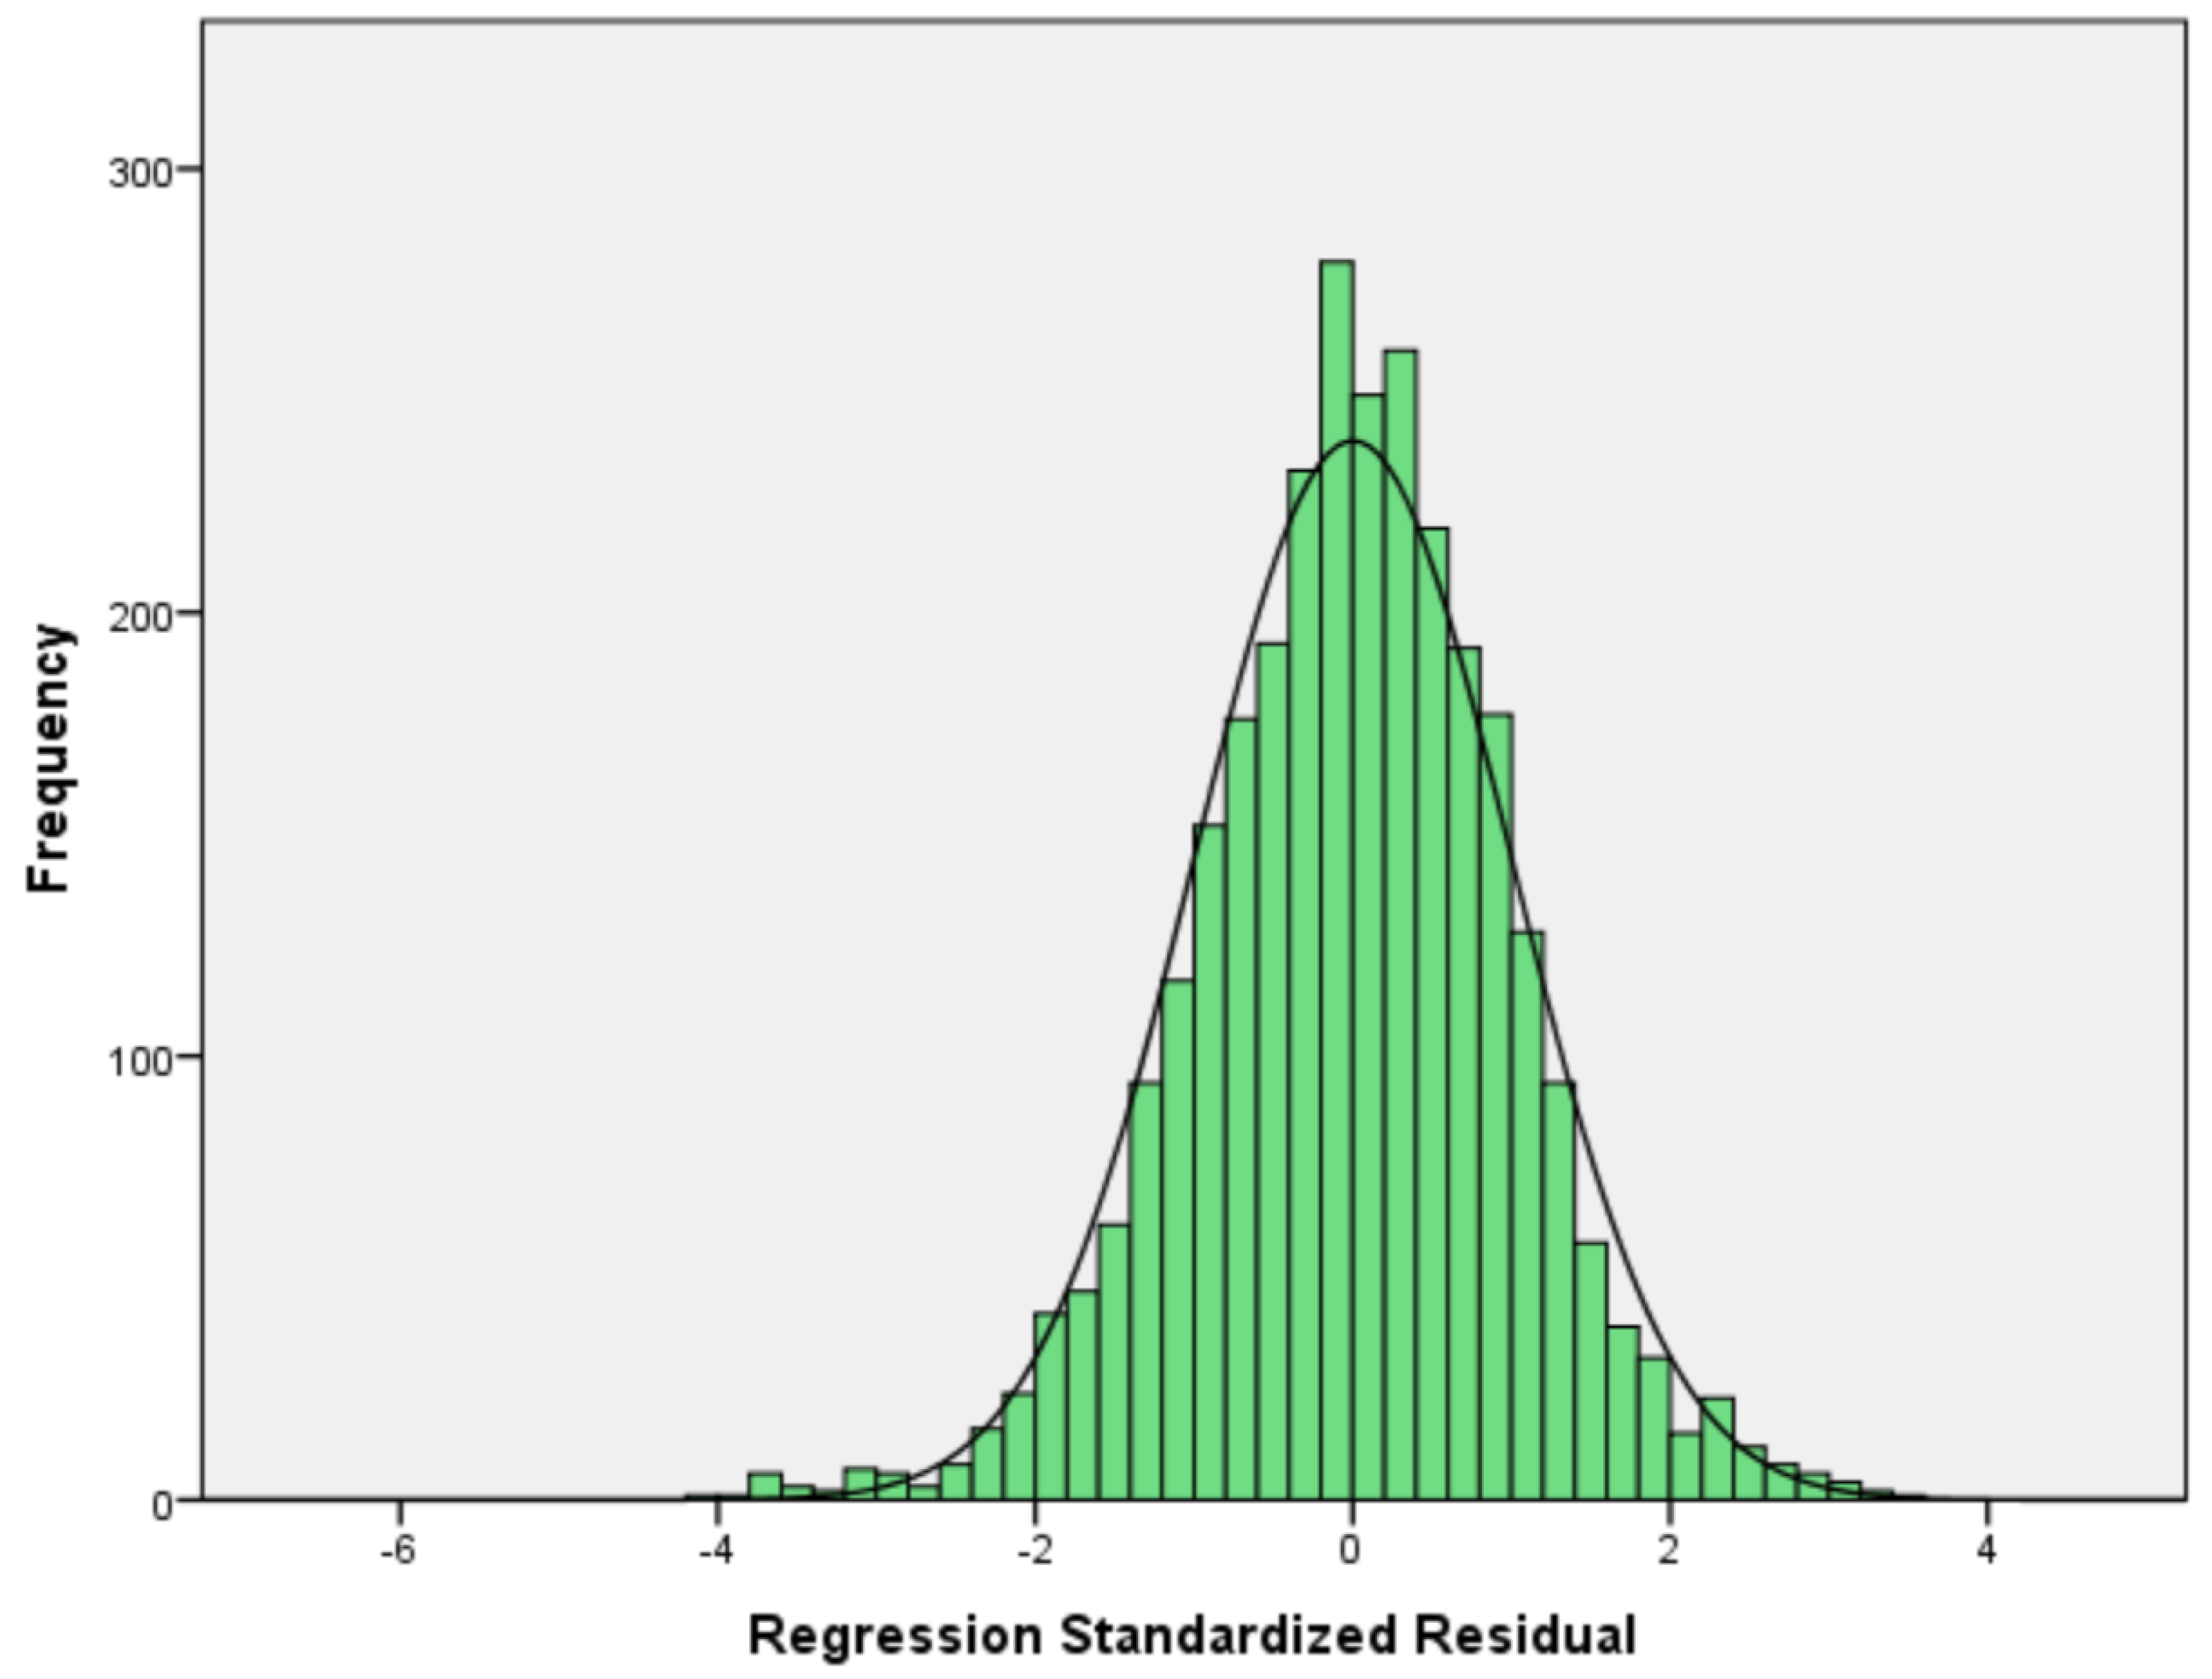
Table 2.
Proposed models summary.
| Model | Predictors | R | R-squared | Adjusted R-squared |
Std. error of estimation |
|---|---|---|---|---|---|
| 1 | P2 | .776 | .602 | .601 | 1.296 |
| 2 | P2, X1 | .816 | .666 | .666 | 1.187 |
| 3 | P2, X1, E2 | .821 | .674 | .674 | 1.172 |
| 4 | P2, X1, E2, G1 | .826 | .683 | .683 | 1.156 |
| 5 | P2, X1, E2, G1, G5 | .835 | .698 | .698 | 1.129 |
| 6 | P2, X1, E2, G1, G5, G2 | .840 | .706 | .705 | 1.115 |
| 7 | P2, X1, E2, G1, G5, G2, C1 | .842 | .709 | .708 | 1.109 |
| 8 | P2, X1, E2, G1, G5, G2, C1, E1 | .843 | .710 | .710 | 1.106 |
| 9 | P2, X1, E2, G1, G5, G2, C1, E1, G6 | .844 | .712 | .711 | 1.104 |
| 10 | P2, X1, E2, G1, G5, G2, C1, E1, G6, G3 | .845 | .714 | .713 | 1.100 |
| 11 | P2, X1, E2, G1, G5, G2, C1, E1, G6, G3, S1 | .845 | .715 | .714 | 1.099 |
Table 3.
ANOVA and Multicollinearity report for the dependent variable Human Flight and Brain Drain.
Table 3.
ANOVA and Multicollinearity report for the dependent variable Human Flight and Brain Drain.
| Model | Sum of squares | df | Mean Square | F test | Sig. | VIF > 10 | Condition index > 30 | |
|---|---|---|---|---|---|---|---|---|
| 1 | Regression | 7572.337 | 1 | 7572.337 | 4509.459 | .000 | No | No |
| Residual | 5015.806 | 2987 | 1.679 | |||||
| Total | 12588.144 | 2988 | ||||||
| 2 | Regression | 8382.389 | 2 | 4191.194 | 2975.662 | .000 | No | No |
| Residual | 4205.755 | 2986 | 1.408 | |||||
| Total | 12588.144 | 2988 | ||||||
| 3 | Regression | 8490.582 | 3 | 2830.194 | 2061.745 | .000 | No | No |
| Residual | 4097.562 | 2985 | 1.373 | |||||
| Total | 12588.144 | 2988 | ||||||
| 4 | Regression | 8598.433 | 4 | 2149.608 | 1607.744 | .000 | No | No |
| Residual | 3989.710 | 2984 | 1.337 | |||||
| Total | 12588.144 | 2988 | ||||||
| 5 | Regression | 8787.083 | 5 | 1757.417 | 1379.187 | .000 | No | No |
| Residual | 3801.061 | 2983 | 1.274 | |||||
| Total | 12588.144 | 2988 | ||||||
| 6 | Regression | 8883.446 | 6 | 1480.574 | 1191.750 | .000 | No | No |
| Residual | 3704.697 | 2982 | 1.242 | |||||
| Total | 12588.144 | 2988 | ||||||
| 7 | Regression | 8921.901 | 7 | 1274.557 | 1036.335 | .000 | No | No |
| Residual | 3666.242 | 2981 | 1.230 | |||||
| Total | 12588.144 | 2988 | ||||||
| 8 | Regression | 8941.701 | 8 | 1117.713 | 913.434 | .000 | No | No |
| Residual | 3646.443 | 2980 | 1.224 | |||||
| Total | 12588.144 | 2988 | ||||||
| 9 | Regression | 8960.777 | 9 | 995.642 | 817.678 | .000 | Yes | No |
| Residual | 3627.366 | 2979 | 1.218 | |||||
| Total | 12588.144 | 2988 | ||||||
| 10 | Regression | 8983.164 | 10 | 898.316 | 742.081 | .000 | Yes | No |
| Residual | 3604.979 | 2978 | 1.211 | |||||
| Total | 12588.144 | 2988 | ||||||
| 11 | Regression | 8996.000 | 11 | 817.818 | 677.769 | .000 | Yes | Yes |
| Residual | 3592.144 | 2977 | 1.207 | |||||
| Total | 12588.144 | 2988 | ||||||
Table 4.
Selection of Models for the dependent variable Human Flight and Brain Drain.
| Model | Sum of squares | df | Root mean square | F test | Sig. | R | R-squared | Adjusted R-squared |
Standard error of estimation |
|
|---|---|---|---|---|---|---|---|---|---|---|
|
Model 6: P2, X1, E2, G1, G5, G2. |
Regression | 8883.446 | 6 | 1480.574 | 1191.750 | .000 | .840 | .706 | .705 | 1.115 |
| Residual | 3704.697 | 2982 | 1.242 | |||||||
| Total | 12588.144 | 2988 | ||||||||
|
Model 7: P2, X1, E2, G1, G5, G2, C1. |
Regression | 8921.901 | 7 | 1274.557 | 1036.335 | .000 | .842 | .709 | .708 | 1.109 |
| Residual | 3666.242 | 2981 | 1.230 | |||||||
| Total | 12588.144 | 2988 | ||||||||
|
Model 8: P2, X1, E2, G1, G5, G2, C1, E1. |
Regression | 8941.701 | 8 | 1117.713 | 913.434 | .000 | .843 | .710 | .710 | 1.106 |
| Residual | 3646.443 | 2980 | 1.224 | |||||||
| Total | 12588.144 | 2988 | ||||||||
Table 5.
Coefficients Model 6 for the dependent variable Human Flight and Brain Drain.
| Model 6 | Unstandardized Coefficients |
Standardized Coefficients | t | Sig. | 95.0% Confidence Interval for B |
Collinearity Statistics | |||
|---|---|---|---|---|---|---|---|---|---|
| B | Std. Error | Beta | Lower Bound | Upper Bound | Tolerance | VIF | |||
| (Constant) | 1.343 | .105 | 12.752 | .000 | 1.137 | 1.550 | |||
| Public Services | .216 | .020 | .262 | 10.948 | .000 | .177 | .255 | .173 | 5.784 |
| External Intervention | .327 | .014 | .379 | 23.469 | .000 | .299 | .354 | .378 | 2.642 |
| Uneven Economic Development | .182 | .018 | .183 | 9.939 | .000 | .146 | .218 | .290 | 3.449 |
| Voice and Accountability | .465 | .034 | .228 | 13.846 | .000 | .399 | .530 | .363 | 2.757 |
| Political Stability and Absence of Violence/Terrorism | .291 | .033 | .138 | 8.807 | .000 | .227 | .356 | .403 | 2.482 |
| Rule of Law | -.757 | .052 | -.367 | -14.430 | .000 | -.859 | -.654 | .153 | 6.555 |
Disclaimer/Publisher’s Note: The statements, opinions and data contained in all publications are solely those of the individual author(s) and contributor(s) and not of MDPI and/or the editor(s). MDPI and/or the editor(s) disclaim responsibility for any injury to people or property resulting from any ideas, methods, instructions or products referred to in the content. |
© 2024 by the authors. Licensee MDPI, Basel, Switzerland. This article is an open access article distributed under the terms and conditions of the Creative Commons Attribution (CC BY) license (http://creativecommons.org/licenses/by/4.0/).
Copyright: This open access article is published under a Creative Commons CC BY 4.0 license, which permit the free download, distribution, and reuse, provided that the author and preprint are cited in any reuse.


