
Submitted:
11 December 2024
Posted:
12 December 2024
You are already at the latest version
Abstract
As one of the most important food crops in the world, the quality assurance of corn seeds is of utmost significance in all stages of production, storage, circulation and breeding. However, the traditional detection method has some disadvantages, such as high labor intensity, strong subjectivity, low efficiency, cumbersome operation, high cost and possibly harmful to human health. In view of this, it is of great significance to study more advanced detection methods. In this paper, the application of near infrared spectroscopy and its imaging technology in the quality detection of corn seeds was reviewed. Firstly, the principles of these two technologies were introduced, and their components, data acquisition and processing methods, as well as portability were compared and discussed. Then, the application of these methods to the main quality of corn seeds (including variety and purity, vigor, internal components, mycotoxins and other qualities such as frost damage, hardness and maturity, etc.) was reviewed. The significance of corn quality characteristics and the function of the applied algorithm were emphasized.. Finally, the future research direction of spectral and its imaging technology was proposed, aiming to further enhance the accuracy, reliability, and practicability of the detection technology, provide valuable reference information for researchers, and contribute to global food security and sustainable agricultural development.
Keywords:
Corn seed
; Near-Infrared Spectroscopy
; Hyperspectral Imaging
; Quality Detection
1. Introduction
Corn (Zea mays L.) is one of the three major food crops globally, rich in proteins, lipids, vitamins, and various nutrients. It serves both as an economic and a feed crop, and plays a key role as an ingredient in the pharmaceutical, starch, and alcohol industries. According to the statistical data from the National Bureau of Statistics (https://data.stats.gov.cn/easyquery.htm?cn=C01), China’s corn production in 2023 reached 288.8423 million tons, accounting for 41.54% of the total production of all food crops, ranking first in the planting area and output of major food crops. In addition, the planting efficiency of corn is higher than that of other food crops, and it has become the main source of income for many crop farmers. Therefore, corn holds an extremely important position in China’s agricultural production, and strengthening research on corn is crucial for promoting agricultural development, economic growth, and stability.
In the process of production, processing and sales of corn seeds, its quality detection is particularly important, the different varieties make its use of different scenarios, some suitable for human consumption, some suitable for animal feed, and some can be made into a lot of agricultural and sideline processing products, the internal composition of corn differences also create its use. In addition, the level of seed vitality for the seedling and growth of corn is also affected. If the seed is improperly stored, it will suffer mycotoxin infection, etc., which affects life and production, and even causes harm to human health. Thus, in the process of corn production, storage, circulation and breeding, it is a key step to accurately detect corn quality of each process. Table 1 shows the main detection indicators and application scenarios of corn in each production processes, and lists the relevant traditional detection methods [1,2,3,4]. From Table 1, it can be found that the current traditional corn quality detection methods include: manual detection, drying method, Kjeldahl nitrogen determination, spectrophotometry, DNA molecular marker method, and protein electrophoresis identification, etc, most of which are based on chemical analysis. Although the detection accuracy is high, there are obvious drawbacks, such as heavy workload, strong subjectivity, low efficiency, high cost, and harm to human health. Moreover, the detection samples cannot be recycled and used, the reagents and corn samples require sufficient reaction time, which is time-consuming and labor-intensive. The quality of corn directly affects the health of the public and its processing characteristics, so the research on its quality detection methods is of great significance.
Existing non-destructive corn quality detection technologies [5] include electronic nose and electronic tongue detection methods based on chemical properties, dielectric property detection methods based on electrical properties, and spectral technology based on optical properties, etc. Since optical property detection technologies have high detection speed and accuracy, and there have been no similar reports before. Therefore, to help readers to understand the field of corn quality detection, this study collated and summarized the literature of near infrared spectroscopy (NIRS) and hyperspectral imaging (HSI) technology in nondestructive testing of corn quality. In this review, the principles of these two technologies (NIRS, HSI) are introduced firstly, and the difference between them were compared. Then the development and application of different indicators such as corn variety and purity, vitality, internal composition, mycotoxins infection and other indicators are introduced. Finally, the challenges and future research directions in corn quality detection are discussed. The schematic diagram of this study is shown in Figure 1.
2. Introduction of NIRS and HSI technologies
2.1. Basic Principles and Characteristics
Near-infrared spectroscopy (NIRS) ranges from 780 to 2500 nm, and is divided into short-wave near-infrared (wavelength 780 to 1100 nm) and long-wave near-infrared (wavelength 1100 to 2500 nm). It records the absorption characteristics of hydrogen-containing groups X-H (C-H, O-H, N-H, etc.) and covers a large amount of structure and composition information, so the components containing these groups can be established by chemometrics with relational models for qualitative or quantitative analysis of samples. The NIRS equipment is relatively simple. The common components includes a light source, a beam splitter system, a sample detector, an optical detector and its data analysis system. The NIR spectrometer can be small in size and have portable equipment to facilitate rapid detection in the field, such as testing the quality of agricultural products at the agricultural production site. As for the detection methods, the NIRS has transmission, diffuse reflection, transmission and reflection detection methods, and the choice of different detection methods is also demand-dependent.
2.2. Basic Principles and Characteristics of HSI
As for hyperspectral imaging (HSI) technology, it is a detection method that combines spectral technology and image technology, which can obtain both spectral information and image information of samples. The spectroscopic technique is mainly near-infrared absorption, and has been introduced above. The image technology can obtain the target image information without touching the object, which has the advantages of intuitive, quantitative, recognition, fast speed and mature technology.
Compared with NIRS equipment, the structure of hyperspectral equipment is more complex. It mainly includes CCD camera, imaging spectrometer, lens, light source controller, sample station, mobile platform and its controller, hyperspectral data acquisition software, mobile platform mobile control software. The imaging spectrometer is the core component, which is able to obtain both spectral and spatial information of the target. Optical systems need to have higher resolution to ensure the quality of spectra and images. Its detectors usually need to have high sensitivity and high resolution to cope with a large number of spectral bands and fine image information. Hyperspectral equipment is generally larger in size and higher in price, and is often used in aerospace remote sensing, large-scale farmland monitoring in precision agriculture and other fields. The application of hyperspectral imaging technology can not only locate the specific position of the sample, obtain the spectral information of the specific position, and detect the chemical composition of the sample, which is a fast and efficient optical detection means. According to different scanning methods, it can be divided into point scanning, line scanning and area scanning, among which line scanning is the most commonly used one. Table 2 shows the comparison of these technologies.
2.3. The Data Processing Methods
As for the process of NIRS and HSI data, the general analyzing steps are shown as Figure 2. In the process of NIRS data [6], the general steps (Figure 2A) are divided into: sample collection, spectral data preprocessing, feature waveband selection, model establishment and evaluation, etc. At the same time, from the principle of HSI technology, it can be seen that its processing methods include spectral data processing and image data processing (Figure 2B). In general, image data processing and analysis are carried out firstly, including image preprocessing, image segmentation and feature extraction, etc., and the spectral data processing methods and steps are the same as NIRS data.
When spectral data are collected, the first step is to preprocess the acquired spectra in order to eliminate irrelevant information and noise, such as the electrical noise, sample background noise, and stray light noise, etc [7]. Common spectral preprocessing methods include smoothing, derivatives, multiple scattering correction (MSC), baseline correction, standard normal transformation (SNV), orthogonal signal correction (OSC), and combinations of these approaches [8,9,10]. Generally, the second step involves extracting spectral feature wavebands. Since the collected spectral data consist of hundreds or thousands of wavebands, using all wavebands for modeling presents issues such as extensive computation and prolonged processing time. Additionally, due to the lack of distinct spectral absorption, severe overlap, and the inclusion of redundant information, the stability and prediction accuracy of the model may be undermined. Hence, it is a common practice to eliminate irrelevant information and filter out independent variables with high correlation during the modeling process. Currently, commonly used feature waveband selection methods [11,12,13] include principal component analysis (PCA), competitive adaptive reweighting (CARS), genetic algorithm (GA), continuous projection algorithm (SPA), and no-information variable elimination (UVE), etc.
After pretreatment or feature wavelength selection, the calibration model of the spectrum is ultimately established for qualitative or quantitative analysis. With the rapid development of statistics, it is an inevitable trend to use mathematical analysis methods [14] for more scientific classification and quantitative detection, which can be linear or non-linear, supervised or unsupervised. Common qualitative and quantitative methods include biomimetic pattern recognition (BPR), K-nearest neighbor (KNN), linear discriminant analysis (LDA), partial least squares discriminant analysis (PLS-DA), extreme learning machine (ELM), support vector machine (SVM), backpropagation neural network (BPNN), partial least squares regression (PLSR) and radial basis function neural network (RBFNN), etc. In recent years, deep learning algorithms, particularly convolutional neural networks (CNN), have been utilized for both quantitative and qualitative modeling of near-infrared spectroscopy[15,16,17]. Compared to traditional machine learning methods, convolutional neural networks can progressively extract features embedded within spectral data through multiple convolutional and pooling layers, thereby reducing the need for extensive pre-processing of spectra and variable selection prior to modeling to some extent [6]. After the model is established, it is crucial to evaluate its stability and accuracy and select high-quality models. Commonly used indicators include accuracy, correlation coefficient, and the standard deviation of calibration and prediction set samples, etc.
Next, the specific applications of these two technologies in corn variety and purity detection, vitality detection, internal components detection, mycotoxins, and other indicators (freezing damage, hardness detection, and maturity) detection are introduced.
3. Variety and purity detection
Regarding variety and purity detection, scholars have conducted relevant research on corn variety identification, transgenic corn detection, and haploid detection (Table 3).
3.1. Variety identification
Nowadays, the varieties of crop seeds are increasing with each passing day. The number of national-approved corn varieties is growing rapidly. Around 2010, the number of approved corn varieties in China was in the range of 30 to 40 each year . However, in 2020, the number of approved varieties reached as 802 within a single year [18]. Incidents of seed adulteration, counterfeiting, and passing off inferior products as superior ones are becoming increasingly frequent in the market. Unscrupulous merchants mix unqualified seeds with qualified ones, leading to reduced crop yields and seriously undermining the interests of growers. Therefore, the variety and purity detection are particularly necessary.
Over the years, many scholars had conducted extensive research in this field. Wu et al. (2010) collected diffuse reflection spectral data of 37 corn varieties. The original spectra were preprocessed by vector normalization, and a method of spectral feature waveband extraction based on standard deviation was proposed. They performed PCA and established a BPR model with an average correct recognition rate of 94.3% [19]. Wang et al. (2011) used genetic algorithms to select feature wavebands for 37 varieties, reducing the data dimension and using linear discriminant analysis for classification, achieving an average correct rejection rate of 99.65% [20]. Huang et al. (2011) used PLS model to determine the purity of Nongda 108 corn with the final verification set of 95.75% and an average relative error of 2.73% [21]. Jia et al. (2012) established a BPR model for 8 corn varieties, with an average correct recognition rate of 94.6% [22]. In 2014, Han et al. collected near-infrared spectral data of 8 corn varieties and found that the SVM algorithm was more suitable for small sample spectral analysis under certain principal components [23]. In 2015, Jia et al. used near-infrared spectroscopy and chemometrics to identify coated corn seed varieties, with the soft independent modeling of class analogy (SIMCA) model showing an accuracy rate of 97.5% [24]. In 2018, Cui et al. studied the feasibility of identifying maize seed varieties by combining NIRS with chemometrics methods. The spectra were pretreated with smoothing, the first derivative and vector normalization; then PCA, LDA and BPR were applied to establish identification models. The results showed that the average correct identification rate was more than 90%, and it was robust to samples from different regions and years [25].
From 2012 to 2022, various scholars utilized hyperspectral imaging technology. Zhang et al. extracted texture variables (contrast, homogeneity, energy and correlation) and established a PCA-GLCM-LS-SVM model with a recognition accuracy of 98.89% [26]. Wang et al. collected hyperspectral image data of 3 varieties of corn seeds and selected 6 optimal spectral wavelengths by SPA algorithm. Different varieties of corn seeds were classified according to spectral, texture, or fusion data, and the results showed that the classification results based on the pretreatment data of the whole band were the best, with an accuracy of 91.667% (Figure 3) [27]. Xia et al. proposed an MLDA algorithm and achieved a classification accuracy of 99.13% [28]. Zhou et al. realized the non-destructive identification of sweet corn seed varieties and achieved good classification accuracy rates [29]. Scholars from Zhejiang University used algorithms like RBFNN, t-SNE, and SVM combined with hyperspectral imaging to classify corn varieties [30,31,32]. Zhao et al., Miao et al., and Bai et al. also made contributions in corn seed variety classification using hyperspectral imaging and different methods [30,31,32].
Some scholars proposed model update concepts. He et al. used clustering algorithms for model update, results showed that after the model parameters were determined and applied, the overall accuracy rate of the updated model was 98.3%, which was higher than the accuracy rate of 84.6% obtained by the unupdated model [33]. With the update and iteration of learning algorithms, deep learning was applied in data analysis [34,35,36,37]. Zhang et al. combined hyperspectral imaging with deep convolutional neural networks (DCNN) to classify four maize seed varieties. The results showed that the DCNN model had 100% training accuracy, 94.4% test accuracy and 93.3% verification accuracy, which was superior to KNN and SVM models in most cases. DCNN model also had the best performance in terms of evaluation indicators (sensitivity, specificity and accuracy) and achieved good results [34]. Wang et al. compared different classification models and found that the performance of the proposed CNN-LSTM is slightly better than the other five models [38].
3.2. Transgenic Detection
Transgenic corn is one of the most widely used transgenic crops in China. Although this technology can breed excellent varieties with high yield, high resistance, and high quality that adapt to adverse ecological environments, it also brings two issues: exogenous gene safety and environmental safety. With transgenic technology develops and is widely applied, the safety and reliability of transgenic products are drawing increasing attention. Accurate, rapid, and efficient detection methods for transgenic corn are of great significance for food quality monitoring and control and for human health and the social economy.
Feng et al. (2018) used NIRS for the identification of transgenic corn seeds. Three variable selection algorithms (weighted regression coefficients, PCA-loadings and second derivatives) were used to extract the feature wavelength. Five methods, including KNN, SIMCA, naive Bayes classifier, ELM and BPANN were used to establish the discriminant model. The results showed that ELM exhibited the best performance with 100% classification accuracy based on full waveband and 90.83% based on feature wavelengths [39]. At the same year, Peng et al. utilized NIRS to identify transgenic corn with SG smoothing. The SVM model based on full spectrum was superior to the PLS model, with a recognition accuracy of over 90%[40]. In 2022, Zhang et al. employed NIRS to identify four groups of transgenic corn. A three-layer ANN model identified transgenic corn with 100% accuracy [41].
In 2017, Feng et al. used NIR hyperspectral imaging and multivariate data analysis along with pretreatment algorithms. Models were established to classify transgenic corn grains with nearly 100% calculation and prediction accuracy [42]. In 2023, Wei et al. collected hyperspectral images of three types of corn grains and compared traditional and deep learning algorithms. The prediction accuracy of the BPNN-GA model was 0.861, and deep learning modeling had the accuracy of 0.961 [43].
3.3. Haploid detection
In the field of identifying corn haploids and polyploids, several studies had been conducted. Liu et al. employed KPCA for feature extraction and SVM to establish a classification model for corn seed haploids and polyploids, with average correct recognition rates of 95% and 93.57% respectively [44]. Yu et al. proposed a nonlinear feature analysis method based on SVSKLPP, showing high average accuracy, sensitivity, and specificity of 97.1%, 98.8% and 95.4% [45]. Cui et al. proposed a screening scheme for corn haploid seeds based on NIRS quantitative analysis with an average accuracy above 90% and a model monitoring and calibration solution for stability [46]. In 2021, Ge et al. fused NMR and NIRS data, improving unclear corn grain category classification by about 9% with a DADA framework [47]. In 2023, Ribeiro et al. used NIRS and preprocessed data with PCA, a PLS-DA model achieved 100% accurate classification of haploid and diploid seeds and plants [48].
As for the application of hyperspectral in haploid detection, Wang et al. took Zhengdan 958 and Nongda 616 as research objects and explored the effect of embryo orientation (embryo facing or facing away from the light source) on the haploid recognition model. The correct acceptance rate of the haploid and diploid test sets was as high as 99%, and the wrong acceptance rate was less than 1% [49]. He et al. discussed the applicability of near-infrared hyperspectral imaging, used three variable selection methods to determine 20 wavelengths and established a PLSDA model with 90.31% accuracy [50]. Zhang et al. used hyperspectral imaging combined with a GAN-based data enhancement method to identify haploid corn grains, showing that both DCGAN and CGAN increased classifier accuracy by more than 10%, with CGAN having a higher increase [51].
3.4. Vitality detection
Seed vitality is a key indicator for measuring seed quality and is related to germination rate, quantity, and stress resistance. Traditional seed vitality determination methods are destructive and have a long test period. The recent studies are summarized as shown in Table 4.
Agelet et al. used NIRS and various methods (PLS-DA, KNN, LS-SVM) to identify thermally damaged corn kernels. Among them, PLS-DA had the highest accuracy of 99% [52]. In 2013, Yang et al. used NIRS and BPNN to establish a corn seed vitality detection model. The BPNN model constructed by combining preprocessing and feature extraction methods had a recognition accuracy of 95.0% [53]. In 2018, Wu et al. used NIRS to establish a new method for detecting vitality indicators (germination rate, germination index, vitality index and other vitality indicators) of sweet corn seeds and established a PLSR quantitative model [54]. Wang et al. (2020) distinguished normal seeds from heat-damaged and artificially aged seeds using NIRS based on a self-made single seed device. The accuracy for heat-damaged seeds reached 100%, and it was higher than 95% for artificially aged seeds. The accuracy of the comprehensive model for calibration set and prediction set were 97.8% and 97.3% respectively [55]. In 2022, Zhao et al. applied NIRS and chemometrics to determine the vitality of sweet corn seeds under reflection and transmission modes, and found that the transmission model was better than the reflection model [56].
As for the applications of HSI technology [57,58,59,60,61,62,63], Ambrose et al. established a PLS-DA method to distinguish aged and normal corn seeds. The classification accuracy rates of the calibration set and prediction set were 97.6% and 95.6% respectively [57]. In 2018, Wakholi et al. used short-wave infrared hyperspectral imaging combined with chemometrics methods (LDA, PLS-DA, SVM) to evaluate corn seed vitality. The results showed that SVM model combined with pretreatment methods had an accuracy of up to 100% (Figure 4) [59].
In 2022, Cui et al. used regression methods to establish the prediction relationship between hyperspectral features and seedling root length. The coefficient of determination reached 0.8319 [62]. In 2022, Zhao et al. combined hyperspectral imaging and deep convolutional neural network to predict the vitality of waxy corn seeds with an accuracy of 98.83% [61]. These studies show that NIRS and hyperspectral imaging technology have great potential in detecting the vitality of corn seeds. Different methods and models have their own advantages in terms of accuracy.
3.5. Components determination
The main components of corn include water, protein, starch, and fat. The content level directly affects product prices and market positioning. The internal chemical components of seeds contain chemical bonds such as C-H, H-H, and C-N that are sensitive to near-infrared spectroscopy. Therefore, many scholars have established models for the component detection of seeds. These studies are summarized in Table 5.
3.5.1. Moisture determination
Moisture is an important factor affecting seed storage, transportation, and germination. Through moisture detection, understanding the moisture content of seeds provides a basis for seed storage and processing. There are some studies conducted in the detection of moisture based on NIRS [64,65,66] and HSI [67,68,69,70,71,72,73]. Fassio et al. (2009) used NIRS to predict high-moisture grain corn’s nutritional value, accurately predicting dry matter, acid detergent fiber, and in vitro organic matter digestibility [64]. Wang et al. (2019) established a PLS monitoring model for corn moisture during filling period with small sample sizes. For 20 and 50 samples, coefficient of determination was higher than 0.99 [65]. Zhang et al. (2020) collected hyperspectral images of embryo side and endosperm side of seeds, and extracted feature wavelengths using UVE. The results showed that the average spectrum extracted from the centroid region was better than that extracted from the whole seed region, and the results of convolutional smoothing pretreatment are better than other pretreatment methods [69]. Wang et al. (2020-2023) explores the accuracy of detecting water content of single maize seed under different pretreatment and waveband extraction algorithms. The results showed that the combination of long-wave hyperspectral imaging technology and general model algorithm could realize the non-destructive and stable prediction of maize seed water content [68,70,73].
3.5.2. Other components determination
From Table 5, it’s found that most of the studies apply NIRS for composition prediction determination [74,75,76,77,78,79]. Fassio et al. (2015) used NIRS to determine corn seed oil content with coefficient of determination of 0.90%, cross-validation standard error of 0.17%, and RPD of 2.3 for qualitative determination [74]. Lyu et al. (2016) analyzed corn’s crude protein, moisture, and fat [75]. Emmanuel et al. (2022) used NIRS for breeding selection and built an NIRS model for the detection of amino acids [76]. Xu et al. (2023) constructed a BiPLS-PCA-ELM model with the R2p of 0.996, 0.989, 0.974 and 0.976; the prediction root means square errors of 0.018, 0.016, 0.067 and 0.109; the RPD value of 15.704, 9.741, 6.330 and 6.236, respectively (Figure 5) [79].
Cataltas et al. (2023) used a one-dimensional convolutional autoencoder and NIRS to detect protein, starch, oil, and moisture [77]. Wu et al. (2023) proposed A-CARS model and the results showed that the model was significantly better than other methods [78]. Some studies were conducted in the component determination with HSI technology, Liu et al. (2020) used HSI technology to determine starch content in single corn seeds, smoothing and derivative algorithms were used to preprocess the spectra, and then CARS method was used to select the feature wavelength. The results showed that ANN prediction model based on Levenberg-Marquardt algorithm was the best model for starch content determination. The correlation coefficient (Rp) of prediction set was 0.96, and the root mean square error (RMSEP) was 0.98 [80]. Zhang et al. (2022) combined hyperspectral imaging technology and deep learning algorithms (DCGAN, ACNNR, CNNR) to predict the oil content of a single corn kernel. The results showed that the attention mechanism helped reduce the prediction error, making ACNNR perform best (prediction determination coefficient =0.9198) [81,82].
3.6. Mycotoxins detection
Corn seeds may be infected with mycotoxins when stored not properly. If the mycotoxins can not be detected well in the early stage, it will bring about various hazards. On the one hand, mycotoxins such as aflatoxin and zearalenone seriously endanger human health and animal growth. Transmission through the food chain can lead to problems like liver damage and disorders of the reproductive system. On the other hand, toxins can reduce the quality and nutritional value of corn and affect its economic value. Strict limit standards for mycotoxins require testing to avoid trade disputes and economic losses. At the same time, detection helps farmers take preventive measures and guarantees the sustainable development of agriculture. Table 6 summarizes the research on mycotoxin detection of corn seeds based on NIRS and HSI..
As can be seen from Table 6, whether using NIRS [83,84,85,86,87,88,89] or HSI technology [90,91,92,93,94,95,96,97,98,99,100,101,102,103,104,105,106,107] for mycotoxin detection, the vast majority of studies are focused on AFB1 detection. Fernández et al. (2009) used NIRS technology to detect the content of aflatoxin B1 in 152 samples. The best predictive model foe detecting AFB1 in maize was obtained by using SNVD as scatter correction (r2 = 0.80 and 0.82; SECV = 0.211 and 0.200 for grating and FT-NIRS instruments, respectively) [83]. Tallada et al. detected AFB1 using near-infrared reflection spectroscopy and color imaging. The accuracy rates for detecting uninfected and infected kernels were 89% and 79% respectively [84]. Tao et al. (2019) used NIRS to detect AFB1 contamination on the surface of corn kernels. The results showed that the best three-category model had a prediction overall accuracy of 98.6% in both ranges I and II. For the seven-category discrimination model, the best overall prediction accuracies obtained in ranges I and II were 91.4% and 97.1%, respectively [85]. In the later stage, some scholars independently developed portable near-infrared spectrometers to analyze different levels of AFB1 or fumonisin B1 and B2 [87,88]. Wang et al. (2022) combined NIRS with deep learning algorithms for the determination of AFB1 in corn. The results showed that compared with the 1D-CNN model, the performance of the 2D-MTF-CNN model was significantly improved [89].
As for the study of HSI technology for aflatoxins detection of corn seeds. Zhu et al. (2016) combined fluorescence and V/NIR HSI to detect aflatoxins in whole corn kernels. The results showed that the best overall prediction accuracy (95.33%) of the LS-SVM model with a threshold of 100 ppb on the embryo side [91]. Conceição et al. (2021) used near-infrared hyperspectral images combined with PLS-DA to rapidly identify Fusarium verticillioides and Fusarium graminearum [92]. The Wang’s team from China Agricultural University successively detected AFB1 in single corn kernels from 2014 to 2023 [96,97,98,99,100,101,102,103]. During this period, improvements and applications were made to different corn varieties, wavelength ranges, pretreatments, especially feature extraction and modeling algorithms. Each study showed that hyperspectral imaging was an effective tool for detecting AFB1 in a single corn kernel. Lu et al. (2022) combined short-wave infrared hyperspectral imaging and synchronous Fourier transform infrared microspectroscopy to study the chemical and spatiotemporal changes of damaged corn kernels caused by Aspergillus flavus infection from macroscopic and microscopic perspectives. For three types of samples, satisfactory full-spectrum models and multispectral models were obtained respectively through PLSR model. In addition, the combination of SR-FTIR microspectroscopy and two-dimensional correlation spectroscopy reveals the possible sequence of dynamic changes of nutrient loss and AFB1 in corn kernels (Figure 6) [105]. Wang et al. (2023) used a fluorescence hyperspectral imaging system for AFB1 detection and developed an undersampling stacking (USS) algorithm for unbalanced data. The results showed that the USS method combined with characteristic wavelength variance analysis achieves the best performance, with an accuracy of 0.98 at the threshold of 20 or 50 μg/kg using the endosperm side spectra [107].
4. Others
In addition to the above seed quality testing, in the production and application process of corn seeds, process of corn seed production and application, it is also necessary to test other qualities such as freezing damage, hardness and maturity according to different application scenarios. The freezing damage, hardness and maturity detection based on NIRS and HSI are summarized in Table 7.
4.1. Frost damage detection
In cold regions or seasons with changeable climates, corn seeds are prone to suffer different degrees of frost damage, which will reduce the germination rate, growth potential and yield potential of seeds. Therefore, conducting frost damage detection of corn seeds can help seed production bases detect and deal with problems in time to avoid or reduce losses.
Agelet et al. (2012) tried to use NIRS technology to identify frost-damaged corn seeds. The results showed that this technology could not effectively distinguish frost-damaged corn seeds, and the highest recognition result was only 63.4% [52]. Jia et al. (2016) also tried to identify frost-damaged corn seeds with an initial moisture content of 30% in a low-temperature environment of -19.2 °C. The results showed that this technology could realize the identification of frost-damaged seeds, and the highest average accuracy rate could reach 97% [109]. Zhang et al. (2022) collected near-infrared spectral data of corn seeds under different frost damage conditions and used different preprocessing, feature extraction methods and modeling methods. The results showed that in the case of standard normal transformation preprocessing combined with principal component analysis feature extraction method and k-nearest neighbor model, the classification results of the training set and the test set were 99.4% and 100% respectively [110].
Zhang et al. (2019) successively used the VIS/NIR hyperspectral imaging system to classify frostbitten corn seeds of different degrees. Three different preprocessing methods (MSC, SNV, 5-3 smoothing), three wavelength selection algorithms (SPA, PCA, X-loading) and three modeling methods (PLS - DA, KNN and SVM) were compared. The results showed that using 5 - 3 smoothing and SPA wavelength selection method for modeling could improve the signal-to-noise ratio of the model, and the classification accuracy could reach more than 90% [111]. In 2021, the scholar studied the feasibility of combining hyperspectral imaging with DCNN to classify different frost-damaged corn seeds. For five and four categories of situations, relevant models (KNN, SVM, ELM and DCNN) were established and the evaluation indicators (accuracy, sensitivity, specificity and precision) were compared. The results showed that the accuracy rate of the DCNN model was the most satisfactory (Figure 7) [112].
4.2. Hardness detection
Williams et al. (2009, 2016) used near-infrared hyperspectral imaging technology to classify corn seeds of three hardness categories: hard, medium, and soft. The results showed that the sensitivity and specificity based on pixel classification were 0.75 and 0.97 respectively; the model based on score histogram performed better in the classification of hard-grained samples, with sensitivity and specificity of 0.93 and 0.97 respectively; and the average spectral model had sensitivity and specificity of 0.95 and 0.93 for medium-sized grains [113,114]. Qiao et al. (2022) collected hyperspectral image data of corn seeds, extracted feature wavelengths by continuous projection algorithm, and established a prediction model of moisture content by PLSR method. Finally, the prediction model was combined with the hardness regression model to verify the hardness prediction model. The results showed that the coefficient of determination of hardness prediction was 0.912 [115].
4.3. Maturity detection
Wang et al. (2015) used hyperspectral imaging technology to predict the texture changes of corn seeds at different storage times. The OSC-SPA-PLSR model was used to visualize the influence of different storage times on texture characteristics in corn seeds. The results showed that the performance of the OSC-PLS full spectral range model in predicting the structural characteristics of corn seeds was significantly better than that of the model without pretreatment [116]. Huang et al. (2016) realized the classification of corn seeds of different years based on hyperspectral imaging and model update [117]. Wang et al. (2022) extracted the average spectra of the embryo side, endosperm side and both sides. The SVM algorithm was used to develop a classification model based on full spectrum, and PCA were used to extract feature wavelengths. The accuracy rate of the prediction set using the full-spectrum classification model was 100% [118]. Yang et al. (2016) used the band ratio image of 640 nm/525 nm to classify and identify corn seed samples with high and low maturity, with an average correct recognition rate of 93.9% [119]. Wang et al. (2021) collected hyperspectral images of the embryo side and endosperm side of corn seeds of different maturities. The embryo-side spectrum (T1), endosperm-side spectrum (T2) and two-sided fused spectrum (T3) were preprocessed, and feature wavelengths were screened by PCA. The results showed that the PLS-DA classification model established by the 12 feature wavelengths extracted from the T2 spectrum based on SG-first-order derivative pretreatment had the best classification effect, with an average classification accuracy of 100%. When the T1 spectrum was input into the model, its average classification accuracy was 98.7%. The results proved the potential of hyperspectral imaging technology in the rapid and accurate classification of corn seed maturity [120].
5. Conclusions and Perspectives
From the above studies, it can be seen that NIRS and HSI technology have made great progress in corn seed quality detection (variety and purity, vitality, internal components, mycotoxins, and other indicators (freezing damage, hardness detection, and maturity)) . Breakthroughs and innovations have been made in detection methods, spectral preprocessing methods and recognition algorithms. Compared with traditional detection methods, spectral and its imaging detection technology has the advantages of easy-processing, fast speed and non-destructive.
In view of the development status and various problems of spectroscopy-imaging technology in corn detection, the following prospects are put forward in order to improve the application. 1) In the spectrometer production industry, unified specifications and general standards need to be formulated to eliminate cross-instrument obstacles in terms of hardware and software and provide a data interface for development to enhance the portability of models. 2) It is necessary to establish a spectra database of corn and expand the coverage of modeling samples to improve the prediction range and accuracy of corn. 3) Combined with artificial intelligence technology, through deep machine learning, optimal wavebands are selected, and irrelevant information is automatically filtered out without manual screening, and an optimal model is established to enhance the robustness and continuity of the corn quality detection model. 4) Due to hyperspectral imaging data is usually redundant, which requires effective algorithms to extract feature wavelengths for dimensionality reduction. The application of multiple spectral technologies in agriculture is the future trend, and the characteristics of various technologies are used to achieve high-quality detection of corn quality.
In summary, with the rapid development of spectrum and its imaging technology, the detection methods of corn quality are also advancing with the times. This is not just for corn, but more and more crops can be accurately detected by these technologies. It will must become an important means of agricultural production inspection in the future.
Author Contributions
Conceptualization: J.Z.; Writing–original draft preparation: J.Z., H.Z.;. Writing–review and editing: L.D., C.G, J.C., J.X.; Supervision: L.D., M.Q.; Project Administration and Funding Acquisition: J.Z. All authors have read, revised and approved the final manuscript.
Funding
This research was funded by the general scientific research project of Zhejiang Education Department, grant number Y202352237, Jiaxing Public welfare Research Project, grant number 2024AY10055, and the research project of Jiaxing Nanhu University, grant number QD61220011 & 62307YL.
Institutional Review Board Statement
Not applicable.
Informed Consent Statement
Not applicable.
Conflicts of Interest
The authors declare no conflict of interest.
References
- Zhang, F.; Zhang, Z.; Chen, Z.; Teng, S.; Xu, R. , Application of spectra ltesting technology in seed quality testing. Journalof Chinese Agricultural Mechanization 2021, 42, 109–114. (In Chinese) [Google Scholar]
- Wang, D.; Wang, K.; Wu, J.; Han, P. , Progressin Researchon Rapidand Non-Destructive Detection of Seed Quality Based on Spectroscopy and Imaging Technology. Spectroscopy and Spectral Analysis 2021, 41, 52–59. (In Chinese) [Google Scholar]
- Jia, W.; Mao, P. , Review on the Near Infrared Spectroscopy in Seed Quality Testing Research. Seed 2013, 32, 46–51. (In Chinese) [Google Scholar]
- Wang, M.; Zhang, Q. , Application of Near Infrared Technology in the Detection of Corn Quality. The Food Industry 2020, 41, 221–226. (In Chinese) [Google Scholar]
- Sun, Q.n; Wang, Q.; Xue, W.; Ma, H.; Sun, B.; Xie, Z. , Advances in nondestructive detection of seed quality. Journal of China Agricultural University 2012, 17, 1–6. (In Chinese) [Google Scholar]
- Zhang, J.; Liu, Z.; Pu, Y.; Wang, J.; Tang, B.; Dai, L.; Yu, S.; Chen, R. , Identification of Transgenic Agricultural Products and Foods Using NIR Spectroscopy and Hyperspectral Imaging: A Review. Processes 2023, 11, 651. [Google Scholar] [CrossRef]
- Candolfi, A.; De Maesschalck, R.; Jouan-Rimbaud, D.; Hailey, P.A.; Massart, D.L. , The influence of data pre-processing in the pattern recognition of excipientsnear-infrared spectra. J Pharmaceut Biomed 1999, 21, 115–32. [Google Scholar] [CrossRef]
- Lee, L.C.; Liong, C.; Jemain, A.A. , A contemporary review on Data Preprocessing (DP) practice strategy in ATR-FTIR spectrum. Chemometr Intell Lab 2017, 163, 64–75. [Google Scholar] [CrossRef]
- Jiao, Y.; Li, Z.; Chen, X.; Fei, S. , Preprocessing methods for near-infrared spectrum calibration. J Chemometr 2020, 34. [Google Scholar] [CrossRef]
- Rinnan, Å. ; Berg, F.V.D.; Engelsen, S.B., Review of the most common pre-processing techniques for near-infrared spectra. TrAC Trends in Analytical Chemistry 2009, 28, 1201–1222. [Google Scholar] [CrossRef]
- Dai, Q.; Cheng, J.H.; Sun, D.W.; Zeng, X.A. , Advances in feature selection methods for hyperspectral image processing in foodindustry applications: a review. Crit Rev Food Sci 2015, 55, 1368–82. [Google Scholar] [CrossRef] [PubMed]
- Li, H.; Liang, Y.; Xu, Q.; Cao, D. , Model population analysis for variable selection. J Chemometr 2010, 24, 7–8. [Google Scholar] [CrossRef]
- Liu, D.; Sun, D.; Zeng, X. , Recent Advances in Wavelength Selection Techniques for Hyperspectral Image Processing in the Food Industry. Food Bioprocess Tech 2014, 7, 307–323. [Google Scholar] [CrossRef]
- Ramirez, C.A.M.; Greenop, M.; Ashton, L.; Rehman, I.U. , Applications of machine learning in spectroscopy. Appl Spectrosc Rev 2021, 8-10, 733–763. [Google Scholar] [CrossRef]
- Yang, J.; Xu, J.; Zhang, X.; Wu, C.; Lin, T.; Ying, Y. , Deep learning for vibrational spectral analysis: Recent progress and a practical guide. Anal Chim Acta 2019, 1081, 6–17. [Google Scholar] [CrossRef]
- Zhang, X.; Lin, T.; Xu, J.; Luo, X.; Ying, Y. , DeepSpectra: An end-to-end deep learning approach for quantitative spectral analysis. Analytica Chimica Acta 2019, 1058, 48–57. [Google Scholar] [CrossRef]
- Zhang, X.; Yang, J.; Lin, T.; Ying, Y. , Food and agro-product quality evaluation based on spectroscopy and deep learning: A review. Trends Food Sci Tech 2021, 112, 431–441. [Google Scholar] [CrossRef]
- Tong, P. , China’s corn seed market in 2021. Seed Science & Technology.
- Wu, W.; Wang, H.; Chen, S.; Guo, T.; Wang, S.; Su, Q.; Sun, M.; An, D. , Fast Discri mination of Commerical Corn Varieties Based on Near Infrared Spectra. Spectroscopy and Spectral Analysis 2010, 30, 1248–1251. (In Chinese) [Google Scholar]
- Wang, H.; Li, W.; Liu, Y.; Chen, X.; Lai, J. , Study on Discrimination of Varieties of Corn Using Near-Infrared Spectroscopy Based on GA and LDA. Spectroscopy and Spectral Analysis 2011, 31, 669–672. (In Chinese) [Google Scholar]
- Huang, Y.; Zhu, L.; Ma, H.; Li, J.; Sun, B.; Sun, Q. , Quantitative Analysis of Hybrid Maize Seed Purity Using Near Infrared Spectroscopy. Spectroscopy and Spectral Analysis 2011, 31, 2706–2710. (In Chinese) [Google Scholar]
- Jia, S.; Guo, T,; Tang, X. ; Si, G.; Yang, Y.; An, D., Studyon Spectral Measurement Methods in Identification of Maize Variety Authenticity Based on Near Infrared Spectra of Single Kernels. Spectroscopy and Spectral Analysis 2012, 32, 103–107. (In Chinese) [Google Scholar] [PubMed]
- Han, Z.; Wang, J.; Zhang, H.; Deng, L.; Du, H.; Yang, J. , Variety and Origin Identification of Maize Based on Near Infrared Spectrum. Journal of the Chinese Cereals and Oils Association 2014, 29, 21–25. (In Chinese) [Google Scholar]
- Jia, S.; An, D.; Liu, Z.; Gu, J.; Li, S.; Zhang, X.; Zhu, D.; Guo, T.; Yan, Y. , Variety identification method of coated maize seeds based on near-infrared spectroscopy and chemometrics. J Cereal Sci 2015, 63, 21–26. [Google Scholar] [CrossRef]
- Cui, Y.; Xu, L.; An, D.; Liu, Z.; Gu, J.; Li, S.; Zhang, X.; Zhu, D. , Identification of maize seed varieties based on near infrared reflectance spectroscopy and chemometrics. Int J Agr Biol Eng 2018, 11, 177–183. [Google Scholar] [CrossRef]
- Zhang, X.; Liu, F.; He, Y.; Li, X. , Application of Hyperspectral Imaging and Chemometric Calibrations for Variety Discrimination of Maize Seeds. Sensors-Basel 2012, 12, 17234–17246. [Google Scholar] [CrossRef]
- Wang, L.; Sun, D.; Pu, H.; Zhu, Z. , Application of Hyperspectral Imaging to Discriminate the Variety of Maize Seeds. Food Anal Method 2016, 9, 225–234. [Google Scholar] [CrossRef]
- Xia, C.; Yang, S.; Huang, M.; Zhu, Q.; Guo, Y.; Qin, J. , Maize seed classification using hyperspectral image coupled with multi-linear discriminant analysis. Infrared Phys Techn 2019, 103, 103077. [Google Scholar] [CrossRef]
- Zhou, Q.; Huang, W.; Tian, X.; Yang, Y.; Liang, D. , Identification of the variety of maize seeds based on hyperspectral imagescoupled with convolutional neural networks and subregional voting. J Sci Food Agr 2021, 101, 4532–4542. [Google Scholar] [CrossRef]
- Zhao, Y.; Zhu, S.; Zhang, C.; Feng, X.; Feng, L.; He, Y. , Application of hyperspectral imaging and chemometrics for variety classification of maize seeds. Rsc Adv 2018, 8, 1337–1345. [Google Scholar] [CrossRef]
- Miao, A.; Zhuang, J.; Tang, Y.; He, Y.; Chu, X.; Luo, S. , Hyperspectral Image-Based Variety Classification of Waxy Maize Seeds by the t-SNE Model and Procrustes Analysis. Sensors-Basel 2018, 18, 4391. [Google Scholar] [CrossRef]
- Bai, X.; Zhang, C.; Xiao, Q.; He, Y.; Bao, Y. , Application of near-infrared hyperspectral imaging to identify a variety of silage maize seeds and common maize seeds. Rsc Adv 2020, 1, 1177–11715. [Google Scholar] [CrossRef] [PubMed]
- He, C.; Zhu, Q.; Huang, M.; Mendoza, F. , Model Updating of Hyperspectral Imaging Data for Variety Discrimination of Maize Seeds Harvested in Different Years by Clustering Algorithm. T Asabe 2016, 59, 1529–1537. [Google Scholar]
- Zhang, J.; Dai, L.; Cheng, F. , Corn seed variety classification based on hyperspectral reflectance imaging and deep convolutional neural network. J Food Meas Charact 2021, 15, 484–494. [Google Scholar] [CrossRef]
- Zhou, Q.; Huang, W.; Fan, S.; Zhao, F.; Liang, D.; Tian, X. , Non-destructive discrimination of the variety of sweet maize seeds based on hyperspectral image coupled with wavelength selection algorithm. Infrared Phys Techn 2020, 109, 103418. [Google Scholar] [CrossRef]
- Fu, L.; Sun, J.; Wang, S.; Xu, M.; Yao, K.; Cao, Y.; Tang, N. , Identification of maize seed varieties based on stacked sparse autoencoder and near-infrared hyperspectral imaging technology. J Food Process Eng 2022, 45. [Google Scholar] [CrossRef]
- Zhang, L.; Wang, D.; Liu, J.; An, D. , Vis-NIR hyperspectral imaging combined with incremental learning for open world maize seed varieties identification. Comput Electron Agr 2022, 199, 107153. [Google Scholar] [CrossRef]
- Wang, Y.; Song, S. , Variety identification of sweet maize seeds based on hyperspectral imaging combined with deep learning. Infrared Phys Techn 2023, 130, 104611. [Google Scholar] [CrossRef]
- Feng, X.; Yin, H.; Zhang, C.; Peng, C.; He, Y. , Screening of transgenic maize using near infrared spectroscopy and chemometric techniques. Span J Agric Res 2018, 16, e0203. [Google Scholar] [CrossRef]
- Peng, C.; Feng, X.; He, Y.; Zhang, C.; Zhao, Y.; Xu, J. , Discrimination of Transgenic Maize Containing the Cry1Ab/Cry2Aj and G10evo Genes Usin gNear Infrared Spectroscopy (NIR). Spectroscopy and Spectral Analysis 2018, 38, 1095–1100. (In Chinese) [Google Scholar]
- Zhang, Y.; Wang, J. , Application of Near Infrared Spectroscopy in Detection and Identification of Transgenic Maize. Journal of Agricultural Mechanization Research.
- Feng, X.; Zhao, Y.; Zhang, C.; Cheng, P.; He, Y. , Discrimination of Transgenic Maize Kernel Using NIR Hyperspectral Imaging and Multivariate Data Analysis. Sensors-Basel 2017, 17, 1894. [Google Scholar] [CrossRef]
- Wei, Y.; Yang, C.; He, L.; Wu, F.; Yu, Q.; Hu, W. , Classification for GM and Non-GM Maize Kernels Based on NIR Spectra and Deep Learning. Processes 2023, 11, 486. [Google Scholar] [CrossRef]
- Liu, W.; Li, W.; Li, H.; Qin, H.; Ning, X. , Research on the Method of Identifying Maize Haploid Based on KPCA and Near Infrared Spectrum. Spectroscopy and Spectral Analysis 2017, 37, 2024–2027. (In Chinese) [Google Scholar]
- Yu, L.; Liu, W.; Li, W.; Qin, H.; Xu, J.; Zuo, M. , Non-destructive identification of maize haploid seeds using nonlinear analysis method based on their near-infrared spectra. Biosyst Eng 2018, 172, 144–153. [Google Scholar] [CrossRef]
- Cui, Y.; Ge, W.; Li, J.; Zhang, J.; An, D.; Wei, Y. , Screening of maize haploid kernels based on near infrared spectroscopy quantitative analysis. Comput Electron Agr 2019, 158, 358–368. [Google Scholar] [CrossRef]
- Ge, W.; Zhang, L.; Li, X.; Zhang, C.; Sun, M.; An, D.; Wu, J. , Applying multimodal data fusion based on manifold learning with nuclear magnetic resonance (NMR) and near infrared spectroscopy (NIRS) to maize haploid identification. Biosyst Eng 2021, 210, 299–309. [Google Scholar] [CrossRef]
- Rodrigues Ribeiro, M.; Lúcia Ferreira Simeone, M.; Dos Santos Trindade, R.; Antônio Dos Santos Dias, L.; José Moreira Guimarães, L.; Salete Tibola, C.; Cristina De Azevedo, T. , Near infrared spectroscopy (NIR) and chemometrics methods to identification of haploids in maize. Microchem J 2023, 190, 108604. [Google Scholar] [CrossRef]
- Wang, Y.; Lv, Y.; Liu, H.; Wei, Y.; Zhang, J.; An, D.; Wu, J. , Identification of maize haploid kernels based on hyperspectral imaging technology. Comput Electron Agr 2018, 153, 188–195. [Google Scholar] [CrossRef]
- He, X.; Liu, L.; Liu, C.; Li, W.; Sun, J.; Li, H.; He, Y.; Yang, L.; Zhang, D.; Cui, T.; Chen, C.; Li, J. , Discriminant analysis of maize haploid seeds using near-infrared hyperspectral imaging integrated with multivariate methods. Biosyst Eng 2022, 222, 142–155. [Google Scholar] [CrossRef]
- Zhang, L.; Nie, Q.; Ji, H.; Wang, Y.; Wei, Y.; An, D. , Hyperspectral imaging combined with generative adversarial network (GAN)-based data augmentation to identify haploid maize kernels. J Food Compos Anal 2022, 106, 104346. [Google Scholar] [CrossRef]
- Esteve Agelet, L.; Ellis, D.D.; Duvick, S.; Goggi, A.S.; Hurburgh, C.R.; Gardner, C.A. , Feasibility of near infrared spectroscopy for analyzing corn kernel damage and viability of soybean and corn kernels. J Cereal Sci 2012, 55, 160–165. [Google Scholar] [CrossRef]
- Yang, D.; Yin, S.; Jiang, L.; Gao, S. , Research On Maize Vigor Intelligent Detection Based On Near Infrared Spectroscopy. Journal of Nuclear Agricultural Sciences 2013, 27, 957–961. (In Chinese) [Google Scholar]
- Li, W.; Li, Y.; Li, G.; Gao, L.; Chen, M.; Lu, J.; Hu, J.; Liu, J. , Seed Vigor Detection of Sweet Corn by Near Infrared Spectroscopy Under High Temperature Stress. Journal of Nuclear Agricultural Sciences 2018, 32, 1611–1618. (In Chinese) [Google Scholar]
- Wang, Y.; Peng, Y.; Zhuang, Q.; Zhao, X. , Feasibility analysis of NIR for detecting sweet corn seeds vigor. J Cereal Sci 2020, 93, 102977. [Google Scholar] [CrossRef]
- Zhao, B.; Wang, A.; Zhao, H. , Determination of sweet corn seed vigor by near infraredspectra and chemometrics. Jounal of Southern Agriculture 2022, 53, 1875–1882. (In Chinese) [Google Scholar]
- Ambrose, A.; Kandpal, L.M.; Kim, M.S.; Lee, W.; Cho, B. , High speed measurement of corn seed viability using hyperspectral imaging. Infrared Phys Techn 2016, 75, 173–179. [Google Scholar] [CrossRef]
- Feng, L.; Zhu, S.; Zhang, C.; Bao, Y.; Feng, X.; He, Y. , Identification of Maize Kernel Vigor under Different Accelerated Aging Times Using Hyperspectral Imaging. Molecules 2018, 23, 3078. [Google Scholar] [CrossRef]
- Wakholi, C.; Kandpal, L.M.; Lee, H.; Bae, H.; Park, E.; Kim, M.S.; Mo, C.; Lee, W.; Cho, B. , Rapid assessment of corn seed viability using short wave infrared line-scan hyperspectral imaging and chemometrics. Sensors and Actuators B: Chemical 2018, 255, 498–507. [Google Scholar] [CrossRef]
- Pang, L.; Men, S.; Yan, L.; Xiao, J. , Rapid Vitality Estimation and Prediction of Corn Seeds Based on Spectra and Images Using Deep Learning and Hyperspectral Imaging Techniques. Ieee Access 2020, 8, 123026–123036. [Google Scholar] [CrossRef]
- Zhao, X.; Pang, L.; Wang, L.; Men, S.; Yan, L. , Deep Convolutional Neural Network for Detection and Prediction of Waxy Corn Seed Viability Using Hyperspectral Reflectance Imaging. Math Comput Appl 2022, 27, 109. [Google Scholar] [CrossRef]
- Cui, H.; Bing, Y.; Zhang, X.; Wang, Z.; Li, L.; Miao, A. , Prediction of Maize Seed Vigor Based on First-Order Difference Characteristics of Hyperspectral Data. Agronomy 2022, 12, 1899. [Google Scholar] [CrossRef]
- Xu, P.; Zhang, Y.; Tan, Q.; Xu, K.; Sun, W.; Xing, J.; Yang, R. , Vigor identification of maize seeds by using hyperspectral imaging combined with multivariate data analysis. Infrared Phys Techn 2022, 126, 104361. [Google Scholar] [CrossRef]
- Fassio, A.; Fernández, E.G.; Restaino, E.A.; La Manna, A.; Cozzolino, D. , Predicting the nutritive value of high moisture grain corn by near infrared reflectance spectroscopy. Comput Electron Agr 2009, 67, 59–63. [Google Scholar] [CrossRef]
- Wang, X.; Ma, T.; Yang, T.; Song, P.; Chen, Z.; Xie, H. , Monitoring model for predicting maize grain moisture at the filling stage using NIRS and a small sample size. Int J Agr Biol Eng 2019, 12, 132–140. [Google Scholar] [CrossRef]
- Yang, L.; Zhang, L.; Ye, Z. , Content in Maize Seeds Based on Ensemble Learning and Near Infrared Spectroscopy. Acta Agriculturae Boreali-occidentalis Sinica 2022, 31, 1025–1034. (In Chinese) [Google Scholar]
- Huang, M.; Zhao, W.; Wang, Q.; Zhang, M.; Zhu, Q. , Prediction of moisture content uniformity using hyperspectral imaging technology during the drying of maize kernel. Int Agrophys 2015, 29, 39–46. [Google Scholar] [CrossRef]
- Wang, Z.; Zhang, Y.; Fan, S.; Jiang, Y.; Li, J. , Determination of Moisture Content of Single Maize Seed by Using Long-Wave Near-Infrared Hyperspectral Imaging (LWNIR) Coupled With UVE-SPA Combination Variable Selection Method. Ieee Access 2020, 8, 195229–195239. [Google Scholar] [CrossRef]
- Zhang, Y.; Guo, W. , Moisture content detection of maize seed based on visible/near-infrared and near-infrared hyperspectral imaging technology. International Journal of Food Science & Technology 2020, 55, 631–640. [Google Scholar]
- Wang, Z.; Fan, S.; Wu, J.; Zhang, C.; Xu, F.; Yang, X.; Li, J. , Application of long-wave near infrared hyperspectral imaging for determination of moisture content of single maize seed. Spectrochimica Acta Part A: Molecular and Biomolecular Spectroscopy 2021, 254, 119666. [Google Scholar] [CrossRef]
- Wu, J.; Zhang, L.; Li, J.; Liu, C.; Sun, X.; Yu, L. , Detection Model of Moisture Content of Single Maize Seed Based on Hyperspectral Image and Ensemble Learning. Transactions of the Chinese Society for Agricultural Machinery 2022, 53, 302–308. (In Chinese) [Google Scholar]
- Zhang, L.; Zhang, Q.; Wu, J.; Liu, Y.; Yu, L.; Chen, Y. , Moisture detection of single corn seed based on hyperspectral imaging and deep learning. Infrared Phys Techn 2022, 125, 104279. [Google Scholar] [CrossRef]
- Wang, Z.; Li, J.; Zhang, C.; Fan, S. , Development of a General Prediction Model of Moisture Content in Maize Seeds Based on LW-NIR Hyperspectral Imaging. Agriculture 2023, 13, 359. [Google Scholar] [CrossRef]
- Fassio, A.S.; Restaino, E.A.; Cozzolino, D. , Determination of oil content in whole corn (Zea mays L.) seeds by means of near infrared reflectance spectroscopy. Comput Electron Agr 2015, 110, 171–175. [Google Scholar] [CrossRef]
- Lyu, N.; Chen, J.; Pan, T.; Yao, L.; Han, Y.; Yu, J. , Near-infrared spectroscopy combined with equidistant combination partial least squares applied to multi-index analysis of corn. Infrared Phys Techn 2016, 76, 648–654. [Google Scholar] [CrossRef]
- Alamu, E.O.; Menkir, A.; Adesokan, M.; Fawole, S.; Maziya-Dixon, B. , Near-Infrared Reflectance Spectrophotometry (NIRS) Application in the Amino Acid Profiling of Quality Protein Maize (QPM). Foods 2022, 11, 2779. [Google Scholar] [CrossRef]
- Cataltas, O.; Tutuncu, K. , Detection of protein, starch, oil, and moisture content of corn kernels usingone-dimensional convolutional autoencoder and near-infrared spectroscopy. Peerj Comput Sci 2023, 9, e1266. [Google Scholar] [CrossRef]
- Wu, X.; Zeng, S.; Fu, H.; Wu, B.; Zhou, H.; Dai, C. , Determination of corn protein content using near-infrared spectroscopy combined with A-CARS-PLS. Food Chemistry: X 2023, 18, 100666. [Google Scholar] [CrossRef]
- Xu, L.; Liu, J.; Wang, C.; Li, Z.; Zhang, D. , Rapid determination of the main components of corn based on near-infrared spectroscopy and a BiPLS-PCA-ELM model. Appl Optics 2023, 62, 2756–2765. [Google Scholar] [CrossRef]
- Liu, C.; Huang, W.; Yang, G.; Wang, Q.; Li, J.; Chen, L. , Determination of starch content in single kernel using near-infrared hyperspectral images from two sides of corn seeds. Infrared Phys Techn 2020, 110, 103462. [Google Scholar] [CrossRef]
- Zhang, L.; Wang, Y.; Wei, Y.; An, D. , Near-infrared hyperspectral imaging technology combined with deep convolutional generative adversarial network to predict oil content of single maize kernel. Food Chem 2022, 370, 131047. [Google Scholar] [CrossRef]
- Zhang, L.; An, D.; Wei, Y.; Liu, J.; Wu, J. , Prediction of oil content in single maize kernel based on hyperspectral imaging and attention convolution neural network. Food Chem 2022, 395, 133563. [Google Scholar] [CrossRef]
- Fernández-Ibañez, V.; Soldado, A.; Martínez-Fernández, A.; de la Roza-Delgado, B. , Application of near infrared spectroscopy for rapid detection of aflatoxin B1 in maize and barley as analytical quality assessment. Food Chem 2009, 113, 629–634. [Google Scholar] [CrossRef]
- Tallada, J.G.; Wicklow, D.T.; Pearson, T.C.; Armstrong, P.R. , Detection of fungus-infected corn kernels using near-infrared reflectance spectroscopy and color imaging. T Asabe 2011, 54, 1151–1158. [Google Scholar] [CrossRef]
- Tao, F.; Yao, H.; Hruska, Z.; Liu, Y.; Rajasekaran, K.; Bhatnagar, D. , Detection of aflatoxin B1 on corn kernel surfaces using visible-near infrared spectroscopy. J Near Infrared Spec 2020, 28, 59–69. [Google Scholar] [CrossRef]
- Liu, T.; He, J.; Yao, W.; Jiang, H.; Chen, Q. , Determination of aflatoxin B1 value in corn based on Fourier transform near-infrared spectroscopy: Comparison of optimization effect of characteristic wavelengths. LWT 2022, 164, 113657. [Google Scholar] [CrossRef]
- Deng, J.; Jiang, H.; Chen, Q. , Characteristic wavelengths optimization improved the predictive performance of near-infrared spectroscopy models for determination of aflatoxin B1 in maize. J Cereal Sci 2022, 105, 103474. [Google Scholar] [CrossRef]
- Shen, G.; Kang, X.; Su, J.; Qiu, J.; Liu, X.; Xu, J.; Shi, J.; Mohamed, S.R. , Rapid detection of fumonisin B1 and B2 in ground corn samples using smartphone-controlled portable near-infrared spectrometry and chemometrics. Food Chem 2022, 384, 132487. [Google Scholar] [CrossRef]
- Wang, B.; Deng, J.; Jiang, H. , Markov Transition Field Combined with Convolutional Neural Network Improved the Predictive Performance of Near-Infrared Spectroscopy Models for Determination of Aflatoxin B1 in Maize. Foods 2022, 11, 2210. [Google Scholar] [CrossRef]
- Tao, F.; Yao, H.; Hruska, Z.; Kincaid, R.; Rajasekaran, K. , Near-infrared hyperspectral imaging for evaluation of aflatoxin contamination in corn kernels. Biosyst Eng 2022, 221, 181–194. [Google Scholar] [CrossRef]
- Zhu, F.; Yao, H.; Hruska, Z.; Kincaid, R.; Brown, R.; Bhatnagar, D.; Cleveland, T. , Integration of Fluorescence and Reflectance Visible Near-Infrared (VNIR) Hyperspectral Images for Detection of Aflatoxins in Corn Kernels. T Asabe 2016, 59, 785–794. [Google Scholar]
- Da Conceição, R.R.P.; Simeone, M.L.F.; Queiroz, V.A.V.; de Medeiros, E.P.; de Araújo, J.B.; Coutinho, W.M.; Da Silva, D.D.; de Araújo Miguel, R.; de Paula Lana, U.G.; de Resende Stoianoff, M.A. , Application of near-infrared hyperspectral (NIR) images combined with multivariate image analysis in the differentiation of two mycotoxicogenic Fusarium species associated with maize. Food Chem 2021, 344, 128615. [Google Scholar] [CrossRef]
- Zhang, J.; Xu, B.; Wang, Z.; Cheng, F. , Application of hyperspectral imaging in the detection of aflatoxin B1 on corn seed. Journal of food measurement & characterization 2022, 16, 448–460. [Google Scholar]
- Zhou, Q.; Huang, W.; Liang, D.; Tian, X. , Classification of Aflatoxin B1 Concentration of Single Maize Kernel Based on Near-Infrared Hyperspectral Imaging and Feature Selection. Sensors-Basel 2021, 21, 4257. [Google Scholar] [CrossRef] [PubMed]
- Zhou, Q.; Liang, D.; Fan, S.; Huang, W.; Pang, Q.; Tian, X. , Application of hyperspectral characteristic wavelength selection based on weighted between-class to within-class variance ratio (WBWVR) in aflatoxin B concentration classification of maize flour. Infrared Phys Techn 2022, 122, 104095. [Google Scholar] [CrossRef]
- Wang, W.; Heitschmidt, G.W.; Windham, W.R.; Feldner, P.; Ni, X.; Chu, X. , Feasibility of Detecting Aflatoxin B1 on Inoculated Maize Kernels Surface using Vis/NIR Hyperspectral Imaging. J Food Sci 2015, 80, M116–M122. [Google Scholar] [CrossRef]
- Wang, W.; Ni, X.; Lawrence, K.C.; Yoon, S.; Heitschmidt, G.W.; Feldner, P. , Feasibility of detecting Aflatoxin B1 in single maize kernels using hyperspectral imaging. J Food Eng 2015, 166, 182–192. [Google Scholar] [CrossRef]
- Wang, W.; Heitschmidt, G.W.; Ni, X.; Windham, W.R.; Hawkins, S.; Chu, X. , Identification of aflatoxin B1 on maize kernel surfaces using hyperspectral imaging. Food Control 2014, 42, 78–86. [Google Scholar] [CrossRef]
- Chu, X.; Wang, W.; Yoon, S.; Ni, X.; Heitschmidt, G.W. , Detection of aflatoxin B1 (AFB1) in individual maize kernels using short wave infrared (SWIR) hyperspectral imaging. Biosyst Eng 2017, 157, 13–23. [Google Scholar] [CrossRef]
- Kimuli, D.; Wang, W.; Lawrence, K.C.; Yoon, S.; Ni, X.; Heitschmidt, G.W. , Utilisation of visible/near-infrared hyperspectral images to classify aflatoxin B1 contaminated maize kernels. Biosyst Eng 2018, 166, 150–160. [Google Scholar] [CrossRef]
- Kimuli, D.; Wang, W.; Wang, W.; Jiang, H.; Zhao, X.; Chu, X. , Application of SWIR hyperspectral imaging and chemometrics for identification of aflatoxin B1 contaminated maize kernels. Infrared Phys Techn 2018, 89, 351–362. [Google Scholar] [CrossRef]
- Chu, X.; Wang, W.; Ni, X.; Li, C.; Li, Y. , Classifying maize kernels naturally infected by fungi using near-infrared hyperspectral imaging. Infrared Phys Techn 2020, 105, 103242. [Google Scholar] [CrossRef]
- Guo, X.; Jia, B.; Zhang, H.; Ni, X.; Zhuang, H.; Lu, Y.; Wang, W. , Evaluation of Aspergillus flavus Growth and Detection of Aflatoxin B1 Content on Maize Agar Culture Medium Using Vis/NIR Hyperspectral Imaging. Agriculture 2023, 13, 237. [Google Scholar] [CrossRef]
- Mansuri, S.M.; Chakraborty, S.K.; Mahanti, N.K.; Pandiselvam, R. , Effect of germ orientation during Vis-NIR hyperspectral imaging for the detection of fungal contamination in maize kernel using PLS-DA, ANN and 1D-CNN modelling. Food Control 2022, 139, 109077. [Google Scholar] [CrossRef]
- Lu, Y.; Jia, B.; Yoon, S.; Zhuang, H.; Ni, X.; Guo, B.; Gold, S.E.; Fountain, J.C.; Glenn, A.E.; Lawrence, K.C.; Zhang, H.; Guo, X.; Zhang, F.; Wang, W. , Spatio-temporal patterns of Aspergillus flavus infection and aflatoxin B1 biosynthesis on maize kernels probed by SWIR hyperspectral imaging and synchrotron FTIR microspectroscopy. Food Chem 2022, 382, 132340. [Google Scholar] [CrossRef] [PubMed]
- Gao, J.; Ni, J.; Wang, D.; Deng, L.; Li, J.; Han, Z. , Pixel-level aflatoxin detecting in maize based on feature selection and hyperspectral imaging. Spectrochimica Acta Part A: Molecular and Biomolecular Spectroscopy 2020, 234, 118269. [Google Scholar] [CrossRef]
- Wang, Z.; An, T.; Wang, W.; Fan, S.; Chen, L.; Tian, X. , Qualitative and quantitative detection of aflatoxins B1 in maize kernels with fluorescence hyperspectral imaging based on the combination method of boosting and stacking. Spectrochimica Acta Part A: Molecular and Biomolecular Spectroscopy 2023, 296, 122679. [Google Scholar] [CrossRef]
- Zhou, Q.; Huang, W.; Tian, X. , Feature Wavelength Selection Based on the Combination of Image and Spectrum for Aflatoxin B1 Concentration Classification in Single Maize Kernels. Agriculture 2022, 12, 385. [Google Scholar] [CrossRef]
- Jia, S.; Yang, L.; An, D.; Liu, Z.; Yan, Y.; Li, S.; Zhang, X.; Zhu, D.; Gu, J. , Feasibility of analyzing frost-damaged and non-viable maize kernels based on near infrared spectroscopy and chemometrics. J Cereal Sci 2016, 69, 145–150. [Google Scholar] [CrossRef]
- Zhang, J.; Wang, Z.; Qu, M.; Cheng, F. , Research on physicochemical properties, microscopic characterization and detection of different freezing-damaged corn seeds. Food Chemistry: X 2022, 14, 100338. [Google Scholar] [CrossRef]
- Zhang, J.; Dai, L.; Cheng, F. , Classification of Frozen Corn Seeds Using Hyperspectral VIS/NIR Reflectance Imaging. Molecules 2019, 24, 149. [Google Scholar] [CrossRef]
- Zhang, J.; Dai, L.; Cheng, F. , Identification of Corn Seeds with Different Freezing Damage Degree Based on Hyperspectral Reflectance Imaging and Deep Learning Method. Food Anal Method 2021, 14, 389–400. [Google Scholar] [CrossRef]
- Williams, P.; Geladi, P.; Fox, G.; Manley, M. , Maize kernel hardness classification by near infrared (NIR) hyperspectral imaging and multivariate data analysis. Anal Chim Acta 2009, 653, 121–130. [Google Scholar] [CrossRef] [PubMed]
- Williams, P.J.; Kucheryavskiy, S. , Classification of maize kernels using NIR hyperspectral imaging. Food Chem 2016, 209, 131–138. [Google Scholar] [CrossRef] [PubMed]
- Qiao, M.; Xu, Y.; Xia, G.; Su, Y.; Lu, B.; Gao, X.; Fan, H. , Determination of hardness for maize kernels based on hyperspectral imaging. Food Chem 2022, 366, 130559. [Google Scholar] [CrossRef] [PubMed]
- Wang, L.; Pu, H.; Sun, D.; Liu, D.; Wang, Q.; Xiong, Z. , Application of Hyperspectral Imaging for Prediction of Textural Properties of Maize Seeds with Different Storage Periods. Food Anal Method 2015, 8, 1535–1545. [Google Scholar] [CrossRef]
- Huang, M.; Tang, J.; Yang, B.; Zhu, Q. , Classification of maize seeds of different years based on hyperspectral imaging and model updating. Comput Electron Agr 2016, 122, 139–145. [Google Scholar] [CrossRef]
- Wang, Z.; Huang, W.; Tian, X.; Long, Y.; Li, L.; Fan, S. , Rapid and Non-destructive Classification of New and Aged Maize Seeds Using Hyperspectral Image and Chemometric Methods. Front Plant Sci 2022, 13, 849495. [Google Scholar] [CrossRef]
- Yang, X.; You, Z.; Cheng, F. , Study on Identification of Immature Corn Seed Using Hyperspectral Imaging. Spectroscopy and Spectral Analysis 2016, 36, 4028–4033. (In Chinese) [Google Scholar]
- Wang, Z.; Tian, X.; Fan, S.; Zhang, C.; Li, J. , Maturity determination of single maize seed by using near-infrared hyperspectral imaging coupled with comparative analysis of multiple classification models. Infrared Phys Techn 2021, 112, 103596. [Google Scholar] [CrossRef]
Figure 1.
The schematic diagram of this study.
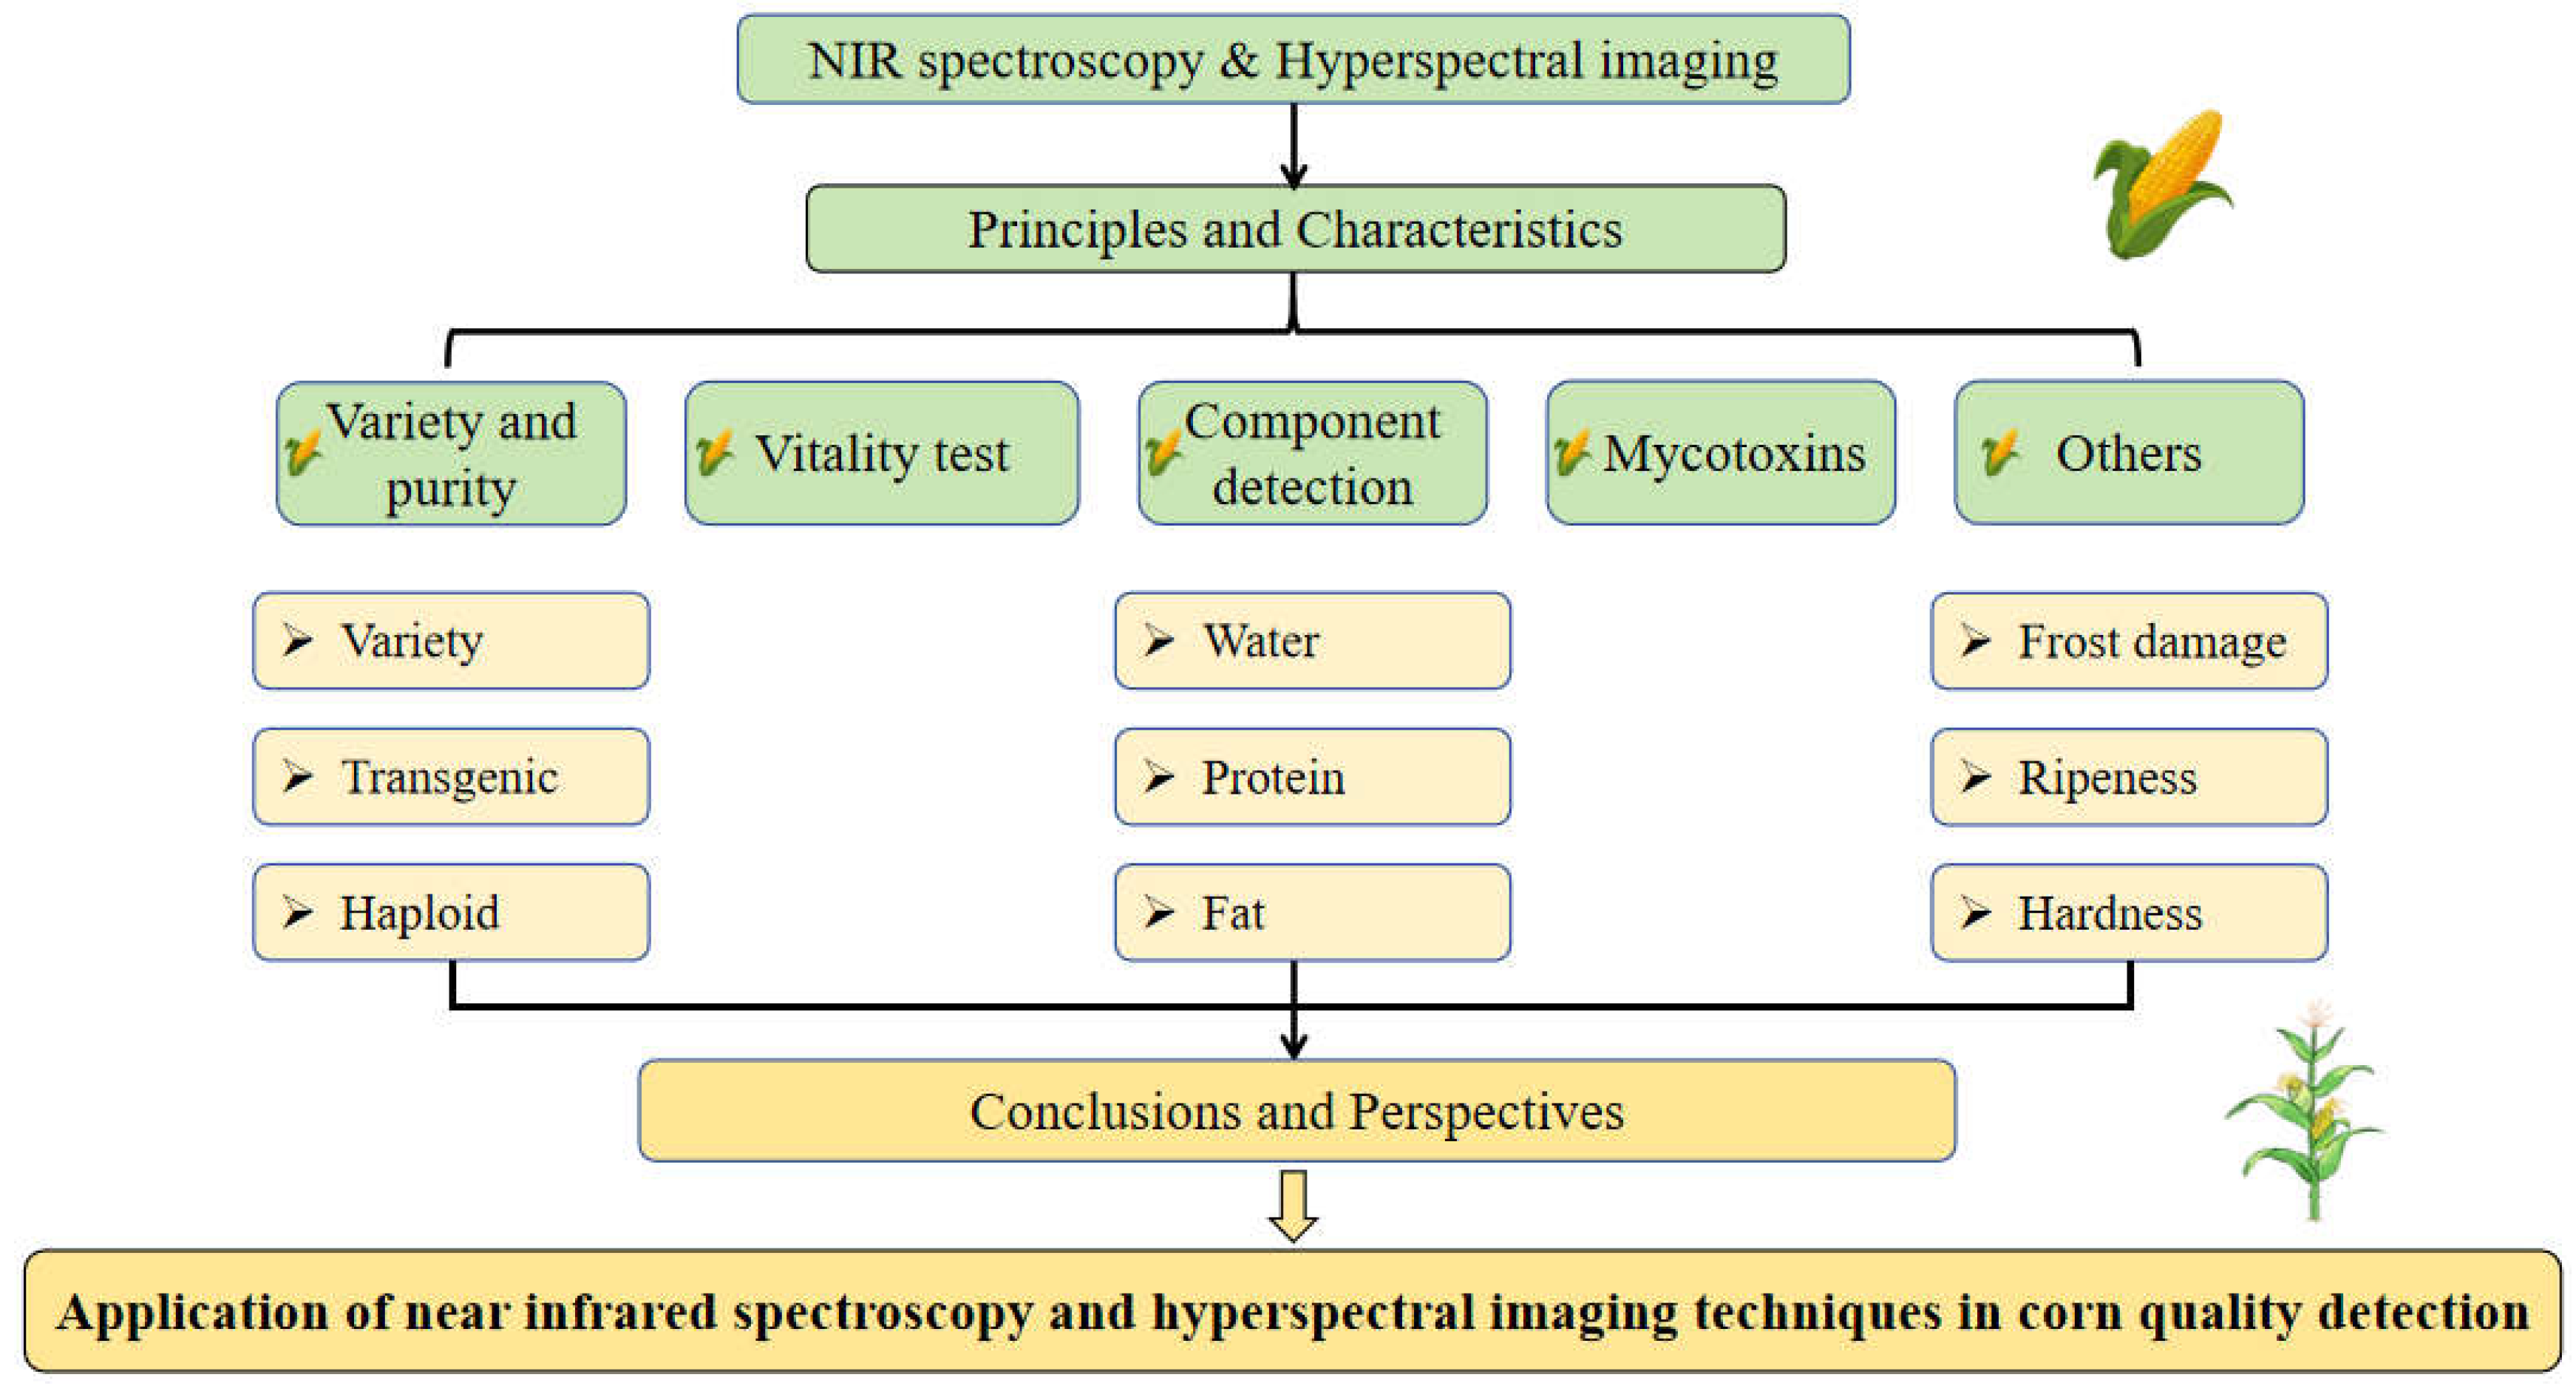
Figure 2.
The general analyzing steps: A (NIRS data); B (HSI data)[6].
Figure 2.
The general analyzing steps: A (NIRS data); B (HSI data)[6].
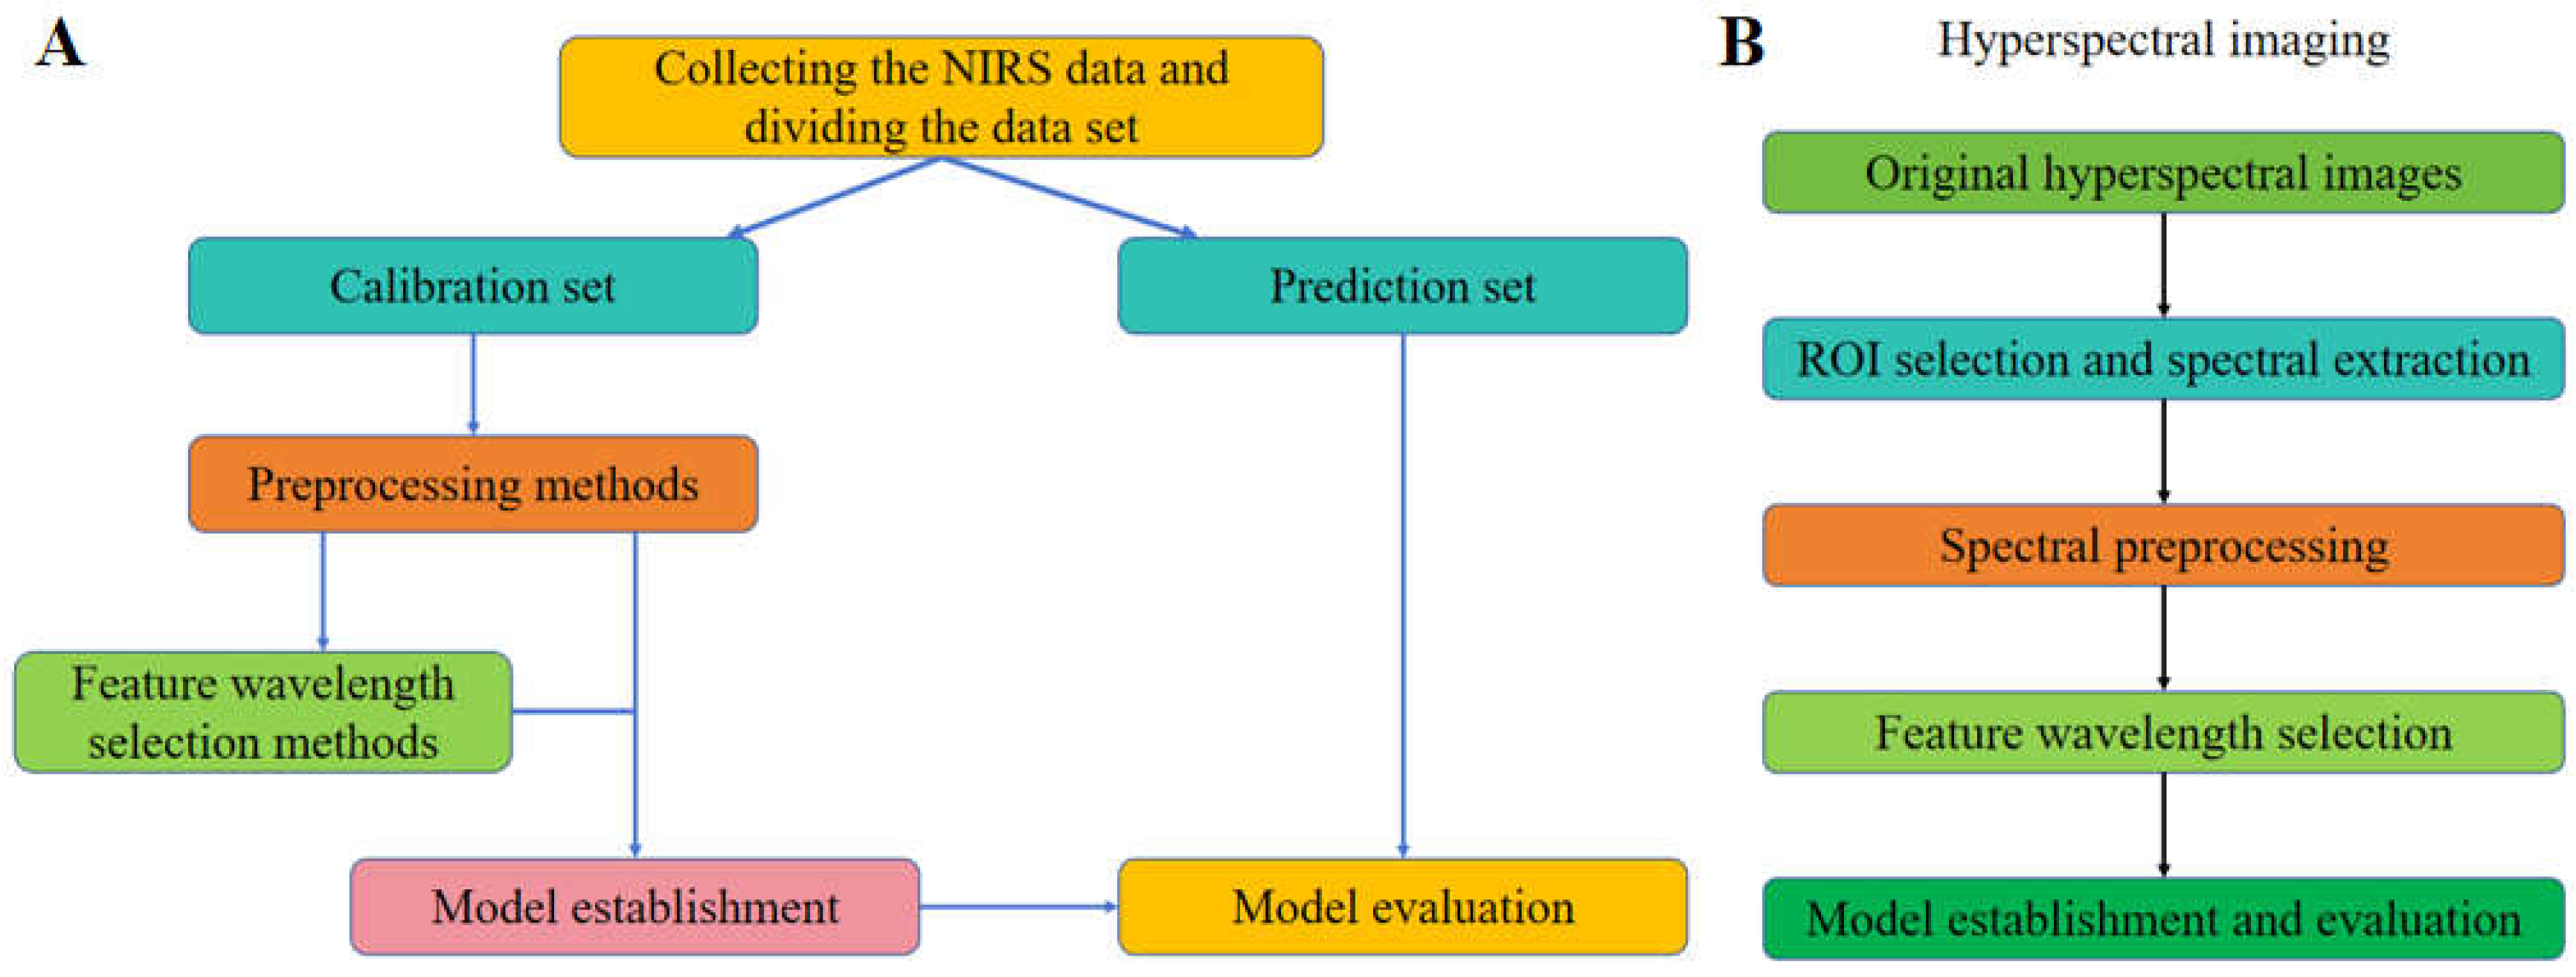
Figure 3.
The data process A.original spectra, B.preprocessed spectra, C.optimal wavelengths selected by SPA,D.Classification images by LS-SVM model based on data fusion [27].
Figure 3.
The data process A.original spectra, B.preprocessed spectra, C.optimal wavelengths selected by SPA,D.Classification images by LS-SVM model based on data fusion [27].
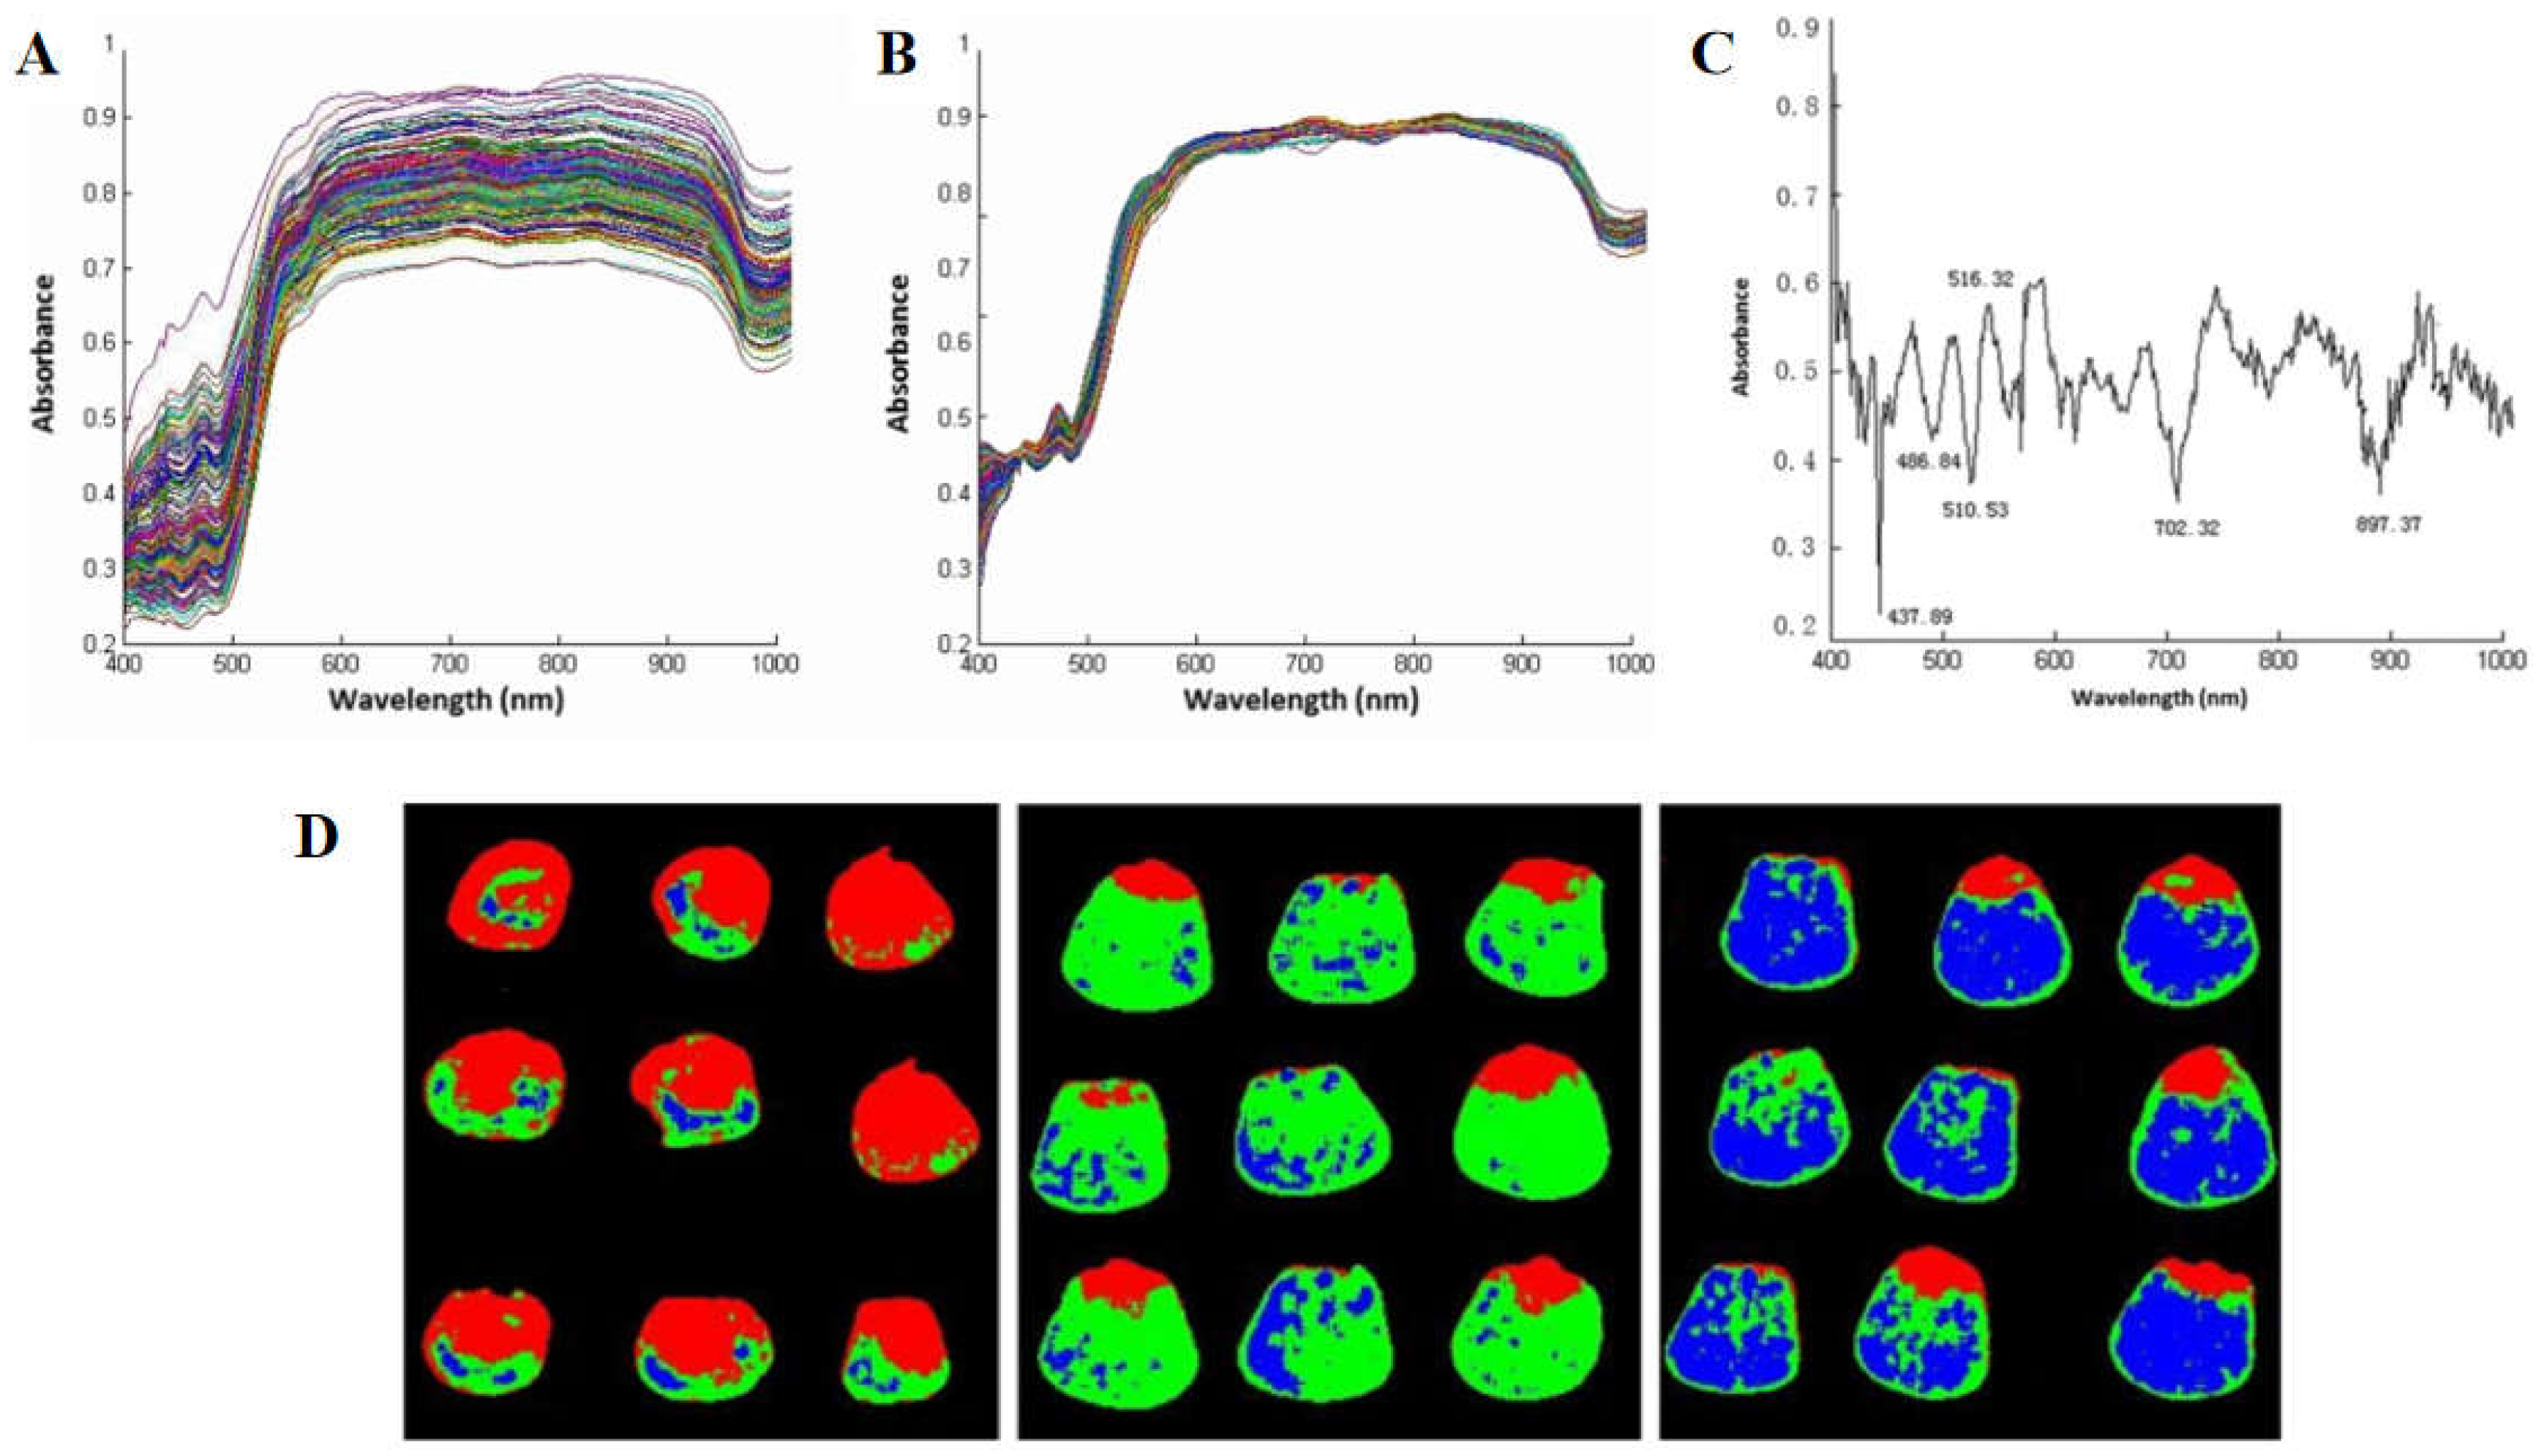
Figure 4.
Schematic flow from data collection to final chemical image[58].
Figure 4.
Schematic flow from data collection to final chemical image[58].
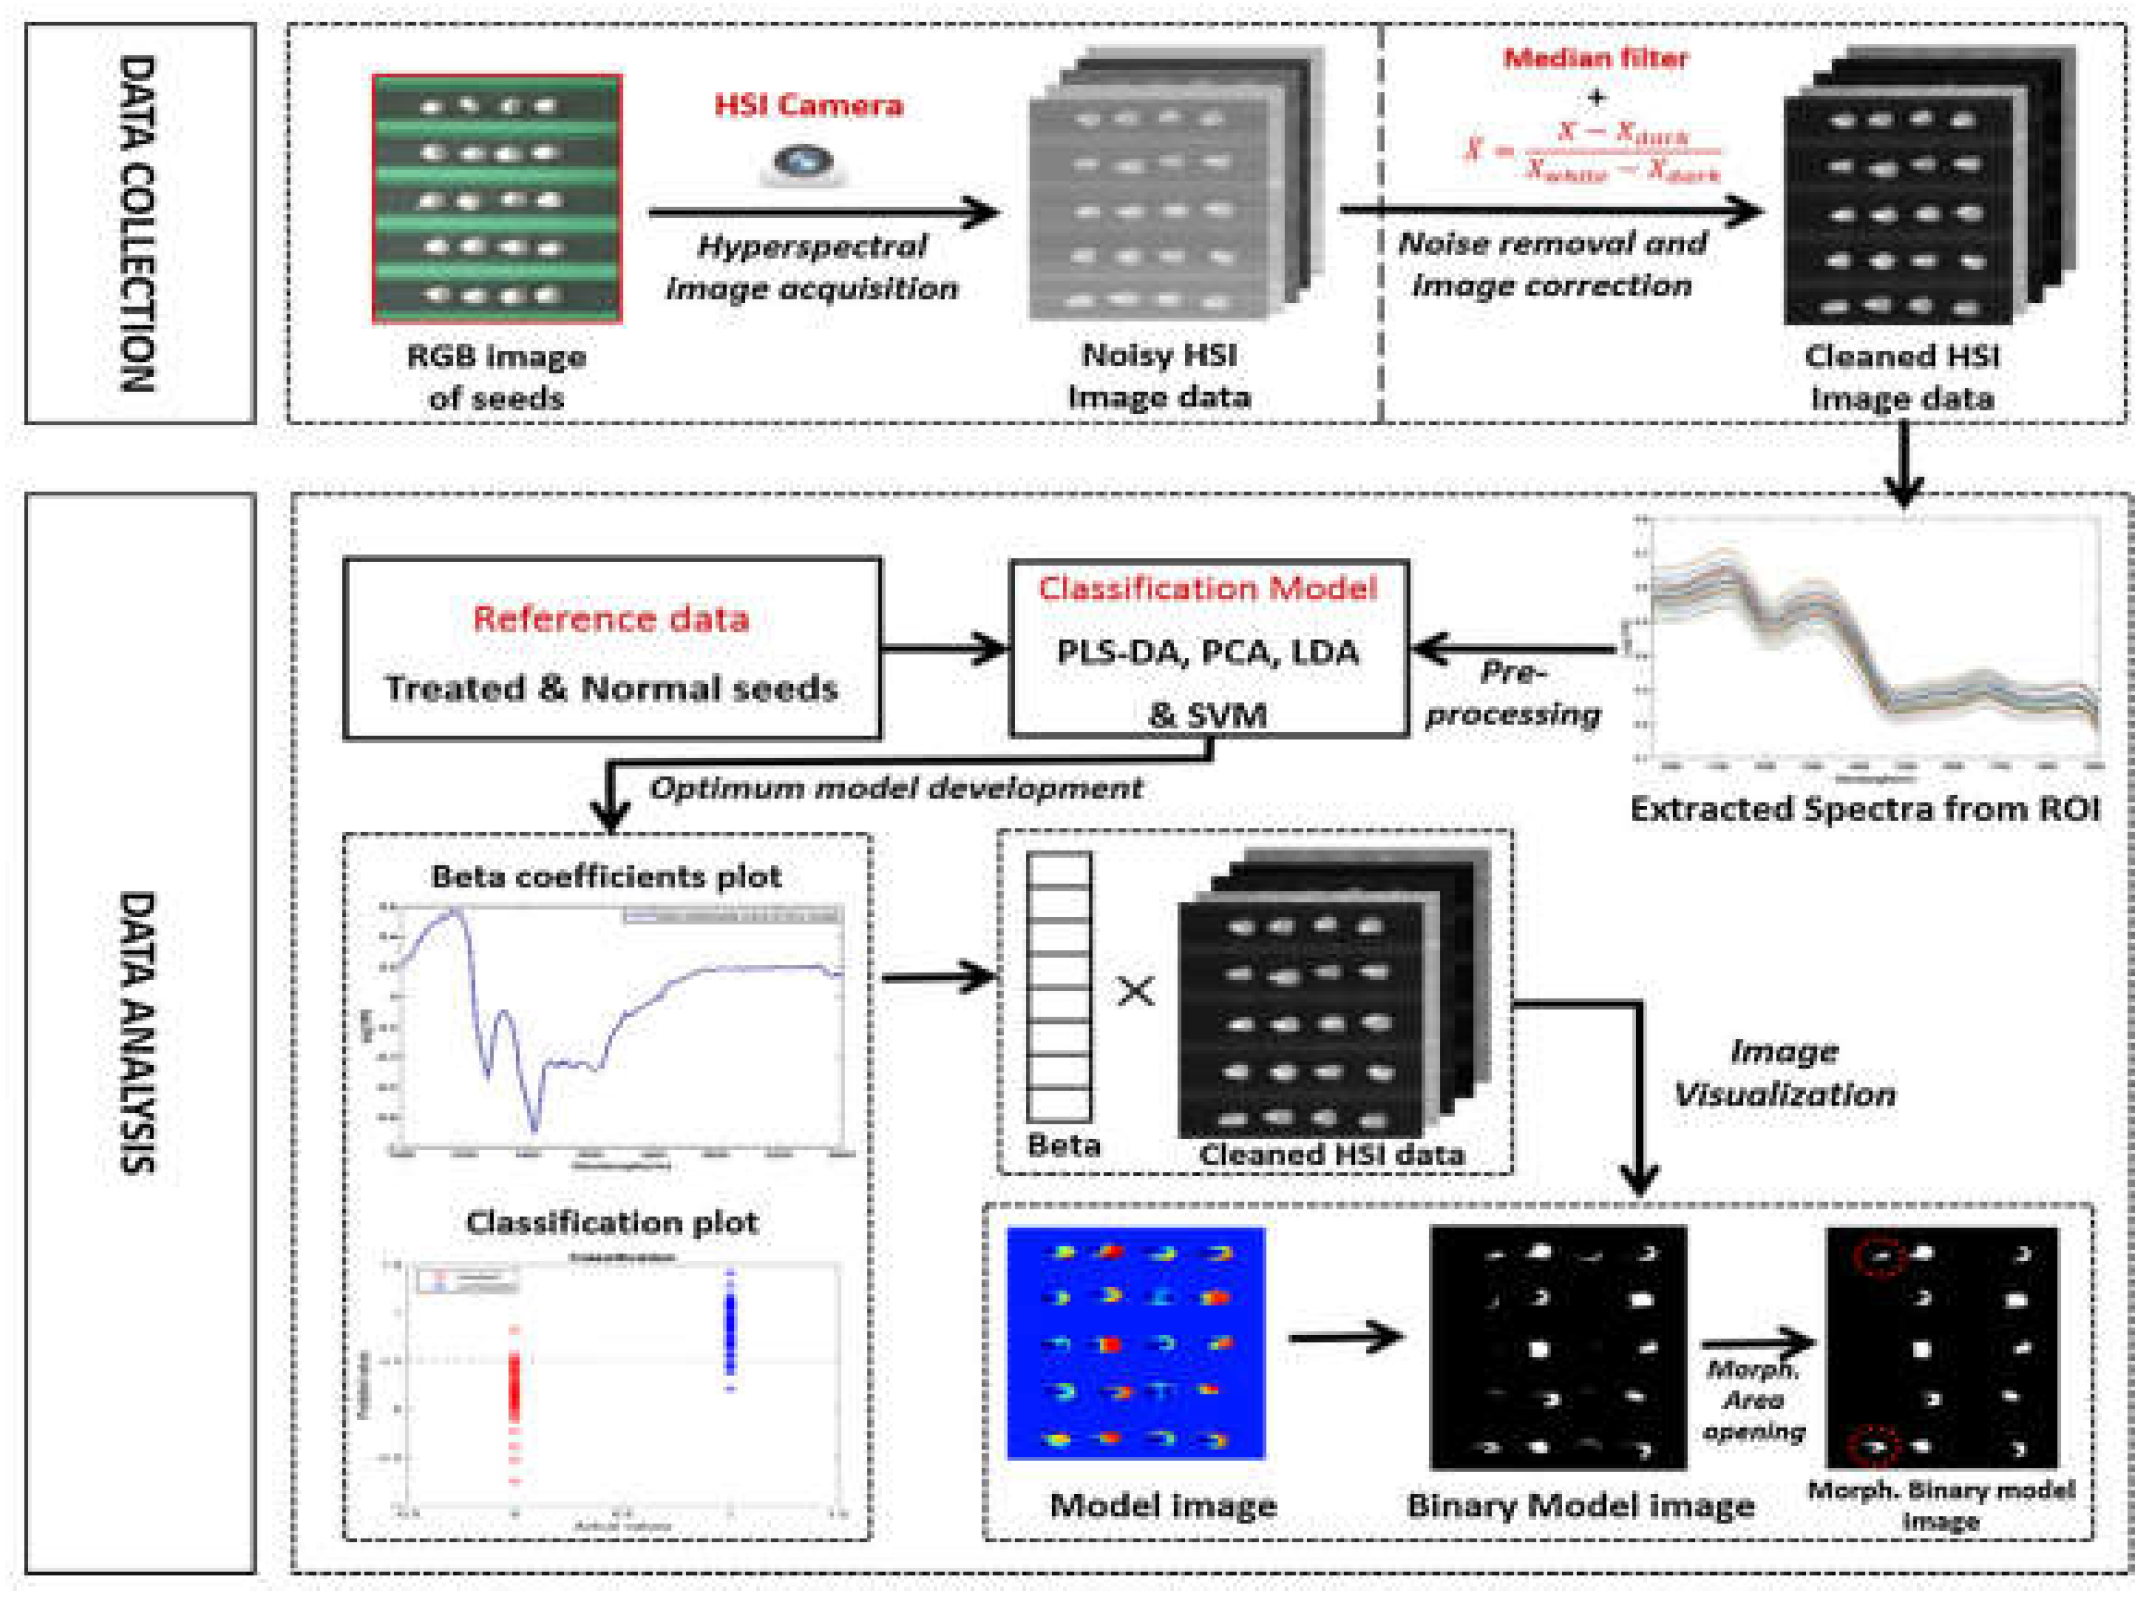
Figure 5.
A:Spectroscopic data of the samples, B:Characteristic spectral intervals selected by BiPLS, and C:Distribution map of measured and predicted values,(a)–(d) predicted results of moisture, oil, protein, and starch, respectively[77].
Figure 5.
A:Spectroscopic data of the samples, B:Characteristic spectral intervals selected by BiPLS, and C:Distribution map of measured and predicted values,(a)–(d) predicted results of moisture, oil, protein, and starch, respectively[77].
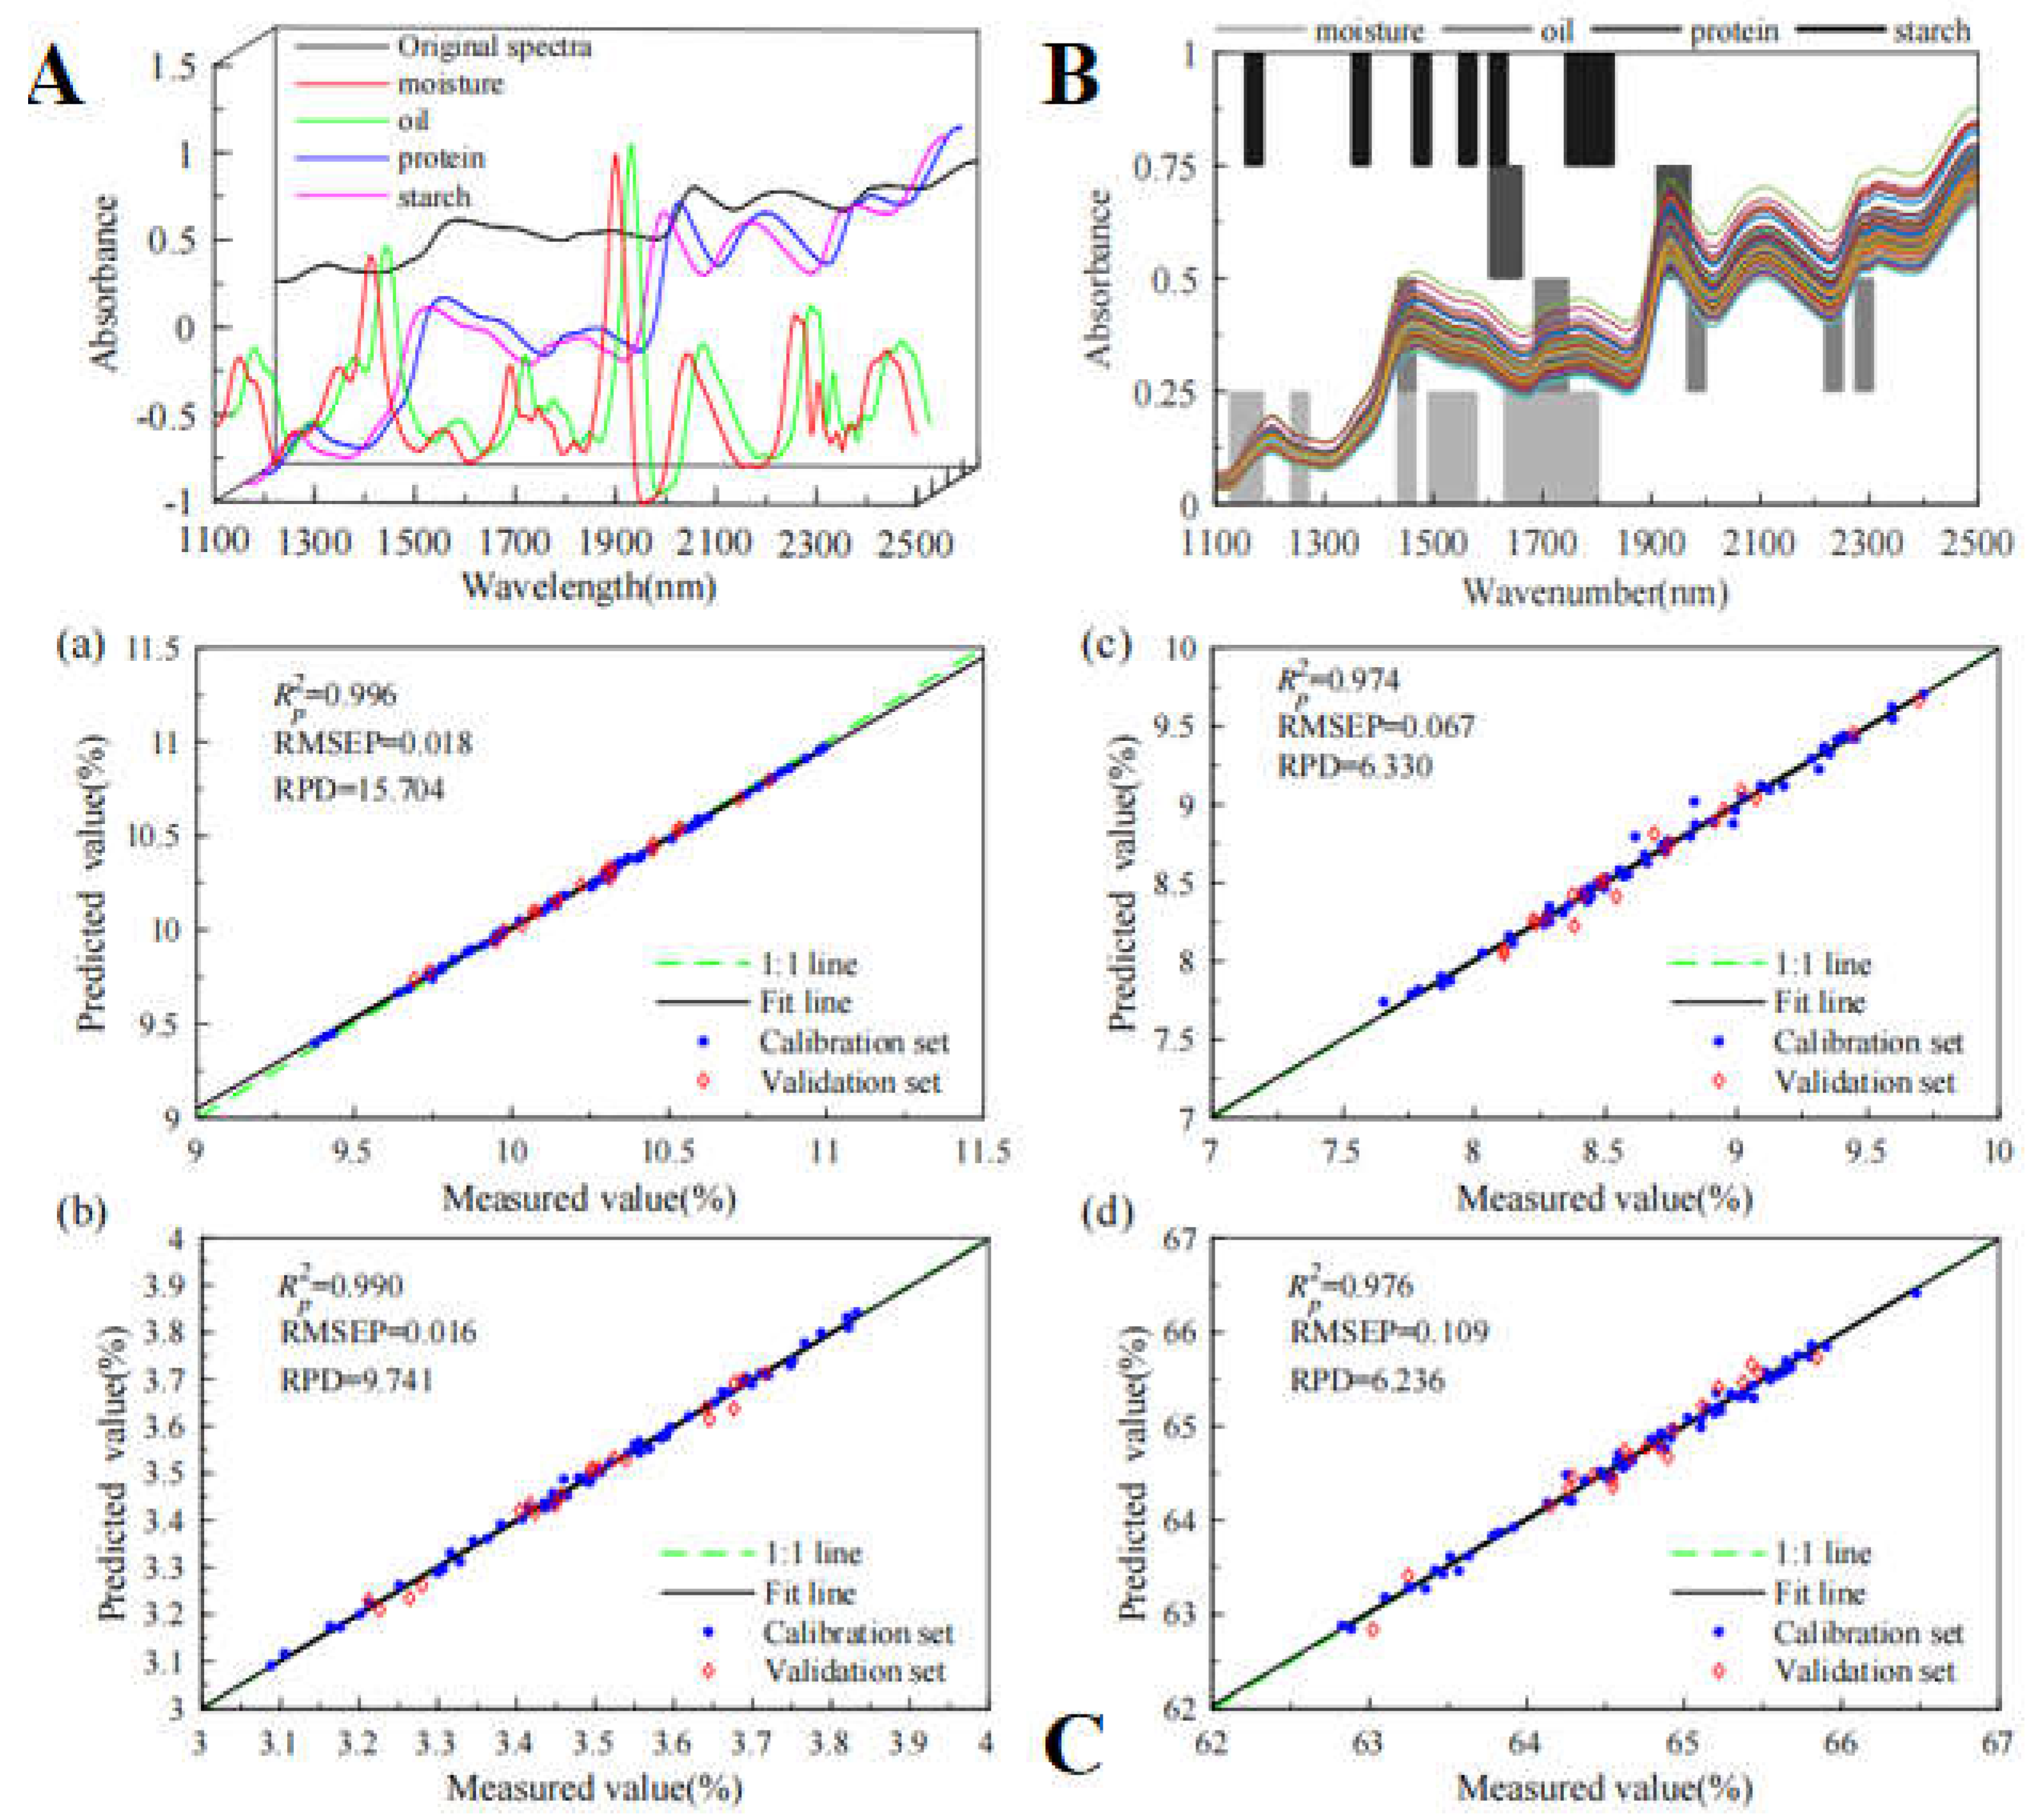
Figure 6.
Linear regression plots and pixel-level visualization maps, the synchronous and asynchronous 2DCOS maps generated from the SR-FTIR spectra, the SR-FTIR images for chemical distributions of nutrient depletion and trace AFB1 accumulation[105].
Figure 6.
Linear regression plots and pixel-level visualization maps, the synchronous and asynchronous 2DCOS maps generated from the SR-FTIR spectra, the SR-FTIR images for chemical distributions of nutrient depletion and trace AFB1 accumulation[105].
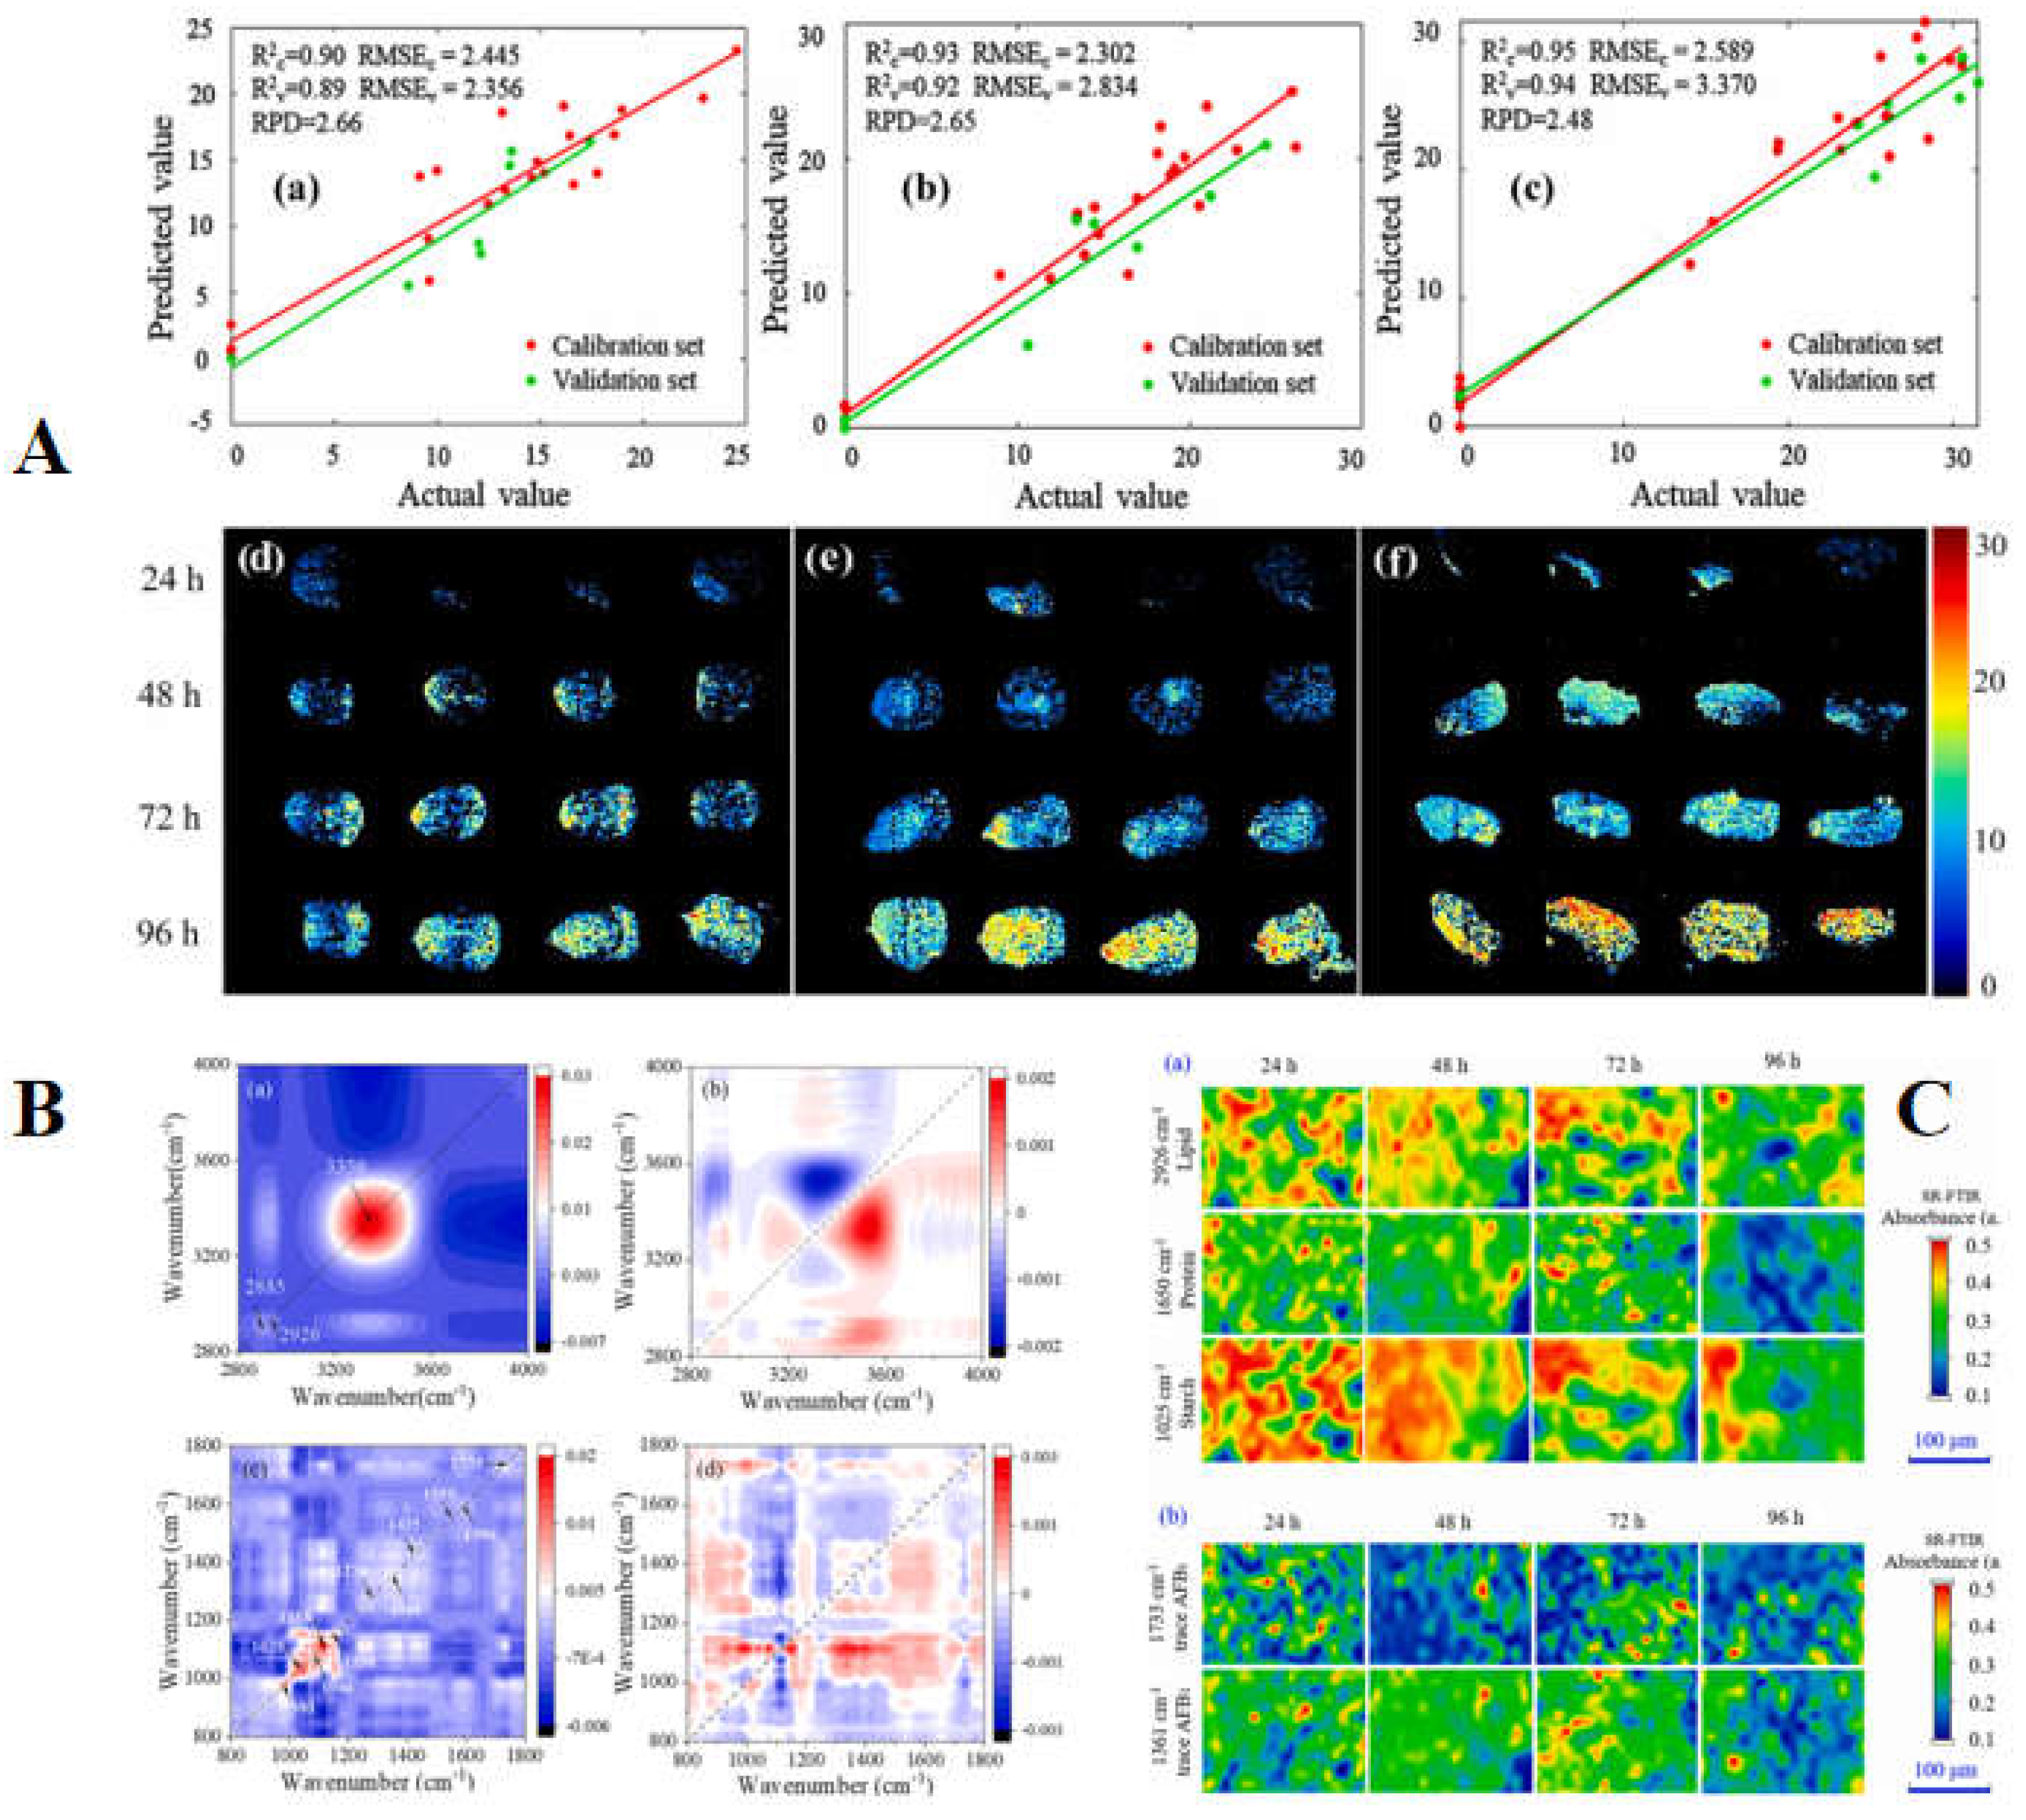
Figure 7.
A: The aerage spectra of corn seeds at different freezing conditions, B:the DCNN structure, and C:visualization map of the seeds with DCNN model[112].
Figure 7.
A: The aerage spectra of corn seeds at different freezing conditions, B:the DCNN structure, and C:visualization map of the seeds with DCNN model[112].
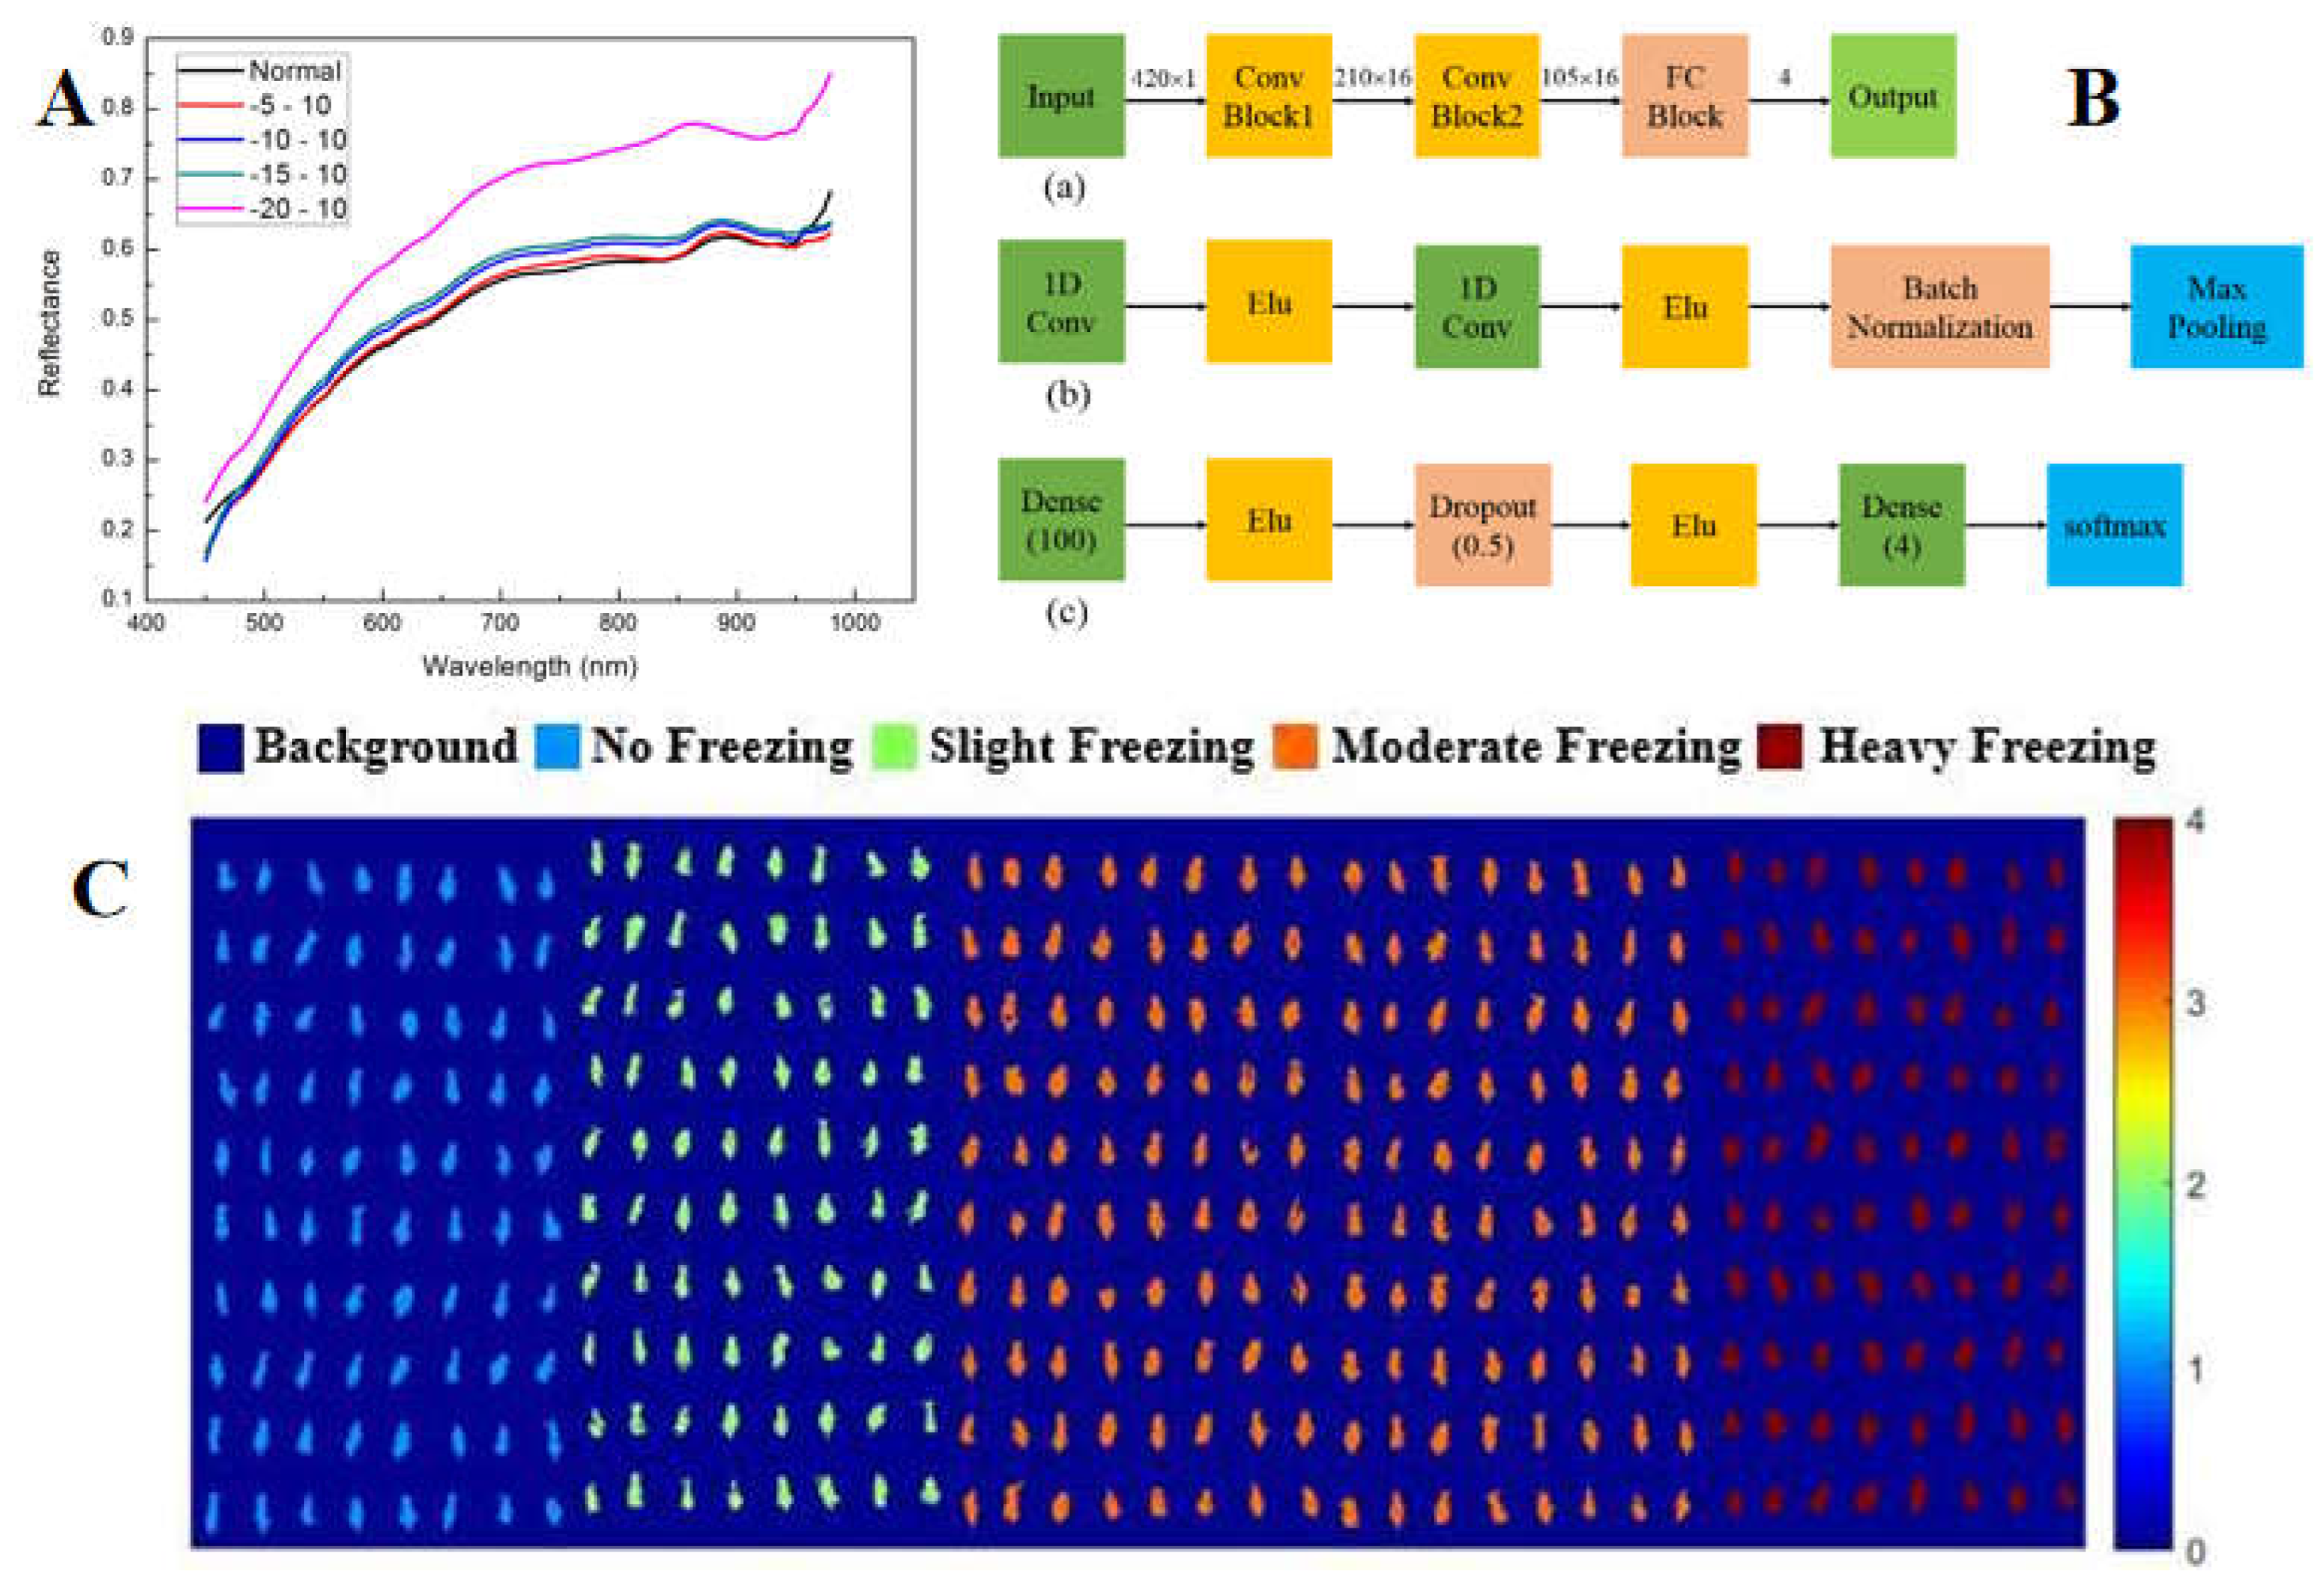

Table 1.
The main detection indicators and application scenarios of corn in production processes.
| Indicators | Application Scenario | Traditional Detection Methods | Advantages | Disadvantages |
|---|---|---|---|---|
| Variety and purity | To avoid losses caused by shoddy and mixed seeds. | Manual , protein electrophoresis, DNA analysis, etc. | High accuracy | Destructive, time-consuming |
| Vigor | To improve seed survival and yield. | Germination rate, electrical conductivity, artificial accelerated aging measurement, etc. | Simple, easy to operate | Time-consuming, destructive, large sample size |
| Component | To provide a basis for rational use and processing. | DNA molecular markers, Kjeldahl nitrogen determination, acid hydrolysis, thermogravimetric analysis, etc. | High accuracy | Time-consuming, destructive |
| Moisture | To provide a basis for storage and processing | Drying, microwave heating, resistance method, etc. | High accuracy | Time-consuming, destructive |
| Mycotoxins | To prevent harm to humans and animals. | HPLC, LC-MS/MS method, etc. | High accuracy | Complicated operation, destructive |
| Freezing damage | To provide a basis for seed selection and use. | Observation, germination, electrical conductivity method, chemical analysis | Simple, easy to operate | Destructive, time-consuming |
| Maturity | To determine the quality and yield potential | Germination determination, nuclear magnetic resonance method | Simple, easy to operate | Time-consuming, destructive |
| Hardness | To provide a basis for processing and packaging. | Hardness meter measurement, grinding method | Easy to operate | Destructive, time-consuming |
Table 2.
The comparison between NIRS and HSI.
| Technology | Data | Components of the Equipment | Price | Portability or not |
|---|---|---|---|---|
| NIRS | Spectra | light source, beam splitter system, sample detector, optical detector and its data analysis system | Lower cost | Yes |
| HSI | Image and spectra | CCD camera, imaging spectrometer, lens, light source controller, sample station, mobile platform and its controller, data acquisition software, and mobile platform mobile control software | Higher cost | No |
Table 3.
Recent studies on corn variety identification, transgenic corn detection, and haploid detection based on NIRS and HSI.
Table 3.
Recent studies on corn variety identification, transgenic corn detection, and haploid detection based on NIRS and HSI.
| Author | Year | Technology | Object | Preprocessing Methods | Models | Results | Reference |
|---|---|---|---|---|---|---|---|
| Wu et al. | 2010 | NIRS | Commercial corn | Vector Normalization | BPR | 94.3% (37 maize varieties average correct recognition rate) | [19] |
| Wang et al. | 2011 | NIRS | Corn seeds | / | LDA | 99.30% (test set average correct recognition and rejection rates), | [20] |
| Huang et al. | 2011 | NIRS | Hybrid corn | / | PLS | 95.75% (validation set average determination coefficient), | [21] |
| Jia et al. | 2012 | NIRS | Single corn seeds | Smoothing + FD + Vector Normalization | PLS-DA | 94.6% (this variety correct recognition rate), 96.5% (other varieties correct rejection rate) | [22] |
| Hang et al. | 2014 | NIRS | Corn seeds | / | ANN, SVM | 90%+(6 principal components overall performance), | [23] |
| Jia et al. | 2015 | NIRS | Coated corn seeds | Moving Average Window Smoothing, FD, Vector Normalization | SVM, BPR, SIMCA | 97.5% (SIMCA model accuracy) | [24] |
| Cui et al. | 2018 | NIRS | Corn seeds | Smoothing, FD and Vector Normalization | LDA, BPR | 90%+(mean correct discrimination rate), | [25] |
| Zhang et al. | 2012 | HSI | Corn seeds | / | LS-SVM | 98.89% (PCA - GLCM - LS - SVM model recognition accuracy) | [26] |
| Wang et al. | 2016 | HSI | Corn seeds | Detrending | LS-SVM | 88.889% (LS - SVM combined features classification accuracy) | [27] |
| Xia et al. | 2019 | HSI | Corn seeds | Normalization | LS-SVM | 99.13% (MLDA - LS - SVM test set classification accuracy) | [28] |
| Zhao et al. | 2018 | HSI | Corn seeds | WT | SVM, RBFNN | 93.85% (calibration accuracy) and 91.00% (prediction accuracy) | [30] |
| Miao et al. | 2018 | HSI | Waxy corn seeds | PA | FDA | 97.5% (t - SNE + FDA model highest classification accuracy), | [31] |
| Bai et al. | 2020 | HSI | Silage maize and common Seeds | WT | SVM, RBFNN | 98%+(silage and common maize seeds classification accuracies), | [32] |
| He et al. | 2016 | HSI | Corn seeds | / | LS-SVM | 98.3% (clustering algorithm updated model highest classification accuracy), | [33] |
| Zhang et al. | 2021 | HSI | Corn seeds | / | DCNN, KNN, SVM | 100% (DCNN model training accuracy), 94.4% (testing accuracy), 93.3% (validation accuracy), | [34] |
| Zhou et al. | 2021 | HSI | Normal and sweet corn seeds | SG Smoothing, FD | CNN | CNN model coupled with subregional voting represents a new approach for the identification | [29] |
| Fu et al. | 2022 | HSI | Corn seeds | SG Smoothing, SNV | SSAE-CS-SVM, CS-SVM | 99.45% (CS-SVM training set accuracy), 95.81% (CS-SVM testing set accuracy), | [36] |
| Zhang et al. | 2022 | HSI | Corn seeds | SG Smoothing-MSC | OCSVM, BPR, RBF-BPR | 100% (CAE - RBF - BPR model CAR and CRR), | [37] |
| Wang et al. | 2023 | HSI | Sweet corn seeds | SG Smoothing, SNV, MSC | SVM, KNN, ELM, BP, CNN, LSTM, CNN-LSTM | 95%+(deep learning models classification accuracy) | [38] |
| Zhou et al. | 2020 | HSI | Sweet corn seeds | SG Smoothing, FD | SVM, KNN, ANN, DT, NB, LDA, LR | 94.07% and 94.86% (germ up and down SG + FD + CARS + SVM model classification accuracies) | [35] |
| Feng et al. | 2018 | NIRS | Transgenic corn | 2nd Derivatives | KN), SIMCA, NBC, ELM, RBFNN | 100% (ELM full spectrum classification rate), 90.83% (ELM sensitive wavelengths classification rate) | [39] |
| Peng et al. | 2018 | NIRS | Transgenic corn | SG Smoothing | PLS, SVM | 90%+(SVM transgenic maize kernel accuracy), 75%+(SVM corn flour accuracy), | [40] |
| Zhang et al. | 2022 | NIRS | Transgenic corn | Vector Normalization | ANN | 100% (ANN transgenic corn recognition), | [39] |
| Feng et al. | 2017 | HSI | Transgenic corn | WT, SNV, MSC | SVM, PLS - DA | almost 100% (HSI calculation and prediction accuracy) | [42] |
| Wei et al. | 2023 | HSI | GM and non - GM corn seeds | STD | SVM, DT, BPNN, VGG | 0.961 (VGG prediction accuracy) | [43] |
| Liu et al. | 2017 | NIRS | Corn Haploid | Smoothing, FD, Vector Normalization | SVM | 95% and 93.57% (haploid and polyploid average correct recognition rates), | [44] |
| Yu et al. | 2018 | NIRS | Corn Haploid | Smoothing, FD, Vector Normalization | OLDA, LPP, SVSKLPP | 97.1% (SVSKLPP average accuracy), 98.8% (SVSKLPP sensitivity), 95.4% (SVSKLPP specificity), | [45] |
| Cui et al. | 2019 | NIRS | Corn Haploid | Smoothing, FD, Vector Normalization | PLS | 90%+(PLS average accuracy) | [46] |
| Ge et al. | 2021 | NMR + NIRS | Corn Haploid | / | SVM, DM, KNN, AD, DADA | The effectiveness of the fusion of NMR and NIRS data for classification. | [47] |
| Ribeiro et al. | 2023 | MicroNIR | Corn Haploid | SNV, SG FD | PLS-DA | 100% (PLS-DA classification accuracy), | [48] |
| Wang et al. | 2018 | HSI | Corn Haploid | Moving Average Window Smoothing, FD, Vector Normalization | BPR | 99% (haploid and diploid CAR), <1% (haploid and diploid FAR) | [49] |
| He et al. | 2022 | HSI | Corn Haploid | SG | PLSDA | 90.31% (model accuracy), | [50] |
| Zhang et al. | 2022 | HSI | Corn Haploid | Min-Max Normalization | KNN, SVM, RF, DCGAN, CGAN | 10%+(DCGAN and CGAN average accuracy improvement), higher (CGAN accuracy improvement than DCGAN) | [51] |
Table 4.
Recent studies on vitality detection based on NIRS and HSI.
| Author | Year | Technology | Object | Preprocessing Methods | Models | Results | Reference |
|---|---|---|---|---|---|---|---|
| Agelet et al. | 2012 | NIRS | Vitality of soybean and corn seeds | SNV | PLS-DA, SIMCA, KNN, LS-SVM | 99% (PLS-DA accuracy for heat - damaged corn kernels) | [52] |
| Yang et al. | 2013 | NIRS | Vitality of corn seeds | SG Smoothing, MSC | BPNN | 95.0% (optimal recognition accuracy) | [53] |
| Wu et al. | 2018 | NIRS | Vitality of sweet corn seeds | AU, MC, MSC, SNV, SG Smoothing | PLSR | NIRS suitable for multi - parameter evaluation | [54] |
| Wang et al. | 2020 | NIRS | Vitality of sweet corn seeds | / | PLS-DA | >98% (classification accuracy) | [55] |
| Zhao et al. | 2022 | NIRS | Vitality of sweet corn seeds | Detrend, MSC, SNV, MC, SG Smoothing | PLS | Transmission spectroscopy better for vigor prediction. | [56] |
| Ambrose et al. | 2016 | HSI | Vitality of corn seeds | Normalization, 1st and 2nd Derivative, SNV, MSC | PLS - DA | 97.6% (calibration accuracy), 95.6% (prediction accuracy in SWIR) | [57] |
| Wakholi et al. | 2017 | HSI | Vitality of corn seeds | Normalization, SNV, MSC, Derivatives, Smoothing | PLS - DA, SVM, LDA | 100% (white seeds SVM accuracy), 100% (purple seeds SVM accuracy), 98% (yellow seeds SVM accuracy) | [59] |
| Feng et al. | 2018 | HSI | Vitality of corn seeds | 2nd derivatives | SVM | ~10% lower (optimal wavelengths vs full spectra SVM models) | [58] |
| Xu et al. | 2022 | HSI | Vitality of corn seeds | SG - 2, SNV, MSC, FD, 2nd derivatives | DT, SVM, LDA, KNN, RF, ANN | >85.71% (LDA accuracy with UVE), >89.76% (ANN accuracy with UVE) | [63] |
| Cui et al. | 2022 | HSI | Vitality of corn seeds | Savitzky - Golay Smoothing, MSC, SNV | PCR, PLS, SVR | 0.8319 (determination coefficient for root length prediction) | [62] |
| Zhao et al. | 2022 | HSI | Vitality of waxy corn seeds | / | DCNN, SVM, KNN, RF | 98.83% (DCNN + full band accuracy, highest) | [61] |
| Pang et al. | 2020 | HSI | Vitality of corn seeds | MSC | SVM, CNN, ELM | 90.11% (1DCNN recognition accuracy), 99.96% (2DCNN accurate recognition) | [60] |
Table 5.
Recent studies on components determination based on NIRS and HSI.
| Author | Year | Technology | Object | Preprocessing Methods | Models | Results | Reference |
|---|---|---|---|---|---|---|---|
| Fassio et al. | 2015 | NIRS | Oil content | 2nd Derivative, SNV | PLS | Qualitative oil determination possible | [74] |
| Lyu et al. | 2016 | NIRS | Protein, moisture, fat | / | EC-PLS | Wavenumber selection method provided valuable reference for designing small dedicated spectrometer | [75] |
| Alamu et al. | 2022 | NIRS | Amino acids | SNV, De-trending | MPLS | These models would serve as tools to rapidly screen their QPM germplasm for amino acids. | [76] |
| Xu et al. | 2023 | NIRS | Moisture, oil, protein, starch content | S-G Smoothing, MSC, SNV, FD and 2nd Derivatives | BiPLS-PCA-ELM | Higher robustness and accuracy (NIRS model) | [79] |
| Cataltas et al. | 2023 | NIRS | Protein, starch, oil, moisture content | MSC, SNV, SG, MC | 1D CAE + MLR, PLSR, PCR | Superior performance (1D CAE + MLR) | [77] |
| Wu et al. | 2023 | NIRS | Protein content | / | PLS, MWPLS, siPLS, GA-PLS, Random Frog - PLS, CARS- PLS, A-CARS-PLS | Great application potential (A - CARS - PLS) | [78] |
| Liu et al. | 2020 | HSI | Starch content | S - G Smoothing | PLSR, ANN | Rp = 0.96 & RMSEP = 0.98 (ANN for starch) | [80] |
| Zhang et al. | 2022 | HSI | Oil content | Maximum and Minimum Normalization | PLSR, SVR | Feasible (oil content method) | [81] |
| Zhang et al. | 2022 | HSI | Oil content | SG Smoothing, SNV, SG1, SG2 | CNNR, ACCNR | Prediction R2 = 0.9198 (ACCNR for oil in single kernel) | [82] |
| Wang et al. | 2019 | NIRS | Moisture Content | Savitzky - Golay | Bootstrap - SPXY - PLS | Effective for small sample moisture monitoring | [65] |
| Yang et al. | 2022 | NIRS | Moisture Content | SG Smoothing, MSC, Normalization, MC, SNV | RF, GDBT, XGB, Staking | R2P = 0.9391 & RPD = 2.91 (stacking model) | [66] |
| Huang et al. | 2015 | HSI | Moisture Content | / | PLSR | better direct method (RP = 0.848 & RMSEP = 2.73) | [67] |
| Zhang et al. | 2020 | HSI | Moisture Content | SG, MSC, SNV, First Derivative | PLSR | The models built with NIR spectra had more potential in determining moisture content | [69] |
| Wang et al. | 2020 | HSI | Moisture Content | SG, SNV, MSC, D1 | PLSR, LS - SVM | Rpre = 0.9325 & RMSEP = 1.2109 (UVE - SPA - LS - SVM) | [68] |
| Wang et al. | 2021 | HSI | Moisture Content | SG, SNV | PLSR | Rpre = 0.9311 ± 0.0094 & RMSEP = 1.2131 ± 0.0702 (CARS - SPA - LS - SVM) | [70] |
| Wang et al. | 2023 | HSI | Moisture Content | SG, SNV, MSC, 1D | PLS, LS - SVM | Rpre = 0.91 & RMSEP = 1.32% (S1 + S2 - UVE - SPA - LS - SVM), | [73] |
| Wu et al. | 2022 | HSI | Moisture Content | MSC | RF, AdaBoost | High accuracy & good robustness (hyperspectral with integrated learning) | [71] |
| Zhang et al. | 2022 | HSI | Moisture Content | PCA | CNN,LSTM, PLS,CNN-LSTM | Promising tool (hyperspectral with deep learning) | [72] |
Table 6.
Recent studies of mycotoxins detection based on NIRS and HSI.
| Author | Year | Technology | Object | Preprocessing Methods | Models | Results | Reference |
|---|---|---|---|---|---|---|---|
| Fernández et al. | 2009 | NIRS | AFB1 | SNV, Detrending | PLS | Potential for 20 ppb AFB1 detection | [83] |
| Tallada et al. | 2011 | NIRS | Infected by eight fungus species | MC, SNV | LDA, MLP | Better classification models (LDA & mean centering) | [84] |
| Tao et al. | 2019 | NIRS | AFB1 | SNV, 1st and 2nd Derivatives | PCA-LDA, PLS-DA | 98.6% (3-class), 91.4% & 97.1% (7-class) | [85] |
| Liu et al. | 2022 | NIRS | AFB1 | SNV | BPNN | RP = 0.9951 (NSGA-II - BPNN) | [88] |
| Wang et al. | 2022 | NIRS | AFB1 | / | 1D-CNN, 2D-MTF-CNN | 2D-MTF-CNN more stable and better | [89] |
| Deng et al. | 2022 | NIRS | AFB1 | MSC | SVM, PLS | High precision on-site testing (NIRS & SVM) | [87] |
| Shen et al. | 2022 | NIRS | Fumonisin B1 and B2 | SNV, DT, MSC, SG Smoothing, FD | PLS-DA, SVM-DA | >86.0% (PLS-DA & SVM-DA), | [88] |
| Zhu et al. | 2016 | Fluorescence and V/NIR HSI | Aflatoxins | / | LS - SVM, KNN | 95.33% (LS - SVM) | [91] |
| Kimuli et al. | 2018 | HSI | AFB1 | SNV, First and Second Derivatives | PLSDA, FDA | 100% (FDA for some varieties), | [101] |
| Kimuli et al. | 2018 | HSI | AFB1 | SNV, SGS | FDA | >96% & 98% (FDA) | [100] |
| Tao et al. | 2022 | HSI | Aflatoxins | SNV, FD, SD | PLS-DA | NIR-HSI has advantage for identification | [90] |
| Conceição et al. | 2021 | HSI | mycotoxicogenic fusarium species | SNV, FD, SNV + FD | PLS-DA | 100% accuracy (PLS-DA for fungi), | [92] |
| Zhang et al. | 2022 | HSI | AFB1 | MSC, SNV, 5-3 Smoothing | KNN, LDA, SVM | 84.1% & 87.3% (training), 77.8% & 83.0% (testing), | [93] |
| Zhou et al. | 2021 | HSI | AFB1 | SG, FD / SD | LDA, KNN, NB, DT | 95.56% (average), 88.67% (independent) | [94] |
| Zhou et al. | 2022 | HSI | AFB1 | SG, FD | SVM, NB, KNN, DT, LDA | The ideal result with an accuracy of 94.46% and 91.11% | [108] |
| Zhou et al. | 2022 | HSI | AFB | SG, MSC, FD | SVM, KNN, DT | 96.18% (SVM), | [95] |
| Wang et al. | 2014 | HSI | AFB1 | SNV | FDA | >88% | [95] |
| Wang et al. | 2015 | HSI | AFB1 | PCA | SAM | Three varieties reached 96.15%, 80%, and 82.61% | [97] |
| Wang et al. | 2015 | HSI | AFB1 | SNV | FDA | An overall classification accuracy of 98% was achieved. | [96] |
| Chu et al. | 2017 | HSI | AFB1 | Normalization | SVM | 83.75% and 82.50% for calibration and validation set | [99] |
| Chu et al. | 2020 | HSI | Infected by Fungi | / | SVM | Two methods can be used for classification | [102] |
| Guo et al. | 2023 | HSI | AFB1, Aspergillus flavus | FD, SNV | SVM, PLSR | Optimal regression (SNV & PLSR) | [103] |
| Mansuri et al. | 2022 | HSI | Fungal contamination | SNV, Savitzky - Golay | PLS - DA, ANN, CNN | 1D - CNN better performance | [104] |
| Lu et al. | 2022 | HSI and FTIR Microspectroscopy | Aspergillus flavus Infection and AFB1 Biosynthesis | SNV, FD | PLSR, SVR | Potential for estimation | [105] |
| Gao et al. | 2020 | HSI | Aflatoxin | MSC | RF, KNN | 99.38% (RF), 98.77% (KNN) | [106] |
| Wang et al. | 2023 | Fluorescence HSI | AFB1 | SNV | SVR - Boosting, AdaBoost, Extra - Trees - Boosting, KNN | Potential for estimation | [107] |
Table 7.
Recent studies on freezing damage, hardness and maturity detection based on NIRS and HSI.
| Author | Year | Technology | Object | Preprocessing Methods | Models | Results | Reference |
|---|---|---|---|---|---|---|---|
| Agelet et al. | 2012 | NIRS | Frozen Seeds | SNV | PLS-DA, SIMCA, KNN, LS-SVM | 63.4% (highest recognition, NIRS unable to distinguish) | [52] |
| Jia et al. | 2016 | NIRS | Frozen Seeds | / | PLS, OLDA, SVM, BPR, MD | 97% (BPR average accuracy) | [109] |
| Zhang et al. | 2022 | NIRS | Frozen Seeds | SNV, 5-3 Smoothing | KNN, SVM | 99.4% (KNN training), 100% (KNN testing) | [110] |
| Zhang et al. | 2019 | HSI | Frozen Seeds | SNV, MSC, 5 - 3 Smoothing | PLS-DA, KNN, SVM | >90% (HSI with 5 - 3 smoothing & SPA) | [111] |
| Zhang et al. | 2021 | HSI | Frozen Seeds | / | ELM, SVM, KNN, DCNN | 97.5% (DCNN testing, 5 - category), 100% (DCNN testing, 4 - category) | [112] |
| Williams et al. | 2009 | HSI | Hardness | MSC, SNV, Derivatives | PLS-DA | Reproducible results (potential for future use) | [113] |
| Williams et al. | 2016 | HSI | Hardness | SNV | PLS-DA | 0.93/0.97 (sensitivity/ specificity for hard kernels), 0.95/0.93 (sensitivity/specificity for medium kernels) | [114] |
| Qiao et al. | 2022 | HSI | Hardness | MSC, SG-Smoothing, FD | PLSR | R2 = 0.912, RMSE = 17.76, RPD = 3.41, RER = 14 | [115] |
| Wang et al. | 2015 | HSI | Maturity | OSC | PLSR | The OSC-SPA-PLSR models were used for visualization of the values of textural properties | [116] |
| Huang et al. | 2016 | HSI | Maturity | / | LSSVM, SVDD | 94.4% (LSSVM with updating, 10.3% higher) | [117] |
| Wang et al. | 2022 | HSI | Maturity | / | SVM | effective detection (combining wavelengths & texture) | [118] |
| Yang et al. | 2016 | HSI | Maturity | / | PLSR | 93.9% (average correct recognition) | [119] |
| Wang et al. | 2021 | HSI | Maturity | SG-SNV, SG-D1 | DT, PLS-DA, AdaBoost | 98.7%/100% (classification accuracy with T1/T2) | [120] |
Disclaimer/Publisher’s Note: The statements, opinions and data contained in all publications are solely those of the individual author(s) and contributor(s) and not of MDPI and/or the editor(s). MDPI and/or the editor(s) disclaim responsibility for any injury to people or property resulting from any ideas, methods, instructions or products referred to in the content. |
© 2024 by the authors. Licensee MDPI, Basel, Switzerland. This article is an open access article distributed under the terms and conditions of the Creative Commons Attribution (CC BY) license (http://creativecommons.org/licenses/by/4.0/).
Copyright: This open access article is published under a Creative Commons CC BY 4.0 license, which permit the free download, distribution, and reuse, provided that the author and preprint are cited in any reuse.


