
Submitted:
04 December 2024
Posted:
11 December 2024
You are already at the latest version
Abstract
Water at membrane interfaces is vital for the cellular biological functions, but despite its importance, the structure and function of biological water remain elusive. Here, by studying the OH stretching mode in partially hydrated lipid multilayers by FTIR measurements, relevant information on the water structure at the surface with lipid membranes has been gathered. The water hydrogen-bond network is highly perturbed in the first layers that are in contact with the lipid membrane, exhibiting strong deviations from tetrahedral symmetry and a significant number of defects, such as isolated water molecules and a large number of hydrogen-bonded water dimers in the interfacial region. These findings supports the hypothesis that in phospholipid membranes water chains are formed that are involved in the proton transfer across lipid bilayers by phosphate groups of opposing lipids. Furthermore, we have determined that even at very low hydration levels, a small amount of water is embedded within the confined spaces of the hydrocarbon region of phospholipid bilayers, which could potentially contribute to the structural stability of the lipid membrane.
Keywords:
FTIR Attenuated total reflection spectroscopy
; Hydrogen bonding
; Phospholipid membrane
; Phase transition
; Membrane hydration
1. Introduction
Biological membranes are now recognized to play a major role in many cellular processes. Typically, they are composed of a mixture of different phospholipids and proteins organized in a bilayer structure about 50 Å thick.
Water is a key element that controls the self-assembly [1] and the function [2] of the lipid bilayers in the cell through complex interactions between water molecules with the hydrophilic head groups of lipids. Changes in the degree of hydration or in the organization of water molecules at the membrane interface deeply affect the organization and dynamics of lipids in the membrane [3,4,5], the biological functions of membrane and of the membrane-embedded proteins [6,7,8]. The vice versa is also true: for example, the simple substitution of hydrogen atoms (single protons) by methyl groups in the headgroups of the membrane lipids, as in the case of phosphatidylethanolamines and phosphatidylcholines, causes strong changes in the organization of water molecules around the amphiphiles, influencing the effectiveness of these lipids on protein activities [8].
Hydration also allows adhesion and fusion between different membranes and between membranes and proteins [9], affecting the flexibility of biomembranes [10].
Furthermore, the phase state of the membrane is highly sensitive to the water content: when it is lowered below the value corresponding to the full hydrated condition for the lipid bilayer, the temperature of the transition from the low-temperature rigid gel phase (L) to the high-temperature (and biologically most relevant) liquid crystalline phase (L) is shifted to higher values [11], with consequent dramatic effects on the permeability properties of the bilayer [12,13,14,15,16].
Water species are differently organized in the bilayer, and they can also be distinguished by the number and type of hydrogen bonds (HBs) coordinating water molecules among themselves and with the lipid residues [17,18].
Over the last years, experimental and simulation studies with varying water content have unveiled important details on the conformation and dynamics of lipid membranes [19,20,21]. Moreover, a slowdown of the translational and rotational dynamics of the interface water compared to that of the bulk water has been observed [22,23]. This slowdown is even more pronounced at low hydration levels, with the lowest values for the water hydrogen bonded to the carbonyl oxygen buried deep in the hydrophobic core.
Although the structural organization and dynamics of the lipid-water system have been extensively studied for a long time [24,25,26,27,28], many of the details of membrane hydration and water-lipid interface [29,30,31] are far from being well understood. Further insights into the interplay between membrane lipids and the aqueous environment and further elucidation of the molecular-level structure of water at the membrane/water interface are necessary to fully understand the conformational properties and stability of cell membranes and the functioning of biological cells.
Studying the properties of phospholipid membranes with varying water content represents an interesting possibility to get insights into the hydration process and the formation of HBs between water and polar moieties at the interface.
Here, we present a Fourier transform infrared-Attenuated total reflectance (FTIR-ATR) study aiming to explore the arrangement of water confined in a model lipid membrane (dimyristoyl phosphatidylcholine, DMPC), by investigating the OH stretching (v-OH) band of water at various low-level hydration. The frequencies of this band are influenced by the HBs between water molecules and the interactions between interfacial lipid moieties and hydrated water molecules. In the majority of studies, membranes are in a highly hydrated state (i.e. in the physiologically relevant fully hydrated or "excess water" condition) and the infrared spectra provide information on the structure of the water, averaging over the contributions from bulk and interface.
Conversely, at low levels of water content, it is expected that the spectrum is mainly contributed by the first hydration layers of the membrane, and water is almost fully involved in bonding to lipid groups. In such cases, the frequencies (which describe the hydrogen-bond strengths) and the structure of the v-OH band are quite susceptible to the local environment of the water molecules at the membrane-water interface. Therefore, in the present study, the hydration-induced changes in the OH stretching band were investigated, as valuable markers for the water-lipid interactions and the hydrogen bonding structure in the first hydration layers [18,32].
DMPC is a phospholipid with a zwitterionic motif containing a positively charged choline headgroup and negatively charged phosphate and carbonyl groups, all potentially involved in interactions with water molecules. Water molecules may also cross-link the phospholipid head groups via hydrogen bonding to the oxygens at the interface.
Hence, the water-lipid interactions were also inspected by jointly analyzing the changes in the PO stretching of the phosphate group in the head moiety, and the stretching vibrations of the polar ester carbonyl C=O groups in the interfacial region. In this way, we were able to investigate in great detail the water molecule environments of poorly hydrated membranes and the binding sites of water in biomembranes by identifying H-bonds between interfacial water molecules and phospholipid headgroups [33].
2. Materials and Methods
DMPC was purchased from Avanti Polar Lipids (Birmingham, AL, USA) and used without further purification. A membrane-forming solution was prepared by dissolving 20 mg of dry phospholipids in 1 ml of a 2:1 chloroform/methanol solution in a flask. Then the solution was evaporated by using a vacuum pump. After that, 1 ml of distilled water was added and the solution was left to hydrate for about 1 hour at 35°C. Finally, it was stirred in a vortex mixer to promote the formation of liposomes.
Aligned multilayers were obtained by spreading about 70 l of liposome suspension directly onto the ATR plate and evaporating water. The sample was repeatedly subjected to hydration/dehydration cycles. While evaporating the aqueous solvent, capillary forces flatten the membranes, which spontaneously form highly aligned multibilayers [34].
Saturated salt solutions, prepared by mixing a great excess of chemically pure salt and deionized water, were used to maintain the sample at different relative humidity (RH). For the experiments, the solution was poured into a toroidal small tank set around the ATR plate, and the whole area was isolated from the rest by a sealed cover.
To ensure that the membrane was in a well-equilibrated hydrated state, it was kept at room temperature for 24 h or more at each hydration before measurements until the absorbance spectrum stabilized in the region 2800–3800 . Furthermore, for each salt solution, hydration and dehydration scans were acquired and negligible hysteresis effects were observed. All measurements were carried out in duplicates by preparing new liposomes each time.
For this study, nine salts were used (LiCl, CH3COOK, MgCl2, K2CO3, NH4NO3, NaCl, KCl, KNO3, K2SO4) to have a range of RH ranging from 11 to 98%. The values of equilibrium RH at 25°C are given in Table 1.
The molar water-to-lipid ratio has been determined by gravimetric sorption experiments [35] at a temperature of T=25°C. The hydration data were analyzed by using Brunauer–Emmett–Teller (BET) theory [36] and reported in Table 1. Values of were found to range from 1.25 (lowest hydration) to 8.5 (highest hydration), in good agreement with previous results [36,37].

Table 1.
Selected saturated salt solutions and corresponding RH at 25 °C along with the respective number of water molecules per DMPC evaluated by gravimetric sorption experiments, , and infrared area under the bands corresponding to the stretching vibration,.Note that the observed good agreement between and suggests that water molecules enter uniformly between the lipid bilayers preserving both the lamellar lipid structure and the good bilayer alignment. If it weren’t so, there would be defects in the alignment of lipids, that should result in the formation of cavities where water molecules can accumulate at the expense of lipids [38]. The presence of defect-induced pools of water molecules would cause a more intense absorption signal for the water band, and a consequent less intense absorption intensity for the methylene band, preventing the IR-derived data from being in good agreement with the gravimetric data.
| Salt | %RH | ||
|---|---|---|---|
| LiCl | 11 | 1.25 | 1.2 |
| CH3COOK | 23 | 1.70 | 1.73 |
| MgCl2 | 33 | 2.10 | 2.1 |
| K2CO3 | 43 | 2.40 | 2.78 |
| NH4NO3 | 64 | 3.33 | 3.41 |
| NaCl | 75 | 4.00 | 3.89 |
| KCL | 85 | 4.97 | 4.76 |
| KNO3 | 95 | 7.00 | 7.52 |
| K2SO4 | 98 | 8.51 | 8.51 |
DMPC bilayer has a gel-to-liquid crystalline transition temperature of 24°C in its fully hydrated state (25-30 water molecules per lipid). The phase state is highly sensible to the content of water (lyotropic phase behavior): when the water/lipid molecule ratio is lower than twelve, the order among the hydrocarbon chains increases and the main transition temperature is moved toward higher values so that partially hydrated multilayers are in gel phase at temperatures at which they would be in liquid crystalline phase. For the conditions at which the studies were performed ( T=25°C and at most equal to 8.5) lipid bilayers are considered to be in a gel phase.
3. Experimental Section
Fourier-transform infrared spectra were taken at 25∘C in attenuated total reflectance (ATR) mode, by using a single reflection horizontal ATR accessory, having a diamond crystal fixed at an incident angle of 45∘ (Platinum ATR, Bruker) mounted on a Vertex 80V FT-IR spectrometer (Bruker Vertex 80V). The penetration depth, , of IR light in the sample is the following:
Where is the wavelength of the incident light, n1 is the real refractive index of the internal reflection element (n1=2.4), is the angle of incidence and n2 is the refractive index of the sample. The latter parameter was evaluated by the formula
where and are the molar volumes of water and lipid, respectively, while 1,33 and 1,44 are the corresponding refractive indexes. Consequently, n2 varies switching from the dried sample (n2 =1.44) to the most hydrated sample (n2=1.41), which only slightly affects the penetration depth , that, for all the different hydrations, it was estimated to be around 400 nm for a wavelength of 3.0 m, close to the peak of the OH stretching band.
Based on the above considerations, the thickness of the stack of lipid bilayers, of about 10 m, exceeds several times the penetration depth of the evanescent wave at all the investigated hydrations.
A background scan was recorded before each measurement and subtracted from the sample spectra. Each spectrum was averaged over 216 scans with a resolution of 2 cm−1 and ATR corrected. Atmospheric moisture effects were eliminated by performing measurements in an evacuated optics bench configuration.
The values of the number of water molecules per lipid at each hydration were determined from infrared spectra by evaluating the ratio of the total area of the methylene band in hydrated samples, , to the total area of this band in the dry sample, , and the fraction of volumes available to water molecules: =(1-() ). As shown in Table 1, the values of n obtained by this procedure are in agreement within a few percent with those determined experimentally by gravimetric sorption measurements.
The present infrared analysis investigated the water-lipid H-bonding interactions and hydration processes from two different perspectives: the water and the lipid one. From the water perspective, the focus was on the shape and on the frequency shifts of the hydroxyl (OH) stretching band at varying hydration levels, which are related to the number and strength of hydrogen bonding of different water populations in the hydration sites of the membrane, with the highest frequency due to the weakest interactions of water molecules.
Conversely, the changes of the stretching vibrations of the polar ester carbonyl C=O groups in the interfacial region and the phosphate group in the head moiety were monitored from the lipid perspective[5,39]. Both of these groups are sites of water sorption and are proton-acceptors: when water molecules bond with them through hydrogen bonding, their stretching frequencies decrease markedly due to the elongation of the involved chemical bonds [40].
4. Results and Discussion
Figure 1 shows the spectral region between 2600 and 3800 cm−1 of DMPC bilayers at different hydration levels, from dry to 98%, compared to the spectrum of pure liquid water.
In this region, pure water shows the characteristic broad band vibrational spectrum due to the OH stretching vibrations with a maximum near 3400 cm−1 and a low-frequency wing near 3200 cm−1 [41].
In the hydrated lipid sample, besides the OH stretching band (v-OH), the typical methylene stretching (CH2) bands of acyl chains are also revealed below 3000 cm−1 [18,32]. To account for the swelling behavior, all the spectra were normalized to the CH2 /CH3 stretching band (2800–2970 cm−1 ) In fact, in an ATR experiment, it is common to observe an increase in the OH stretching band and a decrease in the C-H bands when the hydration level increases.[42]. This rise and fall of the band magnitudes can be accounted for by considering that the gradual water absorption induces the progressive swelling of multibilayers. Consequently, a major quantity of water molecules and a minor content of lipids are present in the sampled volume.
It is clear from Figure 1 that the shape of the v-OH band observed in the spectral region above 3000 cm−1 in hydrated lipids differs from that in pure water and depends on the relative hydration level.
To better appreciate the changes in the v-OH band at different RHs, the experimental data were normalized to the maximum amplitude and plotted in Figure 2.
The comparison with the spectrum of pure liquid H2O shows that the shape of the OH-stretching band strongly differs in both the high- and the low-frequency sides relative to the peak at 3420 cm−1 in pure water. Furthermore, the changes are dependent on the water molecules content. These observations indicate that the water hydrogen-bonded structure is strongly changed in the lipid system with respect to the pure liquid water as a consequence of the interaction with the hydrophilic-hydrophobic groups [1]. In particular, as the water content increases, in the membrane system the high-frequency shoulder near 3600 cm−1 becomes gradually more evident, appearing to shift to higher frequencies and showing a major increase at RH= 75%. Differently, the intensity of the low-frequency component, centered at about 3250 cm−1, progressively increases as RH increases up to 64%, whereas it reverses the trend as RH is increased above 64% (see the inset of Figure 2).
Furthermore, the position of the main peak at about 3420 cm−1 is shifted to higher frequencies with respect to that of liquid water. This finding would indicate the weakening of the average H-bonding in lipid bilayers. The observed behaviors are in line with the results of a previous dehydration study on DMPC [43], where the dehydration was obtained by water evaporation.
To provide a quantitative analysis of these changes so to obtain information on the various types of OH species present in water, as well as to clarify intermolecular interactions and the influence of micro-confinement, a deconvolution procedure of the v-OH band was conducted.
Differently from previous analysis [44,45], here, the band was decomposed into five contributions, by considering that the molecules involved in the formation of HBs act as either proton donors (D) or proton acceptors (A). The five components, labelled as DAA, DDDA, DA, DDA and free OH, correspond to water molecules having different H-bond coordination numbers (ranging from 0 to 4) according to the number of H-bond donor (D) sites and H-bond acceptor (A) sites [46,47]. For example, in a DDAA configuration, a molecule can simultaneously donate and accept two H-bonds. The structure of the DA bond patterns is linear, whereas the other molecular models, DDAA, DDA, and DAA, create three-dimensional networks of H bonds. Also, water molecules with stronger HBs and higher connectivity give rise to lower frequency O–H stretching sub-bands, while water with weaker HBs and lower connectivity result in higher frequency sub-bands [48,49].
For the deconvolution of the s-OH band in hydrated lipids, an additional low-frequency Gaussian component was included to account for the contributions of the high-energy tail of CH2 groups and the asymmetric stretching mode of the N(CH3)3 head groups observed below 3050 cm−1 [50].
Figure 3 shows an example of the OH band decomposition into five Gaussian sub-peaks for the DMPC at three selected hydration levels (low, intermediate, and high). Fitting has provided unique solutions independently of the starting values of parameters. Our FTIR studies reveal that the ordering and arrangement of the H-bonds in the water layers adjacent to the phospholipid head groups are significantly influenced by lipid hydration and exhibit clear heterogeneity.
From the fitting procedure, we have estimated the relative contribution of each Gaussian area to the total area of the v-OH band (percentage areas) together with the peak frequencies of sub-bands. The results are shown in Figure 4.
We observed that the DDAA and DA bands are the most prominent at all investigated hydrations, contributing to more than 70% of the total integrated area of the v-OH band. Notably, although DA dimer populations prevail, a considerable number of water molecules are arranged in tetrahedral DDAA substructures even at very low hydration levels. Surprisingly, at these low hydrations a non negligible significant number of free waters is also found.
Furthermore, in lipid bilayers the position of the DA is roughly unchanged at around 3380 cm−1 up to RH= 75% and then increases to 3400 cm−1. Conversely, the position of the low-energy DDAA component exhibits a redshift (from 3250 to 3235 cm−1) as RH increases up to 75%, and a blue shift (up to 3258 cm−1) for RH > 75%, whereas the positions of the other components remain fairly unchanged or increase slightly.
Considering that the linear absorbance is proportional to the number density of resonant oscillators, to better describe the obtained results, we have calculated the number of water molecules (), associated with each of the five OH environments, by multiplying the percentage areas for the number of water molecules reported in Table 1 and corresponding to the different RHs.
In this regard we have to observe that, to correctly evaluate the intensity of infrared absorption of OH stretching vibrations, it should be necessary to quantify the variation of the OH transition dipole as a function of the OH frequency. In confined water molecules, the dipole moment magnitude increases with the number of HBs they form, varying at most from a value of about 2.9 D (for molecules that self-organize through HBs) to a value of 2 D ( for isolated water molecules in small cages) [51].
Nevertheless, while these values should be regarded as approximate due to the unknown dipole moments for the different vibrations of water confined within lipid bilayer, the water population distributions we have determined provide valuable insights into how hydration occurs within the different hydrogen bonding environments near the membrane interface.
Indeed, the results shown in Figure 5 disclose important information. First, despite its percentage of surface area tending to decrease (Figure 4, b), the number of free water molecules increases monotonically with increasing hydration (Light green bars Figure 5, a). More importantly, the numbers of water molecules associated with the DDAA and DA components both increase, exhibiting a greater slope when the hydration level overcomes the value of 75% (Light violet and light blue bars, Figure 5, a).
As is well known, water molecules in the lipid bilayer can occupy different regions, resulting in varying degrees of binfding strenght : some amount of water resides deep within the lipid-water interface by binding strongly to PO2, and more weakly to CO [52]; a limited number of water molecules is found confined between the hydrocarbon chains of the bilayer (buried water); water molecules are also found near the N(CH3)3+ groups and are involved in a clathrate-like structure [13,14,15,16].
To correlate the H-bonding formation at with the observed changes in the sub-bands, we have carefully analyzed the stretching vibrations of the phosphate group representing the primary hydration site of PC lipids (lipid perspective) [32].
For such analysis we have considered the symmetric stretching band, because in contrast with what was observed for the asymmetric band [5], it is well-resolved at all the hydrations. The evolution with hydration of this band is shown in Figure 5. As expected [5,39], the frequency position gradually decreases, indicating the progressive water uptake at the PO group and the related formation of HBs, and becomes almost constant in the range of RH= 75%, suggesting that, beyond this hydration level, the formation of H-bonds for this group has saturated.
The observed similar decreasing trend of the and the frequency position of the DDAA band with varying RH values indicates that the related molecular events are strictly correlated and/or are the two different faces (of the water and of the lipid ones) of the same mechanism and suggests that the formation of HBs at sites is involved in the four-coordinated tetrahedral water environments.
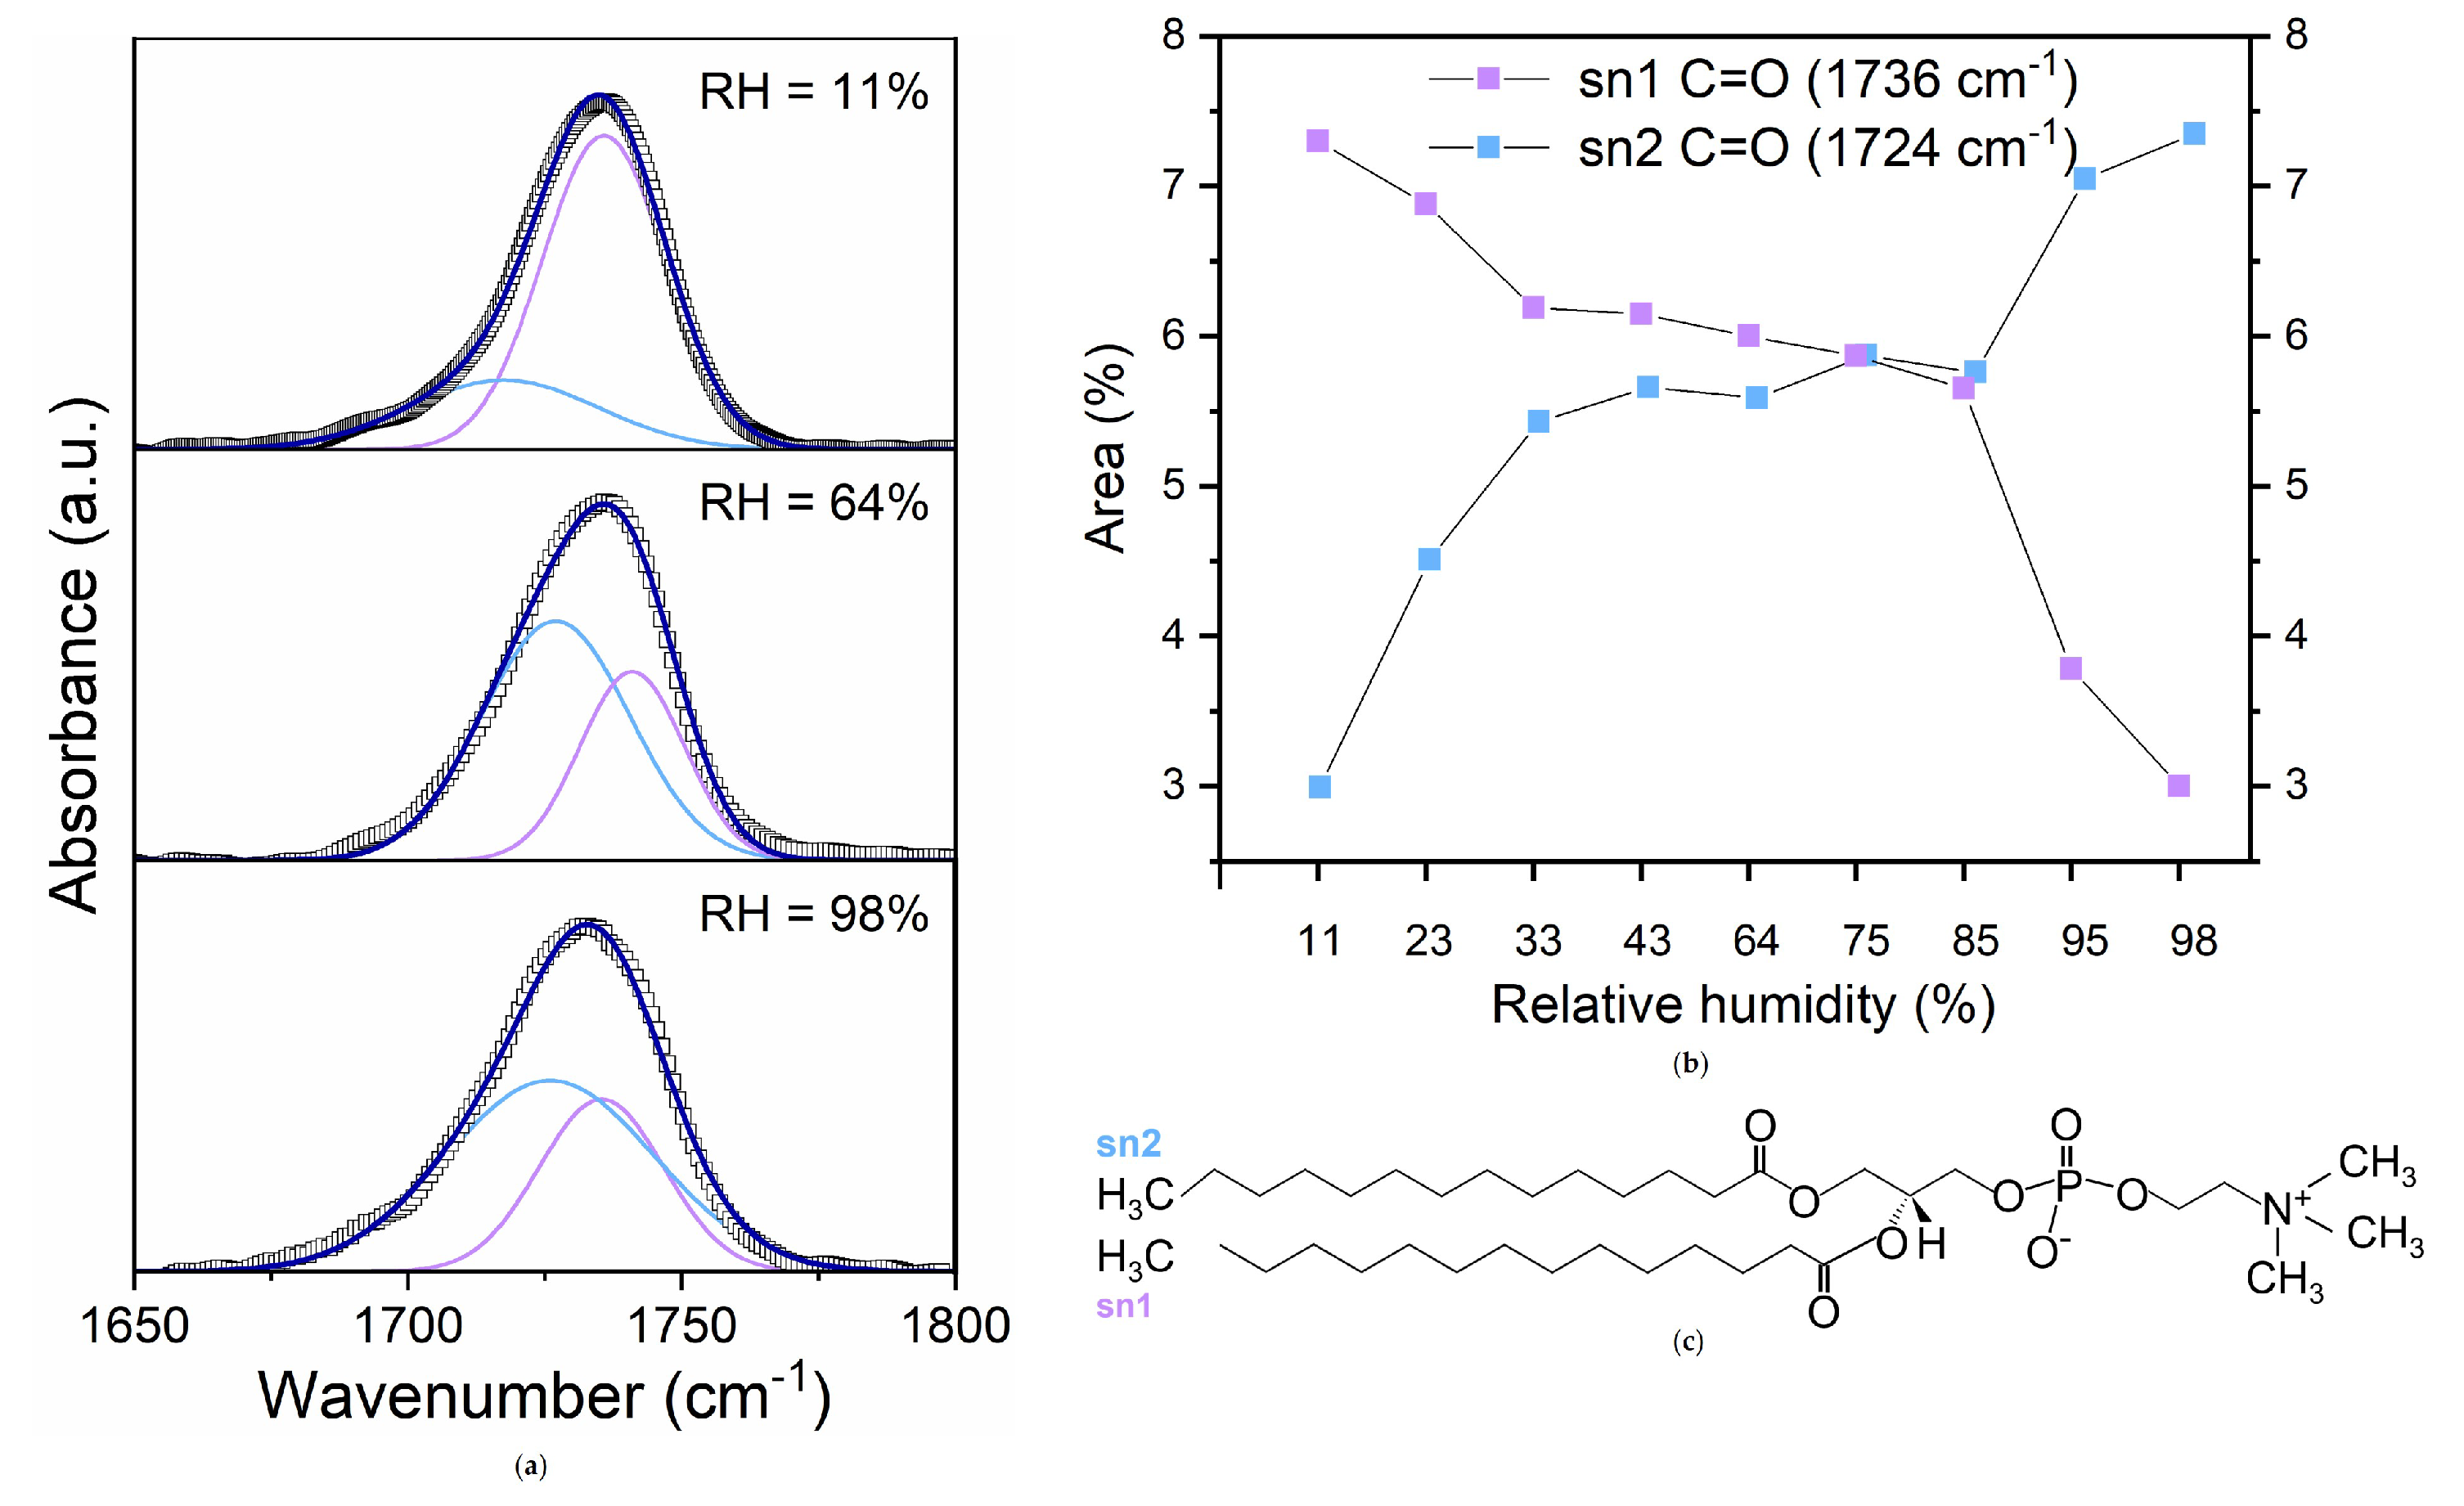
To further inspect the hydration sites of lipids at the interface, the spectral region of the stretching band of the ester carbonyl group, extending between 1800 and 1650 cm−1 has been also scrutinized (Figure 6).
In this region, at all the investigated hydrations, an asymmetric band is observed, that broadens and shifts towards lower wavenumber with increasing the water content. Indeed this band comes from the overlapping of a band at 1741 cm−1 and a band at 1727 cm−1, corresponding to the C=0 stretching vibrations of the ester groups at the sn-1 and sn-2 position, and respectively describing non-hydrogen bonded and hydrogen bonded carbonyl group [11,53,54].
In Figure 6 the stretching band of the carbonyl group, deconvoluted into two Gaussian contributions from hydrogen and non-hydrogen bonded C=O groups at three selected hydrations is shown. The absorbance values of the two peaks were converted to percentage areas to obtain the percentages of hydrogen-bonded and non-hydrogen-bonded C=O groups (Figure 6).
It is found that the area of sn-2 C=O groups increases with increasing RH, remains about constant between 40% - 85%, and then starts to grow again. A mirrored trend is found for the sn-1 C=O component. It is worth noting that the abrupt increase of sn-2 C=0 area is found in correspondence with the observed saturation of hydrogen bonding sites in the PO moiety.
Interestingly, precisely in proximity to this hydration level, the frequency at which the DDAA sub-band is observed, shows a reverse trend with RH. The shift to higher frequencies could be interpreted as an overall weakening of the H-bonding among water molecules, indicating the formation of weaker HBs with C=O groups.
From previous studies, we know that the gel phase of DMPC can absorb up to 13 water molecules per DMPC [9,38,55], four of which lie in the interfacial water region and are shared by two adjacent lipids: two are located between phosphate oxygens of two neighboring lipid molecules, forming an infinite hydrogen-bonded phosphate-water-phosphate-water ribbon, whereas the other two molecules are hydrogen-bonded to one phosphate oxygen of a molecule and to another water molecule respectively, establishing a linkage across the bilayer interface with the corresponding water molecules of the adjacent bilayer [56].
From our results, the value of RH= 85% corresponds to a number of about five water molecules for lipid (see Table 1), mainly equally distributed in DDAA and DA populations.
We deduce that during the early stages of the hydration process, most water molecules are involved in interactions with the phosphate group in DDAA and DA arrangements, even if some loosely bonded water molecules are in the buried region between the hydrocarbon tails and at the carbonyl sites. A second step of hydration is activated after the saturation of phosphate groups, with the formation of a great number of HBs with the carbonyl group.
A relevant result of our analysis was the occurrence in the first layers of hydration of a high fraction of dimer water (DA) molecules, which can result in the formation of segmented water chains (water wires) with strong intradimer hydrogen and weak interdimer hydrogen bonds. This finding supports the hypothesis that water chains are formed in phospholipid membranes and are involved in the protons transfer across lipid bilayers by phosphate groups of opposing lipids [57,58]. Interestingly, very recently it has been shown that the presence of water dimers in the interfacial structure of water has a direct impact on the rate of water splitting [59,60]. All these findings highlight the importance of loosely constrained water structures in ion transport mechanisms under atomic confinement.
Our study also shows that at very low hydration levels water molecules are present in the buried region between the hydrocarbon tails. If we consider that DMPC at a low hydration state and room temperature is in a gel phase, this result is in contrast with that found by Alarcon et al. [17], who estimated a negligible contribution of buried water in the gel phase of Dipalmitoylphosphatidylcholine (DPPC) bilayers by means molecular dynamics simulations.
Interestingly, a recent simulation study on the hydration of DMPC has revealed different binding states of water molecules and found that, at low hydration, most of the water is maintained inside the membrane, assuring the structural stability of the bilayer [23]. Water molecules residing in internal cavities located in the apolar hydrocarbon region are becoming recognized increasingly as having an important role in regulating the membrane fluidity and the permeability of hydrophilic non-electrolytes [61].
Experimentally, the presence of water within the hydrocarbon region of phospholipid bilayers in the fully hydrated liquid-crystalline phase membranes has been well established [62,63,64,65], but there is limited and non-definitive evidence for this in partially hydrated or gel-phase membrane [17]. The present study fills this gap and focuses on the relevance of sub-constrained water molecules at the lipid-membrane interface.
A deeper understanding of water-lipids interactions in partially hydrated membrane could enable better comprehension of the consequences of biological membrane dehydration induced by freezing or by interaction with other biomolecules, i.e. cholesterol, peptide, protein or drug [66], or by sugar or salt or metal ion.
Furthermore, it can shed light on the mechanisms by which some organisms, including tardigrades, survive in a dehydrated environment for long times [67], and on the fundamentals of long-time biopreservation [68]. In addition, studying the dehydration of lipids at the membrane interface can be also useful to understand the mechanism of raft domain formation [69].
5. Conclusion
The H-bonding characteristics of the hydration water of DMPC were studied using infrared spectroscopy by varying the relative humidity of the ambient atmosphere of multibilayer samples. Relevant information on the hydration interaction of phospholipid bilayers has been gathered. Deconvolution of the OH stretching band in poorly hydrated lipid multilayers enables to distinguish five water molecule populations characterized by different combinations of hydrogen bond donors and acceptors.
We have deduced that also at very low hydration, a small amount of water is embedded in the confined spaces within the hydrocarbon region of phospholipid bilayers. This finding provides support to the results of a recent simulation study [23] and suggests that the presence of water in the interfacial region and, even if in a small amount, between the hydrocarbon region determines the structural stability of the lipid membrane.
According to the study, there is a substantial amount of dimer water molecules present in the first layer of hydration, which can lead to the development of hydrogen-bonded water-wires.
The hydration process was also investigated by observing the changes of the phosphate group symmetric stretching and C=O stretching modes, correlating them with shifts the OH stretching sub-bands and the distribution of water populations.
The results from this study can be useful for understanding how changes in the degree of hydration can threaten the stability and biological function of lipid membranes and clarify the aspects of water H-bonding self-assembly and their role in transport mechanisms across lipid membranes.
Author Contributions
Conceptualization, G. D., V.C.N. and C.B.; formal analysis, C.B., U.W. and R.V.; investigation, E. B., A. C., R. V. and C.B.; writing—original draft preparation, G. D., V.C.N. and C.B.; writing—review and editing, G.D., V.C.N and R.V.; visualization, E.B., A.C. and R. V.; supervision, G.D., V.C.N; project administration,G.D; funding acquisition, V.C.N.. All authors have read and agreed to the published version of the manuscript.
Funding
We acknowledge financial support under the National Recovery and Resilience Plan (NRRP), Mission 4, Component 2, Investment 1.1, Call for tender No. 104 PRIN 2022 published on 2.2.2022 by the Italian Ministry of University and Research (MUR), funded by the European Union – NextGenerationEU– Project Title "Unveiling the mutual interaction between lipid rafts and amyloid oligomers at the neuronal membrane - NeuRaftAmyl", CUP J53D23001320006
Data Availability Statement
The data presented in this study are available upon request from the corresponding author.
Abbreviations
The following abbreviations are used in this manuscript:
| FTIR-ATR | Fourier transform infrared - Attenuated total reflectance |
| DMPC | Dimyristoyl Phosphatidylcholine |
| RH | Relative Humidity |
| HBs | Hydrogen Bonds |
References
- Disalvo, E.A. Membrane Hydration: The Role of Water in the Structure and Function of Biological Membranes; Vol. 71, Springer, 2015.
- Milhaud, J. New insights into water–phospholipid model membrane interactions. Biochimica et Biophysica Acta (BBA)-Biomembranes 2004, 1663, 19–51. [Google Scholar] [CrossRef] [PubMed]
- Mashaghi, A.; Partovi-Azar, P.; Jadidi, T.; Nafari, N.; Maass, P.; Tabar, M.R.R.; Bonn, M.; Bakker, H.J. Hydration strongly affects the molecular and electronic structure of membrane phospholipids. The Journal of chemical physics 2012, 136, 03B611. [Google Scholar] [CrossRef] [PubMed]
- D’Angelo, G.; Conti Nibali, V.; Crupi, C.; Rifici, S.; Wanderlingh, U.; Paciaroni, A.; Sacchetti, F.; Branca, C. Probing intermolecular interactions in phospholipid bilayers by far-infrared spectroscopy. The Journal of Physical Chemistry B 2017, 121, 1204–1210. [Google Scholar] [CrossRef] [PubMed]
- Nibali, V.C.; Khouzami, K.; Wanderlingh, U.; Branca, C.; D’Angelo, G. Study of the interaction of water with phospholipid bilayers by FTIR spectroscopy. Atti della Accademia Peloritana dei Pericolanti-Classe di Scienze Fisiche, Matematiche e Naturali 2017, 95, 8. [Google Scholar]
- Laage, D.; Elsaesser, T.; Hynes, J.T. Water dynamics in the hydration shells of biomolecules. Chemical Reviews 2017, 117, 10694–10725. [Google Scholar] [CrossRef]
- Fitter, J.; Verclas, S.; Lechner, R.; Seelert, H.; Dencher, N. Function and picosecond dynamics of bacteriorhodopsin in purple membrane at different lipidation and hydration. FEBS letters 1998, 433, 321–325. [Google Scholar] [CrossRef]
- Lee, A.G. How lipids affect the activities of integral membrane proteins. Biochimica et Biophysica Acta (BBA)-Biomembranes 2004, 1666, 62–87. [Google Scholar] [CrossRef]
- Disalvo, E.; Lairion, F.; Martini, F.; Tymczyszyn, E.; Frias, M.; Almaleck, H.; Gordillo, G. Structural and functional properties of hydration and confined water in membrane interfaces. Biochimica et Biophysica Acta (BBA)-Biomembranes 2008, 1778, 2655–2670. [Google Scholar] [CrossRef]
- Fitter, J.; Lechner, R.; Büldt, G.; Dencher, N. Temperature dependence of molecular motions in the membrane protein bacteriorhodopsin from QINS. Physica B: Condensed Matter 1996, 226, 61–65. [Google Scholar] [CrossRef]
- Mantsch, H.; McElhaney, R. Phospholipid phase transitions in model and biological membranes as studied by infrared spectroscopy. Chemistry and physics of lipids 1991, 57, 213–226. [Google Scholar] [CrossRef]
- Rand, R.; Fuller, N.; Parsegian, V.; Rau, D. Variation in hydration forces between neutral phospholipid bilayers: evidence for hydration attraction. Biochemistry 1988, 27, 7711–7722. [Google Scholar] [CrossRef] [PubMed]
- Stepniewski, M.; Bunker, A.; Pasenkiewicz-Gierula, M.; Karttunen, M.; Róg, T. Effects of the lipid bilayer phase state on the water membrane interface. The Journal of Physical Chemistry B 2010, 114, 11784–11792. [Google Scholar] [CrossRef] [PubMed]
- Lopez, C.F.; Nielsen, S.O.; Klein, M.L.; Moore, P.B. Hydrogen bonding structure and dynamics of water at the dimyristoylphosphatidylcholine lipid bilayer surface from a molecular dynamics simulation. The Journal of Physical Chemistry B 2004, 108, 6603–6610. [Google Scholar] [CrossRef]
- Khandelia, H.; Kaznessis, Y.N. Structure of the antimicrobial β-hairpin peptide protegrin-1 in a DLPC lipid bilayer investigated by molecular dynamics simulation. Biochimica et Biophysica Acta (BBA)-Biomembranes 2007, 1768, 509–520. [Google Scholar] [CrossRef]
- Rosa, A.S.; Cejas, J.P.; Disalvo, E.A.; Frías, M.A. Correlation between the hydration of acyl chains and phosphate groups in lipid bilayers: Effect of phase state, head group, chain length, double bonds and carbonyl groups. Biochimica et Biophysica Acta (BBA)-Biomembranes 2019, 1861, 1197–1203. [Google Scholar] [CrossRef]
- Alarcón, L.M.; de Los Angeles Frias, M.; Morini, M.A.; Belén Sierra, M.; Appignanesi, G.A.; Anibal Disalvo, E. Water populations in restricted environments of lipid membrane interphases. The European Physical Journal E 2016, 39, 1–9. [Google Scholar] [CrossRef]
- Binder, H. Water near lipid membranes as seen by infrared spectroscopy. European Biophysics Journal 2007, 36, 265–279. [Google Scholar] [CrossRef]
- Conti Nibali, V.; Branca, C.; Wanderlingh, U.; D’Angelo, G. Intermolecular hydrogen-bond interactions in DPPE and DMPC phospholipid membranes revealed by far-infrared spectroscopy. Applied Sciences 2021, 11, 10038. [Google Scholar] [CrossRef]
- Zhang, Z.; Berkowitz, M.L. Orientational dynamics of water in phospholipid bilayers with different hydration levels. The Journal of Physical Chemistry B 2009, 113, 7676–7680. [Google Scholar] [CrossRef]
- Samatas, S.; Calero, C.; Martelli, F.; Franzese, G. Water between membranes: structure and dynamics. In Biomembrane Simulations; CRC Press, 2019; pp. 69–88.
- Srivastava, A.; Debnath, A. Hydration dynamics of a lipid membrane: Hydrogen bond networks and lipid-lipid associations. The Journal of Chemical Physics 2018, 148. [Google Scholar] [CrossRef]
- Calero, C.; Stanley, H.E.; Franzese, G. Structural interpretation of the large slowdown of water dynamics at stacked phospholipid membranes for decreasing hydration level: All-atom molecular dynamics. Materials 2016, 9, 319. [Google Scholar] [CrossRef] [PubMed]
- Gennis, R.B. Membrane dynamics and protein-lipid interactions. In Biomembranes; Springer, 1989; pp. 166–198.
- Tardieu, A.; Luzzati, V.; Reman, F. Structure and polymorphism of the hydrocarbon chains of lipids: a study of lecithin-water phases. Journal of molecular biology 1973, 75, 711–733. [Google Scholar] [CrossRef] [PubMed]
- Wanderlingh, U.; D’Angelo, G.; Branca, C.; Conti Nibali, V.; Trimarchi, A.; Rifici, S.; Finocchiaro, D.; Crupi, C.; Ollivier, J.; Middendorf, H. Multi-component modeling of quasielastic neutron scattering from phospholipid membranes. The Journal of chemical physics 2014, 140, 05B602_1. [Google Scholar] [CrossRef] [PubMed]
- D’Angelo, G.; Wanderlingh, U.; Nibali, V.C.; Crupi, C.; Corsaro, C.; Di Marco, G. Physical study of dynamics in fully hydrated phospholipid bilayers. Philosophical Magazine 2008, 88, 4033–4046. [Google Scholar] [CrossRef]
- Nibali, V.C.; D’Angelo, G.; Tarek, M. Molecular dynamics simulation of short-wavelength collective dynamics of phospholipid membranes. Physical Review E 2014, 89, 050301. [Google Scholar] [CrossRef]
- Rifici, S.; Corsaro, C.; Crupi, C.; Nibali, V.C.; Branca, C.; D’Angelo, G.; Wanderlingh, U. Lipid diffusion in alcoholic environment. The Journal of Physical Chemistry B 2014, 118, 9349–9355. [Google Scholar] [CrossRef]
- Rifici, S.; D’Angelo, G.; Crupi, C.; Branca, C.; Conti Nibali, V.; Corsaro, C.; Wanderlingh, U. Influence of Alcohols on the Lateral Diffusion in Phospholipid Membranes. The Journal of Physical Chemistry B 2016, 120, 1285–1290. [Google Scholar] [CrossRef]
- Wanderlingh, U.; D’Angelo, G.; Nibali, V.C.; Gonzalez, M.; Crupi, C.; Mondelli, C. Influence of gramicidin on the dynamics of DMPC studied by incoherent elastic neutron scattering. Journal of Physics: Condensed Matter 2008, 20, 104214. [Google Scholar] [CrossRef]
- Grdadolnik, J.; Kidri, J.; Had, D.; others. Hydration of phosphatidylcholine reverse micelles and multilayers—an infrared spectroscopic study. Chemistry and physics of lipids 1991, 59, 57–68. [Google Scholar] [CrossRef]
- Arrondo, J.; Goni, F.; Macarulla, J. Infrared spectroscopy of phosphatidylcholines in aqueous suspension a study of the phosphate group vibrations. Biochimica et Biophysica Acta (BBA)-Lipids and Lipid Metabolism 1984, 794, 165–168. [Google Scholar] [CrossRef]
- Fringeli, U.P.; Günthard, H.H. Infrared membrane spectroscopy. In Membrane spectroscopy; Springer, 1981; pp. 270–332.
- Jendrasiak, G.L.; Hasty, J.H. The hydration of phospholipids. Biochimica et Biophysica Acta (BBA)-Lipids and Lipid Metabolism 1974, 337, 79–91. [Google Scholar] [CrossRef]
- Jendrasiak, G.L.; Smith, R.L. The interaction of water with the phospholipid head group and its relationship to the lipid electrical conductivity. Chemistry and physics of lipids 2004, 131, 183–195. [Google Scholar] [CrossRef] [PubMed]
- Wilkinson, D.; Morowitz, H.; Prestegard, J. Hydration of phosphatidylocholine. Adsorption isotherm and proton nuclear magnetic resonance studies. Biophysical journal 1977, 20, 169–179. [Google Scholar] [CrossRef] [PubMed]
- Nagle, J.F.; Tristram-Nagle, S. Structure of lipid bilayers. Biochimica et Biophysica Acta (BBA)-Reviews on Biomembranes 2000, 1469, 159–195. [Google Scholar] [CrossRef]
- Lewis, R.N.; McElhaney, R.N. The structure and organization of phospholipid bilayers as revealed by infrared spectroscopy. Chemistry and physics of lipids 1998, 96, 9–21. [Google Scholar] [CrossRef]
- Hübner, W.; Blume, A. Interactions at the lipid–water interface. Chemistry and Physics of Lipids 1998, 96, 99–123. [Google Scholar] [CrossRef]
- Brubach, J.B.; Mermet, A.; Filabozzi, A.; Gerschel, A.; Roy, P. Signatures of the hydrogen bonding in the infrared bands of water. The Journal of chemical physics 2005, 122, 184509. [Google Scholar] [CrossRef]
- Pohle, W.; Selle, C.; Fritzsche, H.; Binder, H. Fourier transform infrared spectroscopy as a probe for the study of the hydration of lipid self-assemblies. I. Methodology and general phenomena. Biospectroscopy 1998, 4, 267–280. [Google Scholar] [CrossRef]
- Arsov, Z. Long-Range Lipid-Water Interaction as Observed by ATR-FTIR Spectroscopy. In Membrane Hydration; Springer, 2015; pp. 127–159.
- Rosa, A.S.; Disalvo, E.A.; Frias, M. Water behavior at the phase transition of phospholipid matrixes assessed by FTIR spectroscopy. The Journal of Physical Chemistry B 2020, 124, 6236–6244. [Google Scholar] [CrossRef]
- Su, Z.; Juhaniewicz-Debinska, J.; Sek, S.; Lipkowski, J. Water structure in the submembrane region of a floating lipid bilayer: The effect of an ion channel formation and the channel blocker. Langmuir 2019, 36, 409–418. [Google Scholar] [CrossRef]
- Sun, Q. The effects of dissolved hydrophobic and hydrophilic groups on water structure. Journal of Solution Chemistry 2020, 49, 1473–1484. [Google Scholar] [CrossRef]
- Kitadai, N.; Sawai, T.; Tonoue, R.; Nakashima, S.; Katsura, M.; Fukushi, K. Effects of ions on the OH stretching band of water as revealed by ATR-IR spectroscopy. Journal of solution chemistry 2014, 43, 1055–1077. [Google Scholar] [CrossRef]
- Sun, Q. Local statistical interpretation for water structure. Chemical Physics Letters 2013, 568, 90–94. [Google Scholar] [CrossRef]
- Li, D.; Zhu, Z.; Sun, D.W. Visualization of the in situ distribution of contents and hydrogen bonding states of cellular level water in apple tissues by confocal Raman microscopy. Analyst 2020, 145, 897–907. [Google Scholar] [CrossRef] [PubMed]
- Casal, H.L.; Mantsch, H.H. Polymorphic phase behaviour of phospholipid membranes studied by infrared spectroscopy. Biochimica et Biophysica Acta (BBA)-Reviews on Biomembranes 1984, 779, 381–401. [Google Scholar] [CrossRef]
- Coudert, F.X.; Vuilleumier, R.; Boutin, A. Dipole moment, hydrogen bonding and IR spectrum of confined water. ChemPhysChem 2006, 7, 2464. [Google Scholar] [CrossRef]
- Pasenkiewicz-Gierula, M.; Takaoka, Y.; Miyagawa, H.; Kitamura, K.; Kusumi, A. Hydrogen bonding of water to phosphatidylcholine in the membrane as studied by a molecular dynamics simulation: location, geometry, and lipid- lipid bridging via hydrogen-bonded water. The Journal of Physical Chemistry A 1997, 101, 3677–3691. [Google Scholar] [CrossRef]
- Levin, I.W.; Mushayakarara, E.; Bittman, R. Vibrational assignment of the sn-1 and sn-2 chain carbonyl stretching modes of membrane phospholipids. Journal of Raman Spectroscopy 1982, 13, 231–234. [Google Scholar] [CrossRef]
- Lewis, R.N.; McElhaney, R.N. The structure and organization of phospholipid bilayers as revealed by infrared spectroscopy. Chemistry and physics of lipids 1998, 96, 9–21. [Google Scholar] [CrossRef]
- Hauser, H.; Pascher, I.; Pearson, R.; Sundell, S. Preferred conformation and molecular packing of phosphatidylethanolamine and phosphatidylcholine. Biochimica et Biophysica Acta (BBA)-Reviews on Biomembranes 1981, 650, 21–51. [Google Scholar] [CrossRef]
- Pearson, R.H.; Pascher, I. The molecular structure of lecithin dihydrate. Nature 1979, 281, 499. [Google Scholar] [CrossRef] [PubMed]
- Bozdaganyan, M.E.; Lokhmatikov, A.V.; Voskoboynikova, N.; Cherepanov, D.A.; Steinhoff, H.J.; Shaitan, K.V.; Mulkidjanian, A.Y. Proton leakage across lipid bilayers: Oxygen atoms of phospholipid ester linkers align water molecules into transmembrane water wires. Biochimica et Biophysica Acta (BBA)-Bioenergetics 2019, 1860, 439–451. [Google Scholar] [CrossRef] [PubMed]
- Lee, S.; Poojari, C.S.; Maznichenko, A.; Roesel, D.; Swiderska, I.; Pohl, P.; Hub, J.S.; Roke, S. Dynamic second harmonic imaging of proton translocation through water needles in lipid membranes. Journal of the American Chemical Society 2024, 146, 19818–19827. [Google Scholar] [CrossRef] [PubMed]
- Verduci, R.; Creazzo, F.; Tavella, F.; Abate, S.; Ampelli, C.; Luber, S.; Perathoner, S.; Cassone, G.; Centi, G.; D’Angelo, G. Water Structure in the First Layers on TiO2: A Key Factor for Boosting Solar-Driven Water-Splitting Performances. Journal of the American Chemical Society 2024, 146, 18061–18073. [Google Scholar] [CrossRef]
- Tian, Y.; Song, Y.; Xia, Y.; Hong, J.; Huang, Y.; Ma, R.; You, S.; Guan, D.; Cao, D.; Zhao, M.; others. Nanoscale one-dimensional close packing of interfacial alkali ions driven by water-mediated attraction. Nature Nanotechnology 2024, 19, 479–484. [Google Scholar] [CrossRef]
- Wolkers, W.F.; Oldenhof, H.; Tang, F.; Han, J.; Bigalk, J.; Sieme, H. Factors affecting the membrane permeability barrier function of cells during preservation technologies. Langmuir 2018, 35, 7520–7528. [Google Scholar] [CrossRef]
- Perochon, E.; Lopez, A.; Tocanne, J. Polarity of lipid bilayers. A fluorescence investigation. Biochemistry 1992, 31, 7672–7682. [Google Scholar] [CrossRef]
- Chattopadhyay, A.; Mukherjee, S. Red edge excitation shift of a deeply embedded membrane probe: implications in water penetration in the bilayer. The Journal of Physical Chemistry B 1999, 103, 8180–8185. [Google Scholar] [CrossRef]
- Disalvo, E.A.; Bouchet, A.M.; Frias, M. Connected and isolated CH 2 populations in acyl chains and its relation to pockets of confined water in lipid membranes as observed by FTIR spectrometry. Biochimica et Biophysica Acta (BBA)-Biomembranes 2013, 1828, 1683–1689. [Google Scholar] [CrossRef]
- Nickels, J.D.; Katsaras, J. Water and lipid bilayers. Membrane hydration: The role of water in the structure and function of biological membranes.
- Pohl, P.; Saparov, S.M.; Pohl, E.E.; Evtodienko, V.Y.; Agapov, I.I.; Tonevitsky, A.G. Dehydration of Model Membranes Induced by Lectins from Ricinuscommunis and Viscumalbum. Biophysical journal 1998, 75, 2868–2876. [Google Scholar] [CrossRef]
- Meng, X.; Stanton, C.; Fitzgerald, G.; Daly, C.; Ross, R. Anhydrobiotics: The challenges of drying probiotic cultures. Food Chemistry 2008, 106, 1406–1416. [Google Scholar] [CrossRef]
- Scott, K.L.; Lecak, J.; Acker, J.P. Biopreservation of red blood cells: past, present, and future. Transfusion medicine reviews 2005, 19, 127–142. [Google Scholar] [CrossRef] [PubMed]
- Orlikowska-Rzeznik, H.; Krok, E.; Domanska, M.; Setny, P.; La̧gowska, A.; Chattopadhyay, M.; Piatkowski, L. Dehydration of Lipid Membranes Drives Redistribution of Cholesterol Between Lateral Domains. The Journal of Physical Chemistry Letters 2024, 15, 4515–4522. [Google Scholar] [CrossRef]
Figure 1.
Comparison of the OH stretching band shape in the extended spectral range 2600-3800 cm−1 for pure liquid water (H2O) and for DMPC multibilayers hydrated at different RH values. The spectra are normalized to the CH2 /CH3 stretching band (2800–2970 cm−1).
Figure 1.
Comparison of the OH stretching band shape in the extended spectral range 2600-3800 cm−1 for pure liquid water (H2O) and for DMPC multibilayers hydrated at different RH values. The spectra are normalized to the CH2 /CH3 stretching band (2800–2970 cm−1).
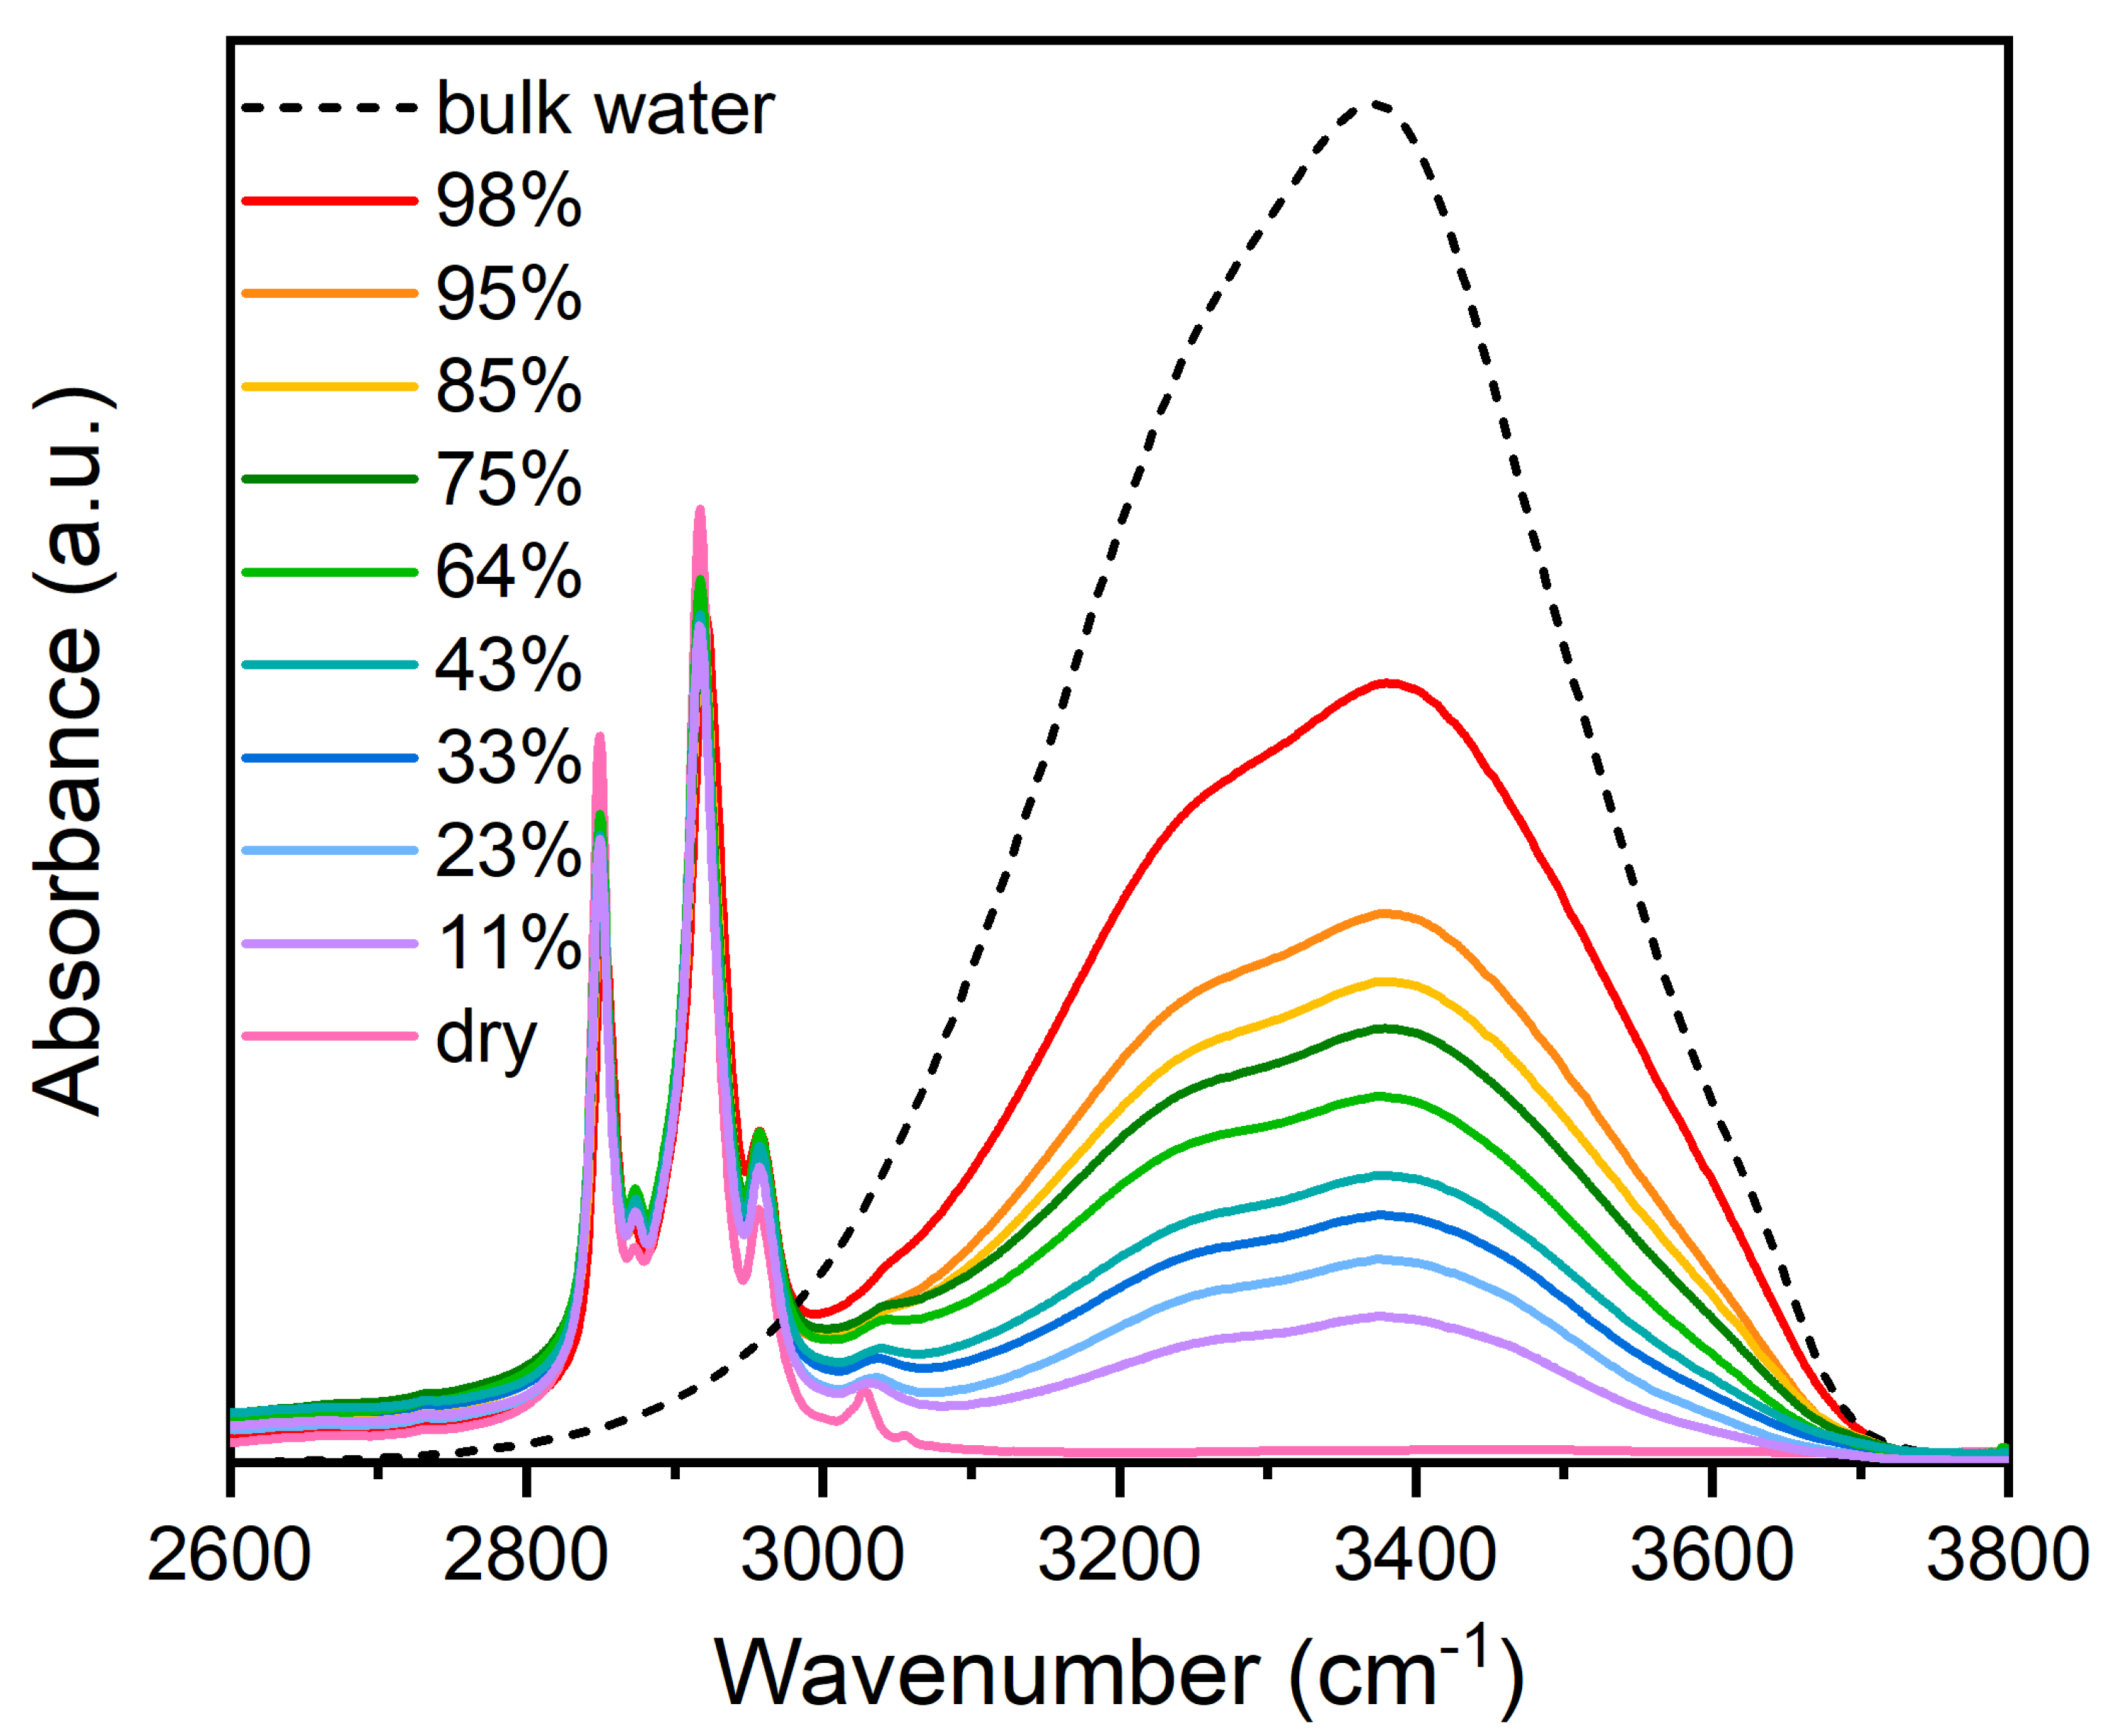
Figure 2.
Comparison of the OH stretching band profile for pure liquid water and DMPC at different RHs, after normalization to the maximum amplitude.
Figure 2.
Comparison of the OH stretching band profile for pure liquid water and DMPC at different RHs, after normalization to the maximum amplitude.
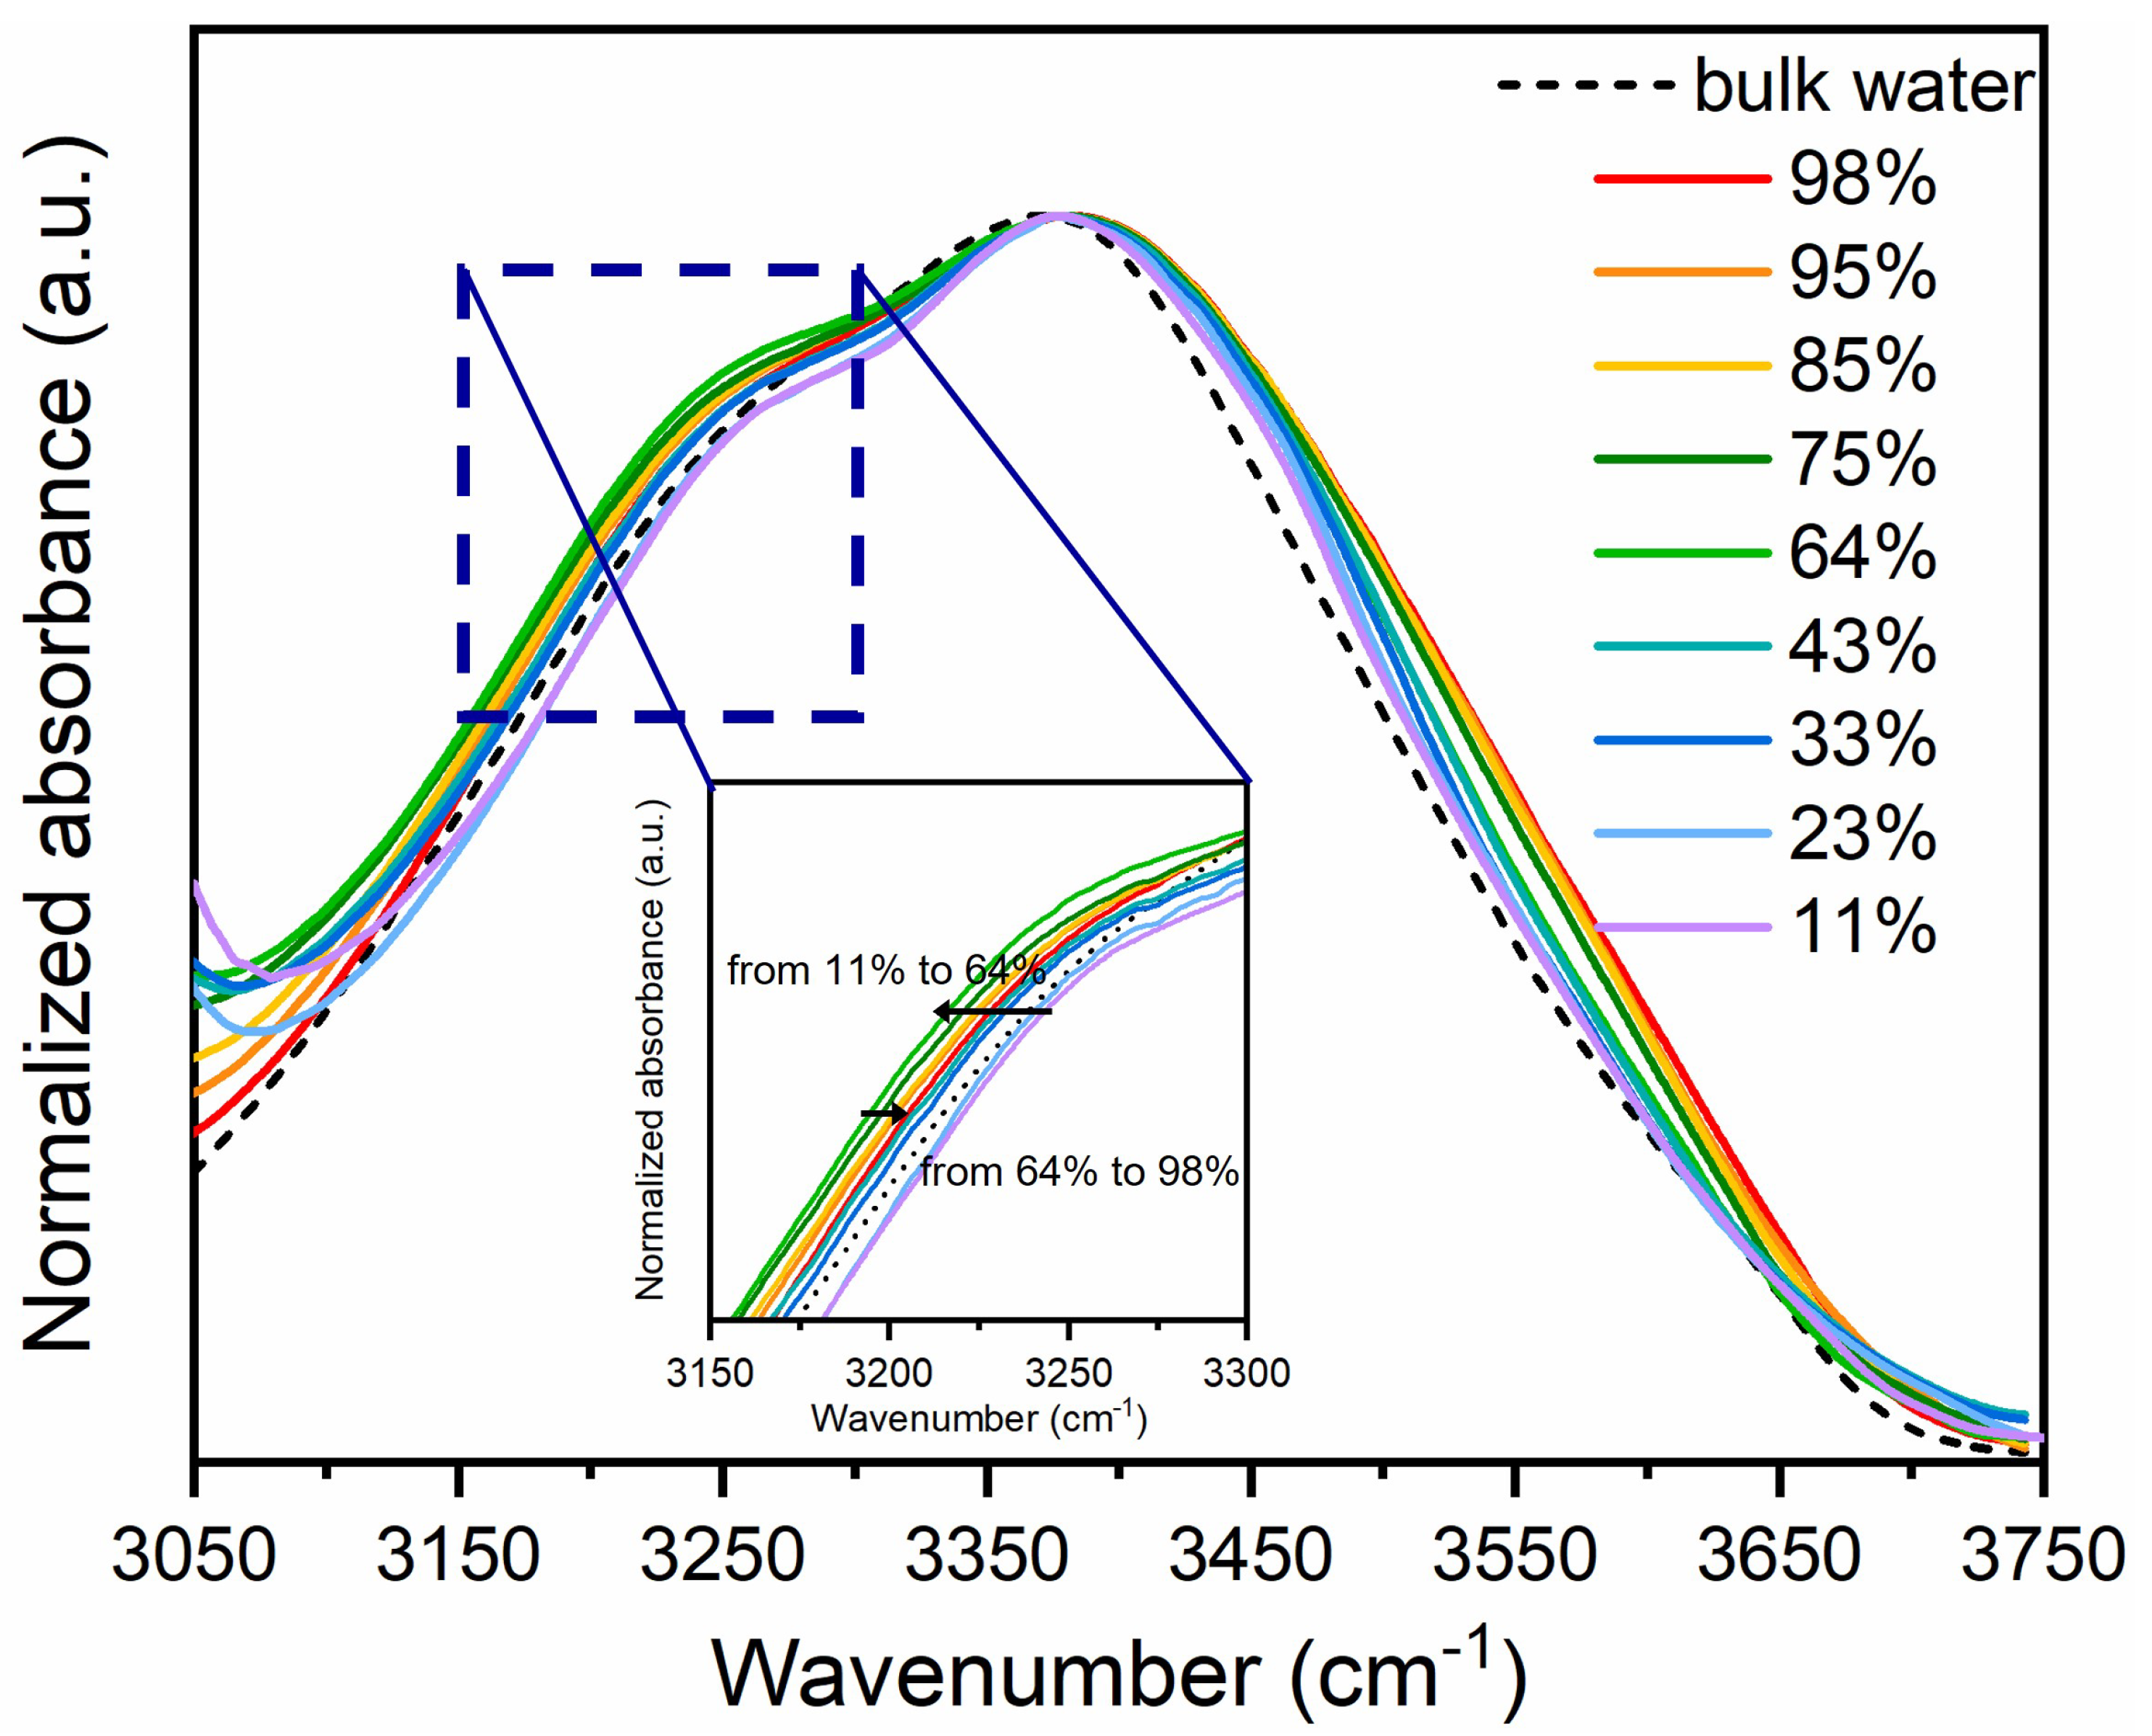
Figure 3.
(a) Schematic representation of the different hydrogen bonding structures of water and the free water molecule; and (b-d) Gaussian deconvolution of the OH stretching band of DMPC/H2O sample at three selected hydration levels.
Figure 3.
(a) Schematic representation of the different hydrogen bonding structures of water and the free water molecule; and (b-d) Gaussian deconvolution of the OH stretching band of DMPC/H2O sample at three selected hydration levels.
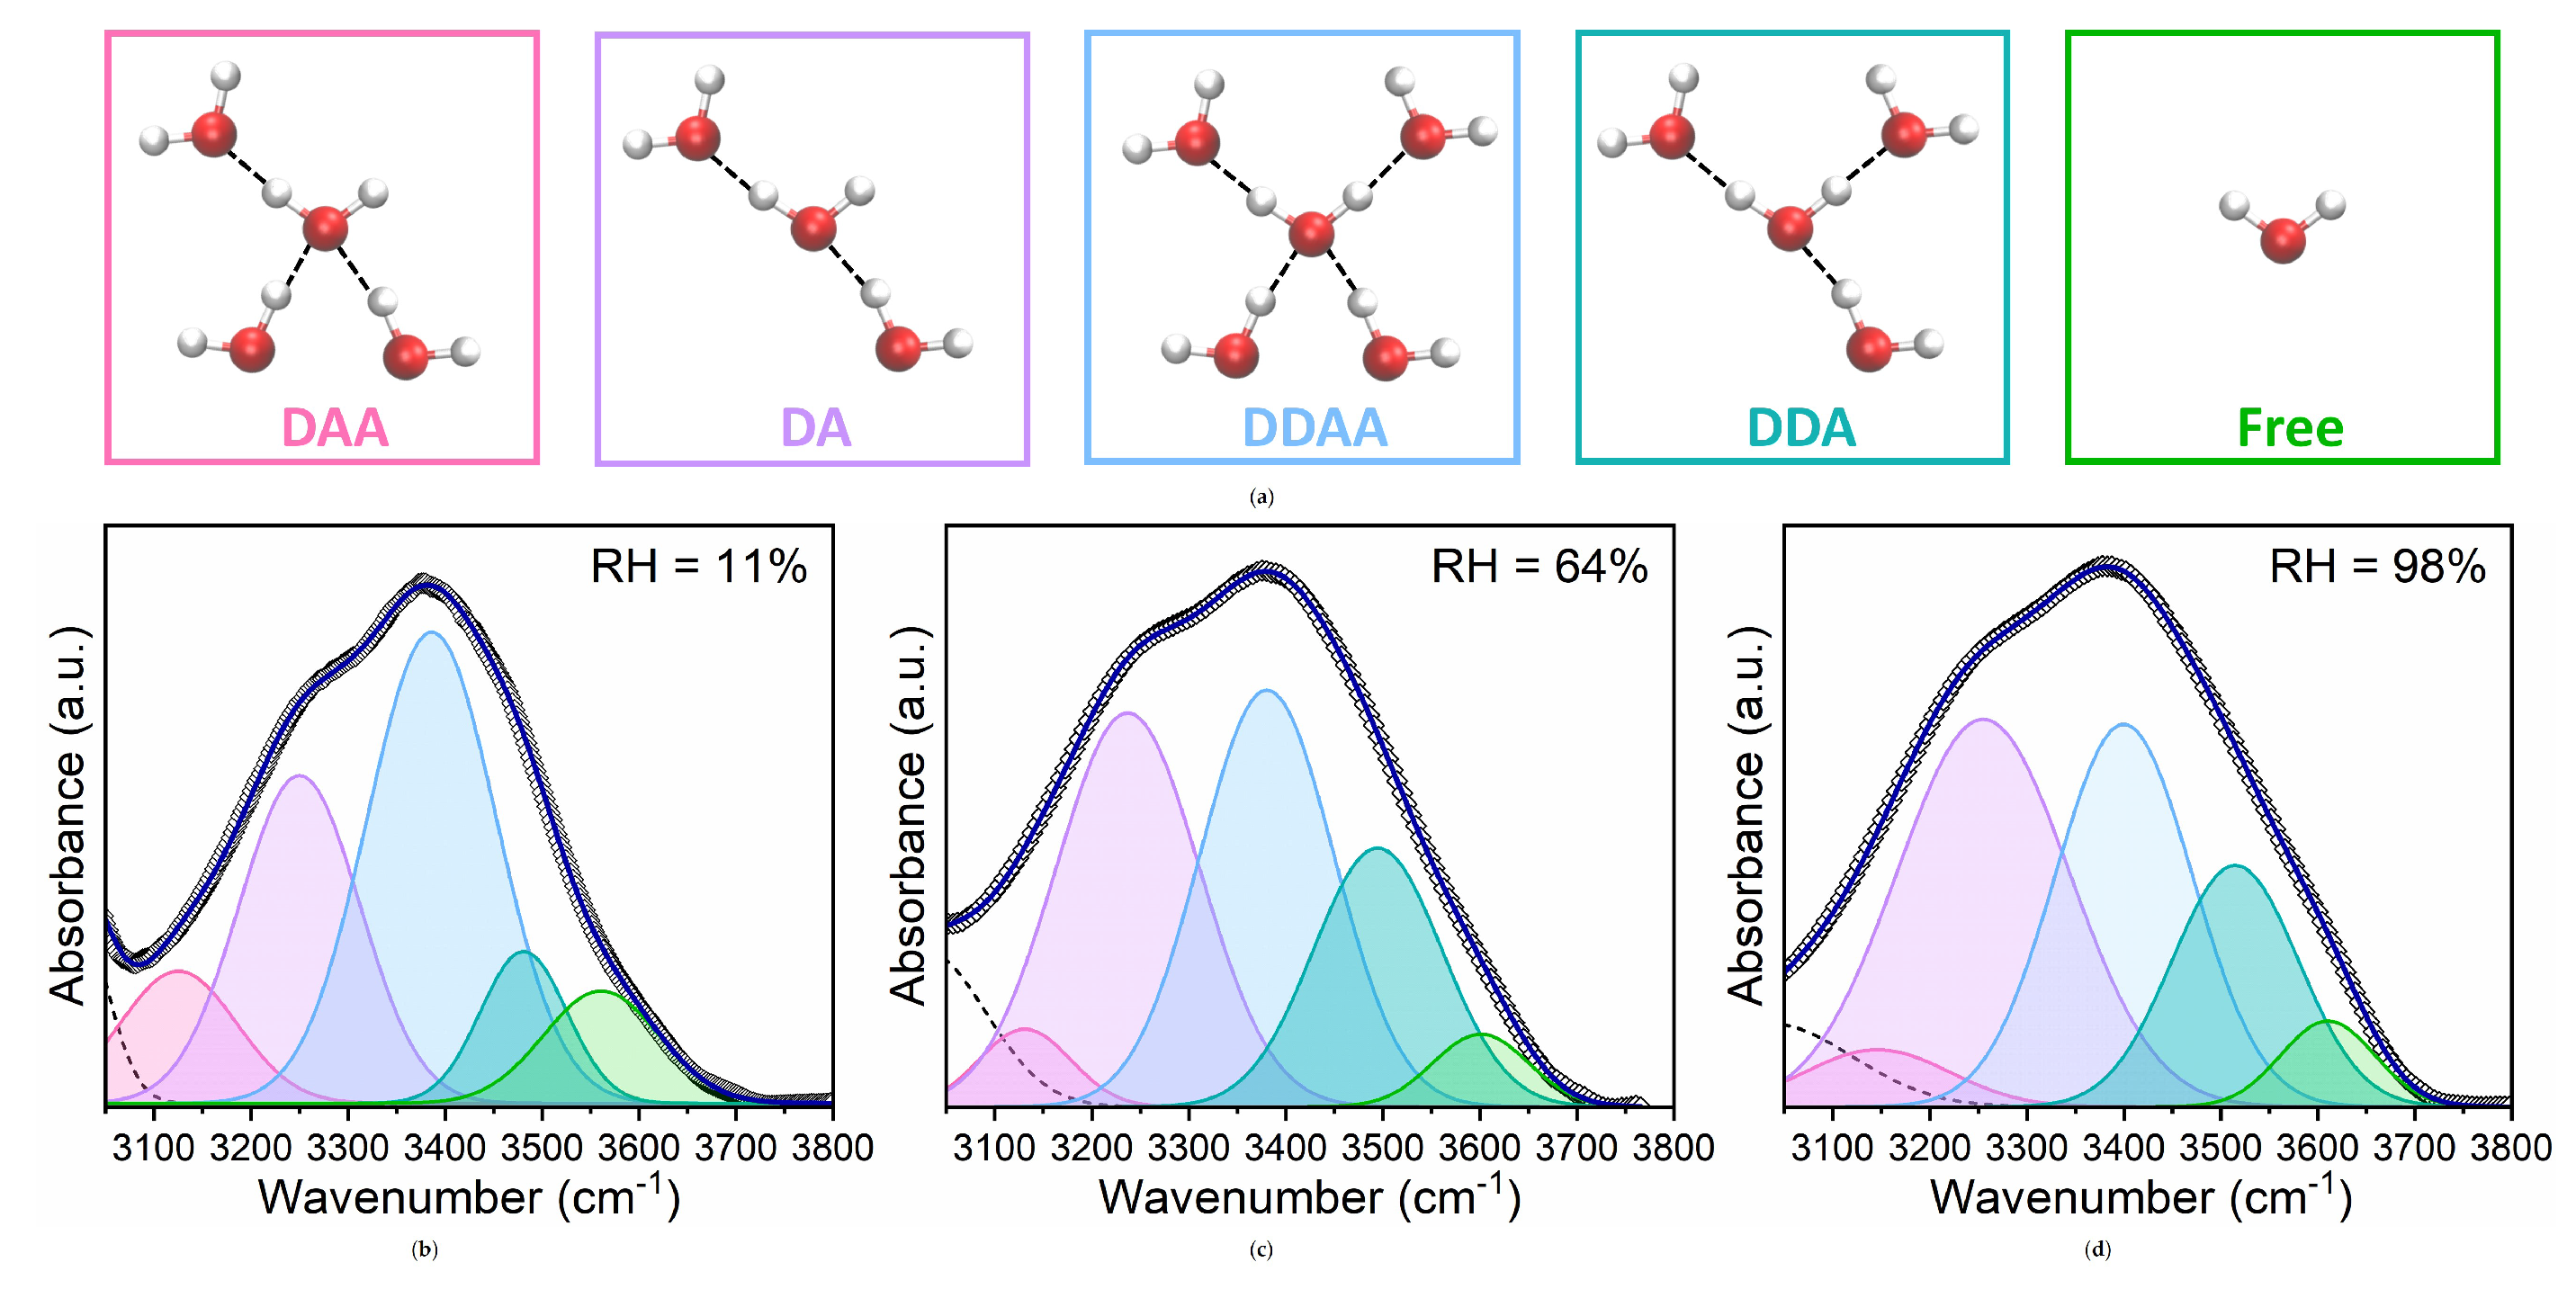
Figure 4.
(a) Frequencies and (b) relative areas of the five OH components obtained by fitting Gaussians to the experimental OH stretching band at the investigated hydration levels.
Figure 4.
(a) Frequencies and (b) relative areas of the five OH components obtained by fitting Gaussians to the experimental OH stretching band at the investigated hydration levels.
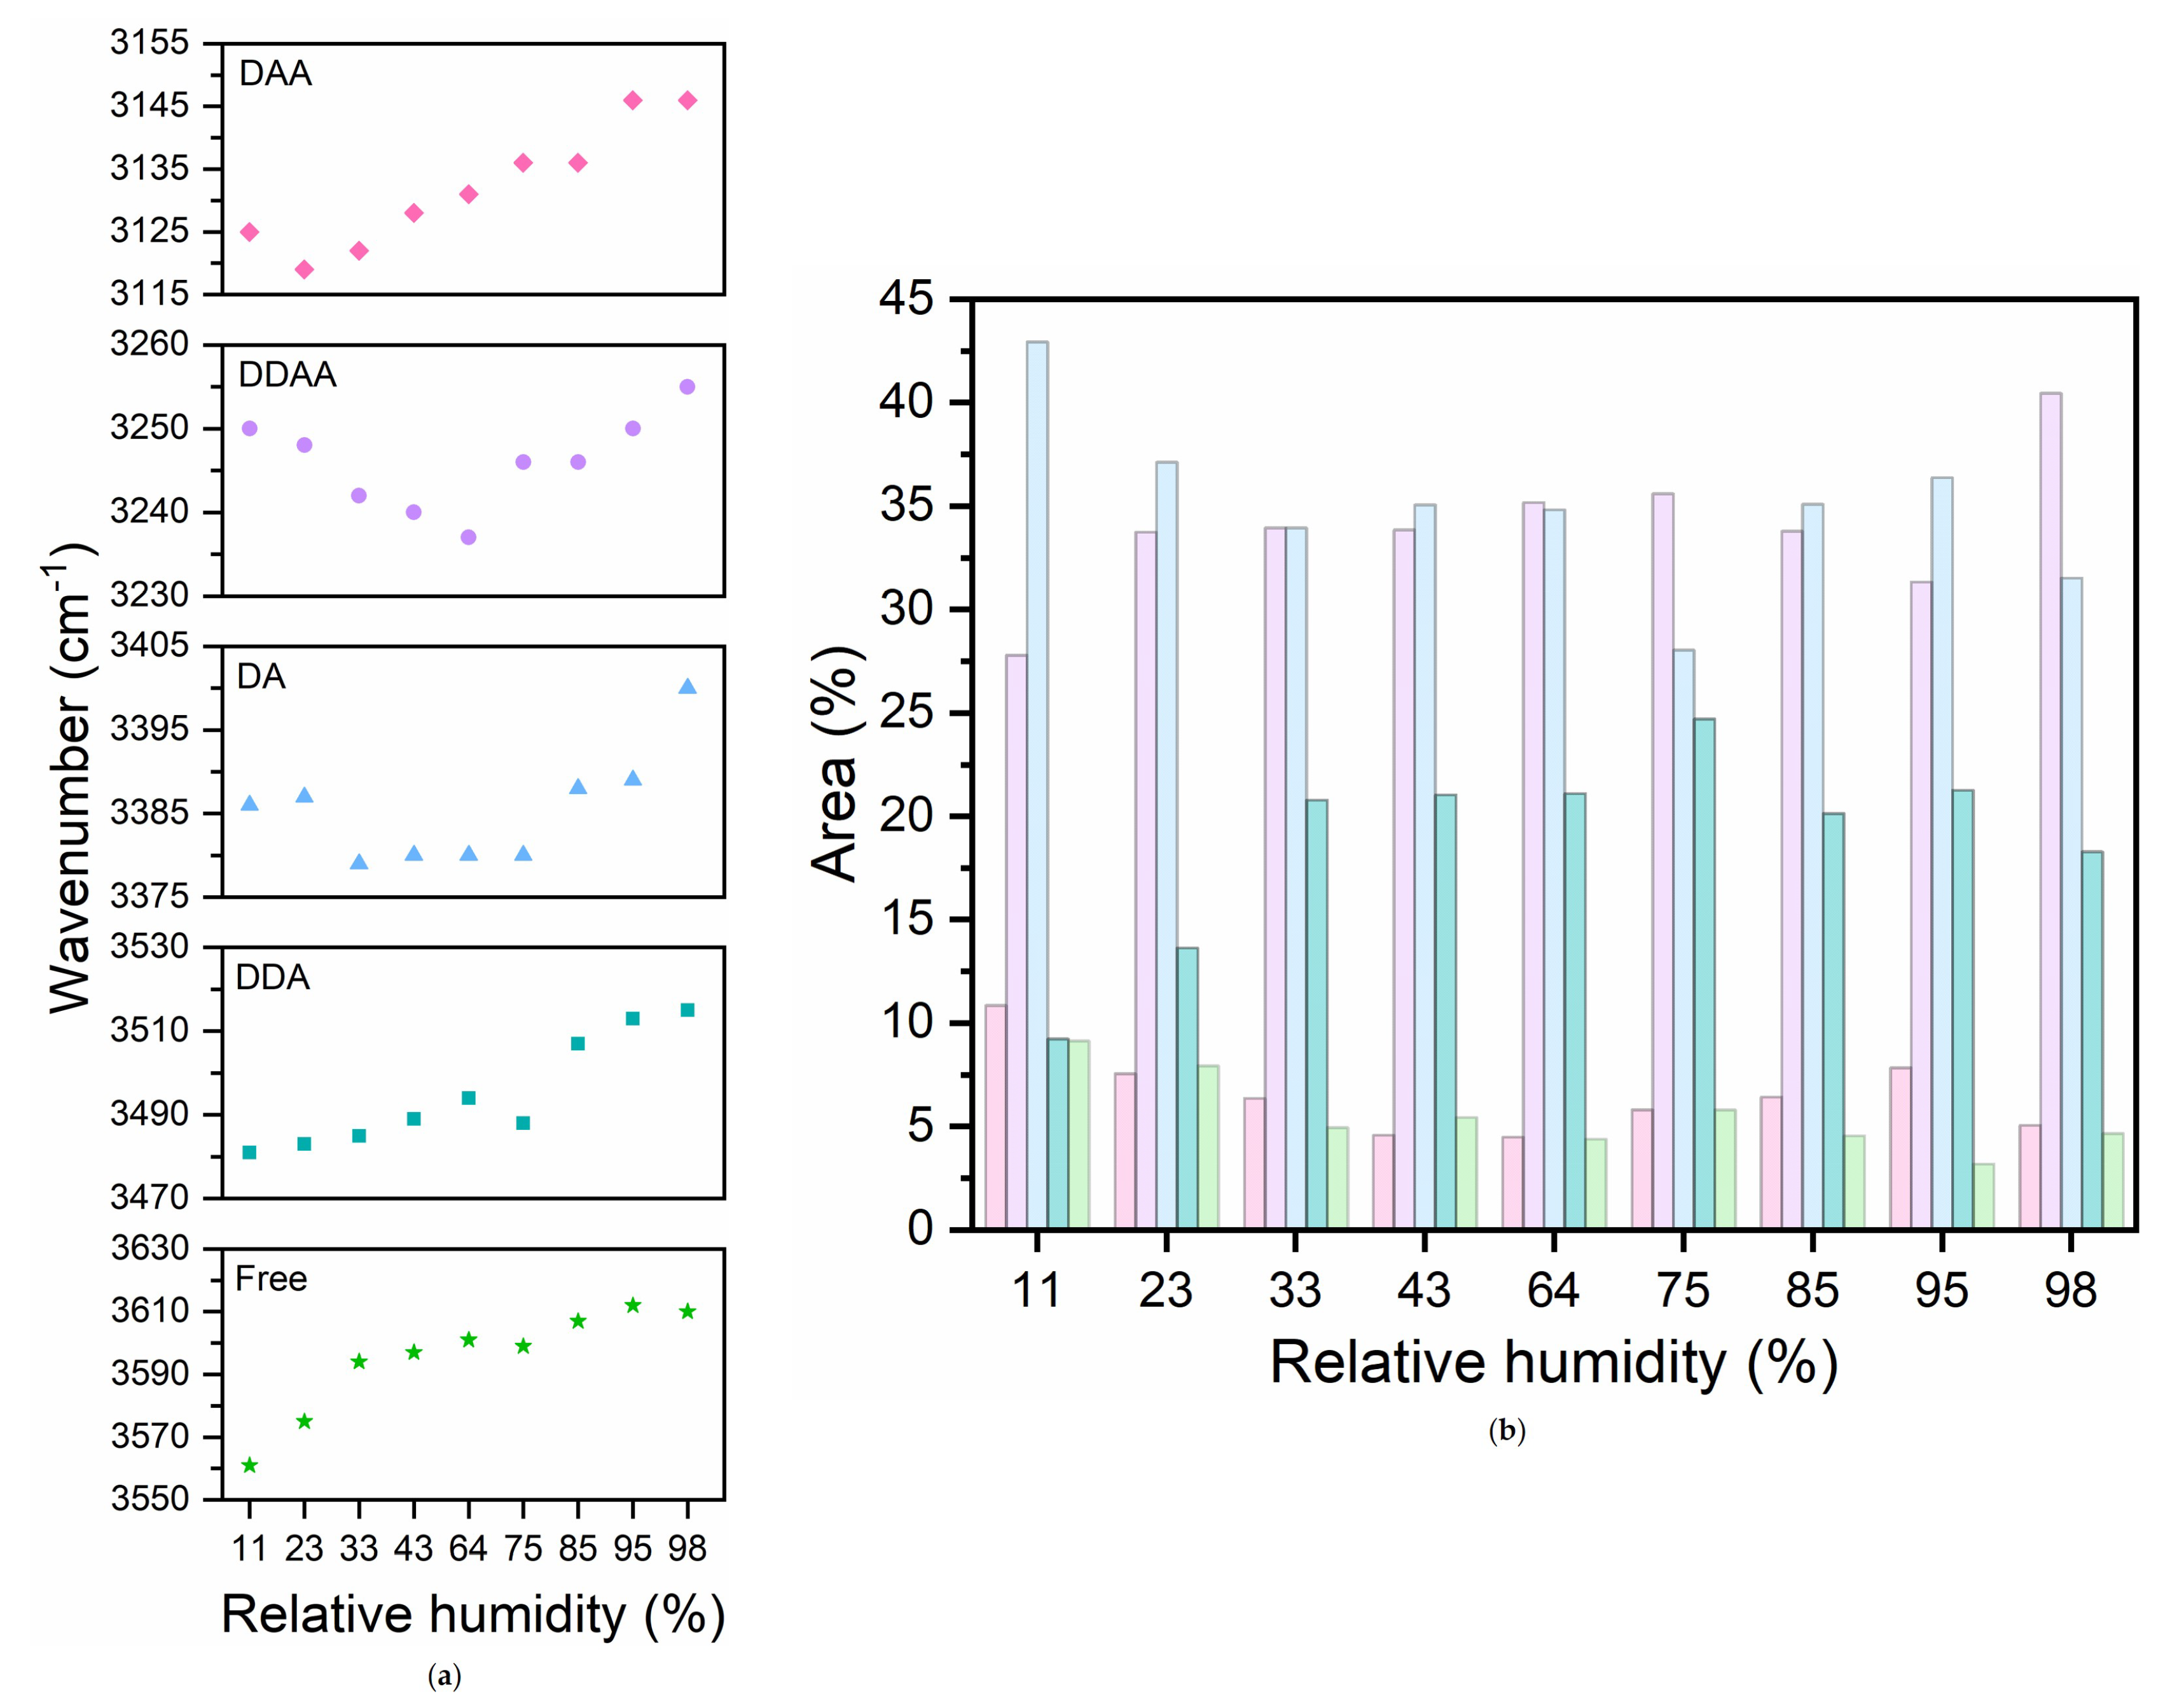
Figure 5.
(a) Number of water molecules, (), associated with the five water environments revealed by the fitting routine as a function of hydration state (the data are reported as histograms for easier visualization); (b) hydration dependence of the frequency of the PO−2 symmetric stretching band of hydrated DMPC.
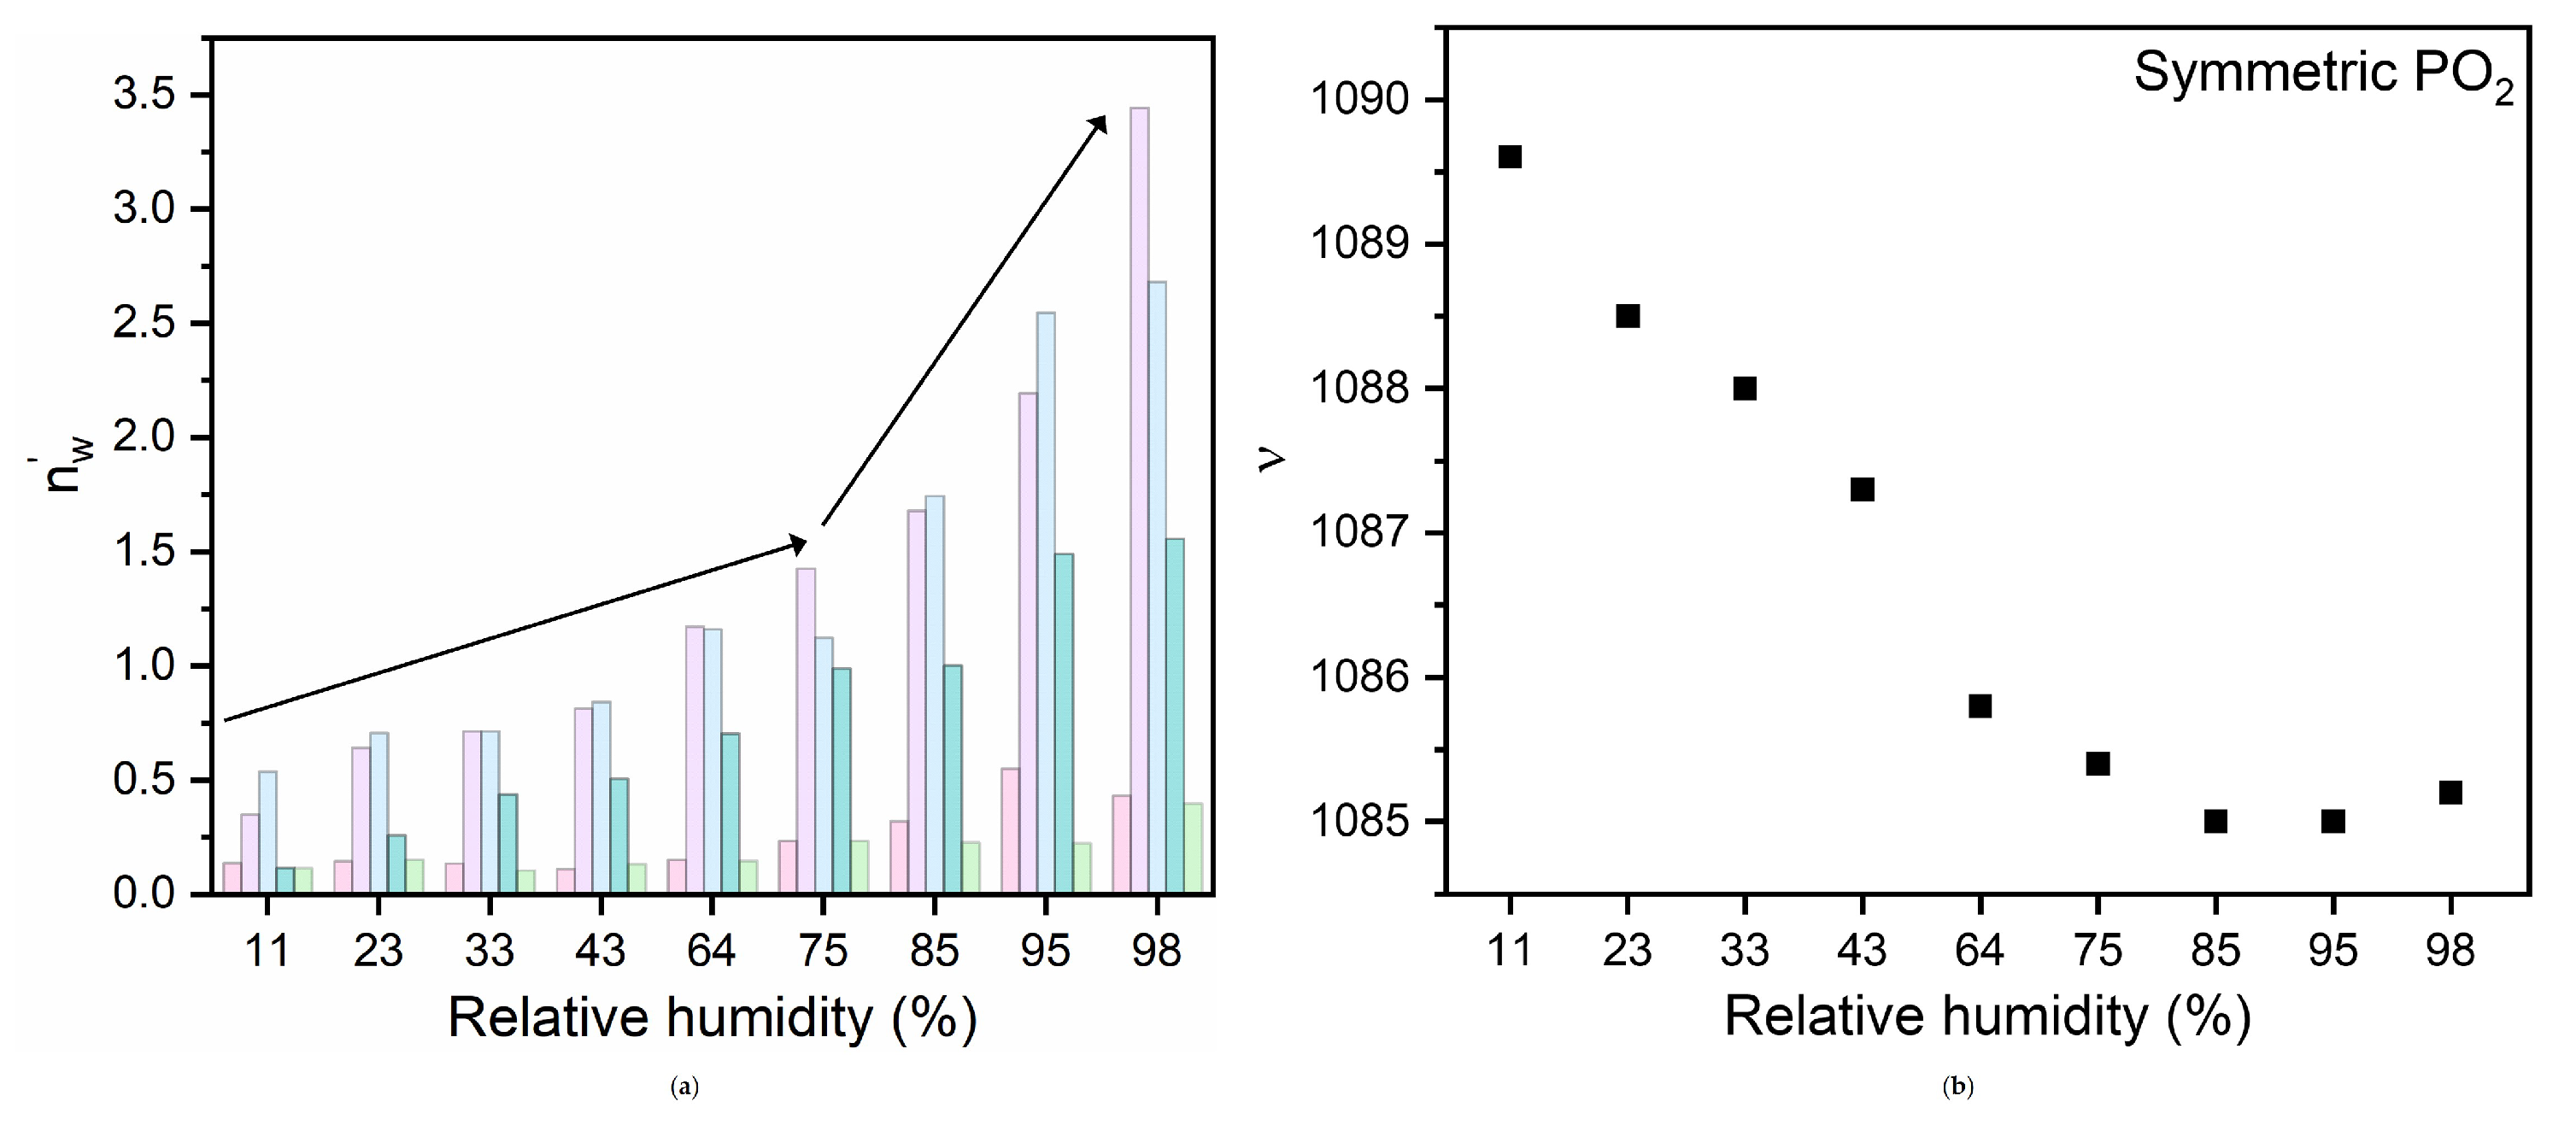
Figure 6.
((a) Deconvoluted infrared absorbance spectrum of DMPC in the 1650–1800 cm−1 region at three selected hydration levels; (b) Area percentages of the hydrogen and non-hydrogen bonded C=O groups and (c) structure of DMPC molecule.
Figure 6.
((a) Deconvoluted infrared absorbance spectrum of DMPC in the 1650–1800 cm−1 region at three selected hydration levels; (b) Area percentages of the hydrogen and non-hydrogen bonded C=O groups and (c) structure of DMPC molecule.
Disclaimer/Publisher’s Note: The statements, opinions and data contained in all publications are solely those of the individual author(s) and contributor(s) and not of MDPI and/or the editor(s). MDPI and/or the editor(s) disclaim responsibility for any injury to people or property resulting from any ideas, methods, instructions or products referred to in the content. |
© 2024 by the authors. Licensee MDPI, Basel, Switzerland. This article is an open access article distributed under the terms and conditions of the Creative Commons Attribution (CC BY) license (http://creativecommons.org/licenses/by/4.0/).
Copyright: This open access article is published under a Creative Commons CC BY 4.0 license, which permit the free download, distribution, and reuse, provided that the author and preprint are cited in any reuse.


