
Submitted:
10 December 2024
Posted:
11 December 2024
You are already at the latest version
Abstract
The entropy production in the polarization phenomena occurring in the underlimiting regime, when an electric current circulates through a single cation-exchange membrane system, has been investigated in the 3-40 °C temperature range. From the analysis of the current-voltage curves and considering the electrolyte-membrane system as a unidimensional heterogeneous system, the total entropy generation in the system has been estimated from the contribution of each part of the system. Classical polarization theory and the irreversible thermodynamics approach have been used to determine the total electric potential drop and the entropy generation, respectively, associated with the different transport mechanisms in each part of the system. The results show that part of the electric power input is dissipated as heat due to both electric migration and diffusion ion transports, while another part is converted into chemical energy stored in the saline concentration gradient. Considering the electro-membrane process as an energy conversion process, an efficiency has been defined as the ratio between stored power and electric power input. This efficiency increases as both applied electric current and temperature increase.
Keywords:
cation-exchange membrane
; limiting current
; diffusion boundary layers
; concentration polarization
; entropy production
; current-voltage curve
; saline concentration gradient
1. Introduction
Concentration polarization at the surface of an ion-exchange membrane arises from the difference between the transport numbers of an ionic species in the membrane and in the free solution. At equilibrium, without electric current or other driving forces, the bulk concentration is uniform throughout the external solution, including the diffusion boundary layers. When an electrical current is applied, ions start to migrate to and through the ion exchange membrane. Since the electrical current is carried by both cation and anions in free solutions, but only by counterions through the ion-exchange membrane, the concentrations profile across the boundary layer gives rise to a diffusional flux of ions to the membrane surface to balance the unequal migration fluxes; that is, polarization occurs. This effect is very important in applications involving ion-exchange membranes in electrolyte media, such as electrodialysis [1]. It is an essential limiting factor in the performance of electrical-driven processes in general. Therefore, these phenomena have been widely studied in literature [1,2,3,4,5,6,7,8,9,10,11,12,13,14,15,16,17,18,19,20].
Usually, polarization phenomena occurring with ion exchange membranes are studied using models based on the Nerst-Planck transport equation [3,4,5,7,9,10,11,12,14,15,17,18,19,20]. More recent works mainly focus on phenomena associated with overlimiting transport [4,7,11,13,14,15,20].
However, studies examining these systems from a thermodynamics point of view are rarer. Chehayeb and Lienhard [21] analyzed the entropy generation in electrodialysis only considering the electric driving force. Generous et al. [22] also studied entropy generation of electrodialysis desalination using multi-component solutions. Ślezak et al. [6] used the non-equilibrium thermodynamics-based Kedem-Katchalsky equations to describe the influence of the concentration boundary layer on membrane potential in a single membrane system. Ślezak et al. [23] used the same formalism to evaluate S-entropy production in a single membrane system in concentration polarization conditions. But in both cases, only a concentration gradient was initially imposed in the system.
Non-equilibrium thermodynamics gives a unified method to study coupled transport processes [24]. Kjelstrup and Bedeaux [25] have encouraged the use of the non-equilibrium thermodynamics formalisms to describe transport in heterogeneous media. It can describe coupled transport processes, such as those occurring under concentration polarization conditions. Entropy production in a system can be used to assess how energy resources are exploited within the system. Non equilibrium thermodynamics formalism has been applied to study fuel cells [26], thermoelectric cells [27], or reverse electrodialysis processes [28]. The work of Manganelly et al. [29] showed that entropy production minimization can be used as a method to optimize the use of energy resources in a system.
However, in most cases, the formalism of the non-equilibrium thermodynamics is used to determine relationships between flows and forces present in the system rather than as a diagnosis tool for analysing energy system.
The purpose of this work is to analyze entropy production in an electrically driven process in a single membrane system under polarization concentration conditions in the underlimiting regime considering the system as a heterogeneous medium. To this end, we combine classical polarization theory and irreversible thermodynamics formalism.
2. Fundamentals
2.1. The system
Figure 1 (above) illustrates the system under study. It consists of a cation-exchange membrane separating two identical 1:1 electrolyte solutions of bulk concentration c0 maintained at the same temperature and hydrostatic pressure. In this configuration, a constant electric current passes through the membrane system. As it is well known, due to the different mobilities of the counterions in membrane and in free solution phases, a current-induced concentration gradient is established within the solution and perpendicular to the membrane surface. The Nernst films model [30] is often used to analyze this phenomenon. This model assumes the formation of polarization layers adjoining the membrane at the two surfaces. Within these layers, termed diffusion boundary layers, convection is absent, and mass transfer is governed by diffusion and migration, resulting in a linear concentration profile (Figure 1, bottom) under steady-state conditions. The Nernst model overlooks the impact of convection on transport. Levich [31] refined this model, demonstrating that convective transport within the diffusion layers results in a smooth monotonic concentration profile that asymptotically approaches the bulk concentration. For this study, we adopt the Nernst model for simplicity.
This phenomenon, termed polarization concentration, significantly affects transport properties, particularly the cell voltage drop, Δϕ, between bathing solutions on either side of the membrane.
The transport processes considered occur along the horizontal axis of the cell, referred to as the x-axis. Fluxes through the membrane are treated as scalar component of the vectorial flux in this direction. The membrane surfaces can be assumed to be in local equilibrium. The electric current is applied via reversible Ag|AgCl electrodes and we also use reversible Ag|AgCl electrodes for measuring the electric potential difference. Treating the system as a multi-layer system, the total voltage drop comprises contributions of the different parts of the system: external electric circuit, electrodes, bulk solution, boundary solution layers, and membrane.
In the bulk solution, far from the diffusion boundary layers, ions transport occurs solely by migration, as there are no concentration gradients perpendicular to the membrane surface.
Within the highly permselective cation-exchange membrane, due to the anion exclusion, there is no significant concentration gradient inside it. Anions are more or less completely excluded from the membrane and their flux by migration and diffusion in opposite directions is compared to that of the cations generally small. Thus, it can be assumed to a first approximation, that the transport of cations through the highly permselective membrane occur primarily via migration driven by the electrical potential gradient [32].
In the diffusion boundary layers, ions are transported through a combination of migration and diffusion mechanisms (Figure 1, bottom). Reversible electrodes in the system are maintained under identical conditions of concentration, temperature and hydrostatic pressure.
2.2. The current-voltage curve of a single membrane system
According to the classical theory of concentration polarization [30], the electric current, I, should increase linearly with voltage, Δϕ, at low voltages, and then rises more slowly, eventually reaching a limiting value. This limiting value, termed limiting current, IL, would correspond to the value of the current at which the concentration of the solution becomes zero at the membrane surface. At this stage, diffusion is unable to supply enough ions to compensate for the migration flux through the membrane, resulting in an ion depletion at this membrane surface. In a real system, however, the current-voltage curve exhibits a characteristic shape with three regions (Figure 2) clearly distinguised. After the linear relationship (I), the curve reaches a region in which the current remains nearly constant despite increasing voltage, region known as plateau region (II). Finally, a new region (III) of current increasing with voltage is observed.
It indicates that concentration of counterions doesn´t become zero in the membrane surface due to the activation of overlimiting transport mechanisms, such as dissociation of water, gravitational convection and electroconvection, which allow the increase in ionic transfer through the membrane [11,14]. Our study focuses on the underliming regime at currents below the limiting value.
Using the classical theory of concentration polarization, the Peers’ equation [32] is obtained which allows to estimate the value of the limiting current, IL, if the solute concentration, c0, the difusion coeficient of solute in water, D, the boundary layer thickness, δ, and the counter-ion transport numbers in the membrane ,, and in free solution, , are known:
where F is the Farday constant and A is the membrane effective area.
For currents I< IL, the concentrations at the dilute (c1) and concentrated (c2) solutions in the membrane/solution interfaces can be expressed as:
In this approach, an equation can be derived for the electric potential difference between two fixed points placed at both sides of membrane in the corresponding bulk solution when the stationary state has been reached after the injection of an electric current in the membrane system. This equation, obtained in a previous work [5], is expressed by:
where and R0 indicates the total ohmic resistance of the system before the polariztion layers are formed. This expression has two contributions, one due to the polarization potential stablished through the membrane system due to the concentration gradient, and other due to the change of the ohmic resistance of the system as a consequence of the formation of the layer.
Equation [3] is only applicable to electric currents such as I< IL. It predices that the electric potential difference tends to infinity as I becomes IL and the polarization potential as well as the resistance of the depletion layer tend to infinity in the Nertnst model.
2.3. The non-equilibrium thermodynamics formalism
The system in Figure 1 can be analyzed with the non-equilibrium thermodynamic formalism. As an isothermal electrochemical cell, it exhibits coupled transport of mass and charge. It consists of different parts which will contribute to the total entropy production. In the considered system, the only external force applied is an electric potential gradient.
According to the irreversible thermodynamics approach, for a homogeneous phase, the change in the entropy in a volume element can be expressed as a function of the fluxes, Ji, and forced, Xi, existing in the system as:
where n is the number of independent fluxes. Irreversible thermodynamics assumes linear relationships between fluxes and forces, and, in general:
where Lij are the linear phenomenological coefficients. It is assumed that the linear relations are locally valid.
The total entropy production is obtained by integrating Equation (4) over the entire volume V of the system considered:
Considering one-dimensional transport in the normal direction (x), the entropy production for the whole path, with a cross-section A, Equation (6) can be written as:
The wasted or lost work per unit time is the energy dissipated as heat in the surrounding and, in the isothermal system, can be expressed as [26]:
Systems with membranes are heterogeneous systems, consisting of bulk and surface parts, all of them with entropy production: electrodes surfaces, bulk solution, polarization layers and membrane. The total entropy production between two fixed points placed at both sides of the membrane in the corresponding bulk solution when the stationary state is reached can be calculated by applying Equation (7) to the different homogeneous parts of the system placed between these two points.
In our isothermal and isobaric system, only one force is externally applied, the electric potential gradient. However, as previously described, the polarization concentration effects caused by the pass of the electric current will result in a concentration gradient and coupled transports of mass and charge will also occur in the cell.
The local entropy production will be:
where Ji and J are, respectively, mass and electric charge flux densities, μj,T is the chemical potential at isothermal conditions of j component, and r and ΔrG are, respectively, the velocity and the reaction Gibbs energy of reaction r. If there are no reactions present in the system, the last term in Equation (9) is null.
Coupling between mass and electric charge fluxes can occur in the system. According to Equation (5), if there is only one reaction occurring in the system, the flux equations can be written as:
In the studied case, connecting leads and reversible electrodes are at the same temperature, pressure and concentration. The only reaction presented in the system is the reversible reaction corresponding to the electrode surfaces required to change charge carrier from chloride in solution to electron in the external circuit. Thus, the main contribution to the entropy production will be due to the electrolyte solution, including boundary diffusion layers, and the membrane.
In analyzing membrane processes, it is more convenient to transform the previous equation into an expression involving the flux of neutral salt, Js, more than the induvial ion fluxes [33]. We choose the membrane as the natural frame of reference for the fluxes. Neglecting the water flux, we have two fluxes (salt and charge) and two involved forces (electric and chemical potential gradients), and Equation (9) can be written as a function of the salt flux as:
and Equation (10) as:
where we have dropped subscript T in the chemical potential gradient since the system is isothermal.
Introducing the salt transference coefficient, ts, defined as the ratio of the salt flux and the electric current density at uniform composition, and the salt diffusion coefficient from Fick Law at zero current, D, the second expression in Equation (12) allows to obtain a relation between both fluxes:
where the relation:
have been used for relating the salt chemical potential and concentration, and mean activities of ions of value 1 are considered. For Ag|AgCl electrodes reversible to the ion Cl-, the salt transference number is equal to the transport number of the cation t+, with:
where t- is the anion transport number.
3. Materials and Methods
The membrane used in this work was a commercial Nafion 117 membrane, a homogenous highly selective cation-exchange membrane manufactured by Dupont Inc. According to the data provided by the manufacturer, this membrane has a nominal thickness of 183 μm, and IEC of 0.94 meq/g.
Sodium chloride (pro analysis-grade) and deionized, doubly distilled water were used to prepare the electrolyte solutions.
A sketch of the experimental setup used for measuring current-voltage curves, already described elsewhere [5], is shown in Figure 3. The membrane was vertically placed separating two glass chambers containing two NaCl solutions of the same concentration 5 molm-3. The exposed membrane surface area was 9.04x10⁻⁴ m2. Both chambers were maintained at the same pressure, and all the experiments were carried out under isothermal conditions by immersing the cell in a thermostatic bath.
The solutions in the chambers were under natural convection conditions, without any stirring. A constant electric current was applied by means of a large active surface Ag|AgCl electrodes, and Ag|AgCl probes electrodes were positioned on either side of the membrane to record the electric potential difference between them.
Current-voltage curves were obtained by measuring the electric potential difference at varying current levels. This process was repeated at different temperatures ranging from 3 to 40oC.
At each temperature, the electric conductivity of the solution was measured with a conductivity meter JENCO Model 1671. Closed vessels containing the solution were immersed in a thermal bath at the selected temperature. Once the thermal equilibrium was reached, the conductivity of the solutions was measured using a suitable conductivity probe. The accuracy of the conductivity measurements was 1 μScm−1.
4. Results and discussion
4.1. Properties of the electrolyte solution
The electrical conductivity,κ, of the electrolyte solution has been measured at each temperature. The results are shown in Table 1. From these values, the diffusion coefficient, D, at each temperature was calculated using the following relationship [34]:
where Λ is the specific conductance, defined by the expression:
and c is the molar concentration of the electrolyte. The results obtained are also shown in Table 1. Transport number of Na+ at different temperatures have been estimated using information from literature [35,36].
The data in Table 1 indicate that increasing temperature enhances the transport properties of the solution phase.
4.2. Current-voltage curves
Current-voltage curves were measured at different temperatures. They are presented in Figure 4(a).
At temperatures below 30oC, the obtained curves exhibit the typical profile for cation-exchange membranes immersed in electrolyte solutions, showing the three usual characteristic regions described earlier. Visual inspection of Figure 4(a) reveals that the second region, corresponding to the plateau, occurs at greater current and becomes less pronounced as temperature increases. Really, for 30 and 40oC, a defined plateau is no longer clearly appreciated.
In the linear region (I) and in the approximately linear segment in region (III), the trend observed with increasing temperature may be attributed to a reduction in the system electric resistance. The electric conductivity of an electrolyte solution increases with temperature [34,35,36], as does the ion transport number and the salt diffusion coefficient, facilitating ion transport. The electric conductivity of Nafion 117 is also temperature dependent. Results in literature have shown that the electric conductivity of the H+-form Nafion membrane is not a monotonic function of the temperature. Initially it increases with temperature, reaches a maximum value of about 60oC and then decreases [37] In Na+-form, an Arrhenius relationship has been observed for the electric conductivity with temperature [38].
In region II, the plateau width decreases with increasing temperature, and it becomes less defined, eventually disappearing entirely at 25 and 30oC. At these temperatures, what is observed is rather an inflection on the current voltage curve. As the temperature increase facilitates ion transport in solution, it may indicate that cation concentration drop on the diluted surface of the membrane decreases with temperature, reducing the voltage drop, also affecting the different mechanisms involved in the overlimiting regime. Further studies are underway to better understand this behavior.
4.2.1. Determination of the limiting current value
4.2.2. Determination of R0 and counterion transport number in the membrane
.
Using the measured limiting currents, the experimental data (Δϕ, I) in region I were fitted to Equation (3) using a minimization χ2 method. It allowed to estimate parameters R0 and at each temperature. Results are shown in Table 2. As expected, R0 decreases with increasing temperature, likely due to the enhanced electrical conductivity of the electrolyte. As the electrical conductivity of Nafion membranes is high [39], the greater contribution to R0 must be due to the electrolyte contribution. The results indicate that the Na+ transport number in the membrane hardly varies with temperature.
Using data from Table 1 and Table 2, the thickness of the boundary diffusion layers at each temperature was estimated using Peer´s equation. Results are also shown in Table 2. The values obtained agree with typical values given in the literature for similar systems [8,10]. A slight increase in layers thickness was observed for temperatures above 20oC.
4.3. Entropy production
We apply Equations (7) and (11) to estimate the entropy production in each part of the system. The total entropy production will be given by:
In the bulk solutions, where no chemical potential gradient exists, ions move solely by migration. From Equation (11), the dissipation function, representing the local energy dissipated as heat due to irreversible processes, is expressed as:
From Equation (7), and assuming steady-state conditions with constant fluxes, the entropy production in the bulk solution is given by:
According to Figure 1 and the second expression in Equation (12), the electric potential difference across the bulk phase is given by:
where dbulk is the thickness of the two bulk phases in the cell. Considering the electric conductivity for a uniform distribution of salt:
the total heat dissipation in the bulk solution can be expressed in terms of the total electric resistance in the bulk phase, Rbulk, and the electric current circulating along the system:
where I=J.A. In the boundary diffusion layers, ions are transported by both migration and diffusion. Consequently, both terms in Equation (11) contribute to the entropy production. Using Equations (13) and (14), the total heat dissipation in layers 1 and 2 can be expressed as:
where the electric potential difference in the boundary diffusion layers, and can be written as [16,33]:
and are the electric conductivity of dilute and concentrate layers, respectively, and the same thickness has been considerered for both layers. Combining Equations (24) and (25), and Equation (22) for the layers conductivity, the total heat dissipation in both layers can be written as:
where Rlayers indicates the ohmic resistance of both layers.
Entropy production within the membrane was evaluated considering its highly selectivity. In this case, cations move predominantly due to migration under the influence of the electric potential gradient. Neglectig water flux, the expression for estimating the heat dissipation inside the membrane is similar to Equation (19) used for determining the bulk solution contribution:
but in this case, there are two contribution in the electric potential difference, one is the ohmic voltage drop across the membrane, and the other is the membrane potential [30]. Thus:
where κm is the membrane electric conductivity. Combining Equations (27) and (28), and using Equation (22) for the membrane conductivity, the total heat dissipation within membrane is given by:
The total heat dissipation is obtained by adding all contributions indicated in Equations (23), (26) and (29), resulting in:
Equation (30) indicates that the total dissipation of heat produced between the two reference electrodes placed in the system has a contribution of the ohmic resistances of the different parts of the system, but there is also a contribution of the diffusion transport in the solution due to the presence of the boundary diffusion layers, which contribute to the total electric potential drop with both ohmic and non ohmic phenomena.
We can estimate the total ohmic resistance of the system using the model described in Section 2.2. According to this model, Rtotal can be expressed as the sum of the total ohmic system resistance in absence of polarization layers, R0, and the ohmic resistance change due to the formation of these layers, ΔR, expressed by:
Using Equations (30) and (31), the total entropy production in the system can be estimated by the equation:
Figure 5 shows the values obtained for the total entropy production using Equation (32) and the data in Table 1 as a function of the current density at each temperature.
Visual inspection of Figure 5 shows that the total entropy production increases as the applied electric current increases and decreases as the system temperature increases.
4.4. Efficiency analysis
Equation (30) expresses the heat dissipation power, , due to the irreversible processes occurring in the system. It is taken from the total electric power input. The other part of the power input is converted into chemical energy stored in the saline gradient created in the boundary diffusion layers. Thus, we can interpret the concentration polarization phenomenon in the system as an energy conversion process, and entropy generation can be used to analyze the energy efficiency of the process. The situation is similar to that in an electrodialysis process, where an electric current is passed through cation and anion exchange membranes placed in alternating order to create a concentration gradient [21].
From the model described in Section 2.2, we can write the electrical power input,, as:
Combining Equations (3), (32) and (33), the useful electric power is given by:
Equation (34) expresses that the power stored in the salt gradient will be maximum for an ideal selective membrane with =1. The dissipated power can also be calculated from:
where =IΔϕ is the experimental power input. In the absence of membrane, there would be no polarization layers, and the electric power input would be dissipated as Joule heat.
Figure 6 shows the stored and dissipated powers calculated from Equations (34) and (35), experimental current-voltage values, and the data given in Table 1.
As can be observed, both stored and dissipated powers increase with the electric current and decrease with temperature.
System efficiency was evaluated as the ratio of store to total power:
The efficiency values are shown in Figure 7 as a function of Ir=I/IL at each temperature. Efficiency increases as the electric current input approaches the corresponding limit value, maybe due to an increase in the concentration difference established between both sides of the membrane. Although it increases both dissipated and stored powers, an increase in temperature generally results in better process efficiency.
It should be noted that the model does not consider the contribution of water transport to entropy production. However, it is expected that this contribution will only be relevant at low flow rates, as the relative importance of the osmotic contribution is reduced.
The model used is only valid for currents below the limiting value and, as the applied current approaches this limiting value, other mechanisms begin to emerge that have not been considered in this study. These mechanisms may contribute to a reduction in the thickness of the boundary diffusion layer, and thus may strongly influence the overall entropy production of the system. The analysis of entropy production would be a useful tool to study dissipation effects in the overlimiting regime.
5. Conclusions
The entropy production in the polarization phenomena occurring in the underlimiting regime, when an electric current circulates through a single cation-exchange membrane system, has been estimated and its variation with temperature has been studied.
To this purpose, classical polarization theory and irreversible thermodynamics formalism were used to analyse experimental the current-voltage curves of the system at different temperatures.
The results obtained reveal that the total entropy production increases as the applied electric current increases and decreases as the system temperature increases.
The total dissipation of heat in the system has a contribution from the ohmic resistances of the different parts of the system, but there is also a contribution from the diffusion transport in the solution due to the presence of the boundary diffusion layers.
Considering the process as a conversion of electric work input into chemical energy stored in the saline gradient, the system efficiency has been evaluated as the ratio of stored to total power input. The results obtained show that efficiency increases with increasing electric current and temperature.
Author Contributions
Conceptualization, J.C.M., V.M.B. and S.M.; methodology, J.C.M. and V.M.B.; software, J.C.M.; validation, J.C. M., V.M.B., and S.M.; formal analysis, J.C.M.; investigation, J.C. M., V.M.B. and S.M.; resources, V.M.B.; data curation, J.C.M.; writing—original draft preparation, J.C.M. and V.M.B.; writing—review and editing, V.M.B. and S.M.; visualization, J.C.M., V.M.B., and S.M.; supervision, V.M.B. and S.M.; All authors have read and agreed to the published version of the manuscript.
Funding
The scientific research was funded by Banco de Santander and Universidad Complutense of Madrid within the framework of Project PR108/20-02.
Institutional Review Board Statement
Not applicable.
Informed Consent Statement
Not applicable.
Data Availability Statement
The data are contained within the article.
Conflicts of Interest
The authors declare no conflicts of interest.
References
- Campione, A.; Gurreri, L.; Ciofalo, M.; Micale, G.; Tamburini, A.; Cipollina, A. Electrodialysis for water desalination: A critical assessment of recent developments on process fundamentals, model and applications. Desalination 2018, 434, 121–160. [Google Scholar] [CrossRef]
- Yamane, R.; Sata, T.; Mizutani, Y.; Onoue, Y. Concentration polarization phenomena in ion-exchange membrane electrodialysis. II. The effect of the condition of the diffusion-boundary layer on the limiting-current density and on the relative transport numbers of ions. Bull. Chem. Soc. of Jpn 1969, 42, 2741–2748. [Google Scholar] [CrossRef]
- Tay, M.; Pourcelly, G.; Lebon, F.; Gavach, C. Polarization phenomena at the interfaces between an electrolyte solution and an ion exchange membrane. J. Electroanal. Chem. 1992, 336, 171–194. [Google Scholar]
- Sistat, P.; Pourcelly, G. Chronopotentiometric response of an ion-exchange membrane in the underlimiting current-range. Transport phenomena within the diffusion layers. J. Membr. Sci. 1997, 123, 121–131. [Google Scholar] [CrossRef]
- Barragán, V.M.; Ruiz-Bauzá, C. Current-voltage curves for ion-exchange membranes: A method for determining the liming current density. J. Colloid Interface Sci. 1998, 205, 365–373. [Google Scholar] [CrossRef] [PubMed]
- Ślęzak, A.; Ślęzak, I. H.; Ślęzak, K.M. Influence of the concentration boundary layers on membrane potential in a single membrane system. Desalination 2005, 184, 113–123. [Google Scholar] [CrossRef]
- Belova, E. I.; Lopatkova, G. Y.; Pismenskaya, N. D.; Nikonenko, V.; Larchet, C.; Pourcelly, G. Effect of anion-exchange membrane surface properties on mechanisms of overlimiting mass transfer. J. Phys. Chem. B. 2006, 110, 13458–13469. [Google Scholar] [CrossRef]
- Larchet, C.; Nouri, S.; Auclair, B.; Dammak, L.; Nikonenko, V. Application of chronopotentiometry to determine the thickness of diffusion layer adjacent to an ion-exchange membrane under natural convection. Adv. Colloid Interface Sci. 2008, 139, 45–61. [Google Scholar] [CrossRef]
- Tanaka, Y. Mass transfer in a boundary layer and in an ion exchange membrane: mechanism of concentration polarization and water dissociation. Russ. J. Electroch. 2012, 48, 665–681. [Google Scholar] [CrossRef]
- Moya, A. A.; Sistat, P. Chronoamperometric response of ion-exchange membrane systems. J. Membrane Sci. 2013, 444, 412–419. [Google Scholar] [CrossRef]
- Nikonenko, V.; Kovalenko, A.; Urtenov, M. K.; Pismenskaya, N. D.; Han, J.; Sistat, P.; Pourcelly, G. Desalination 2014, 342, 85–106. [CrossRef]
- Mareev, S.A.; Butylskii, D. Y.; Kovalenko, A.V.; Petukhova, A.V.; Pismenskaya, N.D.; Dammak, L.; Larchet, C.; Nikonenko, V. Accounting for the concentration dependence of electrolyte diffusion coefficient in the Sand and the Peers equation. Electrochim. Acta. 2016, 195, 85–93. [Google Scholar] [CrossRef]
- Wenten, I.G.; Khoiruddin, K.; Alkhadra, M.A.; Tian, H.; Bazant, M.Z. Novel ionic separation mechanisms in electrically driven membrane process. Adv. Colloid Interface Sci. 2020, 284, 102269. [Google Scholar] [CrossRef]
- Barros, K.S.; Martí-Calatayud, M.C.; Scarazzato, T.; Bernardes, A.M.; Espinosa, D.C.R.; Pérez-Herranz, V. Investigation of ion-exchange membranes by means of chronopotentiometry: A compressive review on this highly informative and multipurpose technique. Adv. Colloid Interface Sci. 2021, 293, 102439. [Google Scholar] [CrossRef] [PubMed]
- Stockmeier, F.; Schatz, M.; Habermann, M.; Linkhorst, J.; Mani, A. Direct 3D observation and unravelling of electroconvection phenomena during concentration polarization at in exchange membranes. J. Membr. Sci. 2021, 640, 119846. [Google Scholar] [CrossRef]
- Batko, K.M.; Ślęzak -Prochazka, I.; Ślęzak, A.; Bajdur, W.M.; Ščurek, R. Modelling of the electrical membrane potential for concentration polarization conditions. Entropy. 2022, 24, 138. [Google Scholar] [CrossRef] [PubMed]
- Uzdenova, A. Ion transport in electromembrane system under the passage of direct current: 1D modelling approach. Membranes. 2023, 13, 421. [Google Scholar] [CrossRef]
- Uzdenova, A.M. Modeling of ion transport in a three-layer system with an ion-exchange membrane based on the Nernst Planck and displacement current equations. Membr. Membr Technol. 2024, 6, 1–8. [Google Scholar] [CrossRef]
- Nguyen, D.; Pham, V.-S. Modeling non-linear ion transport phenomena in ion-selective membranes: Three simplified models. Sep. Purif. Technol 2024, 333, 125929. [Google Scholar] [CrossRef]
- Zabolotsky, V.I.; Vasil’eva, V.I.; Lebedev, K.A.; Akberova, E.M.; Achoh, A.R.; Davidov, D.V.; Loza, S.A.; Dobryden, S.V. Towards optimized cation-exchange membranes for overlimiting current electrodialysis: Correlation between size of resin particles in membranes and mechanism of ion transport through them. Chem. Eng. Sci. 2024, 295, 120137. [Google Scholar] [CrossRef]
- Chehayeb, K.M.; Lienhard V, J.H. Entropy generation analysis of electrodialysis. Desalination. 2017, 414, 184–198. [Google Scholar] [CrossRef]
- Generous, M.M.; Qasen, N.A.A.; Zubair, S.M. Entropy generation analysis of electrodialysis desalination using multi-component groundwater. Desalination. 2021, 500, 114858. [Google Scholar] [CrossRef]
- Ślęzak, A.; Ślęzak -Prochazka, I.; Grzegorczyn, S.; Jasik-Ślęzak, J. Evaluation of S-entropy production in a single-membrane system in concentration polarization conditions. Transp. Porous Med. 2017, 116, 941–957. [Google Scholar] [CrossRef]
- Kjelstrup, S.; Bedeaux, D.; Johannessen, E.; Gross, S. Non-Equilibrium Thermodynamics for Engineers, 2nd ed.; Word Scientific: New Jersey, USA, 2017. [Google Scholar]
- Kjelstrup, S.; Bedeaux, D. Non-Equilibrium Thermodynamics of Heterogeneous Systems, Series on Advances in Statistical Mechanics-Volume 16; Word Scientific: New Jersey,2008.
- Naterer, G.F.; Tokarz, C.D.; Avsec, J. Fuel cell entropy production with ohmic heating and diffusive polarization. Int. J. Heat Mass Tranfer. 2006, 49, 2673–2683. [Google Scholar] [CrossRef]
- Kristiansen, K.; Barragán, V.M.; Kjelstrup, S. Thermoelectric power of ion exchange membrane cells relevant to reverse electrodialysis plants. Phys. Rev. Appl. 2019, 11, 044037. [Google Scholar] [CrossRef]
- Kujawski, W.; Yaroshchuk, A.; Zholkovskiy, E.; Koter, I.; Koter, S. Analysis of membrane transport equations for reverse electrodialysis (RED) using irreversible thermodynamics. Int. J. Mol. Sci 2020, 21, 6325. [Google Scholar] [CrossRef]
- Magnanelli, E.; Wilhelmsen, Ø.; Johannessen, E.; Kjelstrup, S. Energy efficient design of membrane processes by use of entropy production minimization. Comp. Chem. Eng. 2018, 117, 105–116. [Google Scholar] [CrossRef]
- Helfferich, F. Ion Exchange; Dover Publication, INC: New Yor, USA, 1995. [Google Scholar]
- Levich, V.G. Physicochemical Hydrodynamics; Prentice-Hall: New York, USA, 1962. [Google Scholar]
- Strathamann, H. Ion-Exchange Membrane Separation Processes, Membrane Science and Technology Series Volume 9; Elsevier: Amsterdam, The Netherlands, 2004. [Google Scholar]
- Katchalsky, A.; Curran, P.F. Thermodynamics in Biophysics; Harvard University Press Cambridge: Massachusetts, USA, 1967. [Google Scholar]
- Brockris, J.O´M.; Reddy, A.K.N. Modern Electrochemistry; Plenum Press: New York, USA, 1970; Volume 1. [Google Scholar]
- Lobo, V.M.; Quaresma, J.L. Handbook of Electrolyte Solutions, Parts A and B; Elsevier: Amsterdam, The Netherlands, 1989. [Google Scholar]
- Robinson, R.A.; Stokes, R.H. Electrolyte Solutions, 2nd. ed.; Dover Publication Inc.: New Yor, USA, 2003. [Google Scholar]
- Avramov, S.G.; Lefterova, E.; Penchev, H.; Sinigersky, V.; Slavcheva, E. Comparative study on the proton conductivity of perfluorosulfonic and polybenzimidazole based polymer electrolyte membranes. Bulg. Chem. Commun. 2016, 48, 43–50. [Google Scholar]
- Hongsirikarn, K.; Goodwin, J. G.; Greenway, S.; Creager, S. Effect of cations (Na+, Ca2+, Fe3+) on the conductivity of a Nafion membrane. J. Power Sources. 2010, 195, 7213–7220. [Google Scholar] [CrossRef]
- Slade, S.; Campbell, S.A.; Ralph, T.R.; Walsh, F.C. Ionic conductivity of an extruded Nafion 1100 EW series of membranes. J. Electrochem. Soc. 2002, 149, A1556–A1564. [Google Scholar] [CrossRef]
Figure 1.
Sketch of the ion-exchange membrane system under study: An electric current passes through a cation exchange membrane separating two aqueous solutions of NaCl of equal concentration c0 (above). The Ag|AgCl are electrodes reversible to Cl- ion Concentration profiles and different fluxes across the system (bottom).
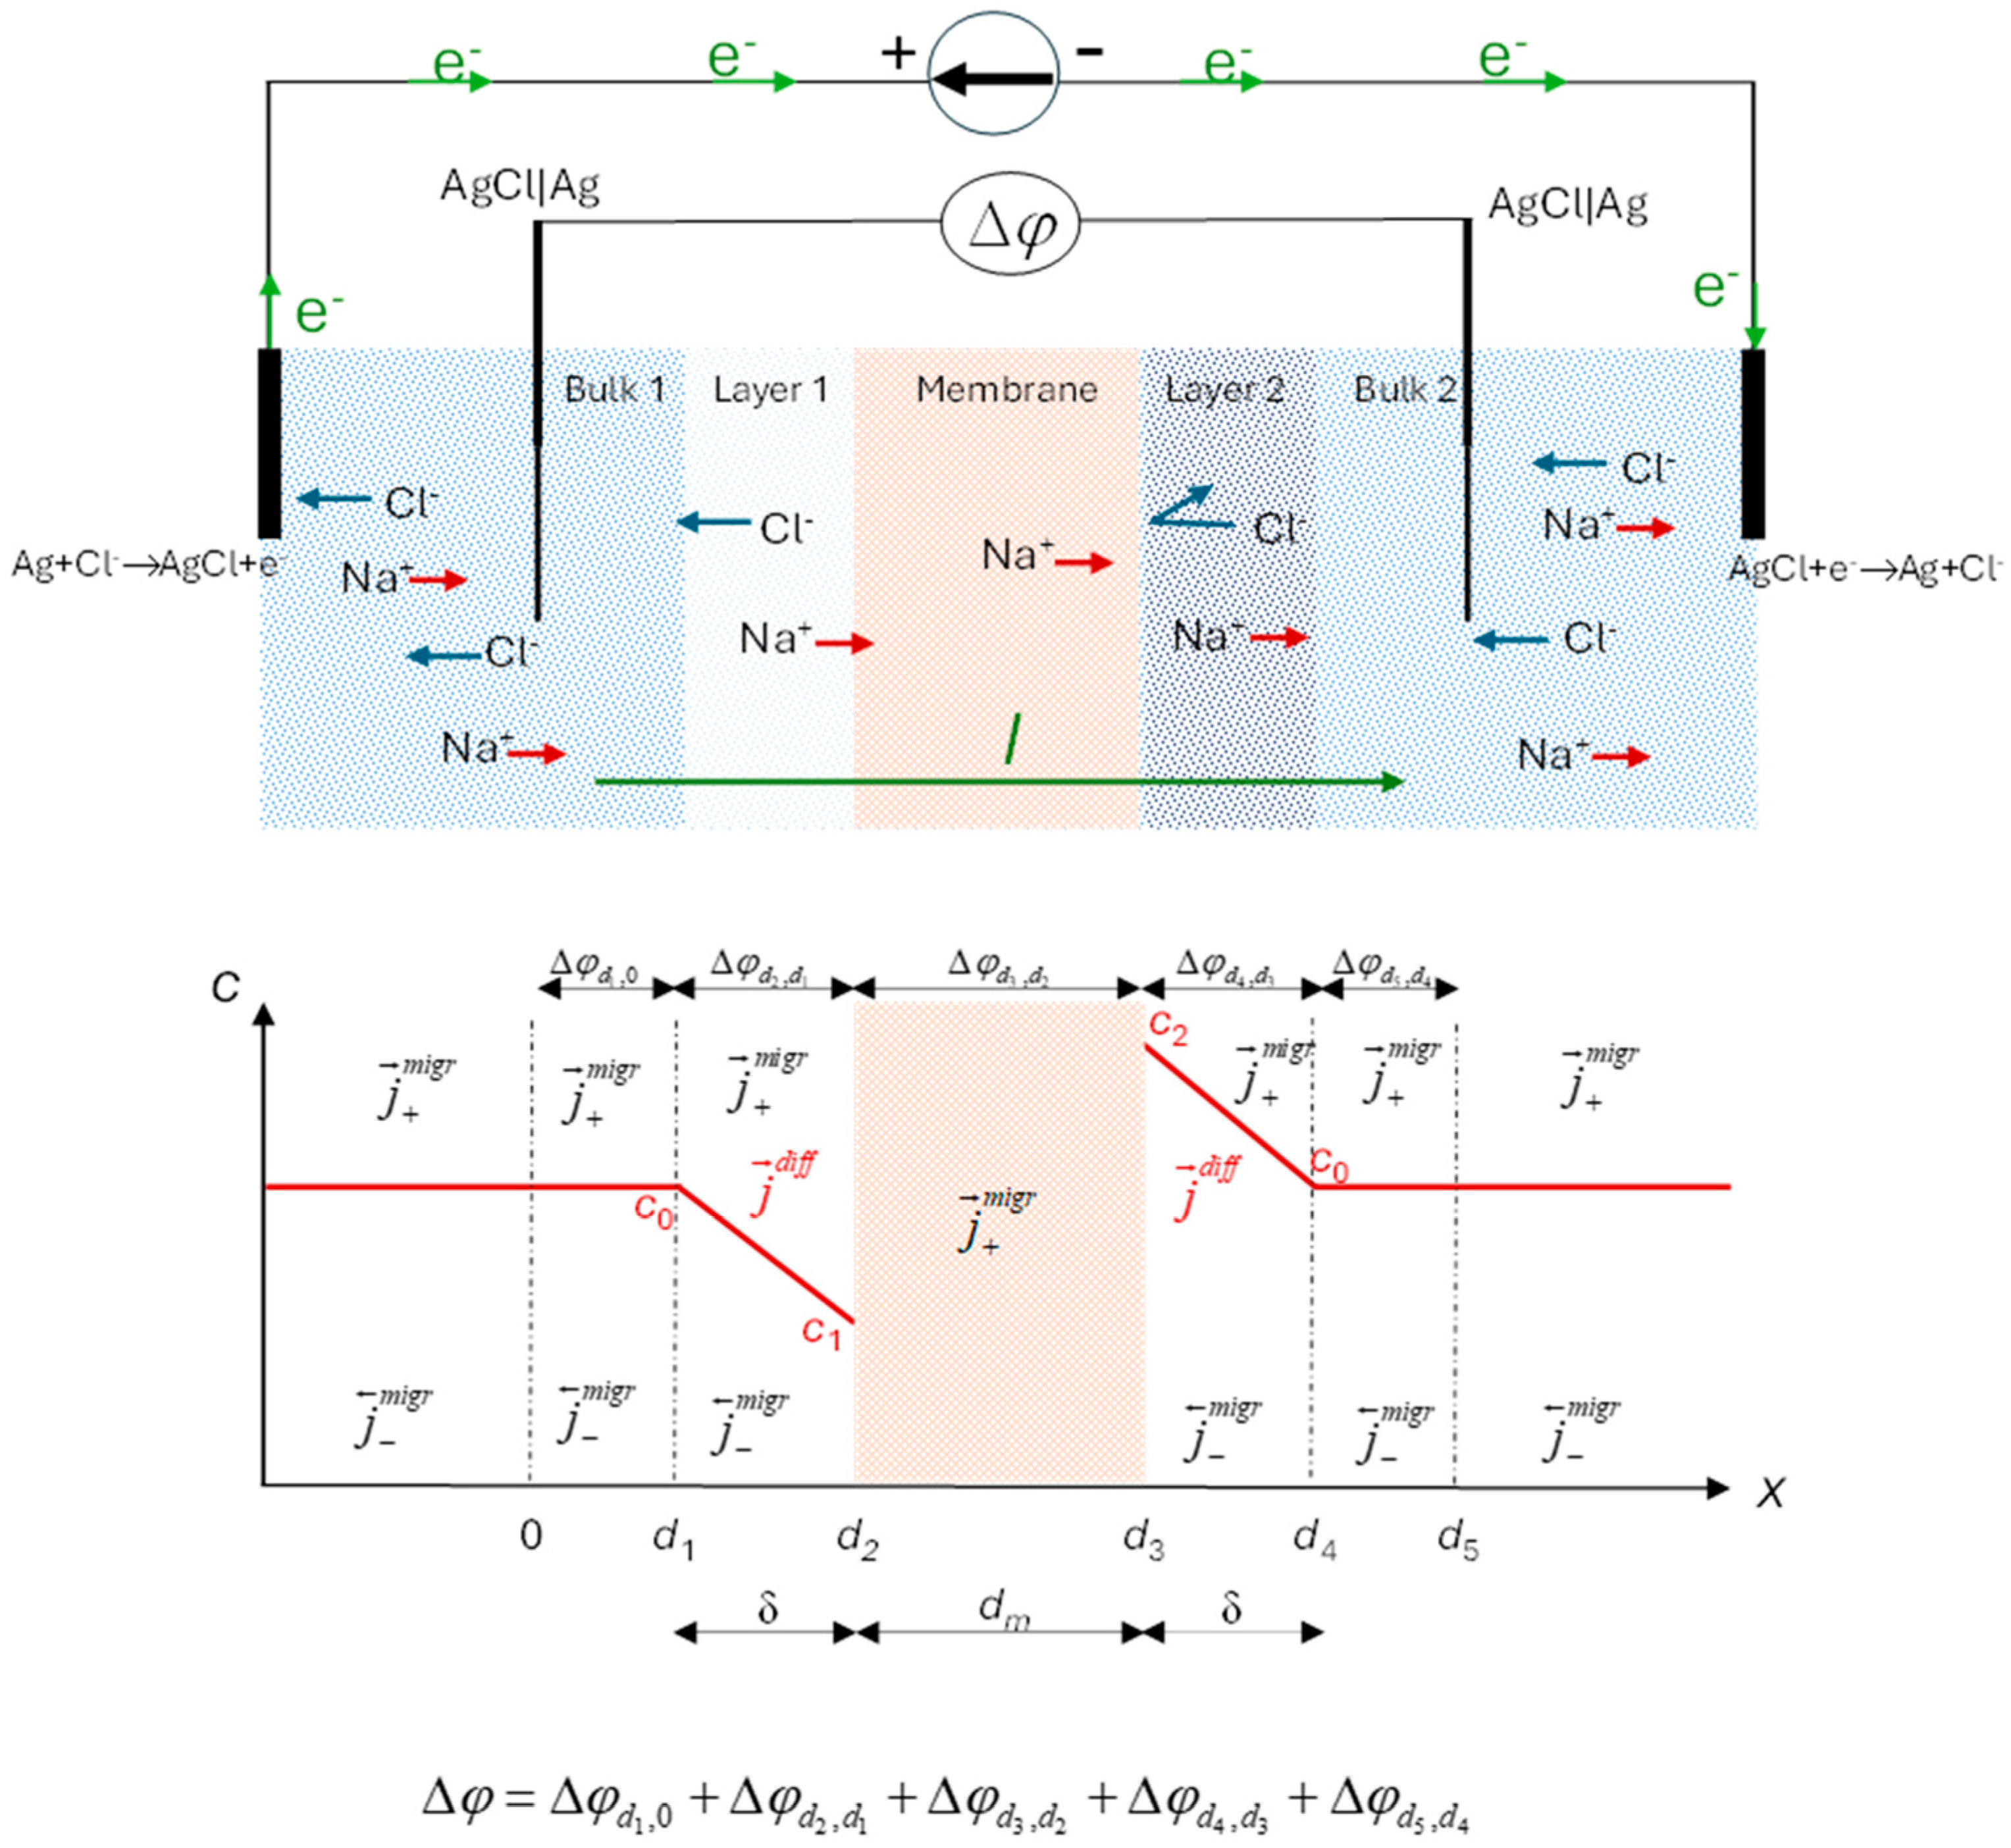
Figure 2.
Sketch of a typical current-voltage curve of an ion-exchange membrane in an electrolyte solution, showing the three distinct regions: (I) linear increase, (II) plateau, and (III) overlimiting transport. Profile predicted by the Nernst model, and linear voltage-current curve for a system without concentration polarization effects are also shown.
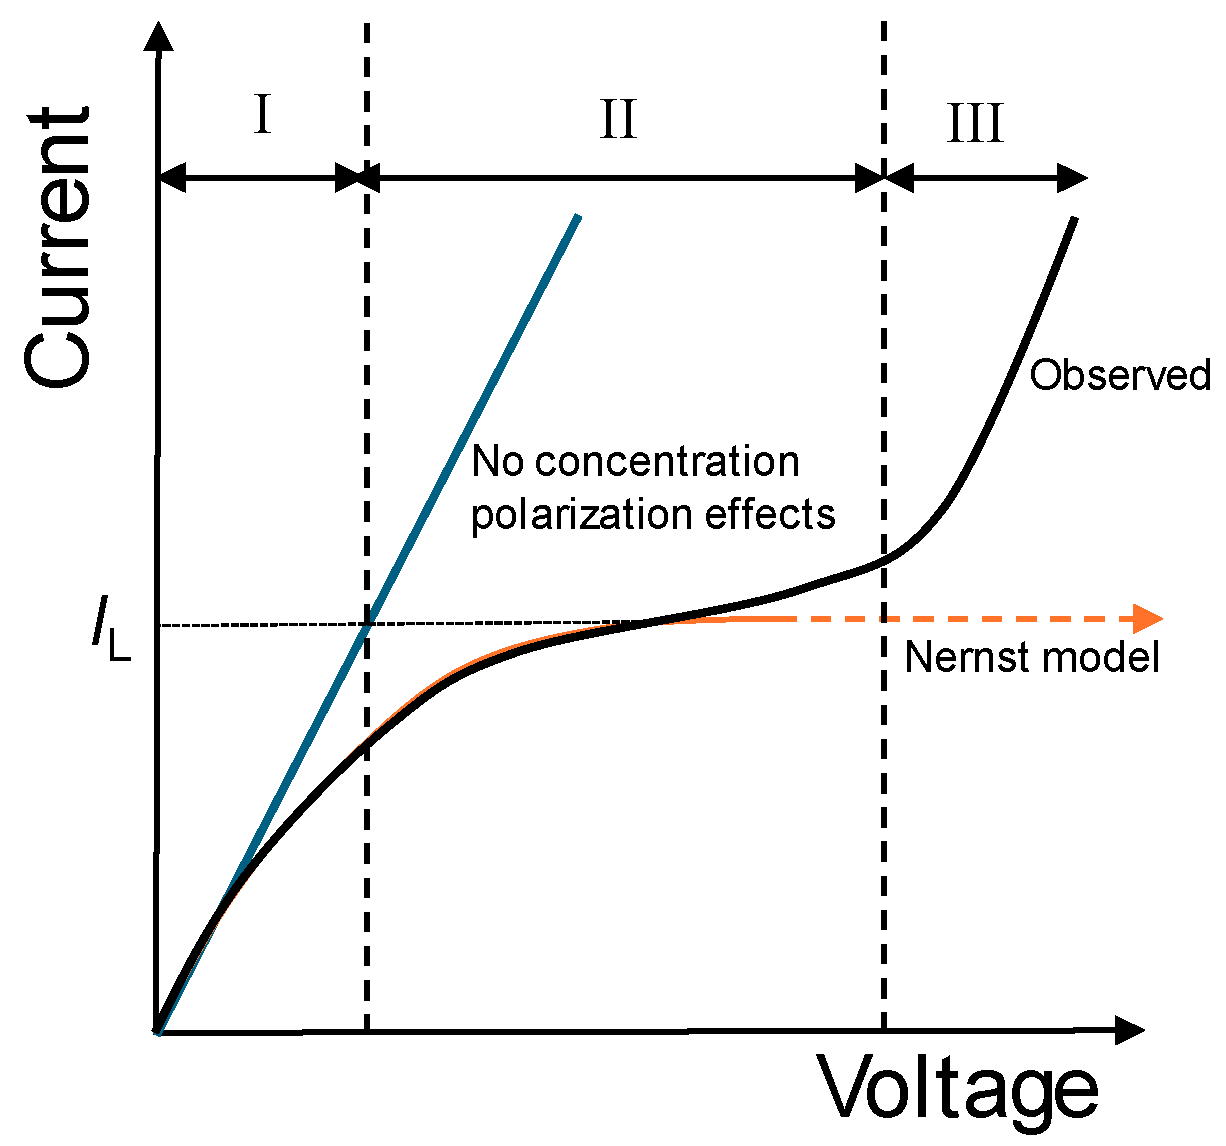
Figure 3.
Sketch of the experimental setup for measuring current-voltage curves. I: electric current; B: Bath; T: Thermostat; S: Solution; M: Membrane; IE: Ag|AgCl injecting Electrode; ME: voltage Ag|AgCl Electrode.
Figure 3.
Sketch of the experimental setup for measuring current-voltage curves. I: electric current; B: Bath; T: Thermostat; S: Solution; M: Membrane; IE: Ag|AgCl injecting Electrode; ME: voltage Ag|AgCl Electrode.
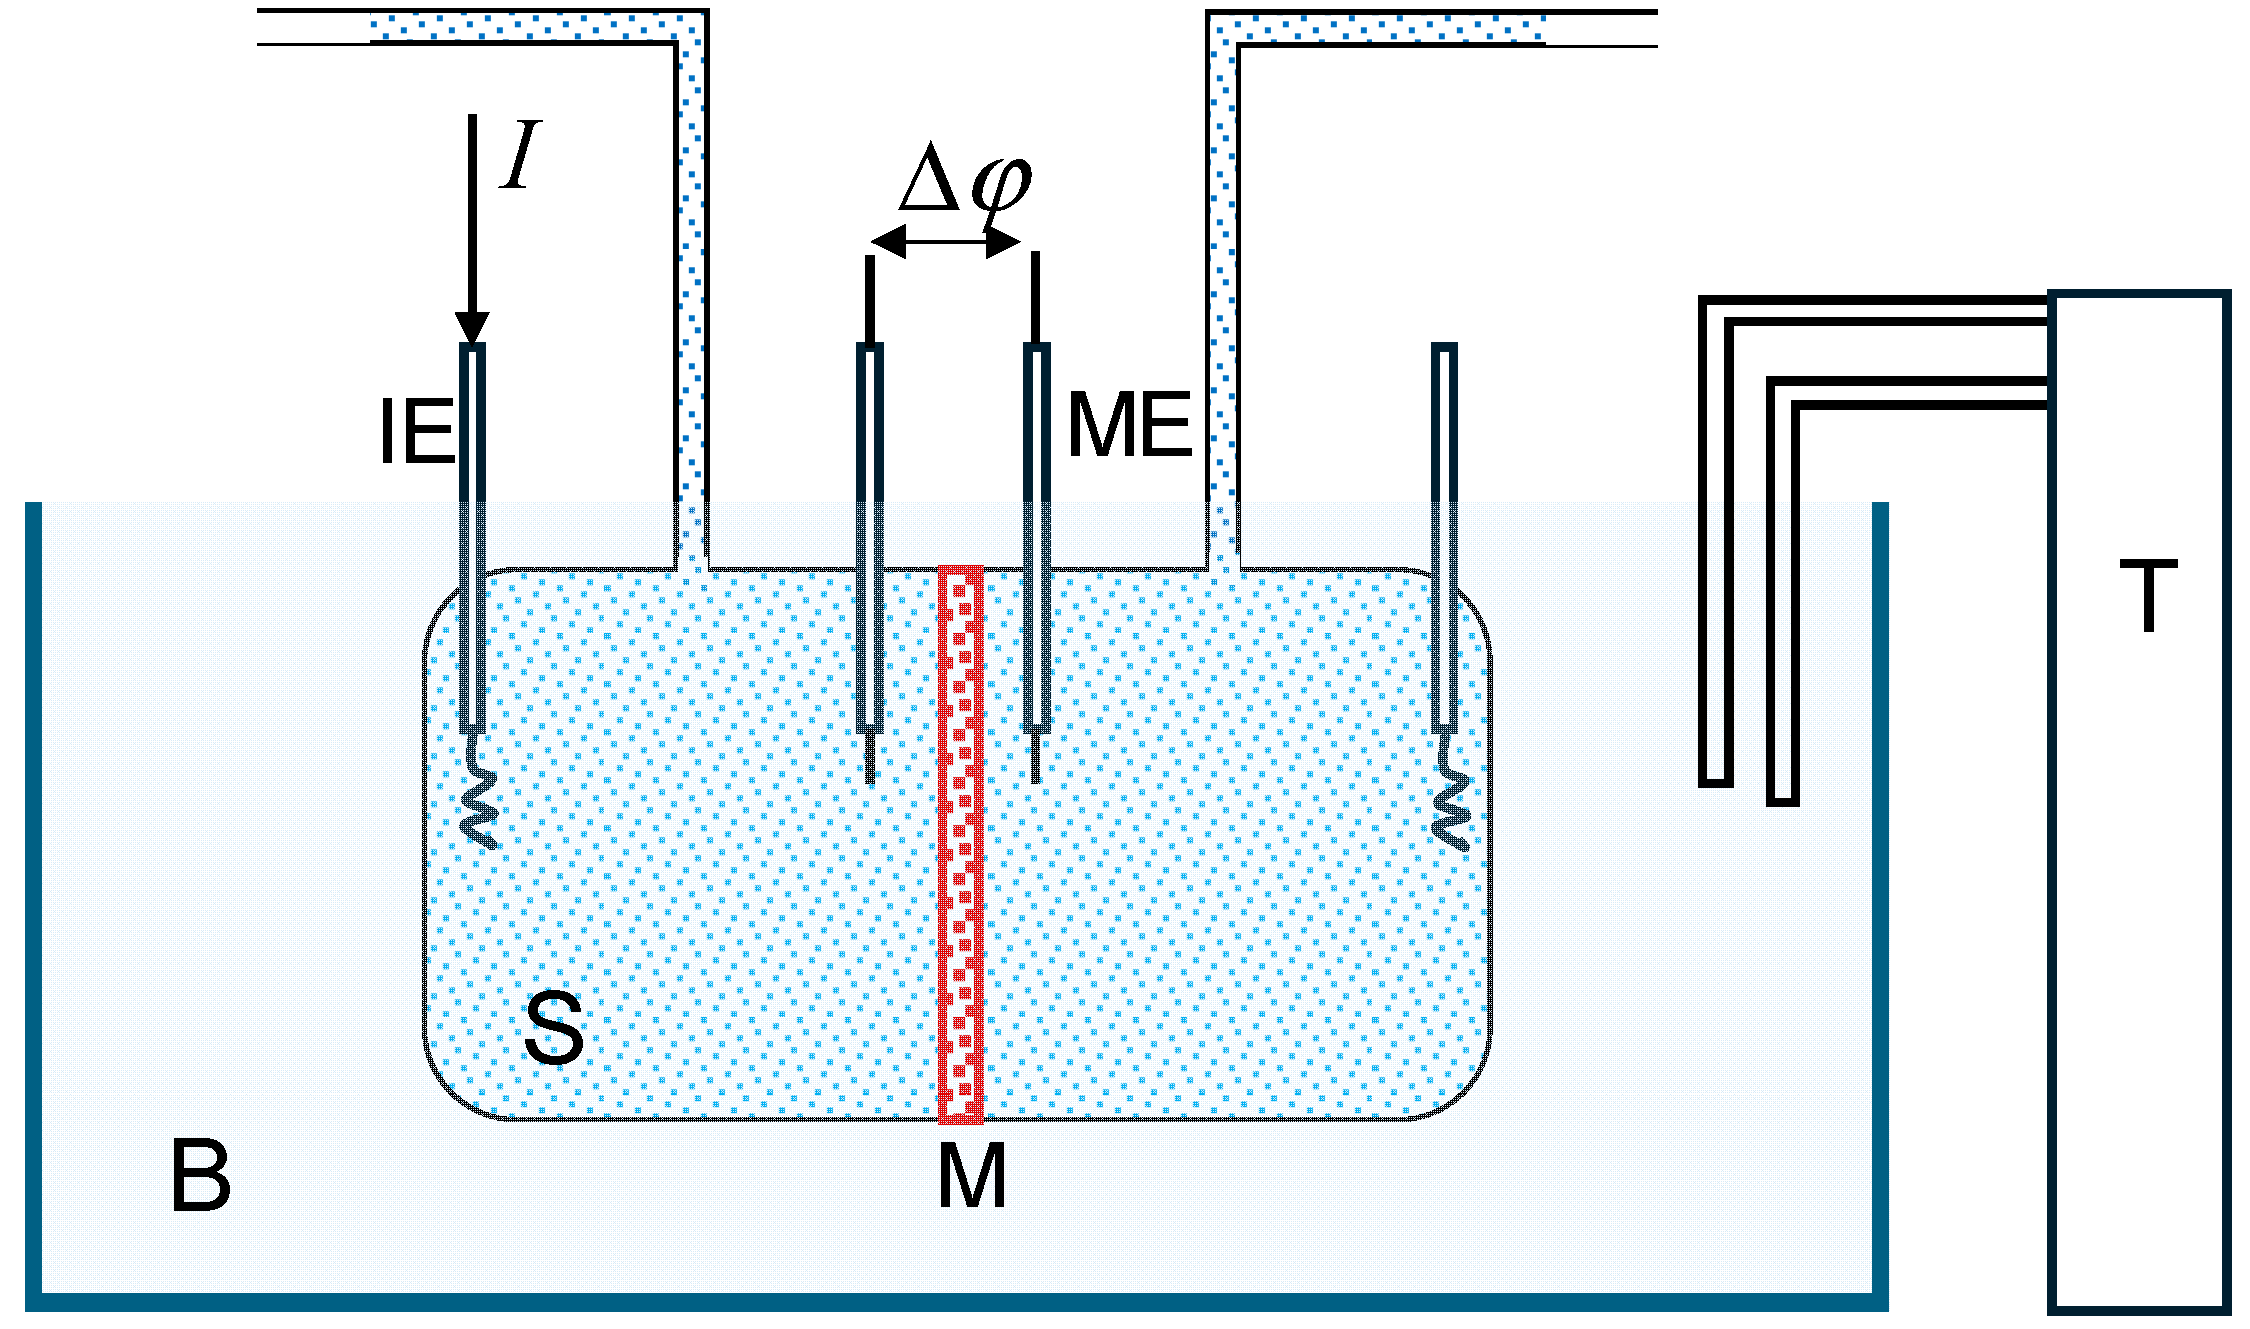
Figure 4.
(a) Current-Voltage curves and (b) corresponding Cowan plots at different temperatures. Dashed lines are included as visual guides.
Figure 4.
(a) Current-Voltage curves and (b) corresponding Cowan plots at different temperatures. Dashed lines are included as visual guides.
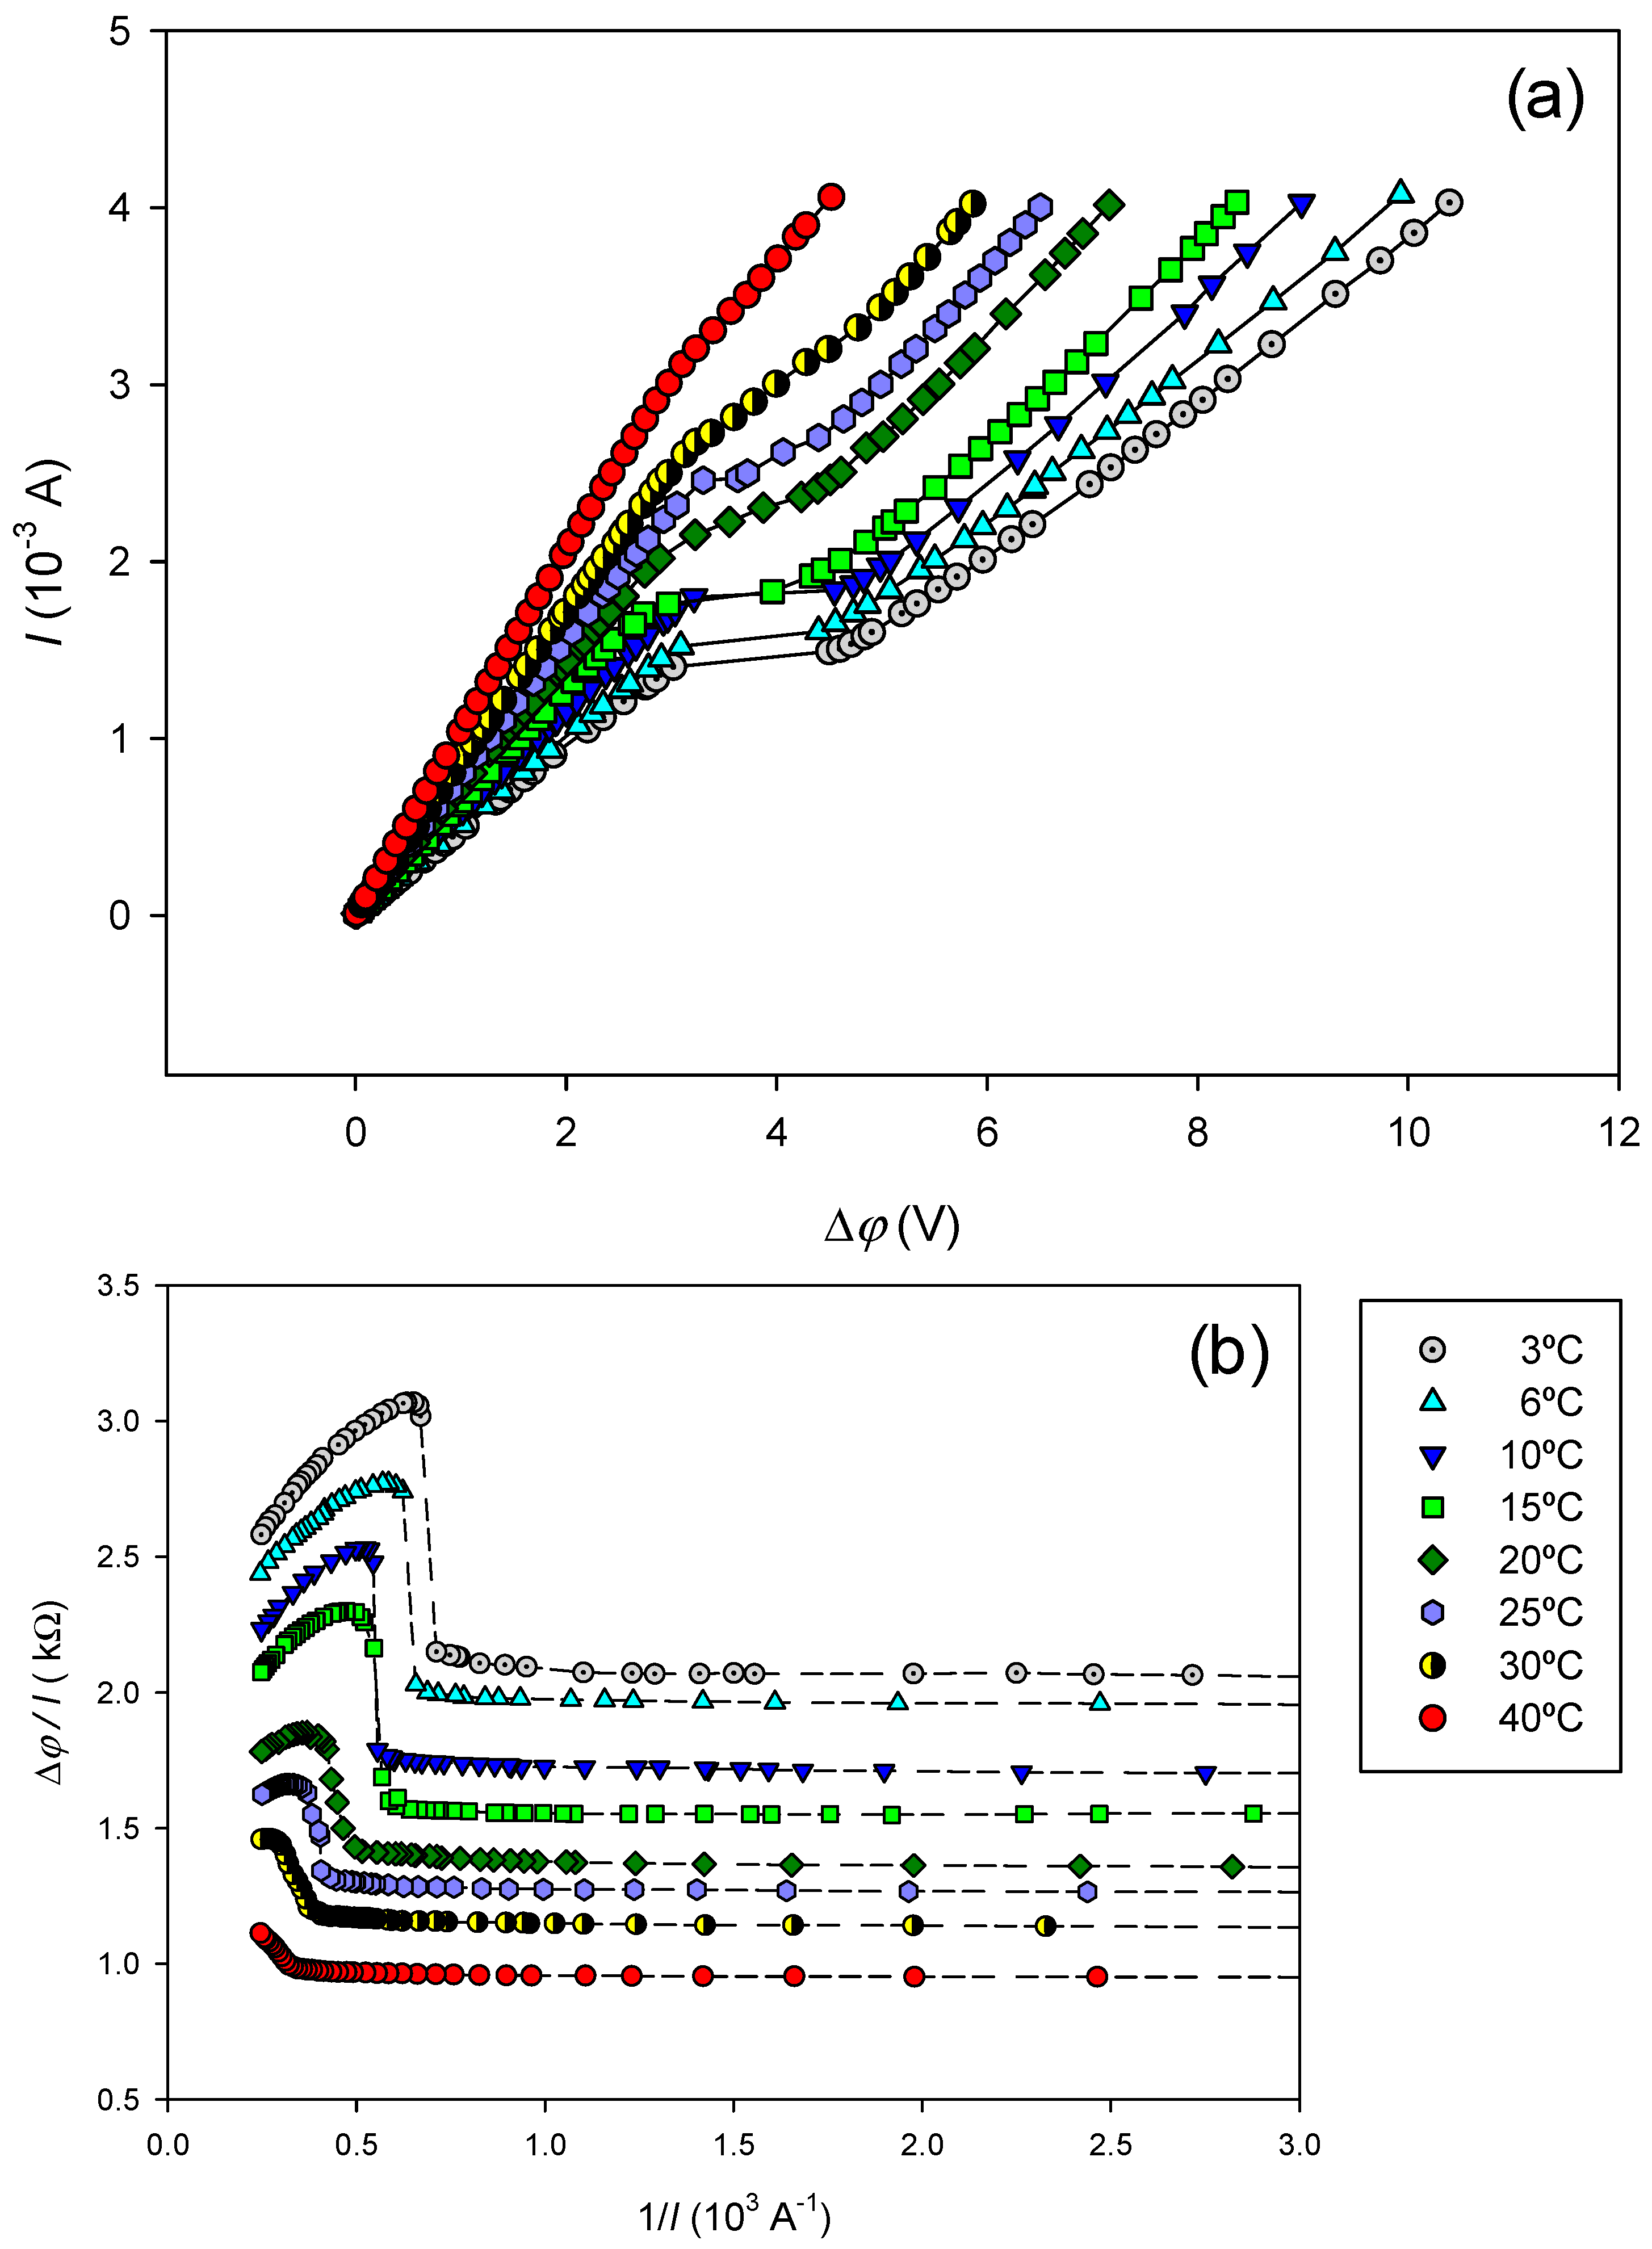
Figure 5.
Estimated entropy production as a function of the applied electric current at different temperatures. Lines are provided as visual guides.
Figure 5.
Estimated entropy production as a function of the applied electric current at different temperatures. Lines are provided as visual guides.
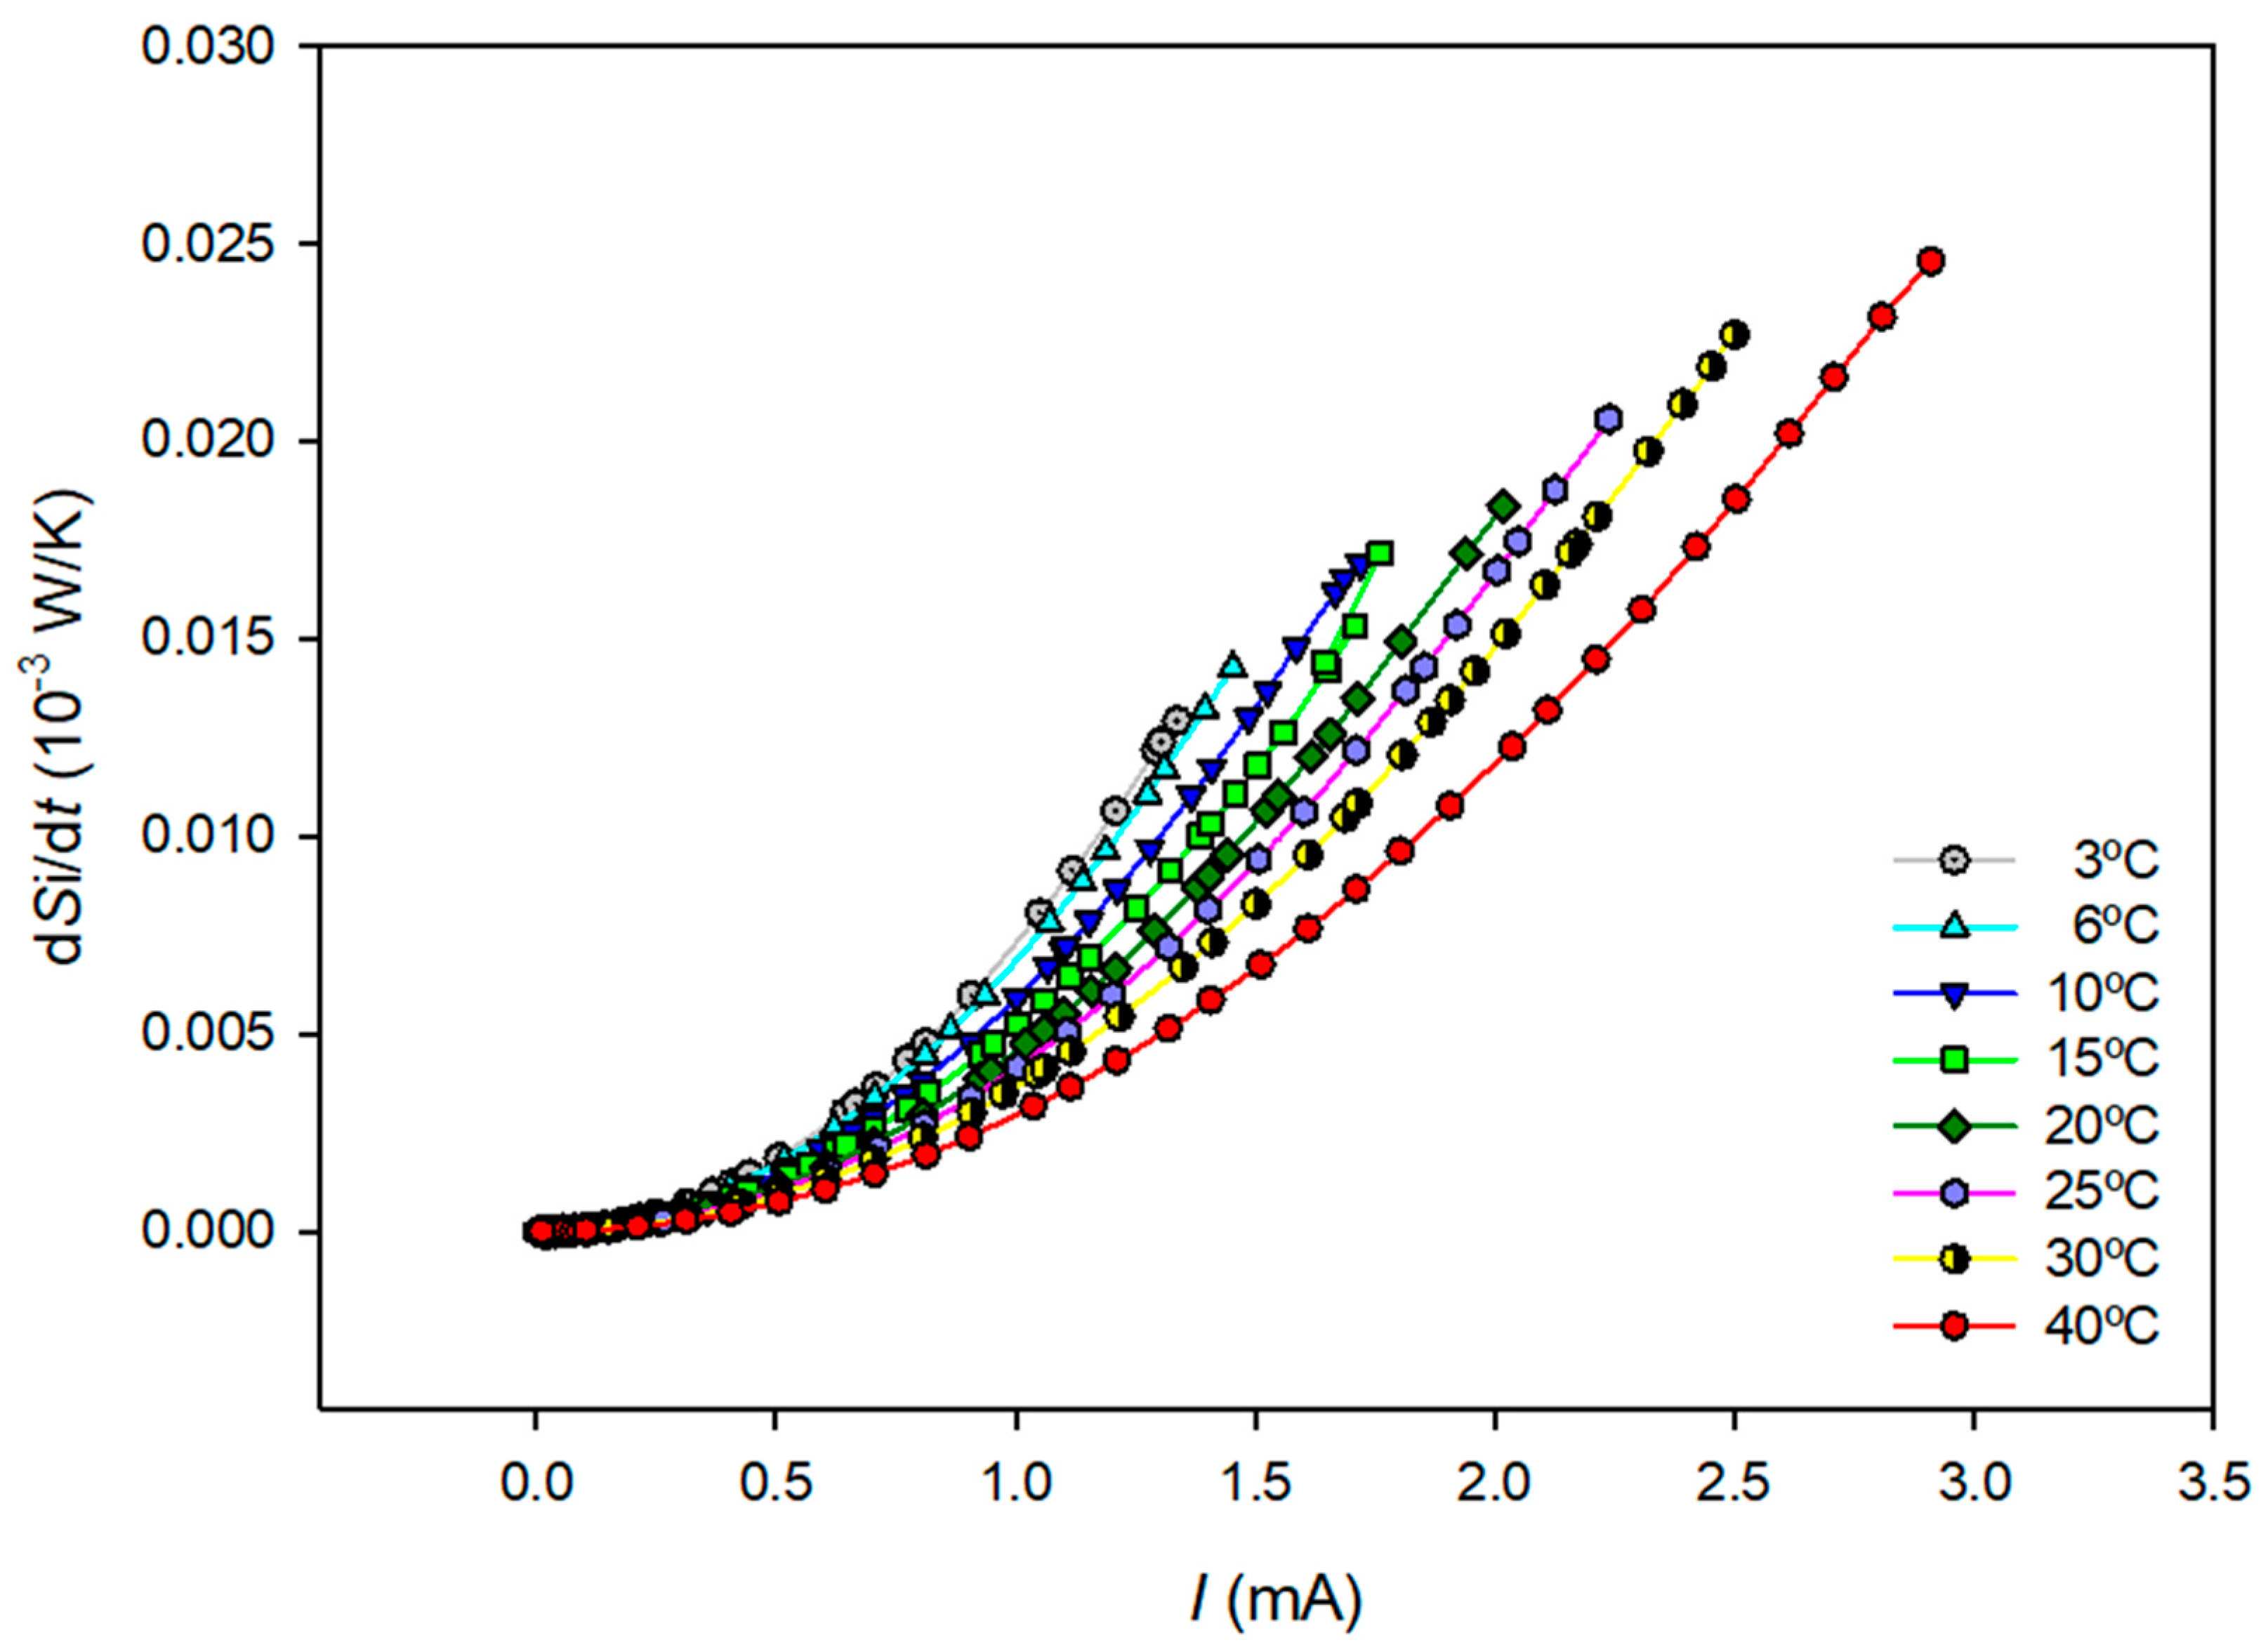
Figure 6.
(a) Estimated stored and (b) dissipated powers as a function of the electric current at different temperatures.
Figure 6.
(a) Estimated stored and (b) dissipated powers as a function of the electric current at different temperatures.
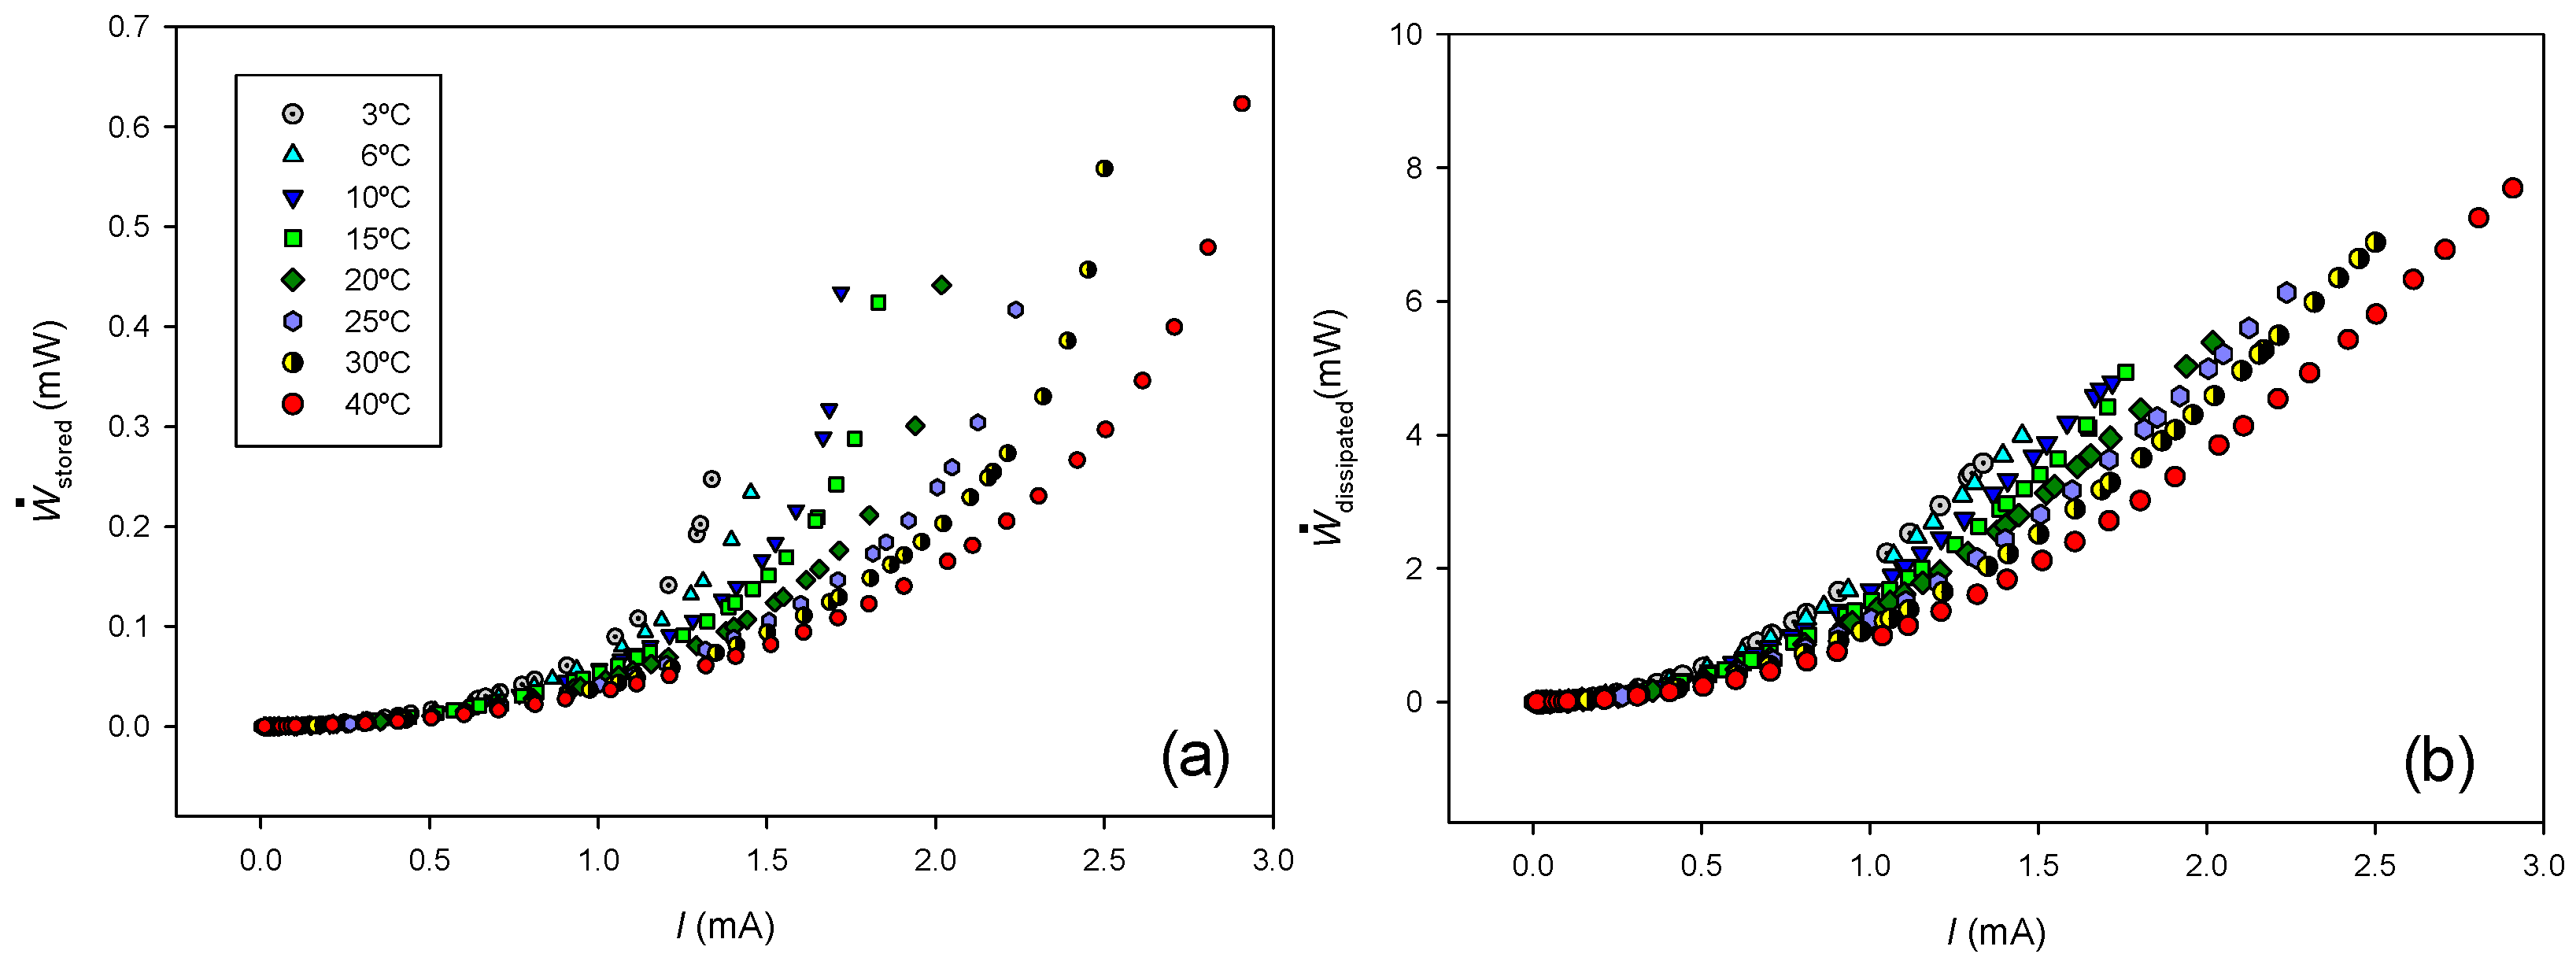
Figure 7.
Estimated efficiencies as a function of Ir= I/IL at different temperatures. Dashed lines are only visual guides. Figure inside shows the efficiency values at different Ir percentages at the different temperatures for a better visualization.
Figure 7.
Estimated efficiencies as a function of Ir= I/IL at different temperatures. Dashed lines are only visual guides. Figure inside shows the efficiency values at different Ir percentages at the different temperatures for a better visualization.
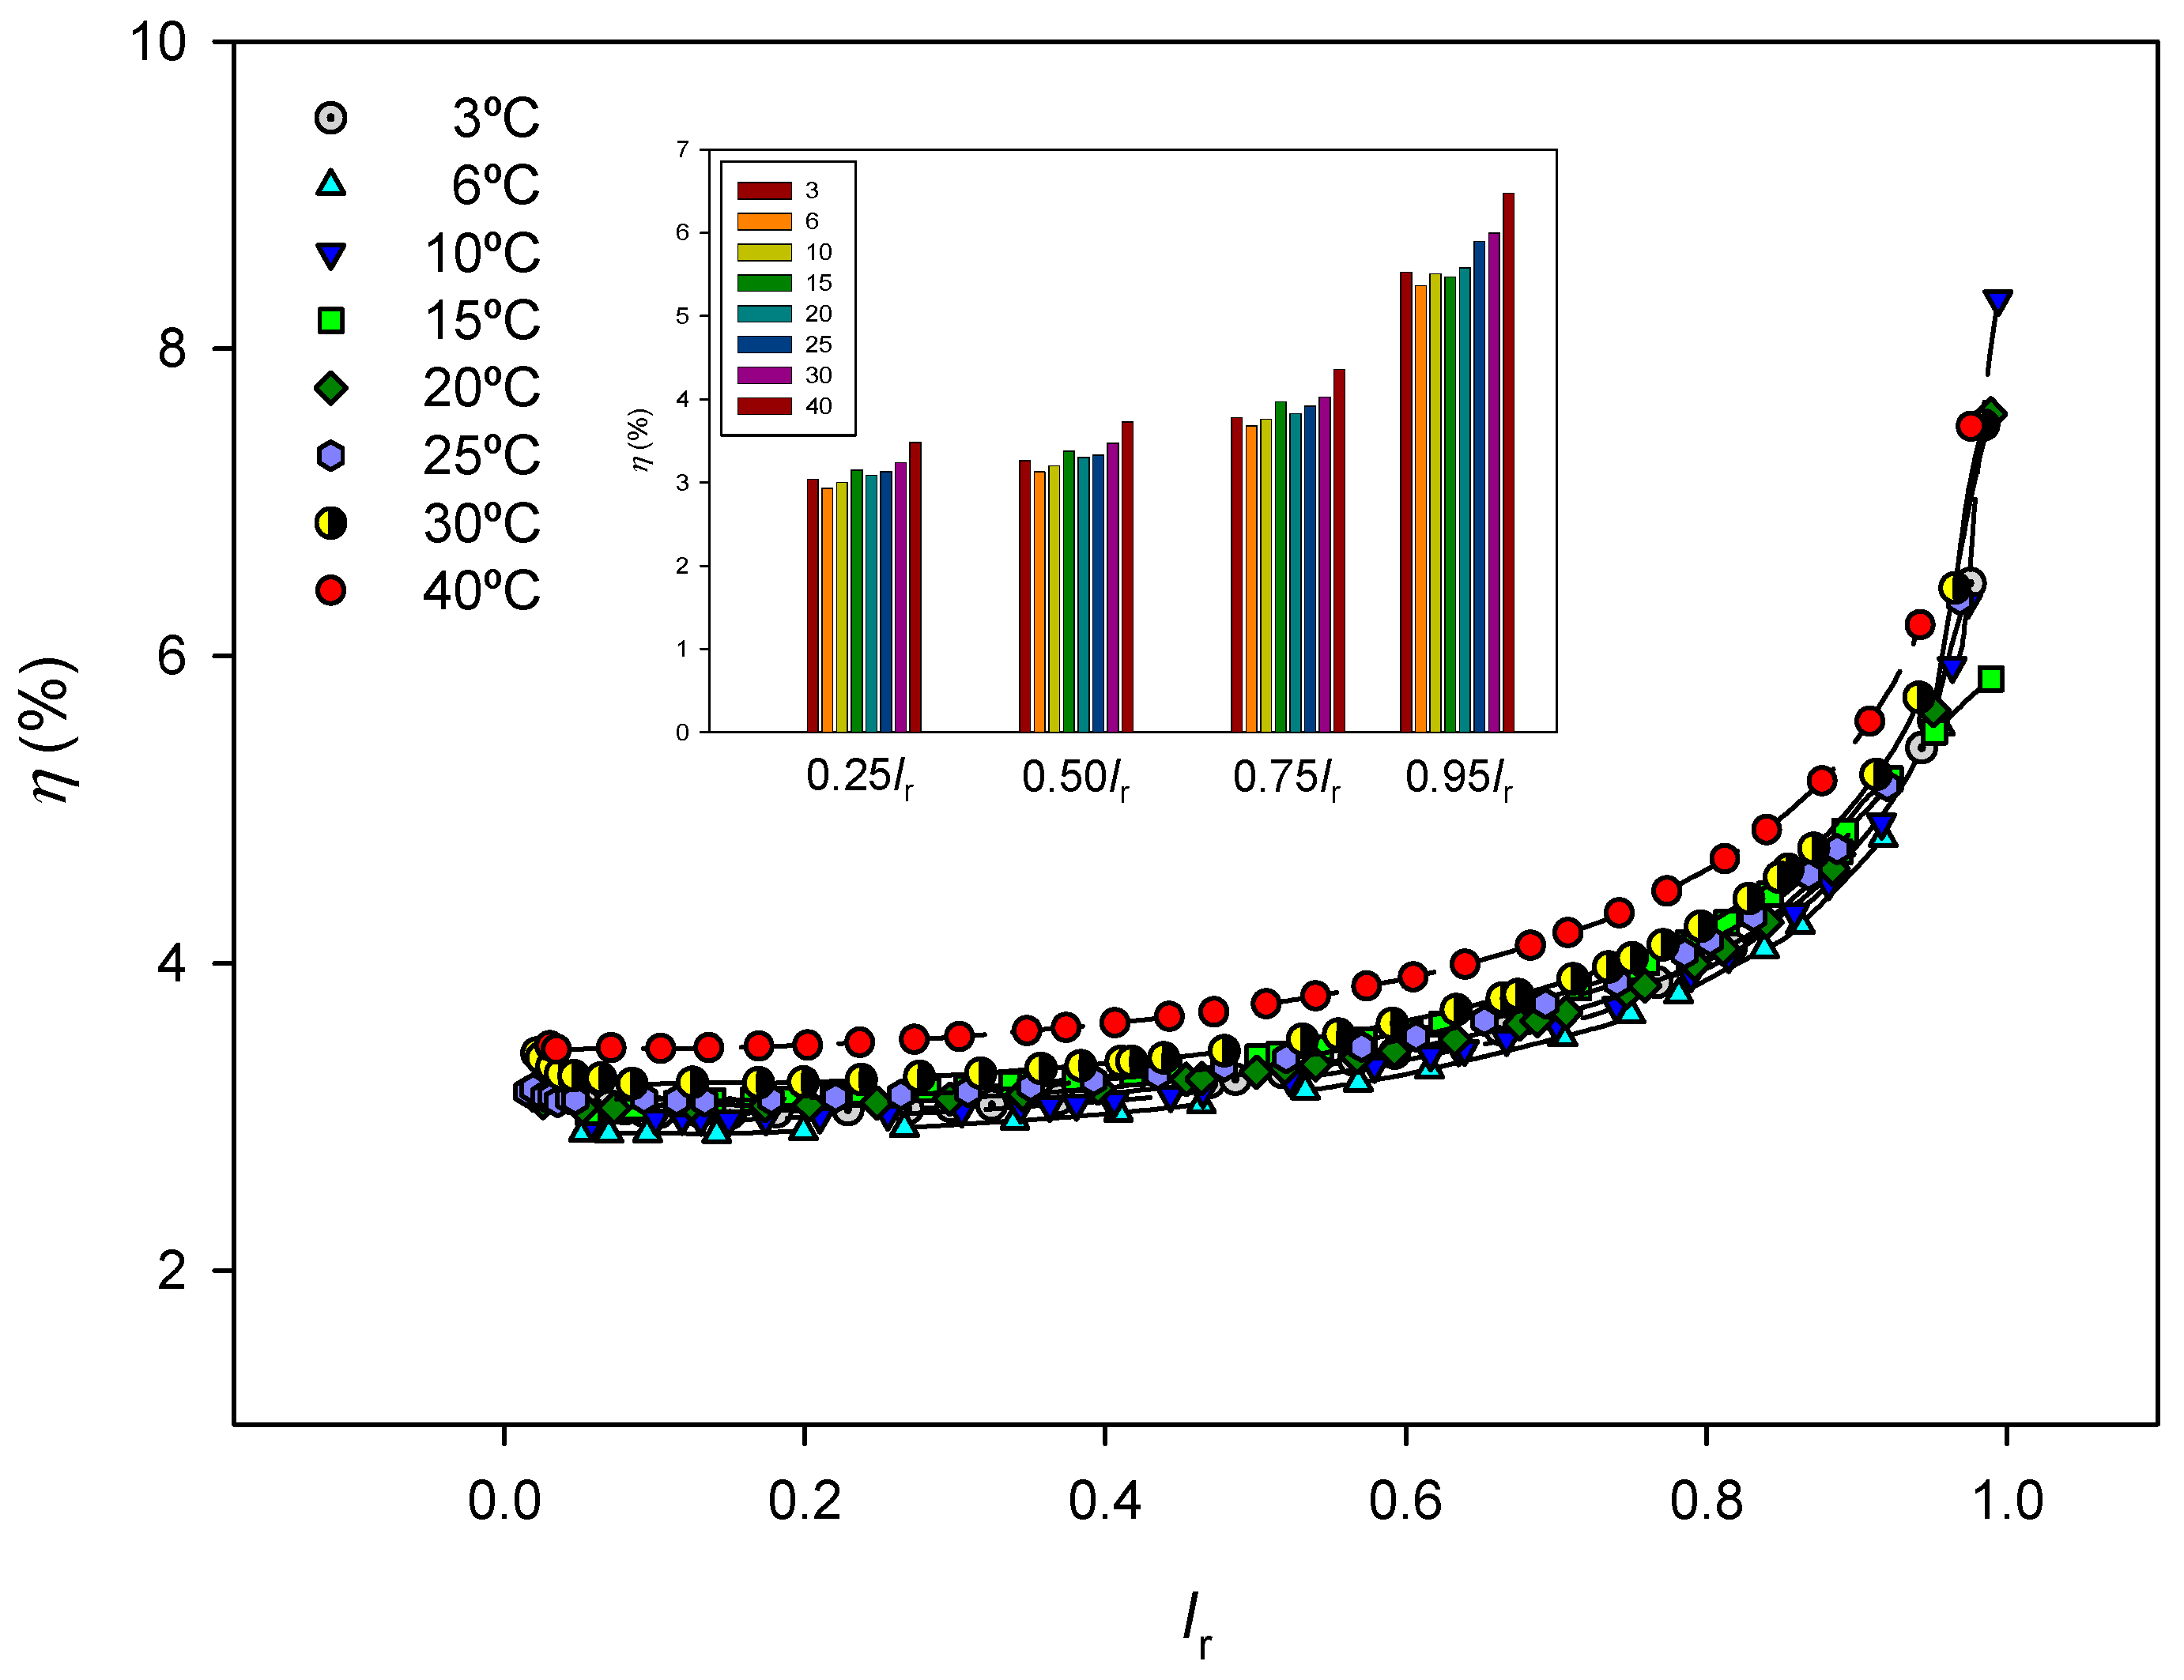

Table 1.
Values of the electrical conductivity, equivalent conductance, diffusion coefficient, and transport number for Na+ in 5 mol.m-3 NaCl aqueous solution.
Table 1.
Values of the electrical conductivity, equivalent conductance, diffusion coefficient, and transport number for Na+ in 5 mol.m-3 NaCl aqueous solution.
| T (K) | κ (μS cm-1) * | Λ (Scm2mol-1) ** | D (10-9 m2 s-1) ** | t+** |
|---|---|---|---|---|
| 276.15 | 350 | 71.62 | 0.884 | 0.360 |
| 279.15 | 376 | 76.94 | 0.959 | 0.386 |
| 283.15 | 415 | 84.92 | 1.074 | 0.389 |
| 288.15 | 474 | 96.99 | 1.248 | 0.392 |
| 293.15 | 535 | 109.47 | 1.433 | 0.394 |
| 298.15 | 608 | 119.91 | 1.596 | 0.395 |
| 303.15 | 654 | 131.98 | 1.787 | 0.397 |
| 313.15 | 753 | 154.08 | 2.155 | 0.399 |
* Measured. ** Estimated.
Table 2.
Values of parameters R0 and y , estimated from Equation (3), values of the limiting current estimated from the corresponding Cowan plots, IL Cowan, and diffusion layer thickness, δ, estimated from Peers´ equation.
Table 2.
Values of parameters R0 and y , estimated from Equation (3), values of the limiting current estimated from the corresponding Cowan plots, IL Cowan, and diffusion layer thickness, δ, estimated from Peers´ equation.
| T (K) | R0( Ω) | IL Cowan (10-3 A) | δ (10-6 m) | |
|---|---|---|---|---|
| 276.15 | 1995.6 ± 1.3 | 0.88± 0.10 | 1.37 | 545 |
| 279.15 | 1896.17± 0.06 | 0.88± 0.06 | 1.52 | 555 |
| 283.15 | 1651.6 ± 0.3 | 0.89± 0.08 | 1.73 | 540 |
| 288.15 | 1495.00 ± 0.04 | 0.89± 0.03 | 1.85 | 592 |
| 293.15 | 1330.8 ± 1.2 | 0.88± 0.15 | 2.04 | 633 |
| 298.15 | 1247.0± 0.1 | 0.88± 0.08 | 2.31 | 629 |
| 303.15 | 1113.9 ± 0.2 | 0.88± 0.06 | 2.54 | 635 |
| 313.15 | 921.40± 0.04 | 0.90± 0.05 | 2.98 | 645 |
Disclaimer/Publisher’s Note: The statements, opinions and data contained in all publications are solely those of the individual author(s) and contributor(s) and not of MDPI and/or the editor(s). MDPI and/or the editor(s) disclaim responsibility for any injury to people or property resulting from any ideas, methods, instructions or products referred to in the content. |
© 2024 by the authors. Licensee MDPI, Basel, Switzerland. This article is an open access article distributed under the terms and conditions of the Creative Commons Attribution (CC BY) license (http://creativecommons.org/licenses/by/4.0/).
Copyright: This open access article is published under a Creative Commons CC BY 4.0 license, which permit the free download, distribution, and reuse, provided that the author and preprint are cited in any reuse.


