Introduction
Diabetes is one of the most common chronic diseases, affecting millions of people worldwide each year. The International Diabetes Federation (IDF) estimated that approximately 463 million people between the ages of 20 and 79 years were living with diabetes. This number is expected to rise, and projections indicate that by 2045, the global prevalence may reach 700 million [
7]. According to the World Health Organization, the prevalence of diabetes has continued to increase in recent years, indicating an urgent need to develop more accurate methods of diagnosis and prognosis. Successful early detection of patients at high risk of developing diabetes can have a significant impact on their prognosis and improve quality of life through timely treatment and prevention of complications. Current diagnostic methods based on traditional statistical approaches often have limited ability to capture the complex interrelationships between risk factors. These limitations underscore the importance of applying machine learning, which is able to analyze and identify non-linear dependencies and patterns in large volumes of clinical data.
Machine learning methods have been successfully applied in various fields [11; 12; 13] and offer a wide range of approaches for classification tasks, which makes them attractive for use in medical diagnosis [
1]. Among them, logistic regression and decision trees occupy leading positions due to their interpretability and accuracy. Logistic regression is easy to use and produces models that are easy to interpret, which is especially important in clinical practice [
2]. Decision trees, on the other hand, offer a more flexible approach, with advantages when dealing with categorical and numerical data, as well as the ability to visualize the decision-making process [
3]. These methods were chosen to investigate their potential in the task of diabetes diagnosis and to comparatively analyze their accuracy and sensitivity.
A plethora of studies support the importance of using machine learning techniques in medical applications. For example, in a study by Zou [
2] evaluated logistic regression and decision trees for diabetes diagnosis. The results of the study showed that logistic regression has good interpretability but is inferior to decision trees in accuracy on complex datasets. Other works, such as the study by Choi [
4], indicate that artificial intelligence is highly effective in predicting diabetes, especially when combined with national databases containing complete patient data. These studies emphasize that to achieve high accuracy and generalizability of models, high-quality data preprocessing, including outlier removal, class balancing, and normalization of feature values, is important.
Data and Methods
To achieve the objective, this study utilized state-of-the-art machine learning techniques that have been proven to be effective in solving classification problems, especially in medical diagnosis. The data used in the analysis include patient demographic information, physical health indicators, and clinical data such as blood glucose levels, body mass index (BMI), and the presence of other conditions (pregnancies, skin thickness, glucose, blood pressure, insulin, age ) that may influence the likelihood of developing diabetes.
Before starting to build the models, the data undergoes a mandatory pre-processing step. This step involves cleaning the data from omissions and outliers that can skew the model results. Missing values are filled in with average values of traits or deleted if their share is small. Abnormal values that may differ significantly from normal ranges are also excluded from the analysis [
9]. The data are then normalized to bring them to a common scale. Normalization is especially important for models that are sensitive to the magnitude of the input data, such as logistic regression e.t.c. High-quality data preprocessing is key to successfully building the model and obtaining accurate predictions. After completing the data cleaning and normalization step, the data are divided into two parts: the training sample and the test sample. The training sample is used to create the models, while the test sample is used to test their accuracy. Splitting the data allows us to evaluate how well the models perform in predicting diabetes. In this paper, a standard ratio was used: 70% of the data is for training and 30% is for testing.
The logistic regression model also was chosen for its simplicity and high interpretability. This method allows the classification of patients according to a binary feature (presence or absence of diabetes) based on clinical data. The basic principle of logistic regression is that it estimates the probability of a patient belonging to one of two classes [
5]. Decision trees, on the other hand, are a more complex model that builds a tree structure of decisions based on successive feature partitions. This model provides flexibility and easy visualization of the decision making process, which makes it popular in medicine. This paper utilizes both models to compare their performance in predicting diabetes.
The decision tree model was chosen for comparison with logistic regression because it adapts well to data containing nonlinear dependencies. Unlike linear models, the decision tree builds consecutive nodes, which allows visualization of the decision making process. This technique is particularly useful for medical applications where the ability to explain the decision-making algorithm is important. The main criterion for partitioning in tree nodes is information maximization, where the optimal boundary is defined using an entropy measure or Gini index. The Gini index measures the probability of incorrectly classifying a randomly selected element from a dataset if that element was labeled randomly according to the class distribution within the set.
Ensemble methods such as Gradient Boosting and XGBoost, which show high accuracy on heterogeneous and nonlinear data, have also been applied to improve the classification accuracy and generalizability of the model. The most important factor behind the success of XGBoost is its scalability in all scenarios [
6]. Gradient boosting is a boosting-like algorithm for regression [
10]. These models work by successively building weak models, each of which is trained on the errors of the previous one, which improves the overall classification result.
Experiments and results
As I mentioned before, the first model I’ve used was logistic regression. Logistic regression is a method used for binary classification, that is, when the target variable has two classes, yes or no. It utilizes the sigmoid function (q(z)), defined by the Equation 1, to convert continuous data into probability between 0 and 1, and by specifying a threshold, it classifies data points into different classes [
8]. Instead of predicting classes directly, logistic regression predicts the probability of belonging to a class. To do this, it uses a sigmoid function,
Here β are the parameters or coefficients that are trained for each feature X. The function constrains the prediction between 0 and 1, interpreted as probability. For instance, let’s suppose we want to predict the probability of diabetes based on blood glucose levels. If the model predicts a probability of 0,7, it means that the patient has a 70% chance of having diabetes. If the decision threshold is set to 0,5, the patient will be classified as “diabetic”.
The results from logistic regression:
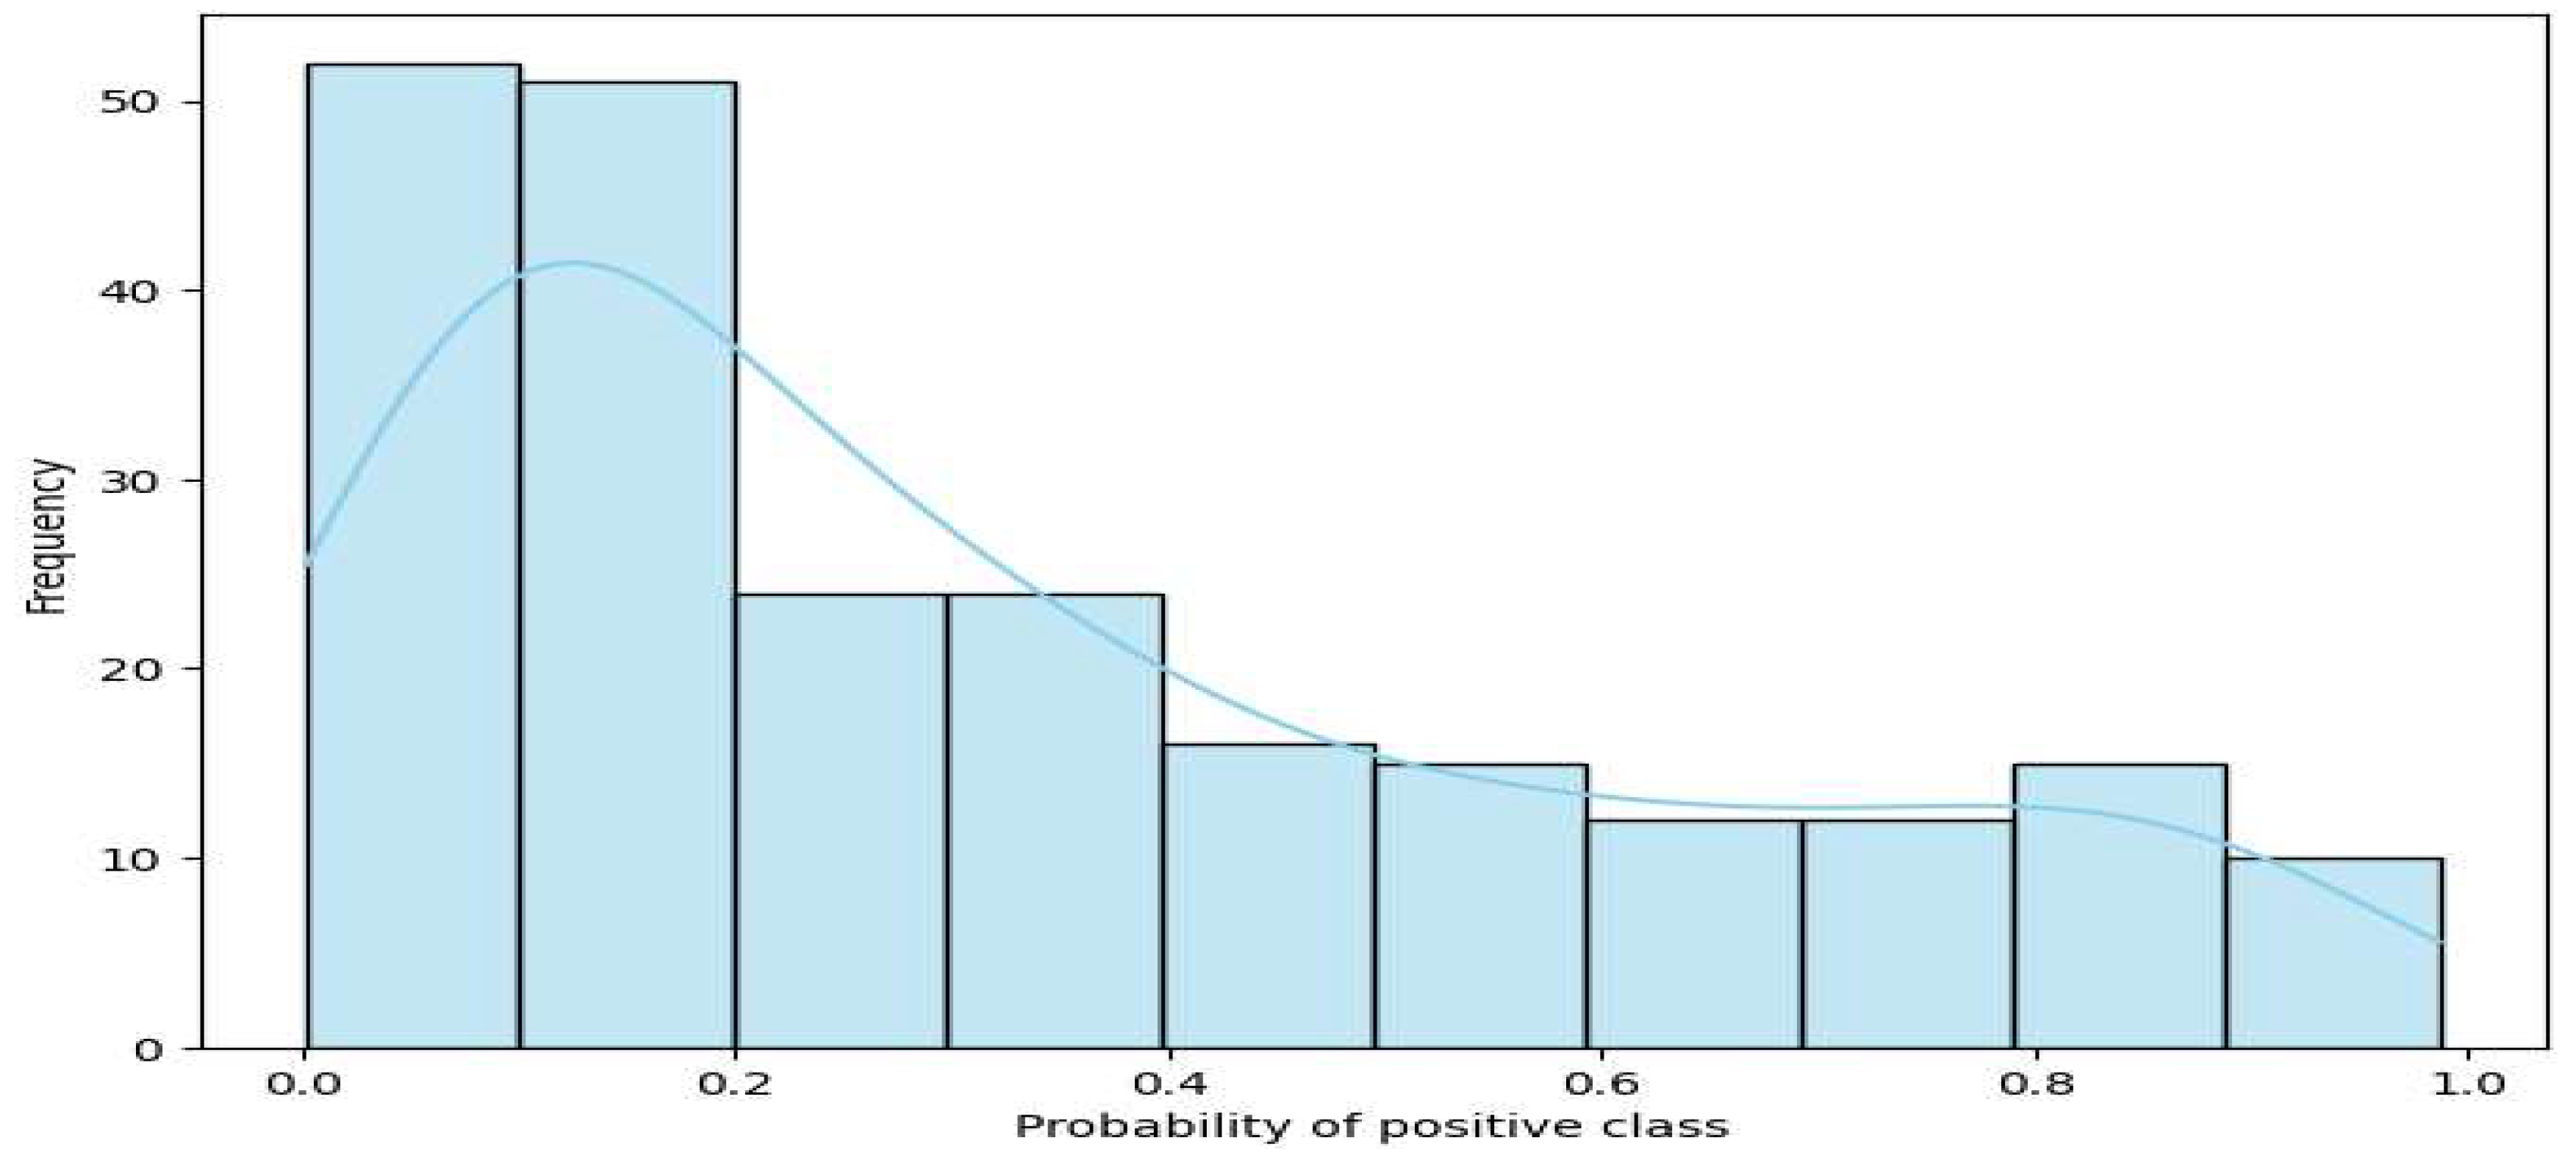
Figure 1.
Class probability distribution for logistic regression.
Figure 1.
Class probability distribution for logistic regression.
Table 1,
Table 2,
Table 3 and
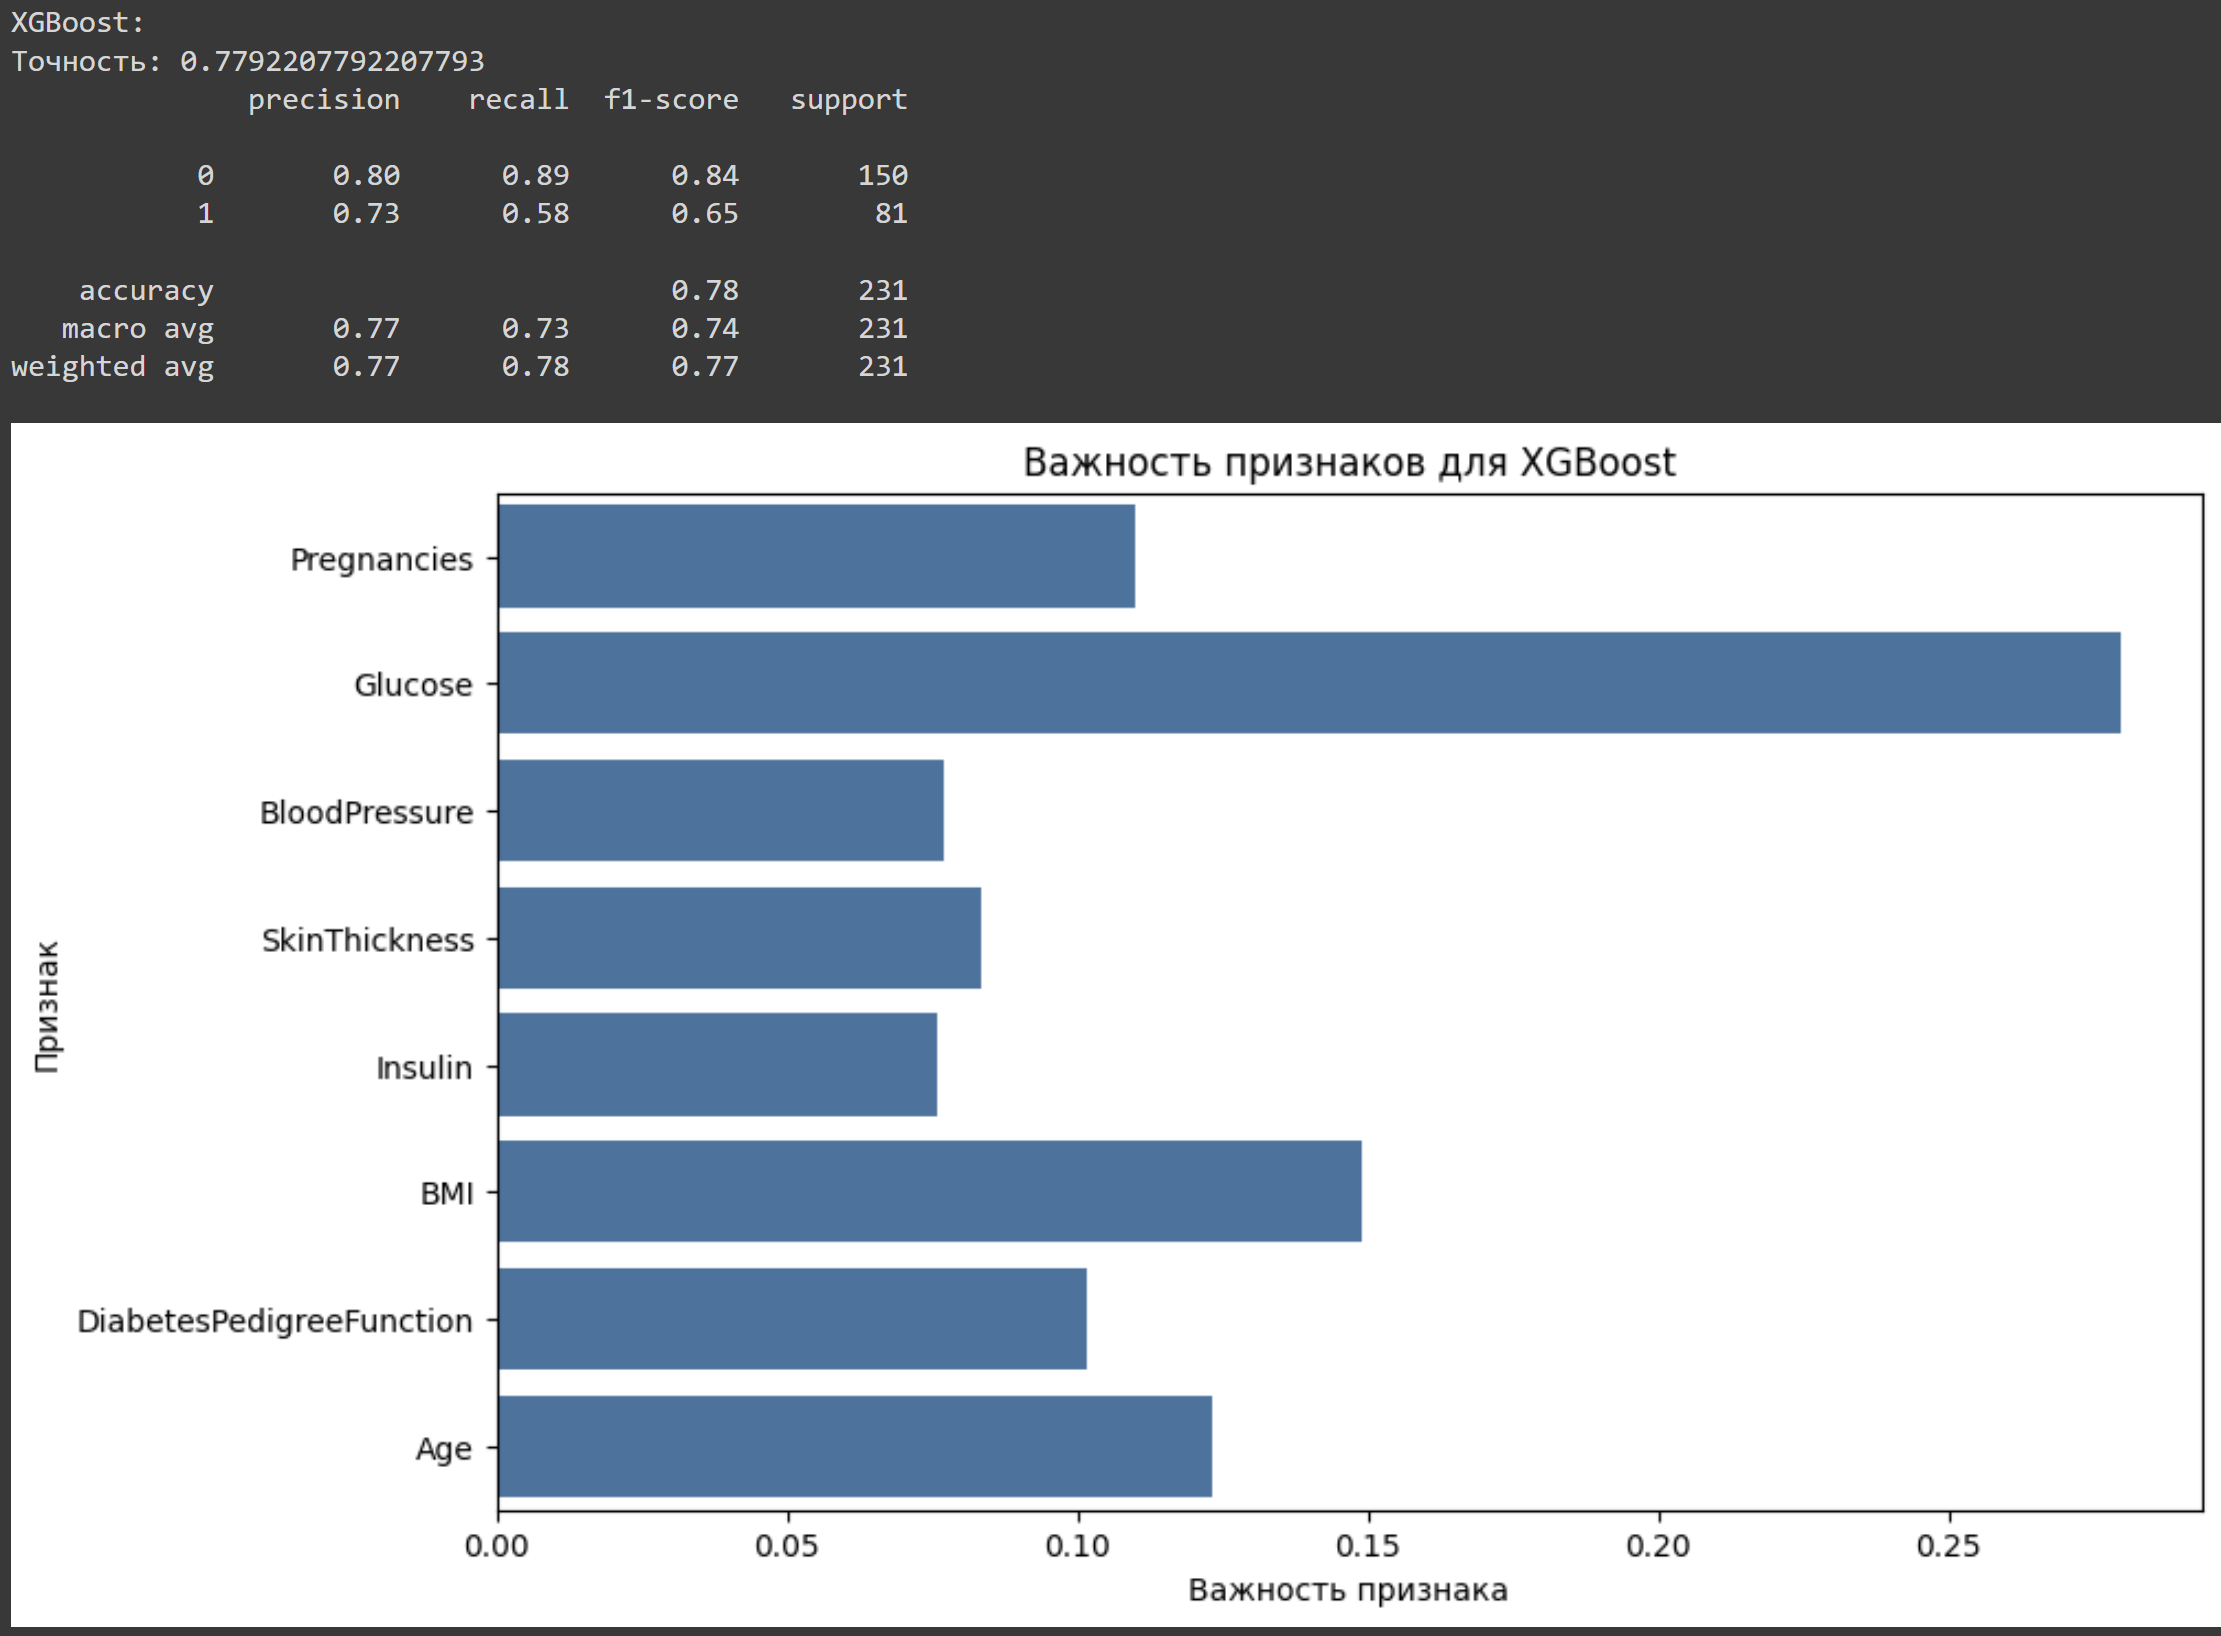
Table 4 show the performance of four models—Logistic Regression, Decision Tree, Gradient Boosting, and XGBoost—for predicting diabetes. The metrics include precision, which measures how many predicted positives are correct, and recall, which shows how well the model finds actual positives. F1-Score combines precision and recall into one value, while support indicates the number of true instances in each class, such as 1 for diabetes cases and 0 for non-diabetes cases.
The
Figure 1 shows the probability distribution of the positive class, usually class “1” for the predictions of the logistic regression model. In the graph, the X-axis represents the probabilities of being in the positive class predicted by the model. Values range from 0 to 1, where 0 means that an object has a high probability of belonging to a negative class and 1 means that it belongs to a positive class. The Y-axis shows the frequency (how many objects fell into each probability category). Here we can see that most of the objects have probability lower than 0,5, which can indicate that for most of the objects, the model predicted the negative class with high confidence. The graph also shows a smooth density contour (line), which helps visualize how the predicted probabilities are distributed across all objects.
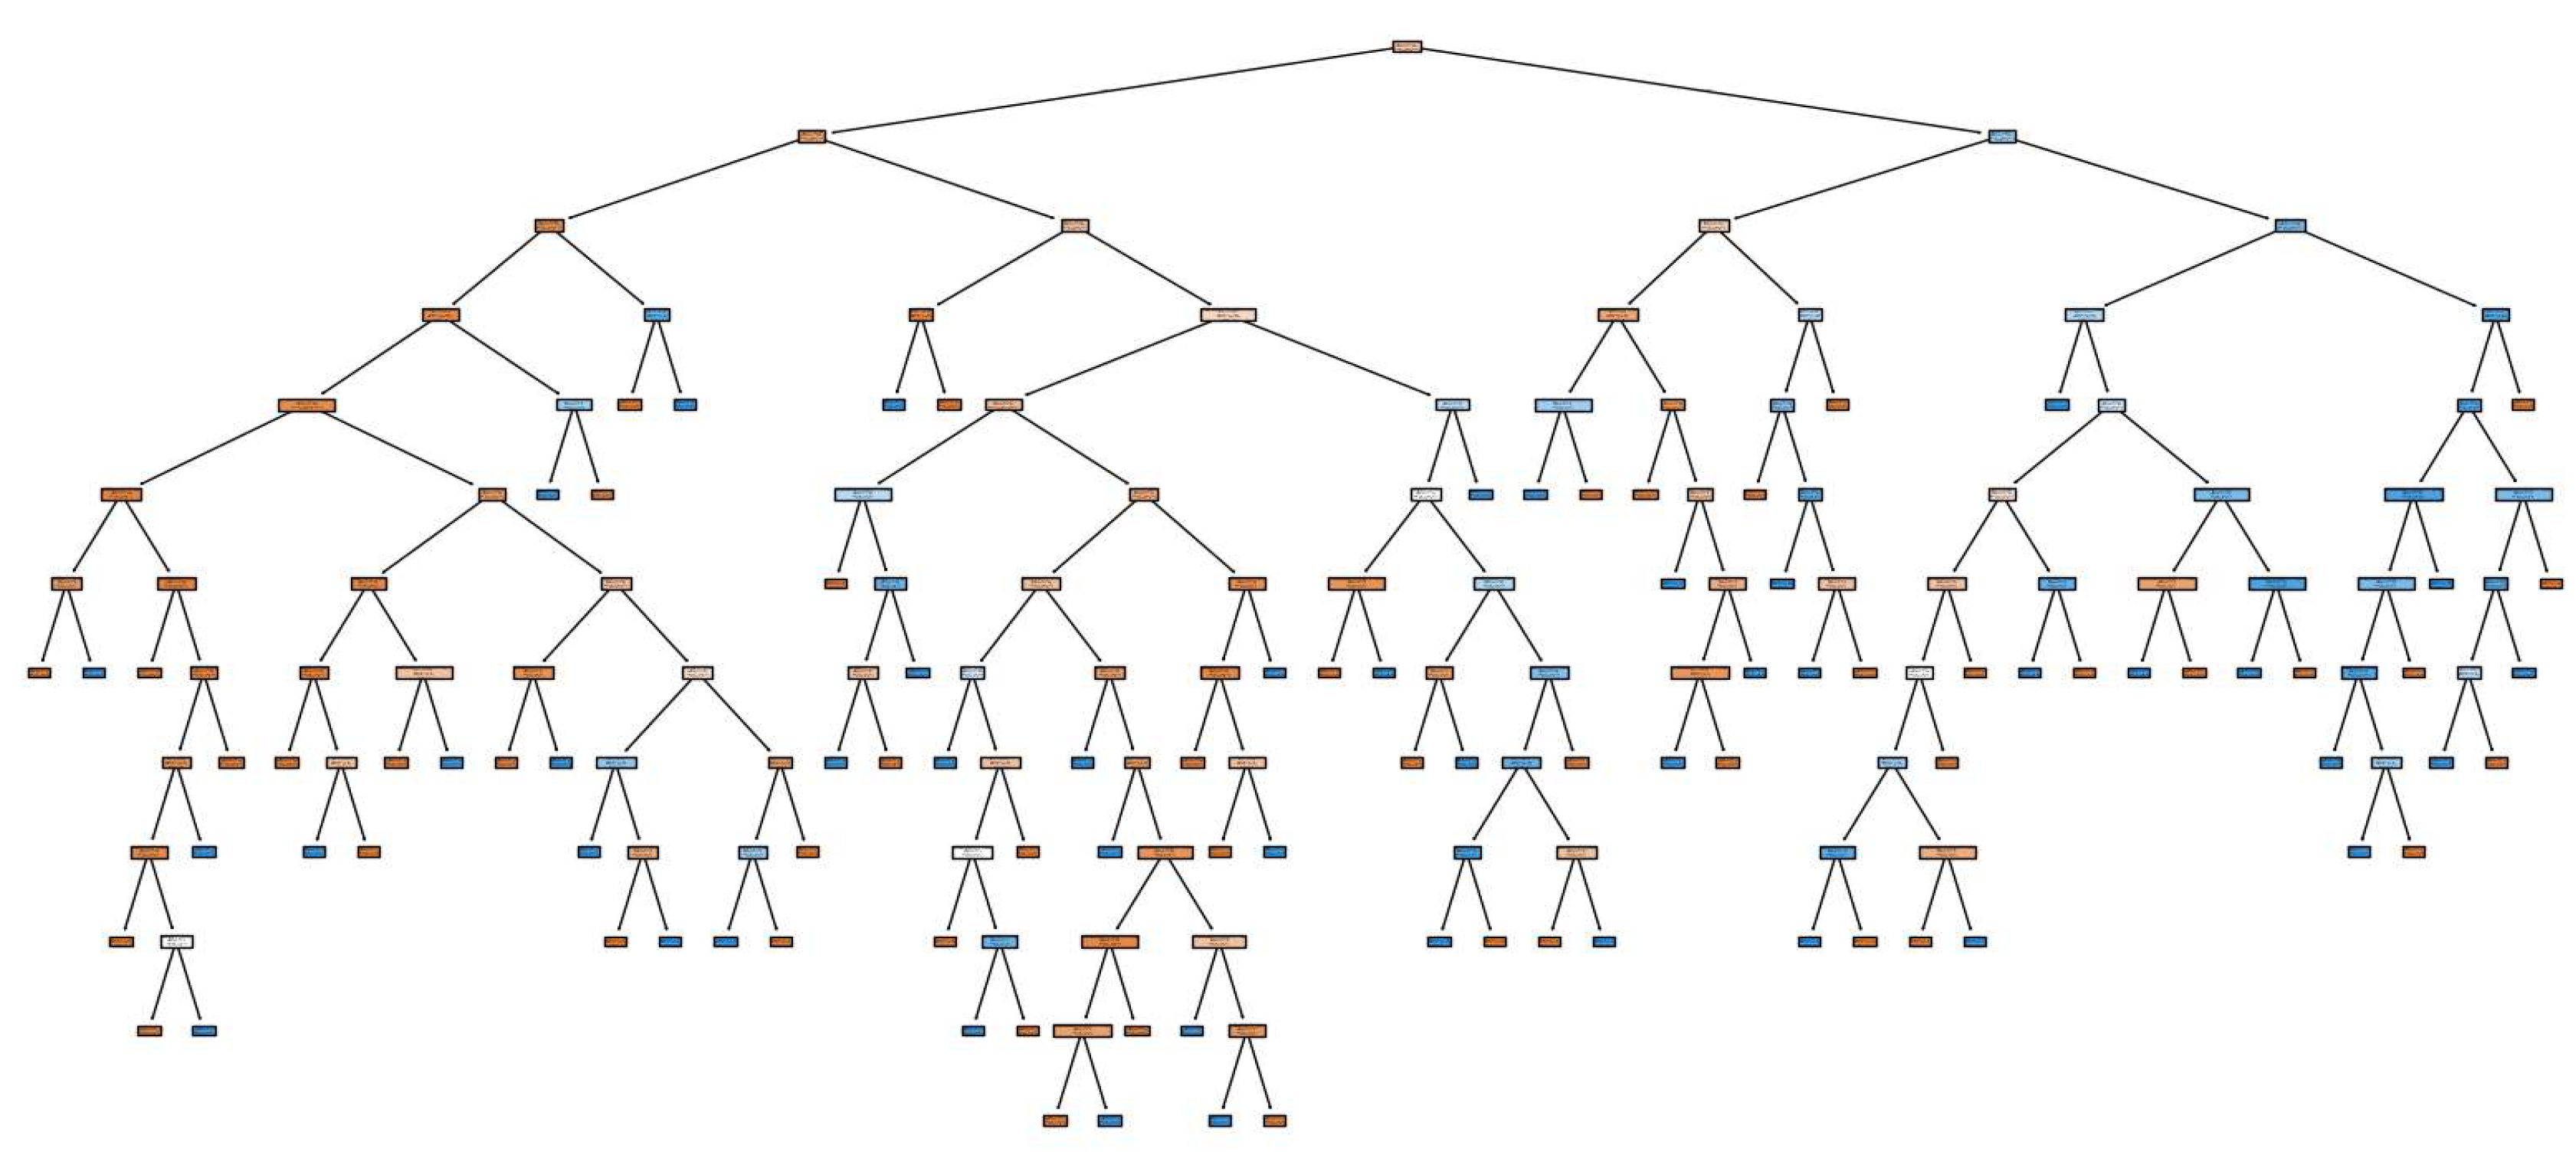
A decision tree constructs a sequence of branches to divide data into classes. At each step, the tree selects the feature that best divides the data, minimizing class heterogeneity by entropy criterion or Gini index, as I mentioned above. Suppose we want to determine whether a patient has diabetes. The tree might first ask if the glucose level is above 120. If yes, then the probability of diabetes increases and the tree moves on to the next question, such as age. The final “leaves” contain class predictions. Advantages and disadvantages, ease of interpretation because the result is clear (rules of thumb) but tendency to overtraining if the tree is too deep.
The results from decision tree:
Figure 2.
Decision tree structure.
Figure 2.
Decision tree structure.
The
Figure 2 shows how a decision tree makes decisions based on the attributes of the data. The tree structure has the following key points. The root node (at the top of the tree) is the first and most important division based on which the tree divides the data. This node is chosen based on the trait that best divides the data into classes. For example, if this is a diabetes prediction model, the root node might be based on glucose levels as it has the strongest influence on predictions. The branches are the next divisions that take other attributes into account. At each level of the tree, the model selects the feature that best separates the data given the antecedent conditions. For example, after glucose levels, the tree may consider age or BMI for further separations. Leaf nodes are the final nodes where the tree completes the classification process. Each leaf node reflects the final model prediction for the corresponding data group. In these nodes, the tree stores the final classes, diabetes or healthy. The more leaf nodes, the more accurately the model can classify the data, but too many leaves can lead to overfitting.
XGBoost or Extreme Gradient Boosting is an improved version of Gradient Boosting that makes predictions faster and more accurate thanks to many optimizations. It also uses several additional tricks, such as regularization, which helps avoid overtraining, and parallel processing, which speeds up learning. The basic idea behind XGBoost, like Gradient Boosting, is that each successive tree focuses on the errors of the previous ones, but with increased efficiency and speed. For example, imagine that XGBoost is a team of experts, each of whom quickly draws conclusions and corrects the errors of the previous ones. Each expert (tree) adds its share of prediction, and so, step by step, the model becomes more and more accurate. It has high accuracy, high speed, excellent performance on big data, but also it can be more complex parameter tuning, resource intensive with large amounts of data.
Gradient Boosting creates a series of “weak models” (usually decision trees), each of which tries to improve the errors of previous models. At each step, a new model is trained on the residuals (errors) of the previous models, allowing the system to adjust its predictions. Each tree is built from the residual errors and added to the model with a certain weight, configurable with a learning rate parameter. For instance, suppose the first model in a series predicted diabetes for 60% of patients correctly, but made errors for the remaining 40%. The next tree is trained only on this 40% and the process continues until the total error is minimized.
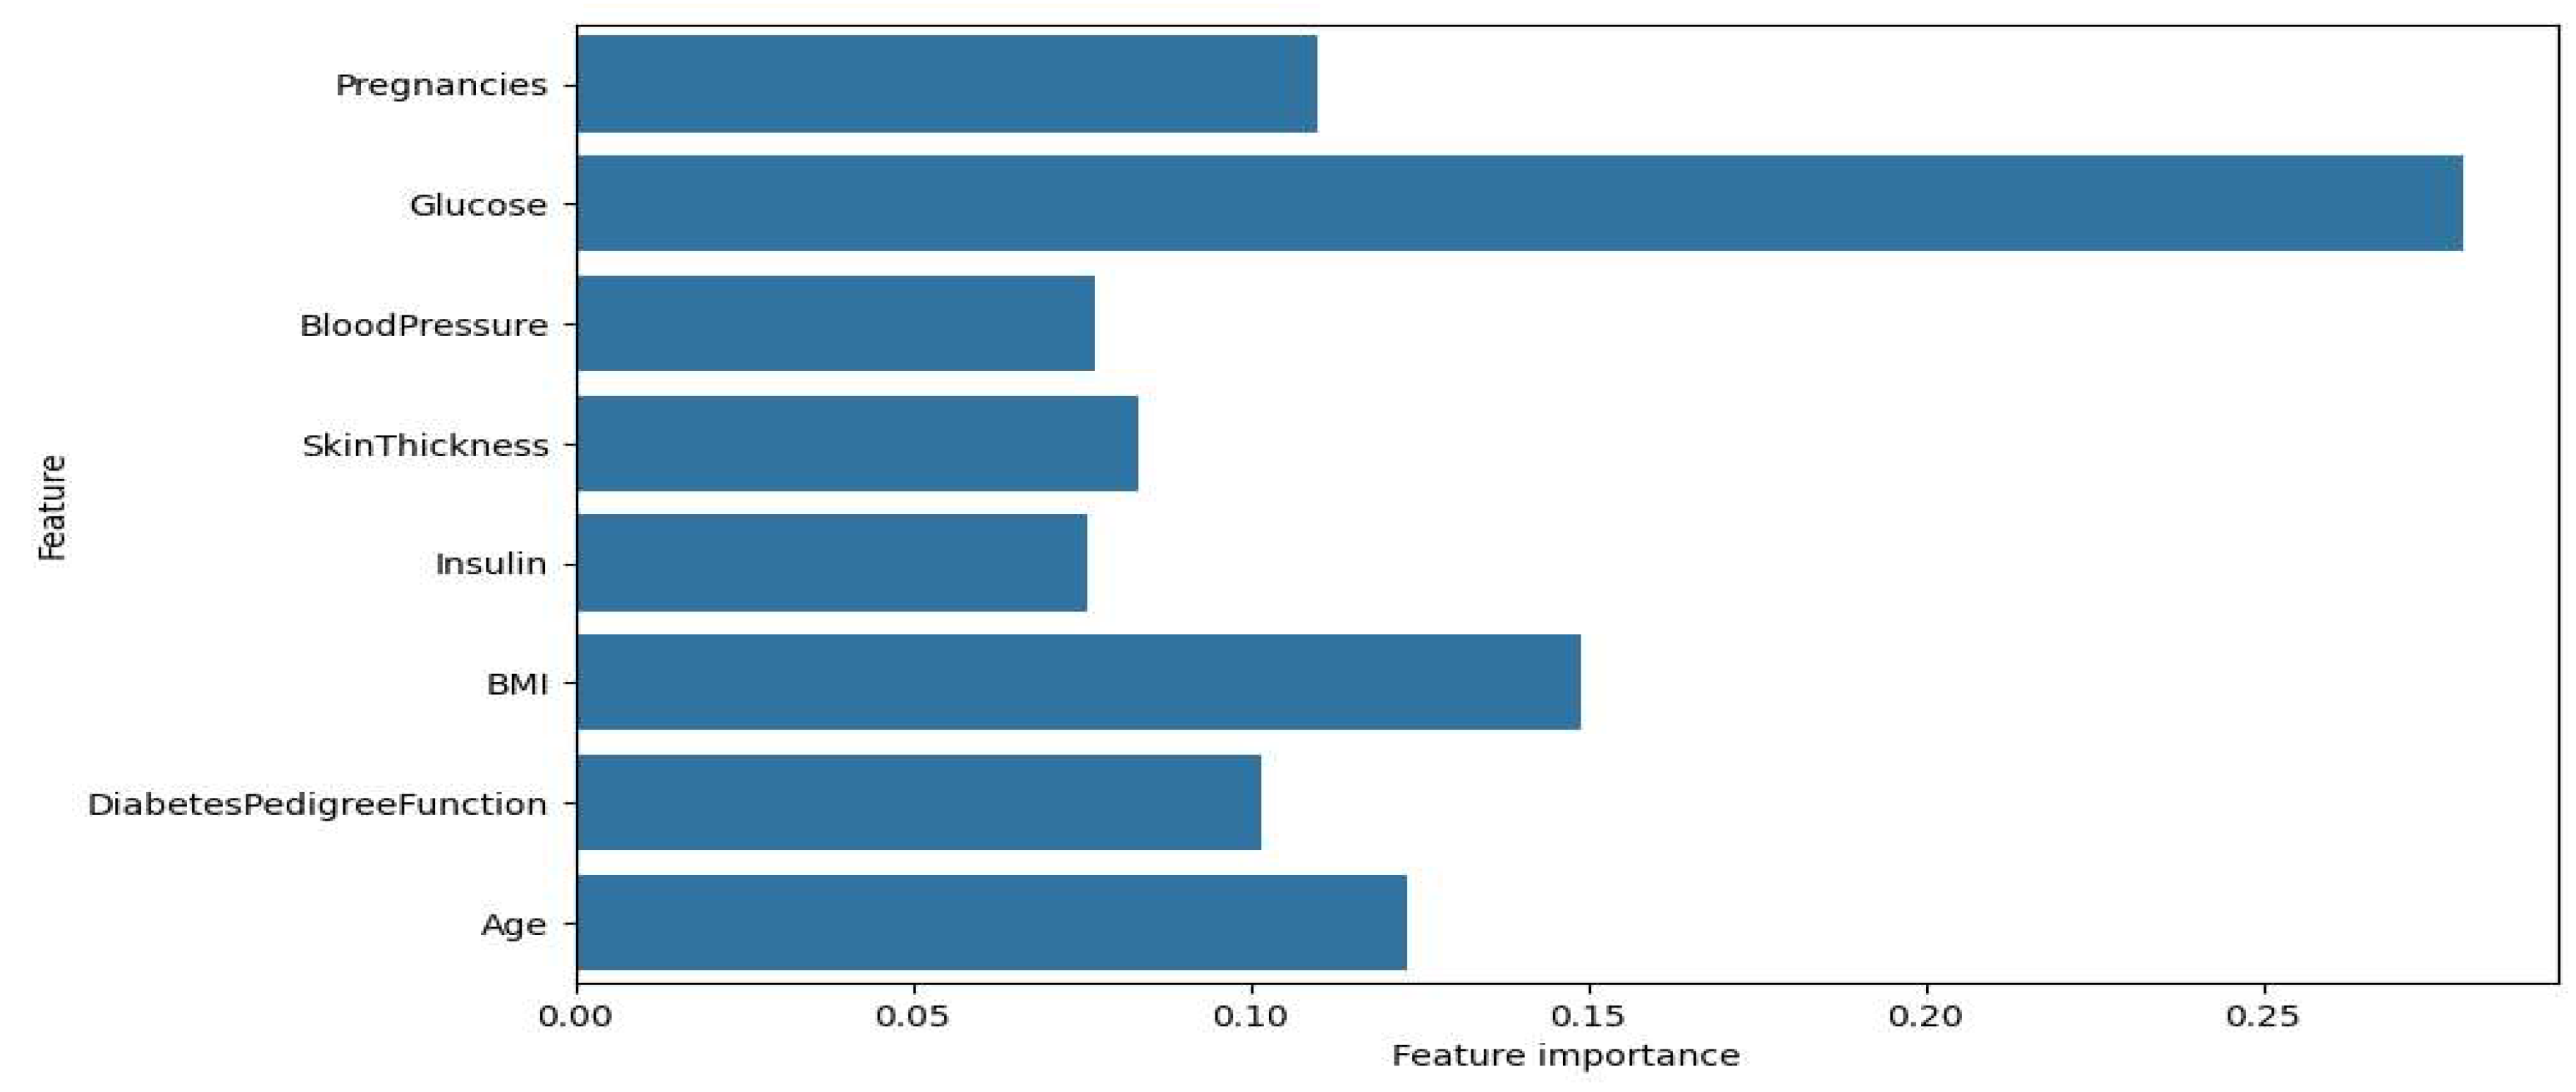
The results from gradient boosting
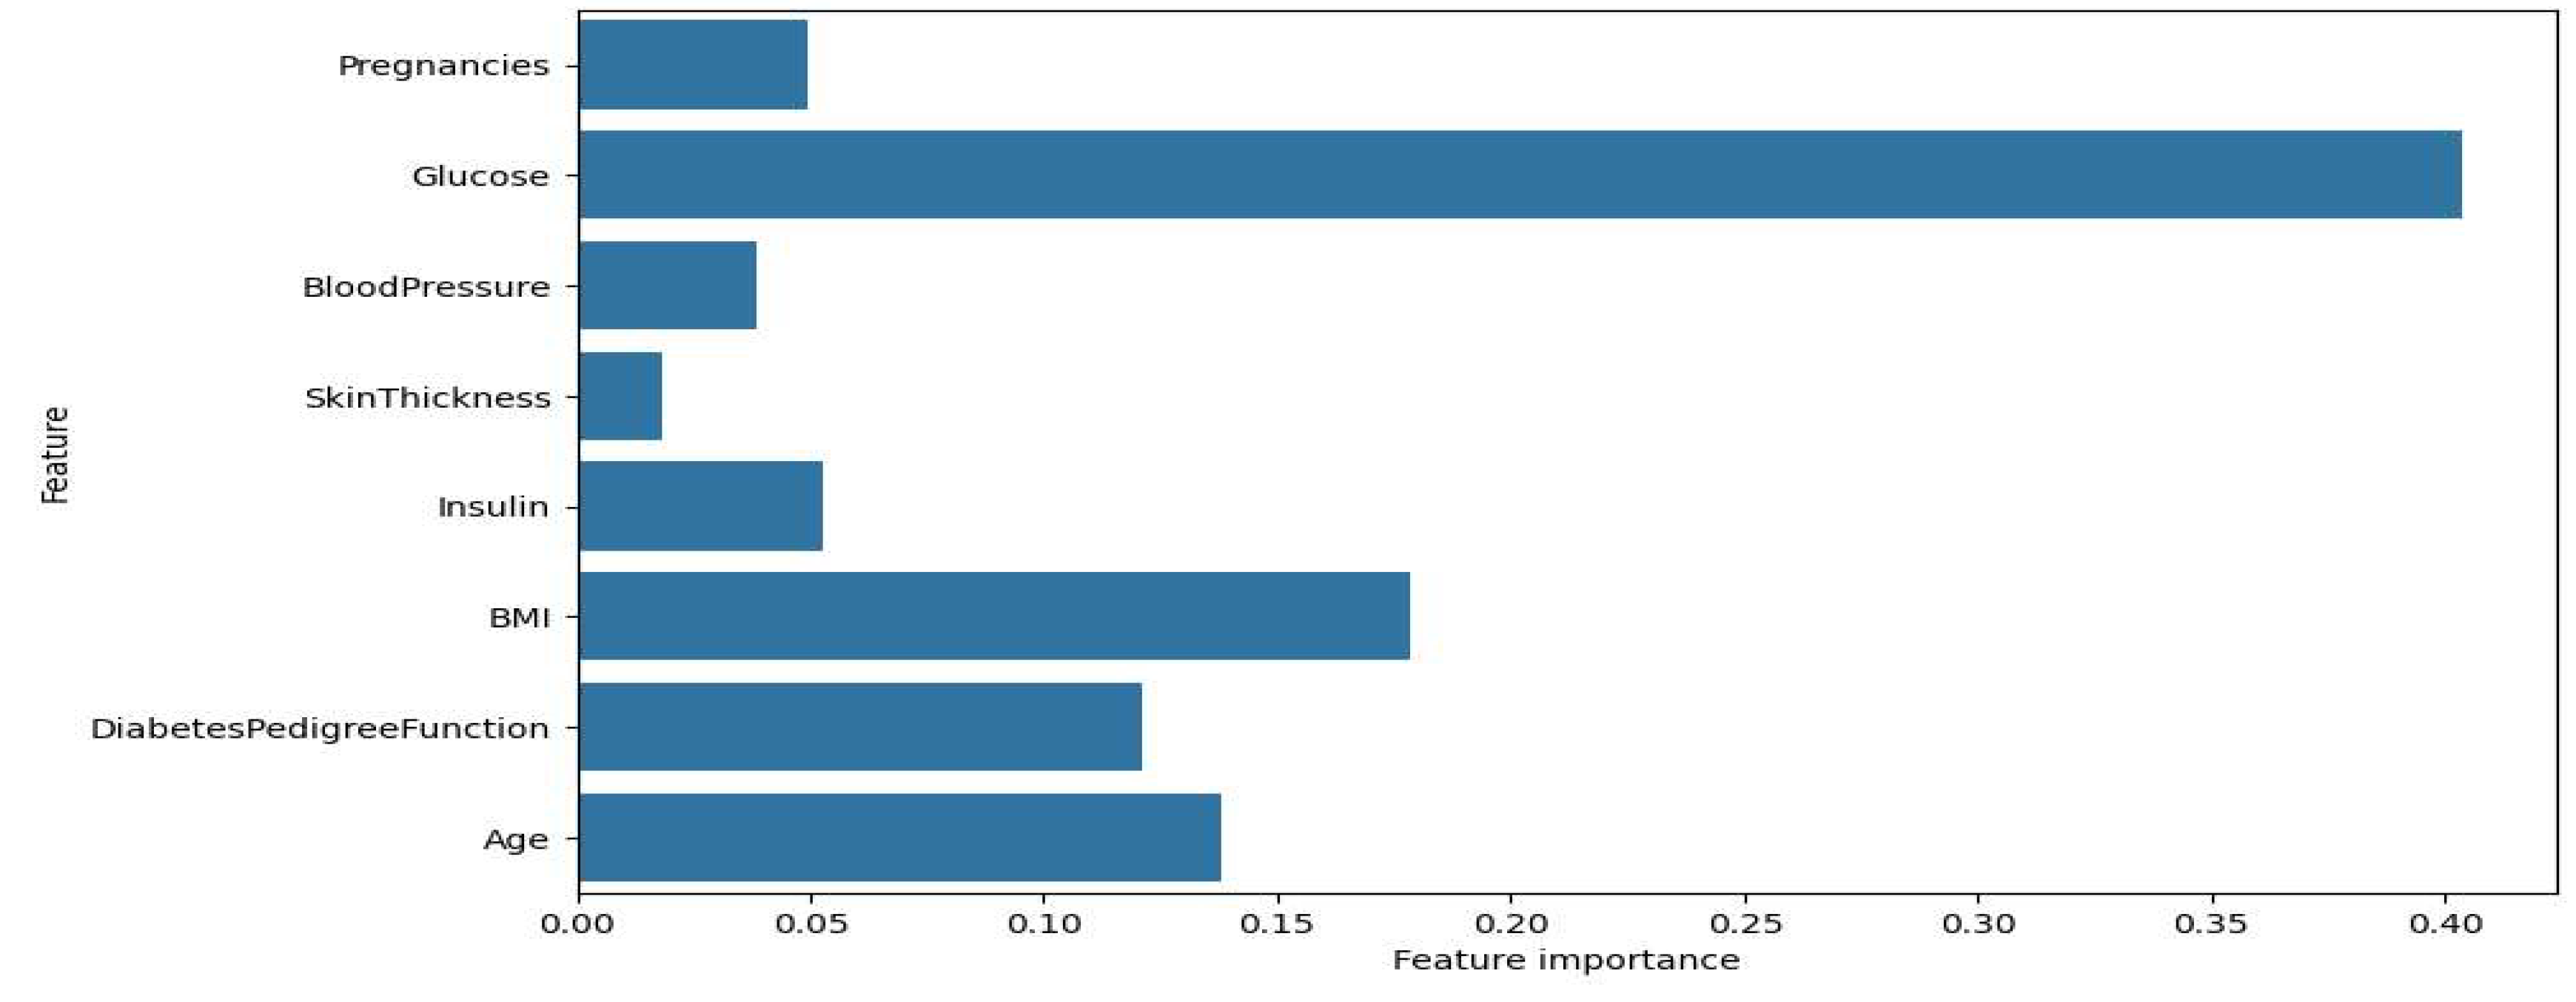
Figure 3.
Significance of features for Gradient Boosting.
Figure 3.
Significance of features for Gradient Boosting.
The results from XGBoost
Figure 4.
Sign importance for XGBoost.
Figure 4.
Sign importance for XGBoost.
Figure 3 and
Figure 4 show the feature importance graphs for the XGBoost and Gradient Boosting models. Significance for XGBoost is, as graph shows that the most important sign for XGBoost is glucose, with an importance coefficient significantly higher than the other signs. The other important attributes include BMI, pregnancies, and age, which also influence the model's prediction, but to a lesser extent. The attributes SkinThickness, insulin, and DiabetesPedigreeFunction have less weight, indicating their relatively low importance for the model. About trait importance for Gradient Boosting, the second graph shows that the distribution of trait importance for Gradient Boosting is slightly different. Glucose also remains the most important trait, but its importance value is even higher. The traits BMI, age, and DiabetesPedigreeFunction also show notable importance, but less than glucose. It is important to note that BloodPressure and insulin are less significant in the Gradient Boosting model than in XGBoost.
Discussion
It is important to note that the accuracy of predictions directly depends on the quality of data and the choice of models. Logistic regression, due to its simplicity and linear nature, produces interpretable results that can be useful for medical professionals. This makes it the preferred choice when not only the accuracy of the model is important, but also its ability to explain the relationships between risk factors and disease probability. Decision trees, on the other hand, offer a more flexible and sophisticated approach that can better handle nonlinear dependencies in the data. One advantage of decision trees is their ability to handle categorical attributes without the need to preprocess them, which simplifies the model building process. However, it is worth noting that decision trees can be prone to overfitting, especially on small datasets, which reduces their ability to generalize. It is important to consider these factors when selecting a model for a particular medical application. The results of both models will depend on a number of factors, such as the balance of classes in the data (number of patients with and without diabetes), the quality of the features, and the presence of noise. If the data are skewed, the model may be prone to erroneous predictions in favor of the more prevalent class, requiring additional processing techniques such as class balancing or the use of additional metrics to assess the quality of model performance, such as the F1 measure, which accounts for both accuracy and completeness.
For the XGBoost model, the most significant feature was glucose level, which was found to be much more important compared to other features. This result is consistent with medical knowledge about the importance of glucose level in diagnosing diabetes. Other significant traits include BMI, number of pregnancies and age, which also have a marked effect on the model results, but to a lesser extent compared to glucose level. The attributes of skin thickness, insulin and family history of diabetes have minimal significance, suggesting that these attributes have low informativeness for the classification task in XGBoost. This may be due to either their correlation with more significant features or their weak association with the target feature.
Gradient Boosting confirms this pattern: the most important feature remains glucose level, and its significance is found to be even higher than in XGBoost. This indicates that Gradient Boosting relies even more heavily on this trait. The traits BMI, age and family history of diabetes also occupy important positions, but their significance is lower than that of glucose. Blood pressure and insulin traits have relatively low significance, indicating that they have little influence on prediction in Gradient Boosting.
From all experiments and results we have got the main accuracy of each method.
Table 5 shows the accuracy of four models used for predicting diabetes.
Conclusion
As a result of analyzing the importance of features in all models, it was found that Glucose has the greatest impact on predicting the target class, which confirms its medical importance in the diagnosis of diabetes. The traits BMI and Age also contribute, although they are inferior to Glucose in terms of significance. Particular attention should be paid to the differences between the models: in Gradient Boosting the significance of Glucose is even higher than in XGBoost, while the BloodPressure and Insulin attributes play a less significant role. The decision tree model, with its hierarchical structure, allows a detailed view of how each feature influences predictions. However, its complex structure indicates potential overfitting, suggesting that parameter tuning may be necessary for generalization. Logistic regression, on the other hand, exhibited a tendency to predict the negative class more frequently, possibly due to data imbalance or limited feature informativeness. To improve the accuracy of the models, it is recommended to balance the data so that logistic regression improves positive class predictions. It is also useful to optimize the decision tree parameters to reduce the risk of overfitting and to perform feature selection focusing on less informative data to increase their significance to the model. Gradient Boosting performed best with 86% accuracy, followed by XGBoost at 83.33%. Decision Tree and Logistic Regression showed slightly lower accuracy at 76.19% and 74.46%, respectively. This indicates that ensemble methods like Gradient Boosting are more effective for this task.
References
- Roglic G. (ed.). Global report on diabetes. – World Health Organization, 2016.
- Zou H., Hastie T. Regularization and variable selection via the elastic net //Journal of the Royal Statistical Society Series B: Statistical Methodology. – 2005. – Т. 67. – №. 2. – P. 301-320.
- Breiman L. Random forests //Machine learning. – 2001. – Т. 45. – P. 5-32.
- Choi B. G. et al. Machine learning for the prediction of new-onset diabetes mellitus during 5-year follow-up in non-diabetic patients with cardiovascular risks //Yonsei medical journal. – 2019. – Т. 60. – №. 2. – 191 p.
- Hosmer Jr D. W., Lemeshow S., Sturdivant R. X. Applied logistic regression. – John Wiley & Sons, 2013.
- Chen T., Guestrin C. Xgboost: A scalable tree boosting system //Proceedings of the 22nd acm sigkdd international conference on knowledge discovery and data mining. – 2016. – P. 785-794.
- Atlas D. et al. IDF diabetes atlas. International Diabetes Federation (9th edition) [Electronic resource].
- Gaso M. S. et al. Utilizing Machine and Deep Learning Techniques for Predicting Re-admission Cases in Diabetes Patients //Proceedings of the International Conference on Computer Systems and Technologies 2024. – 2024. – P. 76-81.
- Emmanuel T. et al. A survey on missing data in machine learning //Journal of Big data. – 2021. – Т. 8. – P. 1-37.
- Friedman J. H. Greedy function approximation: a gradient boosting machine //Annals of statistics. – 2001. – P. 1189-1232.
- Shaiakhmetov D. et al. Morphological classification of galaxies using SpinalNet //2021 16th International Conference on Electronics Computer and Computation (ICECCO). – IEEE, 2021. – P. 1-5.
- Toktosunova A. et al. Developing an Artificial Intelligence Tool for Image Generation Using a Unique Dataset with Image-to-Image Functionality //Proceedings of the International Conference on Computer Systems and Technologies 2024. – 2024. – P. 132-136.
- Sadriddin Z., Mekuria R. R., Gaso M. S. Machine Learning Models for Advanced Air Quality Prediction //Proceedings of the International Conference on Computer Systems and Technologies 2024. – 2024. – P. 51-56.
|
Disclaimer/Publisher’s Note: The statements, opinions and data contained in all publications are solely those of the individual author(s) and contributor(s) and not of MDPI and/or the editor(s). MDPI and/or the editor(s) disclaim responsibility for any injury to people or property resulting from any ideas, methods, instructions or products referred to in the content. |
© 2024 by the authors. Licensee MDPI, Basel, Switzerland. This article is an open access article distributed under the terms and conditions of the Creative Commons Attribution (CC BY) license (http://creativecommons.org/licenses/by/4.0/).