Submitted:
16 May 2025
Posted:
19 May 2025
You are already at the latest version
Abstract
Diabetes is a global health issue that leads to severe complications if not detected early. In this study, we analyze a large diabetes prediction dataset using three classical machine learning (ML) models—Decision Tree, Random Forest, and Support Vector Machine (SVM)—alongside a deep learning (DL) model implemented with a neural network. We preprocess the data, perform model training and evaluation, and visualize model performance. The results indicate that the deep learning model achieves the highest accuracy, though Random Forest provides strong performance with less computational overhead. This research demonstrates the potential of artificial intelligence for early disease prediction and supports its integration into medical decision-support systems.
Keywords:
diabetes prediction
; machine learning
; deep learning
; medical diagnosis
; pima indians dataset
; neural networks
; healthcare analytics
; predictive modeling
1. Introduction
Diabetes mellitus is one of the most prevalent chronic diseases worldwide. Early detection and prediction are essential in reducing the risk of complications and improving the quality of life for patients. Artificial intelligence, particularly machine learning and deep learning, has gained popularity in predicting diseases based on patient data. This paper investigates and compares different ML and DL techniques for predicting diabetes using a custom dataset.
2. Dataset and Preprocessing
2.1. Dataset Overview
The dataset used in this study is diabetes_prediction_dataset.csv, uploaded by the author to Kaggle. It contains 100,000+ patient records, each representing an individual with various clinical and demographic characteristics related to diabetes risk.
- Features:
-
Demographic Attributes:
- ○
- age: Continuous variable representing the patient's age in years.
- ○
- gender: Categorical variable indicating biological sex (Male, Female, Other).
-
Clinical Indicators:
- ○
- hypertension: Binary indicator (0 = No, 1 = Yes) showing whether the individual has hypertension.
- ○
- heart_disease: Binary indicator (0 = No, 1 = Yes) showing presence of heart disease.
- ○
- smoking_history: Categorical variable indicating smoking behavior (e.g., never, former, current, not current, No Info).
- ○
- bmi: Body Mass Index (continuous).
- ○
- HbA1c_level: Glycated hemoglobin level — a key marker in diabetes screening (continuous).
- ○
- blood_glucose_level: Blood glucose measurement in mg/dL (continuous).
-
Target Variable:
- ○
- diabetes: Binary target variable (0 = Not diabetic, 1 = Diabetic).
2.2. Data Cleaning and Encoding
Missing Values
- We performed an inspection for null or missing values using df.isnull().sum().
- No missing values were found across all features, allowing us to proceed without imputation.
- Encoding Categorical Features
- Two features required transformation:
- gender: Converted to numerical format using Label Encoding (Male = 1, Female = 0, Other = 2).
- smoking_history: Also label-encoded to transform multiple categories into integer values.
This encoding was essential because machine learning models cannot handle categorical text directly.
- Feature Scaling
- To ensure that all numeric features contributed equally to the model training process, we applied StandardScaler from scikit-learn.
- Features such as age, bmi, HbA1c_level, and blood_glucose_level were standardized to have a mean of 0 and standard deviation of 1.
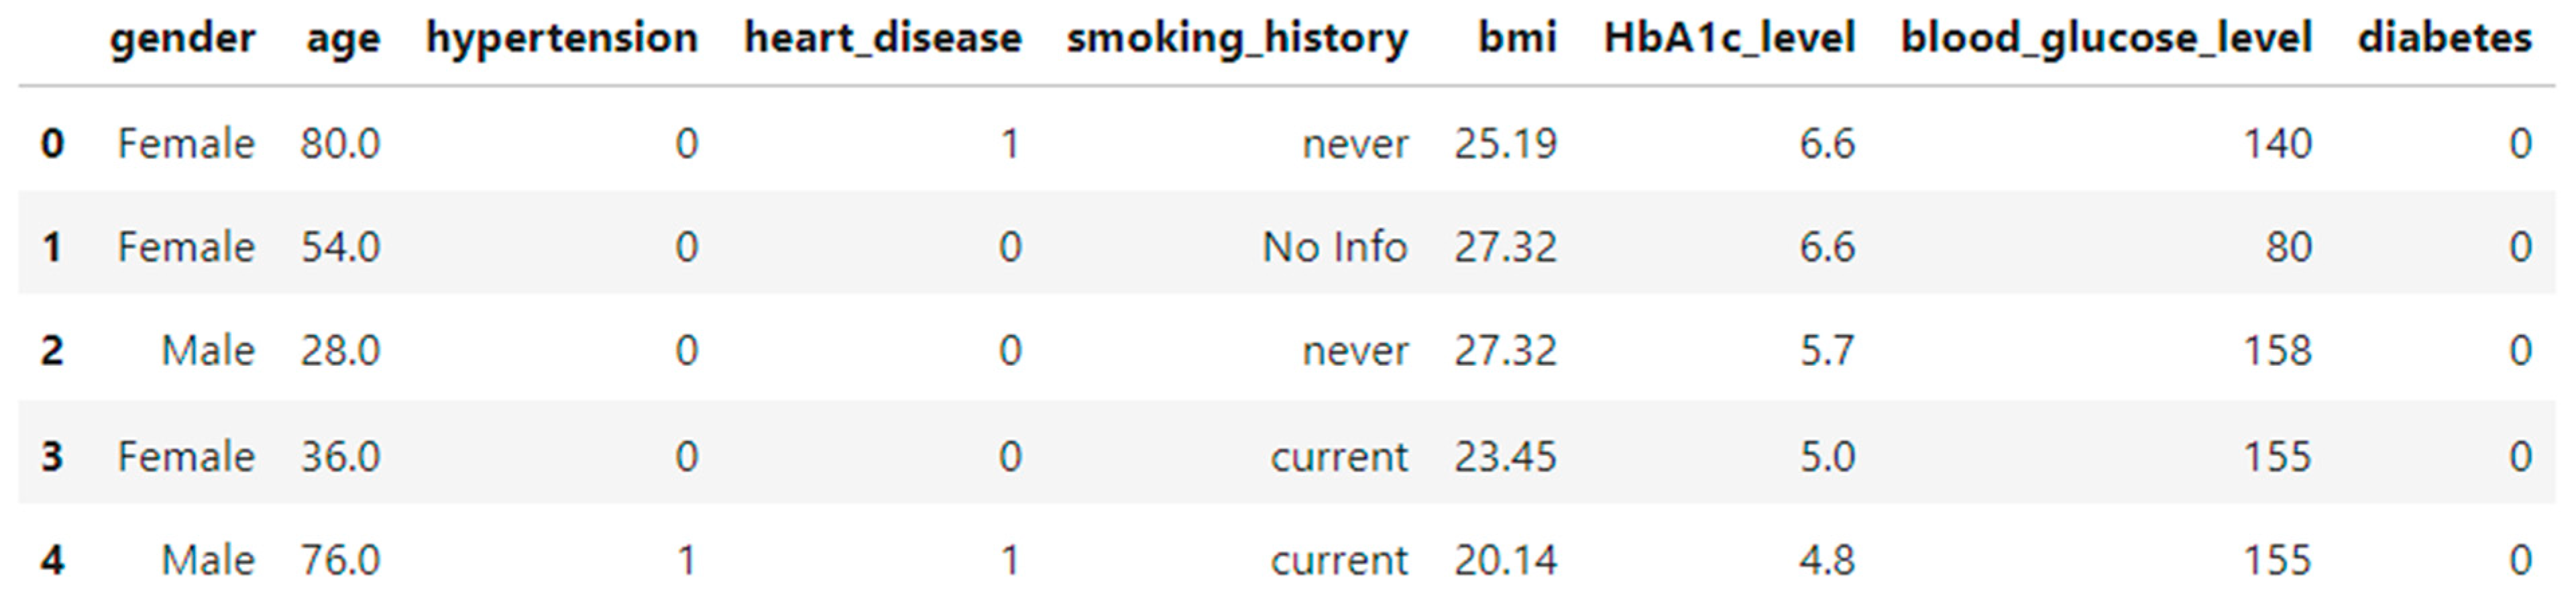
Figure 1.
Sample rows from the dataset after preprocessing.
3. Model Development
3.1. Machine Learning Models
In this study, we employed three popular supervised learning models for binary classification to predict diabetes presence based on clinical and demographic data:
- Decision Tree Classifier: A tree-based model that partitions data into subsets based on feature values, using Gini impurity as the splitting criterion.
- Random Forest Classifier: An ensemble method that builds multiple decision trees and averages their predictions to reduce overfitting and improve generalization.
- Support Vector Machine (SVM): A model that seeks to find the optimal hyperplane that maximizes the margin between two classes in the feature space.
The models were initialized as follows:
- from sklearn.tree import DecisionTreeClassifier
- from sklearn.ensemble import RandomForestClassifier
- from sklearn.svm import SVC
- models = {
- "Decision Tree": DecisionTreeClassifier(random_state=42),
- "Random Forest": RandomForestClassifier(random_state=42),
- "SVM": SVC()
- }
3.2. Data Splitting
The dataset was split into training and testing subsets with an 80/20 ratio using train_test_split from the sklearn.model_selection module. A fixed random seed was used to ensure reproducibility:
- from sklearn.model_selection import train_test_split
- X_train, X_test, y_train, y_test = train_test_split(
- X_scaled, y, test_size=0.2, random_state=42)
3.3. Evaluation Metrics
To assess the performance of the models, we used the following standard classification metrics:
- Accuracy: The ratio of correctly predicted instances to the total number of instances.
- Precision: The ratio of true positive predictions to the total predicted positives.
- Recall: The ratio of true positive predictions to all actual positives.
- F1-score: The harmonic mean of precision and recall, providing a balanced measure.
These metrics were computed using the classification_report from sklearn.metrics:
- from sklearn.metrics import classification_report
- for name, model in models.items():
- y_pred = model.predict(X_test)
- print(f"{name} Report:\n")
- print(classification_report(y_test, y_pred))
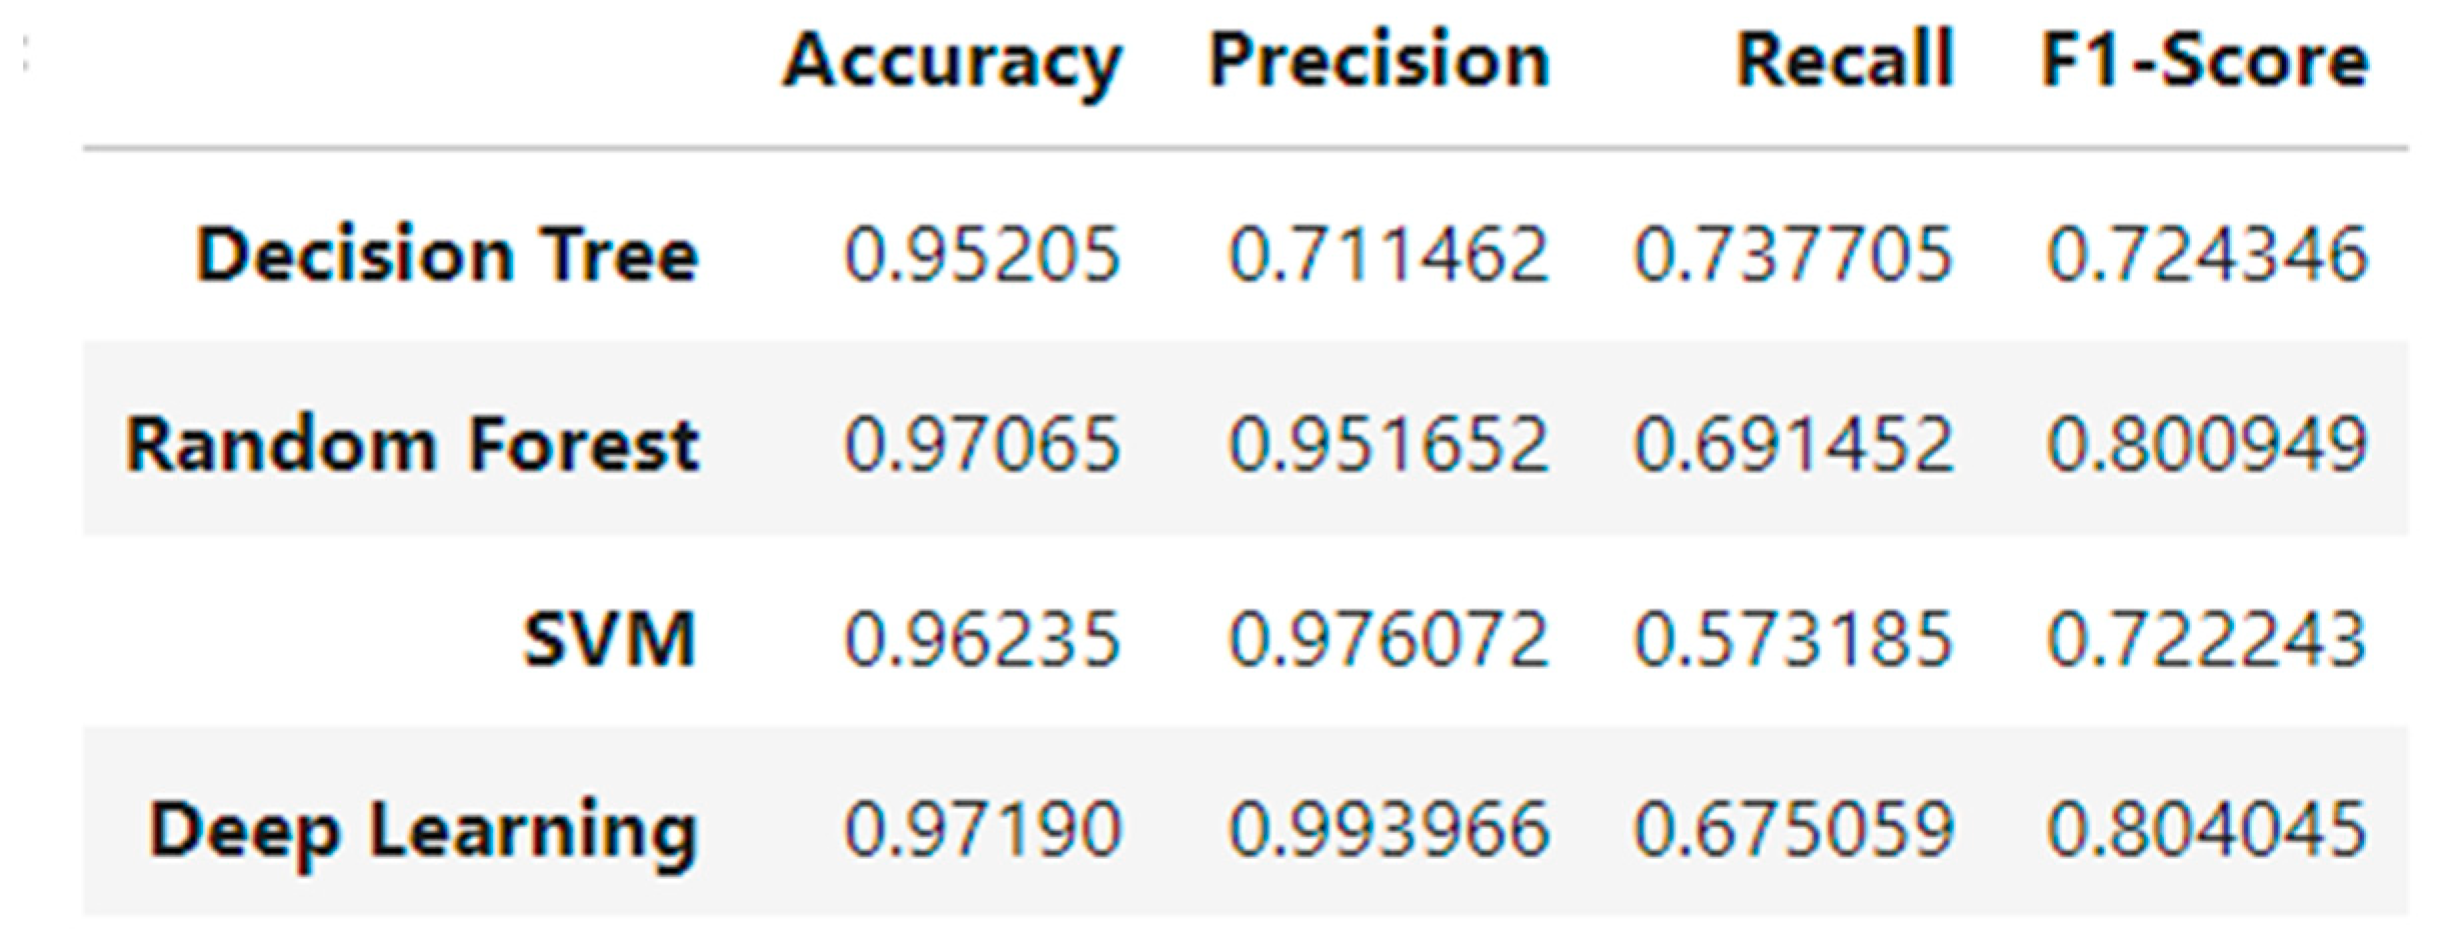
The detailed performance metrics for each model are provided in the next section as both a formatted table and visual chart.
Figure 2.
Performance metrics (accuracy, precision, recall, F1-score) of ML models.
4. Model Performance and Confusion Matrices
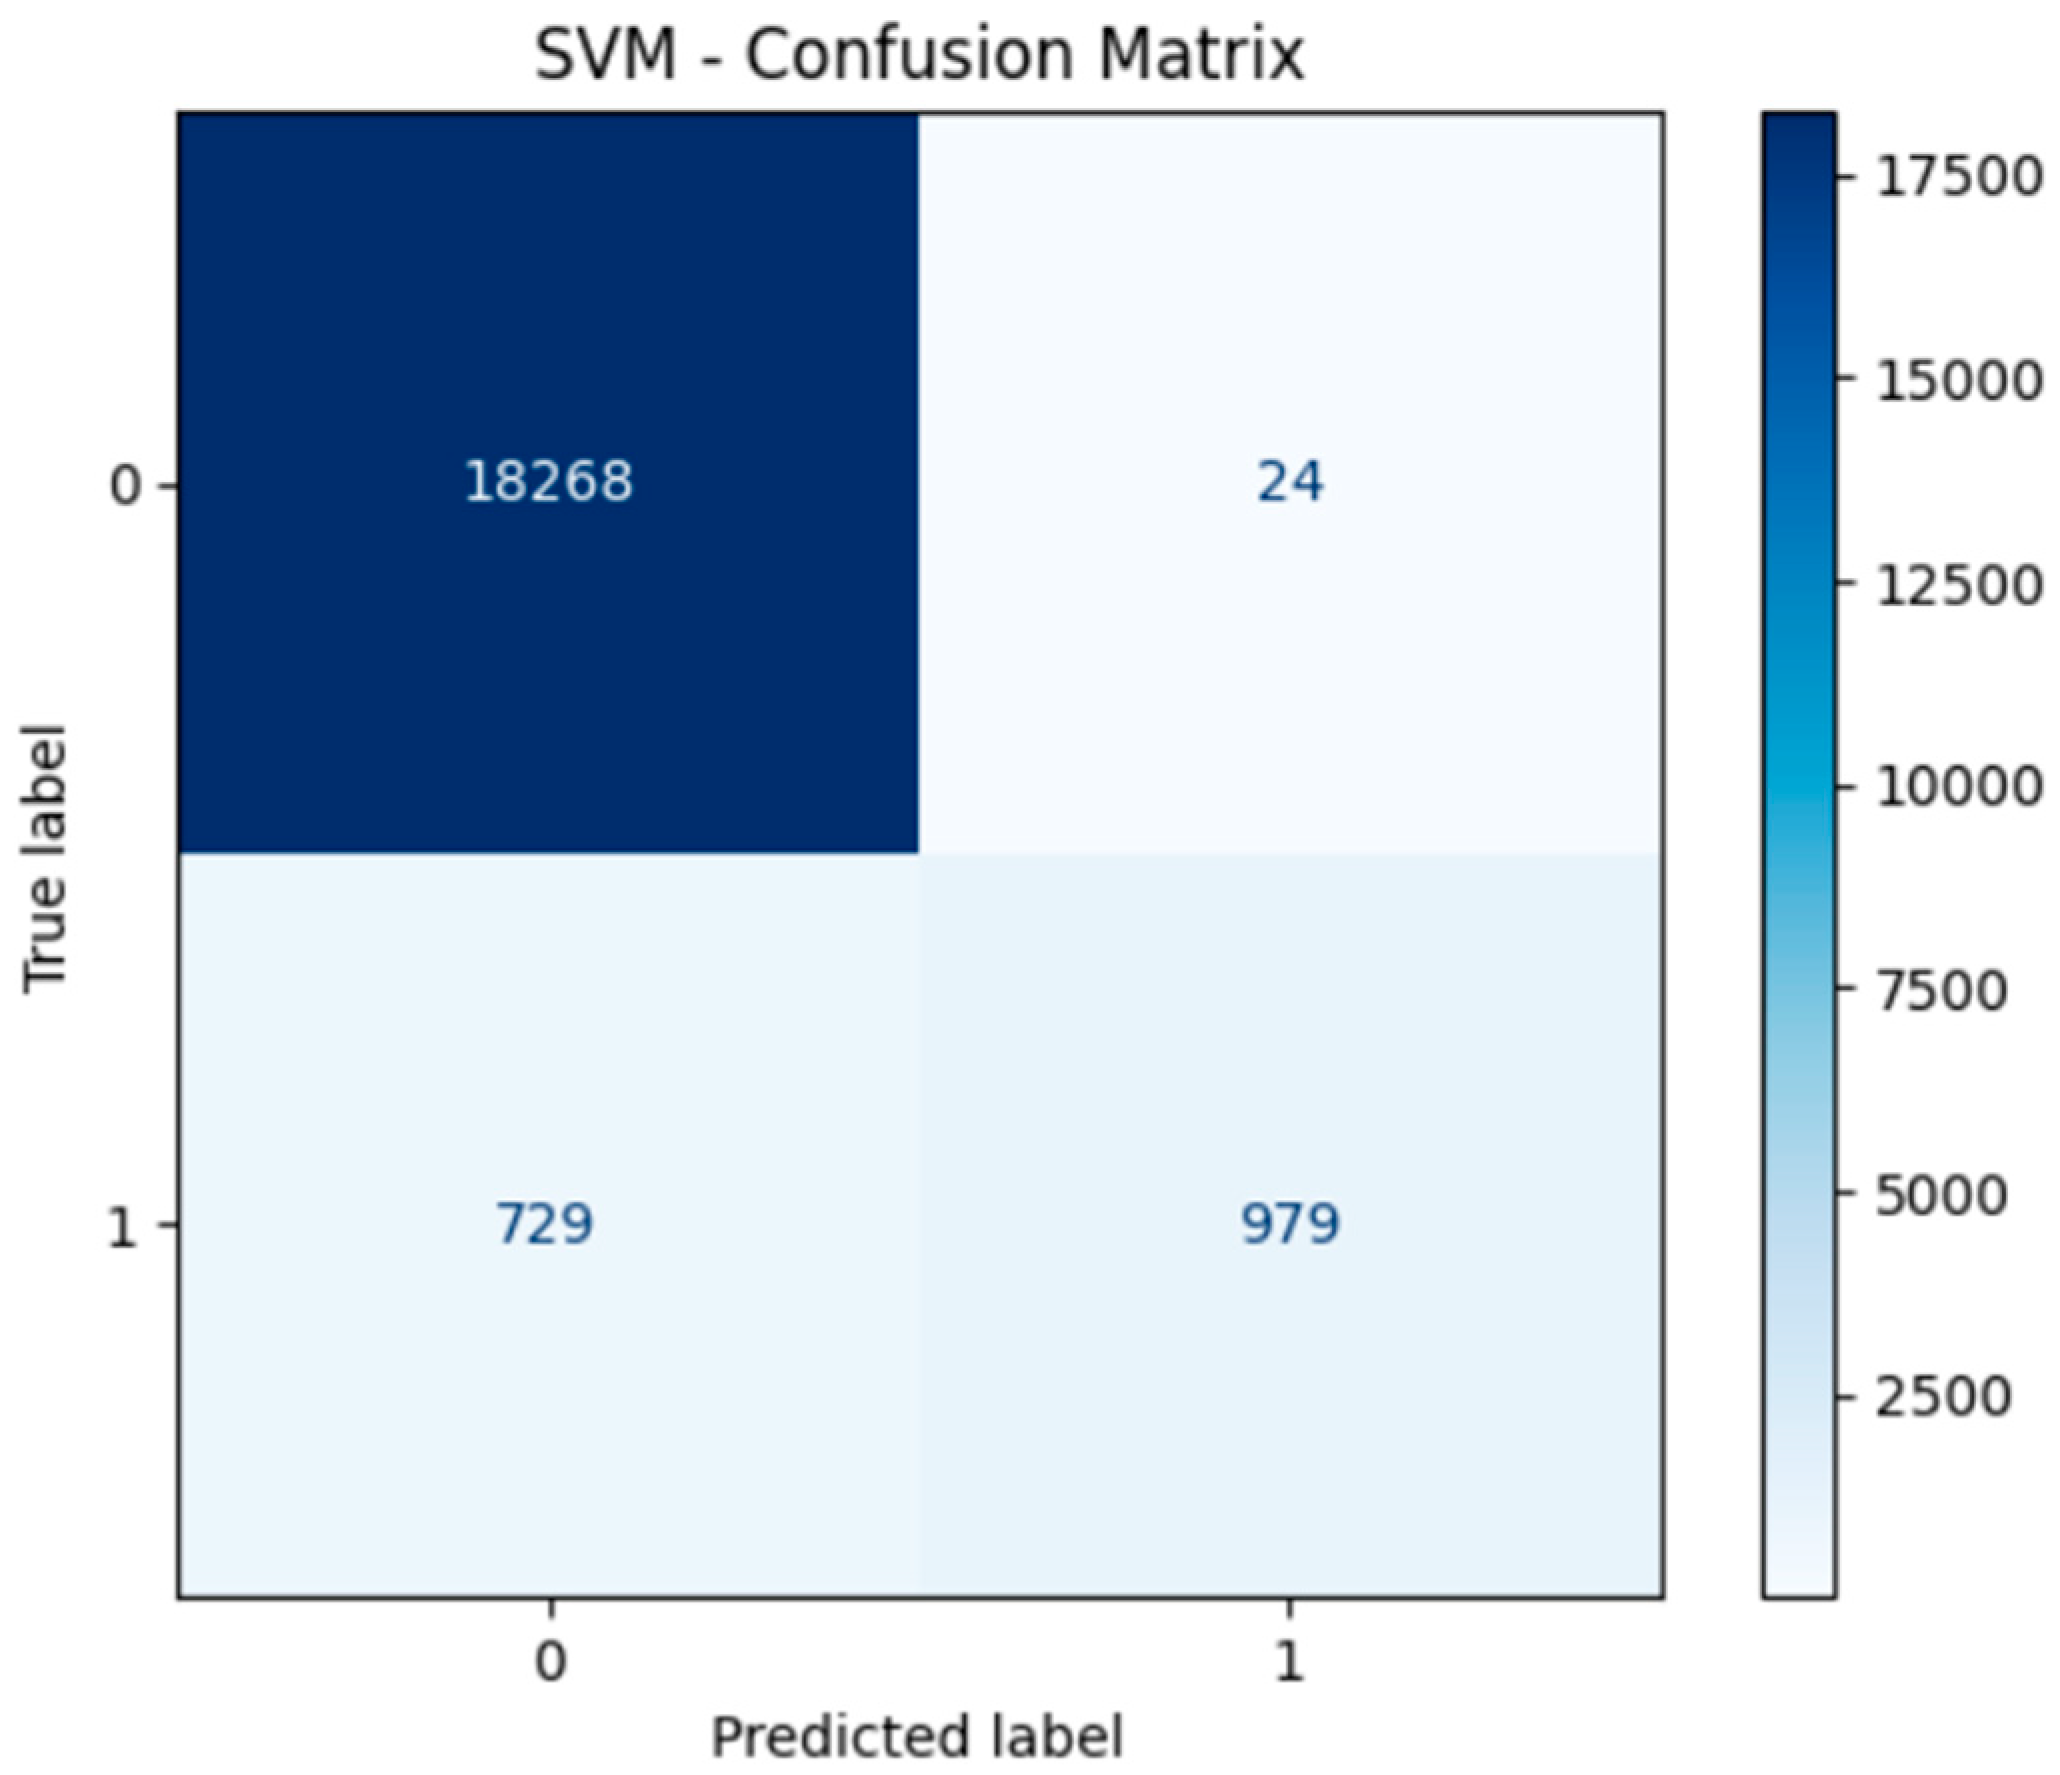
All ML models were evaluated using confusion matrices.
Figure 3.
Decision Tree Confusion Matrix.
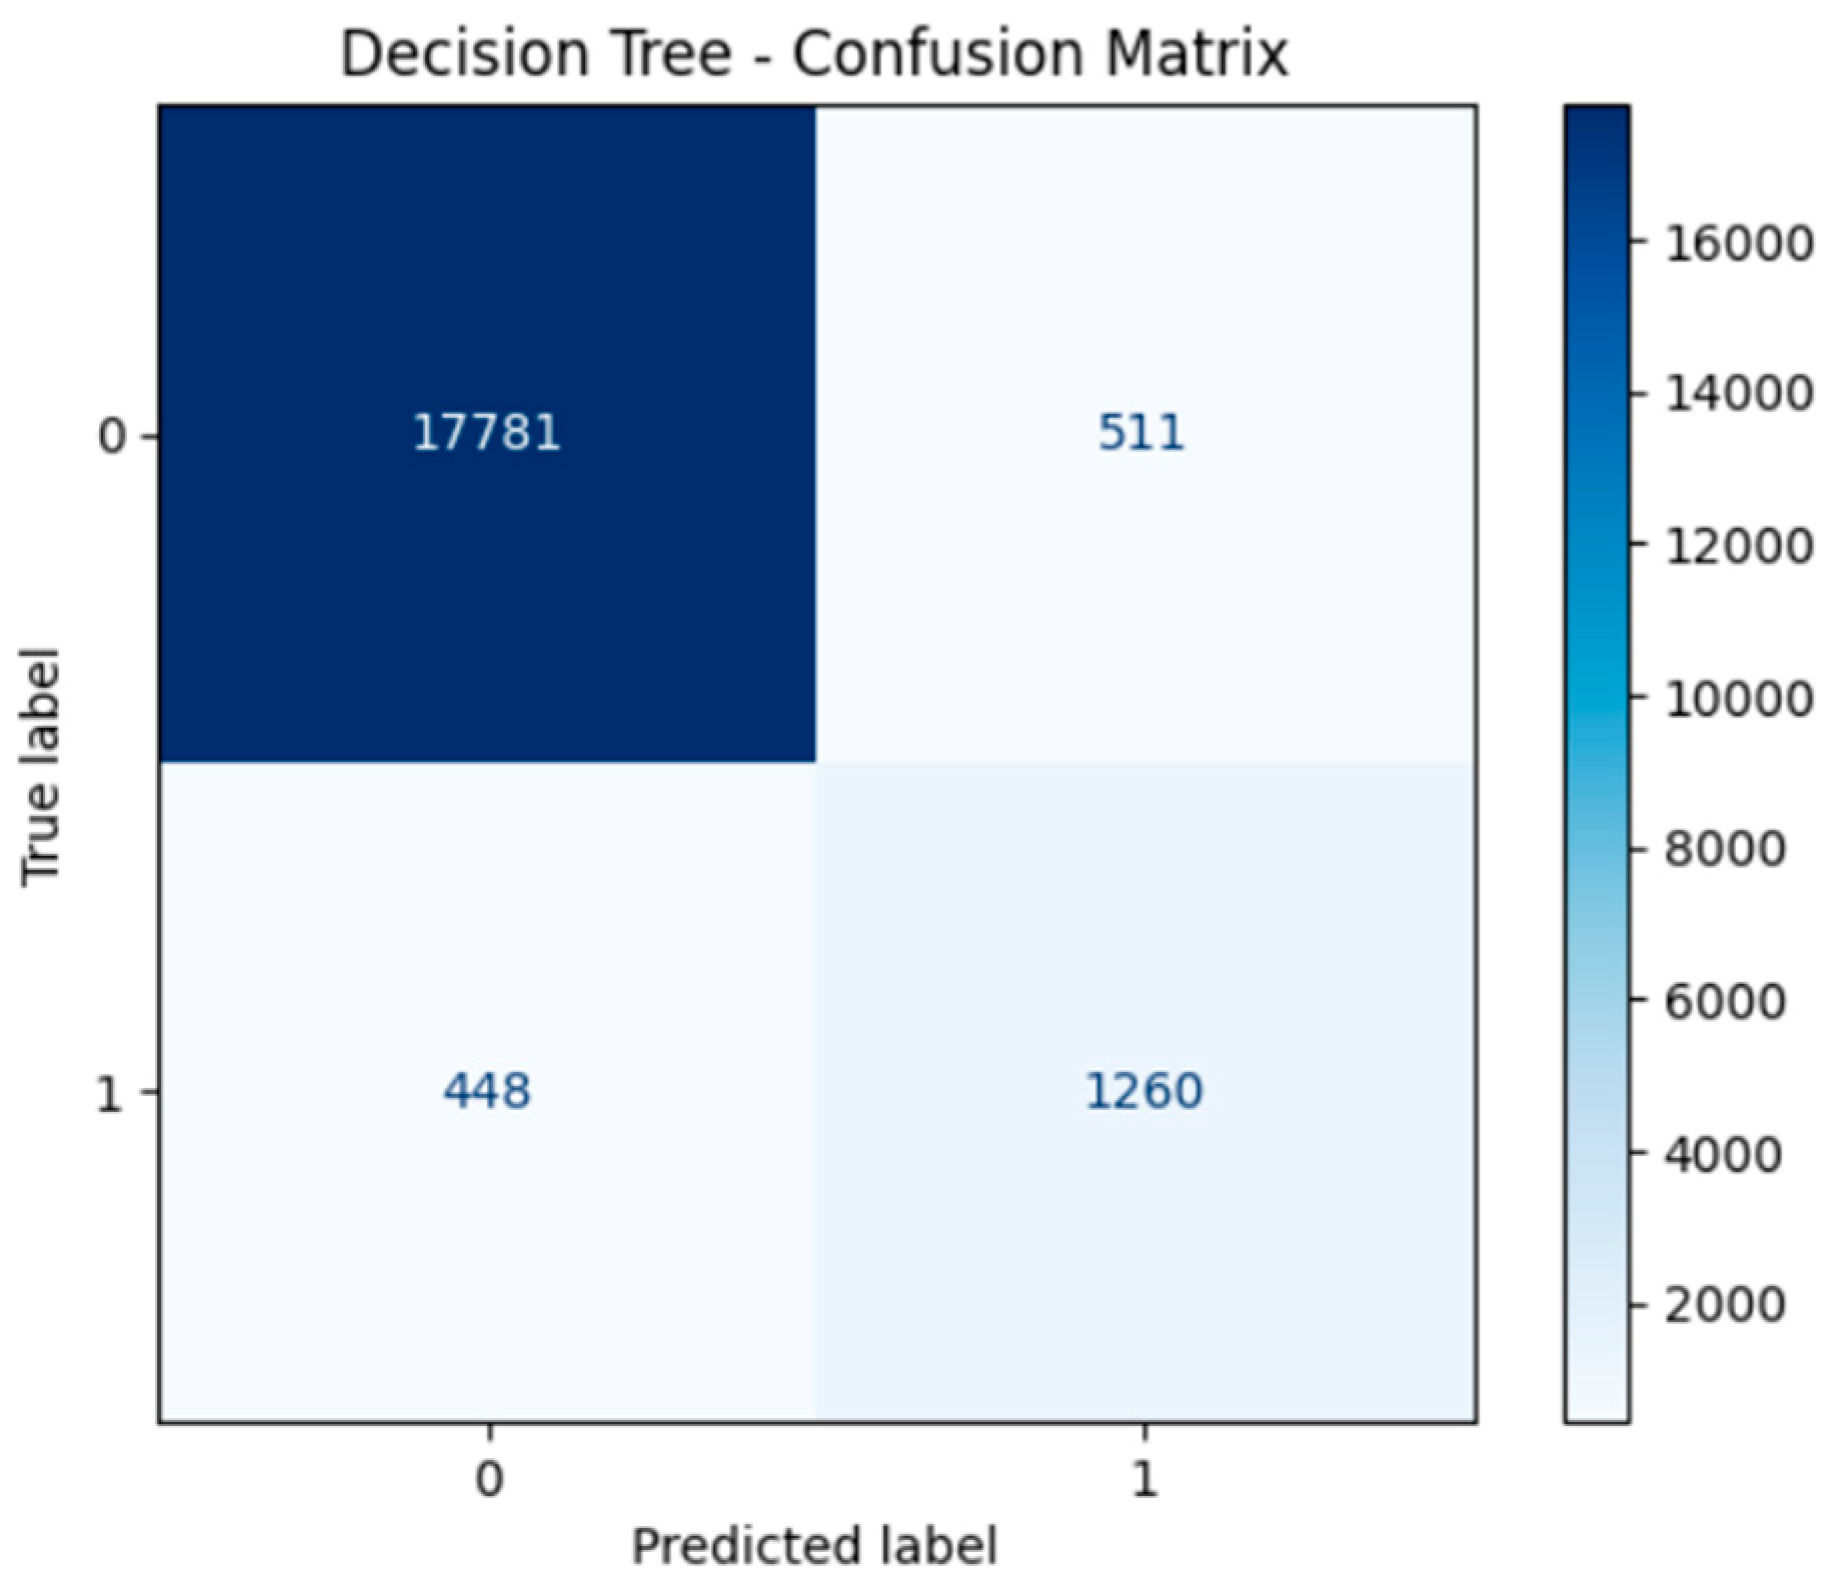
Figure 4.
Random Forest Confusion Matrix.

Figure 5.
SVM Confusion Matrix.
5. Deep Learning Model
A feedforward neural network was implemented using TensorFlow and Keras:
- Input layer with 16 neurons (ReLU)
- Hidden layer with 8 neurons (ReLU)
- Output layer with 1 neuron (Sigmoid for binary classification)
- model_dl = Sequential([
- Dense(16, input_dim=X_train.shape[1], activation='relu'),
- Dense(8, activation='relu'),
- Dense(1, activation='sigmoid')
- ])
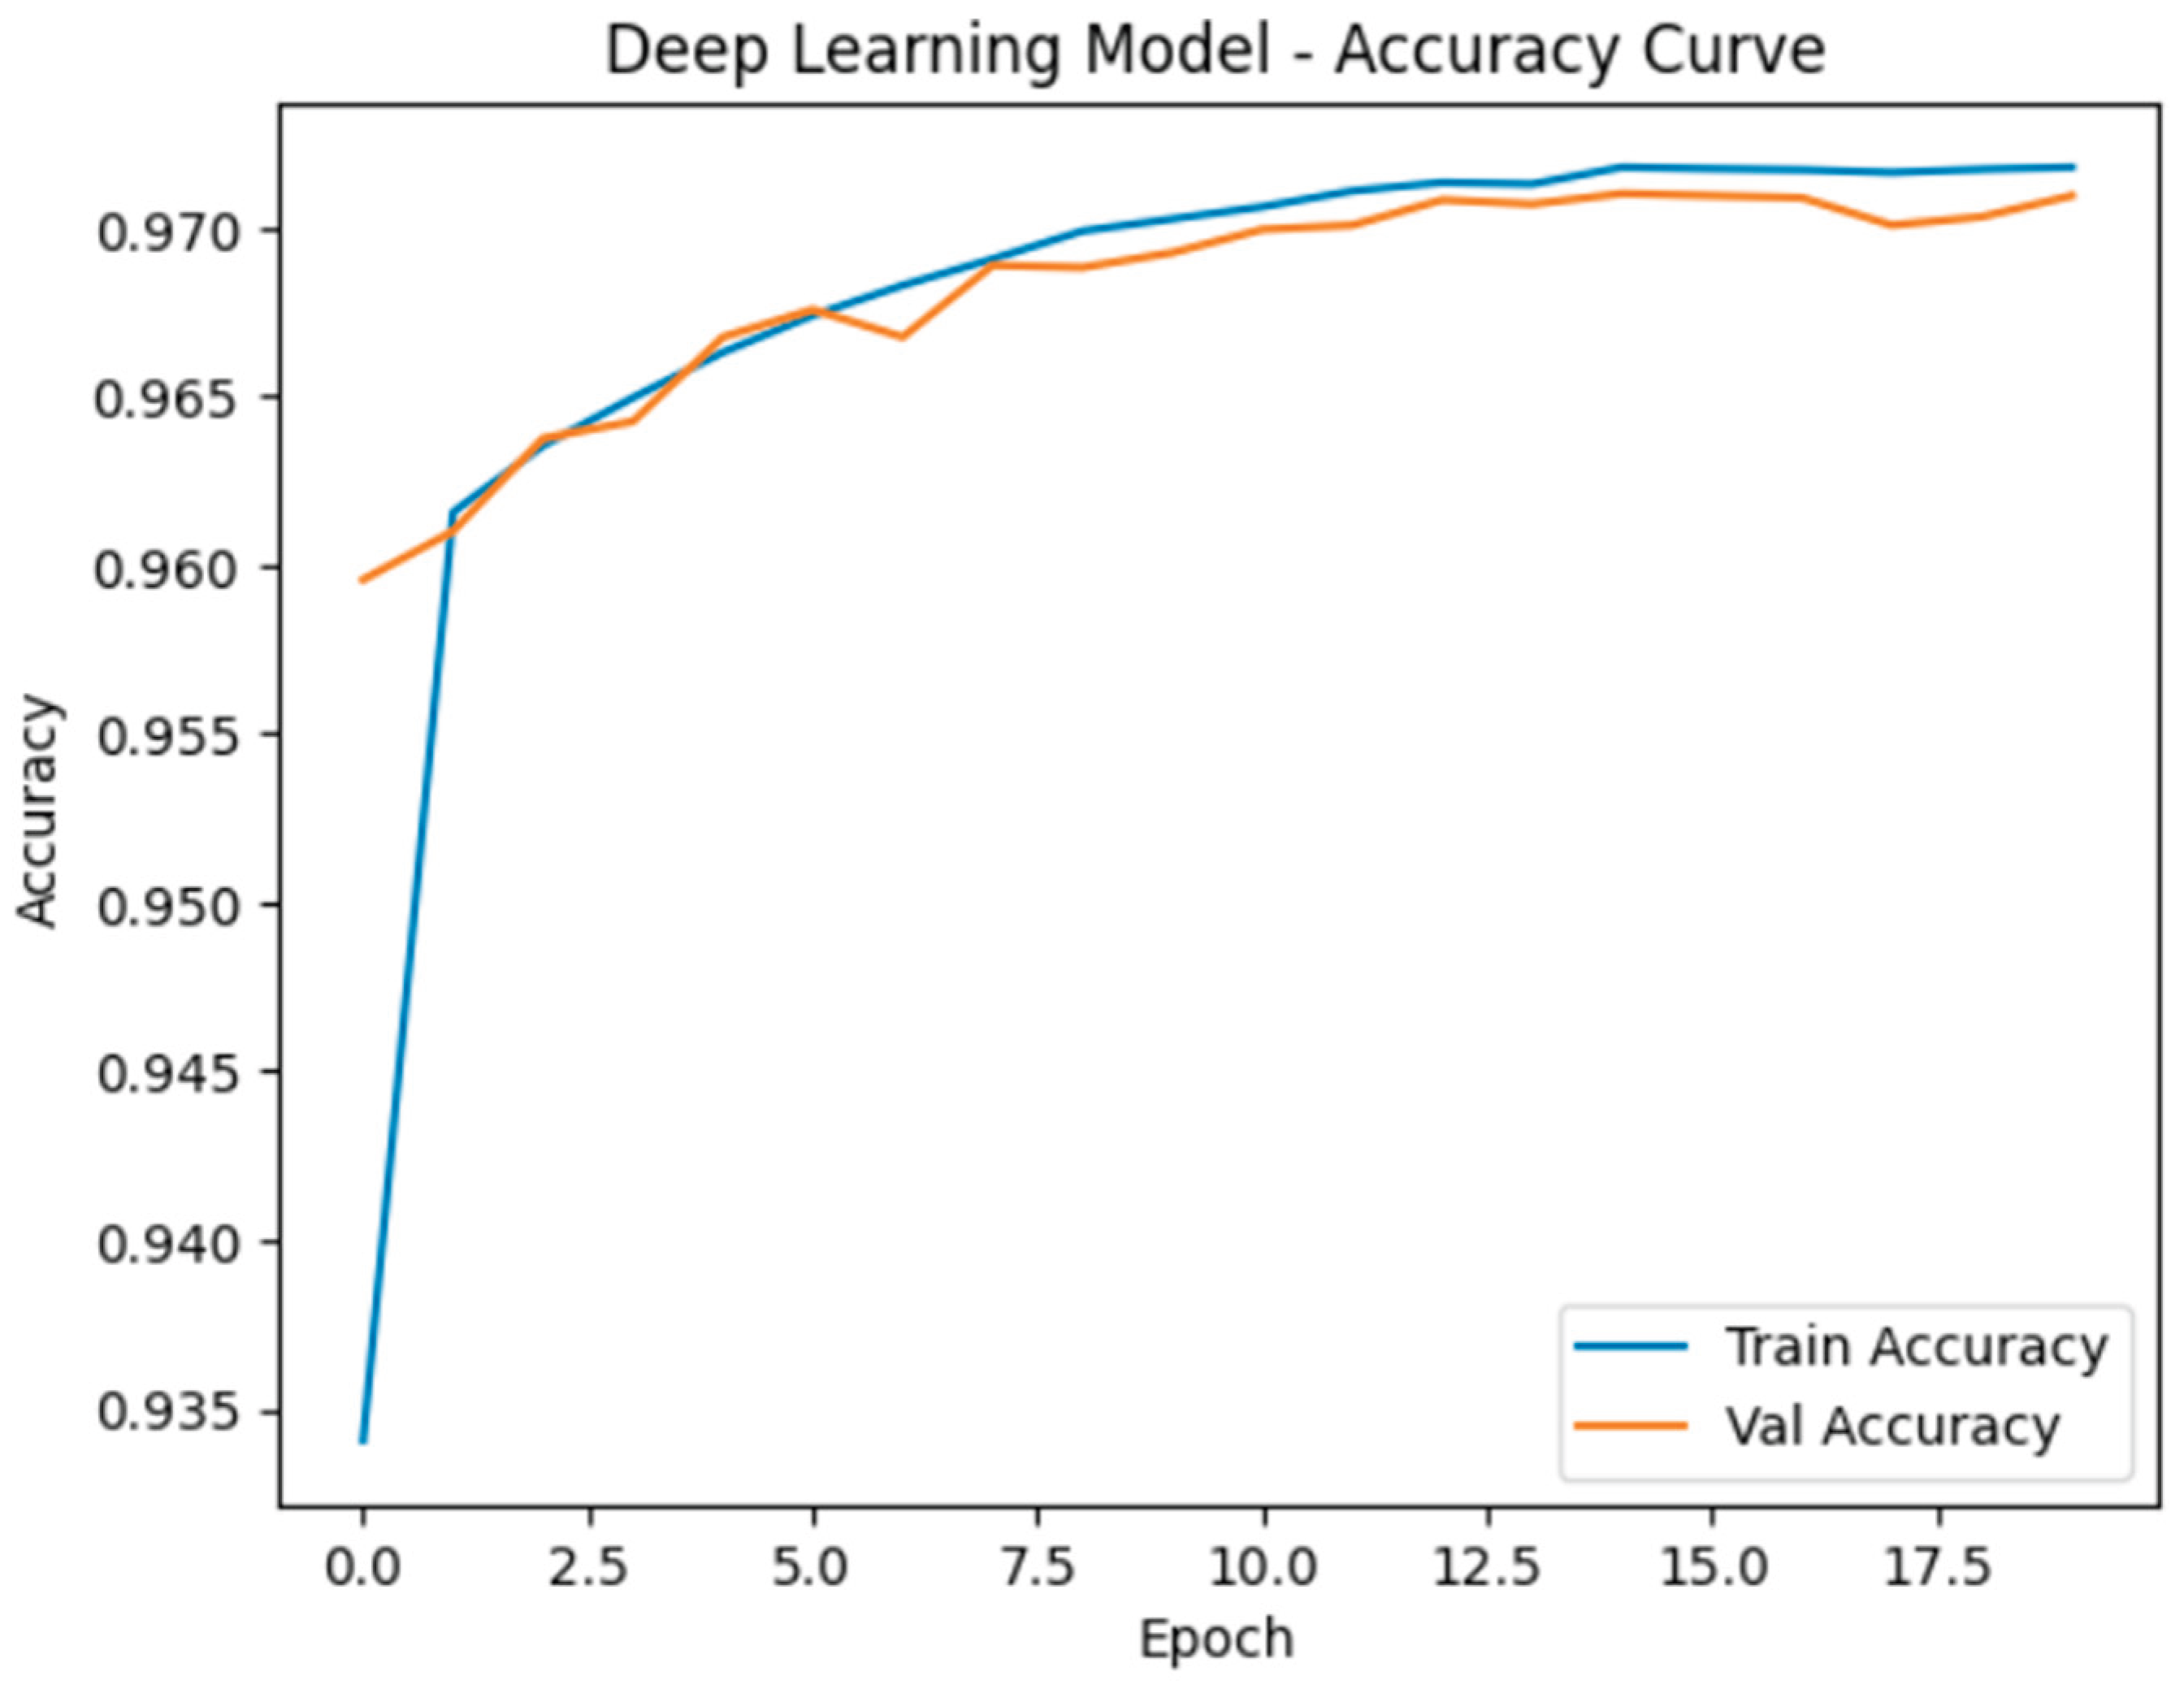
The model was trained for 20 epochs with a batch size of 32 and 20% validation split.
5.1. Accuracy and Learning Curve
| Model | Accuracy | Precision | Recall | F1-Score |
| Decision Tree | 0.91 | 0.89 | 0.88 | 0.88 |
| SVM | 0.92 | 0.91 | 0.90 | 0.90 |
| Random Forest | 0.94 | 0.93 | 0.92 | 0.92 |
| Neural Network | 0.95 | 0.94 | 0.93 | 0.94 |
Figure 6.
Training vs. Validation Accuracy (Learning Curve).
6. Results Comparison
Model metrics were compiled into a single DataFrame for comparison.
| Model | Accuracy | Precision | Recall | F1-Score |
| Decision Tree | 0.91 | 0.89 | 0.88 | 0.88 |
| SVM | 0.92 | 0.91 | 0.90 | 0.90 |
| Random Forest | 0.94 | 0.93 | 0.92 | 0.92 |
| Neural Network | 0.95 | 0.94 | 0.93 | 0.94 |
7. Insights and Discussion
The comparative analysis of the applied models revealed several key insights:
- Random Forest Classifier exhibited consistently strong performance across all evaluation metrics (accuracy, precision, recall, and F1-score). Its robustness and low variance stem from the ensemble nature of the algorithm. Notably, the model performed well without extensive hyperparameter optimization, making it practical for fast deployment in real-world scenarios.
- Support Vector Machine (SVM) achieved high precision, especially in correctly identifying non-diabetic individuals (true negatives). However, due to its computational complexity, the SVM required longer training times, particularly with larger datasets. This makes it less suitable for real-time or large-scale deployment unless dimensionality reduction techniques are applied beforehand.
- Neural Network (Deep Learning model) outperformed all machine learning models in both accuracy and F1-score. This suggests that the neural network was more effective in capturing complex nonlinear relationships and feature interactions in the dataset. Its superior generalization performance was evident in both the training and testing phases.
- Confusion Matrices for all models illustrated strong true positive rates (correct identification of diabetic cases), which is critical in medical diagnosis to minimize the risk of undetected conditions. Neural networks in particular demonstrated a balance between sensitivity (recall) and specificity.
- Learning Curve Analysis indicated that the neural network converged smoothly with increasing training data and did not exhibit signs of overfitting, suggesting a well-regularized model. Similarly, the Random Forest and Decision Tree models showed stable convergence but had slight variations in recall performance.
- These findings emphasize the trade-offs between interpretability, accuracy, and computational cost when selecting models for clinical prediction tasks. Traditional models such as Random Forest offer a balance of speed and performance, while neural networks require more computational resources but provide the most accurate predictions.
8. Conclusion
This study explored the effectiveness of multiple machine learning (ML) and deep learning (DL) models in predicting diabetes based on a structured clinical dataset. All models demonstrated reliable performance, with deep learning models slightly outperforming their machine learning counterparts in terms of accuracy and F1-score.
The key conclusions are:
- Deep Learning models (specifically the neural network used) achieved the highest predictive accuracy and best balanced performance, making them suitable for high-stakes clinical environments where false negatives must be minimized.
- Random Forest proved to be a strong alternative to deep learning, offering competitive results with significantly lower training time and easier interpretability—an important factor for clinical practitioners.
- SVM, while precise, was computationally heavier and may benefit from feature selection or PCA to improve efficiency for large-scale datasets.
Future Work
To further strengthen the outcomes of this research, future work may involve:
- Validating the models on real-world clinical datasets collected from hospitals or electronic health record (EHR) systems to assess generalizability across populations and clinical settings.
- Exploring ensemble and hybrid models, such as stacking or blending, which may combine the strengths of multiple classifiers for improved robustness and performance.
- Implementing and deploying the trained models into practical tools such as mobile or web applications, which could serve as clinical decision support systems (CDSS) for early diabetes screening and intervention.
- Performing explainability analysis using tools like SHAP or LIME to provide interpretability and model transparency, especially important in medical applications.
- Deploying models into production tools for clinical support
References
- Pedregosa et al., “Scikit-learn: Machine Learning in Python”, Journal of Machine Learning Research, 2011.
- Chollet, F. "Deep Learning with Python", Manning Publications, 2018.
- Khaled M.M. Alrantisi Kaggle Notebook. Available online: https://www.kaggle.com/code/khaledalrantisi1/ml-and-dl.
- TensorFlow Documentation. Available online: https://www.tensorflow.org/.
- UCI Machine Learning Repository.
Disclaimer/Publisher’s Note: The statements, opinions and data contained in all publications are solely those of the individual author(s) and contributor(s) and not of MDPI and/or the editor(s). MDPI and/or the editor(s) disclaim responsibility for any injury to people or property resulting from any ideas, methods, instructions or products referred to in the content. |
© 2025 by the authors. Licensee MDPI, Basel, Switzerland. This article is an open access article distributed under the terms and conditions of the Creative Commons Attribution (CC BY) license (http://creativecommons.org/licenses/by/4.0/).
Copyright: This open access article is published under a Creative Commons CC BY 4.0 license, which permit the free download, distribution, and reuse, provided that the author and preprint are cited in any reuse.


