Submitted:
09 December 2024
Posted:
10 December 2024
You are already at the latest version
Abstract
Total 150 samples of complete wild freshwater yellow eel (7.5 – 46.9 cm; 0.42 – 174.3 g wet wt.) were analyzed for percentage water and content of ash and Kcal (i.e. energy) from bomb calorimetry. Content of protein per g dry wt. was calculated from values of Kcal, and content of lipid per g dry wt. was calculated as a difference between contents of protein and ash. Percentage water was highly negative correlated with eel body mass g wet wt. Lipid content per g body wet wt. increased highly with eel body mass. This was in contrast to the constant contents of protein and ash per g wet wt. over varying eel body masses. Kcal per g wet wt. from bomb calorimetry (represent energy in protein + lipid + carbohydrate) was inverse correlated with percentage water. Calculated Kcal (calculated from contents of protein + lipid) was highly correlated, but 5% higher, compared with observed Kcal from bomb calorimetry and suggest, that the factor for converting lipid to Kcal is too high and that the content of carbohydrate was not included. The results were compared with proximate analysis of domesticated rainbow trout maximal fed with high energy food. In general, rainbow trout had a lower energy content and content of lipid per g body wet wt. compared to yellow eel. In contrast to yellow eel, the content of protein per g wet wt. in rainbow trout was highly increasing with decreasing water content. We suggest that this is because the high-energy content in food and very high growth rate of domesticated rainbow trout. The constants for calculating energy from protein and lipid was discussed.
Keywords:
ash
; calorimetry
; Kcal
; lipid
; percentage water
; protein
; proximate analysis
; rainbow trout
; yellow eel
1. Introduction
The European eel stock is panmictic (Als et al., 2011) and can be regarded as one single stock throughout its entire range. The sexually mature eels are believed to spawn early in the calendar year in the Sargasso Sea. The larvae (leptocephals) drift towards Europe and North Africa, including the Mediterranean Sea, in an assumed 300-day migration and reach the coasts in Europe and North Africa during the following winter and spring. Here the larvae transform into glass eels (7.19 cm and 0.29 g), and spread along the coastlines or migrate as elver up the freshwater systems to rivers and lakes. In this phase, which can extend over several years, they are called yellow eels. Hereafter the yellow eel silver and migrate to the Sargasso Sea.
The European eel population decreased in number since the early 1960s, and the current recruitment of glass eel to North Europe today is a few percentage of the 1960–1979 reference level (ICES 2023). The causes of this decline are multiple and complex. These causes may include a combination of oceanic factors and continental factors such as reduction of grow-up habitats in rivers, fishing in fresh and saltwater, obstructions to up- and downstream migration for eel at all life stages, mortality in water turbines, pollution, diseases, parasites (e.g. Anguillicola crassus) and bird predation (ICES 2023).
The commercial catches of yellow and silver eel in 1990 was about 12,500 tons, and in the 2020s, about 2,000 tons were caught, now with a decreasing trend in catches (ICES 2023). All aquaculture for eel currently depends upon wild eel glass eel for seeding. Aquaculture production increased from the start in the 1980s, peaking in 2004 at just under 8,600 tons. Since then it has steadily declined to approximately 5,000 t by 2020. The mean annual aquaculture production for the 5-year period (2017-2021) was 5,387 tons (ICES 2023).
Proximate analysis of aquaculture-reared eel in the literature has mostly concentrated on the relationship between feeding, quality and lipid content of flesh from aquaculture produced eel (Gómez-Limia et al. 2021 and references herein). Surprisingly, there are to our knowledge only two published results (Web of Science) on proximate analysis (i.e. percentage water, protein, ash and lipid) on complete wild eel. One publication (Boëtius and Boëtius 1985) analyzed wild eel, where the subject was proximate analysis of 22 yellow eel (7.1 – 41.5 cm) and 8 silver eel (35 – 76 cm). The eel were analyzed for percentages of water, ash, lipid and nitrogen-N, and what was designated residue. Gómez-Limia et al. (2021) sampled wild eel (26 – 69 cm) in a Spanish river. Skin and head was removed (total 21.2% of body mass), so the proximate analysis (percentages of water, protein, ash, lipid and energy) was on muscle from eel of different body masses.
The purpose of this paper is to analyze complete freshwater yellow eel data from Vester Vedsted Baeck (Rasmussen 1983, Rasmussen et al. 2024) and estimate percentage water, contents of crude protein, lipid, ash and energy (Kcal) in samples of complete yellow eel. The results for wild yellow eel was compared with proximate analysis for domesticated maximal fed rainbow trout using data given in From and Rasmussen (1984).
2. Material and Methods
2.1. Calculation of Crude Protein, Kcal and Lipid
A small number (not included in Appendix A) of complete yellow eel (25 – 42 cm) were analyzed for percentage water, ash, lipid, nitrogen-N, and the data established the relationship between crude protein (here after named protein) versus Kcal.
Kcal dry wt. was calculated as:
Kcal dry wt. = mg protein*5.65 + mg lipid*9.45 (1)
Protein mg dry wt. was calculated as mg nitrogen-N*6.25 and the relation between protein and Kcal was:
Protein mg dry wt. = 1790.9(±107.6) – 191.74(±17.42)*Kcal, R2 = 0.92 (2)
Total 739 yellow eel, distributed into 150 mean size classes (7.5 – 46.9 cm; 0.42 – 174.3 g wet wt.; median = 24.9 g wet wt.) were sampled by electrofishing in May, July, August and October in Vester Vedsted Baeck (location 55.07768, 8.67902) in 1979, 1980 and 1981, and samples were analyzed for percentage of water, ash and Kcal (bomb calorimetry). Sampling months were not included as predictor.
Knowing the energy content Kcal in a sample, the protein was estimated from the relation given in (2).
The content of lipid in the yellow eel was calculated as:
Mg lipid dry wt. = 1000 - mg protein dry wt. – mg ash dry wt. (3)
Determinations of percentage water, dry weight, ash, nitrogen-N (Kjeldahl method), lipid (Bligh and Dyer method) and Kcal (bomb calorimetry) are described in From and Rasmussen (1984).
2.2. Data Treatment
The results were calculated and tested using Excel ver. 5.0 and Real Statistics Resource Pack version 6.7 and http://statpages.org/nonlin.html. Level of significance for statistical tests was p = 0.05.
2.3. Data Source
Appendix A here shows the data for the yellow eel, i.e. length, body mass, percentage water, Kcal (bomb calorimetry) and calculated values of Kcal dry wt. calculated by (1) and protein dry wt. calculated by (2), lipid dry wt. calculated by (3). The three last calculated values (i.e. protein, lipid and Kcal) are given in italic because they are estimated values.
Data for aquaculture maximal fed reared rainbow trout are given in Appendix and Table 11 in From and Rasmussen (1984). Total 119 samples were analyzed for percentage water, protein, lipid, ash and Kcal (bomb calorimetry). The rainbow fish varied from 3.7 – 199.8 g wet wt., median = 42.1 g wet wt. and percentage water from 70% to 80%. The rainbow trout were domesticated fish for several fish generations and selected for maximal feeding rate and fast growth rate.
3. Results
3.1. Body Constituents and Body Mass
Figure 1 shows the relation between body mass g wet wt. versus percentage water of yellow eel.
The relation was described as:
Percentage water = 86.189*body mass-0.043(±0.006), R2 = 0.59, p << 0.05.
The relation is highly significant. The smallest eel in the sample 0.7 g wet wt. had a water content of 84.5%. The largest eel 174.3 g wet wt. had a water content of 64.2%. The lowest water content found was 60.6% in an eel of 87.7 g.
Figure 2 shows the relation between mg body constituent of protein, lipid and ash versus body mass g wet wt. The relations are:
Protein = 143.21*Body mass0.0082 , R2 = 0.02, p > 0.05.
Lipid = 17.4*Body mass0.4109(±0.0423) , R2 = 0.71, p << 0.05.
Ash = 17.89*Body mass-0.015 , R2 = 0.02, p > 0.05.
The trajectories of protein and ash are not significant, and mean content of protein is 147.3 mg per g wet wt. and mean content of ash is 17.3 mg per g wet wt. The trajectory of lipid versus body mass is highly significant and lipid increased with increasing body mass. The decreasing water content with increasing body mass (Figure 1) probably means that decreasing water content is replaced with increasing lipid content while keeping content of protein and ash constant. Twenty observations of lipid were statistical outliers and showed an extra increase in lipid content. These might be yellow eel, which prepare for silvering (Gómez-Limia et al. 2021, Rasmussen et al. 2024).
3.2. Body Constituent and Percentage Water
Figure 3 shows the relation between mg body constituent of crude protein, lipid and ash per g wet wt. versus percentage of water. The relations are:
Protein = 129 +0.2407*Percentage water, R2 = 0.01, p > 0.05.
Lipid = 864.39 – 10.381(±0.388)*Percentage water, R2 = 0.95, p << 0.05.
Ash = 6.6043 + 0.1408*Percentage water, R2 = 0.1, p > 0.05.
The trajectories of protein and ash are not significant, and mean content of protein is 147.3 mg per g wet wt. and mean content of ash is 17.3 mg per g wet wt. The trajectory of lipid versus percentage water is highly significant and increasing with decreasing water content. As in Figure 2 the results show, that the content of protein and ash are constant, and that lipid changes from low content of 25 mg per g wet wt. at percentage water about 85% and high content 250 mg per g wet wt. at percentage water about 60%.
Figure 4 shows the relation between mg body constituent of protein, lipid and ash per g dry wt. versus percentage of water. The relations are:
Protein = -0.1019.8 +21.83(±1.15)*Percentage water , R2 = 0.91, p << 0.05.
Lipid = 2168 – 24.774(±1.311)*Percentage water, R2 = 0.90, p << 0.05.
Ash = -148.21 + 2.9441(±0.2641)*Percentage water, R2 = 0.77, p << 0.05.
The trajectories of contents of protein, lipid and ash are highly significant.
Figure 5 shows the relation Kcal (bombing) per g wet wt. versus percentage of water.
The relation is:
Kcal = 8.6675 -0.0947(±0.0018)*percentage water, R2 = 0.99, p << 0.05.
The relation is highly significant.
Because the lipid content increases at decreasing water content (Figure 3 and 4), the results are as expected.
3.3. Calculated Kcal and Observed Kcal
Figure 6 shows the relation between calculated Kcal (protein*5.65 + lipid*9.45) versus observed Kcal from bomb calorimetry.
The relation is:
Calculated Kcal = 0.4727 + 0.9714(±0.0175)*Kcal (bombing), R2 = 0.99, p << 0.05.
The trajectory is highly significant, but the calculated values of calculated Kcal are as a mean 5% higher than the values of Kcal from bomb calorimetry. The same result was seen in proximate analysis for rainbow trout in From and Rasmussen (1984).
The calculated amount of protein and lipid could probably be a little biased, because the content of protein and lipid were calculated as a differences (formula (2) and (3)). The answer could be, that one or both in combination of the factors 5.65 and 9.45 are too high, see the discussion on factors for converting protein and lipid to Kcal in From and Rasmussen (1984) and 4. Discussion.
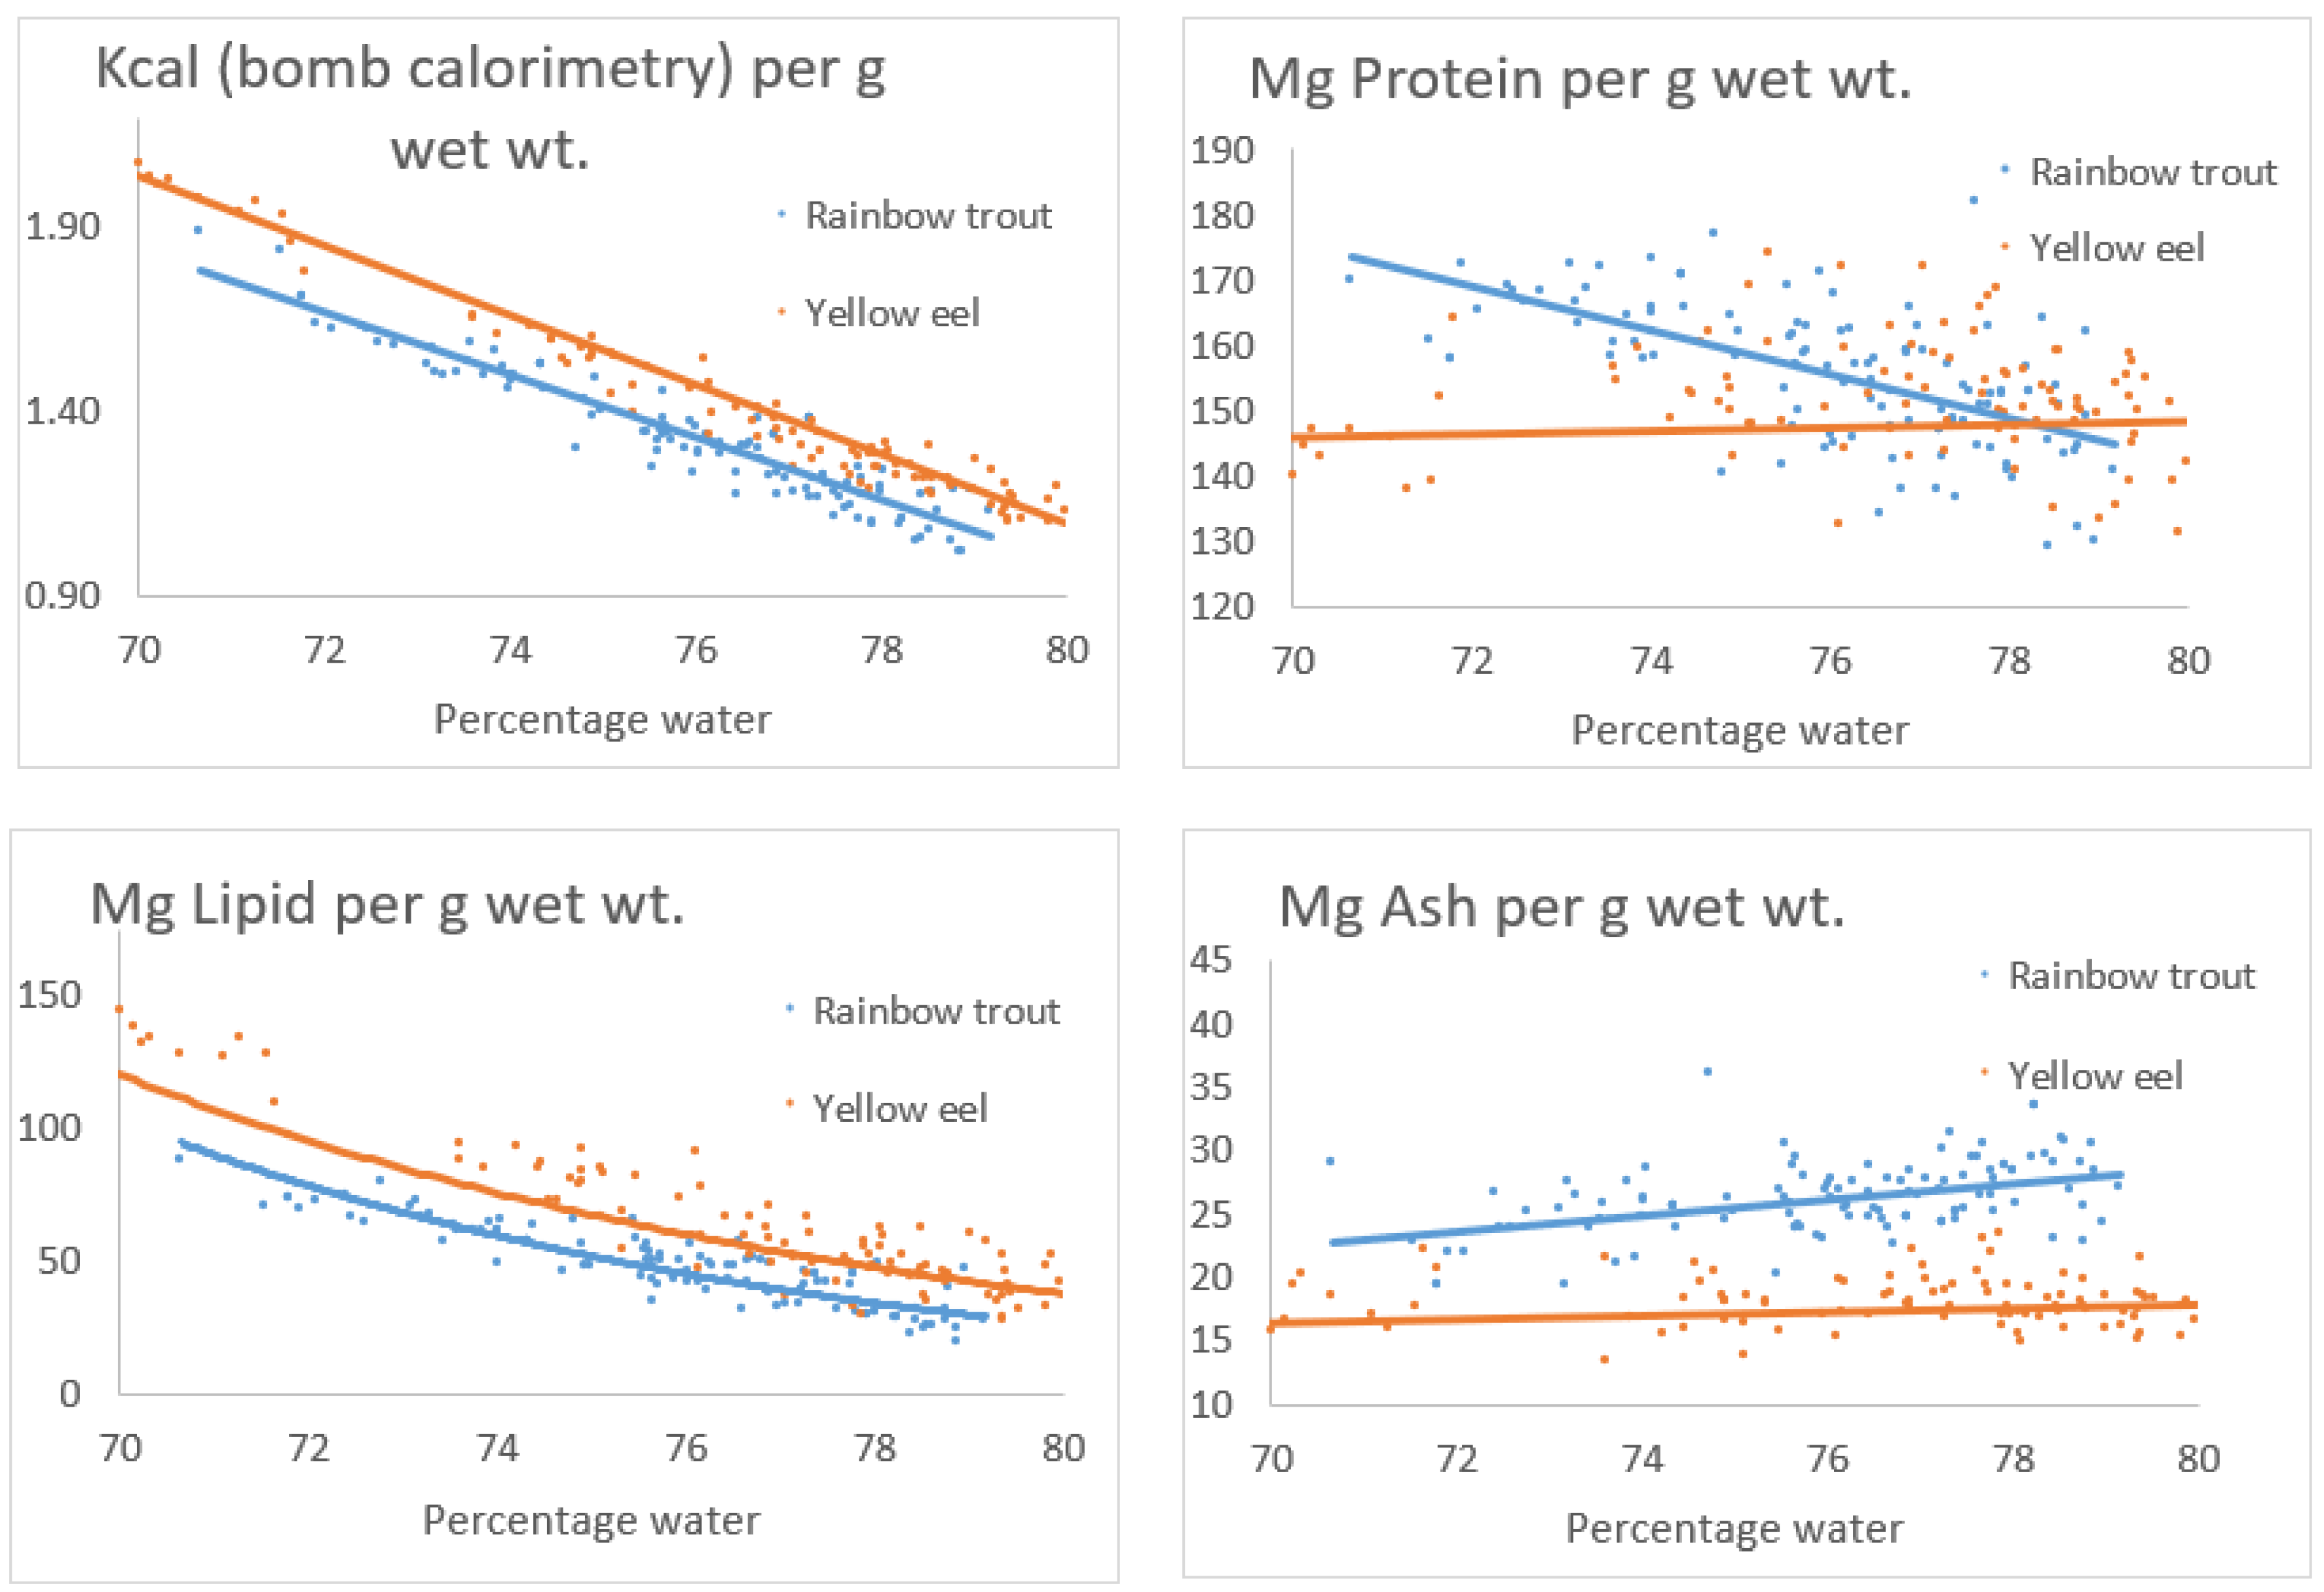
3.4. Comparison Between Yellow Eel and Rainbow Trout
Figure 7 shows comparisons and trajectory lines between rainbow trout and yellow eel for Kcal (bomb calorimetry) per g wet wt. and body constituents of protein, lipid and ash mg per g wet wt., all versus percentage water 70% - 80%. The energy content in eel is about 11.6% higher compared to energy content in rainbow trout, and the relative increase in energy content at decreasing water content is more or less the same for the two species compared. The protein content in yellow eel is constant (see also Figure 3), whereas the protein content in rainbow trout is increasing with decreasing water content. The lipid content per g wet wt. in eel is about 26.2% higher compared to the lipid content in rainbow trout, and the relative increase in lipid content at decreasing water content is more or less the same for the two species compared. The ash content for the two species are more or less constant at water percentage from 70 % - 80%, and about 45.1% higher in rainbow trout with a slight increase of ash in rainbow trout at increasing water content.
4. Discussion
Böetius and Böetius (1985) estimated total nitrogen and non-protein nitrogen, and protein was calculated as (total nitrogen minus non-protein nitrogen)*6.025.
In this paper we did not analyze for different nitrogen fractions compared to Böetius and Böetius (1985), and protein was calculated as total nitrogen*6.25 as also in From and Rasmussen (1984).
In the present results, we have not considered an eventual content of carbohydrate in yellow eel. In rainbow trout (From and Rasmussen 1984), the mean content of carbohydrate in rainbow trout was calculated to about 0.26% of wet wt. and 0.94% of dry wt. One g carbohydrate has an energy content of 3.9 Kcal per g dry wt., and the energy from carbohydrate contribute to the energy from bomb calorimetry. Compared to the higher content of values of protein and lipid, carbohydrate contribute with about 0.5% of the total energy, and carbohydrate can therefore be considered unimportant, but contribute to Kcal from bomb calorimetry.
The conversion factor between content of nitrogen and content of protein is here set to 6.25. In several publications given in From and Rasmussen (1984), the factor in different fish species vary from 6.02 to 6.32.
The factors for calculating energy from protein and lipid are here set to 5.65 and 9.45 Kcal per g dry wt., respectively. In rainbow trout (From and Rasmussen 1984 and references herein) using values of 5.65 and 8.46 instead of 9.45, gives nearly the same calculated results Kcal in protein and lipid compared to energy Kcal from bomb calorimetry. It could suggest, that the results in Figure 6, where calculated energy from protein + lipid is higher compared to bomb calorimetry, is explained by using a value of 9.45 for lipid, where a value of about 8.46 might be better for fish species. Using the value of 8.46 reduced the values of calculated Kcal to be about 0.3% higher compared to bomb calorimetry. The results of Kcal from bomb calorimetry are not biased, and they represent the true values of Kcal (protein + lipid + carbohydrate). We therefore suggest, that possibly the correct value for lipid in these yellow eel is 8.46 Kcal per g dry wt. as proposed in rainbow trout (From and Rasmussen 1984).
The content of protein in yellow eel was calculated using relation (2) from observations of Kcal bomb calorimetry, and the results are in accordance with the results in Figure 3 in the range of content of water from 60% - 85%. The content of protein in rainbow trout (Figure 7) is significantly increasing with decreasing water content, and a plausible explanation for this difference between the two species might be, that we compare wild eel fed invertebrate taxa with domesticated rainbow trout fed high energy food, see later.
The content of lipid in yellow eel was calculated from the relation (3) and might be slightly biased and higher than the true value. The lipid content in rainbow trout (Figure 7) was calculated from proximate analysis and values are not supposed to be biased.
The Kcal bomb calorimetry (Figure 7) was about 11.6% higher in yellow eel compared to rainbow trout. The results of Kcal from bomb calorimetry are not biased, so the difference between the two species probably represent a systematic higher content of lipid in yellow eel compared to rainbow trot.
In Figure 2, Figure 3 and Figure 7, the content of protein in yellow eel per g wet wt. is constant, this is in contrast to the protein content per g wet wt. in rainbow trout in Figure 7. The annual instantaneous growth rate G (body mass wet wt.) of wild yellow eel was calculated to 0.44 year-1 (data in Rasmussen et al. 2024), whereas the calculated G for maximal feed rainbow trout, feed in a little higher temperature regime compared to temperatures in Vester Vedsted Baeck, was calculated to 6.04 year-1 (data in From and Rasmussen 1984). The food of yellow eel consisted of different taxa of invertebrates with high (80 - 85%) water content and low useful energy (1.06 Kcal per g wet wt.) because high content of indigestible matters, whereas the artificial food of rainbow trout had a low water content (37%) and high content of lipid and energy content (3.41 Kcal per g wet wt.). Probably the strategy for wild yellow eel is to keep the necessary amount of protein and ash constant in the cells when growing and favorite a faster increase in lipid for spawning migration. The rainbow trout here are highly domesticated and selected for fast growth rate and maximal feeding.
Data Availability
The data used can be obtained from the corresponding author.
Acknowledgments
Thanks to technical assistance from Knud Jørgensen for contribution to field work.
Conflicts of Interest
The authors certify that they have no affiliations with or involvement in any organization or entity with any financial interest (such as honoraria; educational grants; participation in speakers' bureaus; membership, employment, consultancies, stock ownership, or other equity interest; and expert testimony or patent-licensing arrangements), or non-financial interest (such as personal or professional relationships, affiliations, knowledge, or beliefs) in the subject matter or materials discussed in this manuscript.
Appendix A. Body Constituents
Number of eel for analysis, length cm and body mass g wet wt., percentage water and percentage water and dry content, mg ash dry wt. and energy Kcal dry wt. Estimated protein, lipid and Kcal are in italic.
| Mean | Mean | Bombing | Ash | Crude protein | Lipid | Estimated | ||||
| Month | Number | Length cm | Body mass g | Water% | Dry wt.% | Kcal dry wt. | mg dry wt. | mg dry wt. | mg dry wt. | Kcal dry wt. |
| May | 1 | 39.4 | 92.9 | 74.5 | 25.5 | 6.22 | 71.6 | 598.1 | 330.3 | 6.50 |
| May | 1 | 40.4 | 95.4 | 77.7 | 22.3 | 5.47 | 103.2 | 741.9 | 154.9 | 5.66 |
| May | 1 | 40.9 | 127.0 | 69.7 | 30.4 | 6.76 | 50.9 | 494.5 | 454.6 | 7.09 |
| May | 3 | 37.8 | 101.8 | 66.5 | 33.5 | 6.88 | 54.4 | 471.5 | 474.1 | 7.14 |
| May | 2 | 36.7 | 116.8 | 62.6 | 37.4 | 7.77 | 28.0 | 300.9 | 671.1 | 8.04 |
| May | 2 | 35.4 | 97.2 | 62.4 | 37.6 | 7.5 | 39.3 | 352.7 | 608.1 | 7.74 |
| May | 1 | 36.4 | 87.9 | 66.5 | 33.5 | 7.36 | 44.3 | 379.5 | 576.2 | 7.59 |
| May | 2 | 34.4 | 74.5 | 74.5 | 25.5 | 6.23 | 62.1 | 596.2 | 341.7 | 6.60 |
| May | 5 | 33.1 | 75.0 | 66.9 | 33.1 | 6.94 | 44.4 | 460.0 | 495.6 | 7.28 |
| May | 3 | 32.4 | 58.7 | 69.4 | 30.6 | 6.73 | 44.5 | 500.3 | 455.2 | 7.13 |
| May | 4 | 31.1 | 50.1 | 76.0 | 24.1 | 6.08 | 70.4 | 624.9 | 304.7 | 6.41 |
| May | 4 | 30.3 | 47.6 | 74.9 | 25.1 | 6.16 | 72.0 | 609.6 | 318.4 | 6.45 |
| May | 8 | 29.1 | 41.1 | 77.1 | 22.9 | 5.86 | 85.9 | 667.1 | 247.0 | 6.10 |
| May | 5 | 28.7 | 35.2 | 74.8 | 25.2 | 6.22 | 81.1 | 598.1 | 320.8 | 6.41 |
| May | 7 | 27.5 | 29.8 | 74.7 | 25.4 | 6.01 | 76.9 | 638.3 | 284.8 | 6.30 |
| May | 7 | 27.0 | 28.8 | 76.9 | 23.1 | 5.84 | 76.3 | 670.9 | 252.8 | 6.18 |
| May | 6 | 26.1 | 25.7 | 76.9 | 23.1 | 5.94 | 76.8 | 651.8 | 271.4 | 6.25 |
| May | 10 | 24.7 | 22.4 | 77.4 | 22.6 | 5.71 | 85.4 | 695.9 | 218.7 | 6.00 |
| May | 8 | 23.0 | 20.1 | 78.8 | 21.2 | 5.62 | 82.8 | 713.1 | 204.1 | 5.96 |
| May | 4 | 21.9 | 16.9 | 77.8 | 22.2 | 5.72 | 84.0 | 693.9 | 222.1 | 6.02 |
| May | 13 | 22.7 | 17.2 | 79.4 | 20.6 | 5.5 | 84.4 | 736.1 | 179.5 | 5.86 |
| May | 10 | 21.7 | 13.2 | 77.7 | 22.3 | 5.78 | 86.6 | 682.4 | 231.0 | 6.04 |
| May | 12 | 20.3 | 12.3 | 78.2 | 21.8 | 5.75 | 87.8 | 688.2 | 224.0 | 6.01 |
| May | 11 | 19.3 | 9.5 | 79.5 | 20.5 | 5.54 | 89.5 | 728.5 | 182.0 | 5.84 |
| May | 11 | 18.3 | 8.2 | 80.4 | 19.6 | 5.65 | 103.2 | 707.4 | 189.4 | 5.79 |
| May | 12 | 17.3 | 6.8 | 80.8 | 19.2 | 5.7 | 86.7 | 697.8 | 215.5 | 5.98 |
| May | 9 | 16.3 | 4.4 | 79.4 | 20.6 | 5.36 | 104.2 | 763.0 | 132.8 | 5.57 |
| July | 2 | 40.3 | 110.9 | 70.2 | 29.8 | 6.77 | 65.2 | 492.6 | 442.2 | 6.96 |
| July | 1 | 43.3 | 137.0 | 67.2 | 32.8 | 6.91 | 49.0 | 465.8 | 485.2 | 7.22 |
| July | 1 | 37.3 | 87.7 | 60.6 | 39.4 | 7.58 | 21.0 | 337.3 | 641.7 | 7.97 |
| July | 1 | 35.3 | 89.9 | 65.6 | 34.4 | 7.28 | 53.4 | 394.8 | 551.8 | 7.45 |
| July | 1 | 41.3 | 115.6 | 75.3 | 24.7 | 5.95 | 72.2 | 649.8 | 278.0 | 6.30 |
| July | 3 | 33.3 | 63.6 | 70.7 | 29.4 | 6.73 | 63.4 | 500.3 | 436.3 | 6.95 |
| July | 5 | 28.3 | 39.4 | 76.9 | 23.1 | 5.73 | 96.1 | 692.0 | 211.9 | 5.91 |
| July | 1 | 45.8 | 171.3 | 70.3 | 29.7 | 6.83 | 68.0 | 481.1 | 450.9 | 6.98 |
| July | 4 | 32.5 | 56.0 | 75.1 | 24.9 | 6.25 | 65.3 | 592.3 | 342.4 | 6.58 |
| July | 10 | 26.5 | 27.9 | 78.6 | 21.4 | 5.68 | 74.0 | 701.6 | 224.4 | 6.08 |
| July | 2 | 36.3 | 81.3 | 69.8 | 30.2 | 7.09 | 34.3 | 431.3 | 534.4 | 7.49 |
| July | 4 | 30.3 | 47.9 | 76.7 | 23.3 | 6.05 | 85.5 | 630.7 | 283.8 | 6.25 |
| July | 7 | 25.5 | 27.5 | 78.8 | 21.2 | 5.65 | 82.2 | 707.4 | 210.4 | 5.99 |
| July | 5 | 31.3 | 51.4 | 76.9 | 23.1 | 6.12 | 78.4 | 617.3 | 304.3 | 6.36 |
| July | 8 | 24.5 | 22.1 | 78.2 | 21.8 | 5.61 | 77.6 | 715.0 | 207.4 | 6.00 |
| July | 11 | 19.5 | 12.7 | 80.3 | 19.7 | 5.54 | 91.1 | 728.5 | 180.4 | 5.82 |
| July | 10 | 22.5 | 18.8 | 79.3 | 20.7 | 5.43 | 81.4 | 749.6 | 169.0 | 5.83 |
| July | 10 | 21.5 | 15.7 | 80.4 | 19.6 | 5.77 | 80.3 | 684.4 | 235.3 | 6.09 |
| July | 10 | 23.5 | 20.4 | 78.5 | 21.5 | 5.64 | 82.1 | 709.3 | 208.6 | 5.98 |
| July | 2 | 27.3 | 32.7 | 74.9 | 25.1 | 6.23 | 72.0 | 596.2 | 331.8 | 6.50 |
| July | 3 | 29.3 | 43.6 | 75.2 | 24.9 | 6.24 | 74.2 | 594.2 | 331.6 | 6.49 |
| July | 10 | 10.5 | 1.6 | 80.9 | 19.1 | 5.24 | 105.8 | 786.0 | 108.2 | 5.46 |
| July | 10 | 11.5 | 2.1 | 80.1 | 19.9 | 5.37 | 108.0 | 761.1 | 130.9 | 5.54 |
| July | 10 | 12.5 | 2.9 | 80.2 | 19.8 | 5.32 | 99.9 | 770.6 | 129.5 | 5.58 |
| July | 10 | 13.5 | 3.4 | 79.9 | 20.1 | 5.94 | 89.8 | 651.8 | 258.4 | 6.12 |
| July | 9 | 14.5 | 4.4 | 79.0 | 21.0 | 5.63 | 87.6 | 711.2 | 201.2 | 5.92 |
| July | 10 | 15.5 | 5.6 | 79.2 | 20.8 | 5.48 | 82.6 | 740.0 | 177.4 | 5.86 |
| July | 10 | 16.5 | 7.1 | 78.6 | 21.4 | 5.47 | 94.0 | 741.9 | 164.1 | 5.74 |
| July | 10 | 17.5 | 8.8 | 78.5 | 21.5 | 6.07 | 81.5 | 626.8 | 291.7 | 6.30 |
| July | 10 | 18.5 | 11.2 | 77.9 | 22.1 | 5.37 | 105.7 | 761.1 | 133.2 | 5.56 |
| July | 10 | 22.5 | 14.1 | 78.0 | 22.0 | 5.81 | 88.1 | 676.7 | 235.2 | 6.05 |
| Aug | 1 | 44.3 | 125.2 | 73.9 | 26.1 | 6.16 | 64.6 | 609.6 | 325.8 | 6.52 |
| Aug | 1 | 30.8 | 50.6 | 74.6 | 25.4 | 6.05 | 82.5 | 630.7 | 286.8 | 6.27 |
| Aug | 1 | 42.8 | 128.6 | 66.0 | 34.0 | 7.35 | 40.4 | 381.4 | 578.2 | 7.62 |
| Aug | 2 | 31.3 | 49.5 | 75.5 | 24.5 | 6.19 | 64.0 | 603.8 | 332.2 | 6.55 |
| Aug | 1 | 41.8 | 124.3 | 71.3 | 28.7 | 6.84 | 55.5 | 479.2 | 465.3 | 7.10 |
| Aug | 1 | 31.8 | 52.5 | 71.8 | 28.2 | 6.31 | 73.2 | 580.8 | 346.0 | 6.55 |
| Aug | 1 | 40.8 | 97.2 | 71.1 | 28.9 | 6.71 | 59.0 | 504.1 | 436.9 | 6.98 |
| Aug | 1 | 34.8 | 84.9 | 62.6 | 37.4 | 7.54 | 33.9 | 345.0 | 621.1 | 7.82 |
| Aug | 2 | 33.3 | 79.6 | 65.5 | 34.5 | 7.61 | 39.1 | 331.6 | 629.3 | 7.82 |
| Aug | 3 | 38.8 | 126.5 | 61.9 | 38.1 | 7.52 | 44.3 | 348.8 | 606.9 | 7.71 |
| Aug | 1 | 36.8 | 100.7 | 63.1 | 36.9 | 7.37 | 48.1 | 377.6 | 574.3 | 7.56 |
| Aug | 1 | 37.8 | 90.6 | 71.7 | 28.4 | 6.55 | 78.3 | 534.8 | 386.9 | 6.68 |
| Aug | 2 | 33.8 | 62.5 | 74.9 | 25.1 | 6.13 | 73.4 | 615.3 | 311.3 | 6.42 |
| Aug | 2 | 37.3 | 93.0 | 66.1 | 33.9 | 7.32 | 42.3 | 387.2 | 570.5 | 7.58 |
| Aug | 2 | 46.8 | 174.3 | 64.2 | 35.8 | 6.83 | 43.7 | 481.1 | 475.2 | 7.21 |
| Aug | 3 | 30.3 | 47.9 | 76.1 | 23.9 | 6.45 | 63.7 | 554.0 | 382.3 | 6.74 |
| Aug | 4 | 22.8 | 19.8 | 76.7 | 23.3 | 5.7 | 80.7 | 697.8 | 221.5 | 6.04 |
| Aug | 2 | 26.3 | 27.4 | 77.3 | 22.7 | 5.59 | 83.3 | 718.9 | 197.8 | 5.93 |
| Aug | 1 | 26.8 | 35.7 | 78.0 | 22.0 | 5.66 | 77.5 | 705.5 | 217.0 | 6.04 |
| Aug | 1 | 27.3 | 30.8 | 76.6 | 23.4 | 5.87 | 79.4 | 665.2 | 255.4 | 6.17 |
| Aug | 4 | 21.8 | 15.8 | 79.8 | 20.2 | 5.75 | 75.9 | 688.2 | 235.9 | 6.12 |
| Aug | 4 | 16.3 | 6.4 | 80.4 | 19.7 | 5.61 | 89.4 | 715.0 | 195.6 | 5.89 |
| Aug | 2 | 22.3 | 16.2 | 76.2 | 23.8 | 5.85 | 82.1 | 669.0 | 248.9 | 6.13 |
| Aug | 4 | 20.8 | 15.1 | 79.2 | 20.8 | 5.95 | 77.4 | 649.8 | 272.8 | 6.25 |
| Aug | 2 | 23.3 | 22.6 | 78.8 | 21.3 | 5.71 | 85.4 | 695.9 | 218.7 | 6.00 |
| Aug | 1 | 28.3 | 39.1 | 76.2 | 23.8 | 6.19 | 72.2 | 603.8 | 324.0 | 6.47 |
| Aug | 4 | 29.3 | 39.6 | 76.5 | 23.6 | 5.97 | 72.1 | 646.0 | 281.9 | 6.31 |
| Aug | 2 | 28.8 | 40.1 | 77.2 | 22.8 | 5.72 | 82.3 | 693.9 | 223.8 | 6.04 |
| Aug | 5 | 20.3 | 12.6 | 79.4 | 20.6 | 5.64 | 89.6 | 709.3 | 201.1 | 5.91 |
| Aug | 5 | 19.3 | 10.6 | 78.5 | 21.5 | 5.48 | 86.5 | 740.0 | 173.5 | 5.82 |
| Aug | 4 | 24.3 | 24.0 | 77.9 | 22.1 | 5.81 | 73.0 | 676.7 | 250.3 | 6.19 |
| Aug | 4 | 24.8 | 25.7 | 77.3 | 22.7 | 5.93 | 78.2 | 653.7 | 268.1 | 6.23 |
| Aug | 5 | 18.3 | 9.6 | 80.7 | 19.3 | 5.7 | 84.0 | 697.8 | 218.2 | 6.00 |
| Aug | 5 | 21.3 | 16.9 | 80.0 | 20.0 | 5.64 | 83.2 | 709.3 | 207.5 | 5.97 |
| Aug | 5 | 17.3 | 7.3 | 79.8 | 20.2 | 5.44 | 87.9 | 747.6 | 164.5 | 5.78 |
| Aug | 5 | 16.8 | 7.5 | 80.8 | 19.2 | 5.66 | 100.0 | 705.5 | 194.5 | 5.82 |
| Aug | 5 | 15.3 | 5.4 | 81.6 | 18.4 | 5.24 | 93.8 | 786.0 | 120.2 | 5.58 |
| Aug | 5 | 17.8 | 8.8 | 80.5 | 19.5 | 5.49 | 93.6 | 738.0 | 168.4 | 5.76 |
| Aug | 5 | 19.8 | 12.8 | 78.5 | 21.5 | 5.68 | 80.5 | 701.6 | 217.9 | 6.02 |
| Aug | 5 | 15.8 | 5.9 | 81.0 | 19.0 | 5.34 | 92.1 | 766.8 | 141.1 | 5.67 |
| Aug | 10 | 7.5 | 0.5 | 81.6 | 18.4 | 5.08 | 92.7 | 816.7 | 90.6 | 5.47 |
| Aug | 10 | 8.5 | 0.7 | 84.4 | 15.7 | 5.38 | 91.9 | 759.1 | 149.0 | 5.70 |
| Aug | 10 | 9.5 | 1.2 | 81.4 | 18.6 | 5.12 | 93.3 | 809.0 | 97.7 | 5.49 |
| Aug | 10 | 10.5 | 1.6 | 81.2 | 18.8 | 5.41 | 93.4 | 753.4 | 153.2 | 5.70 |
| Aug | 10 | 11.5 | 2.3 | 81.6 | 18.4 | 5.48 | 86.4 | 740.0 | 173.6 | 5.82 |
| Aug | 10 | 12.5 | 2.8 | 81.5 | 18.6 | 5.43 | 91.5 | 749.6 | 158.9 | 5.74 |
| Aug | 10 | 13.5 | 3.6 | 79.4 | 20.6 | 5.33 | 90.4 | 768.7 | 140.9 | 5.67 |
| Aug | 10 | 14.5 | 4.9 | 79.5 | 20.5 | 5.4 | 89.0 | 755.3 | 155.7 | 5.74 |
| Oct | 1 | 28.3 | 34.2 | 76.2 | 23.9 | 5.58 | 83.3 | 720.8 | 195.9 | 5.92 |
| Oct | 2 | 23.8 | 19.5 | 78.3 | 21.7 | 5.78 | 77.3 | 682.4 | 240.3 | 6.13 |
| Oct | 2 | 27.5 | 38.8 | 73.6 | 26.4 | 6.25 | 50.4 | 592.3 | 357.3 | 6.72 |
| Oct | 1 | 29.3 | 43.8 | 74.2 | 25.8 | 6.33 | 60.3 | 577.0 | 362.7 | 6.69 |
| Oct | 2 | 22.8 | 17.4 | 80.7 | 19.3 | 5.42 | 86.2 | 751.5 | 162.3 | 5.78 |
| Oct | 5 | 21.3 | 14.3 | 77.3 | 22.7 | 6.04 | 74.2 | 632.6 | 293.2 | 6.34 |
| Oct | 1 | 28.8 | 34.7 | 75.3 | 24.7 | 5.66 | 73.4 | 705.5 | 221.1 | 6.08 |
| Oct | 2 | 36.3 | 90.5 | 62.5 | 37.5 | 7.28 | 36.4 | 394.8 | 568.8 | 7.61 |
| Oct | 5 | 20.8 | 12.0 | 81.1 | 18.9 | 5.34 | 103.5 | 766.8 | 129.7 | 5.56 |
| Oct | 3 | 26.8 | 29.2 | 77.1 | 22.9 | 5.43 | 90.6 | 749.6 | 159.8 | 5.75 |
| Oct | 1 | 44.3 | 146.3 | 67.6 | 32.4 | 6.87 | 41.3 | 473.4 | 485.3 | 7.26 |
| Oct | 4 | 23.3 | 18.3 | 78.8 | 21.2 | 5.65 | 93.1 | 707.4 | 199.5 | 5.88 |
| Oct | 4 | 22.3 | 17.1 | 78.4 | 21.6 | 5.63 | 84.3 | 711.2 | 204.5 | 5.95 |
| Oct | 1 | 30.3 | 49.0 | 70.2 | 29.9 | 6.82 | 55.5 | 483.0 | 461.5 | 7.09 |
| Oct | 4 | 25.8 | 26.5 | 77.9 | 22.1 | 5.87 | 76.8 | 665.2 | 258.0 | 6.20 |
| Oct | 1 | 30.8 | 50.0 | 74.9 | 25.1 | 6.37 | 66.0 | 569.3 | 364.7 | 6.66 |
| Oct | 4 | 24.3 | 21.6 | 77.6 | 22.4 | 5.57 | 91.3 | 722.7 | 186.0 | 5.84 |
| Oct | 3 | 21.8 | 17.0 | 79.0 | 21.0 | 6.03 | 76.2 | 634.5 | 289.3 | 6.32 |
| Oct | 2 | 24.5 | 22.9 | 78.1 | 21.9 | 5.84 | 78.2 | 670.9 | 250.9 | 6.16 |
| Oct | 2 | 31.8 | 50.6 | 73.6 | 26.4 | 6.29 | 81.7 | 584.7 | 333.6 | 6.46 |
| Oct | 1 | 37.3 | 91.1 | 69.9 | 30.2 | 6.46 | 60.5 | 552.1 | 387.4 | 6.78 |
| Oct | 1 | 37.8 | 71.7 | 61.2 | 38.8 | 7.45 | 51.3 | 362.2 | 586.5 | 7.59 |
| Oct | 1 | 32.5 | 63.4 | 70.0 | 30.0 | 6.91 | 52.5 | 465.8 | 481.7 | 7.18 |
| Oct | 2 | 25.3 | 26.9 | 78.0 | 22.1 | 5.66 | 80.4 | 705.5 | 214.1 | 6.01 |
| Oct | 1 | 34.8 | 80.7 | 75.1 | 24.9 | 5.8 | 55.0 | 678.6 | 266.4 | 6.35 |
| Oct | 1 | 31.3 | 55.0 | 78.1 | 21.9 | 5.99 | 71.2 | 642.2 | 286.6 | 6.34 |
| Oct | 1 | 25.3 | 24.0 | 77.8 | 22.2 | 5.41 | 99.1 | 753.4 | 147.5 | 5.65 |
| Oct | 2 | 33.8 | 63.2 | 71.6 | 28.4 | 6.79 | 61.9 | 488.8 | 449.3 | 7.01 |
| Oct | 3 | 36.8 | 92.0 | 69.4 | 30.7 | 7.33 | 33.2 | 385.2 | 581.6 | 7.67 |
| Oct | 5 | 18.8 | 10.9 | 78.1 | 21.9 | 5.88 | 67.8 | 663.3 | 268.9 | 6.29 |
| Oct | 5 | 16.3 | 6.6 | 80.7 | 19.3 | 5.33 | 93.0 | 768.7 | 138.3 | 5.65 |
| Oct | 5 | 16.8 | 7.1 | 80.1 | 20.0 | 5.74 | 76.2 | 690.1 | 233.7 | 6.11 |
| Oct | 5 | 15.3 | 5.1 | 80.4 | 19.6 | 5.41 | 90.2 | 753.4 | 156.4 | 5.73 |
| Oct | 5 | 17.8 | 9.1 | 79.4 | 20.6 | 5.67 | 75.4 | 703.5 | 221.1 | 6.06 |
| Oct | 5 | 15.8 | 6.2 | 80.1 | 19.9 | 5.52 | 88.6 | 732.3 | 179.1 | 5.83 |
| Oct | 10 | 19.5 | 12.5 | 79.4 | 20.6 | 5.83 | 73.2 | 672.9 | 253.9 | 6.20 |
| Oct | 10 | 14.5 | 4.5 | 81.0 | 19.0 | 5.65 | 83.4 | 707.4 | 209.2 | 5.97 |
| Oct | 10 | 13.5 | 3.5 | 81.4 | 18.6 | 5.57 | 81.9 | 722.7 | 195.4 | 5.93 |
| Oct | 10 | 12.5 | 2.6 | 80.9 | 19.1 | 5.59 | 75.6 | 718.9 | 205.5 | 6.00 |
| Oct | 10 | 11.5 | 2.2 | 81.7 | 18.3 | 5.5 | 78.2 | 736.1 | 185.7 | 5.91 |
| Oct | 10 | 10.5 | 1.4 | 82.0 | 18.0 | 5.55 | 81.2 | 726.5 | 192.3 | 5.92 |
| Oct | 10 | 9.5 | 1.1 | 82.1 | 17.9 | 5.32 | 86.1 | 770.6 | 143.3 | 5.71 |
| Oct | 10 | 8.5 | 0.7 | 83.3 | 16.7 | 5.33 | 85.9 | 768.7 | 145.4 | 5.72 |
| Oct | 10 | 7.5 | 0.4 | 83.0 | 17.0 | 5.18 | 95.3 | 797.5 | 107.2 | 5.52 |
References
- Als, T.D. , Hansen, M. M., Maes, G.E., Castonguay, M., Riemann, L., Aarestrup, K. and Munk, P. All roads lead to home: panmixia of European eel in the Sargasso Sea. Molecular Ecology 2011, 20, 1333–1346. [Google Scholar] [CrossRef]
- Boëtius, I. and J. Böetius. Lipid and protein content in Anguilla anguilla during growth and starvation. Dana 1985, 4, 1–17. [Google Scholar]
- From, J. and G. Rasmussen. A growth model, gastric evacuation, and body composition in rainbow trout, Salmo gairdneri Richardson, 1836. Dana 1984, 3, 61–139. [Google Scholar]
- ICES (2023). European eel (Anguilla anguilla) Throughout its natural range. ICES Advice: Recurrent Advice. [CrossRef]
- Gómez-Limia, L., N. Cobas and S. Martínez. Proximate composition, fatty acid profile and total amino acid contents in samples of the European eel (Anguilla anguilla) of different weights. International Journal of Gastronomy and Food Science 2021, 25, 1–7. [Google Scholar] [CrossRef]
- Rasmussen, G. , 1983. Recent investigations on the population dynamics of eel (Anguila anguilla L.) in some Danish streams. Proceedings of the 3th British Freshwater Fish Conference, 71-77.
- Rasmussen, G., B. Therkildsen and M. Pedersen, 2024. Food, growth and biological production of European eel Anguilla anguilla in a small stream in Jutland, Denmark. /: https. [CrossRef]
Figure 1.
Percentage water of yellow eel versus Body mass of yellow eel.
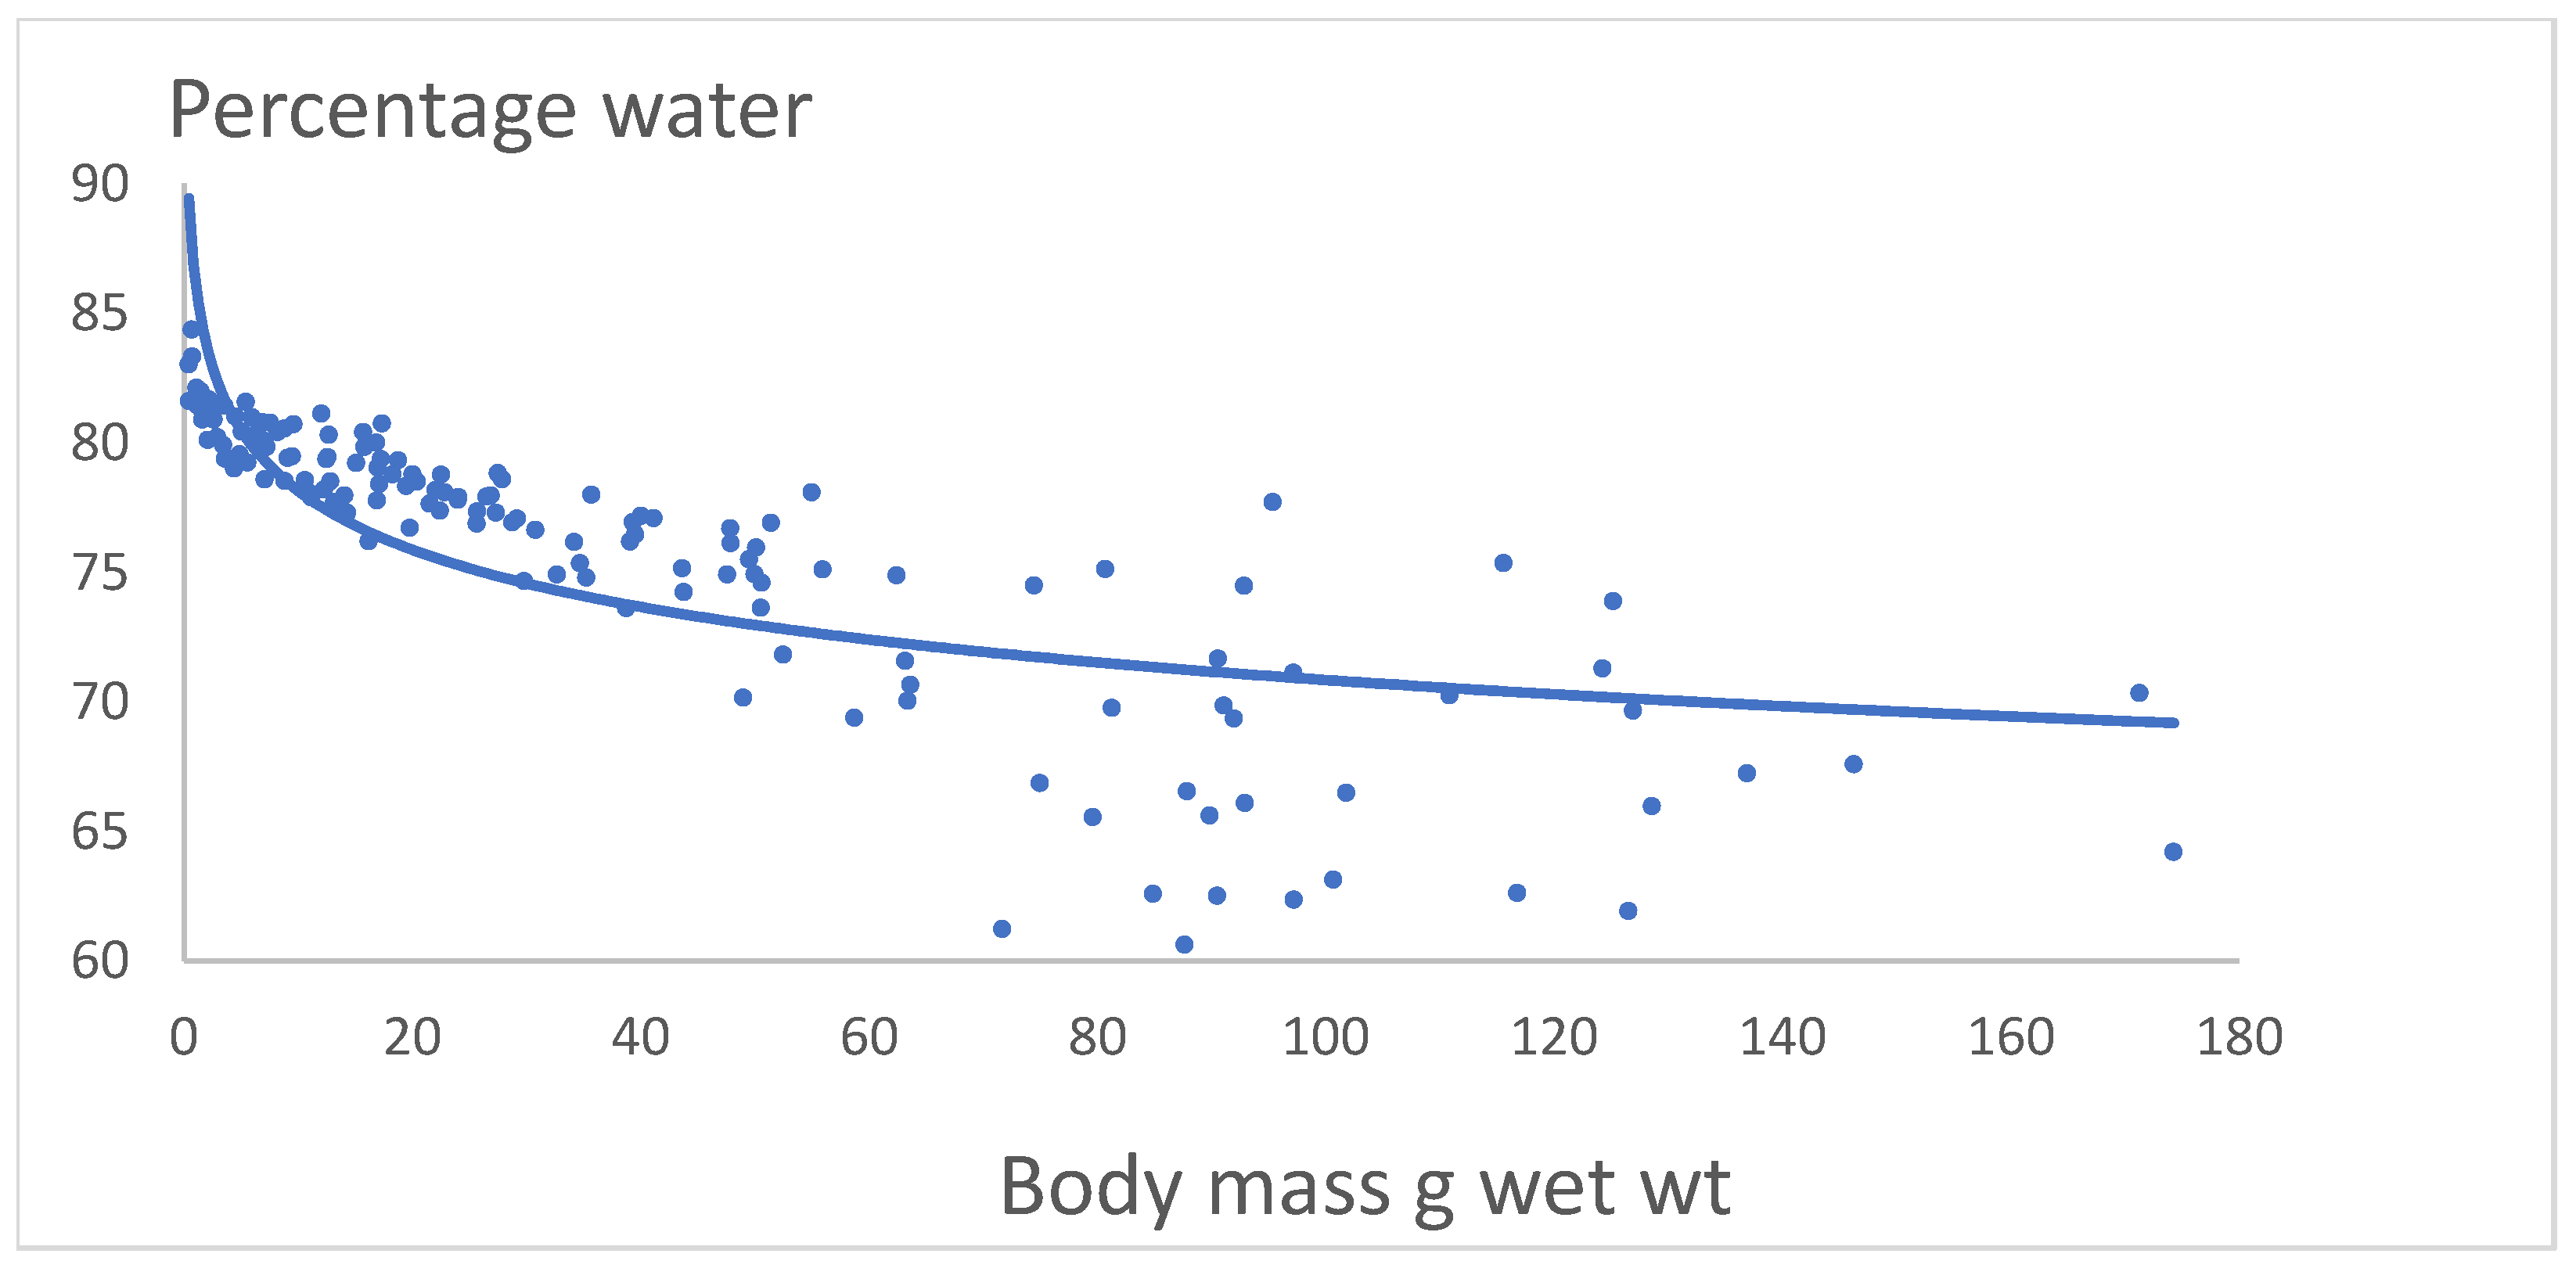
Figure 2.
Mg body constituent protein, lipid and ash per g wet wt. versus Body mass of yellow eel.
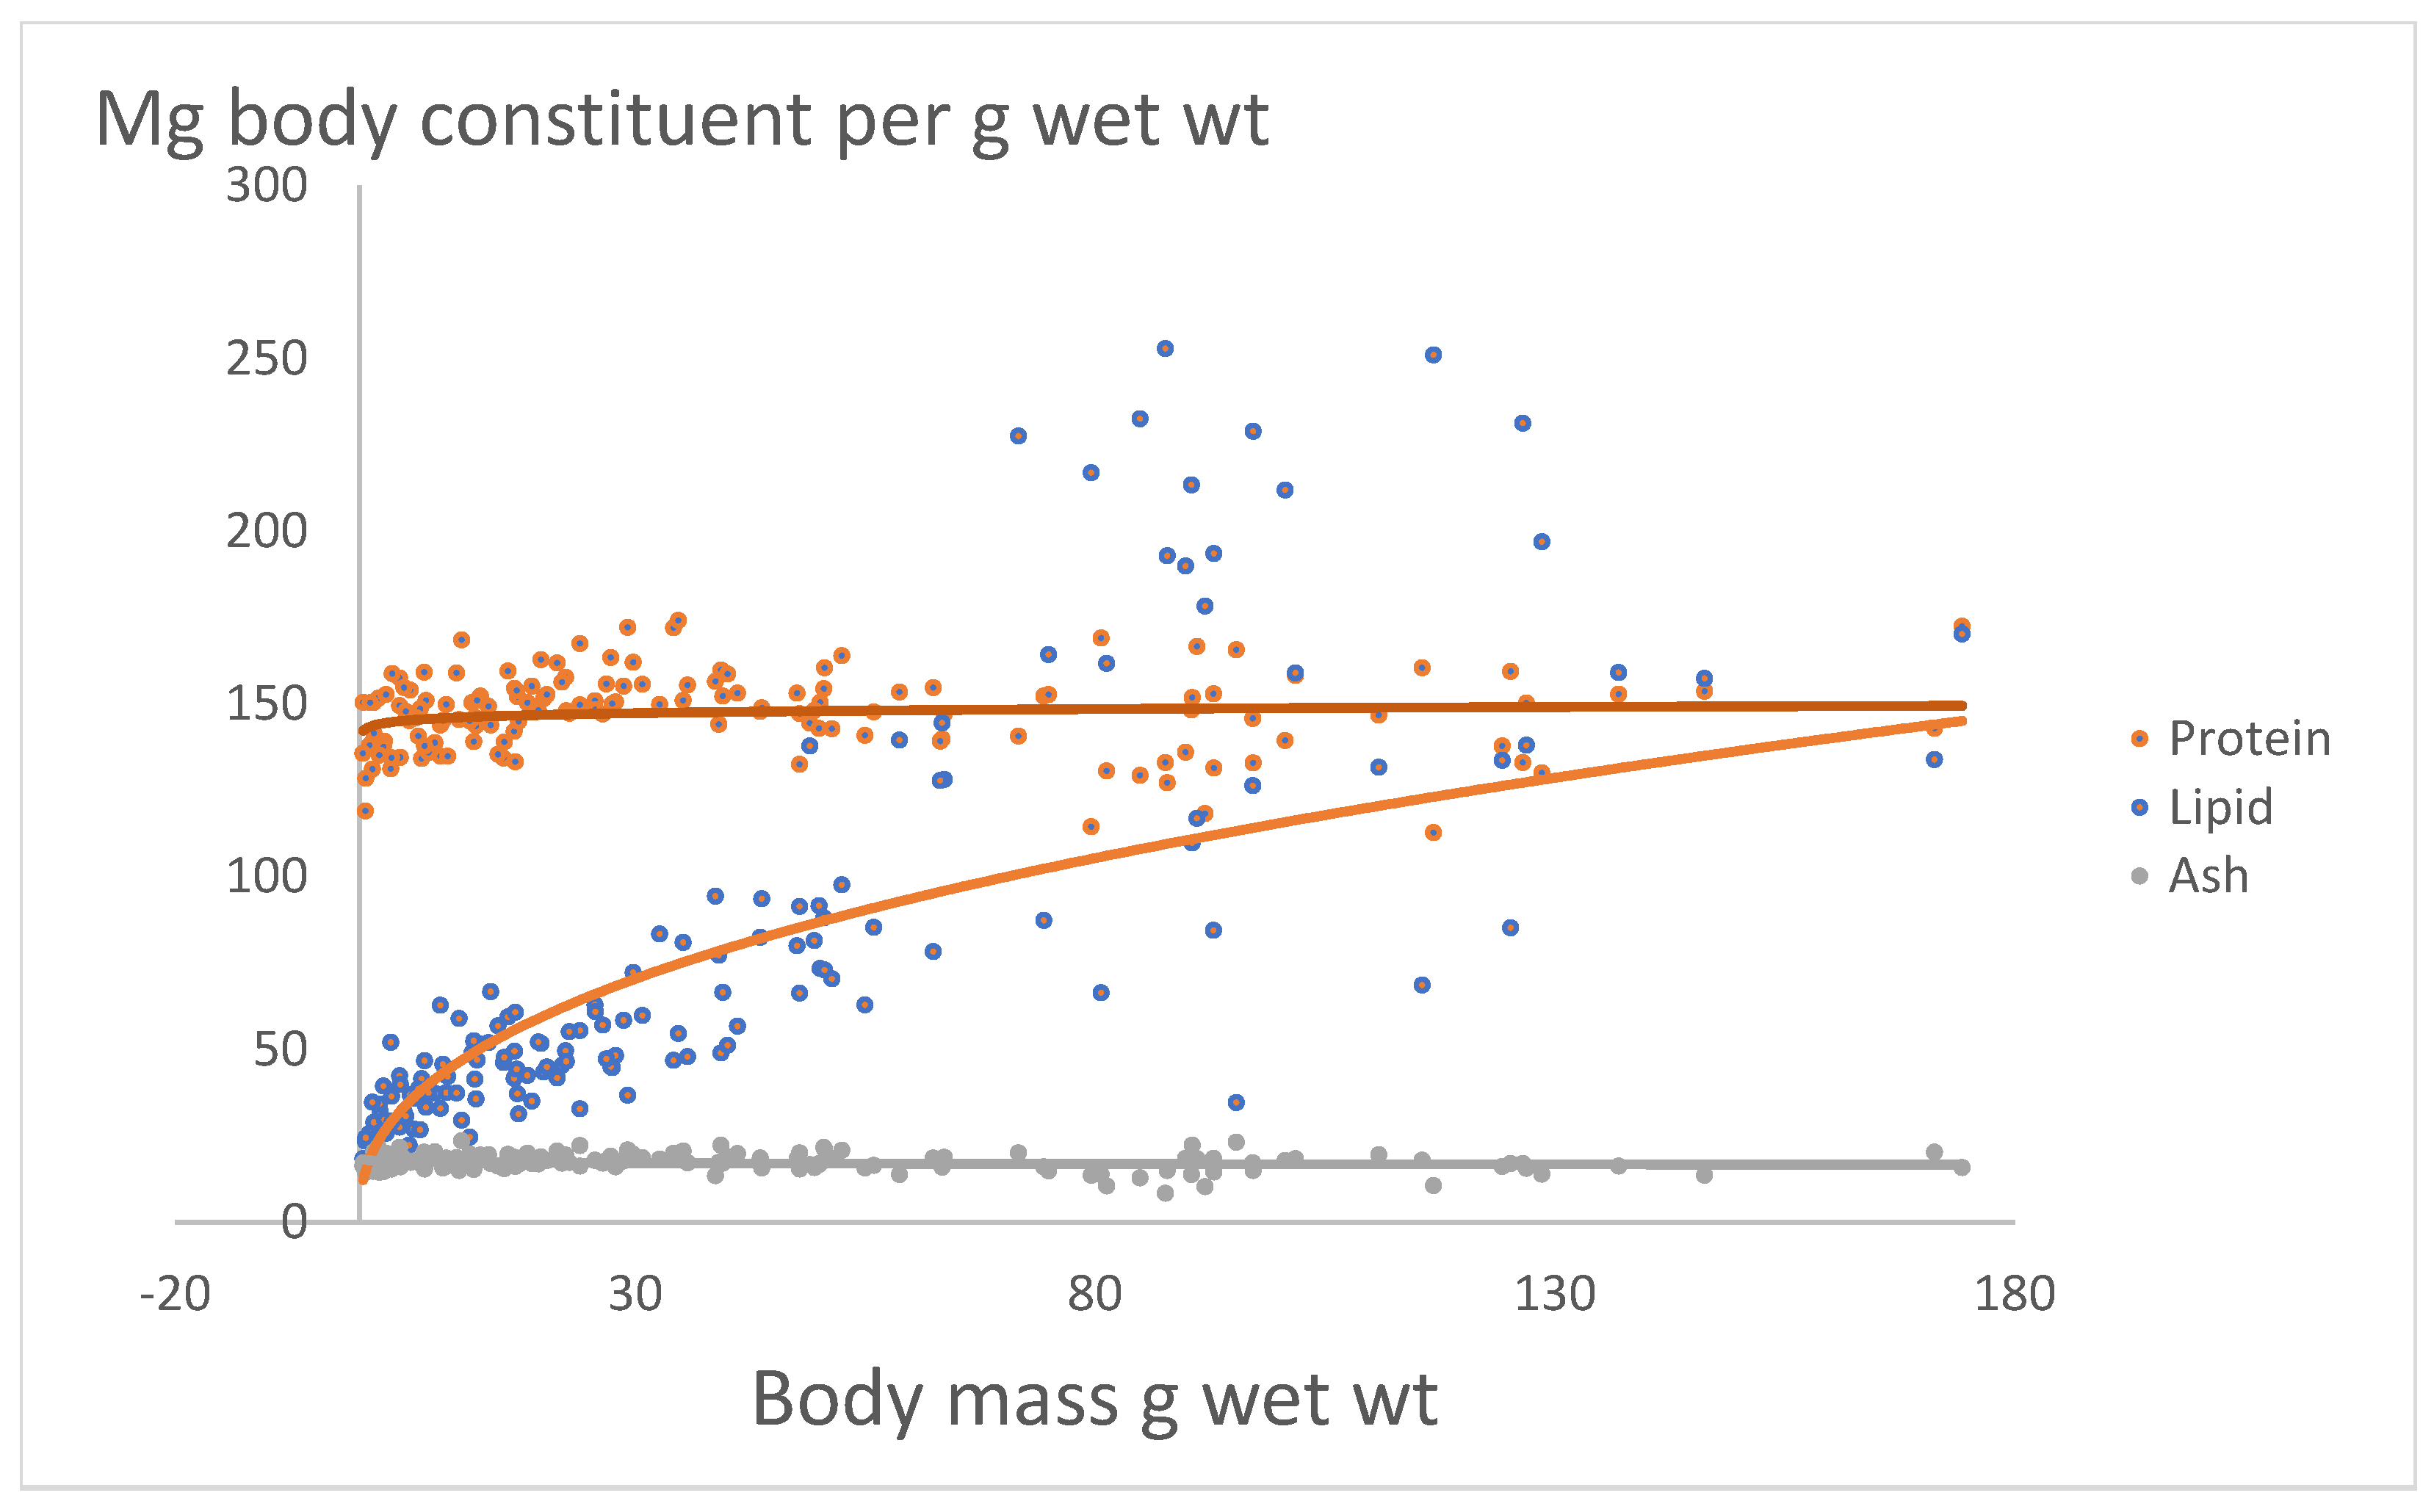
Figure 3.
Mg body constituent (protein, lipid and ash per g wet wt.) per g wet wt. versus Percentage water of yellow eel.
Figure 3.
Mg body constituent (protein, lipid and ash per g wet wt.) per g wet wt. versus Percentage water of yellow eel.
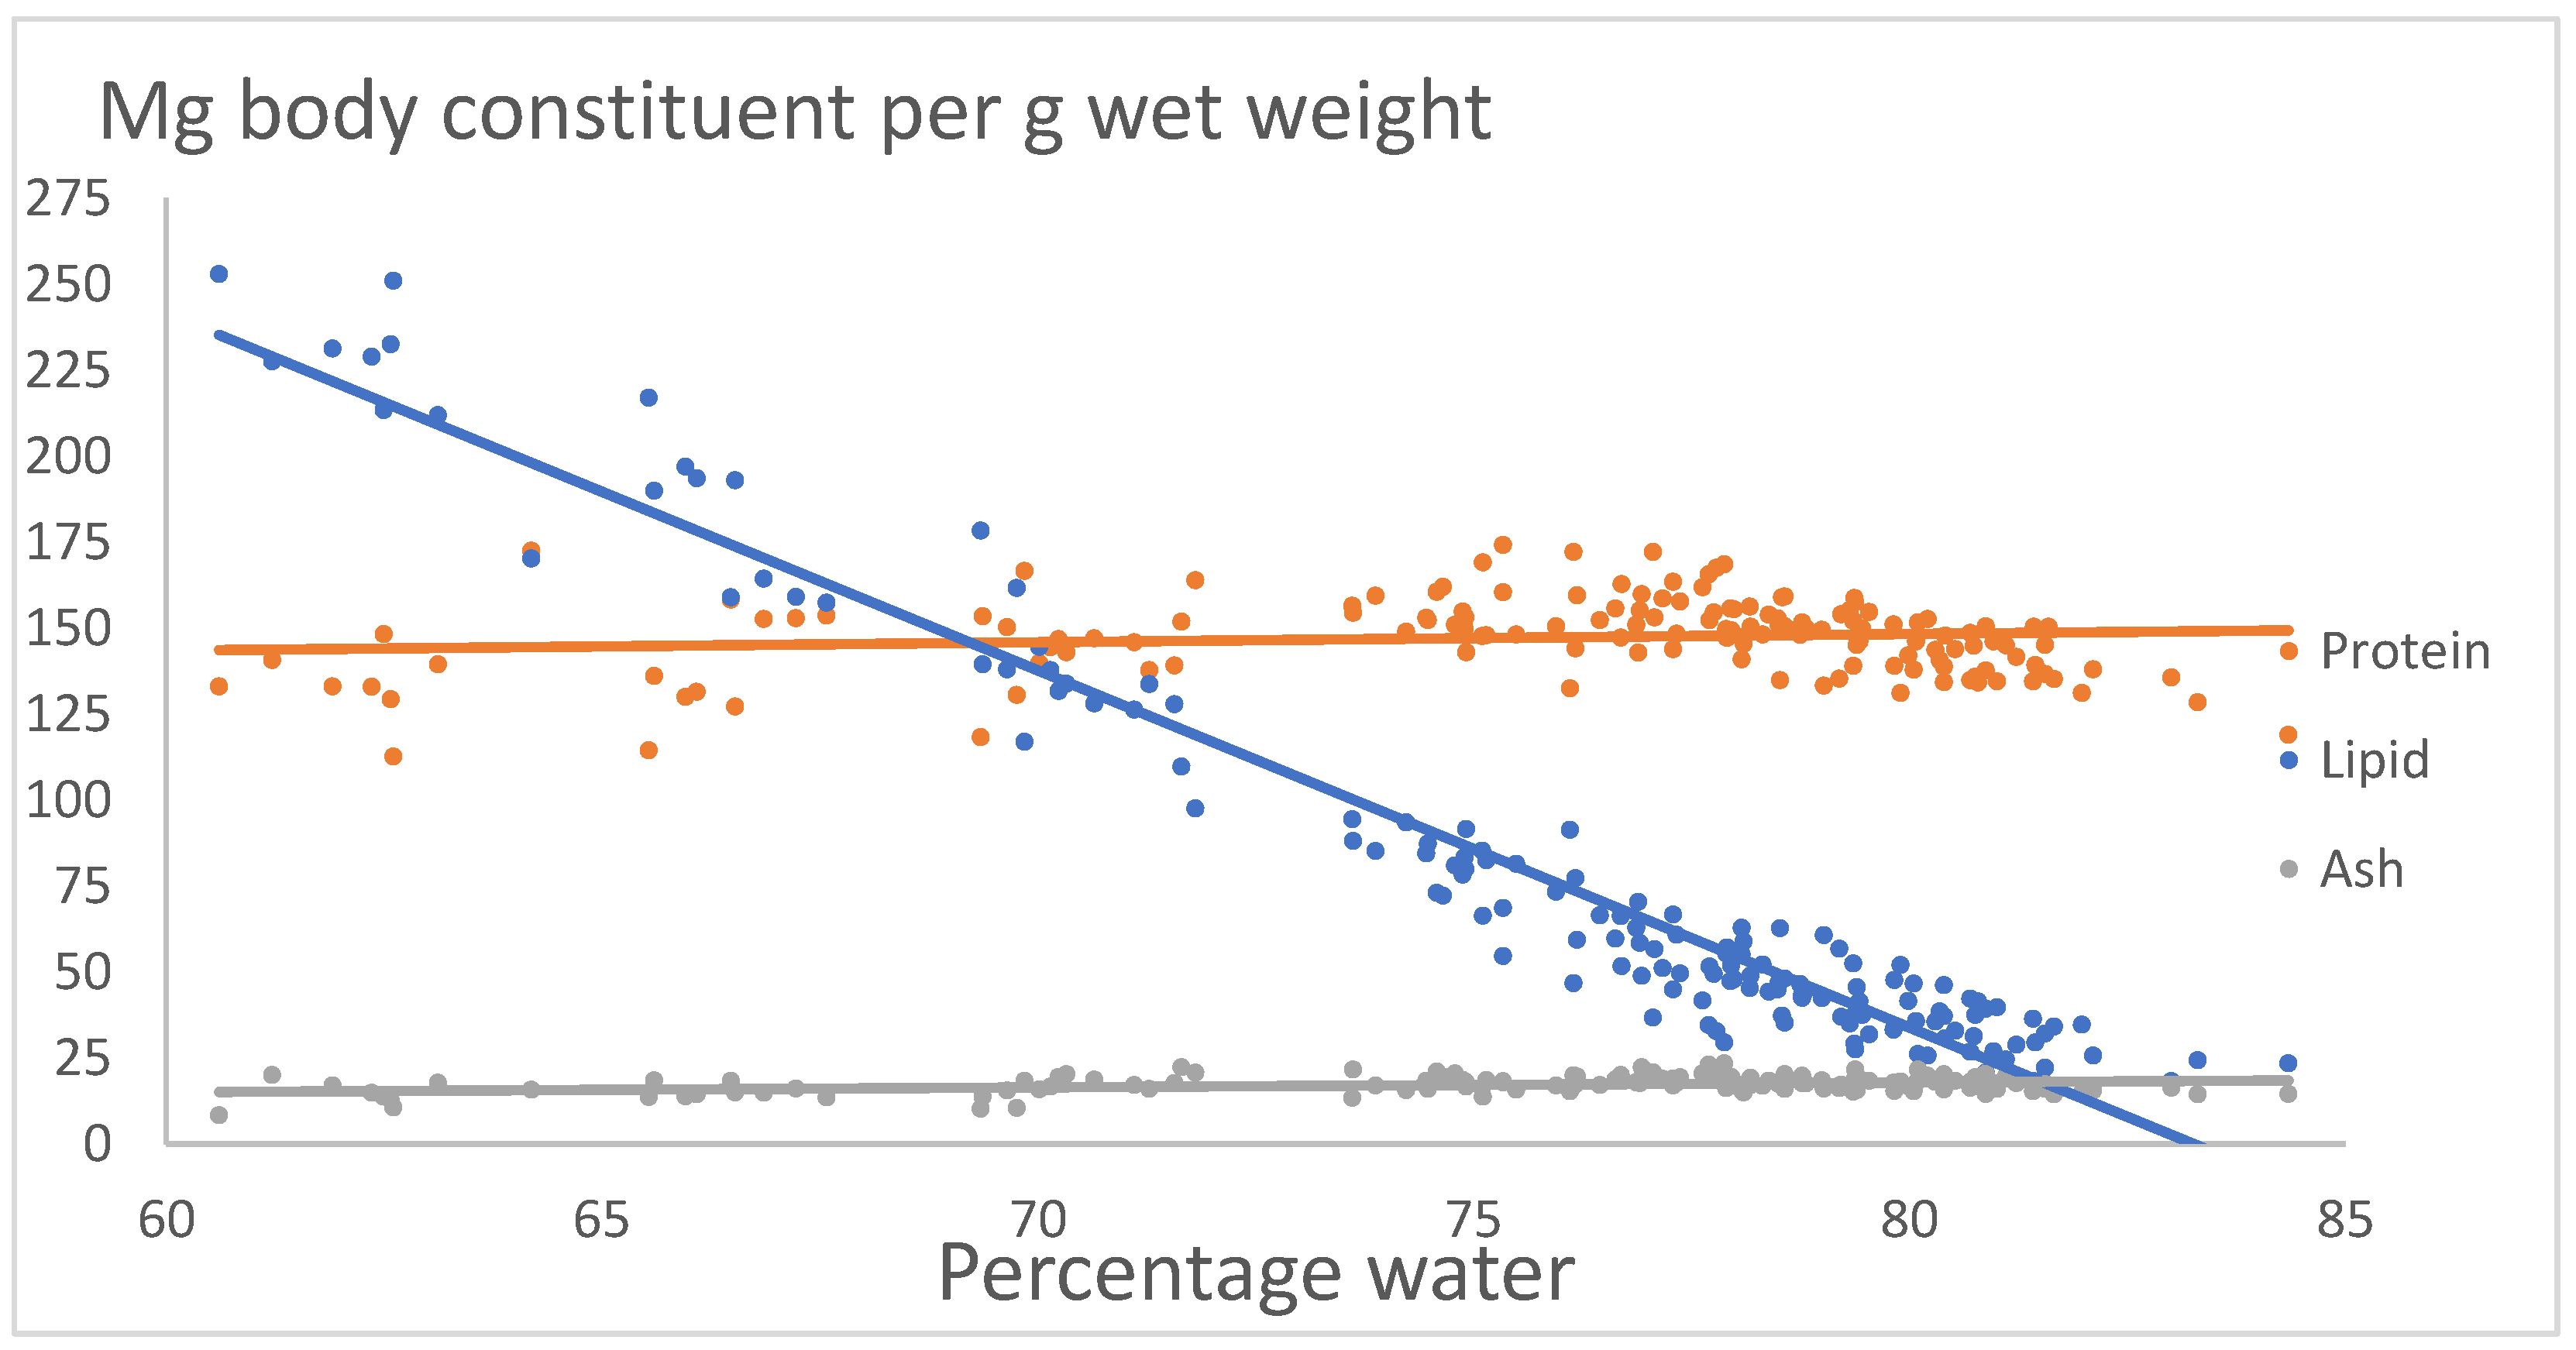
Figure 4.
Mg body constituent (protein, lipid and ash per g per g dry wt.) versus Percent water of yellow eel.
Figure 4.
Mg body constituent (protein, lipid and ash per g per g dry wt.) versus Percent water of yellow eel.
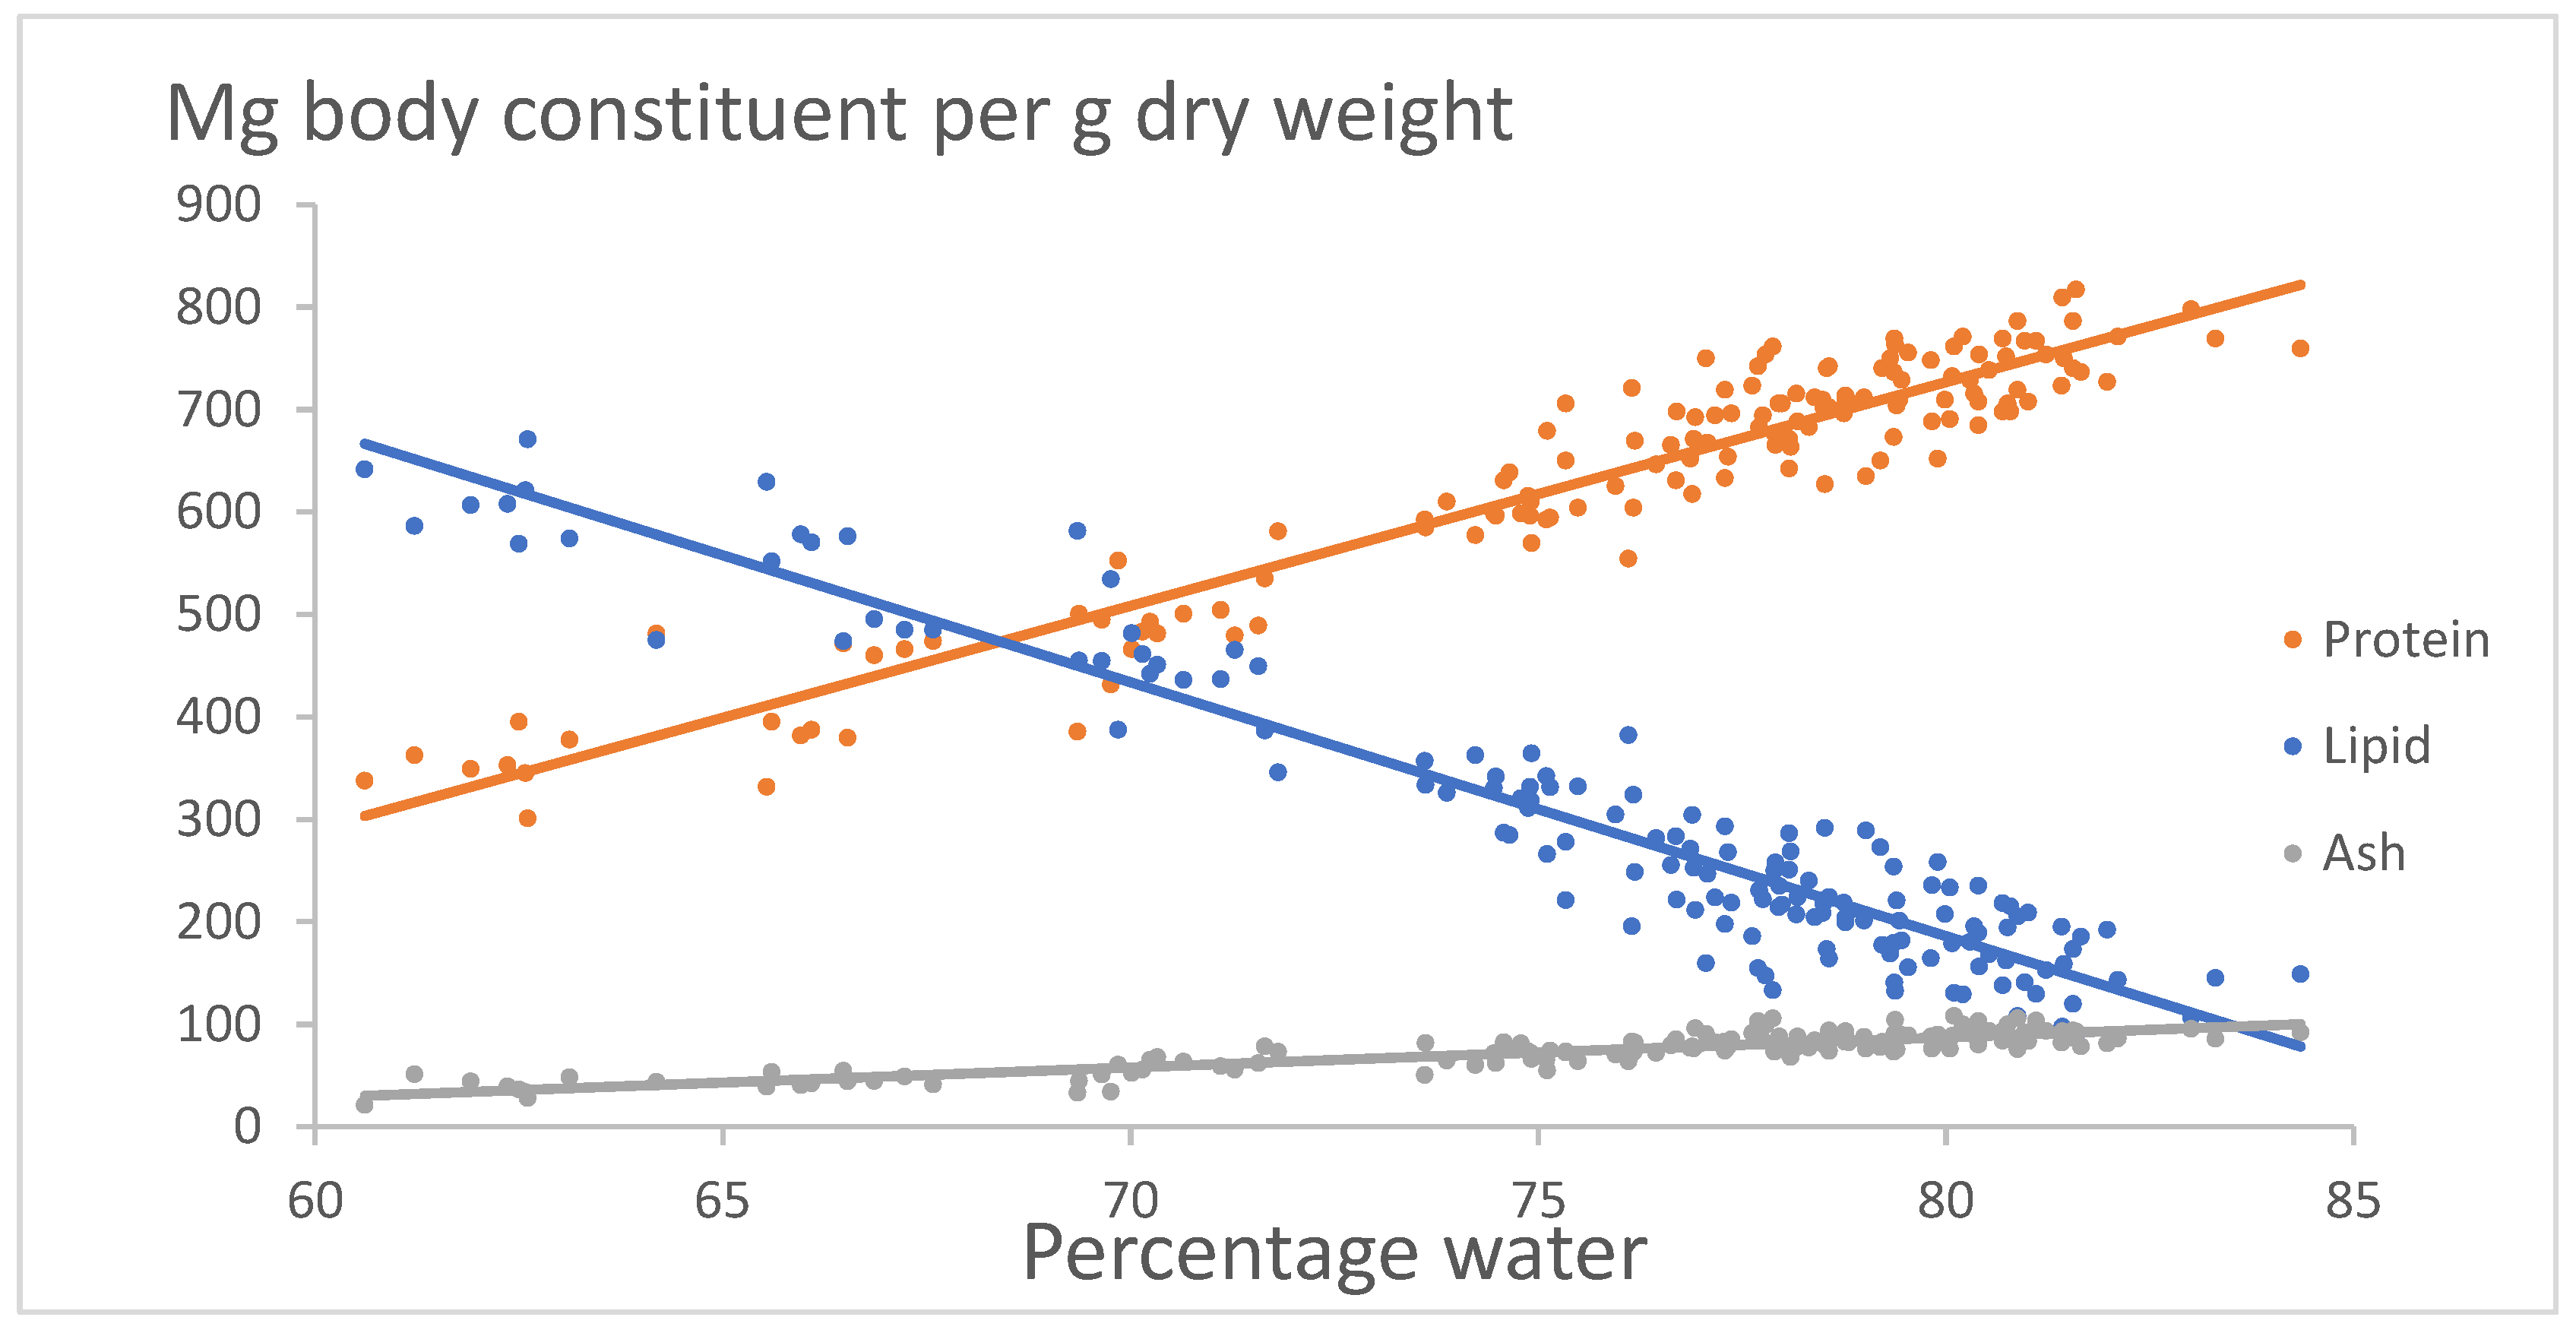
Figure 5.
Kcal (bombing) per g wet wt. versus percentage of water of yellow eel.
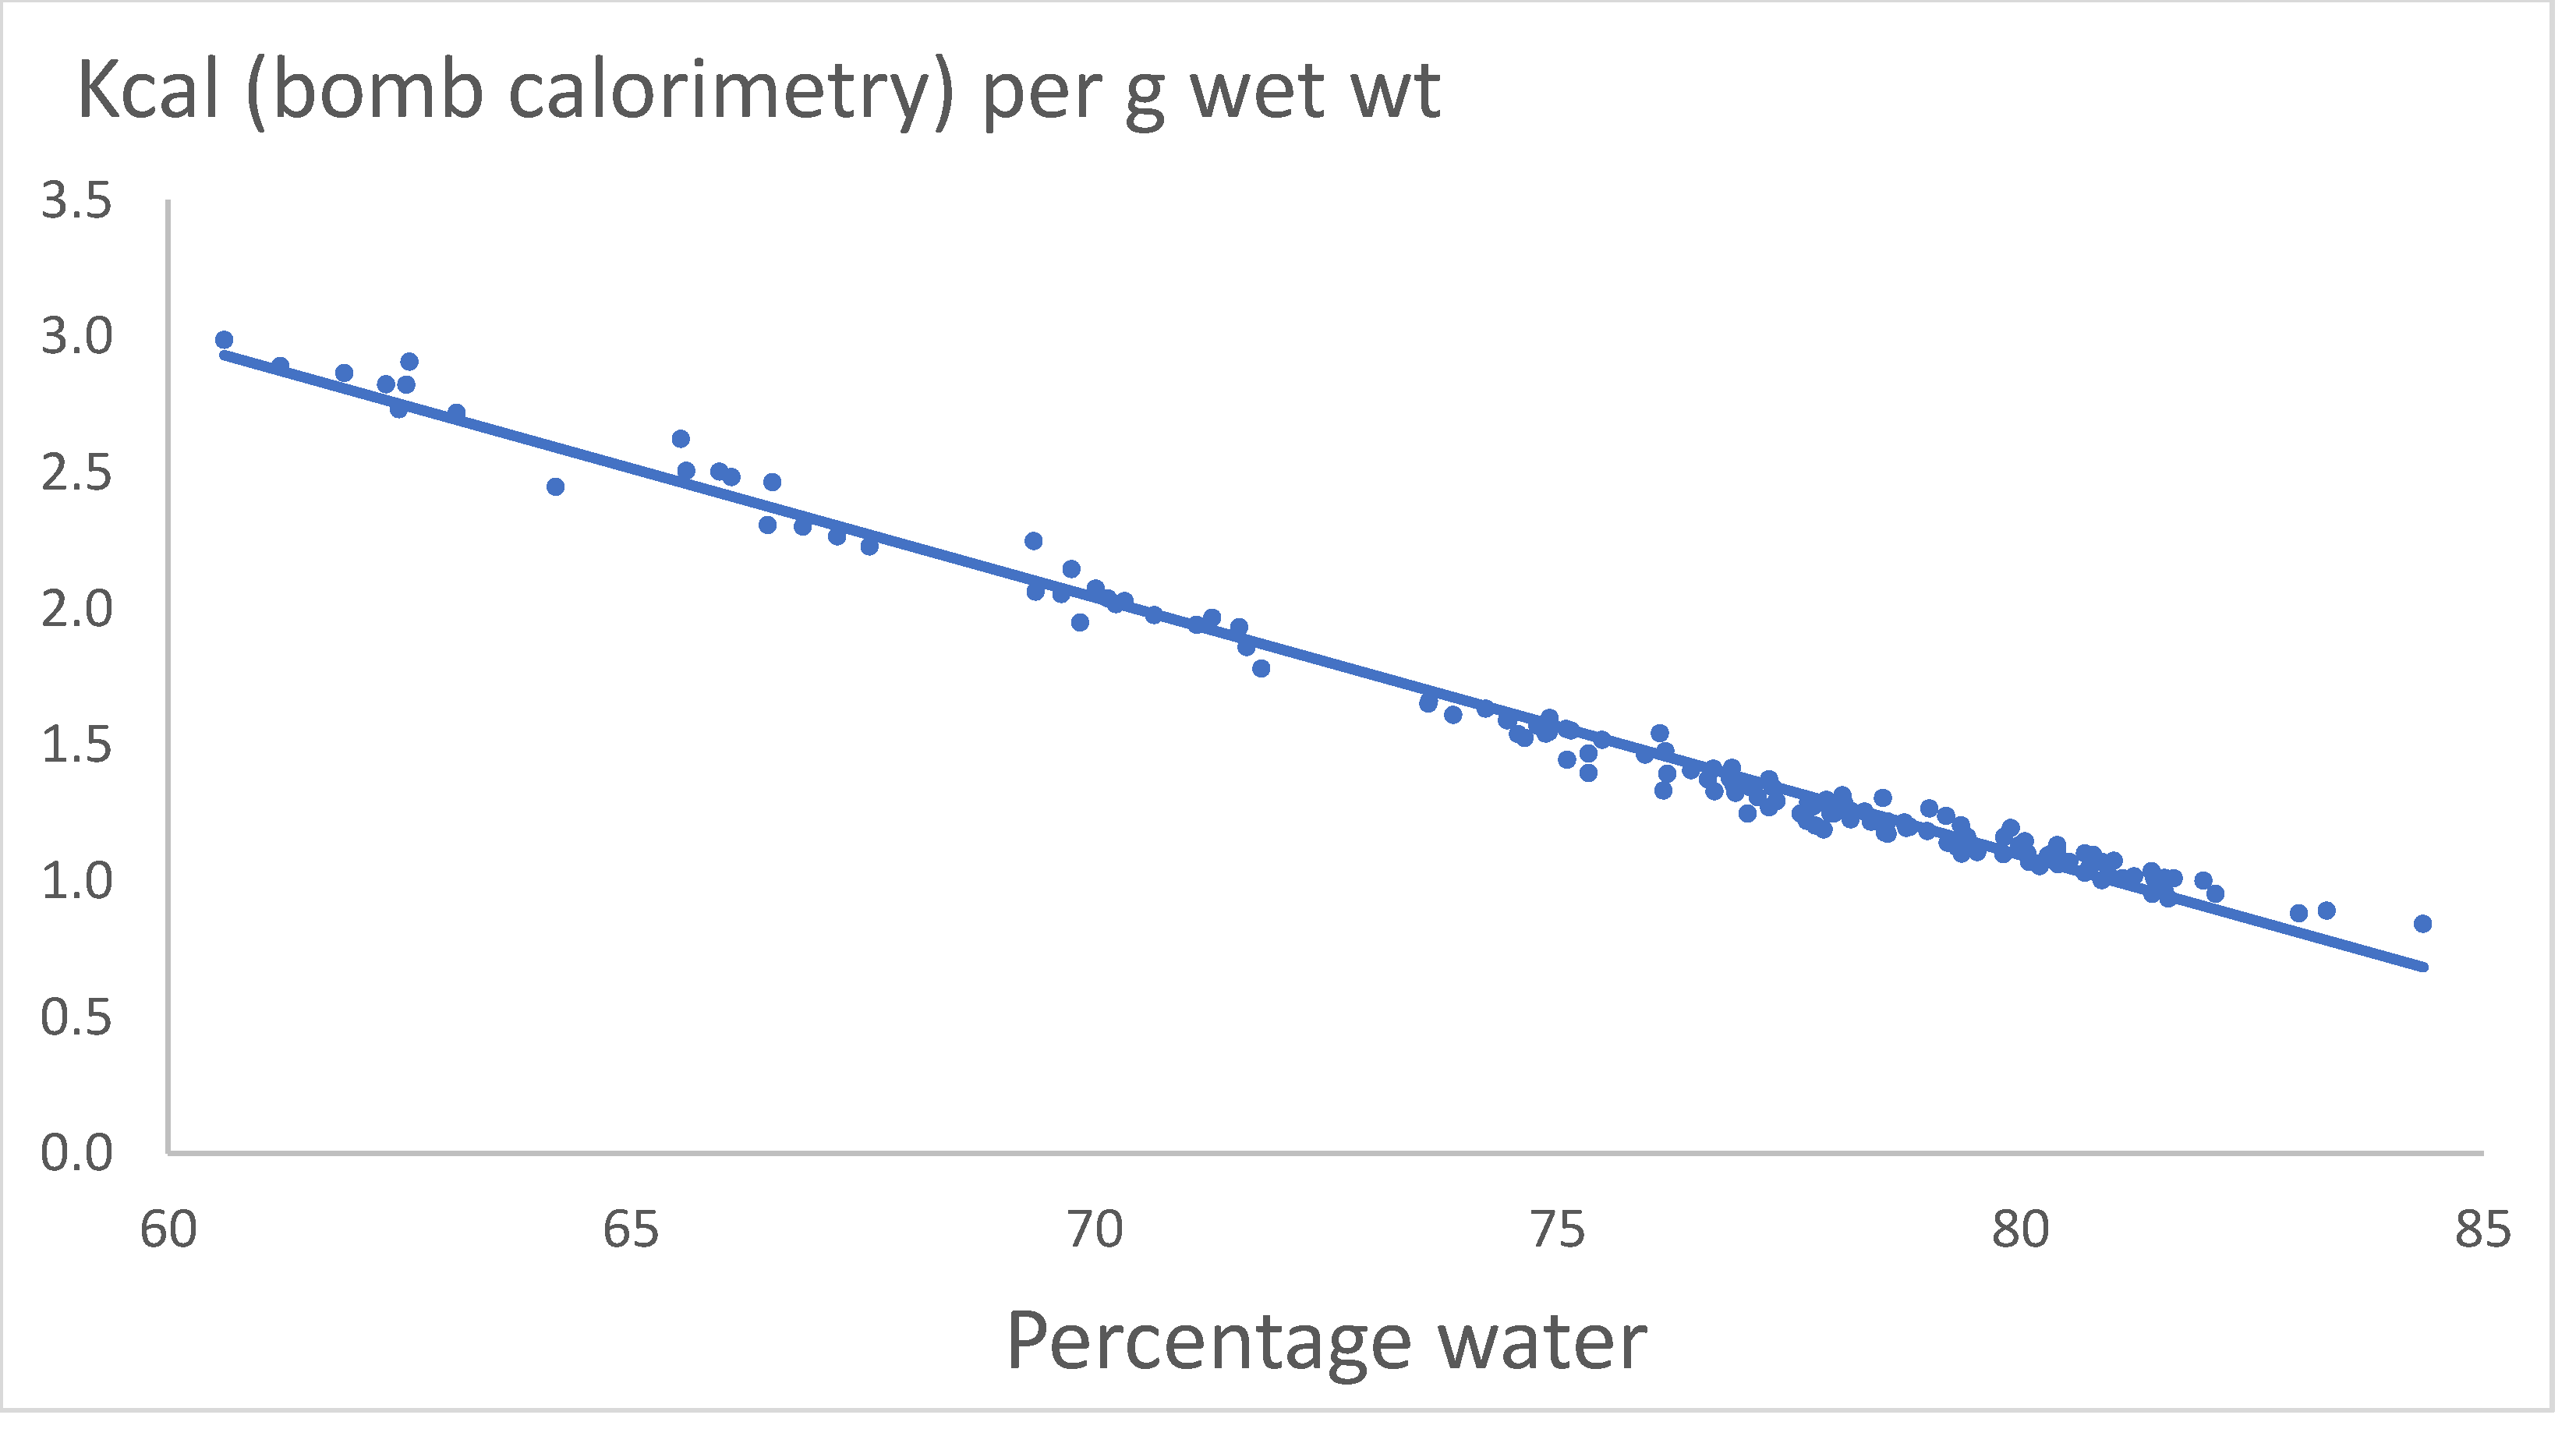
Figure 6.
Kcal (protein + lipid) versus Kcal (bombing).
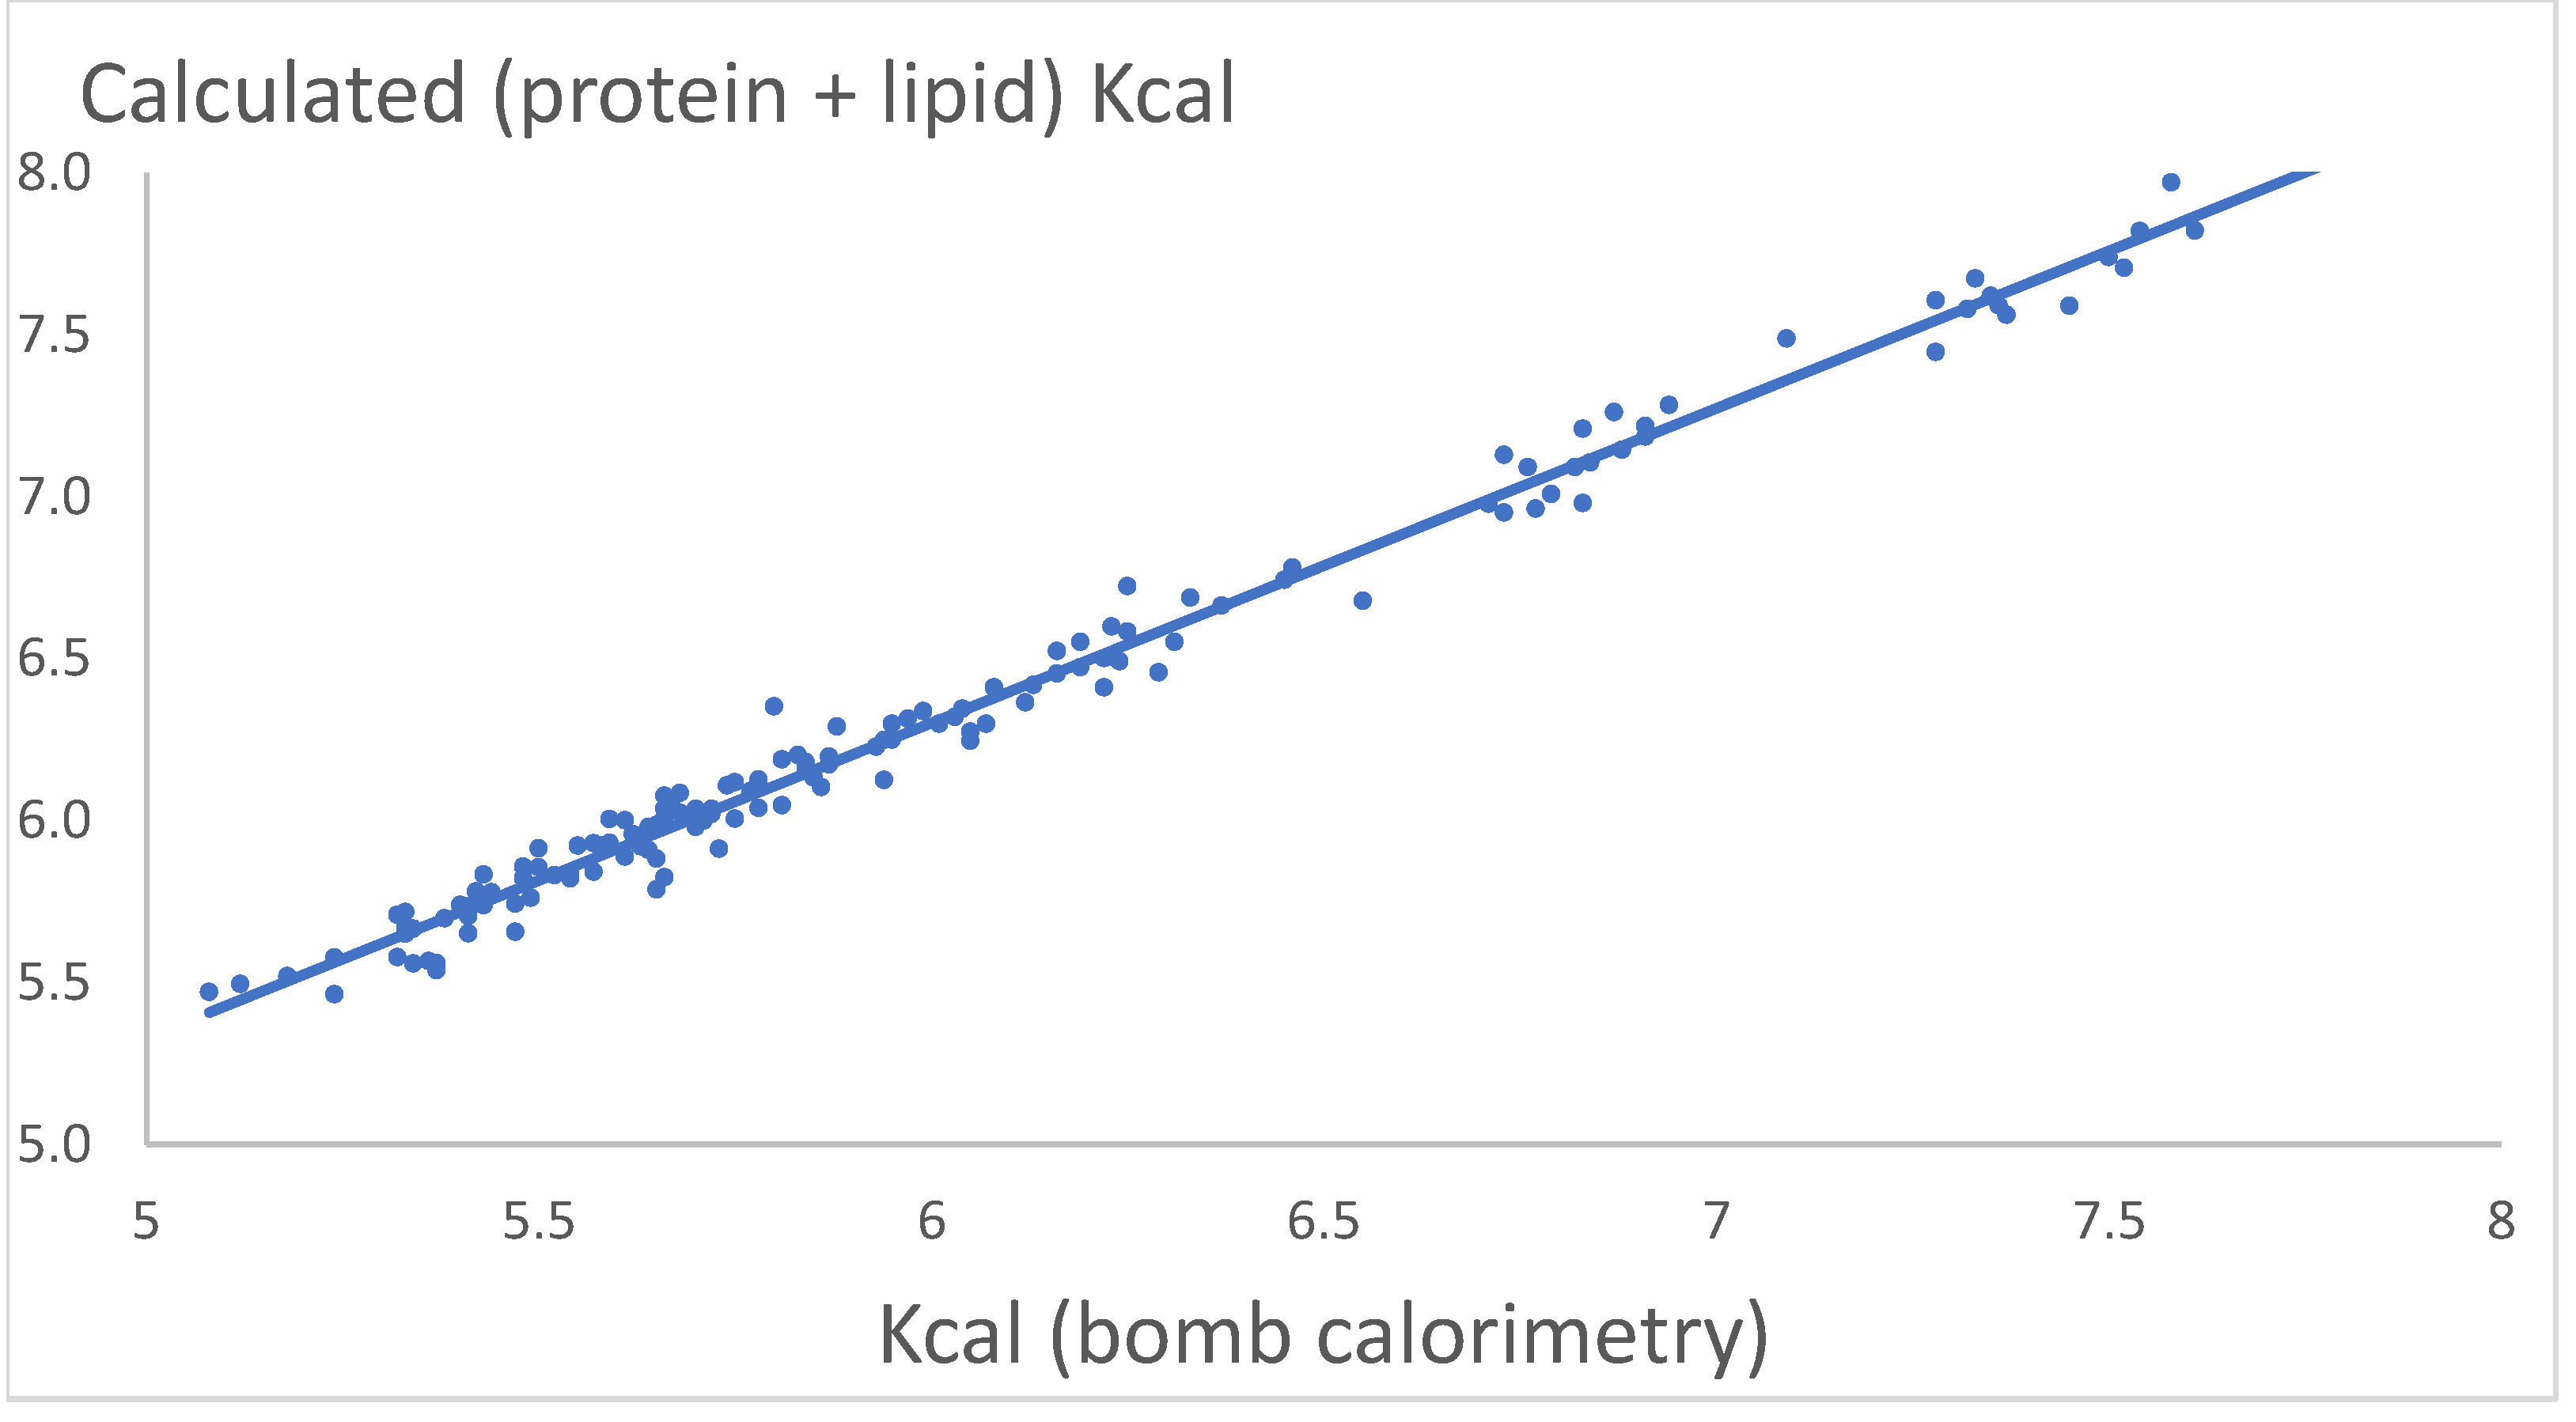
Figure 7.
Kcal and body constituents of protein, lipid and ash compared between yellow eel and rainbow trout.
Figure 7.
Kcal and body constituents of protein, lipid and ash compared between yellow eel and rainbow trout.
Disclaimer/Publisher’s Note: The statements, opinions and data contained in all publications are solely those of the individual author(s) and contributor(s) and not of MDPI and/or the editor(s). MDPI and/or the editor(s) disclaim responsibility for any injury to people or property resulting from any ideas, methods, instructions or products referred to in the content. |
© 2024 by the authors. Licensee MDPI, Basel, Switzerland. This article is an open access article distributed under the terms and conditions of the Creative Commons Attribution (CC BY) license (http://creativecommons.org/licenses/by/4.0/).
Copyright: This open access article is published under a Creative Commons CC BY 4.0 license, which permit the free download, distribution, and reuse, provided that the author and preprint are cited in any reuse.


