Submitted:
10 December 2024
Posted:
11 December 2024
You are already at the latest version
Abstract
Renewable energy technologies, while often labeled as clean or net-zero alterna-tives to fossil fuels, involve substantial use of critical minerals in products like electric vehicles, solar panels, wind turbines, and battery storage systems. This aspect is frequently underappreciated, yet studies indicate it could be a significant area of environmental impact. For instance, research has shown that a typical electric vehicle needs around six times the mineral resources of a conventional vehicle, while an onshore wind turbine requires nine times the mineral input compared to a gas power plant of similar capacity.
This paper seeks to analyze the environmental effects linked to the critical miner-als required by certain renewable energy technologies. The study begins with an estimation of the future megawatt capacities for each type of renewable technolo-gy. Next, it calculates the specific mineral quantities necessary for each model, followed by an assessment of the environmental repercussions tied to their extrac-tion and processing. The results highlight the unique environmental challenges posed by the rising demand for minerals in solar and wind energy systems, taking into account various adoption scenarios.
Keywords:
Clean energy transitions
; Mineral extraction
; Environmental impacts
; Solar pho-tovoltaic (PV)
; Life cycle assessment (LCA)
; Carbon emissions
1. Introduction
Renewable energy technologies have emerged as favored alternatives to traditional fossil fuel-based energy generation, often heralded as clean solutions. In order to meet Paris Agreement's goal of keeping a global average temperature increase below 1.5 degree Celsius, current renewable capacity needs to triple (IEA, 2023). However, massive integration of renewables requires large capital investments and the use of massive quantities of critical elements: copper, lithium, nickel, cobalt, rare earth elements and others. These elements are essential in various renewable technologies, ranging from wind turbines and electricity networks to electric vehicles. However, their availability is often limited and geographically concentrated (IEA, 2021).
Renewable technologies rely on a variety of minerals, with copper and zinc being dominant among them. Additionally, there is a substantial demand for chromium, nickel, and silicon. Notably, the demand for minerals in renewable technologies can far exceed that of fossil fuel-based technologies. Comparatively, a typical electric car requires six times the mineral inputs of a conventional vehicle, while an onshore wind plant demands nine times more mineral resources than a gas-fired plant of the same capacity (IEA, 2021). For instance, this translates to a demand for cobalt that is six to thirty times higher and a demand for rare earth elements that is three to seven times higher, depending on the policy support and stringency. To better understand the demand for these minerals, it is essential to consider the varying market shares of different renewable technology models and forecast their growth. In particular, electric vehicle (EV)-related minerals, such as lithium, are projected to experience the highest demand (IEA, 2021).
The extraction of these materials has led to severe environmental impacts. In addition to the ecological effects, mining activities have led to social conflict and generated carbon emissions not accounted for at the end stage of production. Previous studies have also pointed to the trade-off of climate change impacts vs other environmental impacts entailed in metal-intensive renewable energy production. While deploying these technologies is crucial to limit global warming below 1.5 °C they are likely to exacerbate mining threats to biodiversity (Cabernard & Pfister, 2022). Land use impacts depend on the mining sites. A recent study used satellite image analysis to assess land use change at three copper mines, showing results ranging from below 5 to about 20 hectares of built-up land needed per thousand tonnes of copper ore extracted (Murakami et al., 2020).
1.1. Importance
Numerous studies have examined the overall environmental impacts of solar farms, wind farms, batteries, and storage systems. However, these studies often overlook the specific impacts associated with the minerals used in these installations. This paper aims to comprehensively understand the mineral requirements and potential environmental consequences associated with every new megawatt-hour (MWh) of solar or wind generation, as well as the battery and storage systems. By doing so, it offers a more precise depiction of the minerals needed to meet energy demand and store renewable energy efficiently.
Understanding these environmental impacts is crucial for solar farms, wind farms, battery manufacturers, storage system developers, and other stakeholders. It enables them to incorporate these externalities into their projects and guides environmental management agencies and investors in their decision-making processes. Moreover, this analysis facilitates a straightforward comparison of environmental impacts between different solar and wind models. Such comprehensive analysis is vital for making informed choices while considering both environmental factors and cost analysis.
1.2. Objective
The objective of this master's project is to assess the environmental impacts associated with the extraction and processing of critical minerals used under different scenarios for the deployment of renewable energy technologies.
The central question of this study is: What are the environmental impacts of the extraction of raw materials required for the massive deployment of PV panels and wind turbines? The subsequent research questions include comparing the environmental impacts of different demand scenarios and technologies.
2. Methods
This study focuses on solar PV and wind turbines because these demand more raw materials than other renewable technologies.
In order to obtain the environmental impacts of each mineral required for the projected renewable installations capacity, the method consists of the following three steps:
- Step one is to determine the demand forecast, predicting the required megawatt capacity for each type of renewable energy technology across three different future energy transition scenarios. This allows me to determine the scale of mineral usage in each scenario.
- Step two is to determine the minerals needed for each technology type and calculate the required quantities based on the demand forecast.
- Step three is to collect data on the environmental impacts of each mineral during their mining stage. For the scope of this paper, only the mining stage will be focused on at this time.
Additional data that addresses other processing stages is included in the dataset but is not considered in the final results.
The final results highlight the environmental impacts for specific minerals by the total annual demand of each technology under different deployment scenarios. All the data collected will be summarized in the dataset.
2.1. Wind Models Overview

Table 1.
Source: Referring to Pavel et al. (2017) and Manberger and Stenqvist (2018). (Carrara et al., 2020).
Table 1.
Source: Referring to Pavel et al. (2017) and Manberger and Stenqvist (2018). (Carrara et al., 2020).
| Type of Generator | Type of Turbine | Application |
|---|---|---|
| Direct drive | High-Temperature Superconductors (HTS) | Offshore |
| Direct drive | Electrically Excited Synchronous Generator (EESG) | Onshore |
| Gearbox | Electrically Excited Synchronous Generator (EESG) | Onshore |
| Direct drive | Permanent Magnet Synchronous Generator (PMSG) | Onshore and offshore |
| Gearbox | Permanent Magnet Synchronous Generator (PMSG) | Onshore and offshore |
| Gearbox | Double-Fed Induction Generator (DFIG) | Onshore and offshore |
| Gearbox | Squirrel Cage Induction Generator (SCIG) – Without full converter | Onshore |
| Gearbox | Squirrel Cage Induction Generator (SCIG) – With full converter | Offshore |
| Gearbox | Wound Rotor Induction Generator (WRIG) | Onshore |
Figure 1.
Source: Referring to Manberger and Stenqvist (2018). (Carrara et al., 2020).
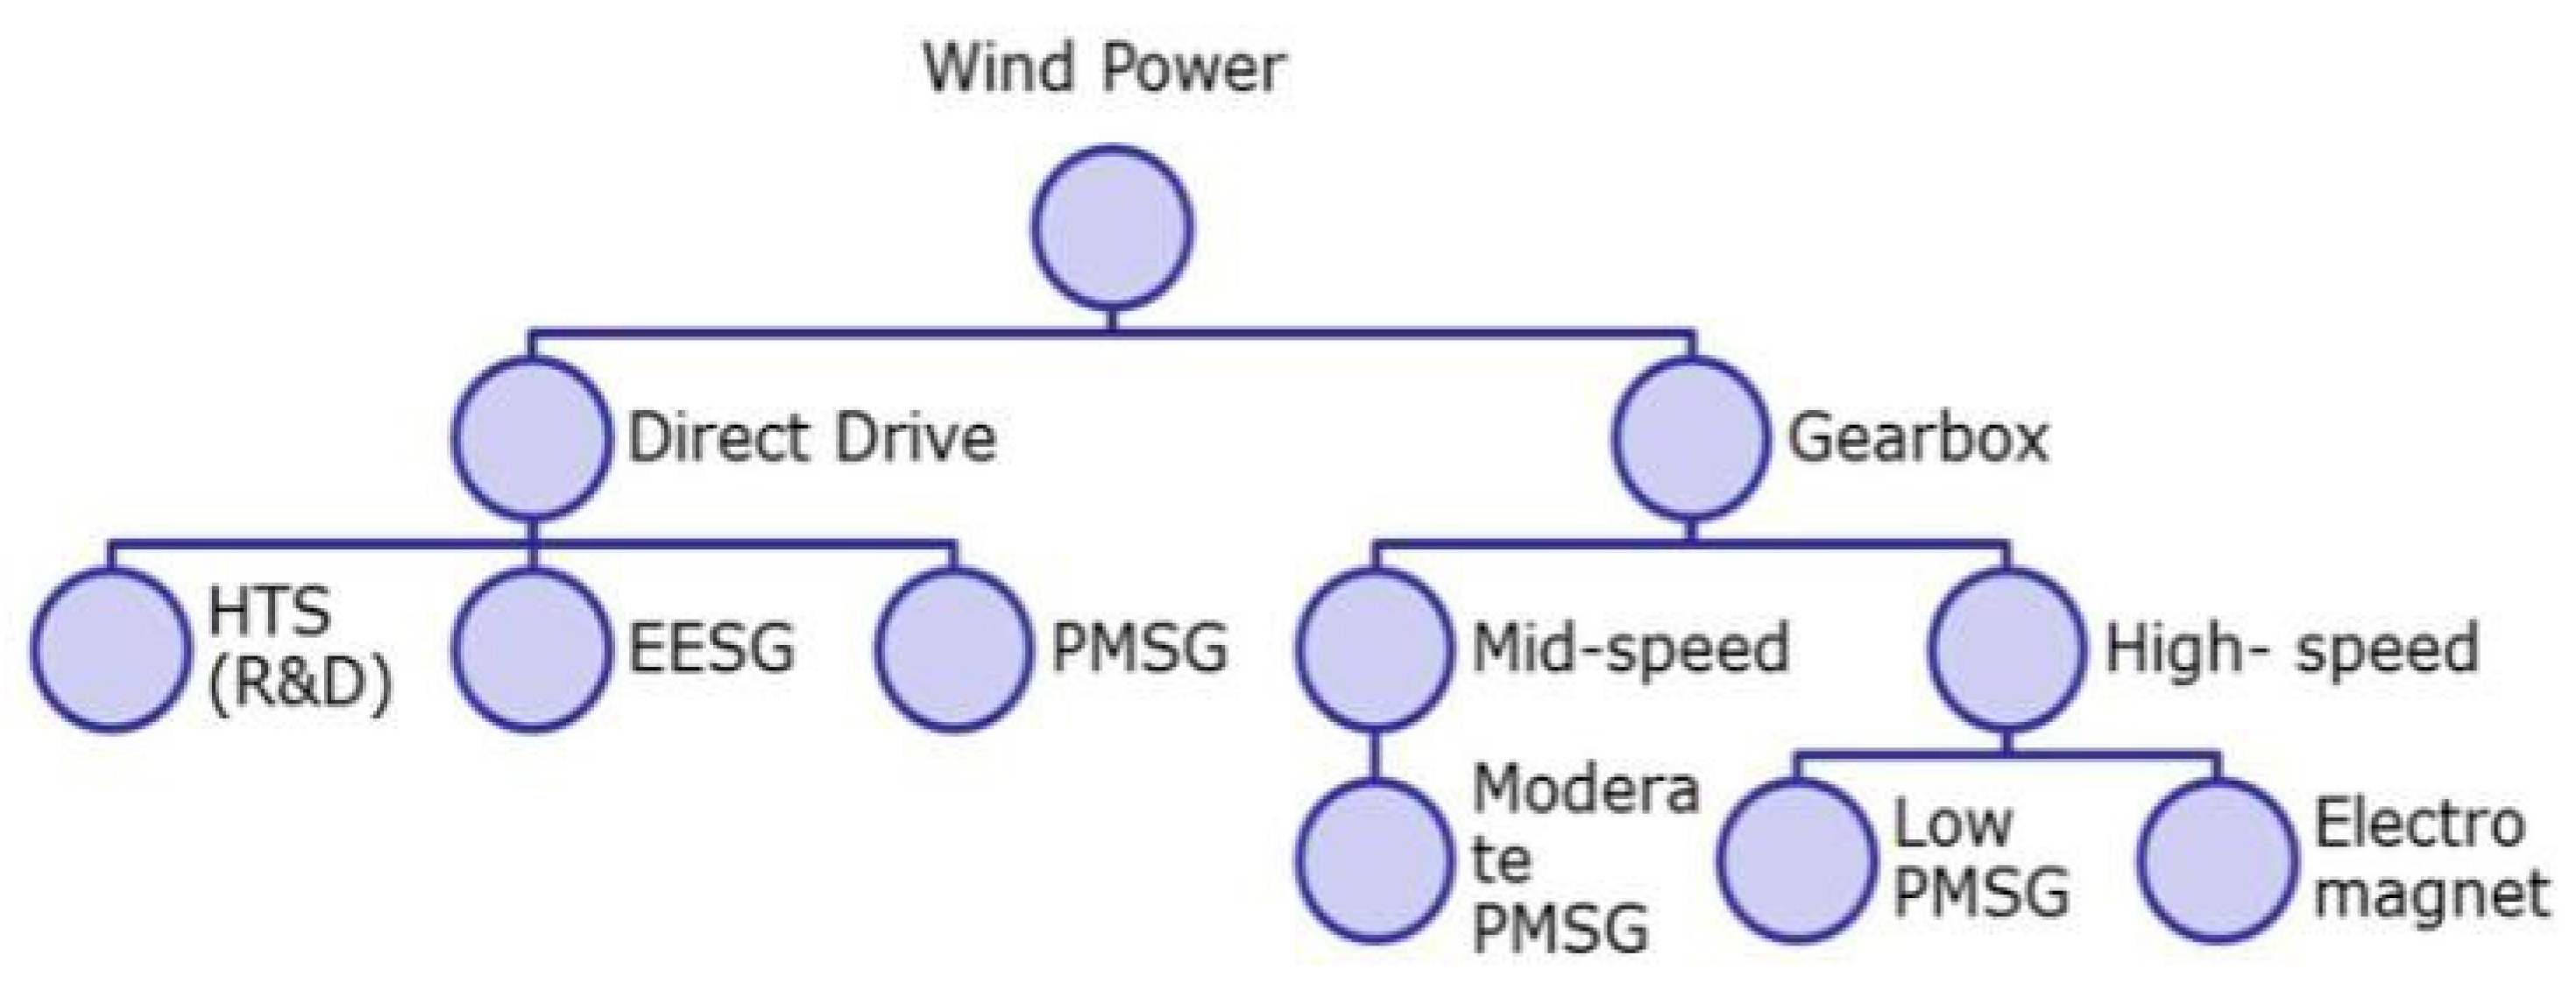
The two main types of wind turbines are direct drive and gearbox. The simplest way to differentiate the two is that the gearbox requires connection to the generator in order to speed up the rotation of blades. On the other hand, the direct drive doesn't require a gearbox to be connected to the generator, therefore, it has fewer moving parts (DOE, 2019).
For gearbox models, the medium-speed (> 80 rpm) configuration requires higher permanent magnets content than the lower-speed drives. The high-speed (>900 rpm) configuration contains electromagnet generators (high-speed induction generators with multistage gearboxes) (Carrara et al., 2020).
By eliminating gearboxes, direct-drive permanent magnets show improvements in weight reduction and have become favorable for offshore applications. The direct-drive turbines manufactured by Siemens and General Electric are based on permanent magnet generators.
Another direct-drive model that does not require permanent magnets is the one used by Enercon, which utilizes an electrically excited generator (Carrara et al., 2020).
Other rising stars include hybrid drives, which combine gearboxes with permanent magnets and grant more reliability than multistage gearbox counterparts (Nassar et al., 2016) (Carrara et al., 2020). High-temperature superconductors (HTS) are based on direct-drive configuration and help decrease weight and save quantities of neodymium and dysprosium demanded (Carrara et al., 2020).
2.2. Solar Models Overview
The most common solar PV panels are:
Wafer-based crystalline silicon (c-Si), either single-crystalline or multi-crystalline silicon (these two are considered together as one type in this study)
- Cadmium telluride (CdTe)
- Copper indium gallium diselenide (CIGS)
- Amorphous silicon (a-Si)
The latter three are commonly referred to as "thin-film technologies", which is much thinner than the 150-200 μm silicon-based wafers PV cells. Other technologies such as multi-junction cells or hybrid devices are upcoming technologies on the horizon that are expected to be introduced for commercial use. However, it is important to note that extensive research is still required before these technologies can be fully implemented. While this study doesn't delve into the specifics it highlights the ongoing advancements in the field (Carrara et al., 2020).
Currently, c-Si panels have the greatest share of the global market (95.4%). Thin-film panels are fairly new, and their popularity is attributed to lower cost and flexible installation. Thin film PV modules typically operate at an efficiency range of 6 to 8 percent, significantly lower than the 16 to 18 percent efficiency achieved by monocrystalline solar cells. Due to this reduced efficiency, the installation of a larger array is necessary with thin film solar technology to generate an equivalent amount of energy obtained from monocrystalline or polycrystalline alternatives. That's why c-Si panels, both single-crystalline and multi-crystalline are still maintaining an absolute advantage in the market (SolarTown).
2.3. General Scenario for Wind and Solar
When setting up the demand scenarios, there are four factors being taken into account:
- Power generation capacities: Future capacities not only depend on the current deployment rate but also depend on the policy agenda. Different carbon reduction goals will alter the requirements for generation capacity.
- Plant lifetime: Fluctuations in capacity, the rate of replacement, and maintenance all affect the quantities of materials needed.
- Sub-technology market shares: Each model has different levels of efficiency and its applicable areas. It is worth noting that all sub-technologies sum up to one, so an increase in one sub-technology must mean a decrease in the other. Costs, efficiency, and mineral intensities are the key differences among different subtypes.
- Material intensities: Generally, material intensities are likely to decrease as technology becomes more mature.
By considering all four factors, this study looks at three different renewable energy demand scenarios: LDS (Low Demand Scenario), MDS (Medium Demand Scenario), and HDS (High Demand Scenario). The description and rationale for each scenario is presented in Table 2, and subsequently, the implications for each technology, solar and wind, are summarised.
For solar and wind, the scenario forecasts are in line with the demand forecast calculated in the Carara's studies (Carrara et al., 2020).
At global level, the first two scenarios are selected from the Energy Technology Perspectives (ETP) 2017 report published by the lEA (lEA, 2017). The third is the most aggressive, which is selected from an exercise developed by the Institute for Sustainable Futures of the University of Technology Sydney (Teske, 2019). The details of the three scenarios are as follows:
LDS - lEA ETP Reference Technology Scenario. The demand for future renewables under this scenario aligns with commitments made by countries under the Paris Agreement to limit GHG emissions and enhance energy efficiency. The scenario aims for a maximum global temperature rise of 2.7 °C in the future.
MDS - lEA ETP Beyond 2 Degrees Scenario. This is in line with a 50% probability of constraining average temperature increases to 1.75 °C by 2100. This scenario also anticipates net zero emissions from the energy sector around 2060.
HDS - Institute for Sustainable Futures 1.5 °C 2019 Scenario. This scenario outlines a mitigation pathway targeting a long-term temperature increase within 1.5 °C, with 100% renewable primary energy by 2050.
To summarize, the low-demand scenario pursues a climate target of 2.7 degree Celsius, slightly better than business as usual, given by current technologies and policy support. Medium demand pursues a climate target of 1.75 degree Celsius. High demand pursues a climate target of 1.5 degree Celsius, with 100% renewable primary energy by 2050.
2.4. Wind Demand Scenarios
There are two main trends that must be considered when determining the sub-technology market shares for wind. There is a continued use of permanent magnet technologies since permanent magnets (notably direct-drive) are well suited to offshore environments due to their reduction in weight and better performance despite their costs and high mineral intensity (World Bank, 2017). Thus, DD-PMSG and GB-PMSG are likely to see rises in their market shares. Due to recent Chinese export restrictions, the manufacturing industry is trying to rely less on rare earths.
Single-stage gearbox with a smaller permanent magnet and HTS generators will be favored (Netherlands, Organization for Applied Scientific Research (TNO), 2018).
LDS – The results are derived from time series data, with a prediction of increasing HTS generators in the offshore market.
MDS –The results are derived from time series data. During the data analysis process, the trends have been adjusted to reflect increased adoption of generators with permanent magnets, particularly direct drive. The adoption rate is adjusted to a higher level in offshore market compared to onshore market.
HDS –Regarding the onshore market, the results are derived from time series data.
During the data analysis process, the trends have been adjusted to reflect increased adoption of generators with permanent magnets, particularly direct drive. Regarding the offshore market, the forecasted demand for various sub-technologies is assumed to closely resemble current global average numbers.
Generally, the amount of minerals required increases with the size of the turbines. This trend is most obvious for steel, aluminum, and polymer materials requirements. For example, the total amount of steel required increases from 200 to 620 t by increasing the rotor size from 90 to 150 meters, which is summarized as an increase around 200% (Vestas 2014b, 2018b). Aluminum and polymer materials can also increase around 150% and 250%, respectively. Estimates for rare- earth elements, chromium, nickel, manganese, and molybdenum, are obtained based om published information, which has been summarized by Carrara's paper (Carrara et al., 2020).
2.5. Solar-PV Demand Scenarios
Because of the current technology advantages that c-Si panels have, they will likely have the same market shares for all LDS, MDS, and HDS scenarios. Thin-film technologies have much higher mineral requirements, so they are expected to show higher demand only in HDS (Carrara et al., 2020).
LDS -- By 2050, c-Si will dominate the market, accounting for approximately 99%.
MDS -- Assuming current aggregate levels and market share compositions for thin-film technologies, we project a linear increase in the share of thin-film technologies in the MDS scenario, until it reaches 10% by 2025.
HDS -- The HDS scenario experiences substantial growth in thin-film technologies, with CdTe and CIGS panels each reaching a 10% share, a-Si growing to 3%, and the remaining 77% allocated to c-Si.
Structural materials are used across all the PV models. These materials include concrete, steel, plastic, glass, aluminum, and copper. No major innovations are underway for these materials, therefore the material intensity in 2050 is set at 80%, 90%, and 100% of the current values in the LDS, MDS, and HDS (Carrara et al., 2020). The quantity demanded for silicon used in c-Si technology will be significantly reduced. It has now reached 4 t/MW, compared to 16 t/MW in 2004 (Carrara et al., 2020). The prediction for silicon usage is drawn based on this ongoing trend. All other materials that are specific to each model all show decreasing quantity demanded in the HDS, thanks to production process advancement.
2.6. Estimates of Annual Global Demand
The annual global demand for minerals used in solar and wind technologies is calculated by the annual global demand from the base year 2018, multiplied by the forecast factors. Each of the minerals has their own forecast factors, which is provided by the Joint Research Centre. The forecast factor is also adjusted differently across the three scenarios in the years 2030 and 2050. The final environmental impact is calculated by multiplying the annual global demand by the impact per unit of minerals. The environmental impacts include CO2eq emissions, freshwater eutrophication, freshwater ecotoxicity, water use, and acidification potential. For all five categories, the numbers are flat throughout all scenarios and for both solar and wind.
3. Results
3.1. Solar
Based on the forecast factors provided in Carara et al.'s 2020 paper, it is clear that that steel and concrete exhibit the highest demand within the structural materials category. In terms of technology-specific materials, silicon and silver demonstrate the greatest demand.
Figure 2.
This graph shows the forecast annual demand for solar structural materials globally. Steel and concrete have the highest demand.
Figure 2.
This graph shows the forecast annual demand for solar structural materials globally. Steel and concrete have the highest demand.
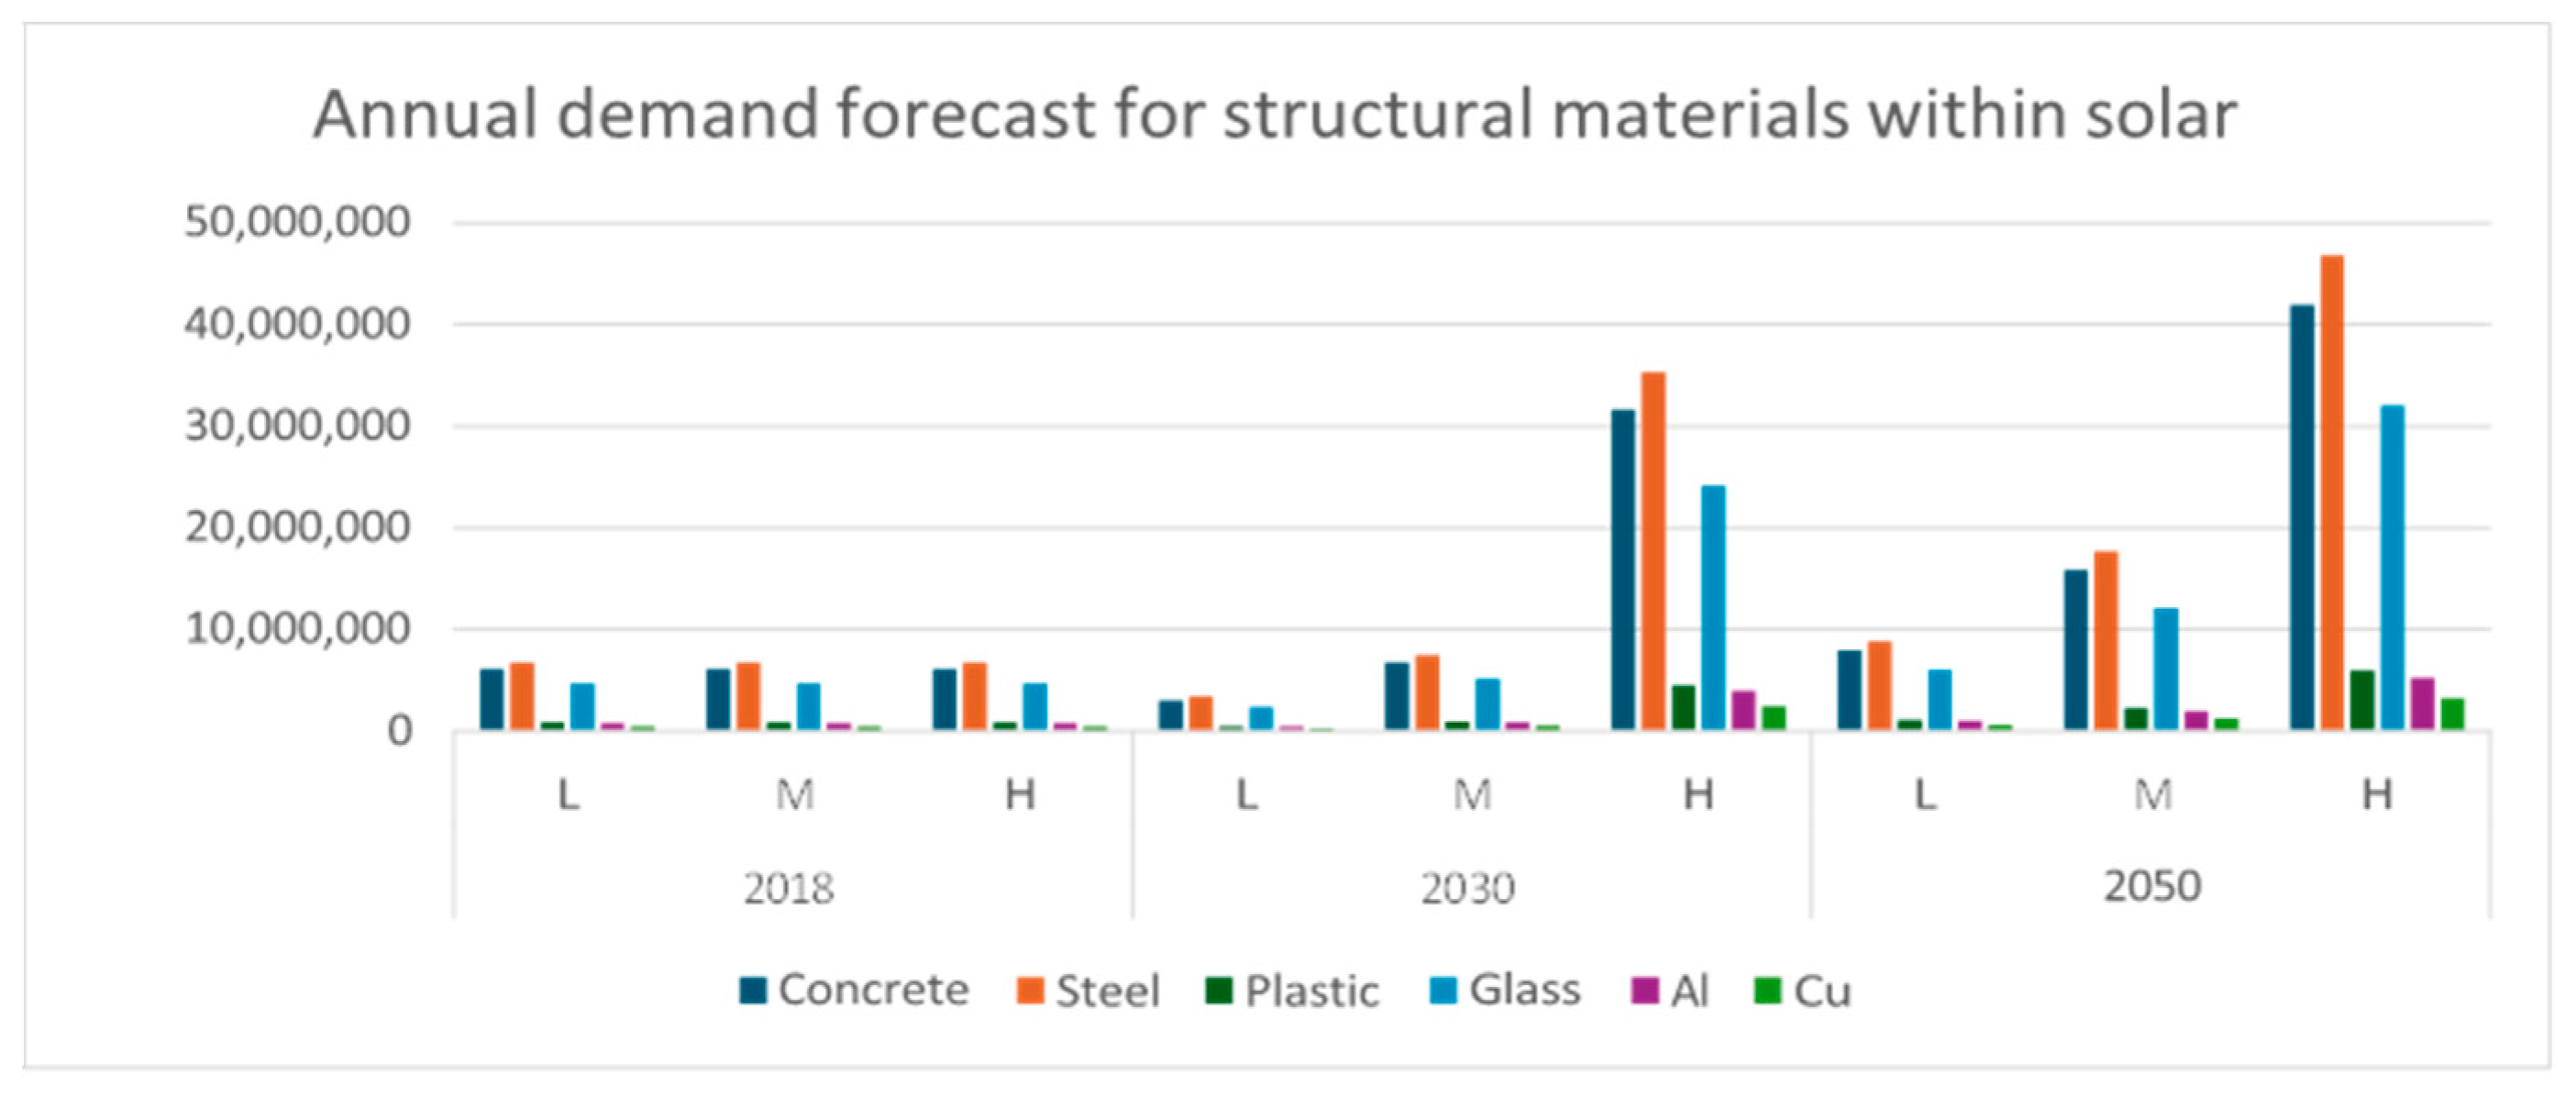
Figure 3.
This graph shows the forecast annual demand for solar technology-specific materials globally. The chart does not include silicon due to its significantly higher value compared to the other minerals. Including silicon would disproportionately dominate the chart, making it difficult to visualize and discern the values of the other minerals. Silicon and silver have the highest demand.

3.2. Wind
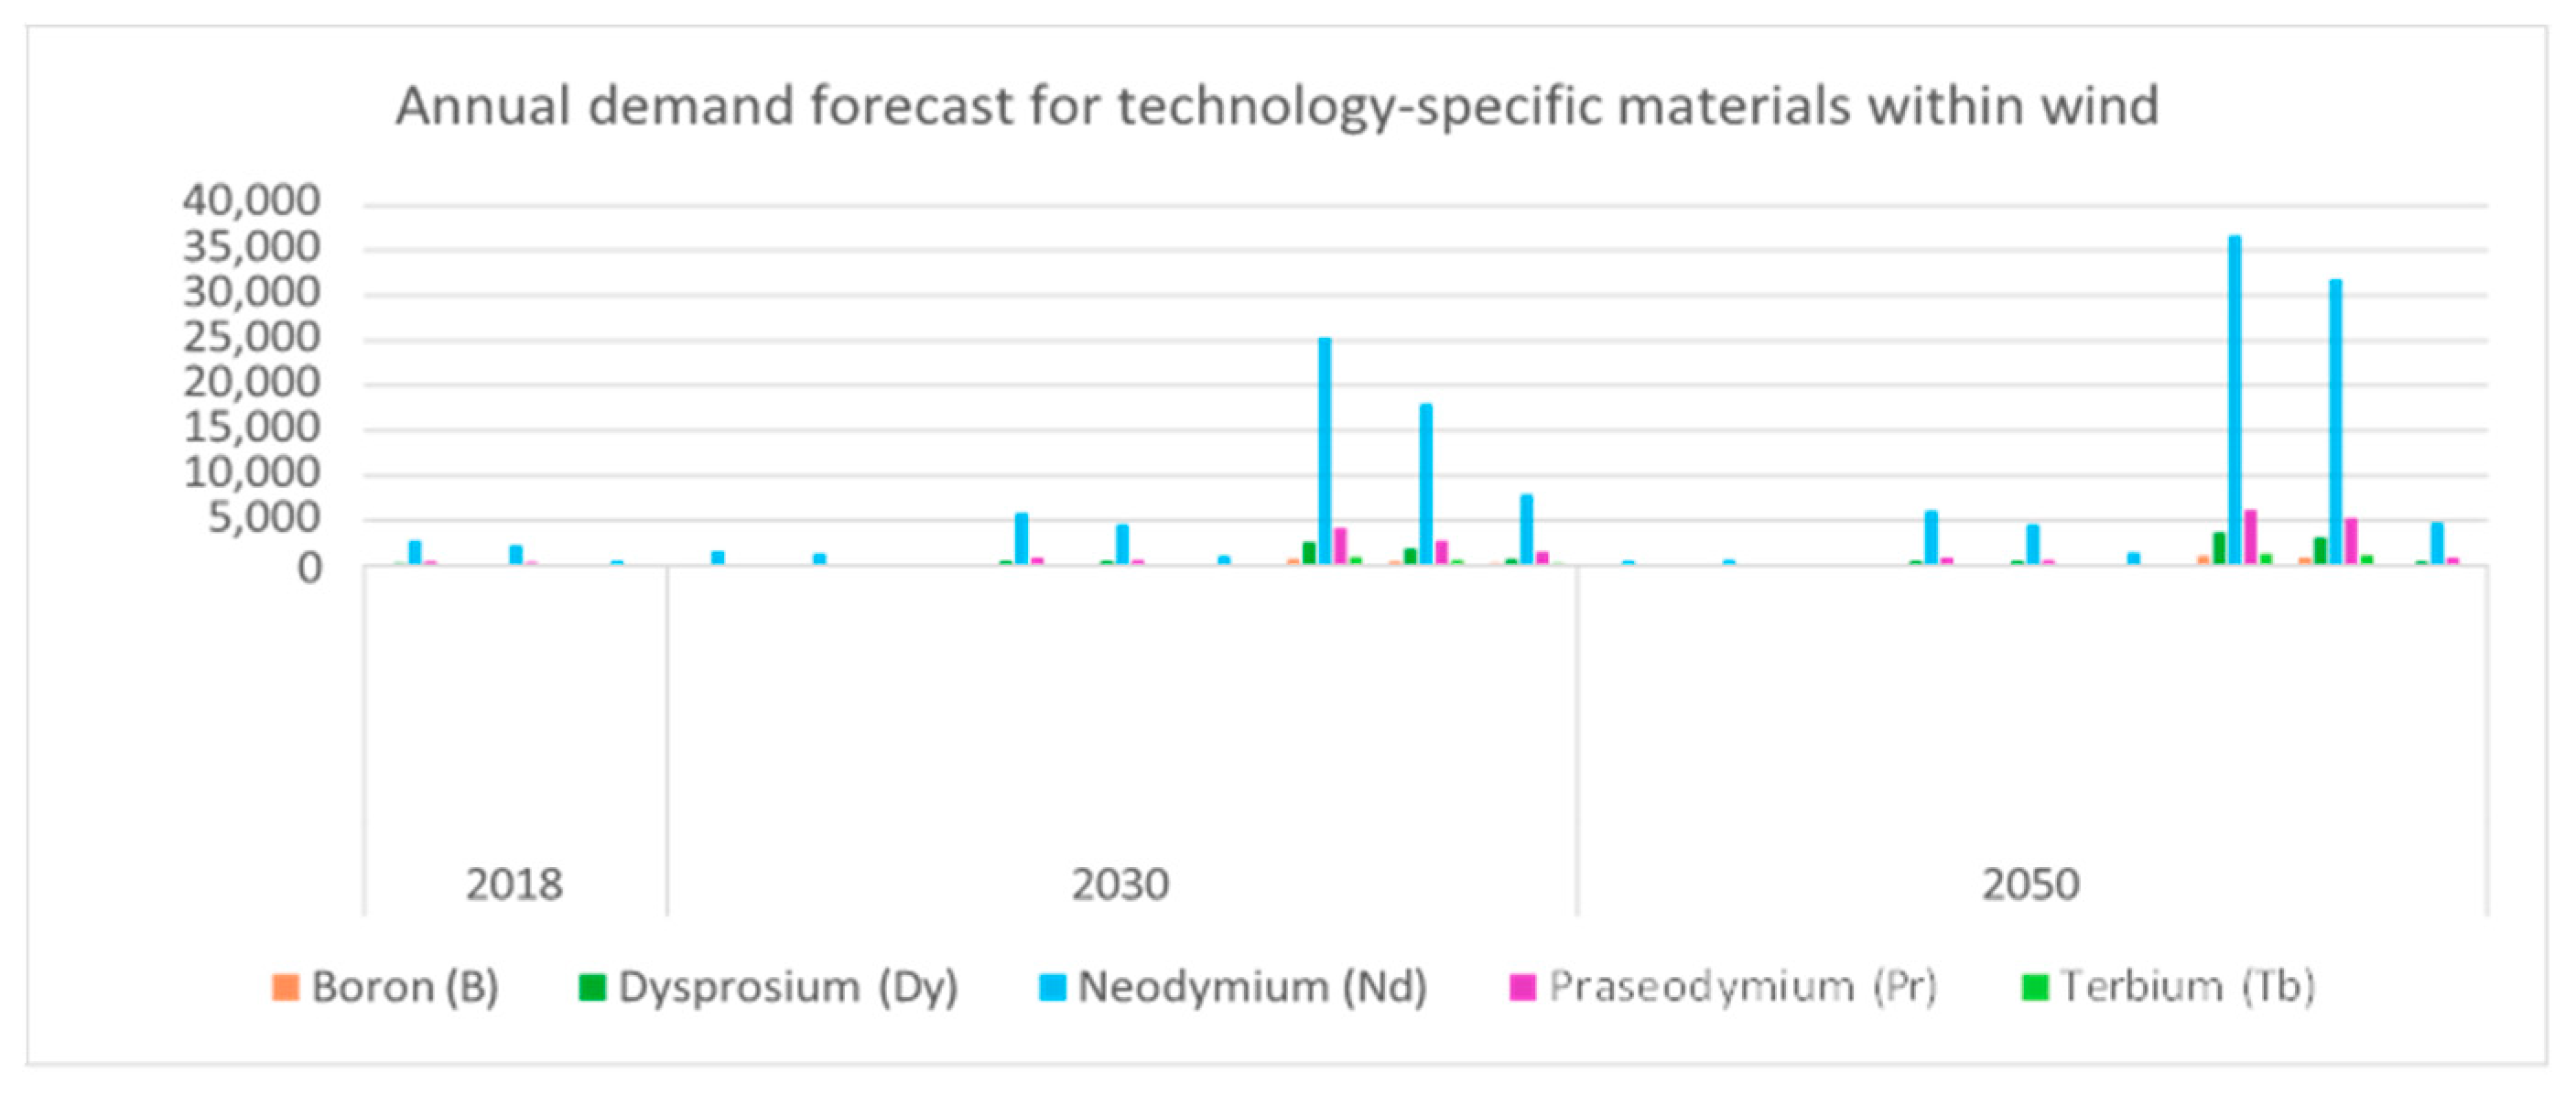
The graph provides a clear representation of the anticipated annual demand for wind structural materials on a global scale. It clearly indicates that concrete and steel are expected to have the highest demand in this category. Furthermore, when focusing on wind technology-specific materials, the graph unmistakably highlights neodymium and praseodymium as the materials with the highest projected demand.
Figure 4.
This graph shows the forecast annual demand for wind structural materials globally. Concrete and steel have the highest demand.
Figure 4.
This graph shows the forecast annual demand for wind structural materials globally. Concrete and steel have the highest demand.
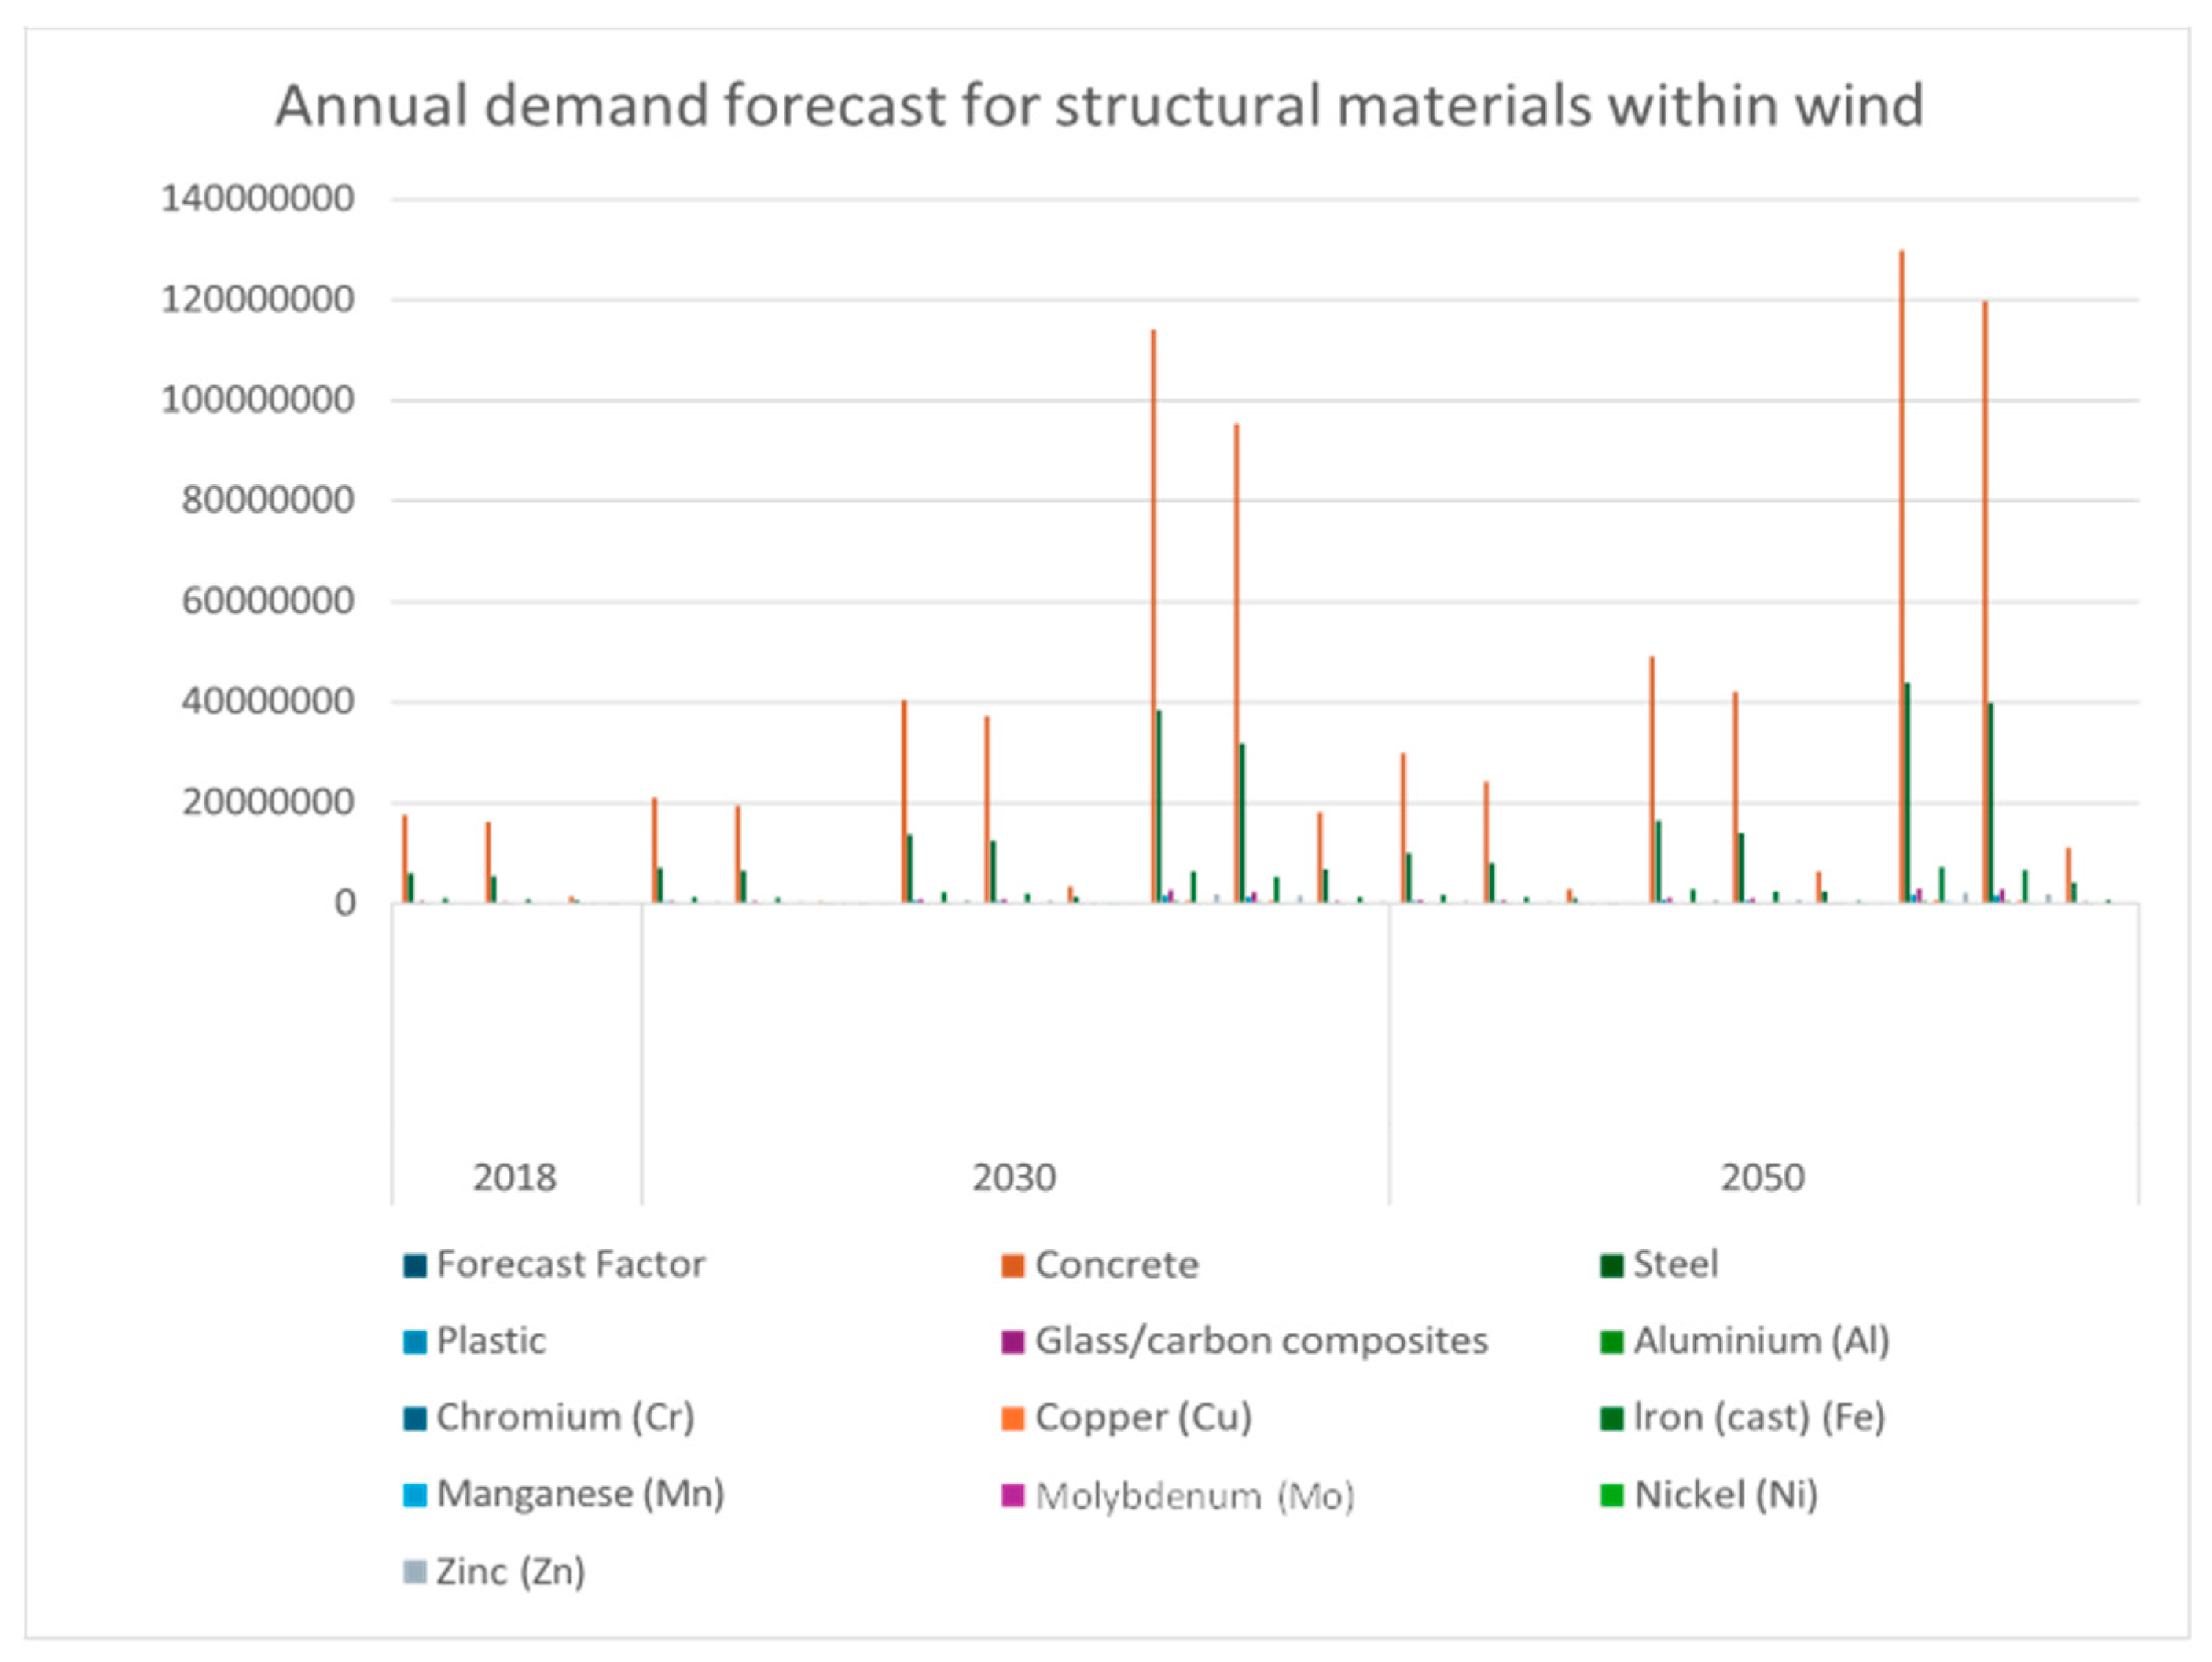
Figure 5.
This graph shows the forecast annual demand for wind technology-specific materials globally. Neodymium and Praseodymium have the highest demand.
Figure 5.
This graph shows the forecast annual demand for wind technology-specific materials globally. Neodymium and Praseodymium have the highest demand.
3.3. Environmental Impacts
Table 3 presents the CO2eq emissions from mining stage for minerals with consistent data available. Both Table 3 and Table 4 data are collected from various life-cycle assessment studies. For consistency, only mining-stage impacts are included.
Among the minerals for which CO2 emission data is available, aluminum and copper are the only ones that have available data and are present in the solar technology demand forecast at the same time. From Figure 6, aluminum has higher total annual CO2 emission than copper. When comparing CO2 emissions data for minerals extracted from different geographies, copper is chosen based on the available data. From Figure 7, I conclude that copper extracted from South Africa and USA has the highest total annual emissions. Figure 8, Figure 9, Figure 10 and Figure 11 present the associated environmental impacts (freshwater eutrophication, freshwater ecotoxicity, water use and acidification potential) for solar.
A total of five different minerals are compared in Figure 12. These minerals are chosen because they are the only ones have available data and are present in the wind technology demand forecasted. From highest to lowest, the total annual CO2 emissions are highest for zinc, copper, and aluminum. When comparing CO2 emissions data for minerals extracted from different geographies, copper is chosen based on the available data. From Figure 13, it becomes evident that copper extracted from South Africa and USA has the highest total annual emissions.
4. Discussion
The results show that concrete and steel will be the materials most highly used for the deployment of solar and wind energy, across all the demand scenarios analyzed. When only considering critical minerals given the data available, aluminum and copper have the highest total CO2eq emissions based on future demand for solar. Silicon has the highest quantity demand in terms of technology-specific materials for solar. However, because no direct silicon related mining emissions data can be found, it is not possible to offer a conclusive result on its CO2 emissions compared to CO2 emissions from aluminum and copper.
For wind turbines, zinc, copper, and aluminum will be responsible for the highest total CO2 emissions during the mining stage.
However, it is worth noting that when comparing the per unit CO2 emission (tCO2eq per metric ton of materials), the ranking of emission changes. Neodymium has the highest CO2 emissions per tons(13.2 tCO2eq per metric ton of Neodymium oxide), which is about 11 times more compared to emissions from zinc (1.18 t CO2eq per metric ton of zinc), 4 times more compared to copper global average (3.2 t CO2eq per metric ton of copper), and 3 times more compared to CO2 emissions from aluminum (4.9 t CO2eq per metric ton of aluminum) (see Table 3).
While shifting from low demand to high demand scenarios in both year 2030 and 2050, CO2 emissions increase 4 to 5 times across all minerals.
As the climate target becomes more ambitious, the increased demand for minerals leads to a significant rise in emissions. The total emissions are driven by the higher quantity demand for minerals, rather than being solely influenced by the flat rate of CO2eq emissions.
While conducting a comparative analysis between aluminum and copper demand in solar and wind technologies (Figure 18, Figure 19 and Figure 20), several noteworthy observations have emerged. First of all, it is evident that the quantities of aluminum and copper required for solar substantially exceed those for wind in the baseline year of 2018. Upon applying the forecast factor, the discrepancy in required quantities between solar and wind becomes even more pronounced.
Furthermore, when examining the scenarios within each target year, a distinct surge in demand is observed when transitioning from the Low Demand Scenario (LDS) to the High Demand Scenario (HDS). Overall, the rate of increase in aluminum demand exceeds that of copper.
Importantly, as both the annual demand forecasts and CO2 equivalent emissions experience concurrent changes (assuming a consistent flat rate of CO2 emissions across all scenarios), it follows that CO2 equivalent emissions will exhibit a more rapid escalation for aluminum due to its higher quantities demanded.
In terms of freshwater eutrophication, aluminum exhibits the higher impacts (only similar to copper given the data available). This is especially pronounced when production from China is included, due to the high values estimated for this country. This indicates a heightened risk of eutrophication associated with Chinese aluminum mining activities. Additionally, aluminum also demonstrates the highest acidity potential based on global averages, excluding China. However, silver has higher acidification potential per unit than aluminum, which is 6.79 kg SO2-equiv / kg silver from couple production of gold-silver and 3.98 kg SO2-equiv / kg silver from other combined metal production respectively.
The trend reverses for wind. In terms of freshwater eutrophication, copper has the highest values, with aluminum ranking on the second. This is because wind has a higher demand of copper than aluminum.
Meanwhile, copper stands out for its extensive water consumption and freshwater ecotoxicity in both solar and wind, making it a significant contributor to environmental impacts in these categories. Copper facilities alone withdrew over 1.3 billion cubic meters of water in 2006, reflecting the substantial water usage in copper mining operations. Additionally, the processing methods employed in copper production contribute to freshwater ecotoxicity concerns, highlighting the environmental challenges associated with this industry sector. It is important to note that copper has the highest total annual ecotoxicity after considering the demand forecast, but freshwater ecotoxicity for silver used in solar and nickel used in wind is much higher. The freshwater ecotoxicity per unit CTUeco/kg for copper is 9.25, nickel 17.52, 330.61 for silver from gold-silver couple production and 54.03 for silver from combined metal production.
4.1. Implications
The findings of this study carry important implications for various stakeholders. For policy makers, it is crucial to strengthen regulatory frameworks and standards to encourage sustainable practices within the mineral extraction and processing industry. And it is especially important to consider how to incorporate these externalities when considering the environmental benefits of the energy transition. To control greenhouse gas emissions, it is important to implement carbon pricing mechanisms that incentivize emission reductions and promote the use of renewable energy sources for mineral operations. It is also important to enforce stricter environmental regulations that limit other air emissions and discharges to soil and water. For public utilities, accelerating investments in renewable energy infrastructure and modernizing grids are essential to meet the increased energy demand associated with mineral extraction. It is also important to explore energy storage solutions to support the transition to cleaner energy sources and enhance grid stability. Utility companies should invest in cleaner production processes and energy-efficient technologies to minimize emissions throughout the mineral supply chain. Optimizing supply chain operations and enhancing transparency in reporting emissions data will further contribute to promoting sustainability in the industry.
4.2. Uncertainties
4.2.1. Analyzing Scenarios, Forecast Factors, Market Share, and Technological Mineral Intensities
The scenarios selected for analysis were derived from existing literature. Although the forecast factor was determined based on the market share of sub-technologies within solar and wind, it is important to note that market projections are subject to change. The choice of scenarios and the required installed capacity are likely to be directly influenced by policy stringency, while the market share of sub-technologies is contingent upon prevailing market conditions.
In addition, this examination encompasses changes in mineral intensities themselves, as well as the emergence of technologies that rely less on critical minerals. In both cases, it is possible to observe externalities arising from increased demand or, conversely, a reduction in externalities due to technological advancements and improvements.
4.2.2. Environmental Factors: Consistency Limitations, Limited Data, LCA Variations, and Global Scope
The environmental factors incorporated in this research are based on the most reliable and consistent data that is publicly available. It is important to note that the overall scope of the study and the data collection process extend beyond what was ultimately included in the calculations. During the data collection phase, it became apparent that there is a lack of robust data regarding the environmental impacts of many minerals. For instance, in the case of minerals like silicon and manganese, their impacts were estimated based on their alloy forms (e.g., Ferrosilicon, ferromanganese). Without further investigation, it becomes challenging to determine the precise environmental figures for silicon and manganese as individual entities.
Additionally, obtaining formal data for mining sources, particularly those located in developing countries, proves to be a significant challenge. Furthermore, the application of various life cycle assessment (LCA) methodologies can result in variations in the final impact estimations. Given these factors, this paper specifically focuses on the mining stage to ensure consistency, while other processing stages like refining are not considered.
5. Conclusions
This study has revealed the critical role that mineral extraction plays in the deployment of renewable energy technologies, shedding light on both the environmental impacts and material demands associated with these technologies. Through detailed analysis of solar PV and wind energy systems across various future demand scenarios, it becomes evident that the transition to renewable energy, while essential for mitigating climate change, is not without its challenges.
Key findings highlight that structural materials such as concrete and steel dominate the demand landscape, while critical minerals like aluminum, copper, and rare earth elements present significant environmental concerns. The data underscores that the high quantities of these materials required, particularly in high-demand scenarios, lead to substantial increases in CO2 emissions, freshwater eutrophication, and ecotoxicity. Moreover, the geographical origins of mineral extraction significantly influence these impacts, with locations such as South Africa and the USA demonstrating higher emissions rates for certain materials.
This analysis emphasizes the importance of addressing the environmental trade-offs inherent in the renewable energy supply chain. Policymakers, industry stakeholders, and environmental agencies must collaborate to promote sustainable mining practices, implement robust environmental regulations, and encourage technological innovation that reduces mineral dependency. Such measures are vital to ensure that the environmental costs of renewable energy technologies do not overshadow their benefits in combating climate change.
Ultimately, while renewable energy is a cornerstone of global decarbonization efforts, a holistic approach that accounts for the full life cycle of these technologies is crucial. Future research should extend beyond the mining stage to include processing and recycling phases, fostering a more comprehensive understanding of the environmental footprint and enabling more sustainable energy transitions.
References
- Carrara, S. , Alves Dias, P., Pavel, C. and Bertoldi, P. (2020) Raw Materials Demand for Wind and Solar PV Technologies in the Transition towards a Decarbonised Energy System. European Commission Joint Research Centre (JRC). [CrossRef]
- International Energy Agency (IEA) (2021) The Role of Critical Minerals in Clean Energy Transitions. IEA, Paris. Licence: CC BY 4.0. https://www.iea.org/reports/the-role-of-critical-minerals-in-clean-energy-transitions.
- International Energy Agency (IEA) (2023) Tripling Renewable Power Capacity by 2030 Is Vital to Keep the 1.5°C Goal within Reach. IEA, Paris. Licence: CC BY 4.0. https://www.iea.org/commentaries/tripling-renewable-power-capacity-by-2030-is-vital-to-keep-the-150c-goal-within-reach.
- International Energy Agency (IEA) (2017) Energy Technology Perspectives 2017. IEA, Paris. Licence: CC BY 4.0. https://www.iea.org/reports/energy-technology-perspectives-2017.
- Cabernard, L.; Pfister, S. Hotspots of Mining-Related Biodiversity Loss in Global Supply Chains and the Potential for Reduction through Renewable Electricity. Environ. Sci. Technol. 2022, 56, 16357–16368. [Google Scholar] [CrossRef] [PubMed]
- Murakami, S.; Takasu, T.; Islam, K.; Yamasue, E.; Adachi, T. Ecological footprint and total material requirement as environmental indicators of mining activities: Case studies of copper mines. Environ. Sustain. Indic. 2020, 8, 100082. [Google Scholar] [CrossRef]
- Månberger, A.; Stenqvist, B. Global metal flows in the renewable energy transition: Exploring the effects of substitutes, technological mix and development. Energy Policy 2018, 119, 226–241. [Google Scholar] [CrossRef]
- Pavel, C.C.; Lacal-Arántegui, R.; Marmier, A.; Schüler, D.; Tzimas, E.; Buchert, M.; Jenseit, W.; Blagoeva, D. Substitution strategies for reducing the use of rare earths in wind turbines. Resour. Policy 2017, 52, 349–357. [Google Scholar] [CrossRef]
- Department of Energy (DOE) (2019) Advanced Wind Turbine Drivetrain Trends and Opportunities. Office of Energy Efficiency & Renewable Energy. https://www.energy.gov/eere/articles/advanced-wind-turbine-drivetrain-trends-and-opportunities.
- SolarTown (2021) Solar Panels: Thin Film or Crystalline. https://solartown.com/learning/solar-panels/solar-panels-thin-film-or-crystalline.
- Vestas Wind Systems A/S (2014) Life Cycle Assessment of Electricity Production from an Onshore V117-3.3 MW Wind Plant. Version 1.0, Denmark.
- Vestas Wind Systems A/S (2018) Life Cycle Assessment of Electricity Production from an Onshore V120-2.0 MW Wind Plant. Version 1.1, Denmark.
- Nunez, P.; Jones, S. Cradle to gate: life cycle impact of primary aluminium production. Int. J. Life Cycle Assess. 2015, 21, 1594–1604. [Google Scholar] [CrossRef]
- Haque, N.; Norgate, T. Estimation of greenhouse gas emissions from ferroalloy production using life cycle assessment with particular reference to Australia. J. Clean. Prod. 2013, 39, 220–230. [Google Scholar] [CrossRef]
- Northey, S.; Haque, N.; Mudd, G. Using sustainability reporting to assess the environmental footprint of copper mining. J. Clean. Prod. 2013, 40, 118–128. [Google Scholar] [CrossRef]
- Westfall, L.A.; Davourie, J.; Ali, M.; McGough, D. Cradle-to-gate life cycle assessment of global manganese alloy production. Int. J. Life Cycle Assess. 2016, 21, 1573–1579. [Google Scholar] [CrossRef]
- Heidari, S.M.; Anctil, A. Country-specific carbon footprint and cumulative energy demand of metallurgical grade silicon production for silicon photovoltaics. Resour. Conserv. Recycl. 2022, 180. [Google Scholar] [CrossRef]
- Farjana, S.H.; Huda, N.; Mahmud, M.P.; Lang, C. Impact analysis of gold silver refining processes through life-cycle assessment. J. Clean. Prod. 2019, 228, 867–881. [Google Scholar] [CrossRef]
- Sheth, K.; Patel, D. Comprehensive Examination of Solar Panel Design: A Focus on Thermal Dynamics. Smart Grid Renew. Energy 2024, 15, 15–33. [Google Scholar] [CrossRef]
- Swami, G.; Sheth, K.; Patel, D. PV Capacity Evaluation Using ASTM E2848: Techniques for Accuracy and Reliability in Bifacial Systems. Smart Grid Renew. Energy 2024, 15, 201–216. [Google Scholar] [CrossRef]
Figure 6.
CO2eq emissions per year for solar technologies based on demand forecast, only considering emissions from aluminum and copper.
Figure 6.
CO2eq emissions per year for solar technologies based on demand forecast, only considering emissions from aluminum and copper.
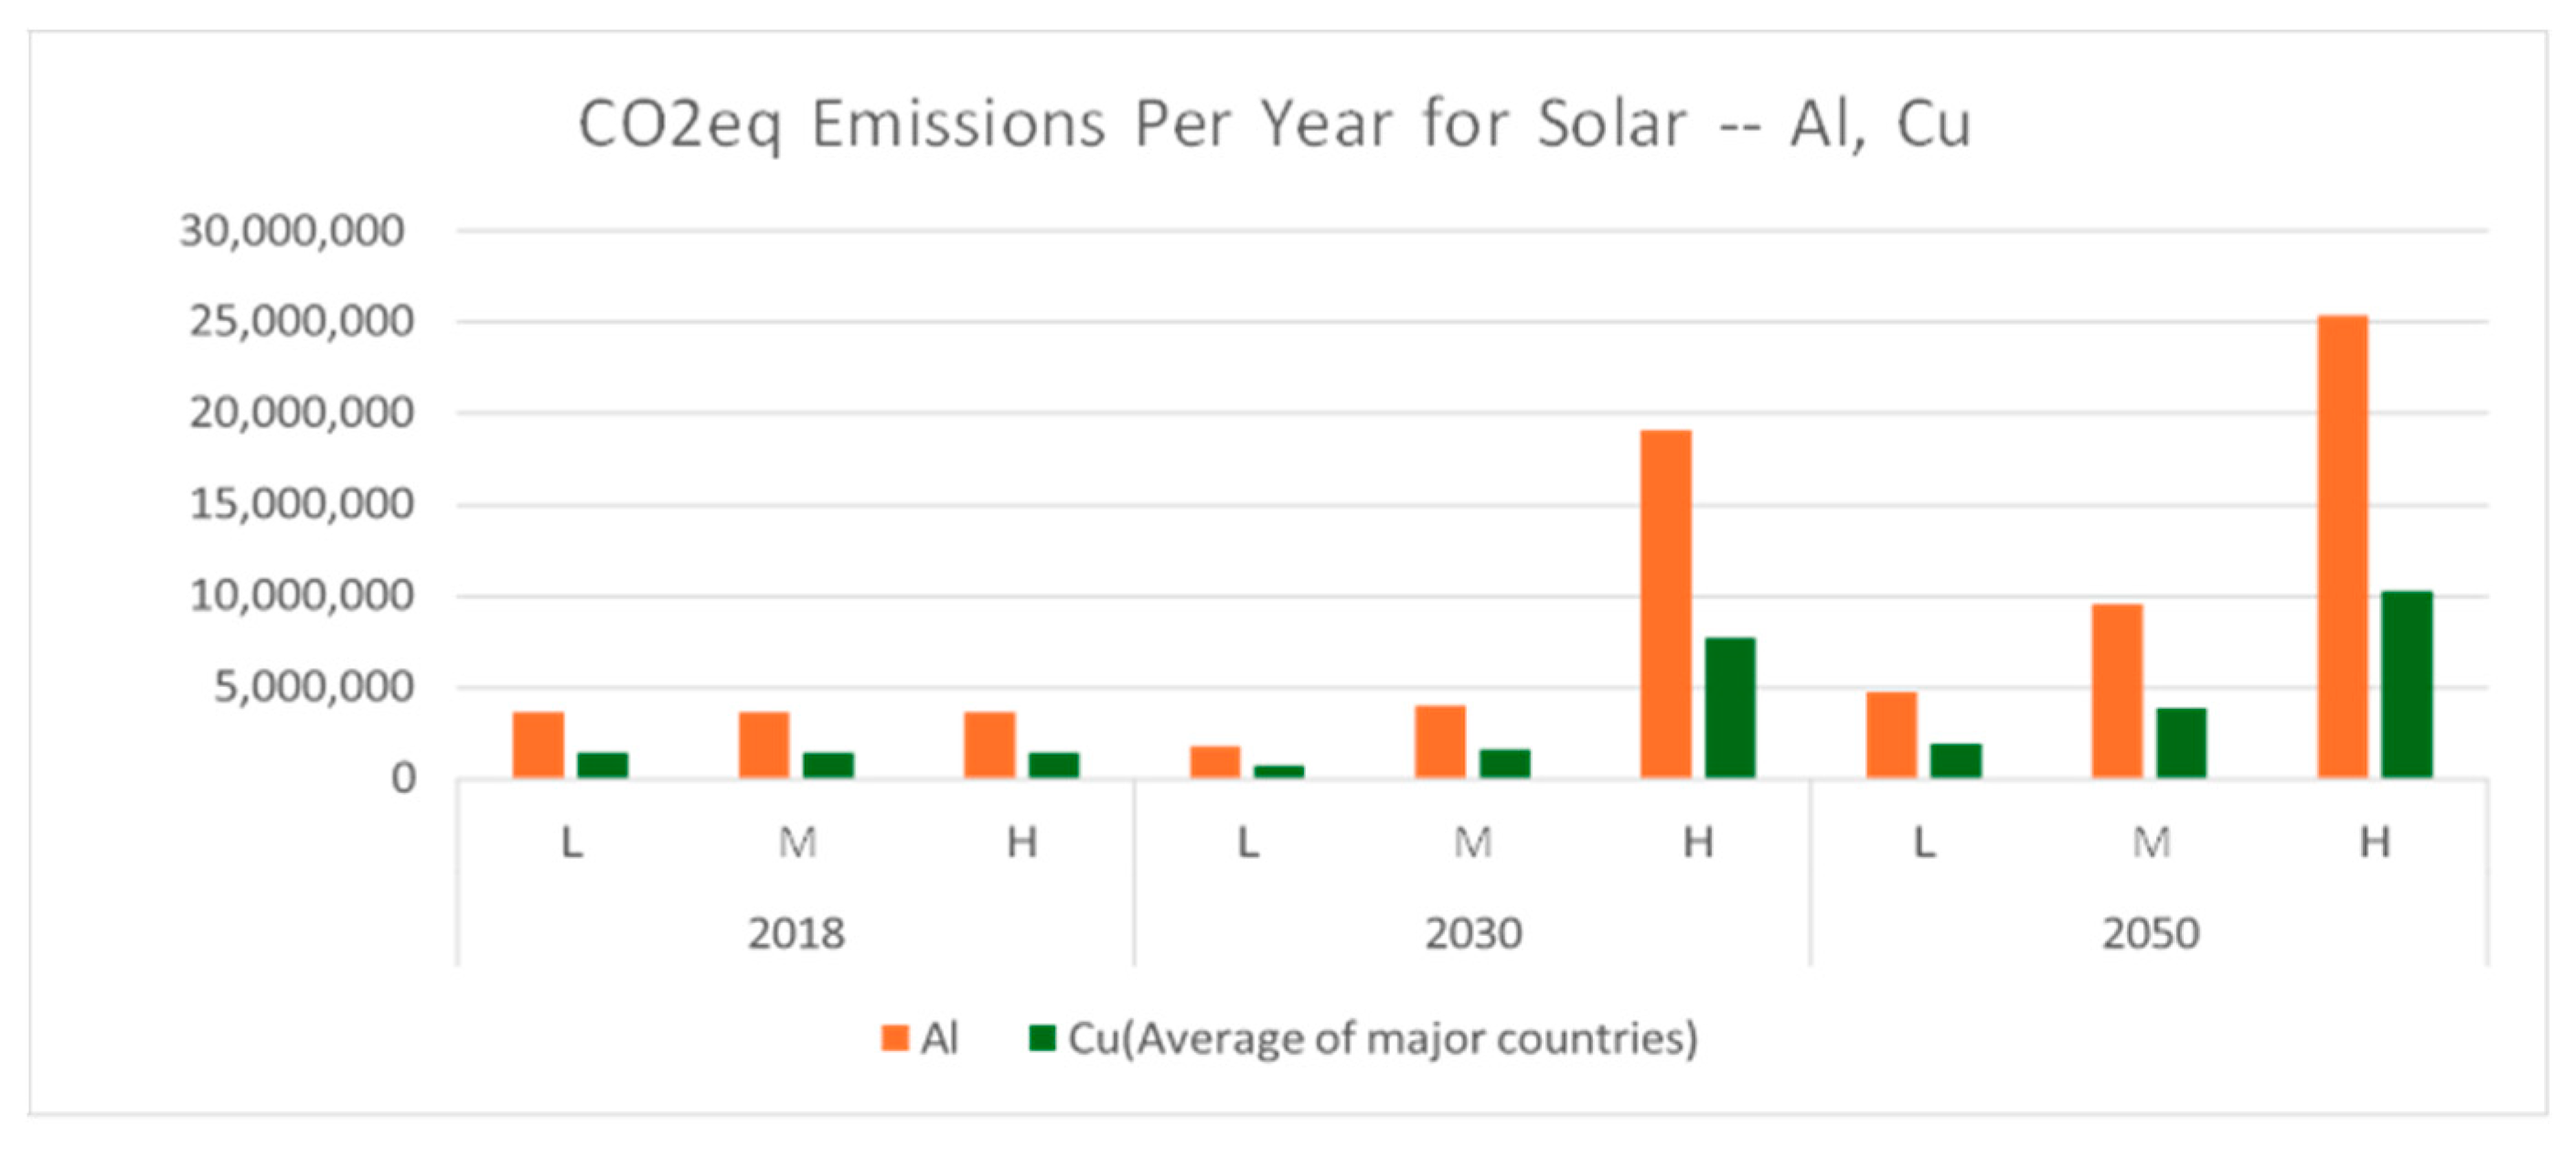
Figure 7.
CO2eq emissions per year for solar technologies based on demand forecast, comparing CO2eq emission from copper mining, based on different countries' origins. Copper mining from South Africa and USA have the highest emissions.
Figure 7.
CO2eq emissions per year for solar technologies based on demand forecast, comparing CO2eq emission from copper mining, based on different countries' origins. Copper mining from South Africa and USA have the highest emissions.
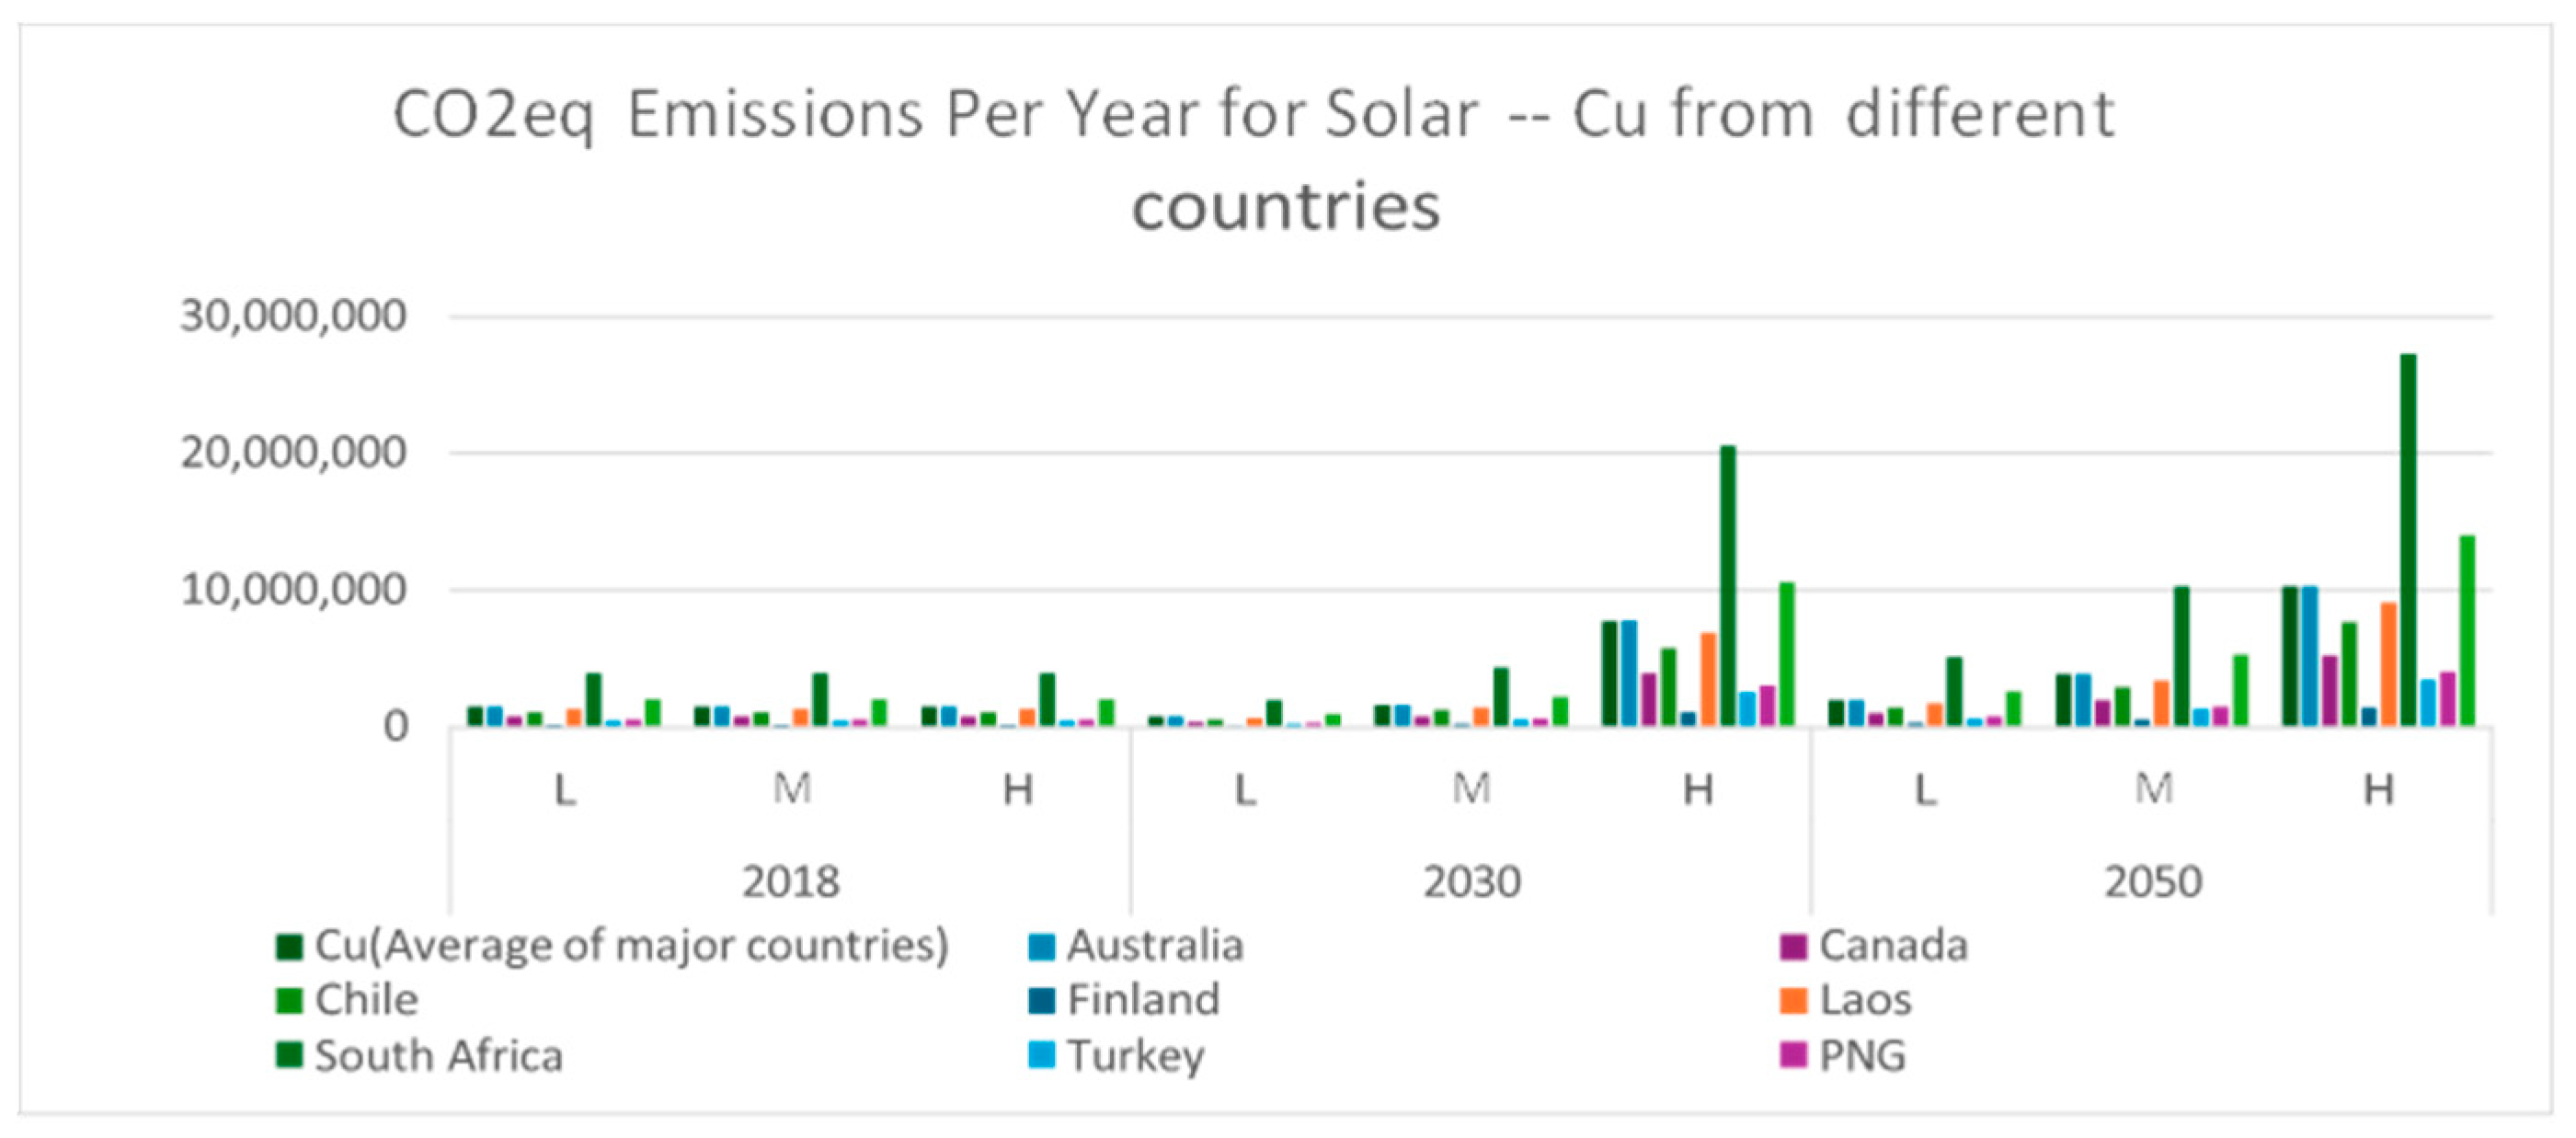
Figure 8.
Freshwater eutrophication for minerals used in solar technology based on demand forecast, with data available.
Figure 8.
Freshwater eutrophication for minerals used in solar technology based on demand forecast, with data available.
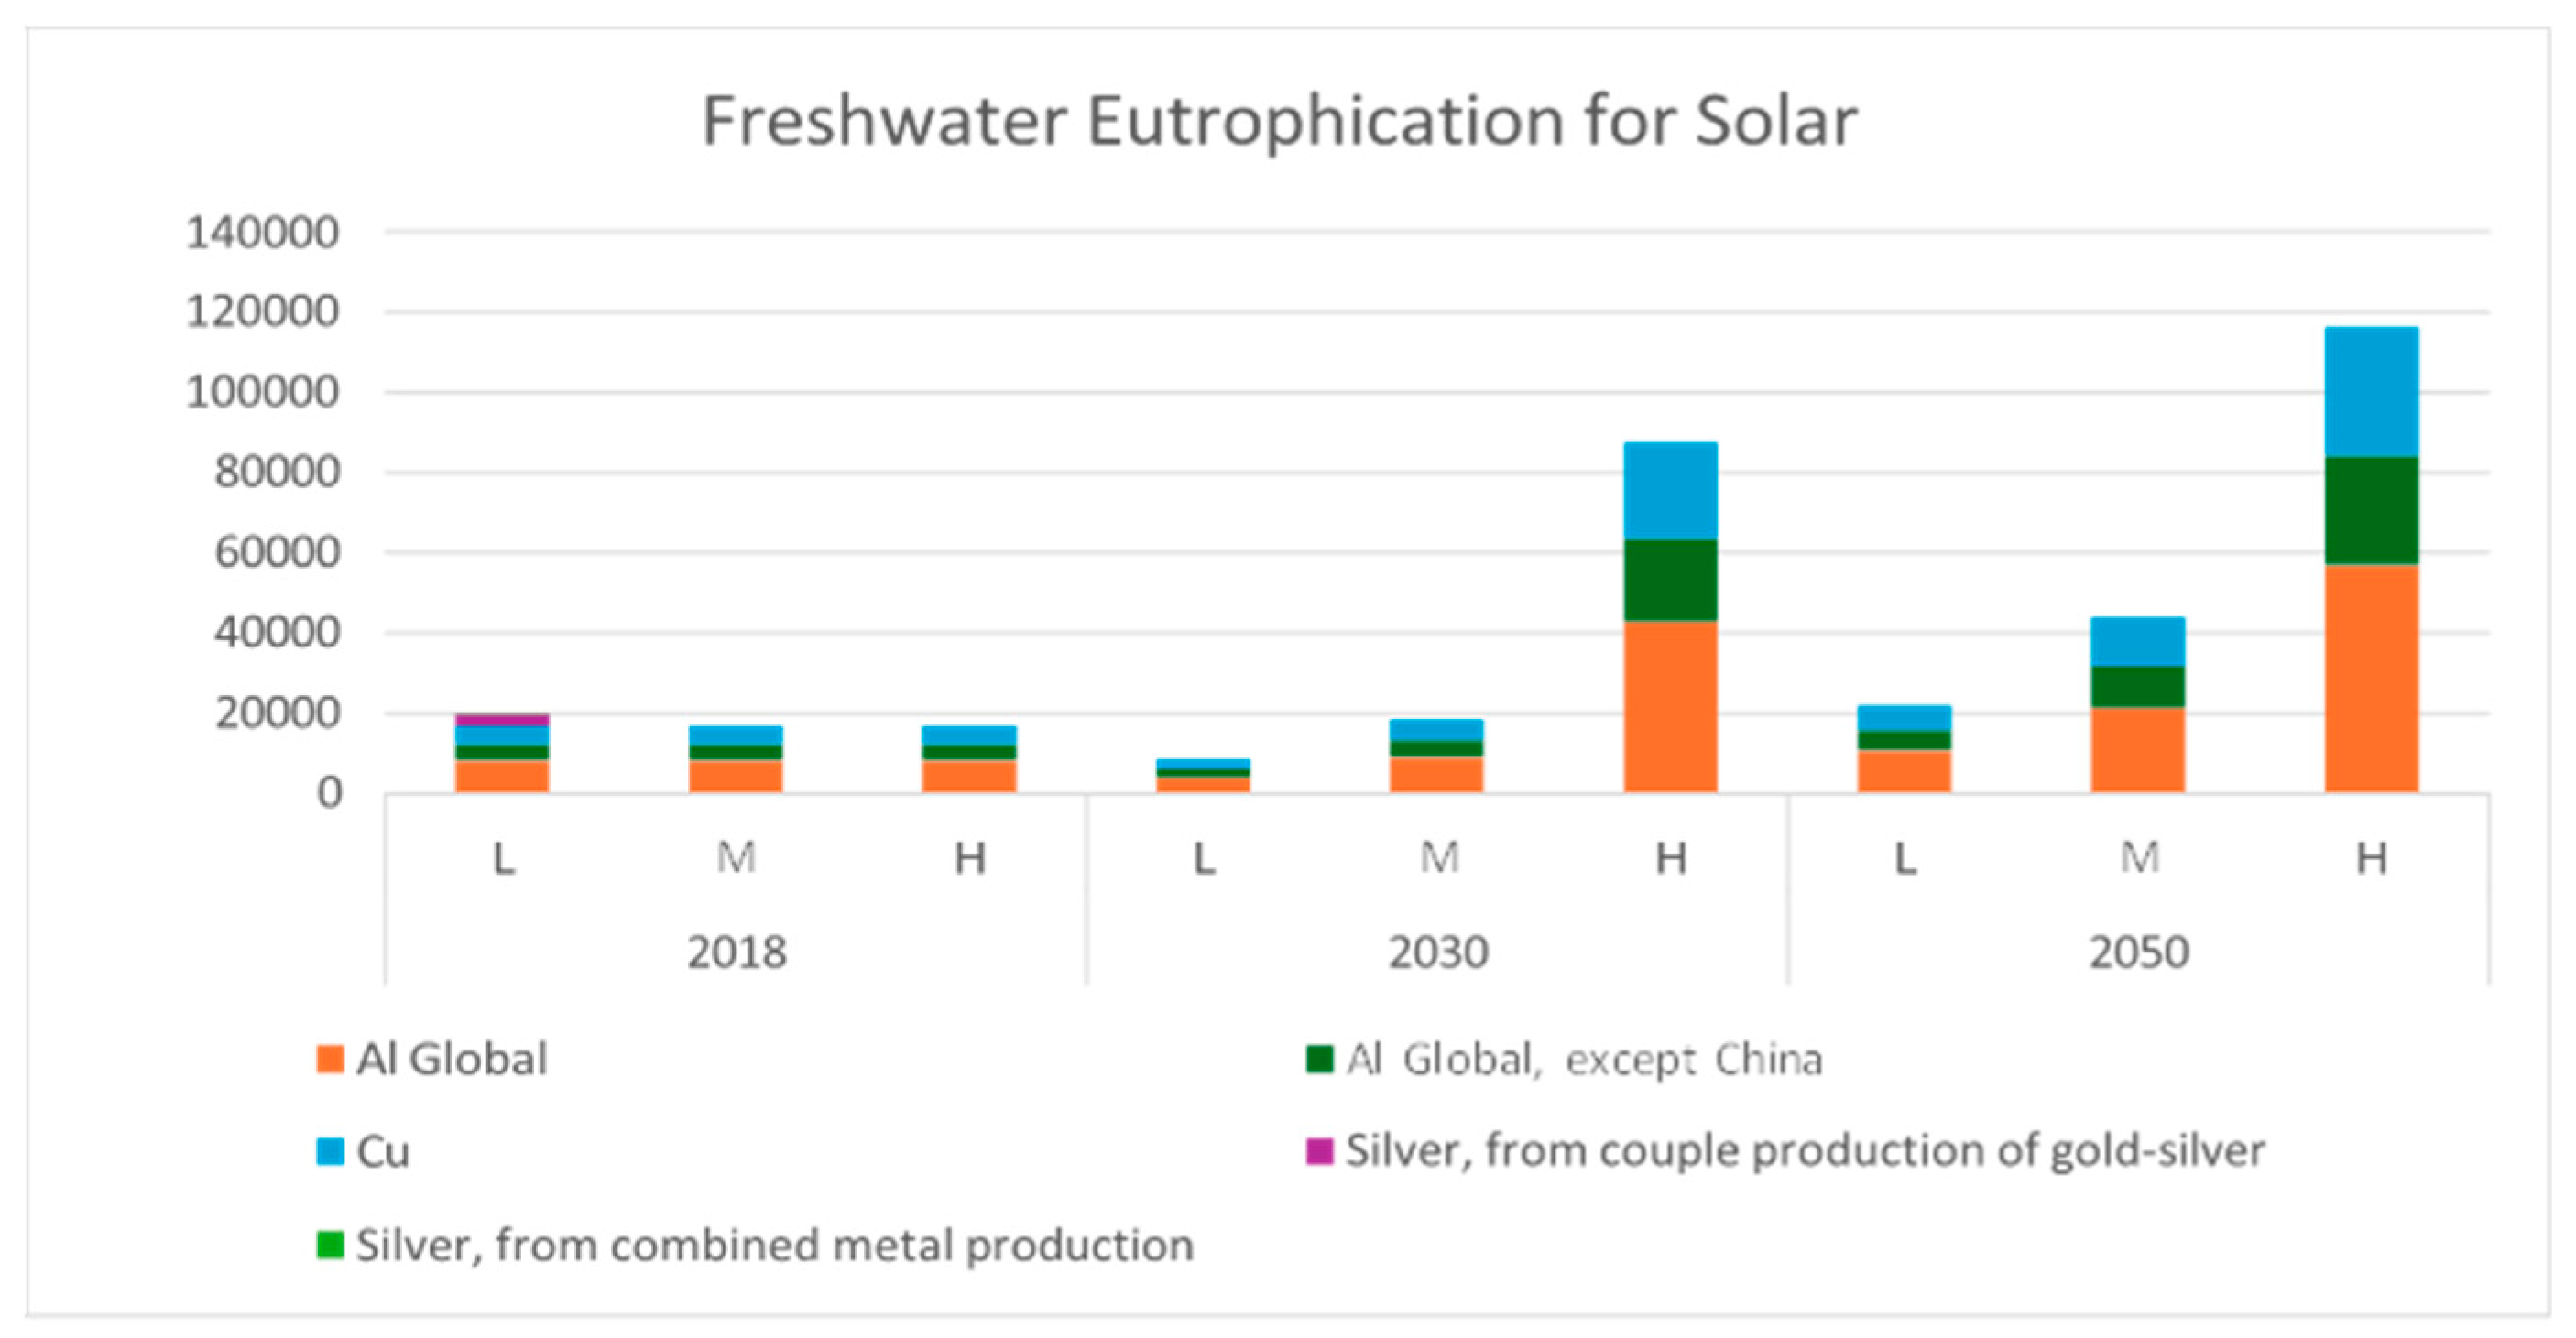
Figure 9.
Freshwater ecotoxicity for minerals used in solar technology based on demand forecast, with data available.
Figure 9.
Freshwater ecotoxicity for minerals used in solar technology based on demand forecast, with data available.
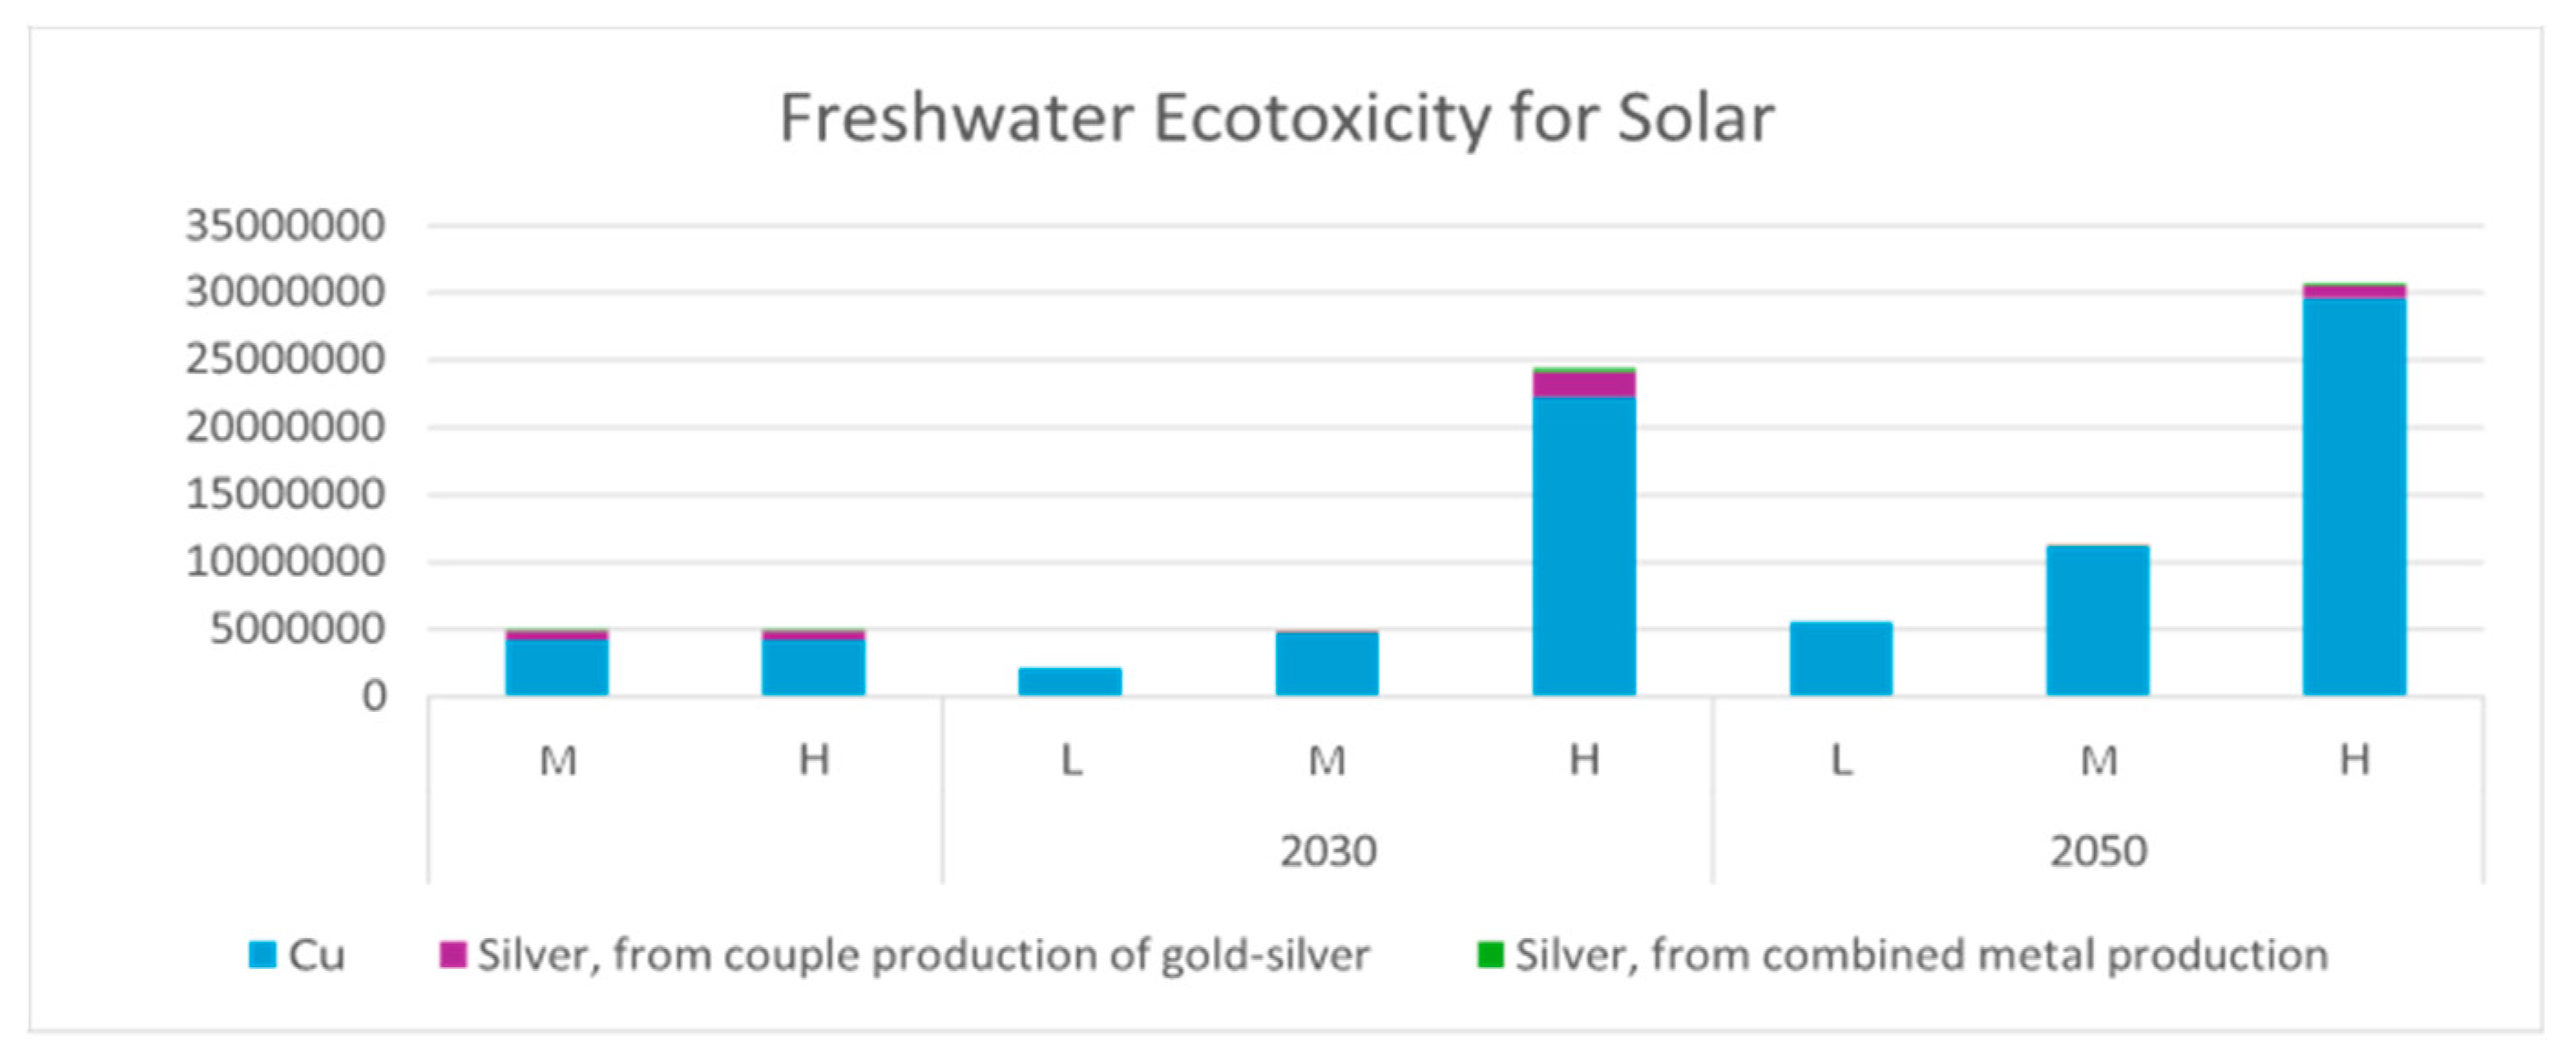
Figure 10.
Water use for minerals used in solar technology based on demand forecast, with data available.
Figure 10.
Water use for minerals used in solar technology based on demand forecast, with data available.
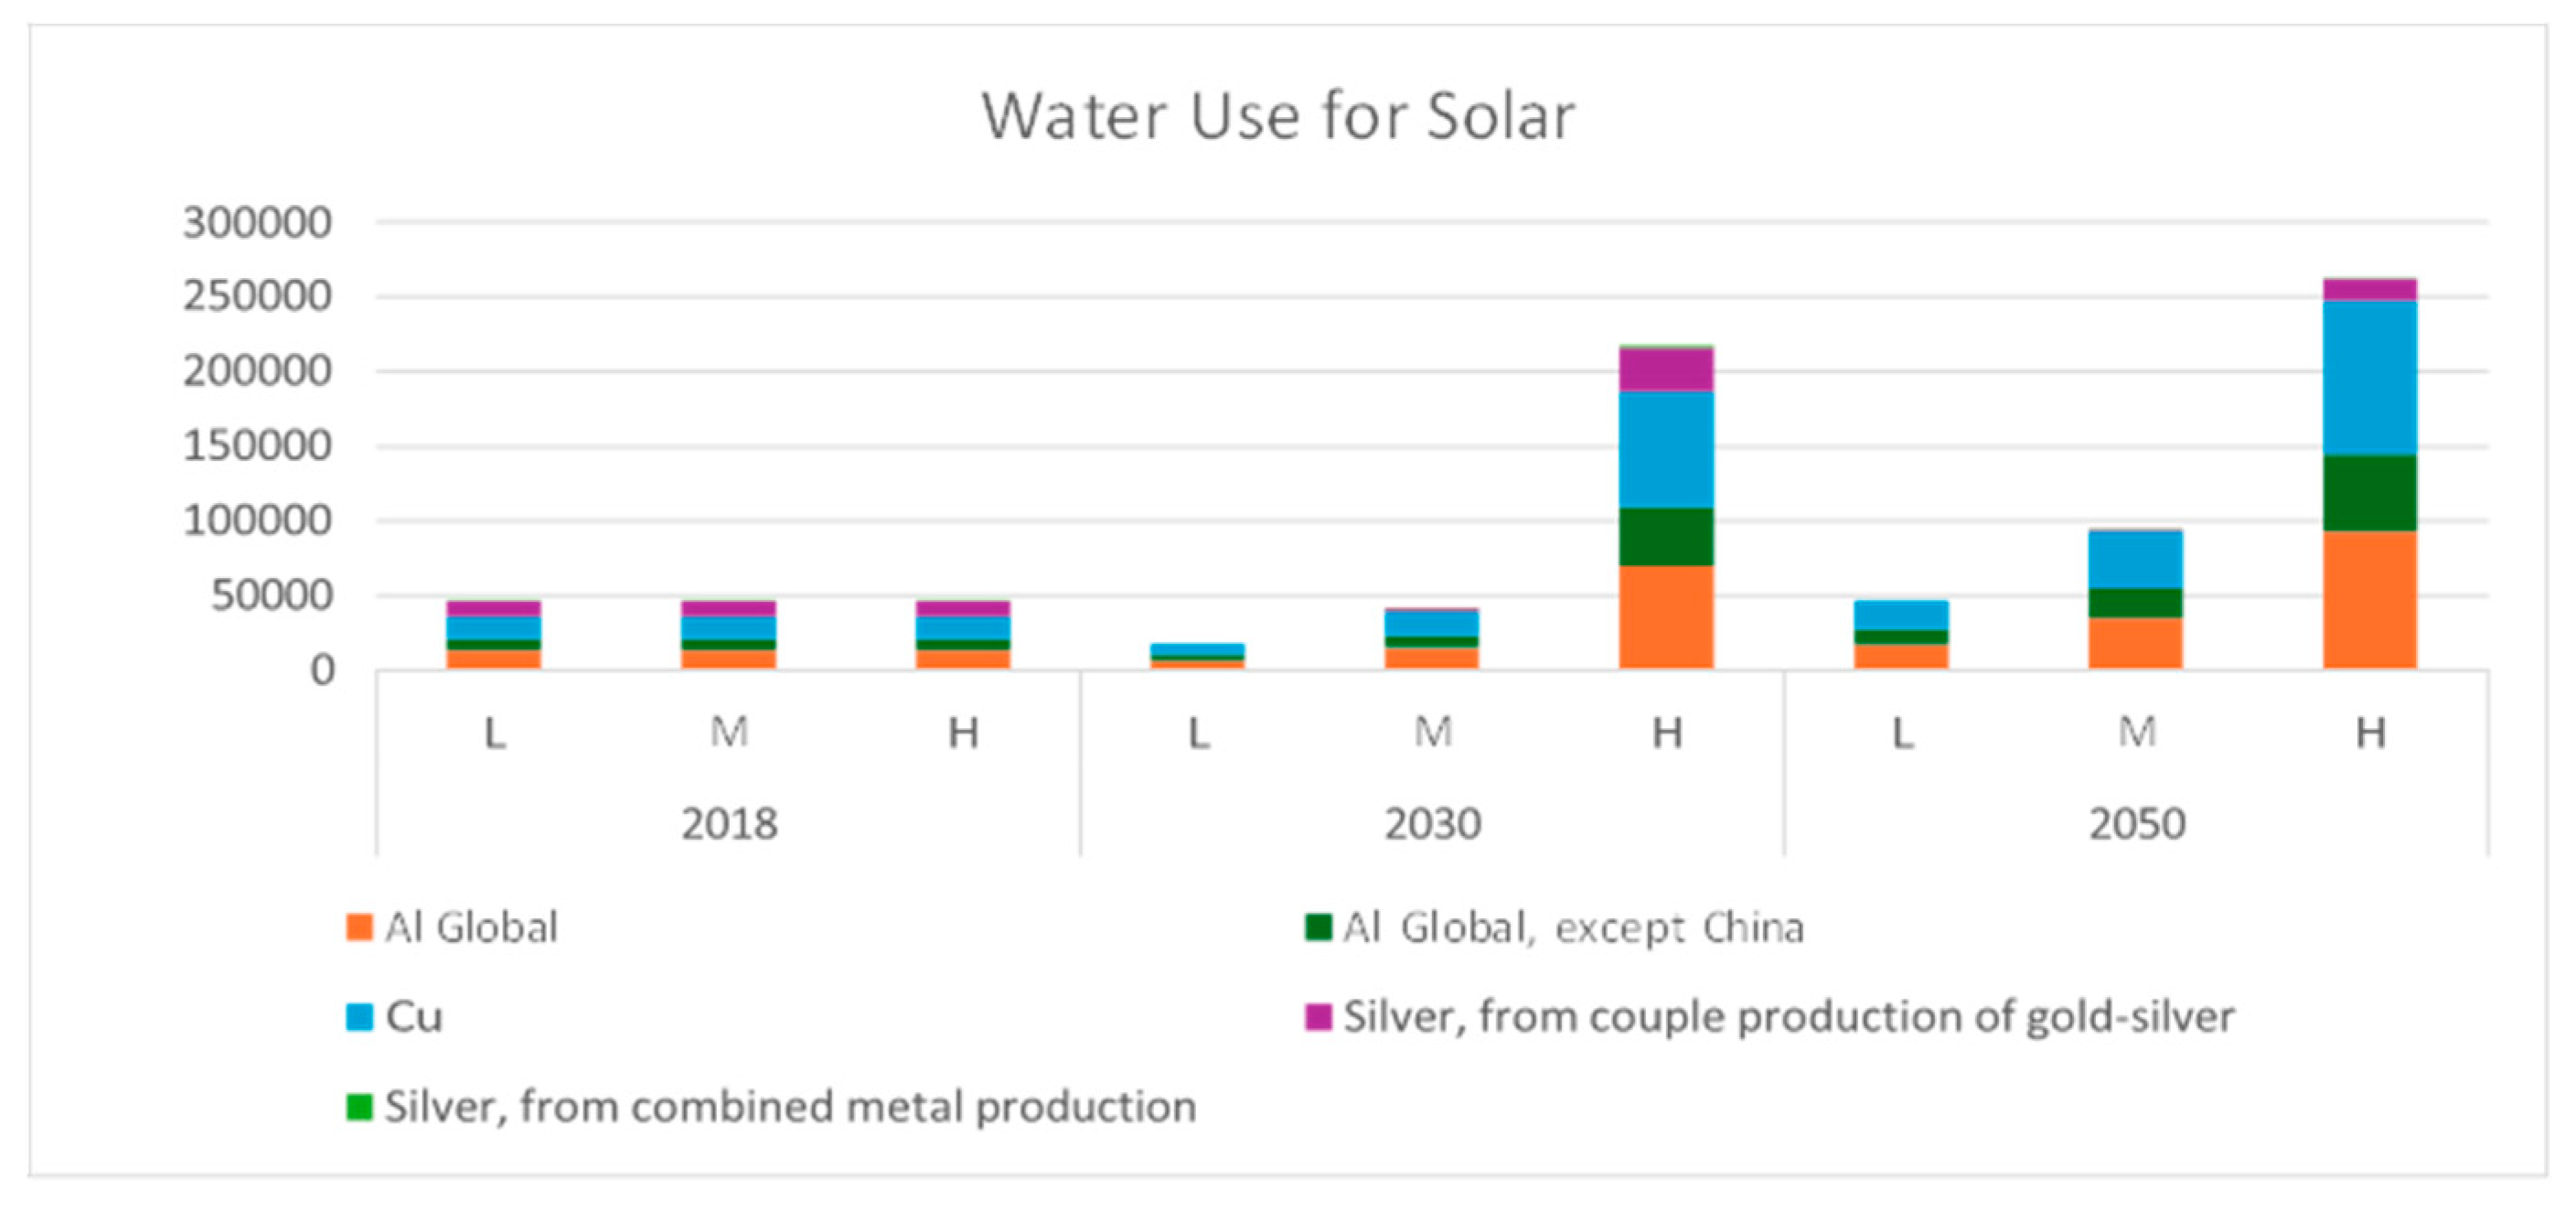
Figure 11.
The acidification potential for minerals used in solar technology is based on demand forecast, with data available.
Figure 11.
The acidification potential for minerals used in solar technology is based on demand forecast, with data available.
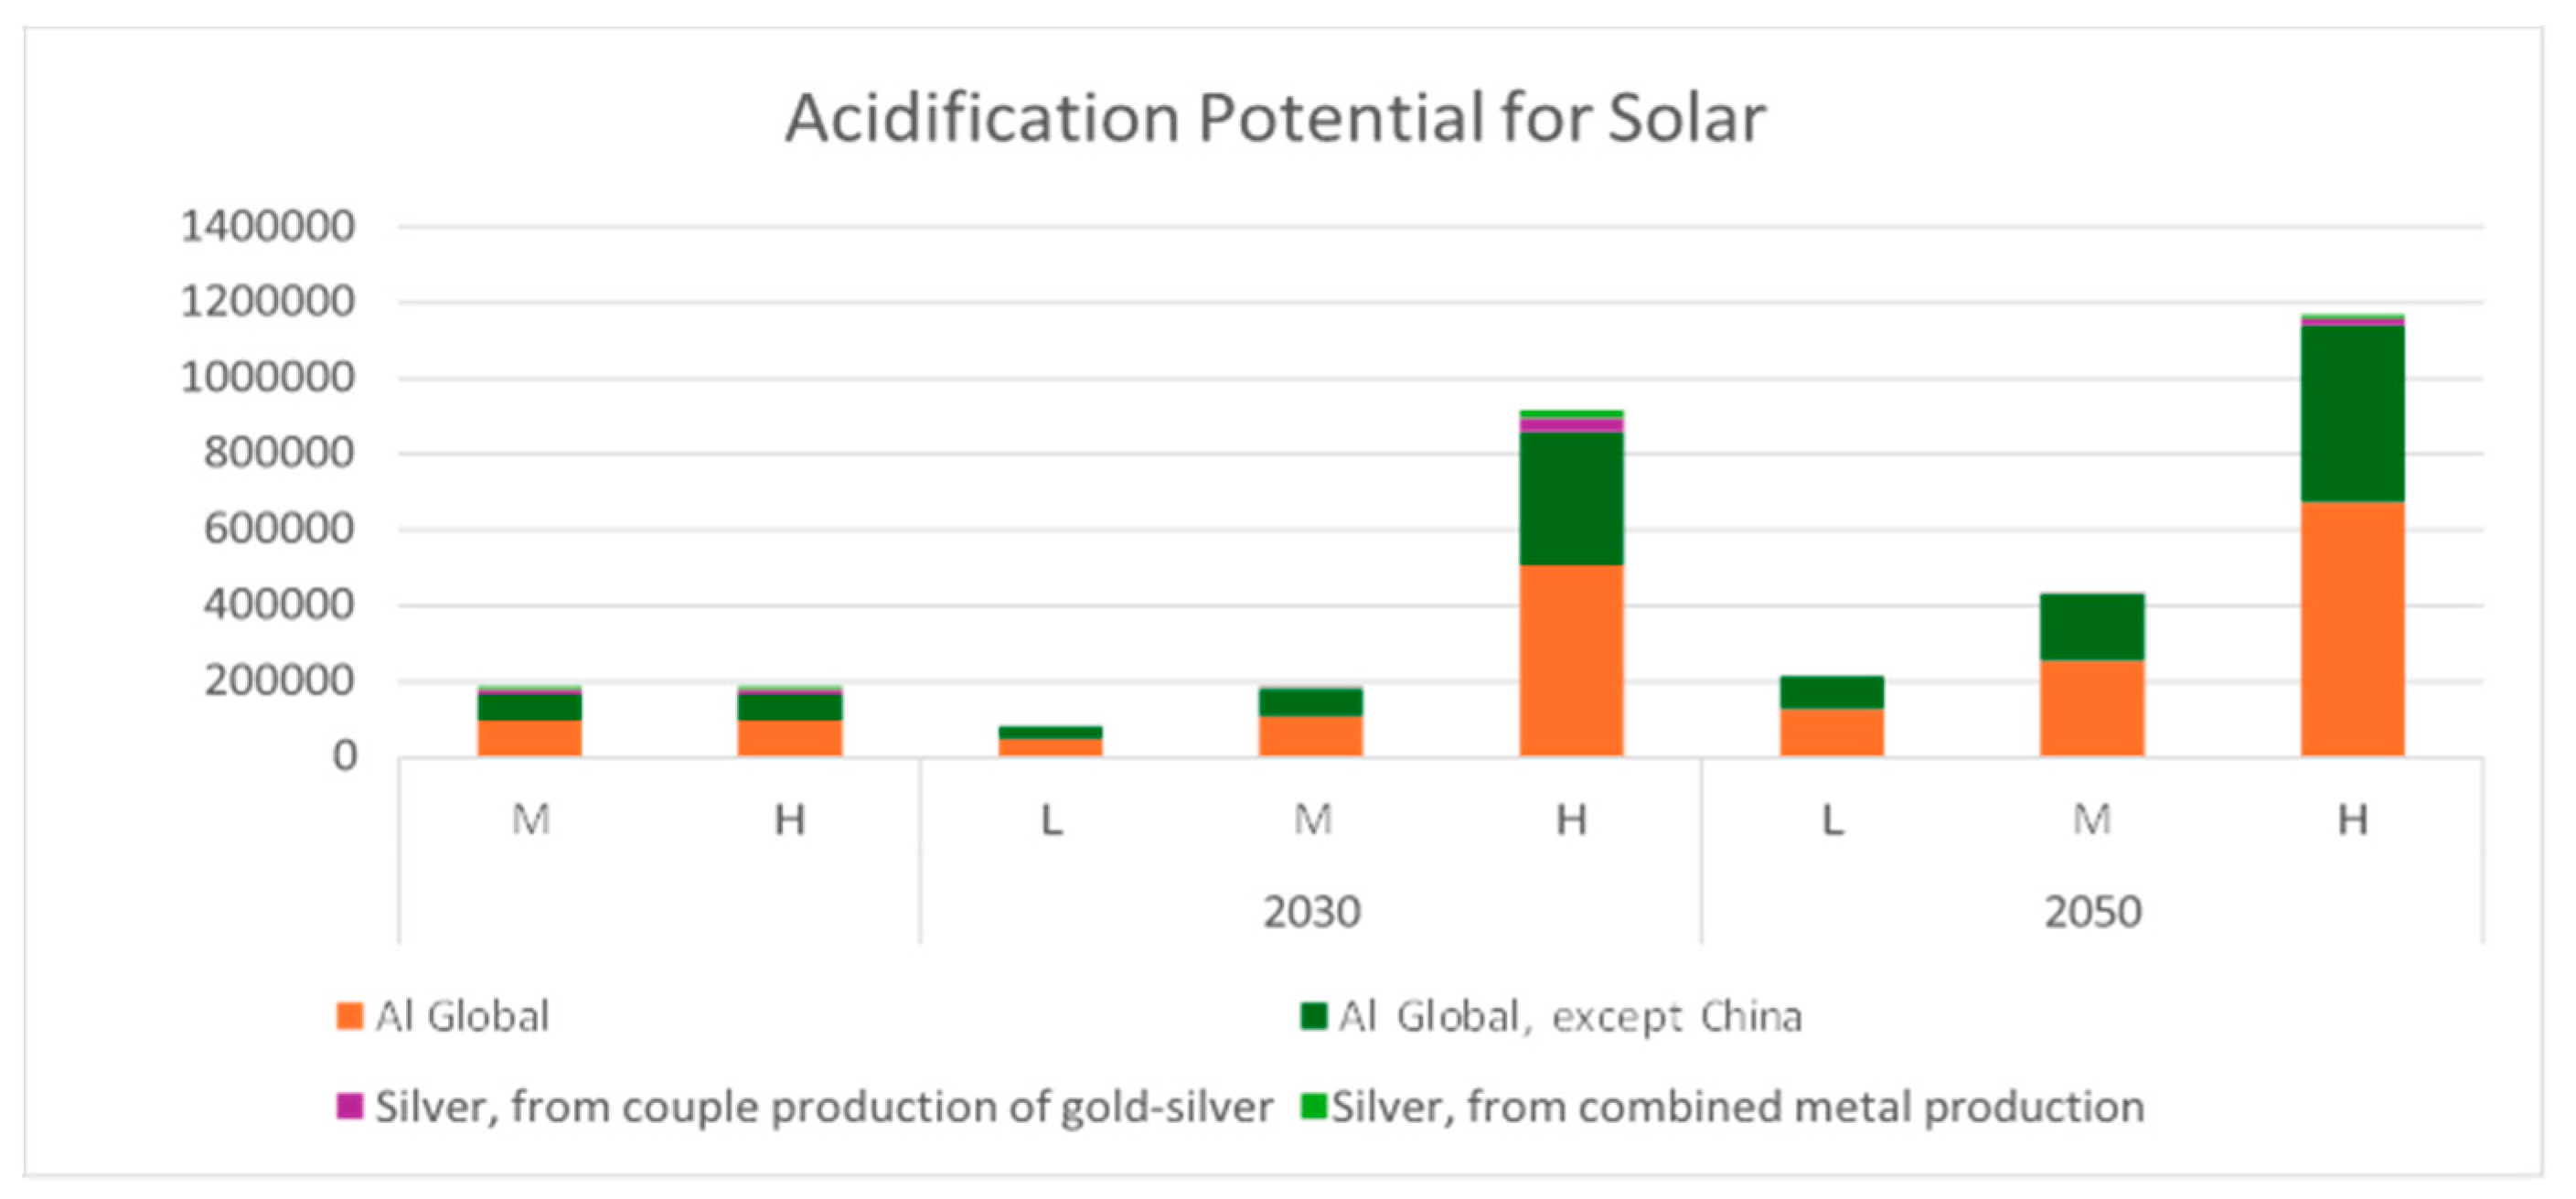
Figure 12.
CO2 emissions per year for wind technologies based on demand forecast, only considering emissions from aluminum, copper, nickel, zinc, and neodymium. From highest to lowest, the total annual CO2 emissions are highest for zinc, copper, and aluminum.
Figure 12.
CO2 emissions per year for wind technologies based on demand forecast, only considering emissions from aluminum, copper, nickel, zinc, and neodymium. From highest to lowest, the total annual CO2 emissions are highest for zinc, copper, and aluminum.
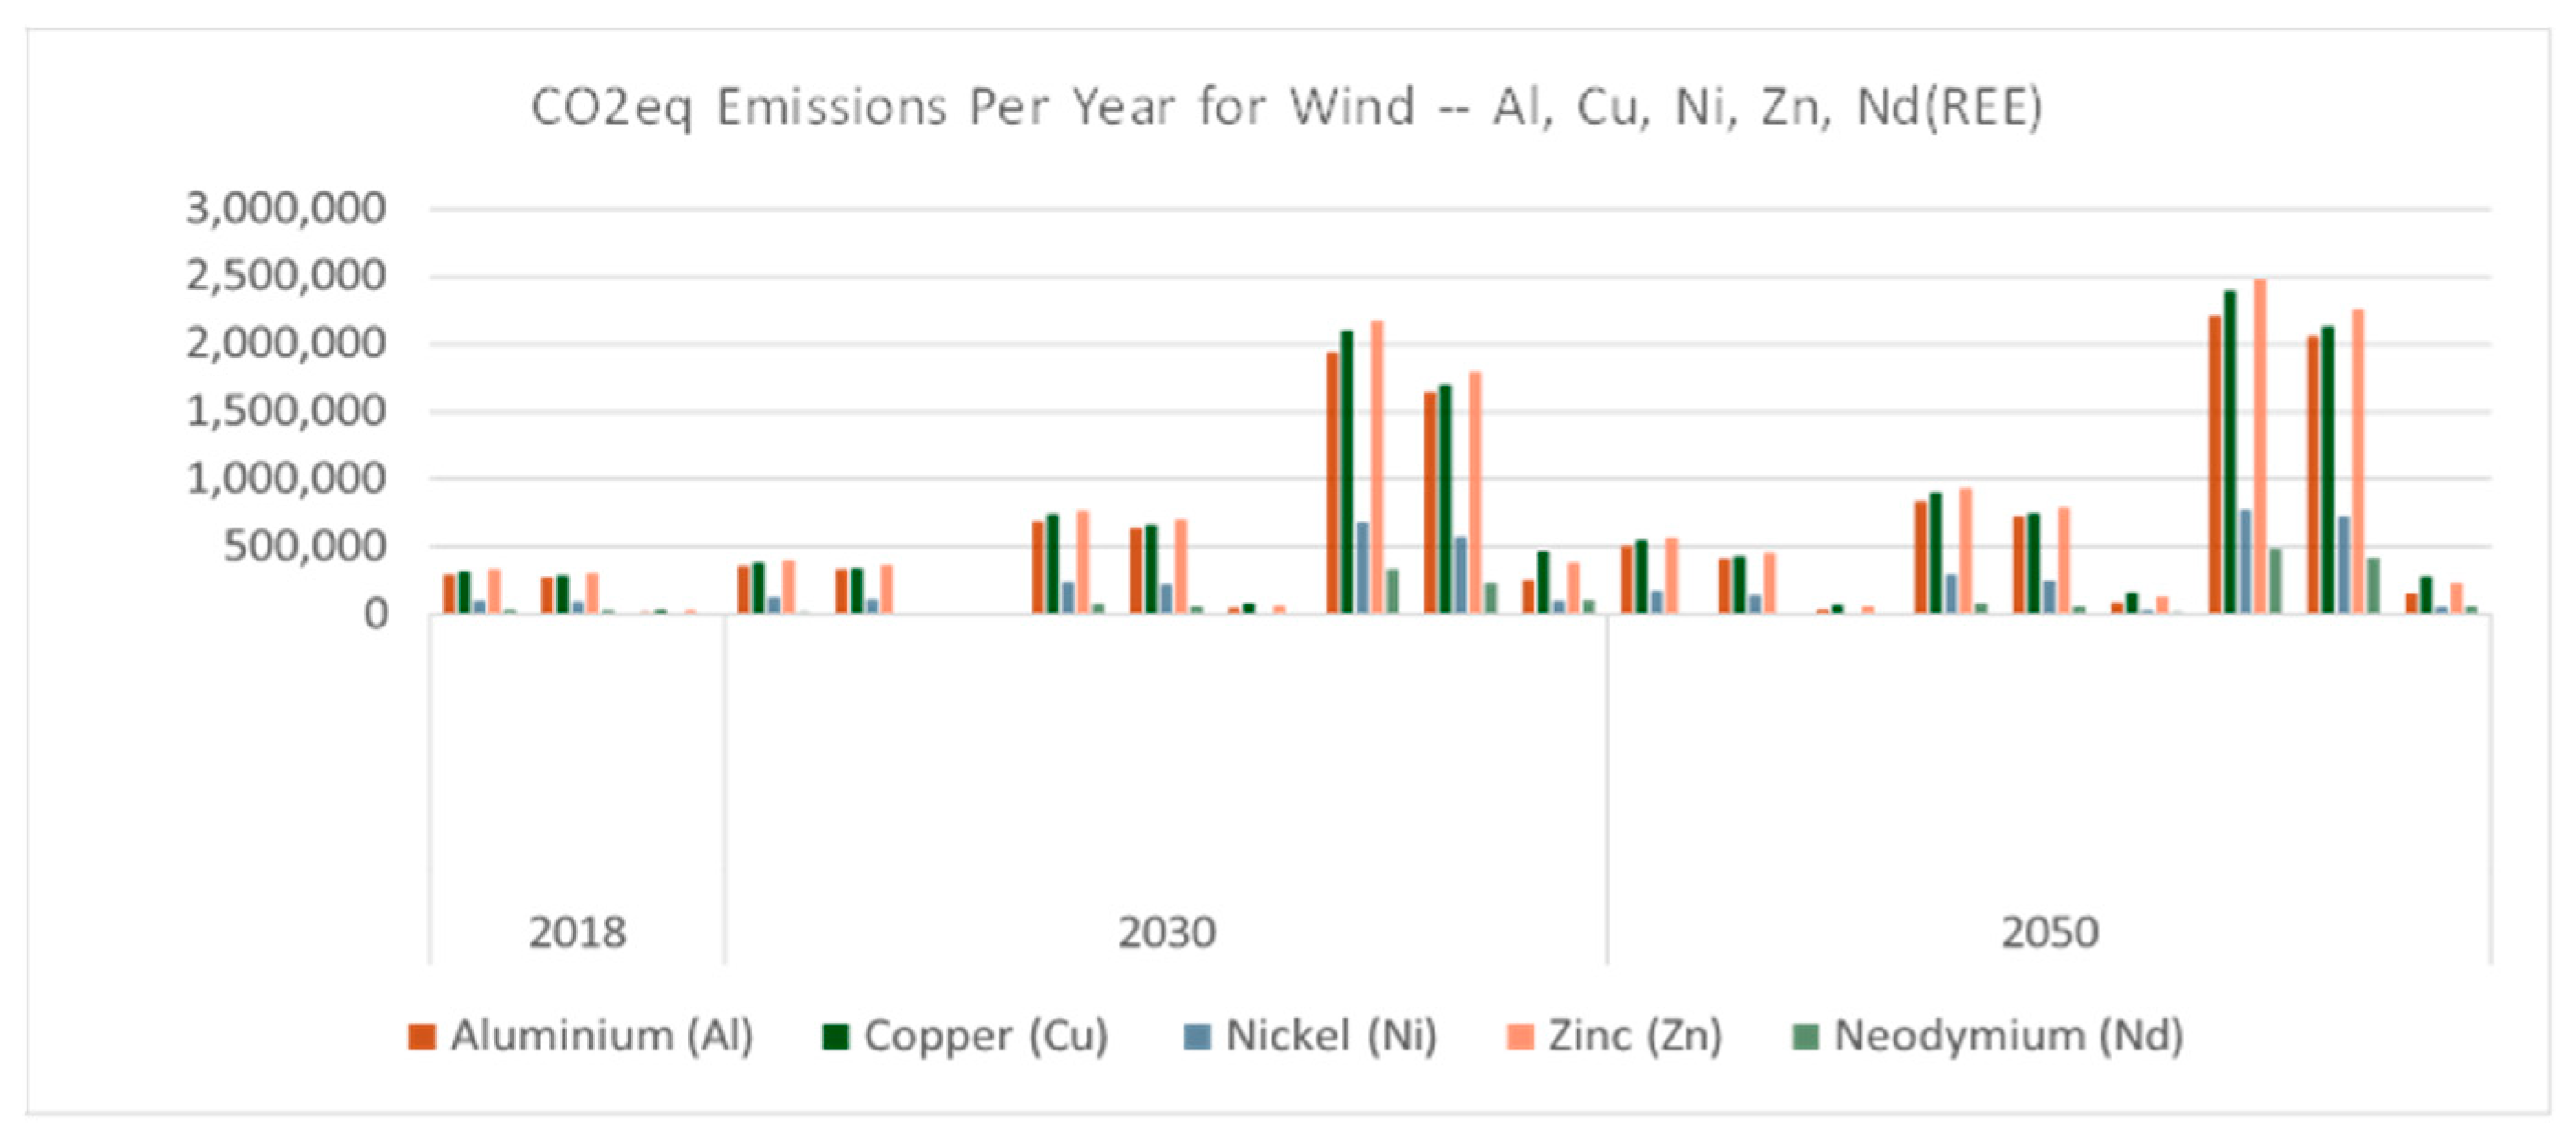
Figure 13.
CO2 emissions per year for wind technologies based on demand forecast, comparing CO2 emission from copper mining, based on different countries' origins. Copper mining from South Africa and USA have the highest emissions.
Figure 13.
CO2 emissions per year for wind technologies based on demand forecast, comparing CO2 emission from copper mining, based on different countries' origins. Copper mining from South Africa and USA have the highest emissions.
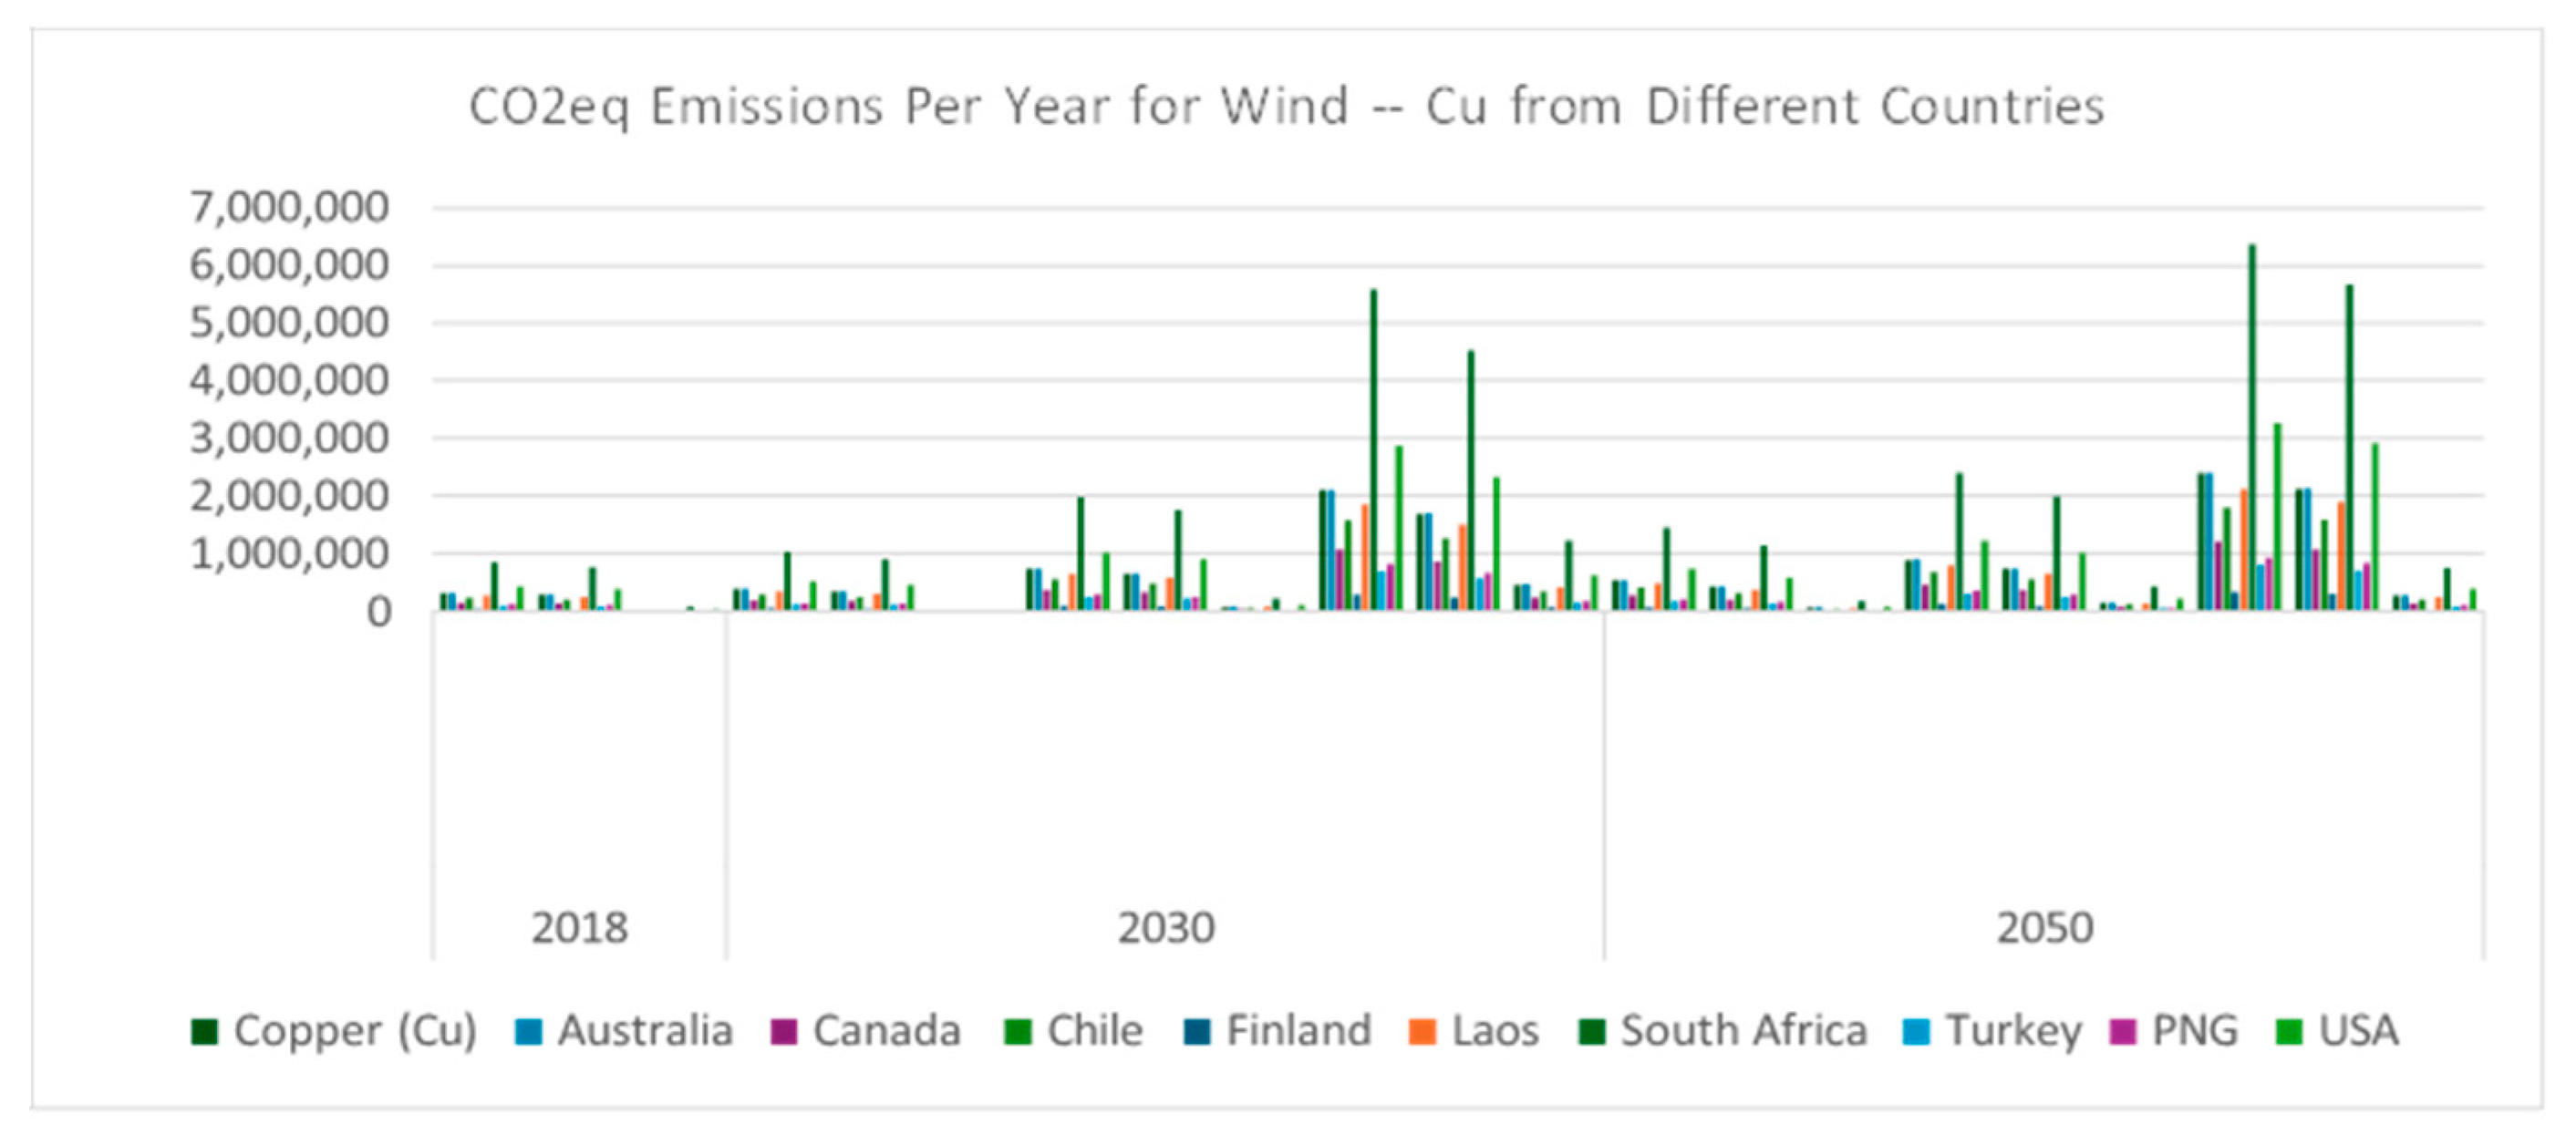
Figure 14.
Freshwater eutrophication for minerals used in wind technology based on demand forecast, with data available.
Figure 14.
Freshwater eutrophication for minerals used in wind technology based on demand forecast, with data available.
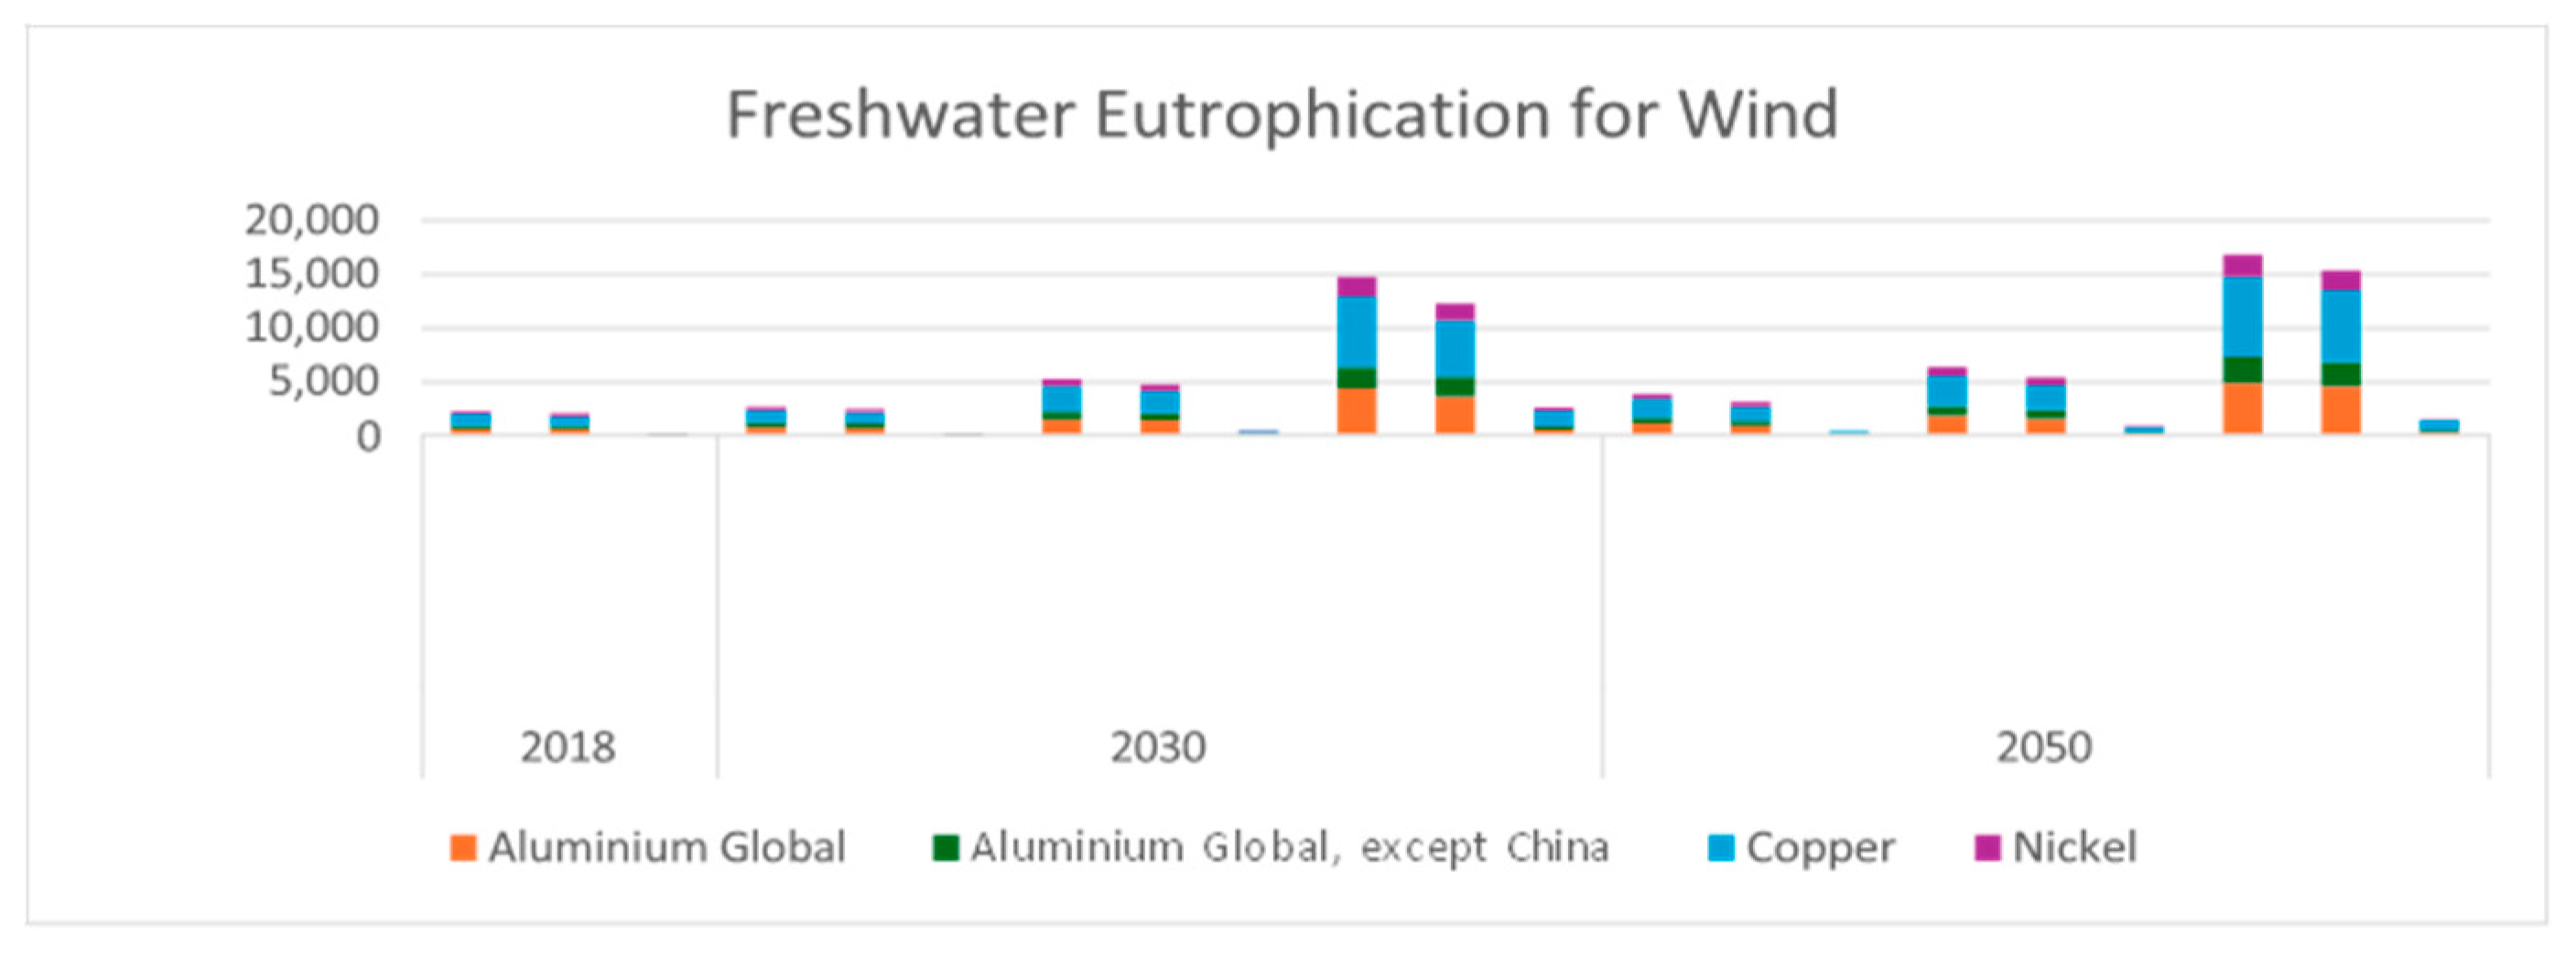
Figure 15.
Freshwater ecotoxicity for minerals used in wind technology based on demand forecast, with data available.
Figure 15.
Freshwater ecotoxicity for minerals used in wind technology based on demand forecast, with data available.
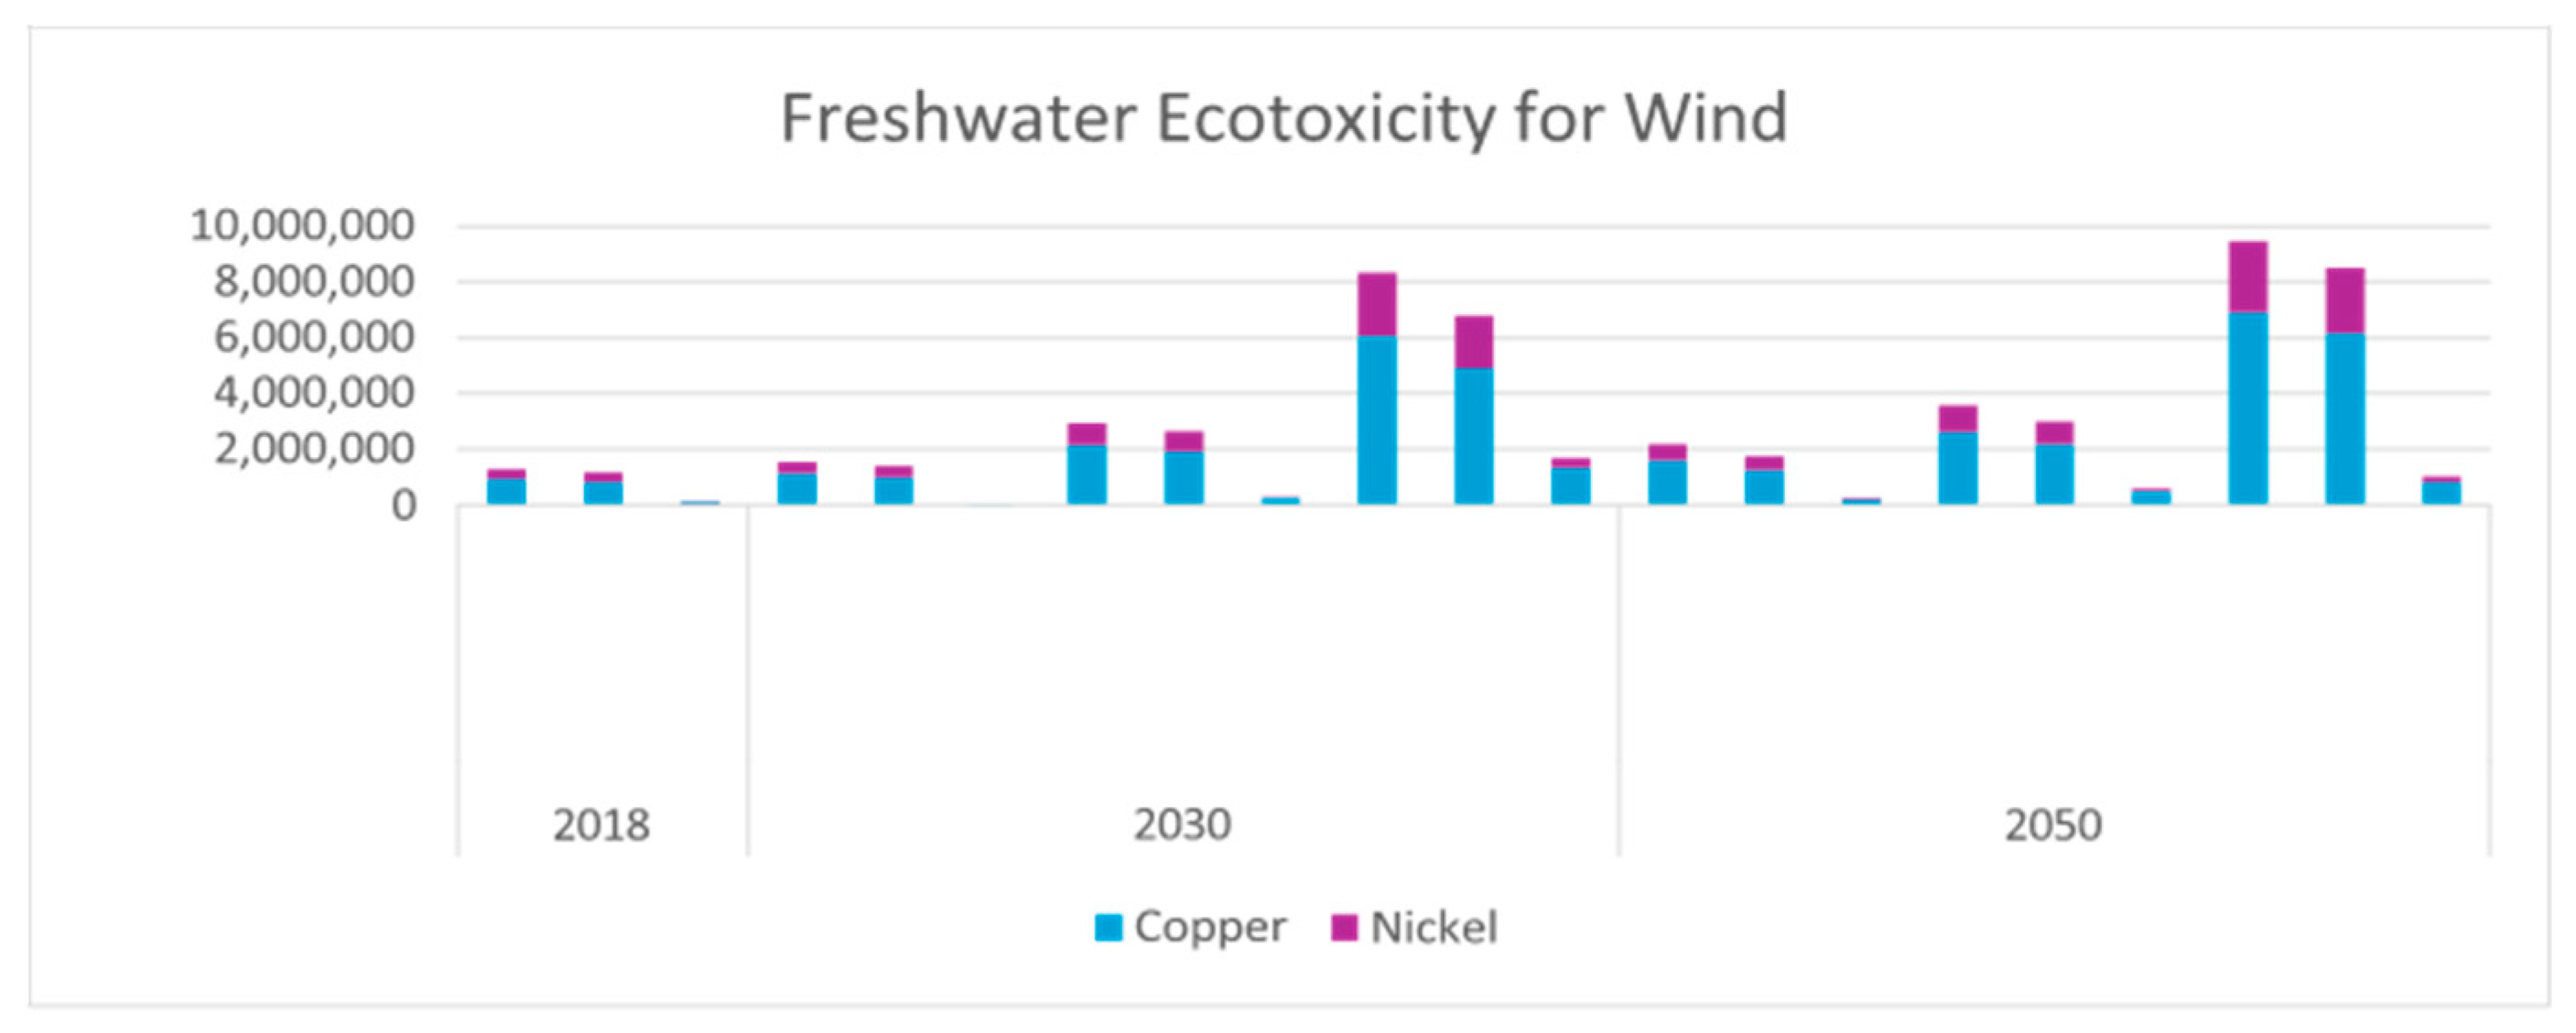
Figure 16.
Amount of water use for minerals used in wind technology based on demand forecast, with data available.
Figure 16.
Amount of water use for minerals used in wind technology based on demand forecast, with data available.
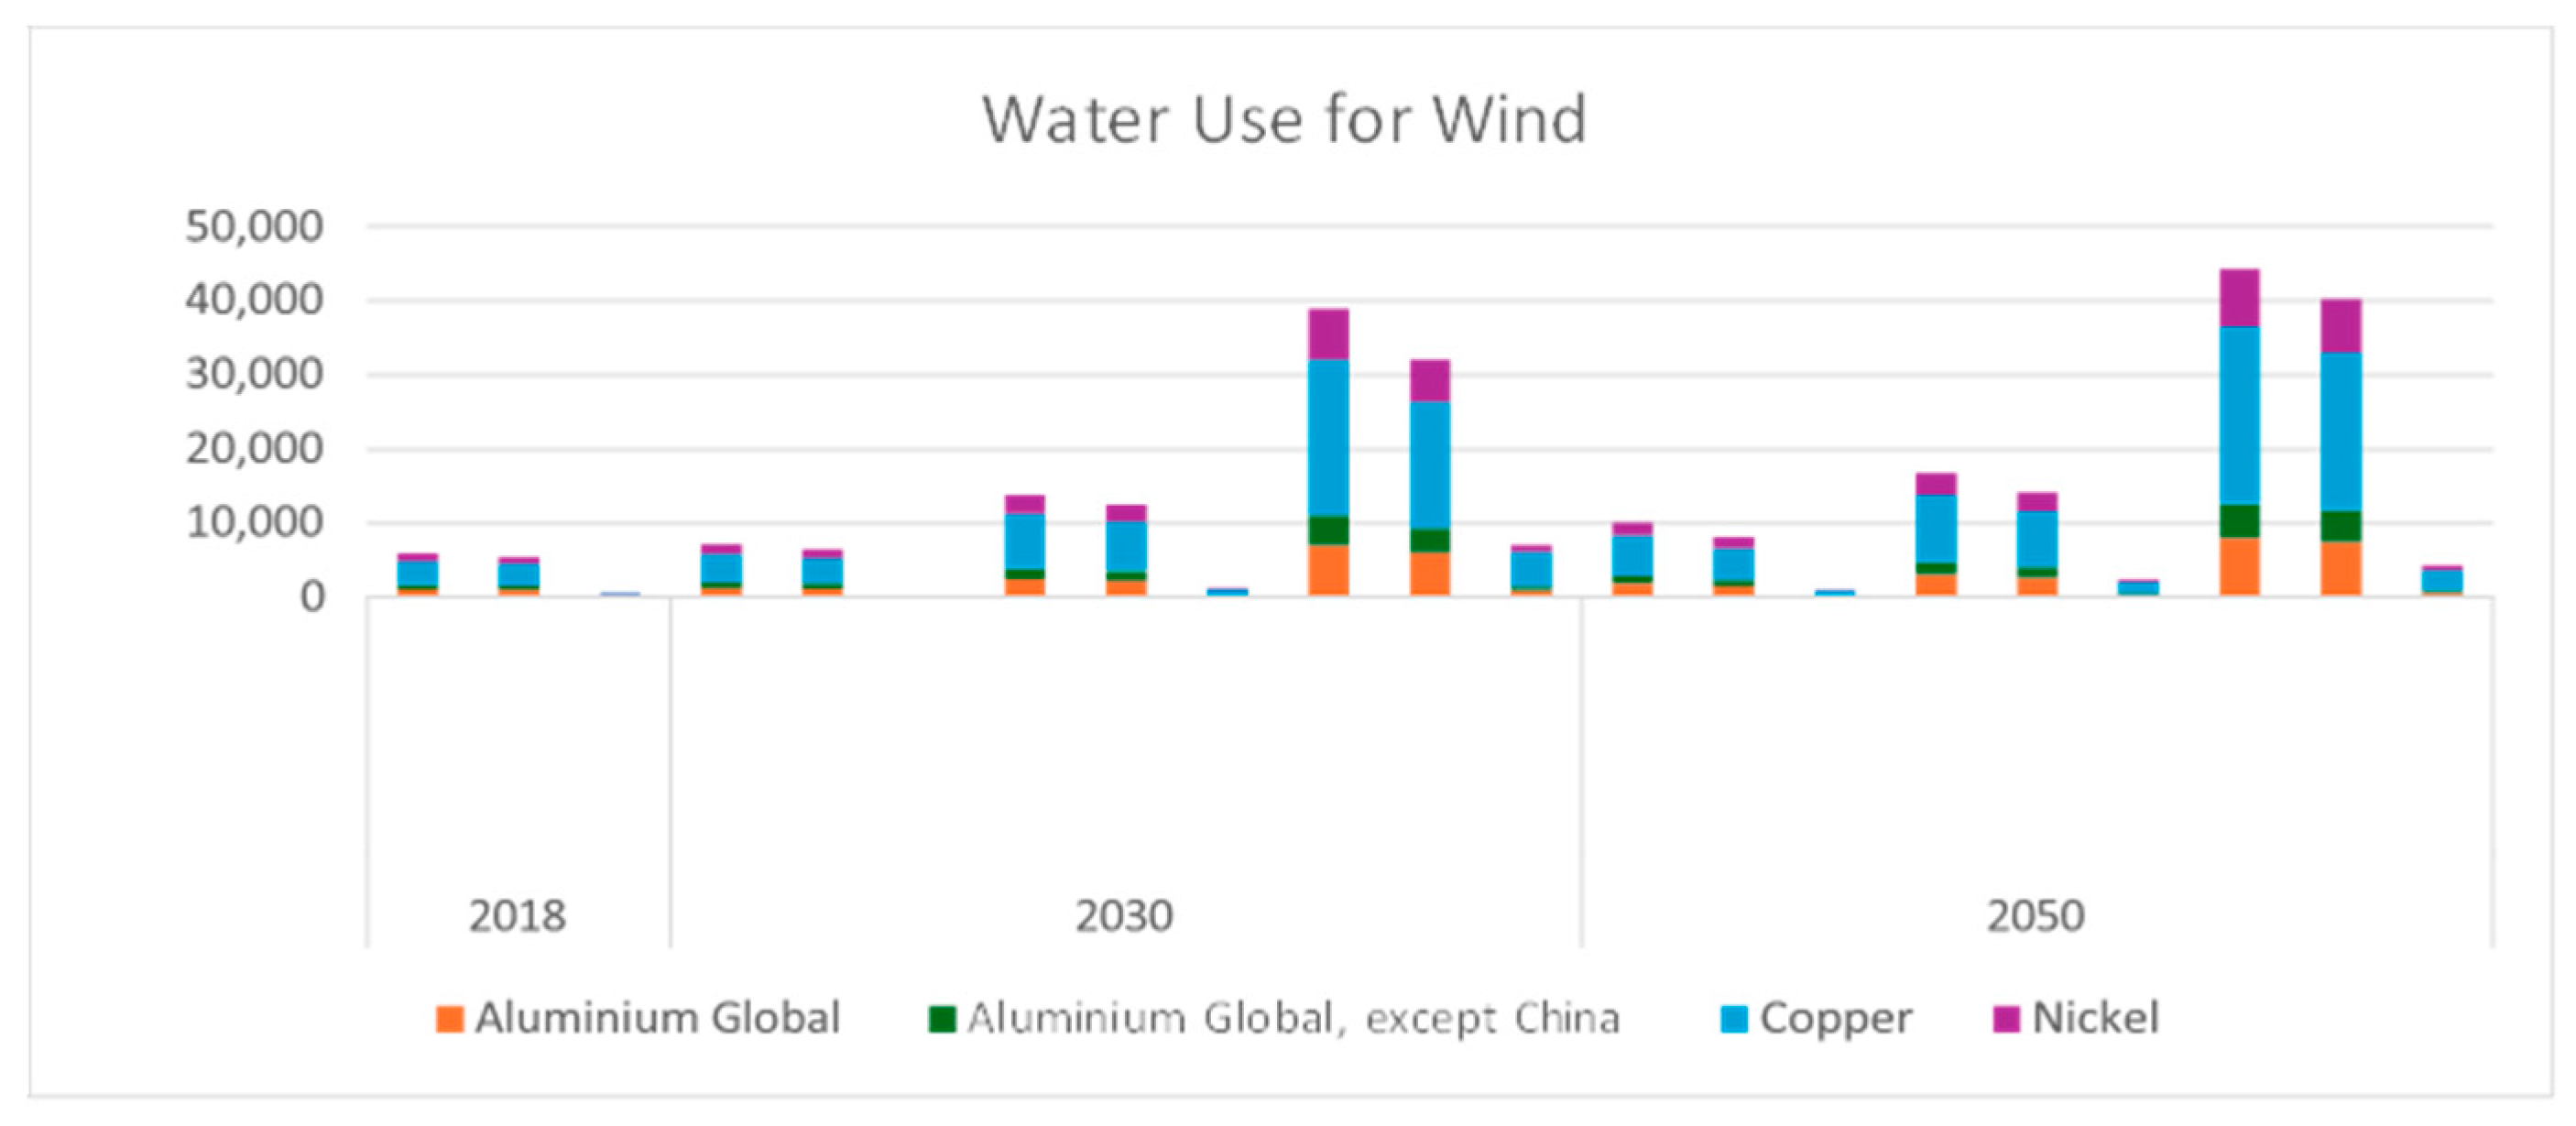
Figure 17.
Acidification potential for minerals used in wind technology based on demand forecast, with data available.
Figure 17.
Acidification potential for minerals used in wind technology based on demand forecast, with data available.
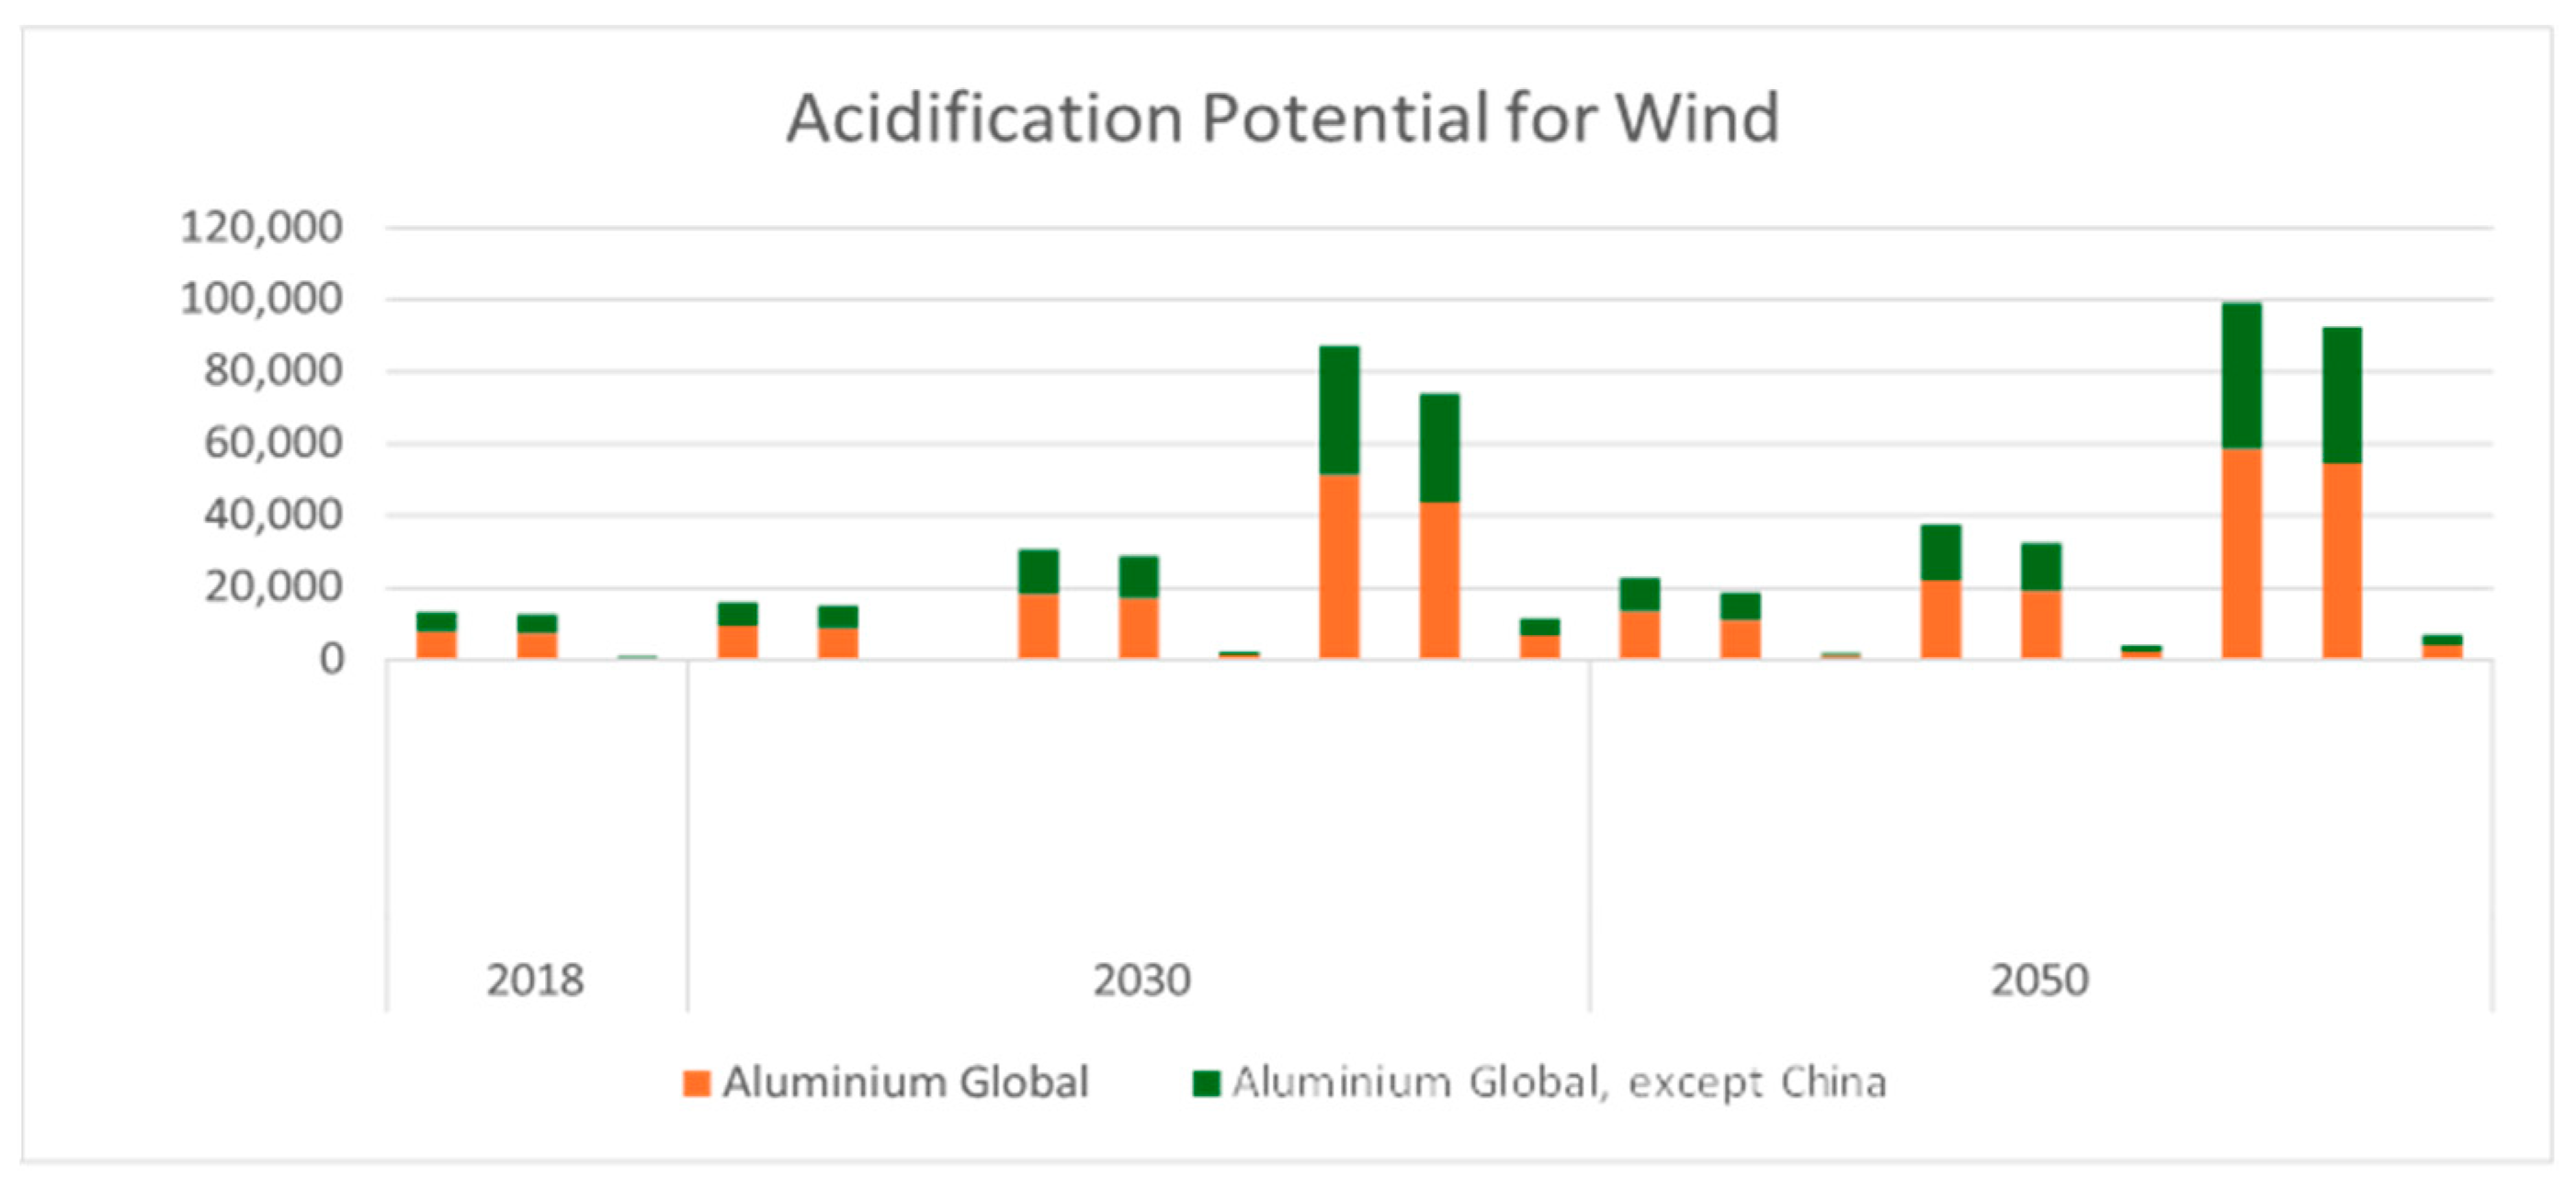
Figure 18.
Comparison of aluminum and copper annual demand forecast quantities between solar and wind across scenarios. Aluminum and copper annual demand forecast quantities are the sum of both onshore and offshore demand forecasts.
Figure 18.
Comparison of aluminum and copper annual demand forecast quantities between solar and wind across scenarios. Aluminum and copper annual demand forecast quantities are the sum of both onshore and offshore demand forecasts.
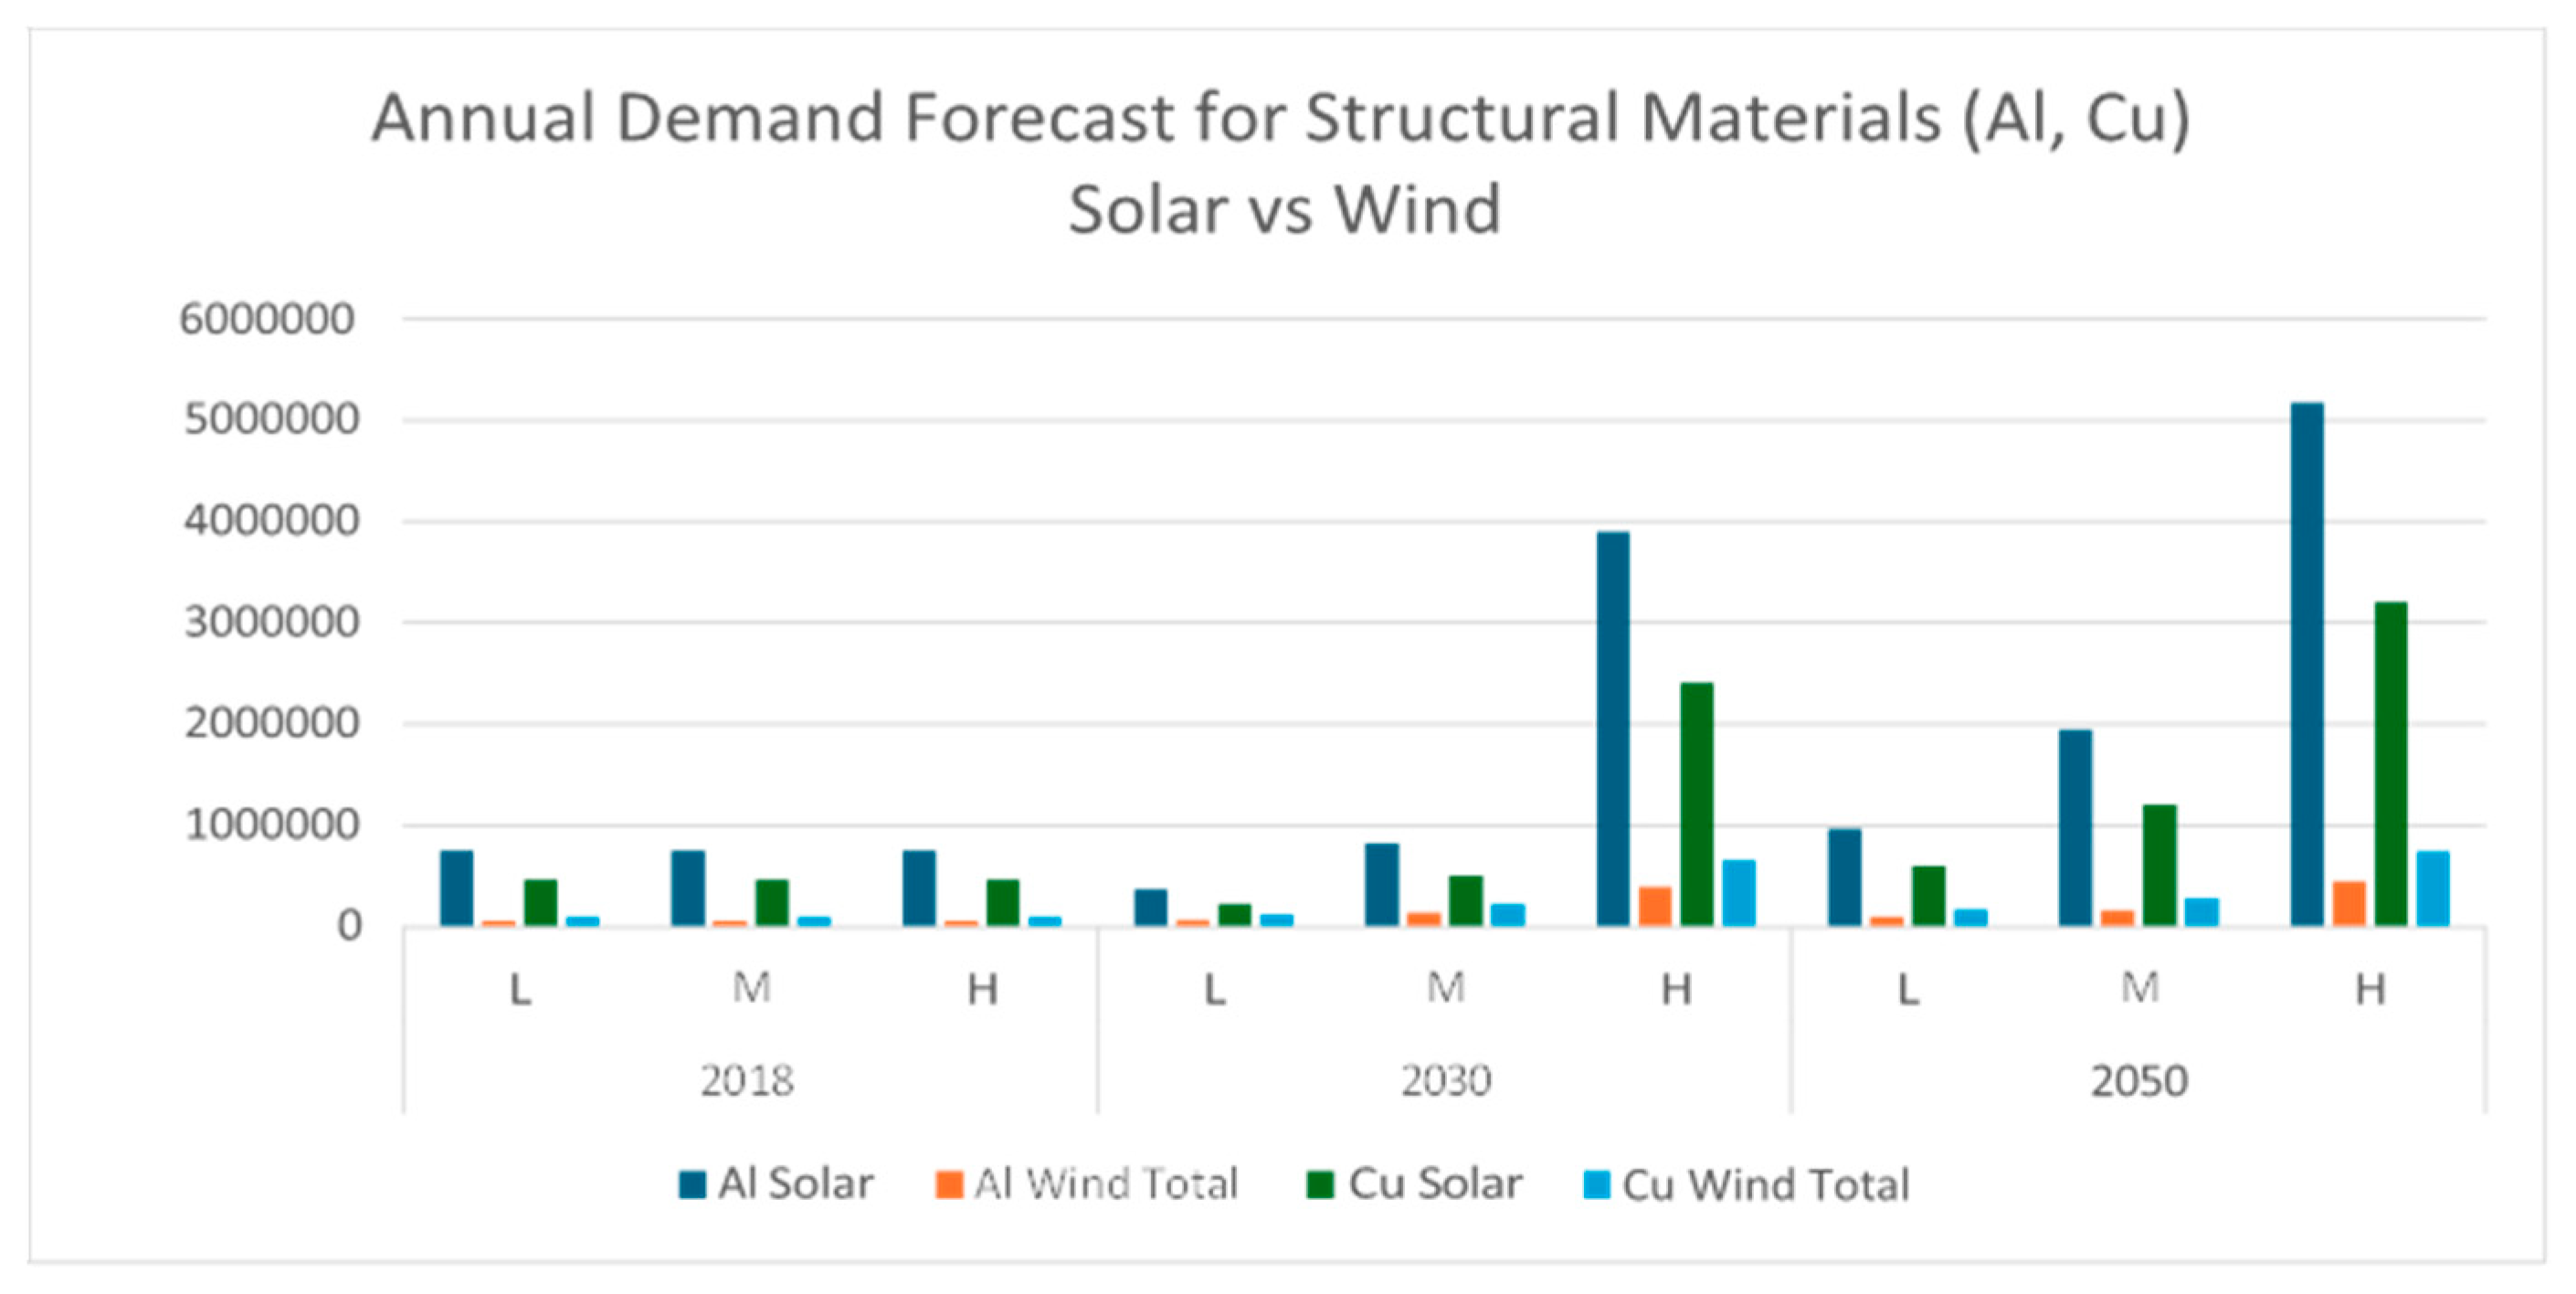
Figure 19.
Comparison of aluminum and copper total annual CO2equivalent emissions between solar and wind across scenarios. Aluminum and copper annual demand forecast quantities are the sum of both onshore and offshore annual CO2 equivalent emissions.
Figure 19.
Comparison of aluminum and copper total annual CO2equivalent emissions between solar and wind across scenarios. Aluminum and copper annual demand forecast quantities are the sum of both onshore and offshore annual CO2 equivalent emissions.
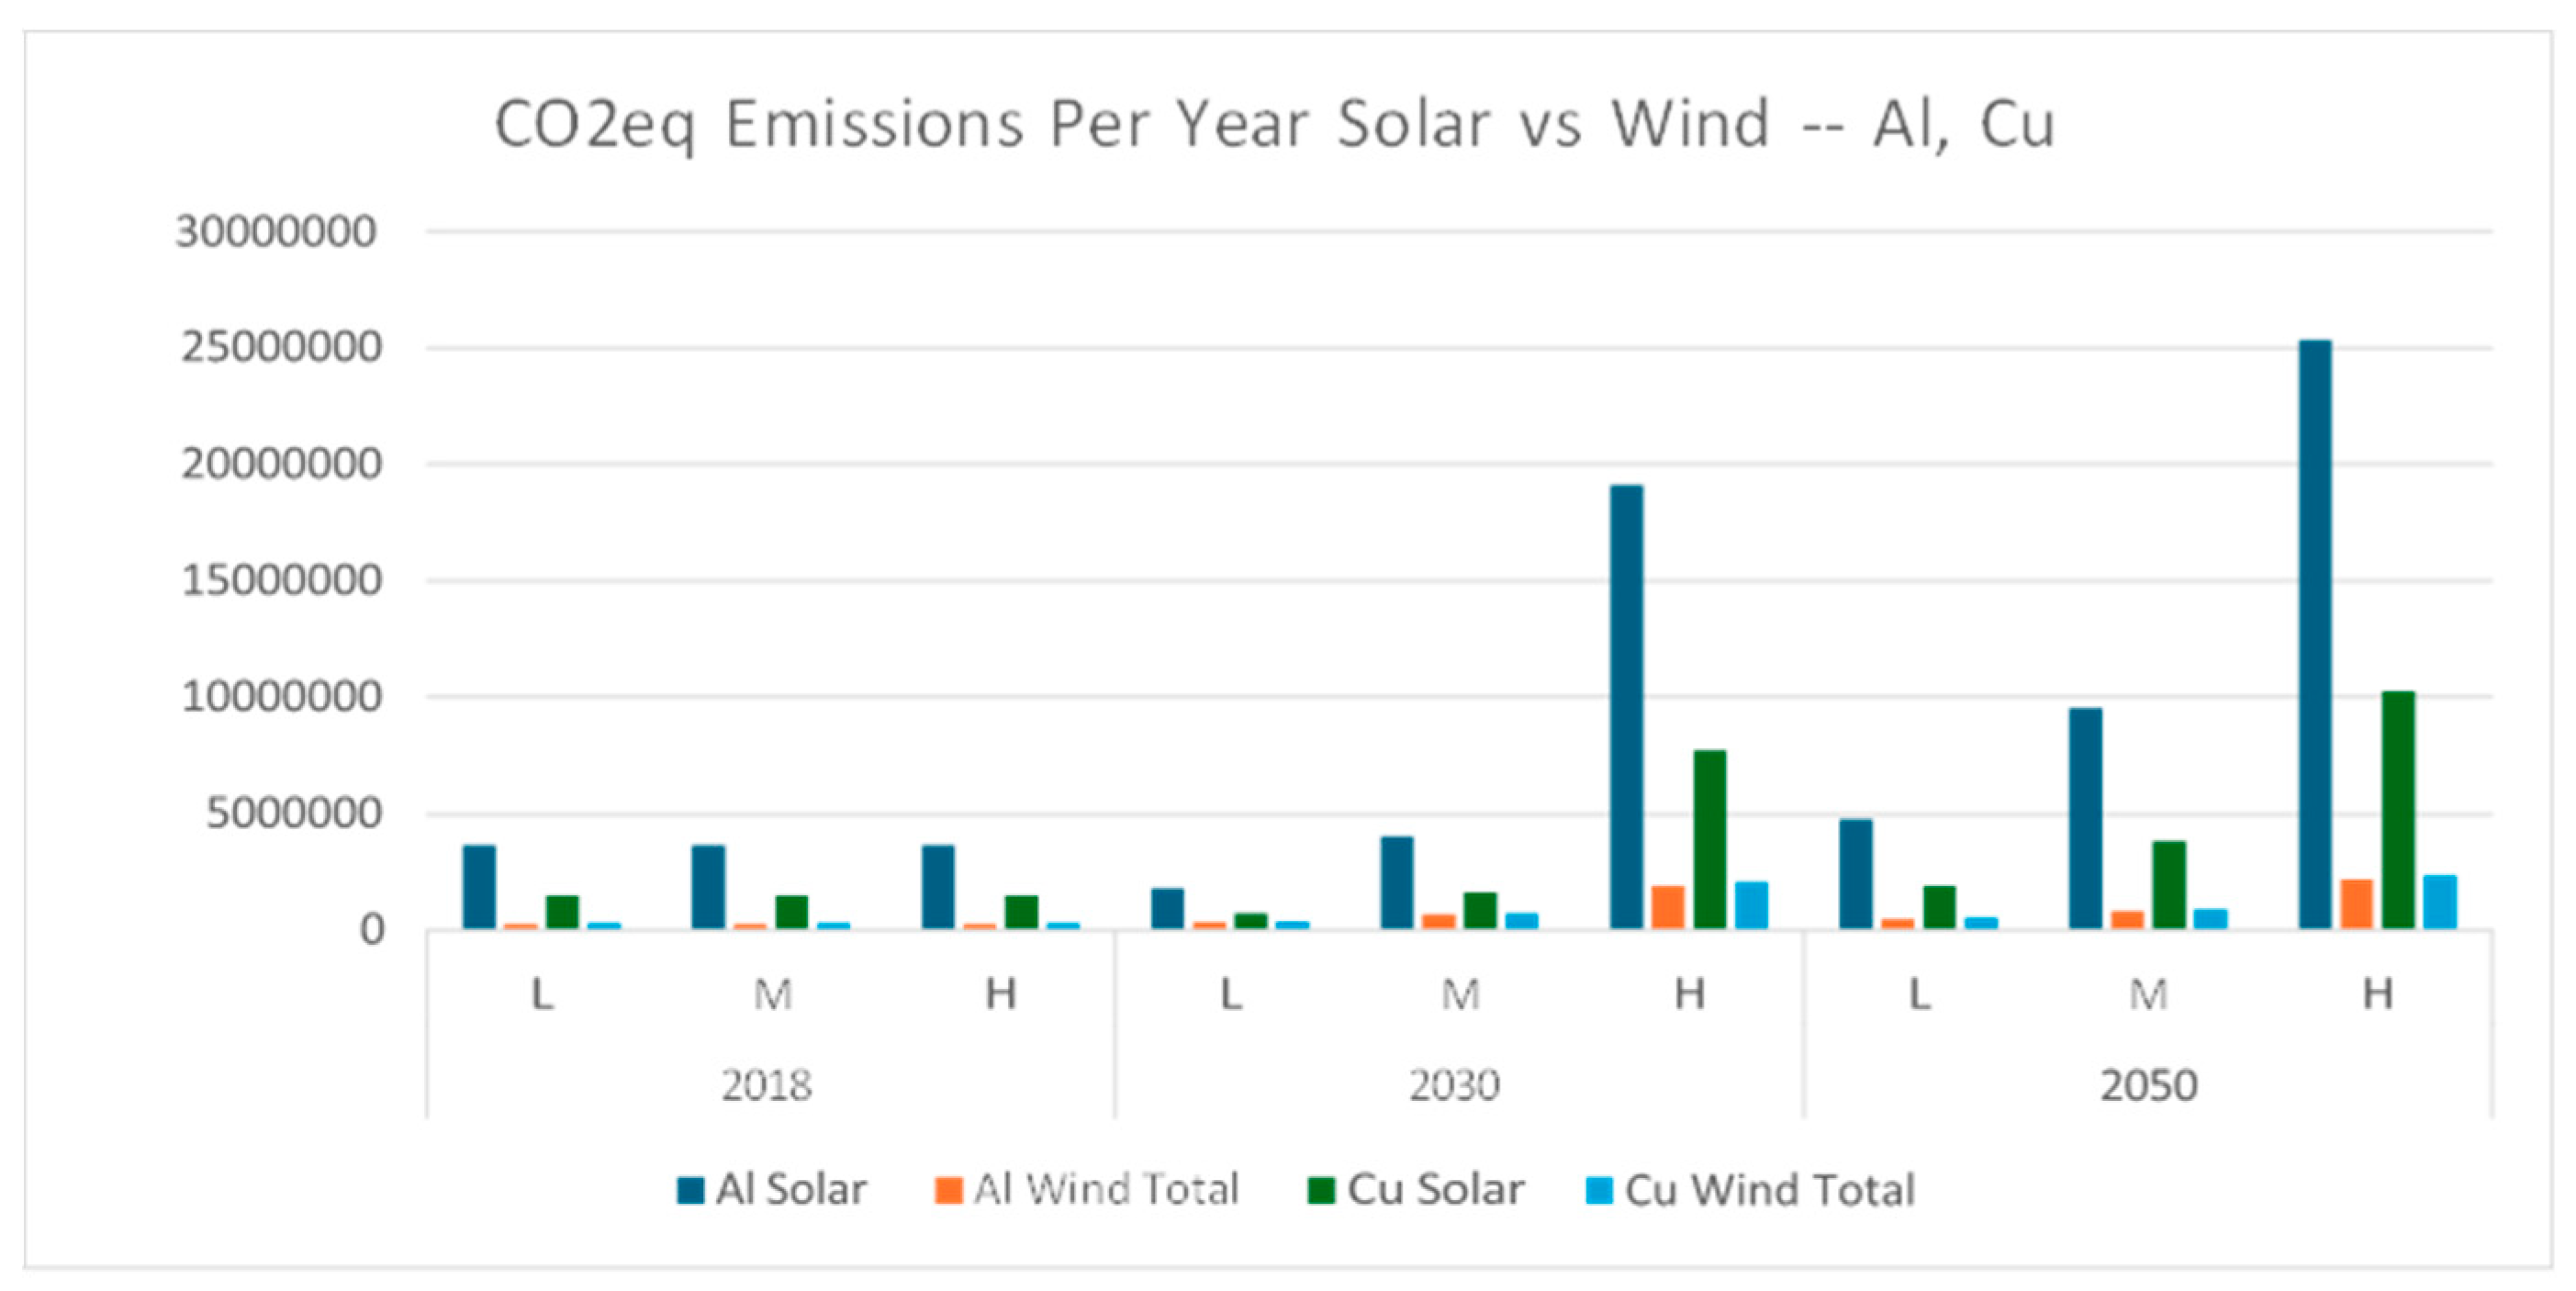
Figure 20.
Change in annual aluminum and copper demand forecasts and change in annual aluminum and copper total CO2equivalent emissions. The number is obtained from dividing quantities of annual demand forecast of aluminum and copper needed in solar by quantities needed in wind. Because both annual demand forecasts and CO2equiavlent emissions are changing at the same rate, only one line represented here for each technology.

Table 2.
Source: Carrara et al. 2020. IEA, 2017. Teske, 2019.
| General Scenario for Wind and Solar | Description | Goal | Source |
|---|---|---|---|
| Low Demand Scenario (LDS) | All scenarios in the ETP report are constructed using a combination of forecasting to reflect known trends in the near term and “backcasting” to develop plausible pathways to a desired long-term outcome. The scenarios should not be considered as predictions, but as analyses of the impacts and trade-offs of different technology choices and policy targets, thereby providing a quantitative approach to support decision making in the energy sector. The ETP scenarios are complementary to those explored in the International Energy Agency (IEA) World Energy Outlook (WEO). LDS is developed given the current technology available. | Pledged to limit temperature increase within 2.7°C | The Energy Technology Perspectives (ETP) 2017 report published by the IEA. |
| Medium Demand Scenario (MDS) | Same as LDS. | 50% chance of limiting average future temperature increases to 1.75°C. | The Energy Technology Perspectives (ETP) 2017 report published by the IEA. |
| Energy sector emissions reach net zero around 2060. | |||
| High Demand Scenario (HDS) | The scenario was set up based on multiple simulations and outputs from various computer models. It is a technical pathway, not a political prognosis. It refers to technically possible measures and options without taking into account societal barriers. Efficiency and renewable potentials need to be deployed even more quickly than in the 2.0°C Scenario (which was not included in this paper), and avoiding inefficient technologies and behaviors is an essential strategy for developing regions in this scenario. | Pledged to limit temperature increase within 1.5°C. | The Institute for Sustainable Futures of the University of Technology Sydney. |
| 100% renewable primary energy in 2050. |
Table 3.
Carbon dioxide emissions for minerals with consistent data available, in terms of tonnes of CO2 equivalent per tonne of minerals. Only copper has consistent data across different countries. All data presented here refer to CO2 emissions from the mining stage.
Table 3.
Carbon dioxide emissions for minerals with consistent data available, in terms of tonnes of CO2 equivalent per tonne of minerals. Only copper has consistent data across different countries. All data presented here refer to CO2 emissions from the mining stage.
| Minerals | Countries of Extraction Sites | Processing Stage | Data Source | CO2eq Emission (tCO2-eq per metric tons of minerals) |
|---|---|---|---|---|
| Iron and Steel | Average of major countries | Mining | IEA (2021) | 0.03 |
| Class 1 Nickel (sulfide) | Average of major countries | Mining | IEA (2021) | 5.3 |
| Lithium Carbonate | Average of major countries | Mining | IEA (2021) | 1.46 |
| Zinc | Average of major countries | Mining | IEA (2021) | 1.18 |
| Aluminium | Average of major countries | Mining | IEA (2021) | 4.9 |
| Cobalt | Average of major countries | Mining | IEA (2021) | 2.09 |
| Copper | Australia | Mining | Northey et al. 2013 | 3.21 |
| Copper | Canada | Mining | Northey et al. 2014 | 1.63 |
| Copper | Chile | Mining | Northey et al. 2015 | 2.4 |
| Copper | Finland | Mining | Northey et al. 2016 | 0.45 |
| Copper | Laos | Mining | Northey et al. 2017 | 2.84 |
| Copper | South Africa | Mining | Northey et al. 2018 | 8.51 |
| Copper | Turkey | Mining | Northey et al. 2019 | 1.07 |
| Copper | PNG | Mining | Northey et al. 2020 | 1.26 |
| Copper | USA | Mining | Northey et al. 2021 | 4.38 |
| Copper | Average of major countries | Mining | IEA (2021) | 3.2 |
| Neodymium Oxide | Average of major countries | Mining | IEA (2021) | 13.2 |
Table 4.
Other environmental impacts, including freshwater eutrophication, freshwater ecotoxicity, water use, and acidification for minerals with consistent data available.
Table 4.
Other environmental impacts, including freshwater eutrophication, freshwater ecotoxicity, water use, and acidification for minerals with consistent data available.
| Other Impacts | Countries | Activity Stage | LCA Studies | Literature Source | Freshwater Eutrophication (kg phosphate-equiv / kg of metal) | Freshwater Ecotoxicity (CTUeco/kg) | Water Use (m³/kg) | Acidification Potential (kg SO2-equiv / kg of metal) |
| Aluminium | Global | Production | Cradle to gate | Nunez and Jones, 2016 | 0.011 | 0.018 | 0.13 | |
| Aluminium | Global, except China | Production | Cradle to gate | Nunez and Jones, 2016 | 0.0053 | 0.01 | 0.09 | |
| Cobalt | Average of major countries | IEA (2021) | 0.0000318 | 0.52 | 0.057 | |||
| Copper | Average of major countries | IEA (2021) | 0.01 | 9.25 | 0.032 | |||
| Rare Earth Elements (REE) | Average of major countries | IEA (2021) | 0.0213 | 538 | 0.635 | |||
| Iron | Average of major countries | IEA (2021) | 0.0006 | |||||
| Nickel | Average of major countries | IEA (2021) | 0.014 | 17.52 | 0.053 | |||
| Lithium | Average of major countries | IEA (2021) | 0.0013 | 5310 | 0.773 | |||
| Silver (from couple production) | Papua New Guinea and Sweden | Refining | Cradle to gate | Farjana et al., 2019 | 1.58 | 330.61 | 5.45 | 6.79 |
| Silver (from combined production) | Papua New Guinea and Sweden | Refining | Cradle to gate | Farjana et al., 2020 | 0.05 | 54.03 | 0.36 | 3.98 |
Disclaimer/Publisher’s Note: The statements, opinions and data contained in all publications are solely those of the individual author(s) and contributor(s) and not of MDPI and/or the editor(s). MDPI and/or the editor(s) disclaim responsibility for any injury to people or property resulting from any ideas, methods, instructions or products referred to in the content. |
© 2024 by the authors. Licensee MDPI, Basel, Switzerland. This article is an open access article distributed under the terms and conditions of the Creative Commons Attribution (CC BY) license (https://creativecommons.org/licenses/by/4.0/).
Copyright: This open access article is published under a Creative Commons CC BY 4.0 license, which permit the free download, distribution, and reuse, provided that the author and preprint are cited in any reuse.


