Preprint
Article

This version is not peer-reviewed.

Forms of Migration of Elements in Natural and Drinking Waters in Village Krasnoshchelye (Lovozero District, the Kola Peninsula) and Human Health Risk Assessment

A peer-reviewed article of this preprint also exists.

Submitted:

09 December 2024

Posted:

11 December 2024

You are already at the latest version

Abstract

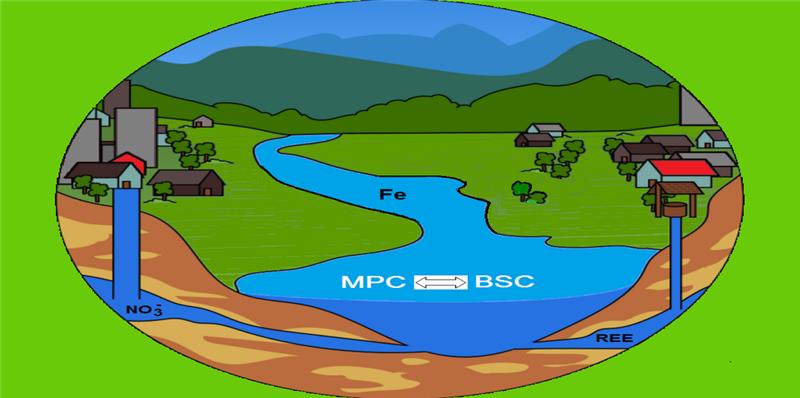
The chemical composition of surface and ground waters of the village Krasnoshchelye (Murmansk region, the Kola Peninsula) have been studied in this work. The quality of surface and ground waters of the village Krasnoshchelye is characterized taking into account the MPC and biologically significant concentration, the forms of migration of elements in the system "solution - crystalline substance" in natural waters and the human body (using the stomach as an example) have been considered. The results of the studies of drinking water in the village Krasnoshchelye indicate that the macro- (Ca, Mg, Na, K) and microelement (Co, Cu, Mn, Ni, V, Zn, Cr) composition have lower concentrations from the standpoint of biological significance for the elemental balance of a person than the recommended level of the lower limit of the BSC, except for the elements U, Th, Y. Their concentration is several times higher than their LLBSC. The forms of migration of elements and newly formed phases depend on both the acidity of the stomach and the amount of gastric juice in the human body, in the "water - gastric juice" system. These are individual characteristics of a person and his age. Well waters can contain up to 50 μg/l of REE, and changes in their migration patterns can lead to accumulation in the human body and cause diseases of the nervous system and other organs.

Keywords: 
;  ;  ;  ;  ;  ;  ;  ;  

1. Introduction

The problem of changing the chemical composition of fresh water and the search for methods to evaluate water quality remains relevant [1,2,3]. Existing methods for evaluating the level of pollution of water bodies with metals and metalloids are divided into three groups: 1) geochemical assessment methods based on the use of comparison of data with average values of their contents in the upper continental crust and regional background concentrations; 2) methods based on the use of standards for content, maximum permissible concentration (MPC). In this case, to evaluate the quality of water, SanPiN 1.2.3685-21 [4] or quality standards for water bodies for fishery purposes are used; 3) methods related to complex pollution indices. The methods help to establish the pollution level based on the classification of a particular index [2]. The idea of the outstanding Russian biochemist N.K. Koltsov about the completeness of drinking water (1912) [5] was reflected in the regulatory documents of Russia in the Sanitary and Epidemiological Rules and Standards [6]. Similar sanitary rules and regulations for bottled water were appeared in the Republic of Belarus and Ukraine [7,8].
The chemical composition of underground and surface waters, sources of drinking water supply is the most important geoecological factor since the chemical properties of water have a direct biochemical effect on the human body and its physiological functions. The waters contain a very large number of elements which, at high concentrations, can have a toxic effect on the human body. It is important to know that both an excess of any element and its deficiency have biochemical significance [9]. The works of V.V. Kovalsky are devoted to the justification of such optimal concentrations for various chemical elements in the geochemical environment. He laid the foundations of geochemical ecology [10]. The work [11] indicates that due to the presence of microelements, drinking water can be both suitable for drinking and useful at the same time. It is proposed to introduce the term "biologically significant concentration" (BSC). This is a concentration at which the intake of an element into the human body with water can affect its overall microelement balance. The lower limit of the BSC (LLBSC) is taken to be the value at which the intake of an element into the body with drinking water is 5% of the total average intake, and the daily consumption of drinking water is taken to be equal to 2 liters for an adult. This paper presents a table of average daily human consumption of elements and lower limits of BSC (LLBSC) [11].
Of great importance in the study of the chemical composition and quality evaluation of drinking water is the study of migration forms of chemical elements since different forms of migration of the same element can have different effects on the human body due to their different toxicity [3,9,12,13].
Previously, the authors of the proposed work have investigated the influence of the chemical composition of the rocks of the Lovozero Massif on the change in the chemical composition of natural waters that are formed within this massif and its immediate northern border, depending on the composition of the rocks, the catchment area and anthropogenic influence. These objects were studied using modern precision methods of analysis (ICP-MS, etc.). Physicochemical modeling was also used, namely the software package (SP) “Selektor” [14]. The results of the studies of drinking waters of the village of Lovozero have showed that these waters do not have a balanced, complete composition. This water cannot be considered physiologically complete in terms of the content of the main macro- and microelements and the amount of total mineralization, both in its original natural state and at the time of delivery to the consumer. As a result of water treatment, the chemical composition of the water changes depending on the reagents used, but this does not bring the chemical composition of the water closer to the standards for bottled water [16,17].
The issue of the need to revise the MAC for some elements, Sr, Na and anions HCO3-, Cl-, SO42-, NO3- for full value and bottled waters and the introduction of regional standards for the study area was also raised there.
The Lovozero district, where the indigenous population lives, is a risk area in terms of cities and districts of the region. There is a significant excess of the average Russian indicators of urolithiasis, circulatory system diseases, malignant neoplasms and gastrointestinal tract diseases (stomach ulcer and duodenal ulcer, gastritis, duodenitis) [18,19]. Maintaining the health of the small indigenous population is a very important task. The purpose of the work is to evaluate the quality of surface and groundwater in the village Krasnoshchelye taking into account the MAC and LLBSC and the form of migration of elements in the system "solution - crystalline substance" in natural waters and the human body (using the stomach as an example), and compare with the composition of other waters in the Murmansk Region.
The village Krasnoshchelye is located in the Lovozero district of the Murmansk region. It is the third largest settlement in the district with a small population (a little over 400 people). The distance from the district center is 140 km. The village Krasnoshchelye is located on the left bank of the River Ponoy, 157 m above sea level. The main enterprise is the agricultural reindeer herding cooperative "Olenevod". Fishing, hunting, and picking mushrooms and berries are of great importance to the villagers. The village Krasnoshchelye is home to the indigenous population of the Kola North, the Izhma Komi and the Sami. People use water from non-centralized water supply systems, i.e. wells (Figure 1).

2. Materials and Methods

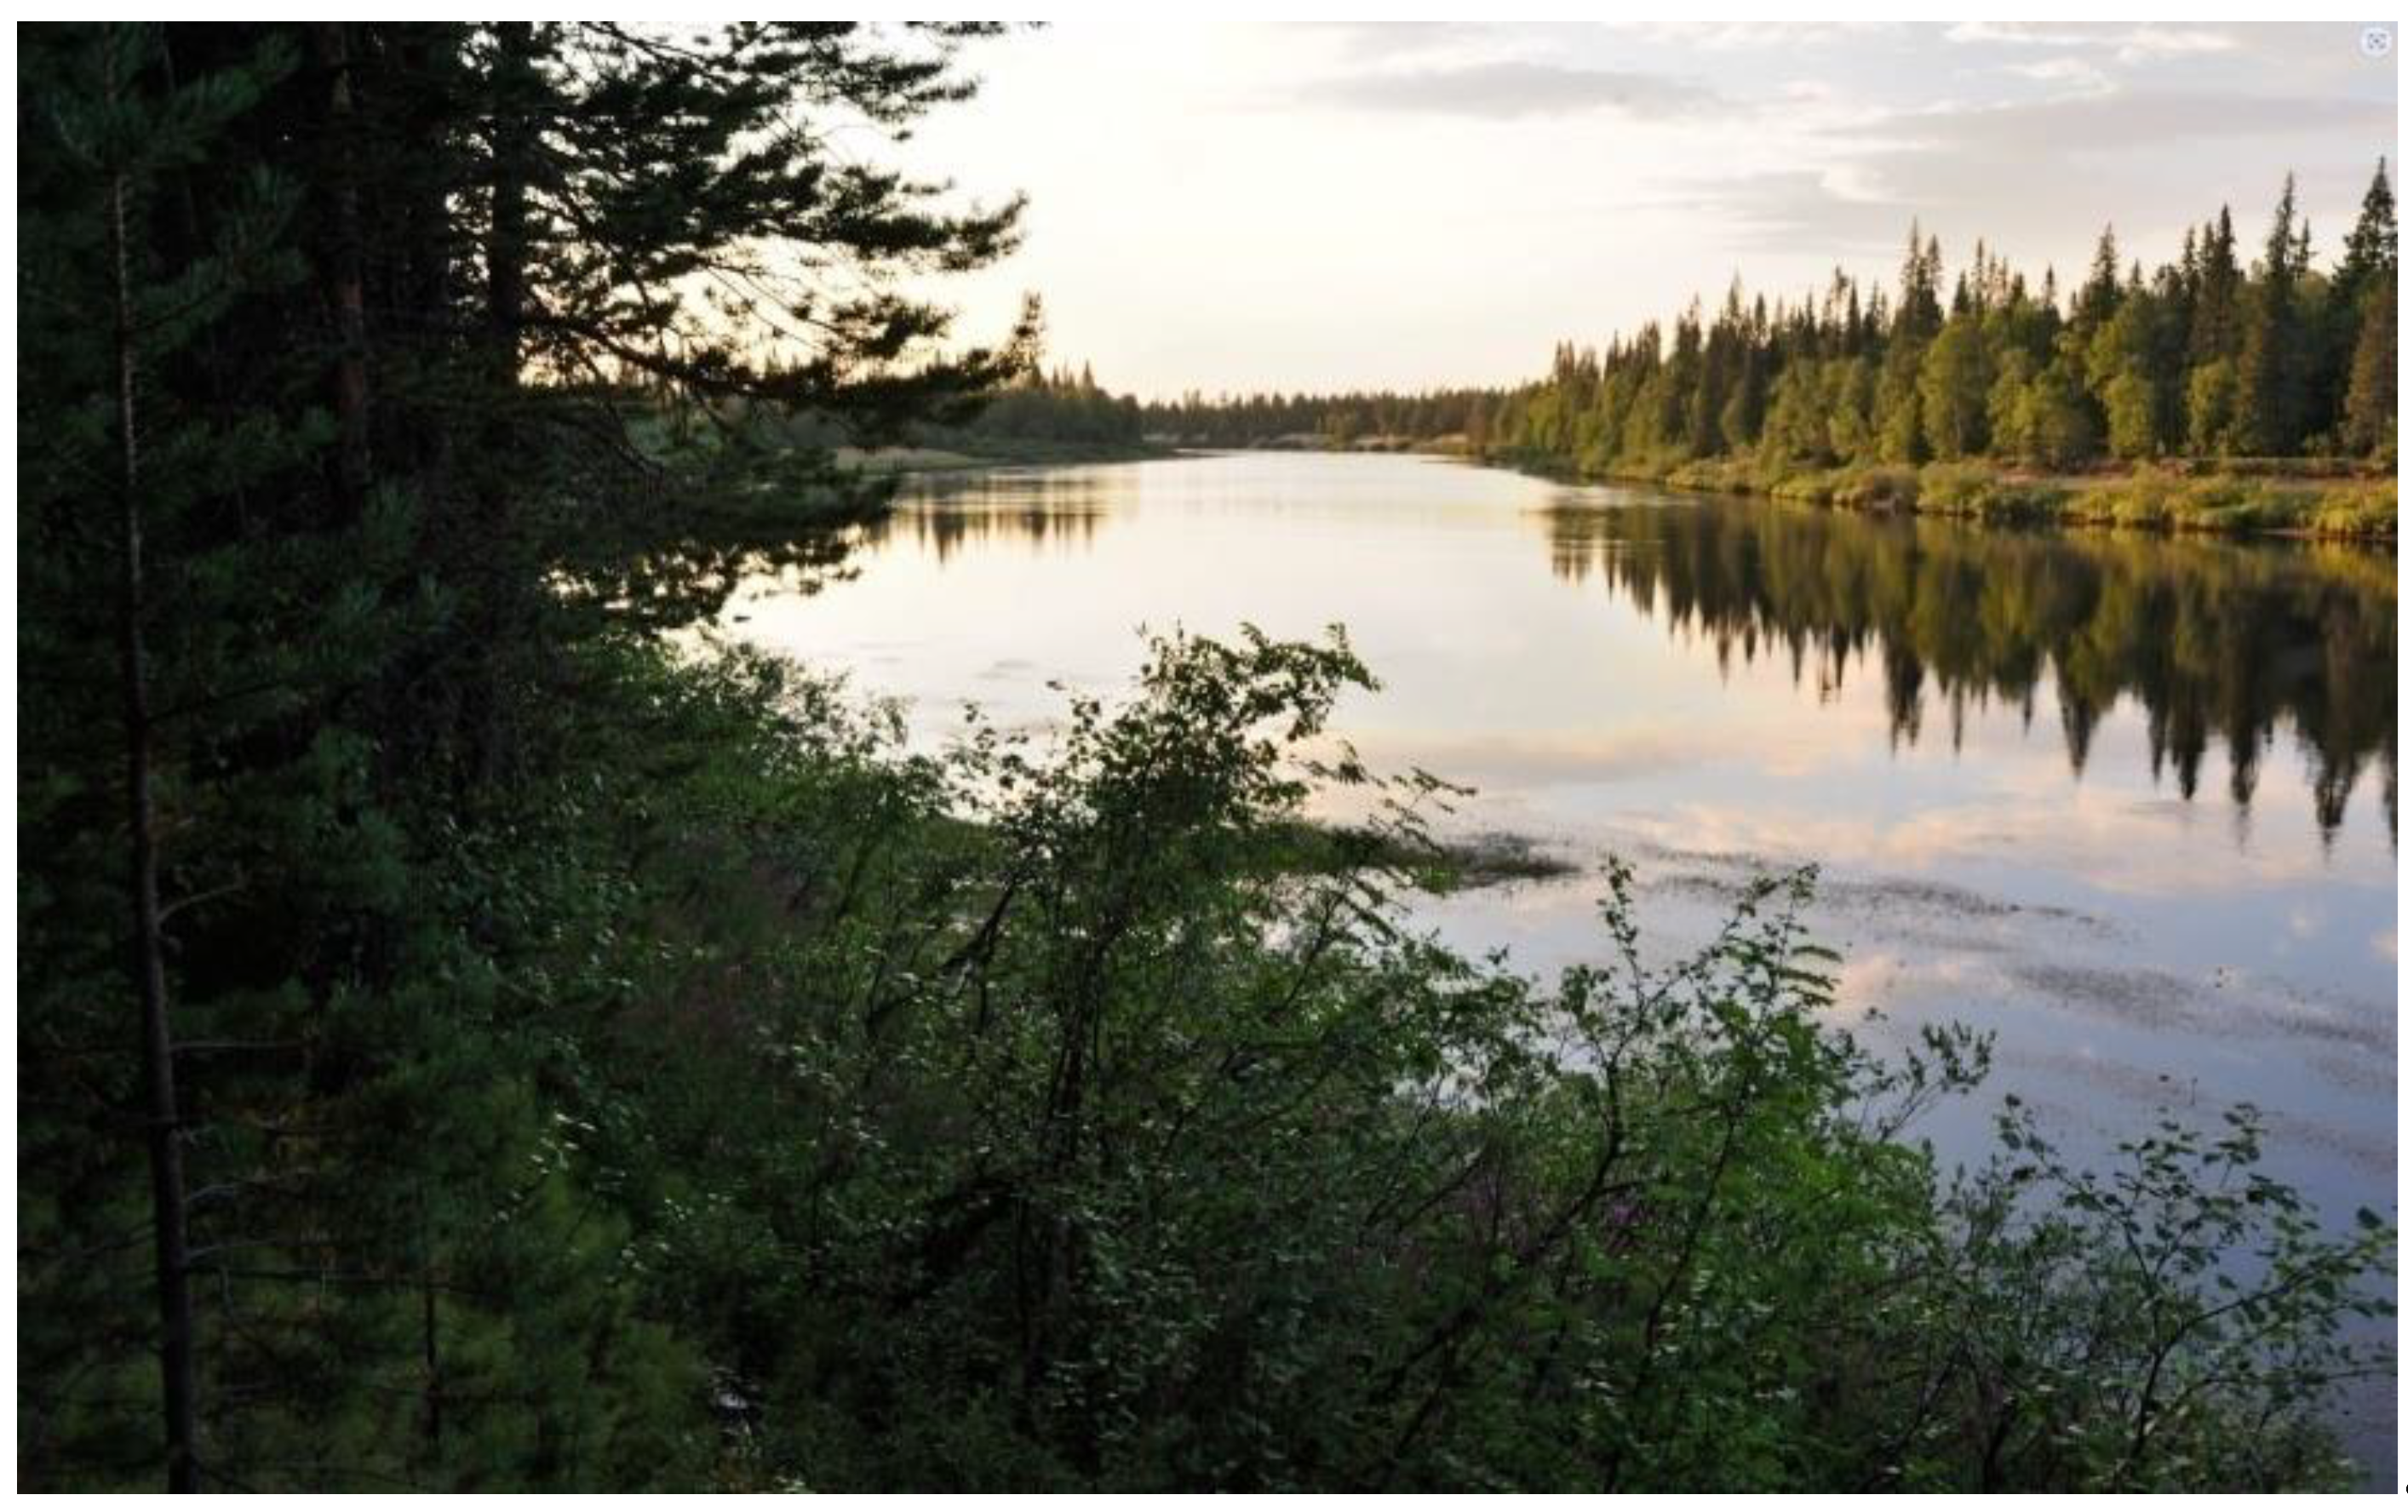
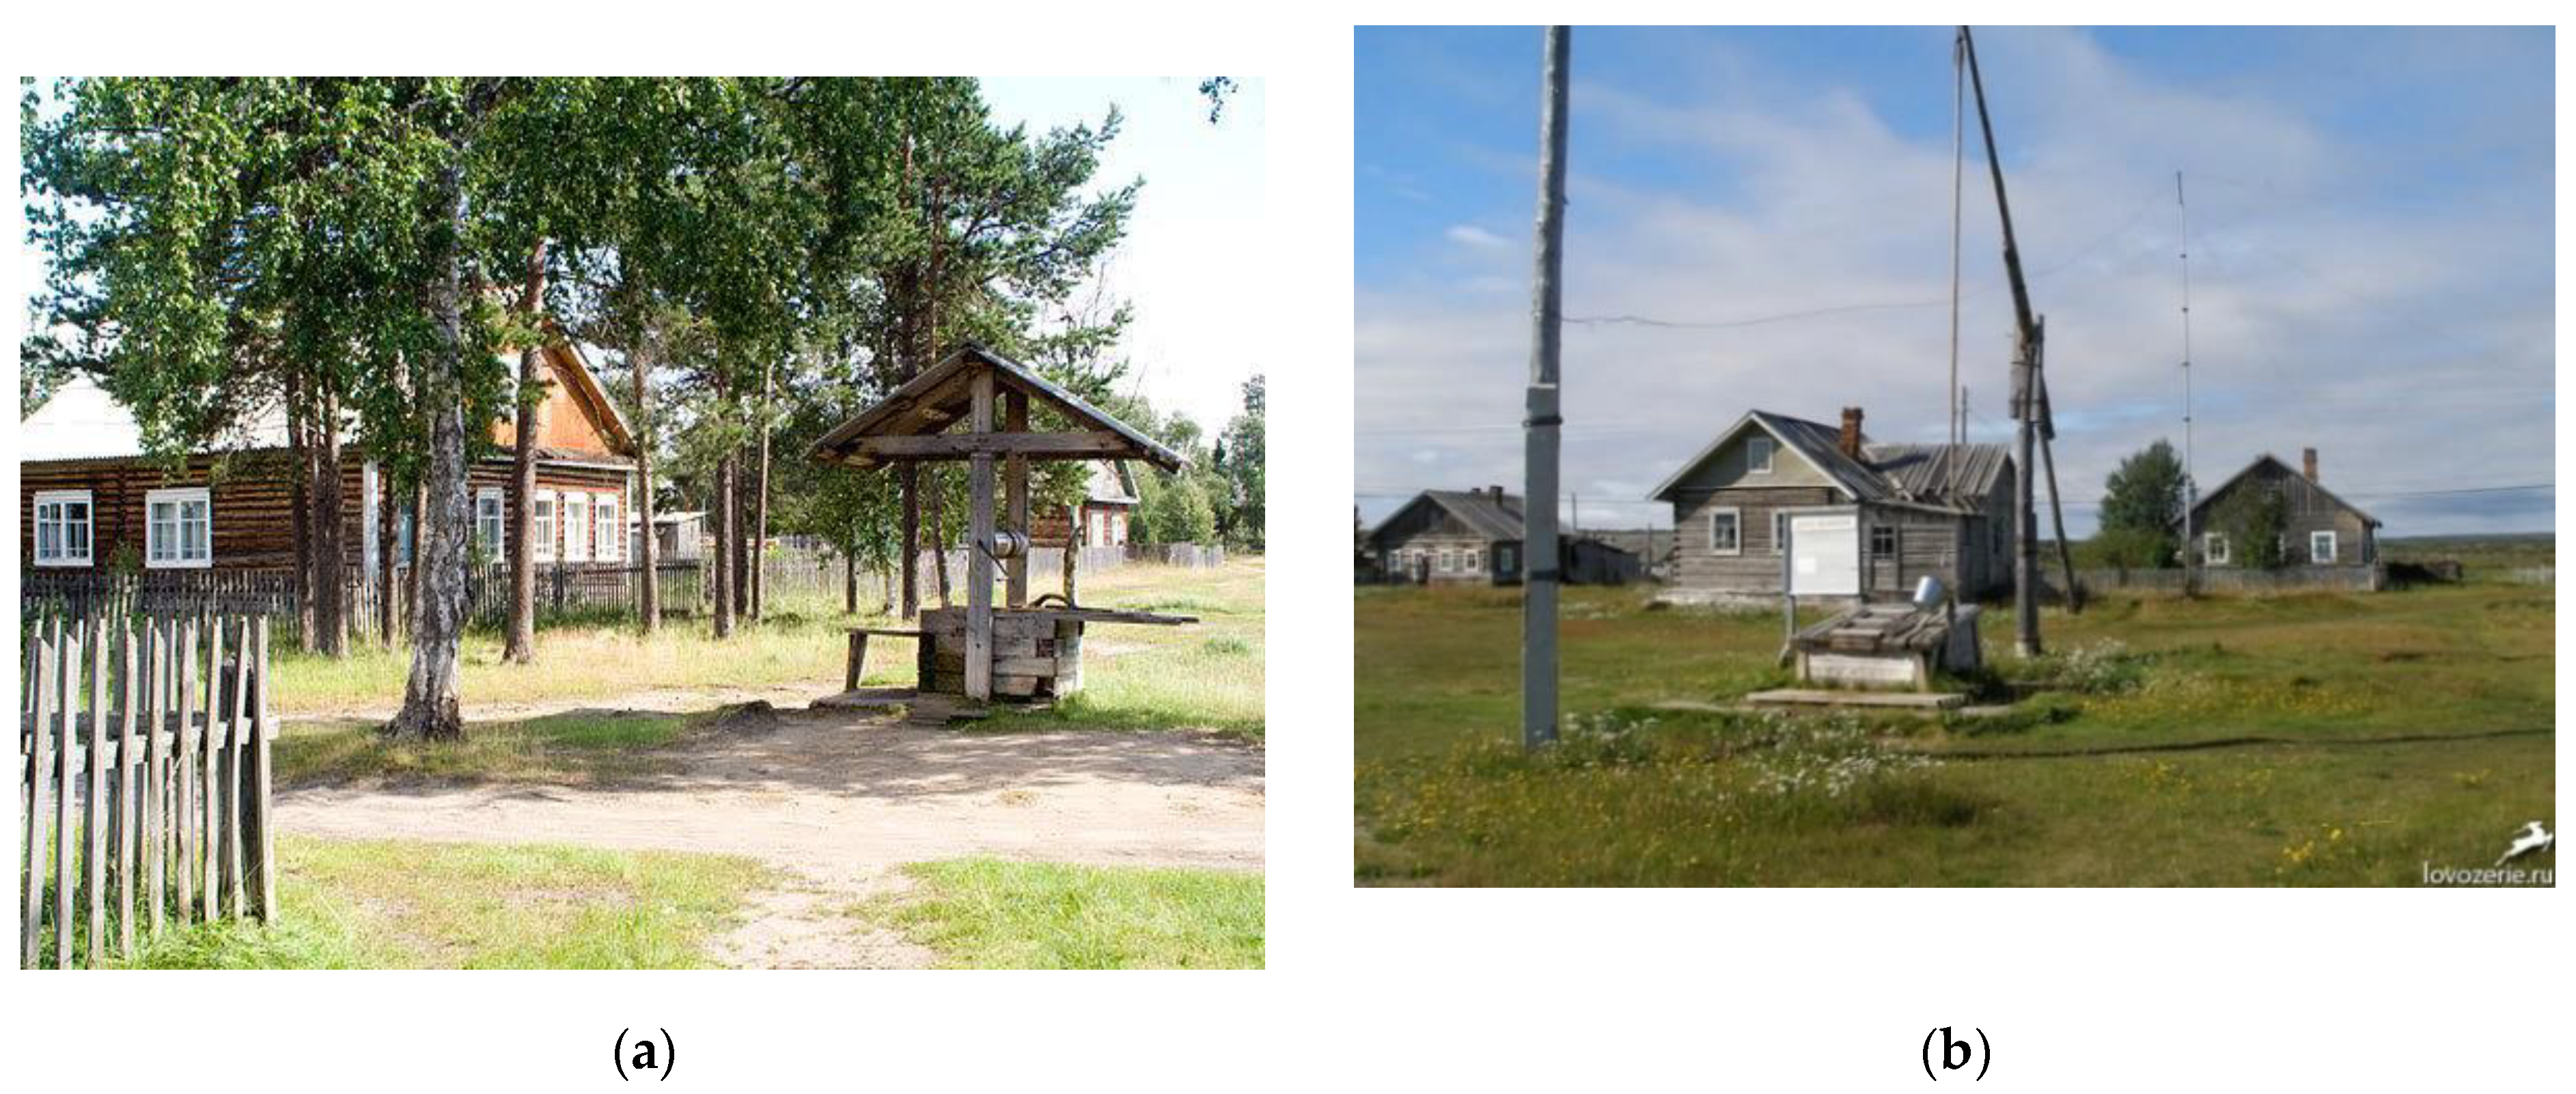
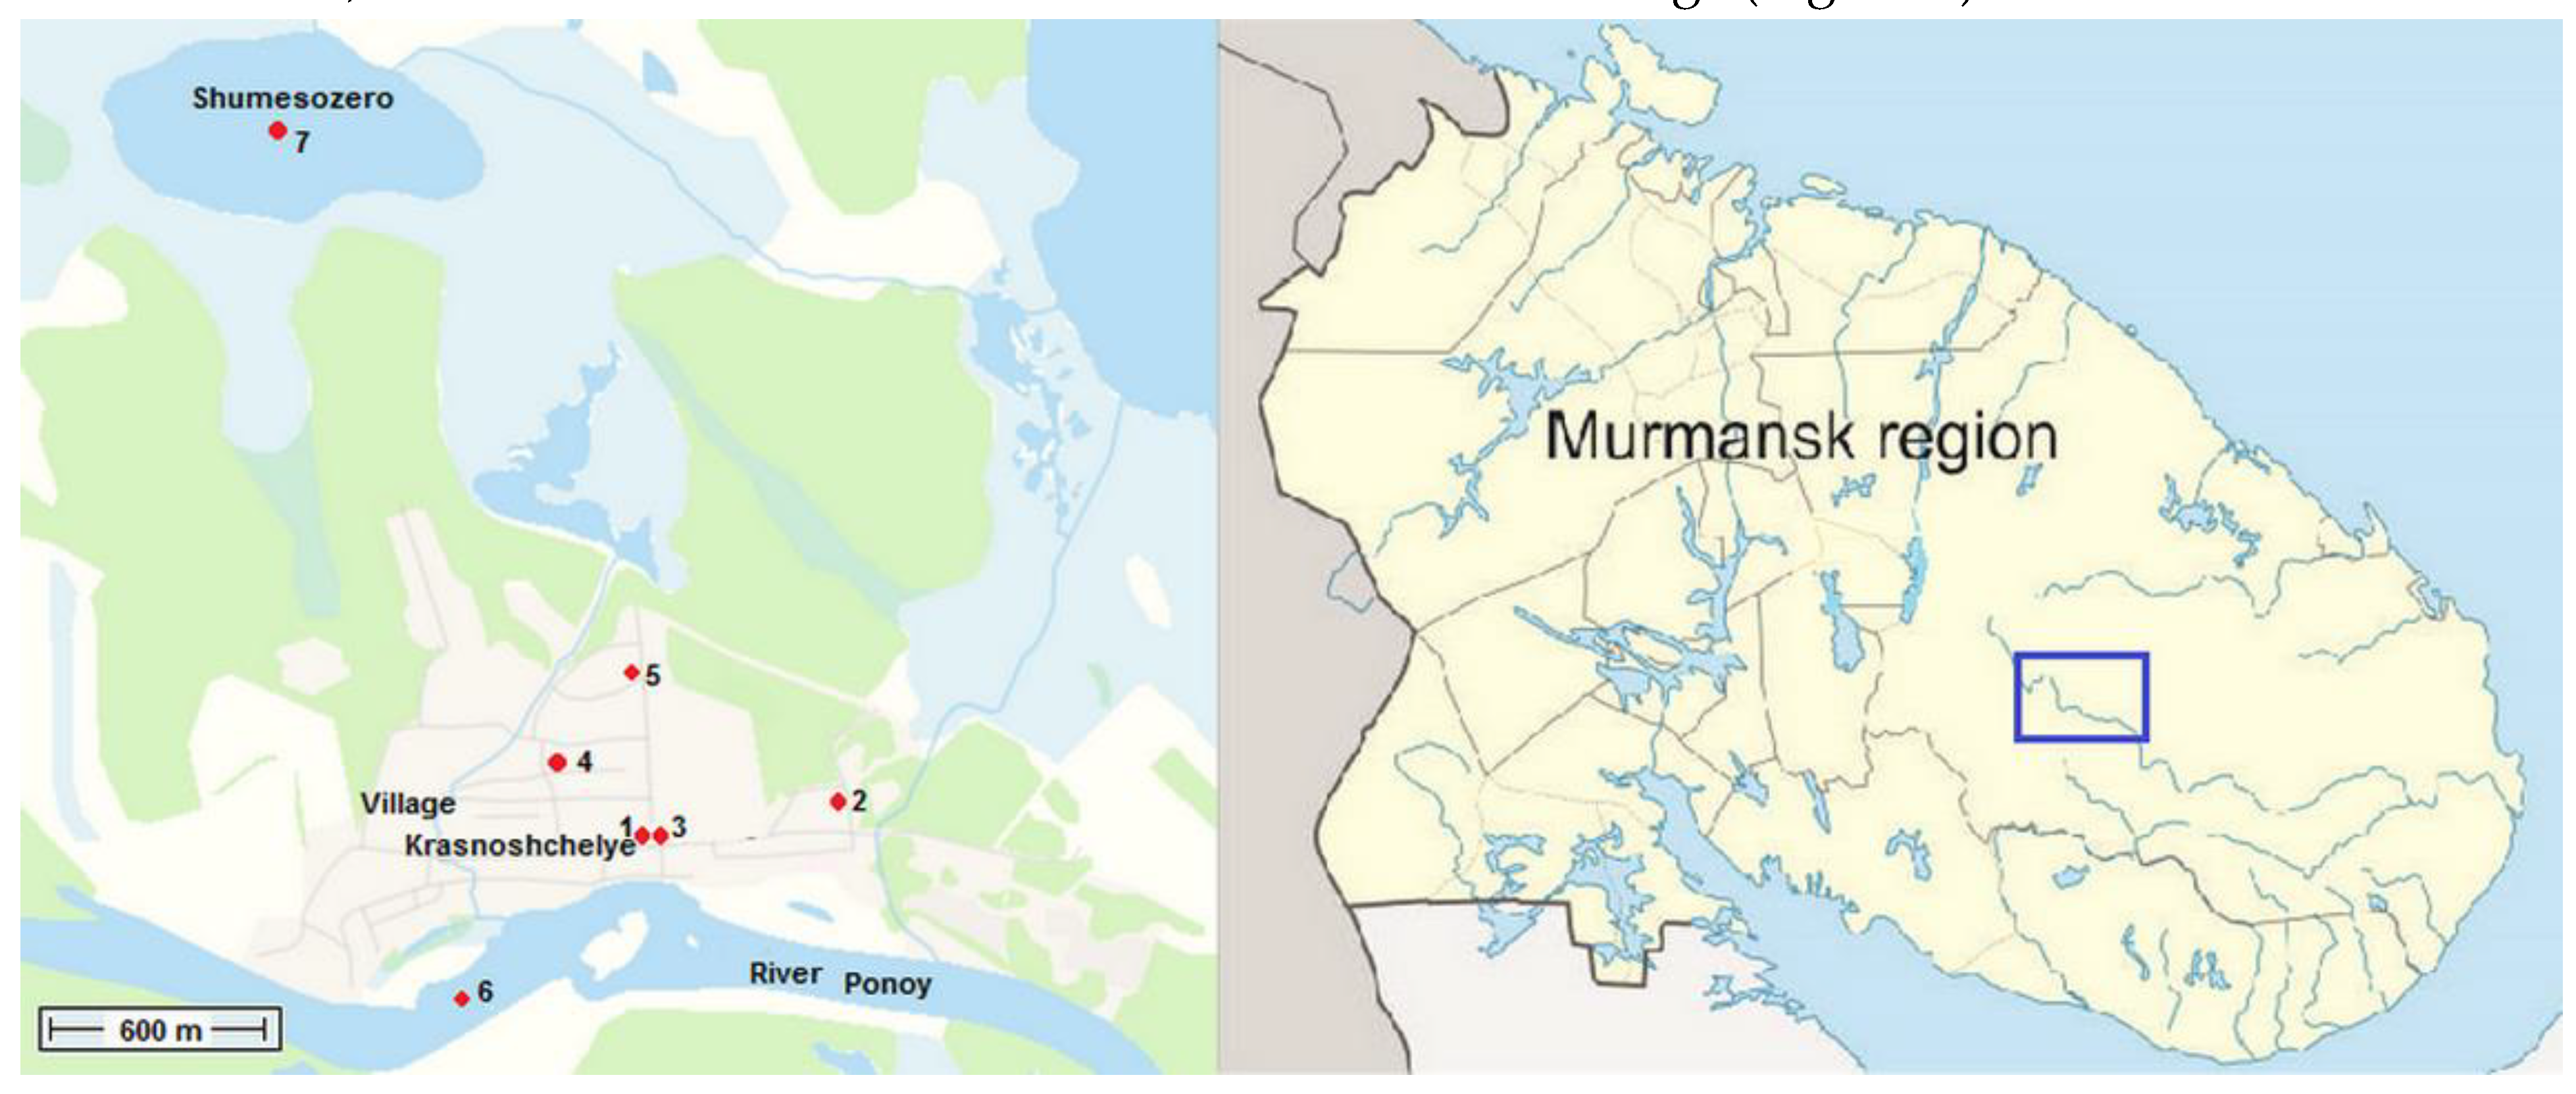
2.1. Research Objects

The objects of the study were surface water (the River Ponoy and the Shumesozero) and underground water from wells in the village Krasnoshchelye. The Ponoy River is the largest river on the Kola Peninsula. The river originates in the center of the Kola Peninsula, flows eastward and flows into the White Sea. The length of the main channel is 426 km, the drop in level from the source to the mouth is 292 m. Three characteristic sections are distinguished near the River Ponoy: the upper section is a swampy plain from the upper reaches of the River Ponoy to the confluence of the River Losinga (211 km from the mouth); the middle section is the section to the confluence of the River Kolmak (211-100 km from the mouth), where the River Ponoy enters the boundaries of the crystalline plateau and gradually forms its valley; a gorge forms in the lower section from the Kolmak to the mouth of the River the Ponoy. The upper section is the longest (214 km). The source of the River Ponoy lies on the western spurs of the Upland Keivy, at an altitude of 292 meters above sea level. The river bed is characterized by strong sinuosity, divided into branches and channels. The river valley is conditional, and The River Ponoy spills over the swamps during a flood. When the River Sakharnaya flows into the River Ponoy, the River Ponoy widens to 50 meters. Alluvium brought from Keivy accumulates along the banks. Alluvium frames the Ponoy River with a kind of dam, on which trees grow.
Figure 1. The River Ponoy near the village Krasnoshchelye (https://wikimedia.org).
Preprints 142329 g002
When the tributaries Tichka, Kuksha and Eljoka flow into the River Ponoy, the river reaches 100 meters in width and 3 meters in depth and approaches the first settlement, Krasnoshchelye (288 km from the mouth). The Shumesozero is located in the north of the village Krasnoshchelye.
Sampling of natural waters was carried out in April 2024 from the River Ponoy, the Shumesozero, and from wells located on different streets of the village (Figure 3).

2.2. Research Methods

The analysis of water samples included determination of pH, Eh, alkalinity, anionic composition (Cl-, SO42-, NO3-, F-, HCO3-, PO43-) and NH4+ using titrimetry and potentiometry methods, liquid analyzer Ekspert-001 (Econix-Expert, Moscow, Russia). Elemental analysis was performed using inductively coupled plasma mass spectrometry with an ELAN 9000 DRC-e instrument (Perkin Elmer, Waltham, USA). Multielement solutions ICP-MS-68A (Solution A and Solution B) (High-purity Standards, Charleston, USA) were used for calibration of the device. The accuracy of the analysis was controlled using standard samples STOK-16, STOK-10 (Inorganic Ventures, Christiansburg, USA), CRM-SOIL-A and CWW-TM-A (High-purity Standards, Charleston, USA. Fluorine concentration was determined using direct potentiometry, ion meter I-160 MI, (ZIP, Gomel, Belarus) (performer E.A. Krasavtseva).

2.3. Software and Thermodynamic Dataset for Modeling

Thermodynamic modeling was performed using the software package “Selektor”, version 3.01 (Vinogradov Institute of Geochemistry SB RAS, Irkutsk, Russia). The software package implements the Gibbs energy minimization method based on the convex programming approach [20,21]. The selector has built-in thermodynamic databases [20,21,22,23,24,25,26,27,28,29].
To solve the problem, a physical-chemical (PCM) model of the interaction "water-rock" was developed. It is adapted to the conditions of the Murmansk region and helps to evaluate the environmental situation if there is a natural or anthropogenic influence in it. The physicochemical model includes 47 independent components (Al, B, Br, Ar, He, Ne, C, Ca, Cl, F, Fe, K, Mg, Mn, N, Na, P, S, Si, Sr, Cu, Zn, Ni, Pb, V, Ba, U, Ag, Au, Co, Cr, Hg, As, Cd, Mo, Se, La, Ce, Zr, H, O, ē), 1174 dependent components: 546 of them are in aqueous solution, 76 are in the gas phase, 111 are in liquid hydrocarbons, 440 are in solid phases, organic and mineral substances.
The set of solid phases of the multisystem was formed taking into account the mineral composition of the rocks of the Baltic Shield [16,17]. In this work, the SP is used for modeling in the system “water - atmosphere”, “water - rock - atmosphere”, “solution - crystalline substance” where the solution is a mixture of drinking water and gastric juice.
The boundary conditions of the model are the amount of water (1000 kg), 1 kg of atmosphere, temperature 20°C (temperature when performing chemical analyses) and 38°C (average temperature of the organ, the stomach).

3. Results and Discussion

Analysis of the results of the chemical composition of well water by macrocomponents (groundwater) shows the content, mg/L: Ca (2.6-12.8), Mg (0.83-2.04), Na (2.4-6.9), K (0.83-7.0), NO3- (11.3-31.8), Cl- (2.3-10.2). For some microcomponents, mg/L: Se (0.0019-0.0027), U (0.00001-0.00008), Th (0.00001-0.00010), Li (0.00023-0.0012), Fe (0.008-0.26), Cu (0.00020-0.0015), Ni (0.00030-0.0018), Y (0.00032-0.016). The pH values in wells range from 5.38 to 6.94 (the permissible range is 6.5-8.5 [6]), in surface waters is 6.38-6.45. The concentration of nitrates in the River Ponoy is 0.35 mg/L. This corresponds to background concentrations in the waters of the River Vudyavryok (0.3 mg/L) in the Apatity-Kirovsk district of the Murmansk region [30]. The nitrate content in wells is tens of times higher, which indicates their biogenic or man-made intake, but does not exceed the MAC which is 45 mg/L [4]. It should be especially noted that the nitrate ion contains a nitrogen atom in the maximum oxidation state of +5 and is highly toxic [3,31]. High concentrations of nitrates contribute to children developing a blood disease called metaglobinemia, and nitrate derivatives in the body (nitrosamines) have carcinogenic properties [9]. According to [6], the concentration of nitrates in bottled waters should not exceed 20 and 5 mg/L for waters of the first and highest categories, respectively. The latter indicates clearly overstated MPC values and high concentrations of NO3- in wells.
The iron concentration is 1.7 mg/L and exceeds the permissible value in surface waters (the River Ponoy and Shumesozero); Its concentration does not exceed 0.3 mg/L (MPC 0.3 mg/L; LLBSC 0.375 mg/L) in wells [3,4].
Analytical data and modeling results of the chemical composition of the River Ponoy and well waters (st. Severnoe siyanie (Figure 3, point 5, Table 1)) indicate higher concentrations (several times) of the elements Ca, K, Na, Ba, Sr, Ce, La, Pr, Y, Cl, Zr, Cu, Co, Zn in the well water. This can be explained by the "water-rock" interaction. Note that the predominant forms of lanthanide migration are nitrates, and in the well waters they are 2 orders of magnitude higher than in the surface waters (the River Ponoy).
The concentrations of Li and Be in the River Ponoy are significantly higher than in the well. This is most likely due to lithium and beryllium deposits in Keivy where the river flows. The high iron content in the river can be explained by the influence of swamps. Thus, the chemical composition of the water is the result of water-rock interaction. It reflects the history of the region and biogenic or technogenic influence.
Data analysis (Table 1) shows that such important metals from the standpoint of biological significance for the microelement balance of humans as Co, Cu, Mn, Ni, V, Zn, Cr have a lower concentration than the recommended LLBSC for them. Macroelements (Ca, Mg, Na,) also have concentrations below the LLBSC. All this can lead to a violation of the micro- and macroelement balance in the human body and cause various diseases. We especially pay attention to the fact that the detected concentrations of U, Th, Y in wells are several times higher than their LLBSC.
Table 2 shows the composition of the phases that saturate the waters of the well and the River Ponoy at temperatures of 3°C and 20°C. The predominant phases in the River Ponoy are goethite and amorphous silica. This corresponds to the influence of the swamps and the weathering of the Keiv rocks on the chemical composition of the water. Silica predominates at 3°C in the well waters.
The concentrations of Y, La, Ce, Sr, Li, Be in the River Ponoy and the well exceed the concentrations of these elements in the waters of the Central'nyy water intake (Kirov) [15] and in the tap waters of Murmansk [32].
In order to establish the connection between the elemental composition of the organism and the ecological and geochemical conditions of the studied area, within the framework of the RFBR grant in 2018, we have developed a model of the stomach environment based on literary sources. Using modeling (PC "Selektor"), the qualitative and quantitative composition of the "solution - crystalline substance" system was studied taking into account environmental conditions and physiological indicators of the human body. In this case, the solution is natural drinking water, gastric juice, a mixture of drinking water and gastric juice, and the crystalline substance is the newly formed phases in equilibrium with the solution [33]. The interaction of gastric juice (GJ) with water essentially leads to the emergence of a geochemical barrier, i.e. the appearance of such physicochemical parameters when there is a sharp change in conditions and concentrations of elements, when solid phases can precipitate. This is a zone in which one geochemical environment is replaced by another [34]. Physicochemical modeling of the system “natural waters – gastric juice” was carried out under conditions of low acidity (pH = 6.24, Eh = 0.218 V, C(Cl-) = 2285 mg/L) with 100 and 10 mL of gastric juice with different amounts of well water (T 38°C). Such conditions are possible in elderly people, children and a number of sick people. Figure 4 shows changes in pH, Eh, migration forms (using Nd as an example) and the composition of newly formed phases depending on the degree of interaction ξ (from 10-6 to 10-3).
Analysis of the results indicates that if there are 100 mL (Figure 3a) or 10 mL of gastric juice (Figure 3b) in the stomach at the time of water intake, then as its volume increases, the acidity and oxidation-reduction conditions in the stomach will change. A water volume of more than 200 mL (ξ=3.7) will lead to positive Eh values and to a change in the forms of lanthanide migration (shown using the example of Nd, Figure 3 g), the appearance of NdNO32+ instead of Nd3+, a change in the qualitative and quantitative composition of the phases and the appearance of illite, FeO(OH), and the disappearance of apatite (Figure 3e). Considering that the waters of wells in the village Krasnoshchelye can contain up to 50 mg/L of rare earth elements (REE), changes in their migration patterns can lead to accumulation in the human body. For REEs, except for yttrium, no BSC or MPC have been established, but their presence in the body can cause a number of diseases, including those of the nervous system [35,36,37]. An evaluation of the elemental status of children in the village Lovozero (also located in the Lovozero district) confirmed the presence of REE in the children's hair [35]. The drinking water studied in the wells of the village Krasnoshchelye also contains rare earth elements.
Changes in oxidation-reduction conditions will affect the behavior of other polyvalent elements, such as Cu, Fe, U, Al, V, etc. Uranium will transform from a 4-valent form (UO2) to 6-valent forms: UO22+, UO2OH+ and UO3. The valence of uranium is of great importance for the body since up to 20% of hexavalent uranium accumulates in the kidneys, 10-30% in the skeleton, and a small amount is deposited in the liver. Up to 50% of tetravalent uranium accumulates in the liver and spleen; up to 10-20% is deposited in the bones and kidneys. In bone tissue, uranium is deposited on the surface of the smallest hydroxyapatite crystals as a result of the ion exchange of two Ca2+ ions for one UO22+ ion. Each UO22+ ion binds tightly to two adjacent phosphate groups on the crystal surface and releases two Ca2+ ions. The form of uranium compound in bone tissue is apparently otenite Ca(UO2)2(PO4)28H2O. Uranium is not part of the crystalline structure of apatite, but is adsorbed on it. It has been established that the uranium content in fish bones is tens of times higher than in muscles [36].
Vanadium from the migration form VO+ passes into HVO42- and H3VO4. Barium, yttrium, nickel, lead, and boron migrate as Ba2+, Y3+, Ni2+, Pb2+, and H3BO3. The sum of the ratios of the concentrations of components detected in water to their MAC values should not be greater than 1 in order to avoid an amplifying effect, the summation effect. This principle is applied to substances with the same type of toxic action mechanism: barium and strontium are nerve and muscle poisons; barium and boron together have a negative effect on the reproductive function of the body [3]. In our case, the toxicity index was less than 1. Barium migrates in the form of Ba2+ cations, a toxic substance. The concentration of barium in the well is 0.037 mg/L. This is above the LLBSC (0.02). Boron is represented by the toxic acid H3BO3. It is a highly toxic substance with a polytropic effect, the concentration of boron in the well is below the MPC (0.5 mg/L) and the LLBSC (0.0325 mg/L). As indicated in the work [3], high MPC values for a number of elements cannot serve as a characteristic of hydrochemical anomalies in specific areas.

4. Conclusions

The results of the studies of drinking water in the village of Krasnoshchelye showed that the macro- (Ca, Mg, Na, K) and microelement (Co, Cu, Mn, Ni, V, Zn, Cr) composition of water from the standpoint of biological significance for the elemental balance of a person have a lower concentration than the recommended level of the LLBSC; the concentrations of U, Th, Y are several times higher than their LLBSC; the forms of migration of elements and newly formed phases in the system "water - gastric juice" depend not only on the acidity of the stomach, but also on the amount of gastric juice. And this is an individual characteristic of a person and his age.
The presence of rare earth elements in drinking well waters with their constant use can cause diseases of the nervous system and other organs. The presence of REE in surface natural and drinking waters has been established in other settlements of the Lovozero district. The results of the research can be used in the fields of geochemistry, hydrology, ecology, and medicine.

Author Contributions

Conceptualization, S.M. and S.D.; methodology, S.M. and S.D.; software, S.M.; validation, S.D., S.M. and V.M.; formal analysis, S.D.; investigation, S.D., V.R. and A.Sh.; resources, A.S.; data curation, S.M., S.D. and A.Sh.; writing—original draft preparation, S.M. and S.D.; writing—review and editing, S.D.; visualization, S.D.; supervision, V.M.; project administration, V.M.; funding acquisition, V.M. All authors have read and agreed to the published version of the manuscript.

Funding

The study was carried out with the financial support of the Russian Science Foundation 24-17-00114 “Evaluation of the chemical state of natural and drinking waters of the Murmansk region, forms of migration, impact on the elemental status of residents”.

Data Availability Statement

The original contributions presented in the study are included in the article, supplementary material, further inquiries can be directed to the corresponding author.

Conflicts of Interest

The authors declare that they have no conflict of interest. The funders had no role in the design of the study; in the collection, analyses, or interpretation of data; in the writing of the manuscript; or in the decision to publish the results.

References

  1. Dolgikh, P.G. Geoecological features of the chemical composition of waters and bottom sediments of the Ust-Ilimsky reservoir. Abstract of the dissertation for the Candidate of Geological and mineralogical Sciences. A.P. Vinogradov Institute of Geochemistry, Irkutsk. Russia. 2024. http://www.igc.irk.ru/ru/zashchita, (accessed on 15 May 2024).
  2. Ushakova, E.S. Ecogeochemistry of aquatic ecosystems of urbanized territories of the northern Caspian Sea. Dissertation for candidate of geological and mineralogical sciences. Tomsk polytechnic university. Tomsk. Russia. 2024. https://portal.tpu.ru/council/indcouncils/6080/worklist (accessed on 18 July 2024).
  3. Kayukova, E.P.; Filimonova, E.A. Quality of fresh groundwater of the Crimean Mountains (the Bodrak River Basin). Moscow University Bulletin. Series 4. Geology 2022, 1, 79–88. [Google Scholar] [CrossRef]
  4. SanPiN 2.1.3684-21. Sanitary Rules and Standards. Hygienic standards and requirements for ensuring the safety and (or) harmlessness of environmental factors for humans; Moscow, Russia, 2021.
  5. Goncharuk, V.V.; Zui, O.V.; Melnik, L.A.; Mishchuk, N.A.; Nanieva, A.V.; Pelishenko, A.V. Assessment of the physiological adequacy of drinking water by biotesting. Chemistry for Sustainable Development 2021, 1, 35–41. [Google Scholar] [CrossRef]
  6. SanPiN 2. 1.4.1116-02. Sanitary Rules and Standards. Drinking water. Hygienic requirements for the quality of water packaged in containers. Quality control; Ministry of Health of Russia: Moscow, Russia, 2002. [Google Scholar]
  7. Sanitary norms and rules Requirements for the physiological usefulness of drinking water; Minsk, Belarus, 2012.
  8. DSTU 7525-2014. Drinking water. Requirements and methods of quality control; Ministry of Economic Development of Ukraine: Kiev, Ukraine, 2014. [Google Scholar]
  9. Krainov, S.R.; Ryzhenko, B.N.; Shvets, V.M. Geochemistry of groundwater. Theoretical, applied and environmental aspects; CentrLitNefteGaz: Moscow, Russia, 2012. [Google Scholar]
  10. Kovalsky, V.V. Geochemical Ecology; Nauka Publ.: Moscow, Russia, 1974. [Google Scholar]
  11. Barvish, M.V.; Schwartz, A.A. A new approach to the assessment of the microcomponent composition of underground waters used for drinking water supply. Geoecology 2000, 5, 467–473. [Google Scholar]
  12. Linnik, P.N.; Nabivanets, B.I. Forms of Metal Migration in Fresh Surface Waters; Gidrometeoizdat: Leningrad, Russia, 1986. [Google Scholar]
  13. Linnik, P.N.; Zhezherya, V.A. Aluminum in surface water of ukraine: concentrations, migration forms, distribution among abiotic components. Water Resources 2013, 40, 157–169. [Google Scholar] [CrossRef]
  14. Sandimirov, S.S.; Pozhilenko, V.I.; Mazukhina, S.I.; Drogobuzhskaya, S.V.; Shirokaya, A.A.; Tereshchenko, P.S. Chemical Composition of Natural Waters of the Lovozero Massif, Russia. Model. Earth Syst. Environ. 2022, 8, 4307–4315. [Google Scholar] [CrossRef]
  15. Mazukhina, S.I.; Sandimirov, S.S.; Drogobuzhskaya, S.V. Physiological adequacy assessment of potable water in Lovozero district, Murmansk region of Russia. In Biogenic—Abiogenic Interactions in Natural and Anthropogenic Systems; Frank-Kamenetskaya, O.V., Vlasov, D.Yu., Panova, E.G., Alekseeva, T. V., Eds.; Springer Proceedings in Earth and Environmental Sciences, Switzerland, 2022, pp.617-633. [CrossRef]
  16. Mazukhina, S.I.; Мазухина, С.И.; Дрoгoбужская, С.В.; Сандимирoв, С.С.; Маслoбoев, В.А. Features of changes in chemical composition of drinking water as a result of water treatment (Lovozero, Kola peninsula). Bulletin of the Tomsk Polytechnic University. Geo Аssets Engineering. [CrossRef]
  17. Mazukhina, S.; Drogobuzhskaya, S.; Sandimirov, S.; Masloboev, V. Effect of Water Treatment on the Chemical Composition of Drinking Water: a Case of Lovozero, Murmansk region, Russia. Sustainability 2022, 14, 16996. [Google Scholar] [CrossRef]
  18. Materials for the state report "On the state of epidemiological well-being of the population in the Murmansk region were prepared by a working group of specialists: sanitary-2022". Rospotrebnadzor: Murmansk, Russia, 2023. https://51.rospotrebnadzor.ru (accessed on 10 March 2024).
  19. Materials for the state report "On the state of the sanitary and epidemiological well-being of the population in the Murmansk region in 2023". Rospotrebnadzor: Murmansk, Russia, 2024. 214 p. https://51.rospotrebnadzor.ru. (accessed on 12 July 2024).
  20. Karpov, I.K.; Chudnenko, K.V.; Kulik, D.A.; Bychinskii, V.A. The convex programming minimization of five thermodynamic potentials other than Gibbs energy in geochemical modeling. Am. J. Sci. 2002, 302, 281–311. [Google Scholar] [CrossRef]
  21. Chudnenko, K.V. Thermodynamic Modeling in Geochemistry: Theory, Algorithms, Software, Applications; Akadem Publishing House “Geo”: Novosibirsk, Russia, 2010. [Google Scholar]
  22. Reid, R.; Prausnic, D.; Shervud, T. Gases and Liquids Properties; Him-ija: Leningrad, Russia, 1982. [Google Scholar]
  23. Reid, R.C.; Prausnitz, J.M.; Sherwood, T.K. The Properties of Gases and Liquids; McGraw-Hill Book Company: New York, NY, USA, 1977. [Google Scholar]
  24. Shock, E.L.; Helgeson, H.C. Calculation of the thermodynamic and transport properties of aqueous species at high pressures and temperatures: Correlation algorithms for ionic species and equation of state predictions to 5 kb and 100°C. Geochim. Cosmochim. Acta 1988, 52, 2009–2036. [Google Scholar] [CrossRef]
  25. Yokokawa, H. Tables of thermodynamic properties of inorganic compounds. J. Nat. Chem. Lab. Indust. 1988, 83, 27–121. [Google Scholar]
  26. Shock, E.L.; Helgeson, H.C.; Sverjensky, D.A. Calculation of the thermodynamic and transport properties of aqueous species at high pressures and temperatures: Standard partial molal properties of inorganic neutral species. Geochim. Cosmochim. Acta 1989, 53, 2157–2183. [Google Scholar] [CrossRef]
  27. Johnson, J.W.; Oelkers, E.H.; Helgeson, H.C. SUPCRT92: Software package for calculating the standard molal thermodynamic properties of mineral, gases, aqueous species, and reactions from 1 to 5000 bars and 0 to 100 C. Comput. Geosci. 1992, 18, 899–947. [Google Scholar] [CrossRef]
  28. 28. Robie, R.A.; Hemingway, B.S. Thermodynamic Properties of Minerals and Related Substances at 298.15 K and 1 Bar (105 Pascals) Pressure and at Higher Temperatures; United States Geological Survey: Washington, DC, USA, 1995.
  29. Shock, E.L.; Sassani, D.C.; Willis, M.; Sverjensky, D.A. Inorganic species in geologic fluids: Correlation among standard molal thermodynamic properties of aqueous ions and hydroxide complexes. Geochim. Cosmochim. Acta 1997, 61, 907–950. [Google Scholar] [CrossRef] [PubMed]
  30. Tokarev, I.V. Isotope reconstruction of the origin, evolution and assessment of the current state of water and ice objects. Dissertation for the degree of Doctor of Geological and Mineralogical Sciences. St Petersburg University, Saint Petersburg, 2024, V.2, p.48. https://crust.ru/newsfullarchive.html. (accessed on 18 July 2024).
  31. Toolabi, A.; Bonyadi, Z.; Paydar, M.; Najafpoor, A.A.; Ramavandi, B. Spatial distribution, occurrence, and health risk assessment of nitrate, fluoride, and arsenic in Bam groundwater resource, Iran. Groundw. Sustain. Dev. 2021, 12, 100543. [Google Scholar] [CrossRef]
  32. Mazukhina, S.I.; Drogobuzhskaya, S.V.; Ionov, N.V.; Rybachenko, V.V. Analysis of the chemical composition of tap water of Murmansk. In Ecological Problems of the Northern Regions and Ways to Their Solution. Proceedings of the VIII Russian Scientific Conference with international participation, Apatity, Russia, 24–29 June 2024; Makarov D.V., Eds. Publishing house of the FIS of the KSC RAS: Apatity, Russia, 2024; pp. 279–280. [Google Scholar]
  33. Mazukhina, S.I.; Chudnenko, K.V.; Tereshchenko, P.S.; Drogobuzhskaya, S.V. Formation of Concretions in Human Body under the Influence of the State of Environment of the Kola Peninsula: Thermodynamic Modeling. Chemistry for Sustainable Development 2020, 28, 186–194. [Google Scholar] [CrossRef]
  34. Mazukhina, S.I.; Maksimova, V.V.; Chudnenko, K.V.; Masloboev, V.A.; Sandimirov, S.S.; Drogobuzhskaya, S.V.; Tereshchenko, P.S.; Senzhenko, V.I.; Gudkov, A.V. Water Quality of the Arctic Zone of the Russian Federation: Physico-Chemical Modeling of Water Formation, Forms of Migration of Elements, Influence on the Human Body; Publishing house of the FIS of the KSC RAS: Apatity, Russia, 2020. [Google Scholar]
  35. Belisheva, N.K.; Drogobuzhskaya, S.V. Rare Earth Element Content in Hair Samples of Children Living in the Vicinity of the Kola Peninsula Mining Site and Nervous System Diseases. Biology 2024, 13, 626. [Google Scholar] [CrossRef] [PubMed]
  36. Tong, S.L.; Zhu, W.Z.; Gao, Z.H.; Meng, Y.X.; Peng, R.L.; Lu, G.C. Distribution characteristics of rare earth elements in children’s scalp hair from a rare earths mining area in Southern China. J. Environ. Sci. Health Part A 2004, 39, 2517–2532. [Google Scholar] [CrossRef] [PubMed]
  37. Wang, W.; Yang, Y.; Wang, D.; Huang, L. Toxic Effects of Rare Earth Elements on Human Health: A Review. Toxics 2024, 12, 317. [Google Scholar] [CrossRef] [PubMed]
  38. Moskalev, Y.I. Mineral Exchange. Medicine: Moscow, Russia, 985. 288 p.
Figure 1. Wells in the village Krasnoshchelye.
Preprints 142329 g001
Figure 3. Water sampling stations (highlighted in red): 1-5 - wells, 6 - Ponoy River, 7 - Shumesozero.
Preprints 142329 g003
Figure 4. Changes in parameters in the stomach during the interaction of 100 mL (a,c,d) and 10 mL (b,d,e) of gastric juice and a volume of water from 1 to 1000 mL.
Preprints 142329 g004
Table 1. Analytical data (AD) and modeling results (RM) of waters of the River Ponoy and well, T 20°C, P 1 bar.
Indicator River Ponoy Well (Figure 3, point 5) Indicator river Ponoy Well (Figure 3, point 5)
AD RM AD RM AD RM AD RM
mg/L mg/L
Eh 0.845 0.8256 Ba total 0.0079 7.86×10⁻³ 0.0373 0.0373
pH 6.38 6.39 6.66 6.68 Ba2+ 7.86×10⁻³ 0.0373
Is* 0.00064 0.00180 BaCO3 3.29×10⁻⁷ 2.78×10⁻⁶
Al total 0.045 0.0450 0.098 0.0980 BaCl+ 1.80×10⁻⁷ 3.70×10⁻⁶
Al(OH)2+ 2.04×10⁻³ 3.84×10⁻³ BaOH+ 3.61×10⁻¹⁰ 3.26×10⁻⁹
Al(OH)2F 0.0804 0.0378 Si total 5.71 5.71 3.06 3.06
Al(OH)2F2- 8.56×10⁻⁵ 1.08×10⁻⁵ SiO2 4.06 2.17
AlO2- 8.20×10⁻³ 5.79×10⁻² HSiO3- 2.92×10⁻³ 3.09×10⁻³
HAlO2 1.26×10⁻² 4.53×10⁻² H4SiO4 13.0 6.99
Al(OH) 2+ 9.23×10⁻⁴ 9.27×10⁻⁴ Sr total 0.017 0.0170 0.041 0.0410
Al(OH)3 0.0109 3.93×10⁻² Sr2+ 0.0169 0.0406
Al(OH)4- 0.0112 7.93×10⁻² SrOH+ 1.40×10⁻⁹ 6.15×10⁻⁹
Al3+ 3.03×10⁻⁵ 1.66×10⁻⁵ SrCO3 6.59×10⁻⁷ 5.81×10⁻⁶
AlSO4+ 1.23×10⁻⁷ 2.33×10⁻⁷ SrHCO3+ 1.47×10⁻⁴ 6.94×10⁻⁴
Ca total 4.23 4.23 15.0 15.00 SrCl+ 7.98×10⁻⁷ 8.29×10⁻⁶
Ca2+ 4.18 14.80 SrF+ 1.77×10⁻⁷ 1.04×10⁻⁷
CaOH+ 1.23×10⁻⁶ 8.14×10⁻⁶ Cd total 5.0×10⁻⁶ 5.00×10⁻⁶ 5.0×10⁻⁶ 5.00×10⁻⁶
CaCO3 1.50×10⁻³ 9.24×10⁻³ Cd2+ 4.97×10⁻⁶ 4.87×10⁻⁶
Ca(HCO3)+ 8.73×10⁻² 0.28 CdCl+ 3.98×10⁻⁸ 1.69×10⁻⁷
CaHSiO3+ 4.62×10⁻⁶ 1.64×10⁻⁵ CdO 7.22×10⁻¹⁴ 2.43×10⁻¹³
CaCl+ 2.40×10⁻⁴ 3.66×10⁻³ CdOH+ 8.06×10⁻¹⁰ 1.45×10⁻⁹
CaCl2 1.09×10⁻⁸ 7.35×10⁻⁷ Ni total 0.00030 3.00×10⁻⁴ 0.00028 2.80×10⁻⁴
CaF+ 1.84×10⁻⁴ 1.59×10⁻⁴ Ni2+ 3.00×10⁻⁴ 2.80×10⁻⁴
CaSO4 0.0336 0.429 NiOH+ 1.01×10⁻⁸ 1.73×10⁻⁸
В total 0.0004 4.40×10⁻⁴ 0.0042 4.22×10⁻³ Pb (0.01) 5.6×10⁻⁵ 5.60×10⁻⁵ 0.00013 1.30×10⁻⁴
B(OH)3 2.51×10⁻³ 0.0241 Pb2+ 2.15×10⁻⁵ 3.29×10⁻⁵
BO2- 2.10×10⁻⁶ 3.93×10⁻⁵ PbOH+ 3.73×10⁻⁵ 1.05×10⁻⁴
Fe total 2.21 2.21 0.263 0.263 PbO 9.00×10⁻¹⁰ 4.73×10⁻⁹
Fe2+ 5.53×10⁻⁹ 2.49×10⁻¹⁰ PbCl+ 4.18×10⁻⁸ 2.77×10⁻⁷
FeSO4+ 7.48×10⁻⁸ 6.68×10⁻⁹ Cu total 0.00060 6.00×10⁻⁴ 0.00150 1.50×10⁻³
Fe(OH)3 0.148 0.0242 Cu+ 7.07×10⁻¹⁶ 3.23×10⁻¹⁵
Fe(OH)4- 1.91×10⁻³ 6.18×10⁻⁴ Cu2+ 5.87×10⁻⁴ 1.44×10⁻³
FeOH2+ 2.50×10⁻³ 1.14×10⁻⁴ CuCl+ 1.43×10⁻⁷ 1.52×10⁻⁶
FeOH+ 5.97×10⁻¹² 4.97×10⁻¹³ CuOH+ 1.58×10⁻⁵ 7.13×10⁻⁵
FeO+ 1.61 0.137 CuF+ 1.62×10⁻⁷ 9.76×10⁻⁸
FeSO4 2.44×10⁻¹¹ 3.88×10⁻¹² CuCl2- 1.01×10⁻¹² 1.48E-16
HFeO2 1.39 0.228 HCuO2- 1.36×10⁻¹² 2.18×10⁻¹¹
FeO2- 6.23×10⁻⁴ 2.02×10⁻⁴ P total 0.0020 2.00×10⁻³ 0.0010 1.00×10⁻³
FeCl+ 3.91×10⁻¹³ 7.47×10⁻¹⁴ PO43- 8.78×10⁻¹⁰ 1.51×10⁻⁹
FeF+ 1.29×10⁻¹² 1.39×10⁻¹⁴ HPO42- 8.13×10⁻⁴ 7.04×10⁻⁴
FeF2+ 1.26×10⁻⁶ 7.67×10⁻⁹ H2PO4- 5.44×10⁻³ 2.42×10⁻³
F- 0.144 0.125 0.0409 0.0318 Co total 0.00011 1.10×10⁻⁴ 0.00028 2.80×10⁻⁴
HF 7.29×10⁻⁵ 9.52×10⁻⁶ Co2+ 1.10×10⁻⁴ 2.80×10⁻⁴
HF2- 2.14×10⁻¹⁰ 7.15×10⁻¹² CoO 6.33×10⁻¹¹ 5.52×10⁻¹⁰
K total 1.00 1.00 3.67 3.67 CoCl+ 4.12×10⁻⁸ 4.54×10⁻⁷
K+ 1.00 3.67 HCoO2- - 5.19×10⁻¹⁶
KCl 3.06×10⁻⁷ 4.96×10⁻⁶ CoOH+ 2.26×10⁻⁸ 1.06×10⁻⁷
KHSO4 6.87×10⁻¹³ 4.80×10⁻¹² Cl total 2.27 2.27 10.22 10.2
KOH 8.06×10⁻⁹ 5.73×10⁻⁸ Cl- 2.27 10.2
KSO4- 5.01×10⁻⁴ 6.93×10⁻³ HCl 1.96×10⁻⁷ 4.63×10⁻⁷
Mg total 1.07 1.07 1.47 1.47 Zr total 0.00018 1.75×10⁻⁴ 0.00079 7.90×10⁻⁴
Mg2+ 1.06 1.44 HZrO3- 1.37×10⁻⁴ 8.08×10⁻⁴
MgOH+ 5.74×10⁻⁶ 1.49×10⁻⁵ ZrO2 1.16×10⁻⁴ 3.57×10⁻⁴
MgCO3 2.43×10⁻⁴ 5.89×10⁻⁴ U total 0.00006 6.40×10⁻⁵ 0.00008 7.90×10⁻⁵
Mg(HCO3)+ 2.96×10⁻² 3.70×10⁻² HUO4- 1.95×10⁻⁷ 4.70×10⁻⁷
MgCl+ 1.19×10⁻⁴ 7.00×10⁻⁴ UO22+ 3.33×10⁻⁷ 1.23×10⁻⁷
MgF+ 2.69×10⁻⁴ 9.00×10⁻⁵ UO2OH+ 3.90×10⁻⁶ 2.64×10⁻⁶
MgSO4 1.63×10⁻² 8.02×10⁻² UO42- 4.95×10⁻¹⁵ 2.33×10⁻¹⁴
MgHSiO3+ 3.02×10⁻⁶ 4.19×10⁻⁶ UO3 7.25×10⁻⁵ 9.17×10⁻⁵
Mn total 0.033 0.0330 0.0110 1.10×10⁻² Li total 0.0032 3.20×10⁻³ 0.00023 2.30×10⁻⁴
Mn2+ 0.0329 1.09×10⁻² Li+ 3.20×10⁻³ 2.30×10⁻⁴
MnOH+ 1.62×10⁻⁶ 1.02×10⁻⁶ LiOH 4.18×10⁻¹⁰ 5.62×10⁻¹¹
MnO 6.41×10⁻¹² 7.84×10⁻¹² Ce total 0.00042 4.23×10⁻⁴ 0.00513 5.13×10⁻³
HMnO2- - - Ce3+ 1.42×10⁻¹¹ 2.16×10⁻¹²
MnSO4 1.32×10⁻⁴ 1.59×10⁻⁴ CeNO32+ 6.09×10⁻⁴ 7.40×10⁻³
MnF+ 2.13×10⁻⁶ 1.73×10⁻⁷ CeSO4+ 1.71×10⁻¹² 8.11×10⁻¹³
MnCl+ 2.17×10⁻⁶ 3.12×10⁻⁶ CeOH2+ 8.14×10⁻¹⁴ 2.20×10⁻¹⁴
CO32- 4.64×10⁻³ 4.33×10⁻³ Cr total 0.00008 - 0.00017 -
HCO3- 46.2 2.01 CrO42- 7.23×10⁻⁵ 2.31×10⁻⁴
HSO4- 6.65×10⁻⁵ 1.22×10⁻⁴ HCrO4- 1.07×10⁻⁴ 1.49×10⁻⁴
SO42- 1.95 1.91 7.52 La total 0.00031 3.05×10⁻⁴ 0.00389 3.88×10⁻³
HNO3 4.87×10⁻⁹ 2.12×10⁻⁷ La3+ 1.19×10⁻¹¹ 1.90×10⁻¹²
NO3- 0.35 0.346 3.11 LaCO3+ 8.67×10⁻¹² 2.11×10⁻¹²
Na+ 2.82 2.82 7.64 7.64 LaF2+ 5.14×10⁻¹³ 1.89×10⁻¹⁴
NaOH 4.98×10⁻⁸ 2.68×10⁻⁷ LaCl2+ 1.71×10⁻¹⁵ 1.09×10⁻¹⁵
NaAlO2 2.31×10⁻⁷ 4.42×10⁻⁶ LaNO32+ 4.41×10⁻⁴ 5.62×10⁻³
NaCl 7.34×10⁻⁵ 8.60×10⁻⁴ LaOH2+ 4.11×10⁻¹⁴ 1.17×10⁻¹⁴
NaF 3.20×10⁻⁶ 2.16×10⁻⁶ LaSO4+ 1.44×10⁻¹² 7.18×10⁻¹³
NaSO4- 1.38×10⁻³ 1.36×10⁻² Zn2+ 7.00×10⁻⁴ 6.85×10⁻⁴ 3.10×10⁻³ 2.98×10⁻³
NaHSiO3 3.62×10⁻⁵ 1.04×10⁻⁴ ZnOH+ 1.82×10⁻⁵ 1.46×10⁻⁴
O2 8.04 4.96 ZnCl+ 7.78×10⁻⁸ 1.41×10⁻⁶
CO2 14.7 6.88 ZnF+ 7.90×10⁻⁸ 8.21×10⁻⁸
VO2+ 7.71×10⁻⁸ 0.00021 6.53×10⁻⁹ Y total 0.00037 3.65×10⁻⁴ 0.0040 3.98×10⁻³
VO43- 0.0012 7.55×10⁻¹¹ 1.02×10⁻¹⁰ Y3+ 3.55×10⁻⁴ 3.78×10⁻³
HVO42- 6.95×10⁻⁴ 4.55×10⁻⁴ YO+ 3.50×10⁻⁸ 1.22×10⁻⁶
H3VO4 1.09×10⁻⁴ 1.80×10⁻⁵ YOH2+ 1.24×10⁻⁵ 2.35×10⁻⁴
Nd 0.00033 3.25×10⁻⁴ 0.00478 4.78×10⁻³ Pr 0.00006 6.25×10⁻⁵ 0.00106 1.06×10⁻³
Nd3+ 7.71×10⁻¹² 5.93×10⁻¹² Pr3+ 2.08×10⁻¹² 4.41×10⁻¹³
NdNO32+ 4.65×10⁻⁴ 6.84×10⁻³ PrNO32+ 9.00×10⁻⁵ 1.52×10⁻³
LLBSC, mg/L: U-0.000037; Si-0.25; V-0.025; Ni-0.0075; Co-0.0075; K-75, Ca-27.5; Mg-7.5; Na-112.5; Cr-0.00375; Th -0.000007; Y-0.0004, * - ionic strength.
Table 2. Composition of phases with which the waters of the well and the Ponoy River are saturated (mol / %), T 20oC.
Object ToC MnO2 FeO(OH) Msc Apt Mnt SiO2
Well
mol 20 2.00×10⁻⁴ 4.71×10⁻³ 2.08×10⁻⁷ 9.86×10⁻⁶ 1.56×10⁻³ -
% 1.72 41.29 0.01 0.49 56.5 -
mol 3 2.00×10⁻⁴ 4.71×10⁻³ 1.21×10⁻³ 9.93E×10-6 - 0.0481
% 0.44 10.7 14.84 0.13 - 73.89
Ponoy
mol 20 6.01×10⁻⁴ 0.0395 - 5.31×10⁻⁶ 7.15×10⁻⁴ 0.0511
% 0.76 50.91 - 0.04 3.81 44.48
mol 3 6.01×10⁻⁴ 0.0395 4.87×10⁻⁷ 9.93×10⁻⁶ - 0.0481
% 0.42 28.21 - 0.13 - 69.25
Disclaimer/Publisher’s Note: The statements, opinions and data contained in all publications are solely those of the individual author(s) and contributor(s) and not of MDPI and/or the editor(s). MDPI and/or the editor(s) disclaim responsibility for any injury to people or property resulting from any ideas, methods, instructions or products referred to in the content.
Copyright: This open access article is published under a Creative Commons CC BY 4.0 license, which permit the free download, distribution, and reuse, provided that the author and preprint are cited in any reuse.
Prerpints.org logo

Preprints.org is a free preprint server supported by MDPI in Basel, Switzerland.

Subscribe

Disclaimer

Terms of Use

Privacy Policy

Privacy Settings

© 2025 MDPI (Basel, Switzerland) unless otherwise stated