
Submitted:
08 December 2024
Posted:
10 December 2024
You are already at the latest version
Abstract
Geosmin and 2-MIB are bacterial secondary metabolites that create an earthy-musty taste and odour (T&O) in drinking water. Both compounds exhibit low odour thresholds and are leading causes of customer complaints to water companies worldwide. Water companies must predict spikes in T&O concentrations early to intervene before these compounds reach the treatment works. Cyanobacteria are key producers of T&O in open waters yet influences of broader microbial and algal communities on cyanobacterial T&O events remain unclear. This study identified T&O risk indicator taxa using next-generation sequencing of bacterial (16S rRNA) and algal (rbcL) communities in three reservoirs in Wales, UK. Ordination analysis of these communities revealed clustering according to assigned T&O concentration levels, identifying T&O signature communities. Random Forest (RF) analyses accurately classified samples for high and low concentrations of geosmin and 2-MIB, demonstrating the biological consortium’s predictive power. Based on shared ecological traits of significant bacterial and algal taxa, we propose five categories corresponding to different magnitudes of taste and odour risk. Indicator taxa in T&O risk categories can then be used to predict T&O events, empowering Water companies first to optimise a treatment response, but importantly to determine triggers before an event to evidence preventative intervention management.
Keywords:
Geosmin
; 2-MIB
; Community analysis
; Taste and Odour
; Reservoir management
1. Introduction
The predominant source of customer complaints to drinking water companies worldwide is the earthy-musty flavours imparted by trans-1,10-dimethyl-trans-9-decalol (geosmin) and 2-methylisoborneol (2-MIB) (Devi et al., 2021; Pochiraju et al., 2021; Wu et al., 2022). These taste and odour (T&O) compounds exhibit low odour thresholds, with geosmin and 2-MIB ‘events’ defined as water concentrations of ≥10 ng L-1 and ≥5 ng L-1, respectively (Hooper et al., 2023). Due to these low concentration thresholds and the high cost of treatment processes such as activated carbon and ozonation (Mustapha et al., 2021), water companies aim to limit the production of these compounds in drinking water reservoirs.
Cyanobacterial blooms (i.e., large increases in biomass) have been considered the leading cause of T&O production (Adams et al., 2021; Bruder et al., 2014; Hayes & Burch, 1989; Newton et al., 2015). However, biomass alone does not explain all potential variations in T&O compound concentrations: significant relationships exist between periods of high cyanobacterial productivity and T&O metabolite production, irrespective of total biomass (Zimmerman et al., 1995). Elevated cyanobacterial productivity could explain how some studies have been unsuccessful in correlating T&O compounds with cyanobacterial biomass (Graham et al., 2010; Watson et al., 2008). For example, Kim et al. (2018) found that concentrations of geosmin per unit biomass were maximal when biomass was lowest, but productivity was high. While we know certain environmental conditions influence T&O metabolite production (i.e, high ammonia and low nitrate; (Hooper et al., 2023; Perkins et al., 2019), it remains unclear how biological factors at the community level affect cyanobacterial productivity-driven T&O events.
Cyanobacterial productivity is influenced by a variety of factors. A substantial amount of research has focussed on the abiotic drivers (e.g., nutrients, temperature, light; (Harris et al., 2016; Montgomery, 2014; Robarts & Zohary, 1987), however, recent work has shown that the wider bacterial communities associated with Cyanobacteria are very influential (Louati et al., 2015; Salomon et al., 2003). Heterotrophic bacteria can change the physiochemical properties of the water environments (Havens, 2008) creating favourable/ unfavourable environmental conditions for cyanobacterial productivity-driven T&O production. Previous studies revealed that cyanobacterial bloom-associated microbial communities are highly varied at the phylum level (Louati et al., 2015; Steffen et al., 2012). However, gene function could be highly conserved despite differences in taxonomic assemblages. It may therefore be possible to define cyanobacterial T&O risk categories based on indicator taxa assigned ecological traits such as nitrogen fixation and assimilation (Louati et al., 2015), organic matter degradation (Berg et al., 2009), and iron uptake (Ploug et al., 2011). Former research has focussed on the indirect and direct effects of bacterial communities on cyanobacterial T&O metabolite production (Berg et al., 2009; Graham et al., 2010; Youn et al., 2020). In doing so, a range of interactions have been observed, all revealing links between certain bacterial communities and increases in the cyanobacterial production of T&O metabolites, including geosmin and 2-MIB. Bacterial communities, however, can also degrade the high molecular weight organic compounds formed by Cyanobacteria (Cai et al., 2014), constituting key roles in nutrient recycling. Bacterial communities associated with Cyanobacteria can also lower oxygen tension near cyanobacterial cells where oxygen-sensitive biochemical processes (photosynthesis, N-fixation) occur (Paerl & Kellar, 1978). These interactions may enhance cyanobacterial productivity and, in turn, the production of T&O compounds. Additionally, these bacterial communities participate in other processes that have the potential to promote or inhibit T&O metabolite production by supporting cyanobacterial growth or altering environmental conditions favourable to T&O metabolite release (Eiler & Bertilsson, 2004; Salomon et al., 2003; Simon et al., 2002).
Relationships also exist between Cyanobacteria and algae, some of which have the potential to affect productivity. Cyanobacteria provide fixed nitrogen (N) to diatoms in return for amino acids and organic carbon (Foster et al., 2011; Hilton et al., 2013; Thompson et al., 2012). They also help release phosphorus (P) by triggering green algae (Chlorophyta) to secrete alkaline phosphatase (APase), which converts organic P into usable phosphate (Bar-Yosef et al., 2010). Additionally, algal communities help detoxify extracellular iron (Fe) compounds produced by Cyanobacteria, which could otherwise be toxic to the Cyanobacteria in low-oxygen waters (Paerl & Pinckney, 1996). Shared functional traits of algal communities associated with Cyanobacteria could thus accelerate nutrient cycling, facilitate cyanobacterial productivity, and potentially cause a T&O event risk. Although there has been considerable research on communities associated with Cyanobacteria, no studies so far have explored interactions within the broader planktonic communities, including bacteria and algae, or their role in T&O events. This is a crucial gap in our knowledge, as these interactions may affect cyanobacterial T&O metabolite production.
Identifying relationships within communities associated with Cyanobacteria is critical for understanding the mechanisms underlying T&O metabolite production and, ultimately, moving towards predicting T&O events. Advances in molecular methods, particularly correlation-based network analyses, have been successful in exploring microbial community co-occurrence and co-exclusion patterns (Barberán et al., 2012; Eiler et al., 2012; Ju & Zhang, 2015). These molecular techniques, which use the relative abundances of marker genes (e.g., 16S rRNA and rbcL), allow the identification of organisms (and thus potential inter-specific interactions) that were previously impossible to detect, particularly within cyanobacterial and algal communities. Such molecular methods provide novel insights into the complex dynamics of these communities and their roles in T&O events (Faust & Raes, 2012). The co-occurrence of organisms reflects potential positive interactions (e.g., facilitation and mutualisms), and negative interactions (e.g., co-exclusion due to competition of resources or differing environmental preferences) or indicates taxa that share similar environmental niches (Faust, 2021). The knowledge of both community dynamics and potential interactions afforded by these methods can offer a potential to explore and understand the relationships between communities associated with Cyanobacteria. Investigating such relationships can highlight taxa potentially implicated in T&O production and possibly pinpoint indicative taxa related to increases in geosmin and 2-MIB concentrations.
In this study, next-generation sequencing of 16S rRNA and rbcL genes was employed to assess bacterial and algal community dynamics across three drinking water reservoirs in Wales, UK to explore ecological relationships and identify biotic drivers of T&O events. One reservoir exhibited elevated geosmin concentrations, another showed elevated 2-MIB levels, and the third had neither geosmin nor 2-MIB concentrations exceeding the event threshold, as defined by Hooper et al. (2023) (geosmin > 10 ng L⁻¹ and 2-MIB > 5 ng L⁻¹). The research aimed to 1) identify bacterial and algal communities associated with elevated T&O metabolite concentrations; 2) determine whether there are taxa indicative of low and high T&O concentrations; and 3) investigate the co-occurrence networks surrounding T&O-producing Cyanobacteria and understand relationships with environmental factors. The aim was to identify taxa associated with T&O event risk, offering valuable insights for water companies and environmental managers.
2. Materials and Methods
2.1. Reservoir Locations and Sample Collection
Between July 2019 and August 2020, 500 mL of reservoir water (maximum depth 0.5 m) was collected monthly using bankside sampling for molecular analysis from multiple sites in three different reservoirs across Wales, UK (map available in Online Resource 1). Additional samples were taken simultaneously from the same locations using the same sampling method and used for chemical analysis. Utilising multiple sites in each reservoir reflects a holistic understanding of ecosystem dynamics, capturing the spatial heterogeneity of the reservoirs. This approach allowed for a comprehensive assessment of T&O risk by collating community compositions across the reservoirs. Moreover, it aligns with water quality management practices, which typically examine the reservoir as a single system. The exception to this sampling regime was a sampling break between March and April 2020 due to COVID-19 restrictions. Samples were transported by a refrigerated vehicle and kept at 4 °C before laboratory analysis. During the sampling period, Reservoir 1 (area covered = 360 ha) experienced geosmin events (≤ 520 ng L-1, n = 32, sites = 5), Reservoir 2 (area covered = 102 ha, n = 30, sites = 2) experienced 2-MIB events (≤ 60 ng L-1) and Reservoir 3 (area covered = 176 ha, n = 25, sites = 4) did not experience elevations in either T&O compound (≤1.80 ng L-1 for both geosmin and 2-MIB). A summary of geosmin and 2-MIB concentrations for each studied reservoir is provided in Online Resource 2.
2.2. Geosmin and 2-MIB Concentrations
Gas Chromatography-Tandem Mass Spectrometry (GC–MS/MS) (Agilent, Santa Clara, USA) was used to determine concentrations of geosmin and 2-MIB. Water samples were extracted using a solid phase extraction (SPE) technique at a Dŵr Cymru Welsh Water accredited laboratory (ISO/IEC 17025:2017). Full details of the methodology are listed in (Hooper et al., 2023).
Categorising Geosmin and 2-MIB concentrations
Low, medium, and high geosmin and 2-MIB concentration categories were proposed to aid data analysis and support the prediction of T&O risk. Drawing distinctions for T&O risk has previously been challenging without clearly defined categories, which are essential for effective modelling and forecasting. By establishing these categories, we can better interpret complex data sets and identify trends or patterns that may indicate forthcoming T&O events. Categories were assigned based on the event-level thresholds set out by Hooper et al. (2023) (geosmin > 10 ng L-1 and 2-MIB >5 ng L-1) and are presented in Table 1.
2.3. Water Chemistry
Water chemistry measurements were conducted at Dŵr Cymru Welsh Water accredited laboratory in line with ISO/IEC 17025:2017. Ammonium (NH4+), nitrate (NO3-), nitrite (NO2-) and total phosphorus (TP) were analysed using an Aquakem 600 discrete analyser (Thermo Scientific, Waltham, USA) with methods described in (Hooper et al., 2023). pH was measured via a pH meter using the Skalar SP2000 robot (Skalar Analytical B. V., Breda, Netherlands). For manganese (Mn) and dissolved iron (DFe), water samples were digested in 1% hydrochloric acid at 85 ± 5°C overnight before being introduced to the Agilent 7700 Inductively Coupled Plasma Mass Spectrometer (ICP-MS) with a Cetac ASX-500 Autosampler (Agilent Technologies, Santa Clara, USA).
2.4. eDNA Extraction and Next-Generation Sequencing (NGS)
2.4.1. Extracting eDNA from Reservoir Water
Water samples (500 ml) were filtered through a Sterivex filter (0.2 µM) using a vacuum manifold. 1 mL of ATL buffer (Qiagen, Germany) was added to the Sterivex filter before storing each sample at −20 °C for later use. Before extraction, 100 µL of proteinase K was added to each filter and left on a turntable for 2 hours. DNA was extracted using ~100 µL of the sample removed from each Sterivex filter, following methods described by Fawley and Fawley (2004). Briefly, samples (~100 μL) were mixed with 200 μL of extraction buffer (5M NaCl, 30 mM NaEDTA and 70 mM tris pH 7.0), 25 μL of 10% DTAB and 200 μL of chloroform and added to a tube containing 0.1 mm glass beads. Samples were then agitated using an MP Biomedical, FastPrep-24™ at 5 ms-1 for 30 seconds twice (with a 5-minute incubation at room temperature), before being centrifuged (Eppendorf, 5417C) at 14000 rpm for 2 minutes. The top phase of samples was transferred to a sterile collection tube (200 μL), and 200 μL of buffer AL (QIAGEN, Germany) added along with 200 μL of ethanol before being vortexed for 30 seconds. DNA was then purified using the procedure and reagents provided within the DNAeasy® Blood & Tissue Kit (QIAGEN, Germany).
2.4.2. Next Generation Sequencing (NGS) – 16S rRNA and rbcL genes
Two gene markers were selected to target algae (rbcL) and bacteria (16s rRNA). Initial 16S rRNA and rbcL PCRs were carried out on the extracted eDNA samples using primers listed in Table 2 with incorporated Nextera tags on the 5’ end of the primers. Compositions of 20 µL PCR reactions were consistent for both target genes, containing 5 µL of 4x AllTaq Mastermix (QIAGEN, Hilden, Germany), 0.30 pmol µL-1 of each primer mentioned above and 1 µL of template DNA. PCR reactions were carried out on a SimpliAmp™ Thermal Cycler (Thermo Fisher Scientific, Waltham, USA), using the following conditions: initial denaturation at 95 °C for 2 minutes followed by 40 cycles of 95°C for 5 seconds (denaturation), 55°C for 15 seconds (annealing), and 72°C for 10 seconds (extension) with a single final extension at 72°C for 5 minutes. All reactions were performed in triplicate to account for PCR bias. PCR success was determined using a QIAxcel (QIAGEN, Hilden, Germany). The successful triplicates were subsequently pooled together and underwent a cleaning stage using a Zymo Research 96 DNA clean-up kit (Zymo Research, Cambridge, UK) according to the manufacturer’s instructions.
Cleaned amplicon samples underwent a secondary amplification to anneal Illumina-Nextera indexes (Illumina, San Diego, USA). 12.5 µL KAPA HiFi HotStart ReadyMix, 5 µL of nuclease-free water and 2.5 µL of each unique Nextera index combination along with 2.5ul of cleaned primary product. This underwent PCR amplification on a MultiGene™ OptiMax Thermal Cycler (Labnet International, Edison, USA) using the following conditions: initial denaturation at 95 °C for 3 minutes followed by eight cycles of 95°C for 30 seconds (denaturation), 55°C for 30 seconds (annealing), and 72°C for 30 seconds (extension) with a single final extension at 72°C for 5 minutes.
SequelPrep normalisation plates (Invitrogen, Waltham, USA) were used to normalise the concentrations of the 16S rRNA and rbcL amplicons as per the manufacturer’s instructions. Before sequencing, normalised samples were pooled together. Samples were sequenced for both genes (16S rRNA and rbcL) on separate runs with either an Illumina MiSeq-nano or v2 cartridge using 2 x 250 bp paired-end reads.
2.4.3. Bioinformatic analysis and databases for taxonomic assignment
Sequence data were processed using QIIME2 v2021.2 (Bolyen et al., 2019). Fastq files from replicate samples were concatenated, and paired-end sequences were demultiplexed and imported into QIIME2. Sequences were denoised, merged, and chimera-checked using the DADA2 pipeline (Callahan et al., 2016). Run-specific truncation was applied based on read quality scores, and samples from separate runs were merged via amplicon sequence variant (ASV) tables.
Taxonomic assignments were made using two databases: (1) 16S rRNA V4 region (515-806 bp) extracted from the SILVA v132 database (Callahan, 2018); and (2) a custom rbcL database, compiled by merging sequences from Diat.barcode v9.2 (accessed 25 October 2021) (Rimet et al., 2019) and GenBank (with overlapping entries removed). GenBank sequences were cross-referenced with NCBI taxdump files for taxonomic classification. Both databases were formatted for QIIME2 and processed using the extract-reads function with a 0.8 identity threshold to filter for primer-containing sequences.
ASV assignment was performed using a Naive Bayes classifier in QIIME2. Post-assignment, features were filtered to retain those with a minimum relative abundance of 0.1% in at least 0.1% of samples.
2.5. Statistical Analyses
2.5.1. Datasets – Proportional and Binomial Manipulation
All statistical analyses were completed in R 4.1.0 (R_Core_Team, 2021). Sequence data for 16S rRNA and rbcL were exported at a genus level (or the closest available lineage) and converted into proportions separately by calculating the percentage of total reads for each genus based on the total number of reads per sample.
Joint analyses of algae and bacterial communities required the 16S rRNA and rbcL proportional datasets to be merged. To do so, we transformed datasets into binomial data to prevent biases towards either group resulting from differences in read depth or amplification efficiencies between bacterial and algal sequences. This transformation allows for a balanced representation of both groups in the analysis, mitigating artefacts that might skew community interactions. Merging different data types in ecological studies is a common approach to reveal broader community dynamics, and similar methods have been applied in metabarcoding studies to combine datasets while addressing such biases (Cuff et al., 2022) Presence (1) was recorded as a taxon proportion ≥1% to reduce noise from rare taxa and to focus on ecologically relevant taxa and absence (0) <1%.
Environmental variables (pH, NH4+, NO3- –, TP – total phosphorus, DMn – dissolved manganese and DFe – dissolved iron), were converted into the categories based on the quartiles of the distribution range of each variable (Q1 ≤ 0.25, Q2 0.25-0.50, Q3 0.50-0.75 and Q4 > 0.75). Samples with values for each variable that fell into a specific quartile range were marked present (1) and absent (0) for the remaining quartile ranges. This binomial categorisation facilitated analyses alongside the binomial community dataset, enabling comparisons and interpretations of community dynamics in relation to environmental conditions.
2.5.2. Non-metric Multidimensional Scaling of 16S rRNA and rbcL communities
Non-metric Multi-Dimensional Scaling (NMDS) was used to assess changes in the community structure of 16S rRNA and rbcL communities (using proportional data) for reservoirs experiencing geosmin (Reservoir 1) and 2-MIB (Reservoir 2) events. NMDS was calculated using the ‘vegan’ package (Oksanen, 2013) using a Bray-Curtis distance, with Wisconsin double standardisation to account for the effects of common and rare taxa. Results were plotted using ‘ggplot2’ (Wickham, 2016).
2.5.3. Random Forest (RF) Models
Random ForestTM (RF) models were used to identify taxa that could predict low and high T&O risk by classifying samples into low, medium, and high geosmin (for Reservoir 1) and 2-MIB (for Reservoir 2) concentration categories. The purpose of this analysis was to determine which bacterial and algal taxa were most indicative of elevated T&O levels. Using the R package ‘randomForest’ (Breiman, 2001), taxa were treated as independent variables, with the T&O concentration categories as the dependent variable.
The number of trees was first optimised for both reservoirs by running preliminary RFs with 105 trees; the point at which the error rate plateaued was selected for subsequent models (104 trees for Reservoir 1 and 2 x 10³ trees for Reservoir 2). The number of variables used in each tree was optimised by cross-validation using 100 folds. After refining the number of trees and variables (Reservoir 1 – n = 197 and Reservoir 2 – n =144), a final model was run for each reservoir. To assess the models' performance, multi-dimensional scaling plots were created from the proximity matrices for the geosmin and 2-MIB RFs.
To identify indicative organisms relating to T&O levels, taxa in the RF models were ranked in descending order of the Mean Decrease Accuracy (MDA) (the decrease in model accuracy from permutations of each taxon), and the top 20 taxa extracted. The top 20 taxa were used to reduce model complexity, improve model performance and highlight key indicator taxa. RFs were performed for this subset of taxa for Reservoir 1 (geosmin) and Reservoir 2 (2-MIB), optimising the number of trees (Reservoir 1 – 2 x 10³ trees and Reservoir 2 – 200 trees) and the number of variables used (Reservoir 1 – 20 taxa and Reservoir 2 – 5 taxa) as described above. Multi-dimensional scaling plots of the proximity matrices from the RFs were again constructed. MDA values associated with the classification of low and high T&O concentrations were further investigated to detect taxa that can differentiate between the two categories (Online Resource 9, geosmin and Online Resource 10, 2-MIB); total mean abundances for each taxon were also calculated to determine average abundances during low and high T&O concentrations.
2.5.4. Co-occurrence Analyses
To investigate the potential linkages between taxa in the algal and bacterial communities, as well as associations with specific environmental conditions, co-occurrence analyses were performed separately for data from each Reservoir using binomial data and the ‘cooccur’ package (Veech, 2013) (parameters listed in Online Resource 3). This followed the approach outlined in Faust (2021). Environmental categories (see Section 2.5.1) were included alongside community data to account for the influence of environmental conditions (i.e., a common response to environmental factors) as well as the direct effects of taxa interactions or connectivity (Faust, 2021). The probabilistic co-occurrence model calculated P-values for pairwise associations (Griffith et al., 2016). Associations are characterised by the probability that the co-occurrence between two taxa is either greater or less than expected by chance (i.e., in randomly assembled communities). Specifically, some taxa pairs co-occur more frequently than expected, indicating a higher-than-expected co-occurrence, while others co-occur less frequently, indicating a lower-than-expected co-occurrence. Significant pairwise associations between taxa and environmental categories (α = 0.01) were extracted and represented as association networks. The nodes in the networks represent taxa and environmental categories and edges reflect the probability of the pairwise associations. Datasets with all nodes and edges used to construct the networks are available in Online Resource 4.
Subnetworks of T&O-producing Cyanobacteria and their associated communities were created to visualise these higher and lower-than-expected co-occurrences. These networks were visualised using ‘igraph’ (Csardi & Nepusz, 2006), ‘ggnetwork’ (Briatte, 2023), and ‘ggplot2’ (Wickham, 2016). Interactive visualisations of the full networks, created using the ‘visNetwork’ package (Almende et al., 2019), are available in Online Resource 5.
2.6. Data Availability
16S rRNA and rbcL Next Generation Sequencing data from this study were submitted to the NCBI Sequence Read Archive (SRA) under the accession number PRJNA1080335. All additional data and code are available on Zenodo (10.5281/zenodo.10671684).
3. Results
3.1. T&O Categories in NMDS Community Analysis
16S rRNA genera composition in Reservoir 1 (geosmin) revealed distinct communities associated with geosmin levels (Figure 1a). Communities sampled during periods of low and medium geosmin levels did not cluster as distinctively as high geosmin levels and overlapped. Reservoir 2 (2-MIB) 16S rRNA communities also exhibited distinct clustering within the 2-MIB concentration categories (Figure 1b). The community composition for rbcL in Reservoir 1 did not appear to cluster according to geosmin levels (Figure 1c). However, In Reservoir 2 (2-MIB), rbcL genera composition can be seen to form a cluster for data points subjected to high 2-MIB levels (Figure 1d).
Random Forest (RF) analysis, using the top 20 taxa as independent variables, correctly classified 100% of samples for high geosmin (>20.00 ng L-1) and 80% of samples for low geosmin concentrations (<5 ng L-1) in Reservoir 1. For 2-MIB concentrations in Reservoir 2, RF analysis correctly classified 100% of samples for high (>10 ng L-1) and low concentrations (<2.50 ng L-1) (confusion matrices provided in Online Resource 6 and multi-dimensional scaling plots of RF proximity matrices provided in Online Resource 7). For both T&O compounds, the classification of samples for medium concentrations was less accurate (geosmin: 5.00 – 20.00 ng L-1 and 2-MIB: 2.50 – 10.00 ng L-1). RF classification of samples for medium geosmin concentrations had a 50% error rate for Reservoir 1, and medium concentrations of 2-MIB in Reservoir 2 had a 100% error rate.
T&O Risk Categorisation of Indicative Taxa Identified by RF Analysis
The importance of each taxon from both models was assessed by exploring overall mean decrease accuracy (MDA) values (Online Resource 8). MDA values associated with the classification of low and high T&O concentrations were further investigated to detect taxa that can differentiate between the two categories (Online Resource 9, geosmin and Online Resource 10, 2-MIB); total mean abundances for each taxon were also calculated to determine average abundances during low and high T&O concentrations.
Three Cyanobacteria (Microcystis PCC-7914, Aphanizomenon NIES81 and Cyanobium PCC-6307) were influential in discriminating low and high geosmin concentrations (Reservoir 1), although of these only Aphanizomenon NIES81 was itself capable of geosmin production (Driscoll et al., 2018). Interestingly, Cyanobium PCC-6307 is a known 2-MIB producer (Jakubowska & Szeląg-Wasielewska, 2015) and Microcystis PCC-7914 is a known toxin producer, producing microcystins (Graham et al., 2010). Aphanizomenon NIES81 was more important in classifying low than high geosmin concentrations; its mean relative abundances show that small proportions of Aphanizomenon NIES81 (0.12 ± 0.4%) are characteristic of low geosmin concentrations, and higher proportions (14.96 ± 19.82%) are typical of high geosmin concentrations. No relative abundance of Microcystis PCC-7914 was recorded during low geosmin concentrations, but this genus received the third-highest MDA value for high geosmin concentrations.
In Reservoir 2, only one 2-MIB-producing Cyanobacteria (Cyanobium PCC-6307) was important in classifying low and high 2-MIB concentrations. Three taxa in this model had overall MDA values of 0 (Legionella, Gammaproteobacteria Class and the Comamonadaceae Family) and were disregarded from interpretation.
3.3. Co-occurrence of Bacterial (16S rRNA) and Algal (rbcL) Communities
In Reservoir 1 (geosmin), 311 pairwise comparisons yielded statistically significant associations between taxa and environmental variables; 87 pairwise associations exhibited lower-than-expected co-occurrence, and 224 pairwise associations exhibited higher-than-expected co-occurrences (Figure 2a). In this network, there were four significantly co-occurring Cyanobacteria taxa, only two of which are known geosmin producers: Aphanizomenon NIES81 and Nostocaceae (Driscoll et al., 2018). Aphanizomenon NIES81 (Figure 2b) showed higher-than-expected associations with Fluviicola, the 2-MIB producer Cyanobium PCC-6307 (Jakubowska & Szeląg-Wasielewska, 2015), and low concentrations of NO₃⁻ and NO₂⁻ and high geosmin concentrations (Figure 2c). Aphanizomenon NIES81 also had 13 lower-than-expected associations, including Bacillus, a known geosmin-degrading bacterium (Zhi et al., 2016). Additionally, Aphanizomenon NIES81 was associated with lower-than-expected co-occurrence in low pH, high NO₃⁻/NO₂⁻ and low geosmin concentrations. The geosmin-producing Nostocaceae showed one higher-than-expected association with the Chlamydomonadaceae Family and no significant lower-than-expected co-occurrence associations.
In Reservoir 2 (elevated 2-MIB site), 179 pairwise comparisons yielded statistically significant co-occurrences: 73 pairwise associations showed lower-than-expected co-occurrence and 106 pairwise associations showed higher-than-expected co-occurrence (Figure 2d). The 2-MIB-producing Dolichospermum NIES41 (Zhang et al., 2017) had one higher-than-expected association with the diatom Melosira. The 2-MIB producer, Cyanobium PCC-6307 (Jakubowska & Szeląg-Wasielewska, 2015) exhibited lower-than-expected co-occurrence with five taxa: Rubinisphaeraceae Family, R7C24, Gomphonema, Ulnaria, and Gemmataceae Family, and higher-than-expected co-occurrence with Asterionella, Sporichyaceae Family, and Rhizobiales A0839 (Figure 2e). Cyanobium PCC-6307 also showed lower-than-expected associations with low pH and high dissolved manganese (DMn), and one higher-than-expected co-occurrence with low DMn concentrations. Interestingly, high concentrations of 2-MIB were not associated with Cyanobacteria or any taxon capable of T&O production at a higher or lower-than-expected co-occurrence (Figure 2f).
Additional details on taxa and environmental variables showing higher-than-expected or lower-than-expected co-occurrence with T&O-producing Cyanobacteria in Reservoirs 1 (geosmin) and 2 (2-MIB) are provided in Online Resource 11 and 12.
In Reservoir 3 (no concentrations of geosmin or 2-MIB above event level threshold), 224 pairwise comparisons revealed statistically significant co-occurrences; 66 pairwise associations were lower-than-expected, while 158 pairwise associations were higher-than-expected (Figure 2g). In Reservoir 3, only two Cyanobacteria displayed significant co-occurrences: the 2-MIB-producing Cyanobium PCC-6307 and Aphanizomenon MDT14a (not a known geosmin producer according to genome analysis by Driscoll (2016)) (Figure 2h). Interestingly, the Cyanobacteria present in Reservoir 3’s network exhibited more higher-than-expected pairwise co-occurrences compared to the T&O-producing Cyanobacteria in Reservoirs 1 and 2, which had a higher frequency of lower-than-expected associations. For Cyanobium PCC-6307, higher-than-expected co-occurrences existed with Aphanizomenon MDT14a, Sporichthyaceae Family, Limnohabitans, and Fragilaria, as well as high pH and low TP and DFe concentrations. This community network had one lower-than-expected co-occurrence with Schlesneria and low pH and NO2- concentrations. The potential importance of these taxa and environmental variables associated with the 2-MIB-producing Cyanobium PCC-6307 is summarised in Online Resource 13.
3.4. T&O Risk Indicator Categories and Associated Taxa
Literature searches of taxa identified by RF models for Reservoir 1 (geosmin) and Reservoir 2 (2-MIB) (Subsection 3.2) were conducted and ecological functions were examined. T&O risk categories were then established based on the shared ecological functions of key taxa identified in the RF models (Table 3). These categories were further applied to taxa significantly co-occurring with T&O-producing Cyanobacteria, organising taxa into the same categories (Table 3).
4. Discussion
This study is the first to explore T&O risk associated with Cyanobacteria by integrating bacterial and algal communities in combination with environmental datasets to identify indicator taxa organised into T&O-risk categories. Identifying bacterial and algal signature communities of low, medium, and high T&O concentration categories indicates that T&O risk can be inferred from these communities. In addition, RF analysis revealed T&O-producing Cyanobacteria are influential in distinguishing between low and high T&O concentrations – critical threshold extremes for water companies in managing water quality. Community network analysis was consistent with findings from the RF analysis, identifying T&O-producing Cyanobacteria from Reservoir 1 (geosmin) and Reservoir 2 (2-MIB) to be significantly associated with high T&O concentration categories, thereby identifying the potential source of T&O metabolite production. T&O-producing Cyanobacteria in Reservoir 1 (geosmin) and Reservoir 2 (2-MIB) experienced more lower-than-expected co-occurrences with other taxa, suggesting that they are less frequently associated with other taxa in a stable or cooperative manner; this could indicate a more selective or unstable ecological role of these T&O-producing Cyanobacteria in the community. The unstable community structure associated with T&O-producing Cyanobacteria may influence their physiology, with T&O metabolite production potentially linked to stress-induced conditions. However, T&O production as a stress response can only occur during the right environmental conditions (low NO3- and NO2-). In contrast, significantly co-occurring T&O-producing Cyanobacteria with other taxa present in Reservoir 3 (no T&O events) exhibited a greater frequency of higher-than-expected co-occurrences with other taxa. T&O-producing Cyanobacteria in Reservoir 3 may display a more stable or integrated role, indicating stronger or more predictable associations with other taxa within Reservoir 3’s ecosystem. In identifying taxa from RF and community network analysis, we propose T&O-risk categories based on the shared function-specific traits of the indicator taxa (T&O-risk categories are discussed below).
4.1. Categorisation of indicative taxa for T&O risk
Ordination analysis revealed that bacterial (16S rRNA) and algal (rbcL) communities clustered by T&O concentration categories (low, medium and high) across Reservoir 1 (geosmin) and Reservoir 2 (2-MIB), indicating that the biology consortium as a response to water quality can reflect T&O concentrations. Both bacteria and algae display T&O signature communities, where specific taxa are associated with T&O concentration categories. From combining data from these communities, indicative taxa associated with T&O-risk were identified in a reservoir experiencing extreme geosmin concentrations (Reservoir 1 – ≤520 ng L-1) and in a reservoir with moderate 2-MIB concentrations (Reservoir 2 – ≤60 ng L-1). Indicative taxa for the differentiation between low and high T&O metabolite concentrations were identified and T&O risk categories were constructed based on the shared ecological functions of each taxon. These categories were further applied to include the taxa associated with T&O-producing Cyanobacteria from community network analysis. Here, five T&O risk categories are proposed and are summarised below; the taxa associated with each category are detailed in Table 3 for reference.
4.1.1. Cyanobacterial T&O Producers
For a T&O event to occur, Cyanobacteria that possess the genes encoding geosmin synthase (geoA) and/or 2-MIB cyclase (mic) must be present within the community under appropriate environmental conditions, such as low NO3- and NO2- concentrations as observed in this study. Aphanizomenon NIES81 was an important variable in the RF model analysis for categorising geosmin concentrations. RF results from Reservoir 2 indicated that Cyanobium PCC-6307 was associated with the presence of 2-MIB, suggesting that this Cyanobacteria could be responsible for 2-MIB production. In this study, both Aphanizomenon NIES81 (Reservoir 1) and Cyanobium PCC-6307 (Reservoir 2) exhibited more lower-than-expected co-occurrences with other community members than higher-than-expected co-occurrences. These lower-than-expected associations imply biotic stress (induced by unstable ecological associations) may trigger the production of T&O metabolites, with geosmin and 2-MIB potentially serving as a defence mechanism, as sesquiterpenoids have previously been implicated in cellular defence (Pattanaik & Lindberg, 2015). In Reservoir 1, Aphanizomenon NIES81 was associated with low NO3-, NO2-, and high geosmin concentrations, consistent with previous findings indicating maximal geosmin production when oxidised nitrogen forms are scarce (Harris et al., 2016). Thus, the presence of T&O-producing Cyanobacteria is likely influenced by biotic stress and/or specific nutrient conditions, such as a low NO3-:NH4+ ratio, which may stimulate both cyanobacterial growth and T&O metabolite production (Hooper et al., 2023).
4.1.2. T&O Degraders
Elevations in T&O metabolite compounds are hypothesised to select for different bacterial species capable of degrading these compounds, thereby increasing the likelihood of such degradation processes occurring. Clercin et al. (2021) observed elevations in geosmin concentrations in a eutrophic reservoir were associated with Novosphingobium hassiacum and Sphingomonas oligophenolica, whereas increased concentrations of 2-MIB were linked to Flavobacterium species. The roles of Pseudomonas and Bacillus in T&O compound degradation remained unclear (Clercin et al., 2021), despite evidence of their capacity to degrade both compounds (Eaton & Sandusky, 2010; Ho et al., 2007; Ma et al., 2015). In this study, the geosmin-degrading Pseudomonas had a greater influence on the RF classification of high rather than low geosmin concentrations in Reservoir 1 (geosmin). The mean relative abundance of Pseudomonas increased during times of high geosmin concentrations compared to low, implying that increases in this degrader could indicate a T&O risk. Three strains of the T&O degrader, Pseudomonas, have been reported to also contain the geosmin synthase gene (geoA), although it is not known if they are effective geosmin producers (Churro et al., 2020). It is unknown why most species of Pseudomonas lack the genes to produce geosmin. In contrast, Bacillus in Reservoir 1 (geosmin) occurred at a lower-than-expected frequency with Aphanizomenon NIES81 and was an important variable in the RF model analysis for categorising geosmin concentrations. T&O degraders like Bacillus have been shown to display an antagonistic relationship with a previously described geosmin-producing strain of Streptomyces (Ma et al., 2015), which agrees with previous findings from natural communities (Bertos-Fortis et al., 2016; Salmaso et al., 2018). The increased abundance of Bacillus would thus be characteristic after periods of high T&O. A potential 2-MIB degrader identified in this study that needs further investigation is Limnobacter. In Reservoir 2 (2-MIB), RF analysis revealed Limnobacter as the most informative genus in categorising 2-MIB concentrations into low and high categories, with heightened relative abundance in Limnobacter during high 2-MIB concentrations. It has been postulated that Limnobacter species can degrade a vast array of aromatic compounds (Pérez-Pantoja et al., 2012; Vedler et al., 2013), although there are no reports to date of this genus degrading T&O compounds.
T&O degraders have the potential to cause fluctuations in geosmin and 2-MIB concentrations in water columns, depending on the relative rates of cyanobacterial T&O production and the biodegradation of the T&O metabolites.
4.1.3. Nutrient Enrichment Indicators
Nutrient enrichment indicators are taxa that tend to be present during periods of nutrient enrichment. For instance, the Peptostreptococcaceae family has been identified as an indicator of nutrient enrichment in urban lakes (Numberger et al., 2022). In Reservoir 1 (geosmin), Peptostreptococcaceae exhibited a significantly lower-than-expected co-occurrence with Aphanizomenon NIES81, despite having the greatest influence on the RF model’s performance in classifying low versus high geosmin concentrations. The enrichment of nutrients such as NH4+ could trigger the cyanobacterial production of T&O metabolite compounds like geosmin (Perkins et al., 2019). The presence of Peptostreptococcaceae before a T&O event suggests a potential early indicator of T&O risk. The lower-than-expected co-occurrence with Aphanizomenon NIES81 in Reservoir 1’s community network could be explained by niche overlap, as both taxa are capable of nitrogen fixation (Paster et al., 1993). This overlap may lead to competitive exclusion, where these organisms compete for similar ecological resources, potentially reducing their co-occurrence within the same habitat. Another indicator of nutrient enrichment is the diatom genus Melosira, which is commonly associated with eutrophic and polluted aquatic systems (Van de Vijver & Crawford, 2020). In the studied reservoirs, Melosira played a significant role in the RF analysis for classifying low and high geosmin concentrations. Additionally, Melosira exhibited a higher-than-expected co-occurrence with the 2-MIB-producing cyanobacterium Dolichospermum NIES41 in Reservoir 2 (2-MIB), suggesting a potential ecological interaction between these taxa under nutrient-enriched conditions. Armatimonas was also significant in the RF classification of low and high geosmin concentrations in Reservoir 1, consistent with previous studies linking this taxon to geosmin production after increases in TP concentrations (Xu et al., 2018). Elevations in TP concentrations favour cyanobacterial growth and productivity, and consequential shifts in the total nitrogen (TN) to TP ratio – particularly TN ratios below 30:1 – have been associated with increased geosmin production in reservoirs (Harris et al., 2016).
Additionally, the diatom Nitzschia, known for its association with nutrient-enriched waters and sensitivity to nutrient depletion (Reynolds et al., 2002), was influential in the RF classification of low and high 2-MIB concentrations in Reservoir 2. In Reservoir 2 declines in Nitzschia abundance were indicative of heightened 2-MIB risk. Additional diatoms characteristic of nutrient enrichment are Aulacoseira and Asterionella (Reynolds et al., 2002). Aulacoseira displayed lower-than-expected co-occurrence with Aphanizomenon NIES81 in Reservoir 1 (geosmin), however, according to Reynolds et al. (2002), this is to be expected due to their sensitivity to rising pH values associated with increased cyanobacterial productivity (Slavin, 2020). In contrast, Asterionella had a higher-than-expected co-occurrence with Cyanobium PCC-6307 in Reservoir 2 (2-MIB), rapid increases in Asterionella species can deplete major anions (NO3-, PO43- and silicates), leading to altered nutrient ratios (Krivtsov et al., 2000).
4.1.4. Nutrient Exchange/Recycling
Taxa capable of nutrient exchange and recycling can benefit Cyanobacteria by creating favourable conditions that promote the production of secondary metabolites, such as geosmin and 2-MIB (Wu et al., 2024). For example, in Reservoir 2, Limnohabitans had a higher-than-expected co-occurrence with Cyanobium PCC-6307 and was highly influential in classifying low and high 2-MIB concentrations. The primary growth substrates for Limnohabitans are autochthonous algal/ cyanobacterial organic matters and products from the photolysis of dissolved materials (Ye et al., 2016); culture-independent analyses show this genus to constitute 11% of the cyanobacterial phycosphere (Kim et al., 2020). The NS9 marine group was also an important variable in categorising low and high 2-MIB concentrations in Reservoir 2. The growth of these prokaryotes is associated with phytoplanktonic organic matter (Takebe et al., 2024) and have been identified to degrade polysaccharides (Reintjes et al., 2023). Similarly, previous work has identified Gemmataceae to contain wide repertoires of carbohydrate-active enzymes allowing them to utilise some polysaccharides, such as xylan, laminarin, lichenin and starch (Kulichevskaya et al., 2020). Gemmataceae had a lower-than-expected co-occurrence with Cyanobium PCC-6307 in Reservoir 2 but was influential in categorising 2-MIB concentrations into low and high categories. Another taxon affiliated with the nutrient exchange/ recycling for 2-MIB-producing Cyanobium PCC-6307 was Rhizobiales A0839. Previous studies link this taxon with NH4+ oxidation and removal in wastewater treatment (Rodriguez-Sanchez et al., 2019). This is an unusual pairing as both taxa compete for NH4+, although previous evidence suggests that NH4+-oxidising bacteria deny Cyanobacteria access to NH4+ and force diazotrophic Cyanobacteria into nitrogen fixation mode (Boyett et al., 2013). However, forced cyanobacterial nitrogen fixation in Cyanobium PCC-6307 cannot be assumed to be fuelling 2-MIB production in Reservoir 2 without further investigation, as the majority of 2-MIB-producing Cyanobacteria are thought to be non-heterocyst producing (Jeong et al., 2021).
The only higher-than-expected co-occurring taxon with Aphanizomenon NIES81 in Reservoir 1 was Fluviicola. Fluviicola is affiliated with the family Cryomorphaceae which belongs to the class Flavobacteriia and contains many species that play an integral role in the recycling of carbon and energy in freshwater environments (Woyke et al., 2011).. Flavobacteriia are major decomposers of high-molecular-mass organic matter in water bodies (Cottrell & Kirchman, 2000), like the 2-MIB degrading genus Flavobacterium (Clercin et al., 2021). Guedes et al. (2018) have previously shown Fluviicola to have positive correlations with Synechococcus; following previous findings from natural communities (Bertos-Fortis et al., 2016; Salmaso et al., 2018). The Chlamydomonadaceae family co-occurred at a higher-than-expected probability with the Nostocaceae family in Reservoir 1, this family contains the genus Chlamydomonas. Although no reports suggest that the Nostocaceae family can produce cylindrospermopsin, Kust et al. (2018) stated that Nostocaceae are a rich source of unknown secondary metabolites that require further investigation. These metabolites could have a similar effect to cylindrospermopsin on members of the Chlamydomonadaceae family, inducing the algae to produce APases for the Cyanobacteria to use.
4.1.5. Cyanobacterial Benefactors
Sediminibacterium has been shown to offer Cyanobacteria protection against the colonisation of opportunistic bacteria by producing bacteriocin and toxoflavin (Sethuraman et al., 2022). Sediminibacterium can also form biofilm consortia with Cyanobacteria (Velichko et al., 2015), and its relationship with Cyanobacteria in wastewater has also been previously reported (Lee et al., 2013). In this study, Sediminibacterium was considered more influential on the RF model’s performance in classifying high than low 2-MIB concentrations. Another taxon influential in categorising 2-MIB concentrations was the genus OM190. This taxon produces a diverse range of secondary metabolites including antimicrobial compounds (Pushpakumara et al., 2022), which have the potential to protect Cyanobacteria from undesired microbes. Protection of T&O-producing Cyanobacteria would in turn enhance T&O risk. For the categorisation of low and high geosmin concentrations, the OM27 clade was highly influential in the model’s performance, especially for high geosmin concentrations. Members of the OM27 clade are known to prey on opportunistic bacteria (Orsi et al., 2016) and have been shown to dominate the bacterioplankton community during cyanobacterial blooms (Wang et al., 2020). We hypothesise that members of the OM27 clade predate on opportunistic bacteria alongside Cyanobacteria, enabling them to become more resilient in the community, which in turn can present a T&O risk.
5. Conclusion
This study marks the first to investigate T&O risk linked to Cyanobacteria by integrating bacterial and algal data to identify indicator taxa for T&O-risk categories. The analysis of bacterial and algal communities in reservoirs with elevated geosmin and 2-MIB concentrations revealed distinct T&O signature communities. The identification of bacterial and algal communities associated with low, medium, and high T&O concentration categories suggests that T&O risk can be inferred from these communities. By combining bacterial and algal datasets, key taxa distinguishing between low and high T&O concentration categories were identified.
T&O-producing Cyanobacteria in Reservoir 1 (geosmin) and Reservoir 2 (2-MIB) showed fewer dependable associations with other taxa, indicating a selective or unstable ecological role. This instability may trigger T&O metabolite production as a stress response under specific environmental conditions, such as low NO₃⁻ and NO₂⁻ levels. Conversely, Cyanobacteria in the reservoir without T&O events exhibited more stable interactions with other taxa, suggesting a more integrated ecological role.
These findings underscore the importance of cyanobacterial interactions within the broader microbial community and the potential of using indicator taxa to assess T&O risk. This approach provides valuable insights for water companies and environmental managers, enabling more accurate predictions and management of T&O events. Importantly enhanced predictive capability also better identifies triggers of T&O metabolite production prior to events occurring after a temporal lag (between metabolite production and T&O event at the Water treatment works) and are hence of key importance in drinking water resource management.
Author Contributions
A. S. Hooper: Conceptualization, methodology, validation, formal analysis, investigation, resources, data curation, writing – original draft, writing – review and editing, and visualisation. S. R, Christofides: Conceptualization, methodology, validation, formal analysis, data curation, writing – review and editing, visualisation. F. M. Windsor: Methodology, validation, review and editing, visualisation. S. E. Watson: Writing – conceptualization, review and editing. P. Kille: Conceptualization, methodology, formal analysis, investigation, resources, writing – original draft, writing –review and editing, supervision, project administration, funding acquisition. R. G. Perkins: Conceptualization, investigation, resources, writing – original draft, writing – review and editing, supervision, project administration, funding acquisition.
Funding
This work was supported by funding from NERC Centre for Doctoral Training in Freshwater Biosciences and Sustainability from the Natural Environment Research Council [NE/R0115241].
Ethical Approval
Not applicable.
Consent to Participate
Not applicable.
Consent to Publish
Not applicable.
Availability of Data and Materials
16S rRNA and rbcL Next Generation Sequencing data from this study were submitted to the NCBI Sequence Read Archive (SRA) under the accession number PRJNA1080335. All additional data and code are available on Zenodo (10.5281/zenodo.10671684).
Acknowledgments
A.S.H was supported by funding from NERC Centre for Doctoral Training in Freshwater Biosciences and Sustainability from the Natural Environment Research Council [NE/R0115241] in collaboration with Dŵr Cymru, Welsh Water (DCWW). The authors would like to acknowledge the significant assistance of Miss Gemma Godwin, Mr Greg Bullock together with the rest of the DCWW Catchment Management Team and the analytical team at the DCWW Glaslyn laboratories.
Competing Interests
The authors have no relevant financial or non-financial interests to disclose.
References
- Adams, H.; Southard, M.; Reeder, S.; Buerkens, F.; Hallford, R.L.; Ikehata, K.; Nix, D.K. Successfully Detecting and Mitigating Algal Blooms and Taste and Odor Compounds. Journal AWWA 2021, 113, 10–19. [Google Scholar] [CrossRef]
- Almende, B.; Thieurmel, B.; Robert, T. (2019). visNetwork: network visualization using ’vis. js’ Library. R Package Version 2.0.9. In (pp. 1–105).
- Bar-Yosef, Y.; Sukenik, A.; Hadas, O.; Viner-Mozzini, Y.; Kaplan, A. Enslavement in the water body by toxic aphanizomenon ovalisporum, inducing alkaline phosphatase in phytoplanktons. Current Biology 2010, 20, 1557–1561. [Google Scholar] [CrossRef] [PubMed]
- Barberán, A.; Bates, S.T.; Casamayor, E.O.; Fierer, N. Using network analysis to explore co-occurrence patterns in soil microbial communities. ISME Journal 2012, 6, 343–351. [Google Scholar] [CrossRef] [PubMed]
- Berg, K.A.; Lyra, C.; Sivonen, K.; Paulin, L.; Suomalainen, S.; Tuomi, P.; Rapala, J. High diversity of cultivable heterotrophic bacteria in association with cyanobacterial water blooms. ISME Journal 2009, 3, 314–325. [Google Scholar] [CrossRef] [PubMed]
- Bertos-Fortis, M.; Farnelid, H.M.; Lindh, M.V.; Casini, M.; Andersson, A.; Pinhassi, J.; Legrand, C. Unscrambling cyanobacteria community dynamics related to environmental factors. Frontiers in Microbiology 2016, 7, 1–13. [Google Scholar] [CrossRef]
- Bolyen, E.; Rideout, J.R.; Dillon, M.R.; Bokulich, N.A.; Abnet, C.C.; Al-Ghalith, G.A.; Alexander, H.; Alm, E.J.; Arumugam, M.; Asnicar, F.; Bai, Y.; Bisanz, J.E.; Bittinger, K.; Brejnrod, A.; Brislawn, C.J.; Brown, C.T.; Callahan, B.J.; Caraballo-Rodríguez, A.M.; Chase, J. . Caporaso, J.G. Reproducible, interactive, scalable and extensible microbiome data science using QIIME 2. Nature Biotechnology 2019, 37, 852–857. [Google Scholar] [CrossRef] [PubMed]
- Boyett, M.R.; Tavakkoli, A.; Sobolev, D. Mathematical Modeling of Competition for Ammonium among Bacteria, Archaea and Cyanobacteria within Cyanobacterial Mats: Can Ammonia- Oxidizers Force Nitrogen Fixation ? Ocean Science Journal 2013, 48, 269–277. [Google Scholar] [CrossRef]
- Breiman, L. Random Forests. Machine Learning 2001, 45, 5–32. [Google Scholar] [CrossRef]
- Briatte, F. (2023). ggnetwork: Geometries to Plot Networks with 'ggplot2'. In.
- Bruder, S.; Babbar-Sebens, M.; Tedesco, L.; Soyeux, E. Use of fuzzy logic models for prediction of taste and odor compounds in algal bloom-affected inland water bodies. Environmental Monitoring and Assessment 2014, 186, 1525–1545. [Google Scholar] [CrossRef]
- Cai, H.; Jiang, H.; Krumholz, L.R.; Yang, Z. Bacterial Community Composition of Size-Fractioned Aggregates within the Phycosphere of Cyanobacterial Blooms in a Eutrophic Freshwater Lake. PLoS ONE 2014, 9. [Google Scholar] [CrossRef] [PubMed]
- Callahan, B.J. (2018). Silva taxonomic training data formatted for DADA2 (Silva version 132). In [dataset].
- Callahan, B.J.; McMurdie, P.J.; Rosen, M.J.; Han, A.W.; Johnson, A.J.A.; Holmes, S.P. DADA2: High-resolution sample inference from Illumina amplicon data. Nature Methods 2016, 13, 581–583. [Google Scholar] [CrossRef]
- Caporaso, J.G.; Lauber, C.L.; Walters, W.A.; Berg-Lyons, D.; Lozupone, C.A.; Turnbaugh, P.J.; Fierer, N.; Knight, R. Global patterns of 16S rRNA diversity at a depth of millions of sequences per sample. Proceedings of the National Academy of Sciences of the United States of America 2011, 108, 4516–4522. [Google Scholar] [CrossRef] [PubMed]
- Churro, C.; Semedo-Aguiar, A.P.; Silva, A.D.; Pereira-Leal, J.B.; Leite, R.B. A novel cyanobacterial geosmin producer, revising GeoA distribution and dispersion patterns in Bacteria. Scientific Reports 2020, 10, 1–18. [Google Scholar] [CrossRef] [PubMed]
- Clercin, N.A.; Druschel, G.K.; Gray, M. Occurrences of 2-methylisoborneol and geosmin –degrading bacteria in a eutrophic reservoir and the role of cell-bound versus dissolved fractions. Journal of Environmental Management 2021, 297, 1–9. [Google Scholar] [CrossRef]
- Cottrell, M.T.; Kirchman, D.L. Natural assemblages of marine proteobacteria and members of the Cytophaga-flavobacter cluster consuming low- and high-molecular-weight dissolved organic matter. Applied and Environmental Microbiology 2000, 66, 1692–1697. [Google Scholar] [CrossRef]
- Csardi, G.; Nepusz, T. (2006). The igraph software package for complex network research. In (pp. 1695–1695): InterJournal.
- Cuff, J.P.; Windsor, F.M.; Tercel, M.P.T.G.; Kitson, J.J.N.; Evans, D.M. Overcoming the pitfalls of merging dietary metabarcoding into ecological networks. Methods in Ecology and Evolution 2022, 13, 545–559. [Google Scholar] [CrossRef]
- Devi, A.; Chiu, Y.T.; Hsueh, H.T.; Lin, T.F. Quantitative PCR based detection system for cyanobacterial geosmin/2-methylisoborneol (2-MIB) events in drinking water sources: Current status and challenges. Water Research 2021, 188, 116478–116478. [Google Scholar] [CrossRef] [PubMed]
- Driscoll, C.B. (2016). Comparative Genomics of Freshwater Bloom-Forming Cyanobacteria and Associated Organisms.
- Driscoll, C.B.; Meyer, K.A.; Šulčius, S.; Brown, N.M.; Dick, G.J.; Cao, H.; Gasiūnas, G.; Timinskas, A.; Yin, Y.; Landry, Z.C.; Otten, T.G.; Davis, T.W.; Watson, S.B.; Dreher, T.W. A closely-related clade of globally distributed bloom-forming cyanobacteria within the Nostocales. Harmful Algae 2018, 77, 93–107. [Google Scholar] [CrossRef] [PubMed]
- Eaton, R.W.; Sandusky, P. Biotransformations of (+/-)-geosmin by terpene-degrading bacteria. Biodegradation 2010, 21, 71–79. [Google Scholar] [CrossRef]
- Eiler, A.; Bertilsson, S. Composition of freshwater bacterial communities associated with cyanobacterial blooms in four Swedish lakes. Environmental Microbiology 2004, 6, 1228–1243. [Google Scholar] [CrossRef]
- Eiler, A.; Heinrich, F.; Bertilsson, S. Coherent dynamics and association networks among lake bacterioplankton taxa. ISME Journal 2012, 6, 330–342. [Google Scholar] [CrossRef] [PubMed]
- Faust, K. Open challenges for microbial network construction and analysis. ISME Journal 2021, 15, 3111–3118. [Google Scholar] [CrossRef]
- Faust, K.; Raes, J. Microbial interactions: From networks to models. Nature Reviews Microbiology 2012, 10, 538–550. [Google Scholar] [CrossRef] [PubMed]
- Fawley, M.W.; Fawley, K.P. A simple and rapid technique for the isolation of DNA from microalgae. Journal of Phycology 2004, 40, 223–225. [Google Scholar] [CrossRef]
- Foster, R.A.; Kuypers, M.M.M.; Vagner, T.; Paerl, R.W.; Musat, N.; Zehr, J.P. Nitrogen fixation and transfer in open ocean diatom-cyanobacterial symbioses. ISME Journal 2011, 5, 1484–1493. [Google Scholar] [CrossRef] [PubMed]
- Glover, R. (2019). Biomonitoring and surveillance with short-and long-read metabarcoding. In (pp. 1–304).
- Graham, J.L.; Loftin, K.A.; Meyer, M.T.; Ziegler, A.C. Cyanotoxin mixtures and taste-and-odor compounds in cyanobacterial blooms from the midwestern united states. Environmental Science and Technology 2010, 44, 7361–7368. [Google Scholar] [CrossRef] [PubMed]
- Griffith, D.M.; Veech, J.A.; Marsh, C.J. Cooccur: Probabilistic species co-occurrence analysis in R. Journal of Statistical Software 2016, 69, 1–17. [Google Scholar] [CrossRef]
- Guedes, I.A.; Rachid, C.T.C.C.; Rangel, L.M.; Silva, L.H.S.; Bisch, P.M.; Azevedo, S.M.F.O.; Pacheco, A.B.F. (2018). Close link between harmful cyanobacterial dominance and associated bacterioplankton in a tropical eutrophic reservoir. Frontiers in Microbiology, 9. [CrossRef]
- Harris, T.D.; Smith, V.H.; Graham, J.L.; Waa, D.B.V. d.; Tedesco, L.P.; Clercin, N. Combined effects of nitrogen to phosphorus and nitrate to ammonia ratios on cyanobacterial metabolite concentrations in eutrophic Midwestern USA reservoirs. Inland Waters 2016, 6, 199–210. [Google Scholar] [CrossRef]
- Havens, K.E. (2008). Cyanobacteria blooms: Effects on aquatic ecosystems (Cyanobacte ed.). Springer. [CrossRef]
- Hayes, K.P.; Burch, M.D. Odorous compounds associated with algal blooms in South Australian water. Water Research 1989, 23, 115–121. [Google Scholar] [CrossRef]
- Hilton, J.A.; Foster, R.A.; James Tripp, H.; Carter, B.J.; Zehr, J.P.; Villareal, T.A. Genomic deletions disrupt nitrogen metabolism pathways of a cyanobacterial diatom symbiont. Nature Communications 2013, 4, 1–7. [Google Scholar] [CrossRef]
- Ho, L.; Hoefel, D.; Bock, F.; Saint, C.P.; Newcombe, G. Biodegradation rates of 2-methylisoborneol (MIB) and geosmin through sand filters and in bioreactors. Chemosphere 2007, 66, 2210–2218. [Google Scholar] [CrossRef]
- Hooper, A.S.; Kille, P.; Watson, S.E.; Christofides, S.R.; Perkins, R.G. (2023). The importance of nutrient ratios in determining elevations in geosmin synthase (geoA) and 2-MIB cyclase (mic) resulting in taste and odour events. Water Research, 232(September 2022), 1-13. [CrossRef]
- Jakubowska, N.; Szeląg-Wasielewska, E. Toxic picoplanktonic cyanobacteria - Review. Marine Drugs 2015, 13, 1497–1518. [Google Scholar] [CrossRef] [PubMed]
- Jeong, J.Y.; Lee, S.H.; Yun, M.R.; Oh, S.E.; Lee, K.H.; Park, H.D. (2021). 2-Methylisoborneol (2-Mib) Excretion By Pseudanabaena Yagii Under Low Temperature. Microorganisms, 9. [CrossRef]
- Ju, F.; Zhang, T. Bacterial assembly and temporal dynamics in activated sludge of a full-scale municipal wastewater treatment plant. ISME Journal 2015, 9, 683–695. [Google Scholar] [CrossRef]
- Kim, K.; Park, C.; Yoon, Y.; Hwang, S.J. (2018). Harmful cyanobacterial material production in the north han river (South Korea): Genetic potential and temperature-dependent properties. International Journal of Environmental Research and Public Health, 15. [CrossRef]
- Kim, M.; Lee, J.; Yang, D.; Park, H.Y.; Park, W. Seasonal dynamics of the bacterial communities associated with cyanobacterial blooms in the Han River. Environmental Pollution 2020, 266, 115198–115198. [Google Scholar] [CrossRef] [PubMed]
- Krivtsov, V.; Bellinger, E.G.; Sigee, D.C. Changes in the elemental composition of Asterionella formosa during tim diatom spring bloom. Journal of Plankton Research 2000, 22, 169–184. [Google Scholar] [CrossRef]
- Kulichevskaya, I.S.; Ivanova, A.A.; Naumoff, D.G.; Beletsky, A.V.; Rijpstra, W.I.C.; Sinninghe Damsté, J.S.; Mardanov, A.V.; Ravin, N.V.; Dedysh, S.N. Frigoriglobus tundricola gen. nov.; sp. nov.; a psychrotolerant cellulolytic planctomycete of the family Gemmataceae from a littoral tundra wetland. Systematic and Applied Microbiology 2020, 43, 1–10. [Google Scholar] [CrossRef] [PubMed]
- Kust, A.; Urajová, P.; Hrouzek, P.; Vu, D.L.; Čapková, K.; Štenclová, L.; Řeháková, K.; Kozlíková-Zapomělová, E.; Lepšová-Skácelová, O.; Lukešová, A.; Mareš, J. (2018). A new microcystin producing Nostoc strain discovered in broad toxicological screening of non-planktic Nostocaceae (cyanobacteria). Toxicon, 150(December 2017), 66-73. [CrossRef]
- Lee, J.; Lee, J.; Lee, T.K.; Woo, S.G.; Baek, G.S.; Park, J. In-depth characterization of wastewater bacterial community in response to algal growth using pyrosequencing. Journal of Microbiology and Biotechnology 2013, 23, 1472–1477. [Google Scholar] [CrossRef] [PubMed]
- Louati, I.; Pascault, N.; Debroas, D.; Bernard, C.; Humbert, J.F.; Leloup, J. (2015). Structural diversity of bacterial communities associated with bloom-forming freshwater cyanobacteria differs according to the cyanobacterial genus. PLoS ONE, 10. [CrossRef]
- Ma, N.N.; Luo, G.Z.; Tan, H.X.; Yao, M.L.; Wange, X.Y. Kinetic Characteristics of Degradation of Geosmin and 2-Methylisoborneol by Bacillus subtilis. Huan Jing Ke Xue 2015, 36, 1379–1384. [Google Scholar] [PubMed]
- Montgomery, B.L. The regulation of light sensing and light-harvesting impacts the use of cyanobacteria as biotechnology platforms. Frontiers in Bioengineering and Biotechnology 2014, 2, 1–7. [Google Scholar] [CrossRef]
- Mustapha, S.; Tijani, J.O.; Ndamitso, M.; Abdulkareem, A.S.; Shuaib, D.T.; Mohammed, A.K. A critical review on geosmin and 2-methylisoborneol in water: sources, effects, detection, and removal techniques. Environmental Monitoring and Assessment 2021, 193, 1–34. [Google Scholar] [CrossRef] [PubMed]
- Newton, R.J.; Jones, S.E.; Eiler, A.; McMahon, K.D.; Bertilsson, S.; Yamada, Y.; Kuzuyama, T.; Komatsu, M.; Shin-ya, K.; Omura, S.; Cane, D.E.; Ikeda, H.; Woodhouse, J.N.; Ziegler, J.; Grossart, H.P.; Neilan, B.A.; Adam, B.; Klawonn, I.; Svedén, J.B. . Sivonen, K. Chemotactic and Growth Responses of Marine Bacteria to Algal Extracellular Products. PLoS ONE 2015, 10, 265–277. [Google Scholar] [CrossRef]
- Numberger, D.; Zoccarato, L.; Woodhouse, J.; Ganzert, L.; Sauer, S.; Márquez, J.R.G.; Domisch, S.; Grossart, H.P.; Greenwood, A.D. Urbanization promotes specific bacteria in freshwater microbiomes including potential pathogens. Science of the Total Environment 2022, 845, 1–13. [Google Scholar] [CrossRef] [PubMed]
- Oksanen, J. Vegan : ecological diversity. R project 2013, 368, 1–11. [Google Scholar]
- Orsi, W.D.; Smith, J.M.; Liu, S.; Liu, Z.; Sakamoto, C.M.; Wilken, S.; Poirier, C.; Richards, T.A.; Keeling, P.J.; Worden, A.Z.; Santoro, A.E. Diverse, uncultivated bacteria and archaea underlying the cycling of dissolved protein in the ocean. The ISME Journal 2016, 10, 2158–2173. [Google Scholar] [CrossRef] [PubMed]
- Paerl, H.W.; Kellar, P.E. Significance of bacterial (cyanophyceae) Anabaena associations with respect to N2 fixation in freshwater. Journal of Phycology 1978, 14, 254–260. [Google Scholar] [CrossRef]
- Paerl, H.W.; Pinckney, J.L. A mini-review of microbial consortia: Their roles in aquatic production and biogeochemical cycling. Microbial Ecology 1996, 31, 225–247. [Google Scholar] [CrossRef]
- Paster, B.J.; Russell, J.B.; Yang, C.M.J.; Chow, J.M. Phylogeny of the Ammonia-Producing Ruminal Bacteria. International Journal of Systematic Bacteriology 1993, 43, 107–110. [Google Scholar] [CrossRef]
- Pattanaik, B.; Lindberg, P. Terpenoids and Their Biosynthesis in Cyanobacteria. Life 2015, 5, 269–293. [Google Scholar] [CrossRef]
- Pérez-Pantoja, D.; Donoso, R.; Agulló, L.; Córdova, M.; Seeger, M.; Pieper, D.H.; González, B. Genomic analysis of the potential for aromatic compounds biodegradation in Burkholderiales. Environmental Microbiology 2012, 14, 1091–1117. [Google Scholar] [CrossRef] [PubMed]
- Perkins, R.G.; Slavin, E.I.; Andrade, T.M.C.; Blenkinsopp, C.; Pearson, P.; Froggatt, T.; Godwin, G.; Parslow, J.; Hurley, S.; Luckwell, R.; Wain, D.J. Managing taste and odour metabolite production in drinking water reservoirs: The importance of ammonium as a key nutrient trigger. Journal of Environmental Management 2019, 244, 276–284. [Google Scholar] [CrossRef]
- Ploug, H.; Adam, B.; Musat, N.; Kalvelage, T.; Lavik, G.; Wolf-Gladrow, D.; Kuypers, M.M.M. Carbon, nitrogen and O 2 fluxes associated with the cyanobacterium Nodularia spumigena in the Baltic Sea. ISME Journal 2011, 5, 1549–1558. [Google Scholar] [CrossRef] [PubMed]
- Pochiraju, S.; Hoppe-Jones, C.; Adams, C.; Weinrich, L. Development and optimization of analytical methods for the detection of 18 taste and odor compounds in drinking water utilities. Water Research X 2021, 11, 1–9. [Google Scholar] [CrossRef]
- Pushpakumara, B.L.D.U.; Tandon, K.; Willis, A.; Verbruggen, H. (2022). Unravelling microalgal-bacterial interactions in aquatic ecosystems through 16S co-occurrence networks. bioRxiv.
- R_Core_Team. (2021). R: A Language and Environment for Statistical Computing. In R Foundation for Statistical Computing. Available online: https://www.r-project.org/.
- Reintjes, G.; Heins, A.; Wang, C.; Amann, R. (2023). Abundance and composition of particles and their attached microbiomes along an Atlantic Meridional Transect. Frontiers in Marine Science, 10. [CrossRef]
- Reynolds, C.S.; Huszar, V.; Kruk, C.; Naselli-Flores, L.; Melo, S. Towards a functional classification of the freshwater phytoplankton. Journal of Plankton Research 2002, 24, 417–428. [Google Scholar] [CrossRef]
- Rimet, F.; Gusev, E.; Kahlert, M.; Kelly, M.G.; Kulikovskiy, M.; Maltsev, Y.; Mann, D.G.; Pfannkuchen, M.; Trobajo, R.; Vasselon, V.; Zimmermann, J.; Bouchez, A. Diat.barcode, an open-access curated barcode library for diatoms. Scientific Reports 2019, 9, 1–12. [Google Scholar] [CrossRef] [PubMed]
- Robarts, R.D.; Zohary, T. Temperature effects on photosynthetic capacity, respiration, and growth rates of bloom - forming cyanobacteria. New Zealand Journal of Marine and Freshwater Research 1987, 21, 391–399. [Google Scholar] [CrossRef]
- Rodriguez-Sanchez, A.; Muñoz-Palazon, B.; Hurtado-Martinez, M.; Maza-Marquez, P.; Gonzalez-Lopez, J.; Vahala, R.; Gonzalez-Martinez, A. Microbial ecology dynamics of a partial nitritation bioreactor with Polar Arctic Circle activated sludge operating at low temperature. Chemosphere 2019, 225, 73–82. [Google Scholar] [CrossRef] [PubMed]
- Salmaso, N.; Albanese, D.; Capelli, C.; Boscaini, A.; Pindo, M.; Donati, C. Diversity and Cyclical Seasonal Transitions in the Bacterial Community in a Large and Deep Perialpine Lake. Microbial Ecology 2018, 76, 125–143. [Google Scholar] [CrossRef] [PubMed]
- Salomon, P.S.; Janson, S.; Granéli, E. Molecular identification of bacteria associated with filaments of Nodularia spumigena and their effect on the cyanobacterial growth. Harmful Algae 2003, 2, 261–272. [Google Scholar] [CrossRef]
- Sethuraman, A.; Stancheva, R.; Sanders, C.; Caceres, L.; Castro, D.; Hausknecht-Buss, H.; Henry, S.; Johansen, H.; Kasler, A.; Lastor, S.; Massaro, I.; Mekuria, I.; Moron-Solano, A.; Read, N.; Vengerova, G.; Zhang, A.; Zhang, X.; Read, B. Genome of a novel Sediminibacterium discovered in association with two species of freshwater cyanobacteria from streams in Southern California. G3: Genes, Genomes, Genetics 2022, 12, 1–8. [Google Scholar] [CrossRef]
- Simon, M.; Grossart, H.-p.; Schweitzer, B.; Ploug, H. Microbial ecology of organic aggregates in aquatic ecosystems. Aquatic Microbial Ecology 2002, 28, 175–211. [Google Scholar] [CrossRef]
- Slavin, E. (2020). Using artificial circulation for in-reservoir management of cyanobacteria and taste and odour metabolite production. In (pp. 1–248).
- Steffen, M.M.; Li, Z.; Effler, T.C.; Hauser, L.J.; Boyer, G.L.; Wilhelm, S.W. Comparative Metagenomics of Toxic Freshwater Cyanobacteria Bloom Communities on Two Continents. PLoS ONE 2012, 7, 1–9. [Google Scholar] [CrossRef] [PubMed]
- Takebe, H.; Tominaga, K.; Isozaki, T.; Watanabe, T.; Yamamoto, K.; Kamikawa, R.; Yoshida, T. Taxonomic difference in marine bloom-forming phytoplanktonic species affects the dynamics of both bloom-responding prokaryotes and prokaryotic viruses. mSystems 2024, 9, e00949–e00923. [Google Scholar] [CrossRef]
- Thompson, A.W.; Foster, R.A.; Krupke, A.; Carter, B.J.; Musat, N.; Vaulot, D.; Kuypers, M.M.; Zehr, J.P. Unicellular cyanobacterium symbiotic with a single-celled eukaryotic alga. Science 2012, 6101, 1546–1560. [Google Scholar] [CrossRef] [PubMed]
- Van de Vijver, B.; Crawford, R.M. Melosira jeanbertrandiana, a new Melosira species (Bacillariophyceae) from the sub-Antarctic region. Botany Letters 2020, 167, 50–56. [Google Scholar] [CrossRef]
- Vedler, E.; Heinaru, E.; Jutkina, J.; Viggor, S.; Koressaar, T.; Remm, M.; Heinaru, A. Limnobacter spp. as newly detected phenol-degraders among Baltic Sea surface water bacteria characterised by comparative analysis of catabolic genes. Systematic and Applied Microbiology 2013, 36, 525–532. [Google Scholar] [CrossRef]
- Veech, J.A. A probabilistic model for analysing species co-occurrence. Global Ecology and Biogeography 2013, 22, 252–260. [Google Scholar] [CrossRef]
- Velichko, N.; Chernyaeva, E.; Averina, S.; Gavrilova, O.; Lapidus, A.; Pinevich, A. Consortium of the 'bichlorophyllous' cyanobacterium Prochlorothrix hollandica and chemoheterotrophic partner bacteria: Culture and metagenome-based description. Environmental Microbiology Reports 2015, 7, 623–633. [Google Scholar] [CrossRef]
- Wang, K.; Razzano, M.; Mou, X. Cyanobacterial blooms alter the relative importance of neutral and selective processes in assembling freshwater bacterioplankton community. Science of the Total Environment 2020, 706, 135724. [Google Scholar] [CrossRef] [PubMed]
- Watson, S.B.; Ridal, J.; Boyer, G.L. Taste and odour and cyanobacterial toxins: Impairment, prediction, and management in the Great Lakes. Canadian Journal of Fisheries and Aquatic Sciences 2008, 65, 1779–1796. [Google Scholar] [CrossRef]
- Wickham, H. (2016). ggplot2. Use R! In Data Analysis (pp. 1–13). Springer. [CrossRef]
- Woyke, T.; Chertkov, O.; Lapidus, A.; Nolan, M.; Lucas, S.; del Rio, T.G.; Tice, H.; Cheng, J.F.; Tapia, R.; Han, C.; Goodwin, L.; Pitluck, S.; Liolios, K.; Pagani, I.; Ivanova, N.; Huntemann, M.; Mavromatis, K.; Mikhailova, N.; Pati, A. . Kyrpides, N.C. Complete genome sequence of the gliding freshwater bacterium Fluviicola taffensis type strain (RW262T). Standards in Genomic Sciences 2011, 5, 21–29. [Google Scholar] [CrossRef] [PubMed]
- Wu, L.; Zhang, C.; Vadiveloo, A.; Montes, M.L.; Xia, L.; Song, S.; Fernandez, M.A.; Lan, S. (2024). Efficient nutrient recycling from wastewater to deserts: A comparative study on biocrust cyanobacteria performance. Chemical Engineering Journal, 491. [CrossRef]
- Wu, T.; Zhu, G.; Wang, Z.; Zhu, M.; Xu, H. Seasonal dynamics of odor compounds concentration driven by phytoplankton succession in a subtropical drinking water reservoir, southeast China. Journal of Hazardous Materials 2022, 425, 1–8. [Google Scholar] [CrossRef]
- Xu, Z.; Te, S.H.; He, Y.; Gin, K.Y.H. The characteristics and dynamics of cyanobacteria-heterotrophic bacteria between two estuarine reservoirs - Tropical versus subtropical regions. Frontiers in Microbiology 2018, 9, 1–13. [Google Scholar] [CrossRef]
- Ye, Q.; Liu, J.; Du, J.; Zhang, J. Bacterial Diversity in Submarine Groundwater along the Coasts of the Yellow Sea. Front Microbiol 2016, 6, 1519. [Google Scholar] [CrossRef] [PubMed]
- Youn, S.J.; Kim, H.N.; Yu, S.J.; Byeon, M.S. Cyanobacterial occurrence and geosmin dynamics in Paldang Lake watershed, South Korea. Water and Environment Journal 2020, 34, 634–643. [Google Scholar] [CrossRef]
- Zhang, J.; Li, L.; Qiu, L.; Wang, X.; Meng, X.; You, Y.; Yu, J.; Ma, W. Effects of Climate Change on 2-Methylisoborneol Production in Two Cyanobacterial Species. Water 2017, 9, 859–859. [Google Scholar] [CrossRef]
- Zhi, Y.; Wu, Q.; Du, H.; Xu, Y. Biocontrol of geosmin-producing Streptomyces spp. by two Bacillus strains from Chinese liquor. International Journal of Food Microbiology 2016, 231, 1–9. [Google Scholar] [CrossRef]
- Zimmerman, W.J.; Soliman, B.H.; Rosen, B.H. Growth and 2-methylisoborneol production by the cyanobacterium Phormidium LM689. Water Science and Technology 1995, 31, 181–186. [Google Scholar] [CrossRef]
Figure 1.
NMDS ordination plots of NGS sequencing data for 16S rRNA data for Reservoirs 1 and 2 (a – n = 33, b – n = 30, respectively), and rbcL data for Reservoirs 1 and 2 (c – n = 33, d – n = 30, respectively). Points are coloured by corresponding T&O category (Reservoir 1 – geosmin and Reservoir 2 – 2-MIB) and shaped by sample point locations.3.2 - Indicative Taxa of T&O ‘Events’ in Reservoirs Experiencing High Geosmin and 2-MIB Concentrations.
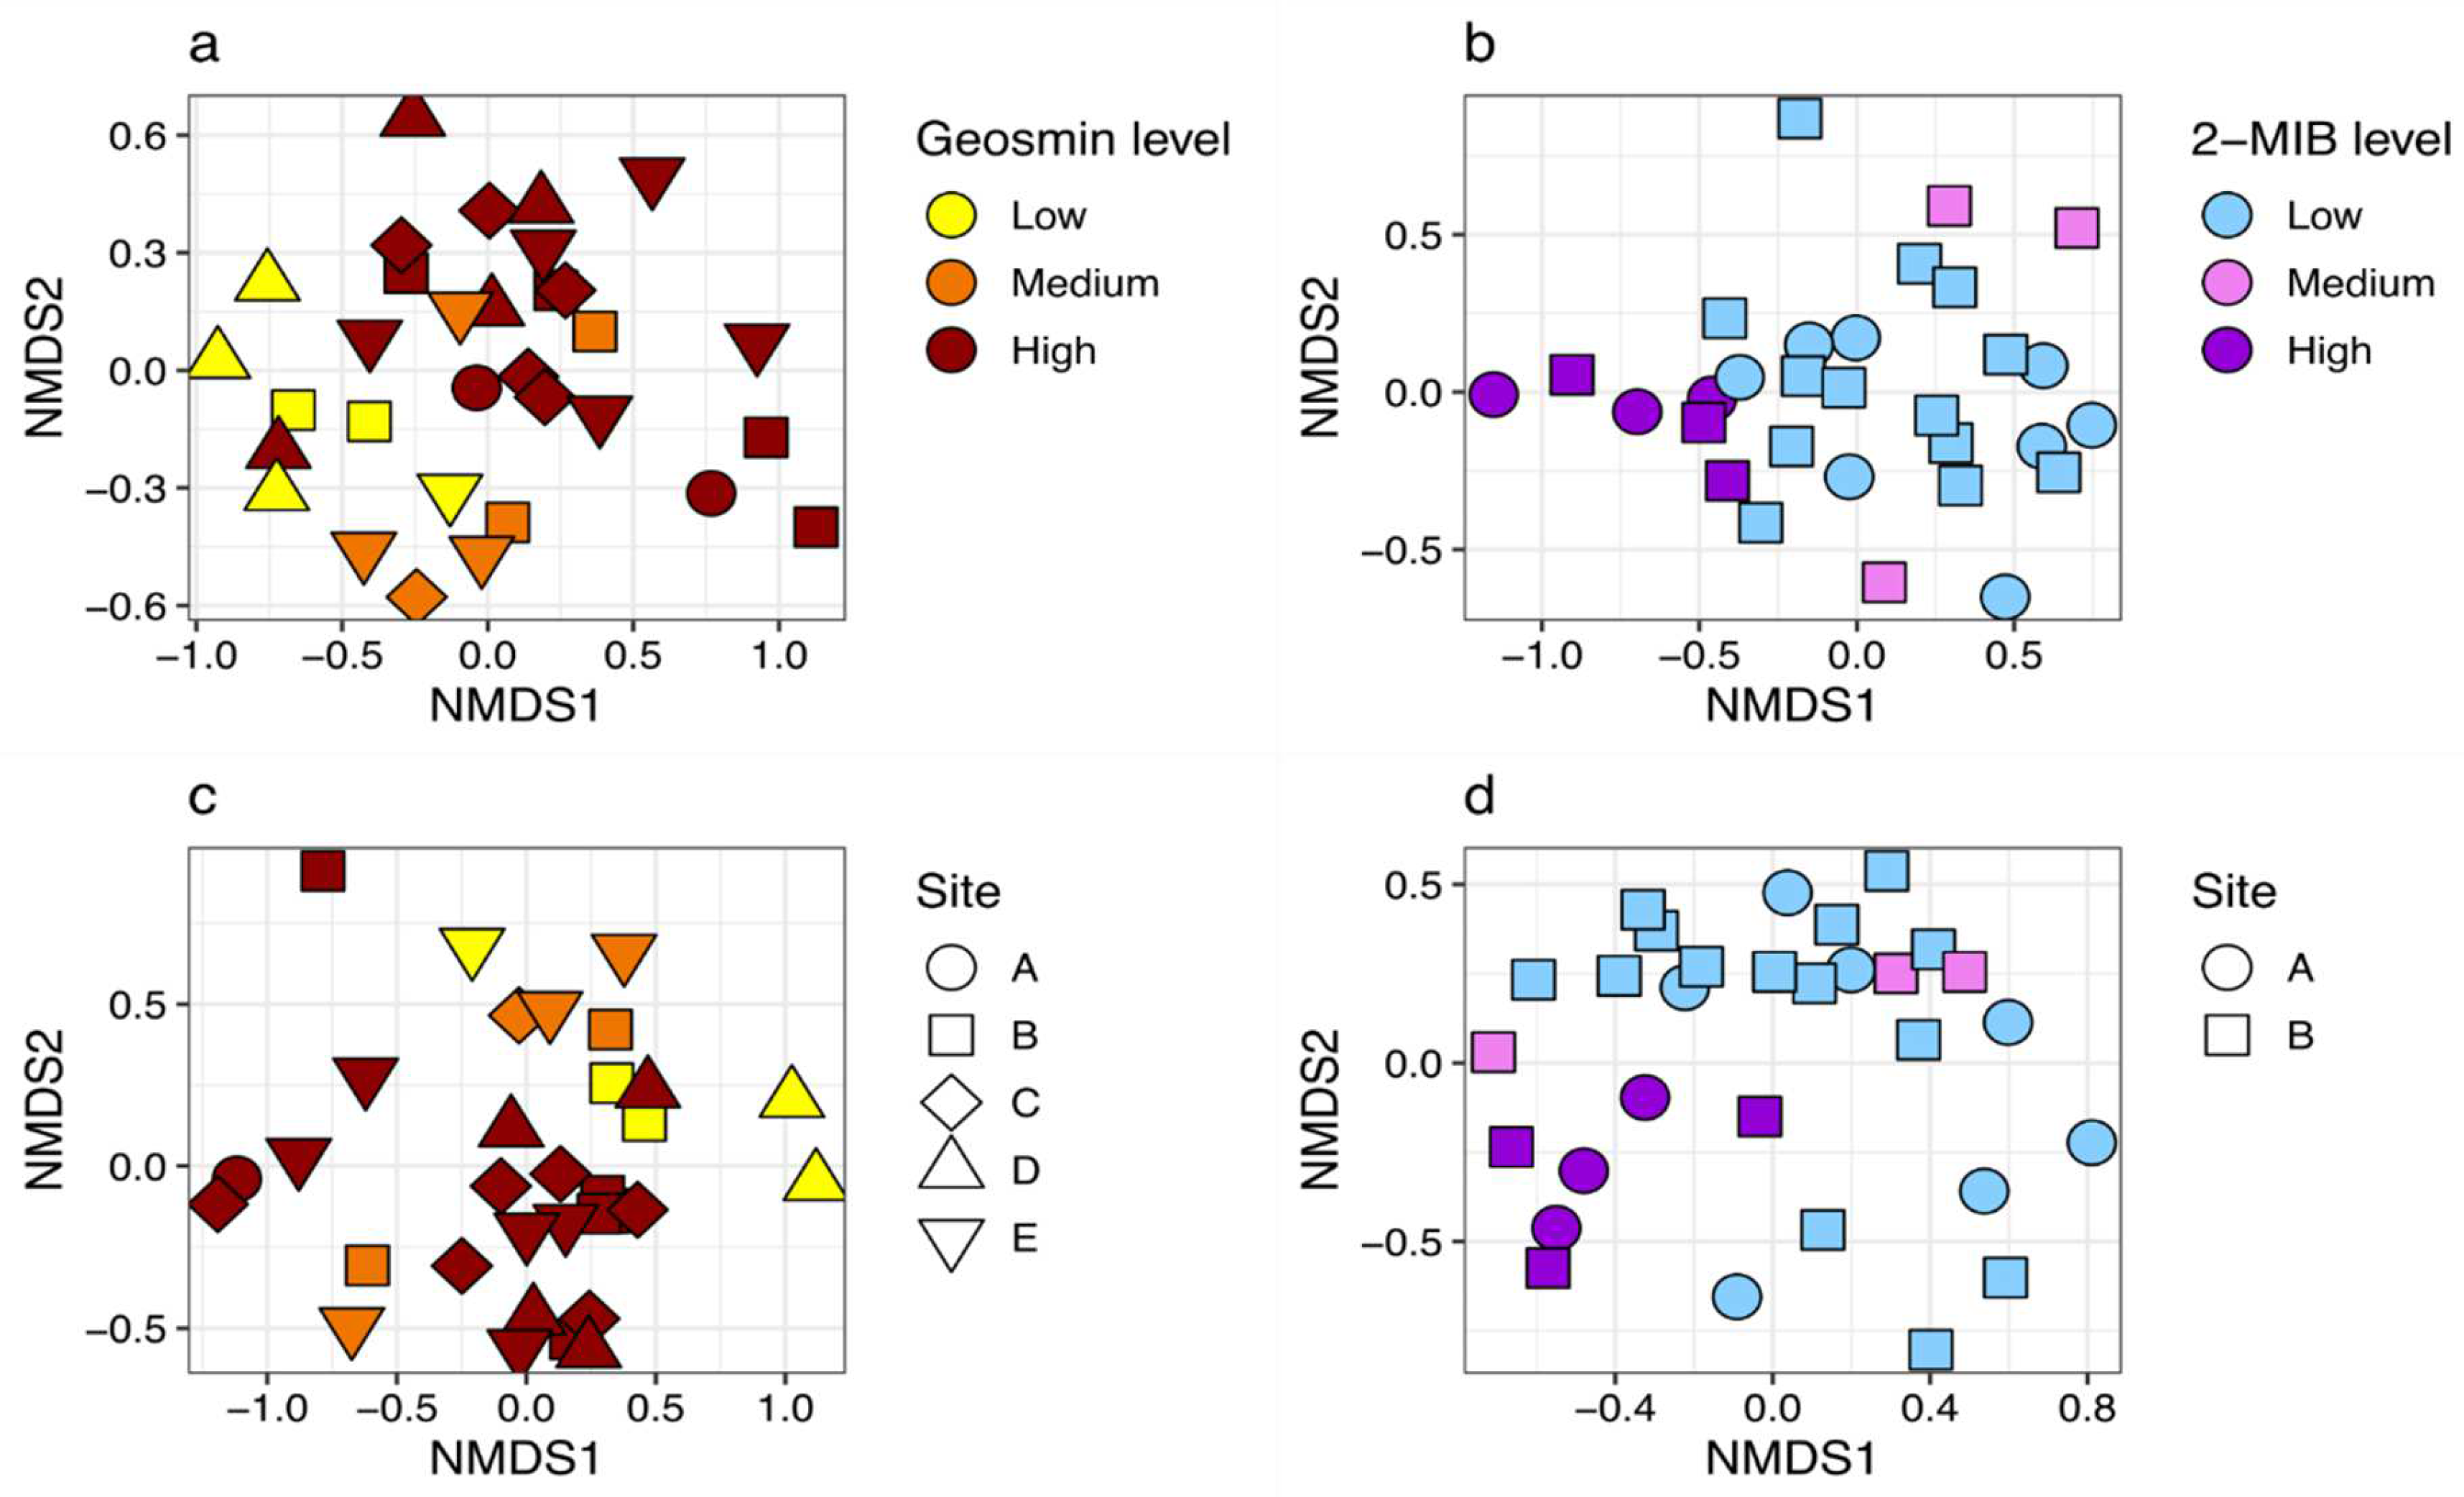
Figure 2.
Overview of significantly (p ≤ 0.01) co-occurring taxa and environmental categories for Reservoirs 1 (A, B and C), 2 (D, E and F), and 3 (G and H) based on combined 16S rRNA and rbcL data. Panels B, E, and H display subsets of T&O-producing Cyanobacteria: Aphanizomenon NIES81 (B - Reservoir 1 - geosmin), Cyanobium PCC-6307 (E - Reservoir 2 – 2-MIB), and Cyanobium PCC-6307 and Aphanizomenon MDT14a (H - Reservoir 3 – no T&O events). Panels C and F show the networks directly surrounding high levels of both geosmin and 2-MIB for Reservoirs 1 and 2, respectively. Cyanobacterial nodes are green, T&O-degrading bacterial nodes are purple, diatom nodes are yellow, and environmental categories are represented by blue triangles. Edges indicate lower-than-expected co-occurrences (grey lines) and higher-than-expected co-occurrences (black lines), with line thickness reflecting the strength of the association.
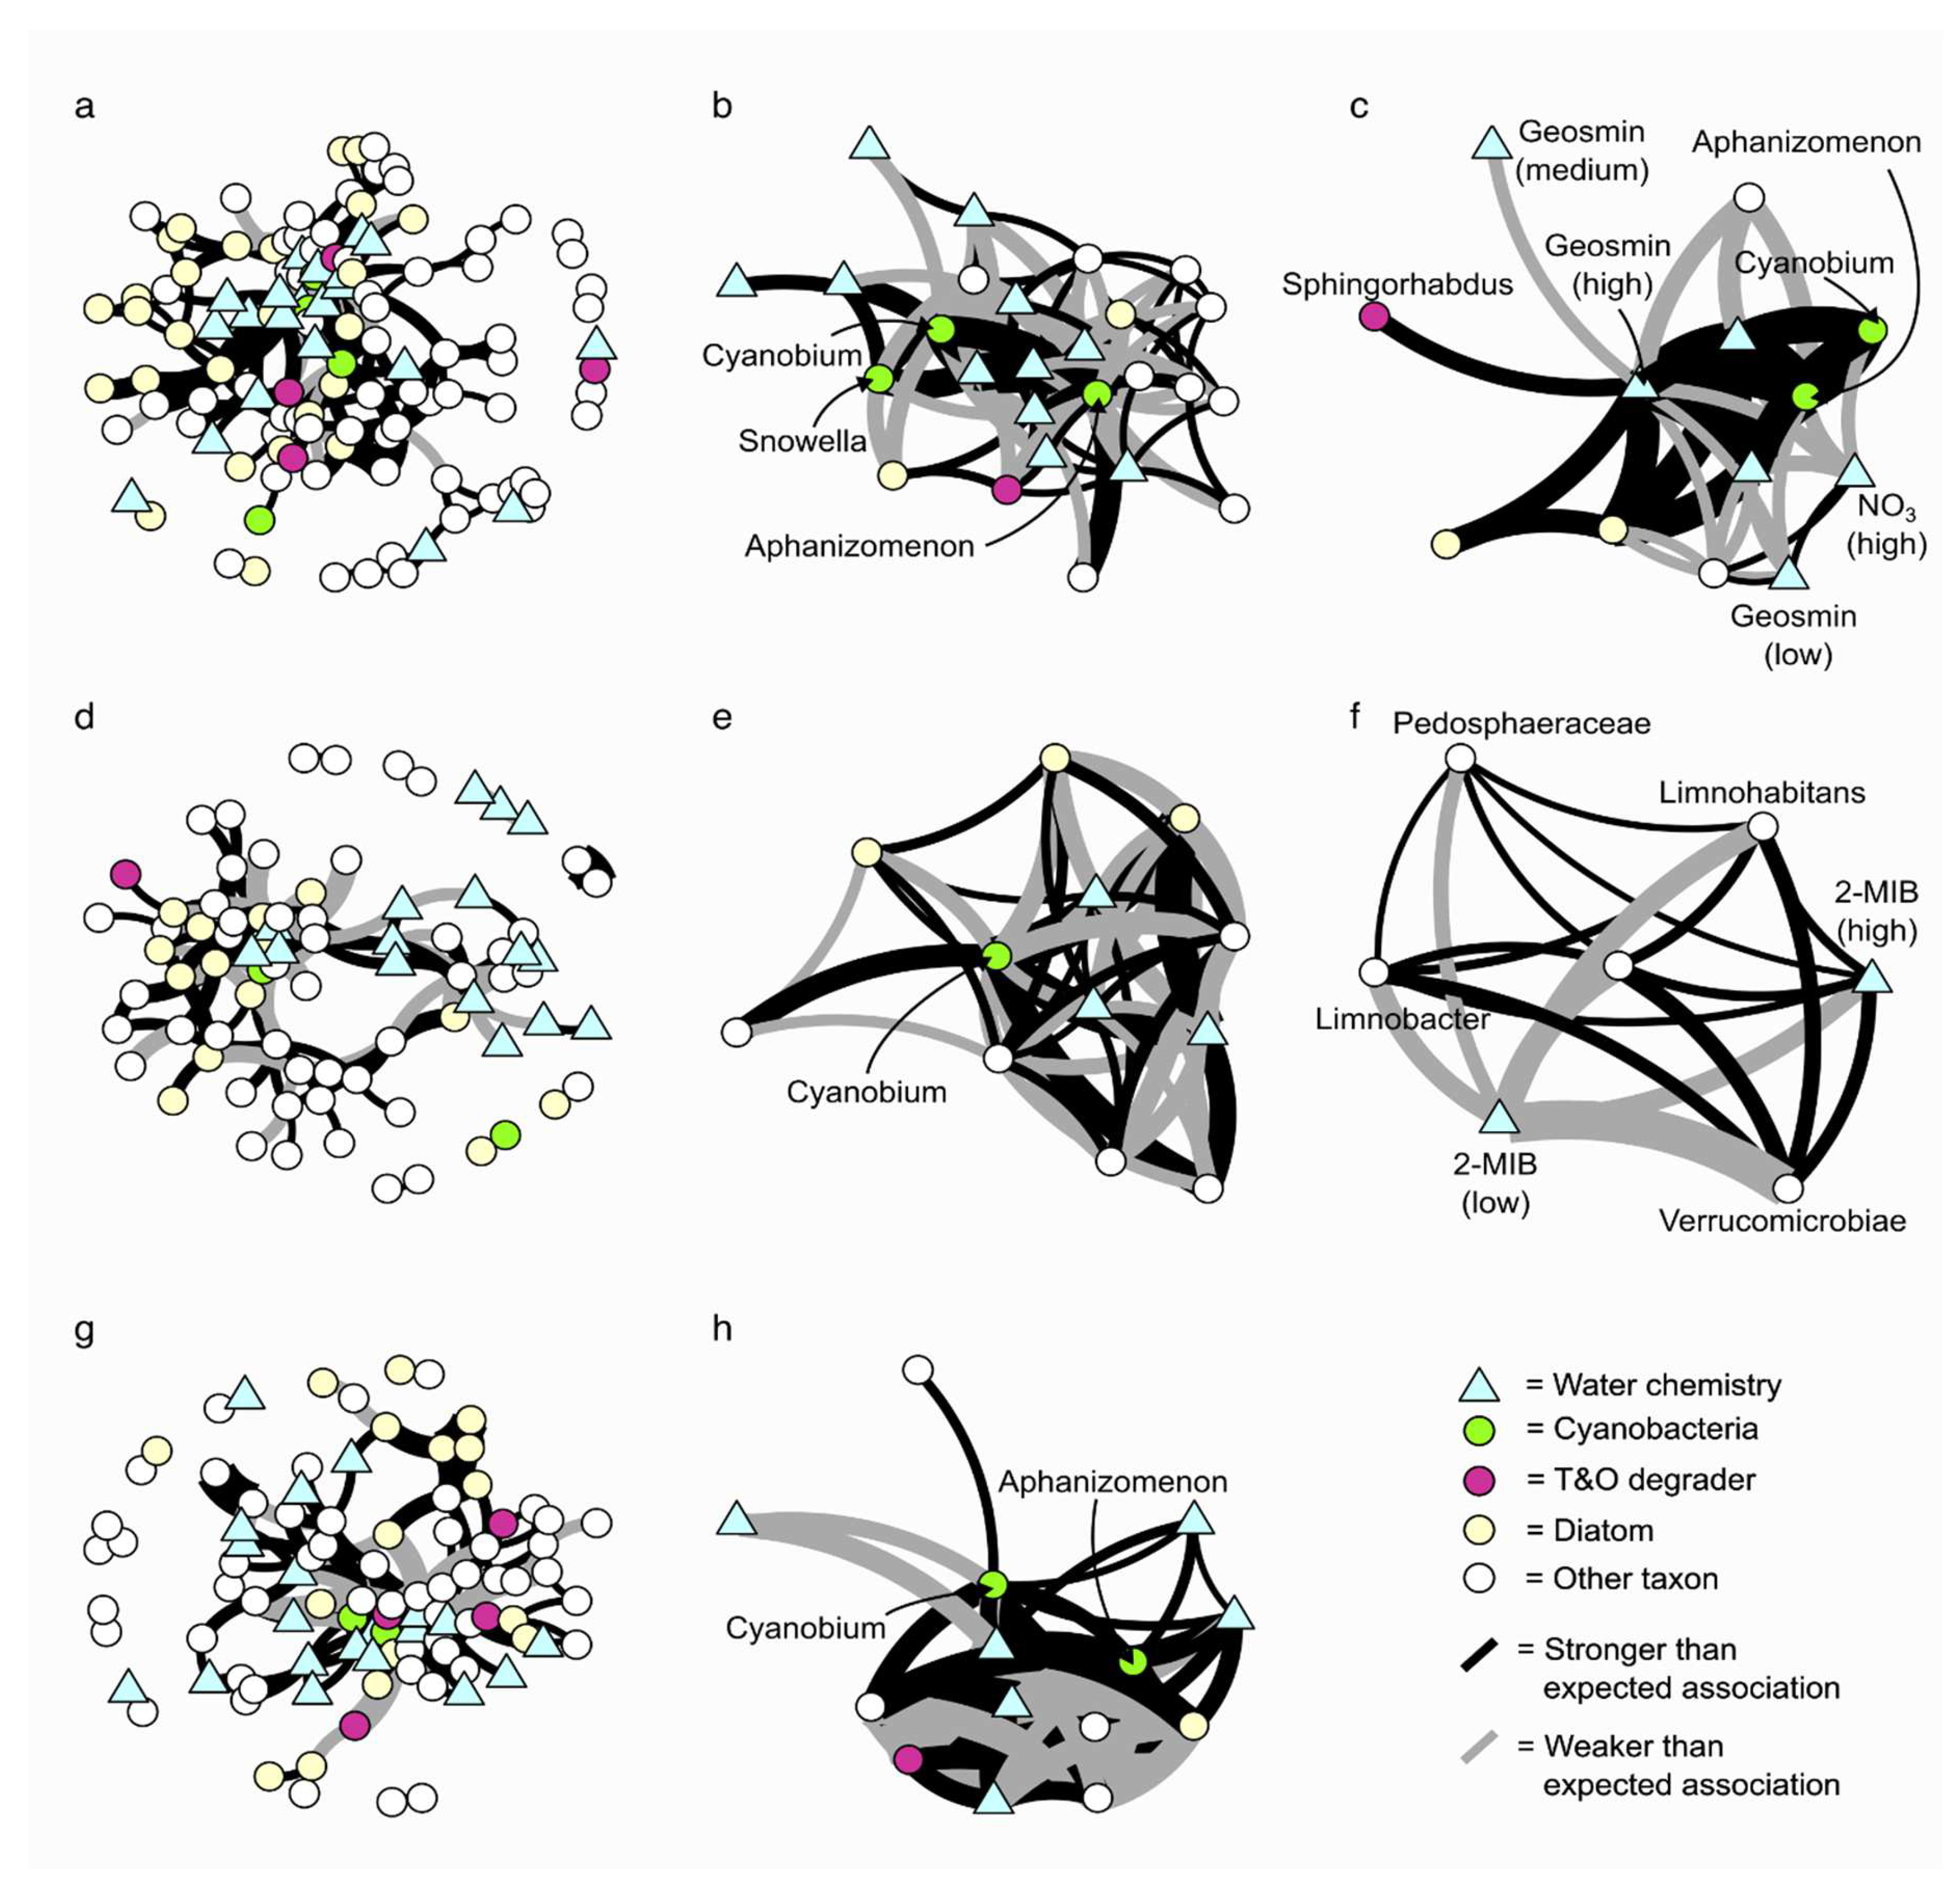

Table 1.
T&O concentration category levels for the T&O metabolites, geosmin and 2-MIB.
| T&O Compound | Category | Concentrations (ng L-1) |
|---|---|---|
| Geosmin | Low | < 5.00 |
| Medium | 5.00 - 20.00 | |
| High | > 20.00 | |
| 2-MIB | Low | < 2.50 |
| Medium | 2.50 - 10.00 | |
| High | > 10.00 |
Table 2.
Nextera tags and primer sets used for primary 16S rRNA (bacteria) and rbcL (algae) NGS amplifications.
Table 2.
Nextera tags and primer sets used for primary 16S rRNA (bacteria) and rbcL (algae) NGS amplifications.
| Name | Sequence (5’ – 3’) | Length (bases) |
Amplicon Size (bases) |
Reference |
|---|---|---|---|---|
| Forward Overhang | TCGTCGGCAGCGTCAGATGTGTATAAGAGACAG | 33 | - | - |
| Reverse Overhang | GTCTCGTGGGCTCGGAGATGTGTATAAGAGACAG | 34 | - | - |
| rbcL646F | ATGCGTTGGAGAGARCGTTTC | 21 | 419 | (Glover, 2019) |
| rbcL998R | GATCACCTTCTAATTTACCWACAACTG | 27 | ||
| 515F | GTGCCAGCMGCCGCGGTAA | 19 | 358 | (Caporaso et al., 2011) |
| 806R | GGACTACHVGGGTWTCTAAT | 20 |
Table 3.
T&O Risk Categories for Taxa Influencing Potential Cyanobacterial Geosmin and 2-MIB Production Based on Shared Ecological Traits.
Table 3.
T&O Risk Categories for Taxa Influencing Potential Cyanobacterial Geosmin and 2-MIB Production Based on Shared Ecological Traits.
| Key Taxa Identified by RF Analysis | Key Taxa Co-occurring with T&O-Producing Cyanobacteria | |||
|---|---|---|---|---|
| T&O Risk Category | Geosmin | 2-MIB | Geosmin | 2-MIB |
| Cyanobacterial T&O Producers | Aphanizomenon NIES81 | Cyanobium PCC-6307 | Aphanizomenon NIES81, Nostocaceae | Cyanobium PCC-6307, Dolichospermum NIES41 |
| T&O Degraders | Pseudomonas, Bacillus | Limnobacter | Bacillus | - |
| Nutrient Enrichment Indicators | Peptostreptococcaceae, Vicinamibacterales Order, Melosira | Armatimonas, Nitzschia | Peptostreptococcaceae, Aulacoseira | Asterionella, Melosira |
| Nutrient Exchange/ Recycling | Limnohabitans, NS9 marine group,Gemmataceae | Fluviicola, Chlamydomonadaceae | Gemmataceae,Rhizobiales A0939 | |
| Cyanobacterial Benefactors | OM27 Clade | Sediminibacterium, OM190 | - | - |
Note: Bold names represent taxa both co-occurring with T&O-producing Cyanobacteria and identified in RF analysis.
Disclaimer/Publisher’s Note: The statements, opinions and data contained in all publications are solely those of the individual author(s) and contributor(s) and not of MDPI and/or the editor(s). MDPI and/or the editor(s) disclaim responsibility for any injury to people or property resulting from any ideas, methods, instructions or products referred to in the content. |
© 2024 by the authors. Licensee MDPI, Basel, Switzerland. This article is an open access article distributed under the terms and conditions of the Creative Commons Attribution (CC BY) license (http://creativecommons.org/licenses/by/4.0/).
Copyright: This open access article is published under a Creative Commons CC BY 4.0 license, which permit the free download, distribution, and reuse, provided that the author and preprint are cited in any reuse.


