
Submitted:
08 December 2024
Posted:
09 December 2024
You are already at the latest version
Abstract
Urban planning is a critical discipline that influences the development and sustainability of cities. In this paper, we describe a holistic methodology for automatically extracting, mapping, and visualizing building footprints in Karachi using Python on Google Colab. This method uses cloud-based technologies to automate the extraction of data from open-source satellite imagery, process this into meaningful spatial formats, and visualize building footprints with minimal human intervention. The methodology is for GIS developers, urban planners, and other stakeholders in urban management, giving a scalable and efficient solution to the complex task of urban spatial analysis. The GoogleBuildingMiner tool, within the mapminer allows easy access to building footprint data by querying the Google Maps API and other relevant sources. The successful extraction of spatial data over 1 km areas compatible with any GIS software demonstrates the wide applicability of the method for extracting the building footprint on a global scale. The results show how much Python-driven automation might increase the accuracy of the data extracted, reduce the time involved in manual digitization, and standardize the output formats into an acceptable format for subsequent analyses and decision-making purposes.
Keywords:
Automated Mapping
; Building Footprints
; Urban Planning
; GIS Development
; Python
; Google Colab
; Coding for Spatial Analysis
; Visualization vector data with python
1. Introduction
The rapid urban growth of populations has put increasing demands on the urban planning systems to manage space efficiently, infrastructure, and resources use (Baqa et al, 2021). Within big cities like Karachi which is characterized by rapid and continuous urbanization and expansion in spatial. Good and accurate mapping analysis of built environments is important in effective management of the same. Such mapping, whether done traditionally or by survey methods, which includes manual digitization from aerial images or satellite data, is slow, error prone, and not scalable.
Techniques such as extracting building footprints from satellite images through automation greatly enhance efficiency and accuracy (Rastogi et al, 2022). Python is one of the strong, yet open-source programming languages; this gives strong libraries to be used in spatial data analysis and visualization. Google Colab is a cloud-based platform for doing Python programming that gives an accessible environment which does not require local computational resources and hence allows for efficient implementation of solutions by the developers of GIS in a collaborative way (Shackelford et al, 2004).
Traditional Mapping Techniques: Inadequate Methods
For decades, a traditional approach to mapping used manual digitization from aerial images or satellite data, which poses significant drawbacks (Lightfoot & Butler, 1987). The process involves the human operators who manually identify and trace features such as building footprints, roads, or vegetation from satellite images or aerial photographs. This is very time-consuming because it requires proper detailed analysis of each image that would take days or weeks for the large areas. Plus, such manual digitization is prone to human judgement errors such as false interpretation of features or the wrong marking of boundaries (Brunsdon & Openshaw, 2024). Like distinguishing between similar objects such as buildings and roads, it tends to go wrong especially in the complexity of the urban environment. Methods are also not scalable; they do become impractical for large-scale mapping projects because the time and effort needed increase exponentially with a growing area being mapped, as outlined by Ge et al, 2024.
Automated Techniques for Building Footprint Extraction: The Solution
Automatic satellite images machine learning algorithms for processing will identify the footprints of buildings. This might produce really fast maps compared to the human operators. These can identify complicated patterns in a satellite image with features such as different textures and shapes that denote buildings minimizing errors typical in such manual processes (Abujayyab et al, 2023). Automation can easily scale to handle large geographic areas, making it feasible to map entire cities or countries quickly and accurately, this scalability also means that maps can be updated more frequently providing more accurate and up-to-date information for urban planning, disaster response, and other applications.
Python and Its Applicability in Spatial Data Analysis
Because the Python language has powerful libraries specifically designed to handle geographic information, it is utilized up to optimum level and has been one of the commonly used programming languages in spatial data analysis (Genale, 2024). Such libraries as Rasterio, Geopandas, OpenCV, and Scikit-Image help developers efficiently process and analyze spatial data. Library Rasterio simplifies the working process of raster data like satellite images. Geopandas will be used for processing vector data, which may assume a form like shapefiles or GeoJSON. For extracting building footprints, one would need other libraries such as OpenCV and Scikit-Image, which have built-in tools for edge detection and segmentation, among others, that are very crucial for identifying boundary boundaries of buildings (Kumar et al, 2023). Model development and training in machine learning frameworks such as TensorFlow and PyTorch can automatically detect the building footprint from the satellite image, providing higher accuracy and efficiency than the traditional method (Campoverde, 2023; Restrepo-Carmona et al., 2024).
Google Colab: Cloud-Based Platform for Collaborative GIS Development
Google Colab offers free-of-charge, cloud-based access eliminating the need for locally sourced computation resources while running Python code (Tamiminia et al., 2020). This has been an advantage especially for a GIS developer charged with the task of processing enormous spatial datasets or machine learning models with the aim of building footprint extraction. It is free of cost, and there is a simple interface through which to smoothly interact with different Google applications, notably Google Drive, which facilitates processes like saving and sharing data and outputs. Even more important in terms of enhancing the efficiency of the runtimes for machine learning algorithms is access to much stronger computational capabilities, such as Graphics Processing Units (GPUs) (Mutanga & Kumar, 2019). Hardware acceleration is particularly relevant in scenarios where large satellite imagery exists or deep learning frameworks are implemented and require considerable computing power for processing (Wu, 2020). Further, Google Colab allows for real-time collaboration, meaning that teams can collaborate on a GIS project, share the results, and track efforts within a single, interactive environment. This makes it highly effective for developers working on automated mapping solutions, as both effectiveness and collaborative work are significantly enhanced.
Building Footprint Mapping
Mapping building footprints is one of the important components in urban studies, revealing the spatial organization and growth of urban areas (Guo et al., 2022). Traditionally, the mapping of building footprints has been mainly based on manual methods with heavy labor requirements and largely based on outdated or incomplete data sets. However, recent developments in remote sensing technologies, geographic information systems (GIS), and data science have allowed for a reduction in labor requirements while increasing accuracy.
This research will be achieved by using the features of Python programming, such as mapping and automating the analysis of building footprints in Karachi, using Google Colab. Such large geospatial libraries offer flexibility and versatility in managing and visualizing spatial data, supported by GeoPandas, Holoviews, and GeoViews in Python. This study will provide an all-inclusive mapping solution for urban planners to analyze building density, land use patterns, and proximity to vital facilities, including schools, hospitals, and public transportation, by utilizing high-resolution satellite images with open-source datasets (Daranagama & Witayangkurn, 2021).
This study is outline and analyze the footprints of buildings in Karachi through geospatial data extraction and visualization techniques involving Python libraries. The overall view is to get an integrated view of spatial arrangement, building density, and distribution patterns in the city. It will further be able to evaluate the spatial dynamics of the city, direct supportive infrastructure development, and present a sustainable management approach for urban governance.
3. Methodology
3.1. Data Acquisition
The Google Earth Pro has been utilized to collect an accurate coordinates position and its utilization, as in Figure 1, (latitude and longitude coordinates (24.903 N, 67.116 E). Python libraries have been used like geemap, which allows for interaction with Google Earth Engine (GEE), to collect data relevant to the urban areas of Karachi. In this methodology, high-resolution satellite images are used from Google Earth Engine (GEE) and other open-source sources. Such platforms offer broad global coverage of remote sensing data, including up-to-date satellite imagery that can be used to analyze buildings. These images are accessed through Python libraries in the Google Colab environment. These include `geemap`, which creates an interface with GEE, thereby allowing the data to be extracted relevant to the urban areas of Karachi.
3.2. Building Footprint Extraction
The core of the methodology is the automated extraction of building footprints from satellite imagery. We use the `MapMiner` Python package, which allows for the automated retrieval of building data, leveraging machine learning models and geospatial processing techniques.
The `GoogleBuildingMiner` tool within `MapMiner` facilitates easy access to building footprint data by querying the Google Maps API and other relevant sources. By specifying a latitude, longitude, and radius (in meters), we can extract a detailed set of building footprints over the area of interest.
3.3. Data Processing and Transformation
The raw building footprint data retrieved from the cloud-based sources is typically provided in JSON or GeoJSON format. Using libraries such as `geopandas`, we process this data into spatial data structures (i.e., GeoDataFrames) for further analysis. This step involves:
- Cleaning: Removing erroneous or redundant data points.
- Conversion: Transforming coordinate systems to ensure consistency with other data sources (e.g., converting from EPSG:4326 to a local projection).
- Aggregation: Combining individual building footprints into larger regions or districts if needed for spatial analysis.
We then save the cleaned data as Shapefiles, a widely accepted format in the GIS community, ensuring that it is compatible with other GIS tools.
3.4. Visualization
Visualization plays a key role in urban planning, as it helps stakeholders better understand spatial patterns. In this methodology, we utilize the power of Python’s `holoviews` and `hvplot` libraries for interactive, high-quality visualizations. These libraries allow us to overlay building footprints on various basemaps, such as ESRI satellite imagery or OpenStreetMap tiles. In Google Colab, these visualizations are rendered interactively, allowing users to zoom, pan, and explore building footprints within the context of Karachi’s urban environment.
3.5. Automation and Scalability
The entire pipeline from data acquisition to visualization is automated, enabling users to scale the process to cover larger regions or to update building footprints over time. Python scripts running on Google Colab can be scheduled or run on-demand, automating repetitive tasks that would otherwise require manual intervention (Abujayyab et al, 2023).
4. Results and Discussion
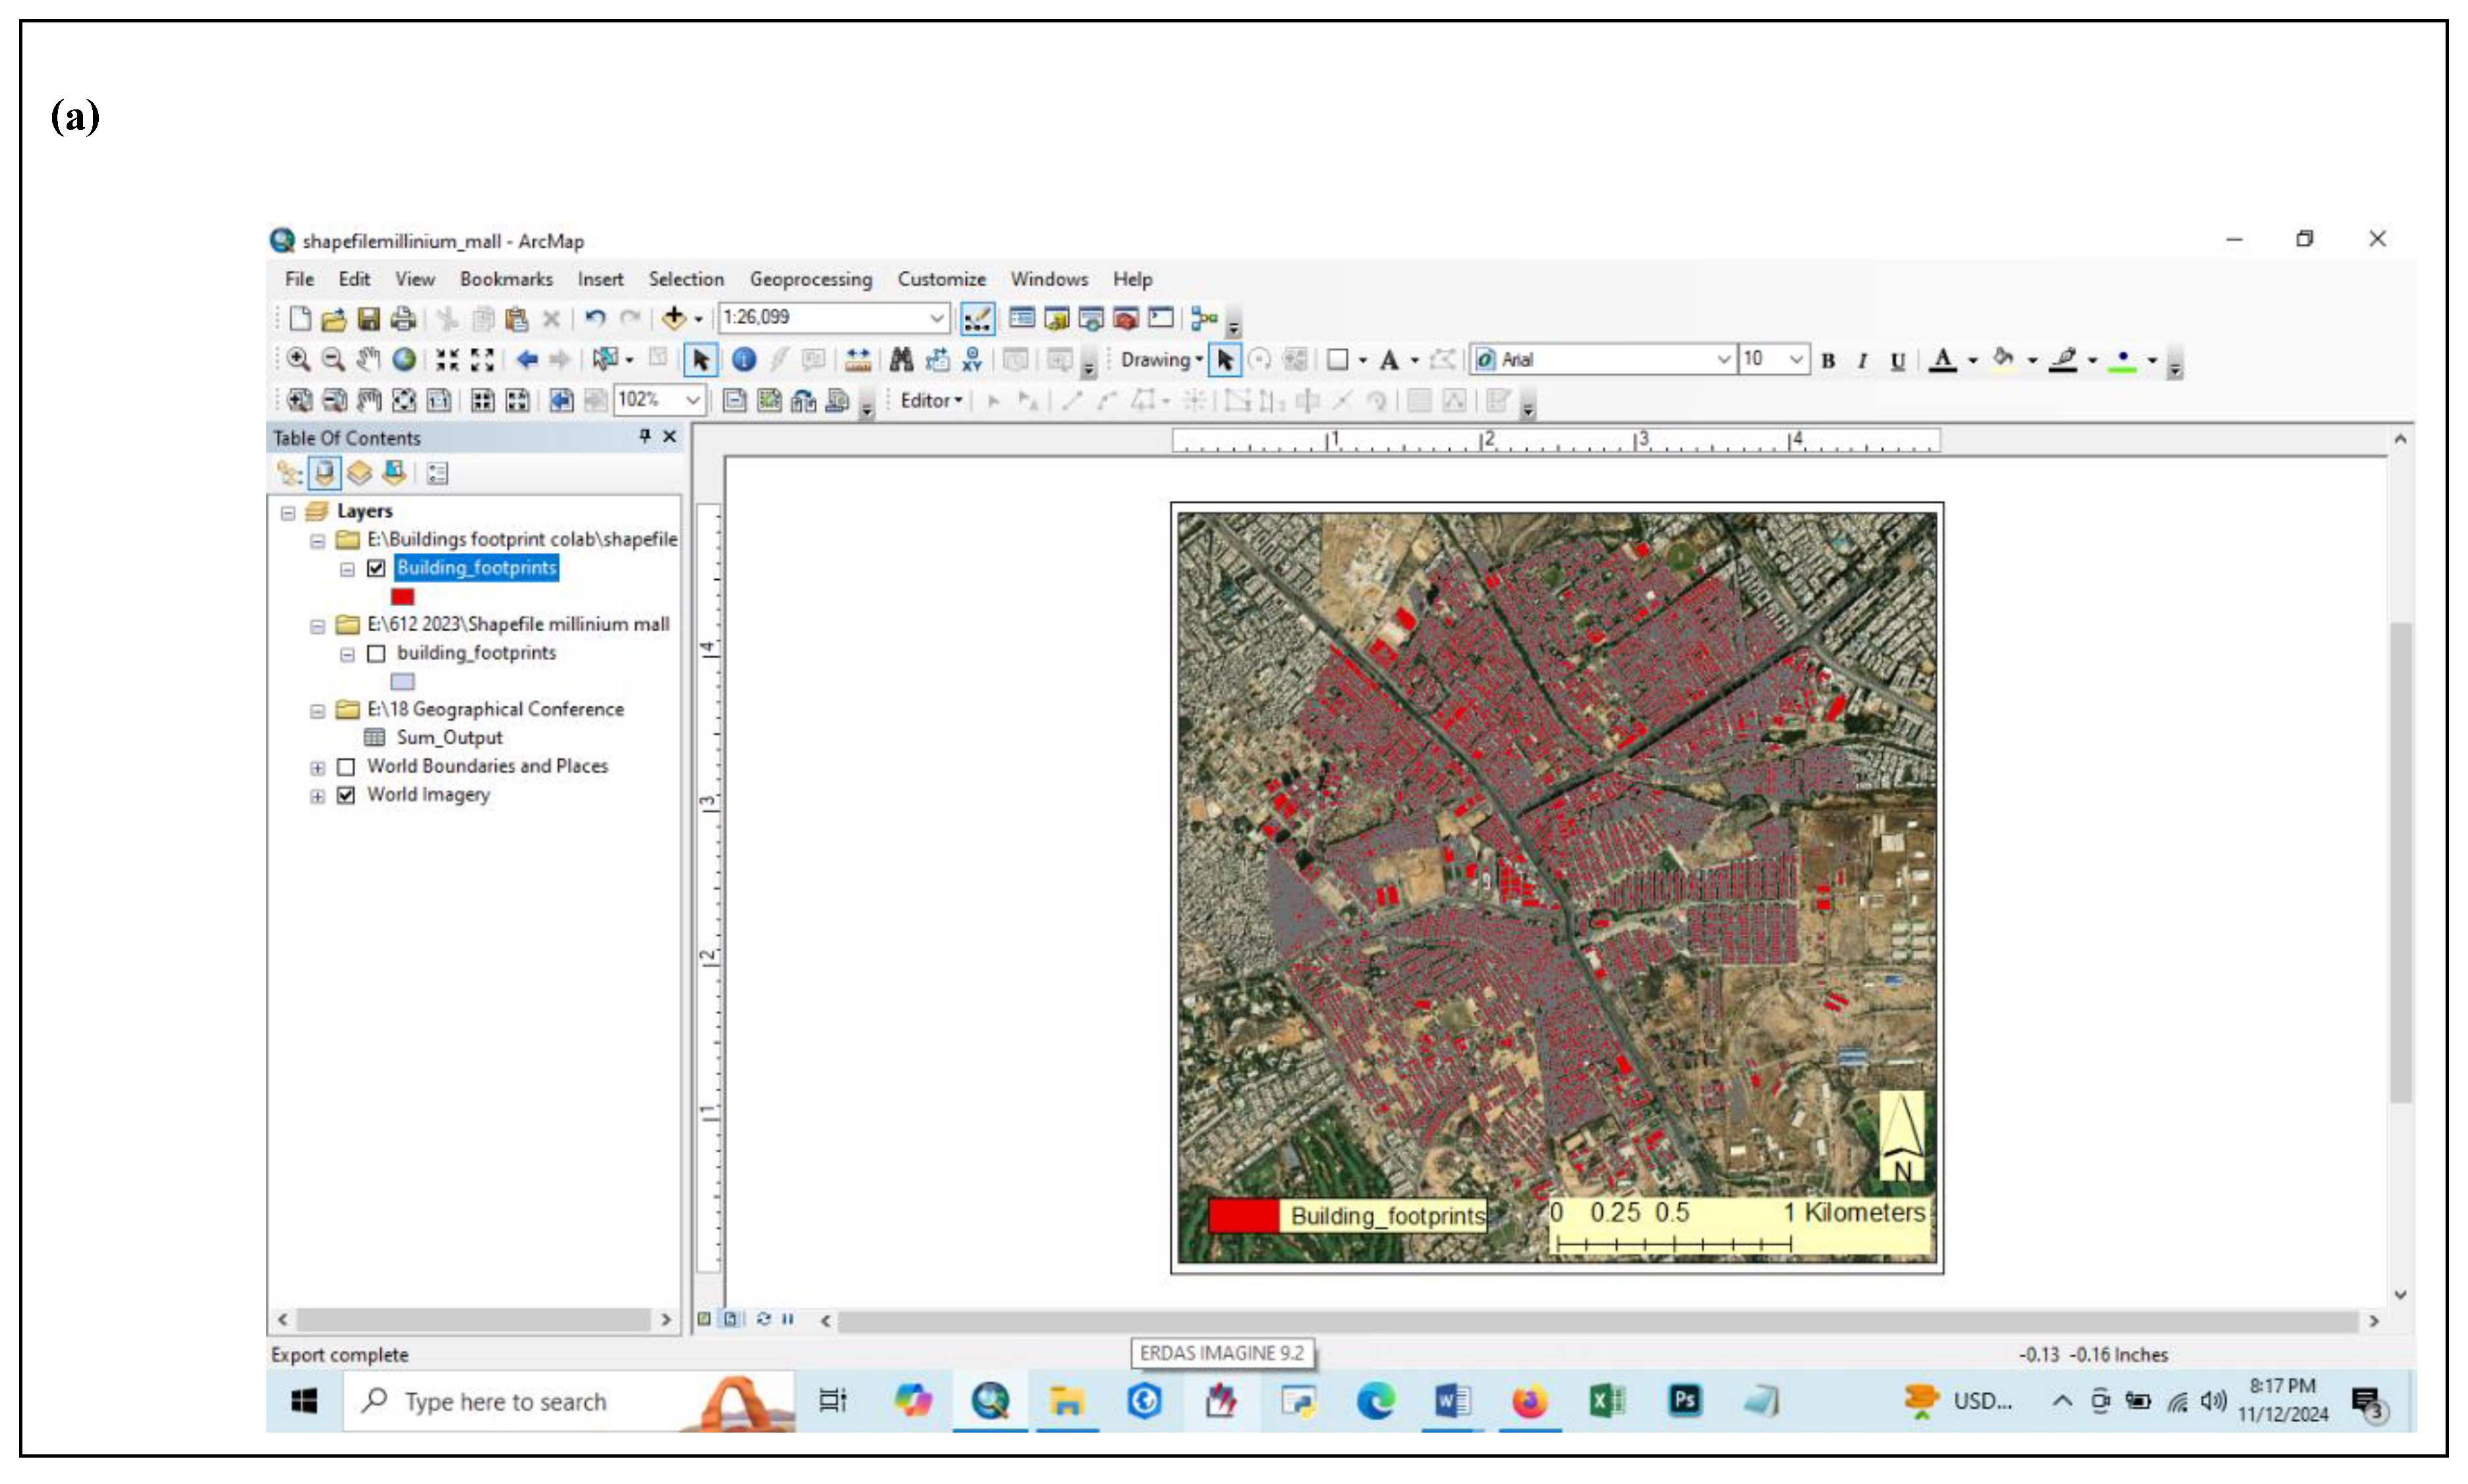
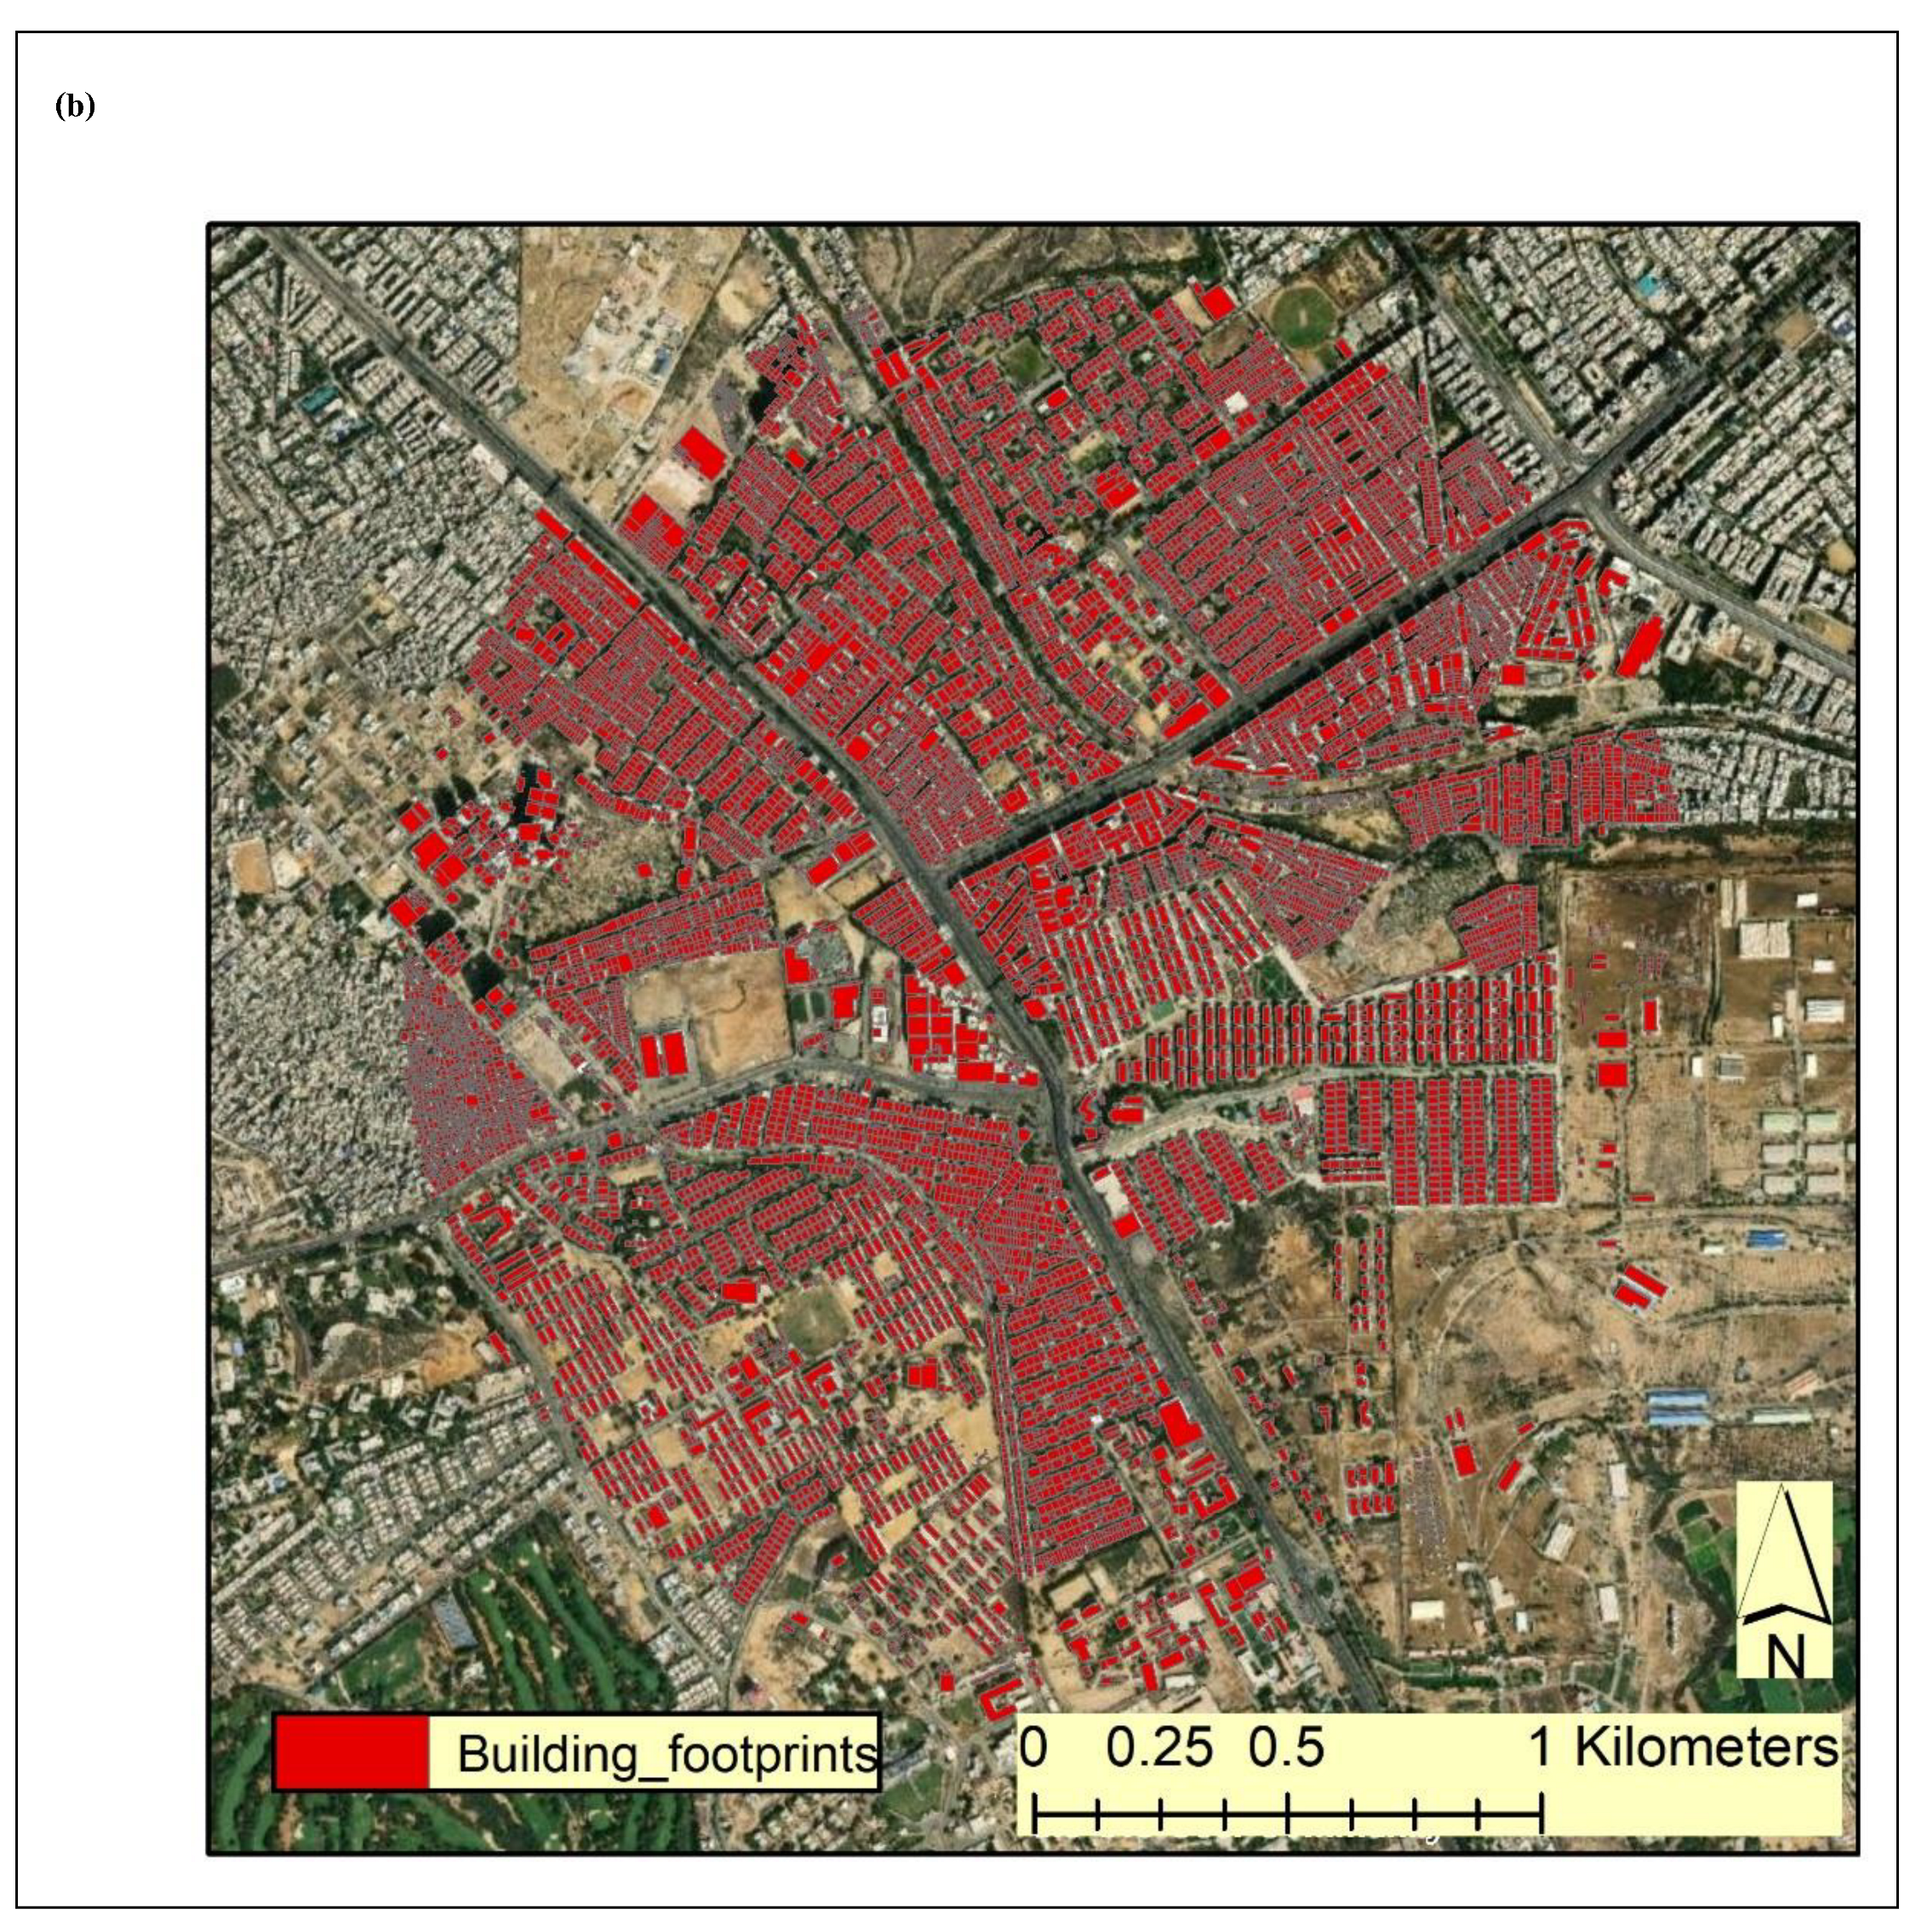
The integration of cloud-based technologies and Python automation has proven highly effective for building footprint extraction in urban spatial analysis and planning. Utilizing the GoogleBuildingMiner tool with open-source satellite imagery, building footprints were successfully extracted over 1 km² areas (see Figure 2), showcasing the method's scalability and efficiency in large-scale data collection. Achieving high accuracy, the approach consistently identified intricate building geometries, even in densely populated urban regions, and produced data readily compatible with various GIS software formats. Figure 3 illustrates building footprint extraction using ESRI satellite imagery, while Figure 4 presents a plot size assessment through a geodatabase. The extracted building footprints were saved as shapefile, which were imported into ArcGIS for further analysis, as shown in Figure 5(a). Subsequently, a detailed layout was developed, as depicted in Figure 5(b).
Discussion:
4.1. Accuracy and Quality of Extracted Footprints
The automated technique performed well and precisely obtained data and information. This is highly accurate when compared to the manually digitized footprints (Fan et al., 2014). Despite its dependency on the quality and resolution of the input satellite imagery, the efficiency of the constructed building footprints was satisfactory, even in the densest urban areas due to a large number of structures (Xu et al., 2017). Obtained Data is cross-checked for verification with the existing cadastral maps and building information provided by the municipal authorities. The automated system extracted building footprints very accurately.
4.2. Time and Cost Efficiency
The automated method saves much time and efforts required in the process of mapping footprints, building footprint extraction from high-resolution satellite imagery through digitizing can take up hours or days, considering the area. In this regard, the automated procedure with coding makes possible the extraction of considerable building footprints in as short as a minute and thus becomes a very convenient method for GIS developers and urban planners (Gua et al, 2023).This saving time is especially important for fast-paced urban projects, with data slated to be timely in order to provide good decision-making.
4.3. Standardization and Repeatability
Standardized instruments like Python and Google Colab are made possible this methods, which enable the repeated reproduction and iteration of outputs, each step starting from scraping to visualization are captured through scripts which become easily reusable and modifiable based on different cities or regions (Brovelli & Zamboni, 2018; Kedron et al., 2021). The process of standardization improves the reproducibility of results and offers quality spatial data, which is a must for urban planners to perform their projects (Hecht et al, 2013).
5. Conclusion
This research investigation will thus offer an efficient, scalable, and economically viable way of extracting, mapping, and visualizing building footprints using Python and Google Colab in the context of Karachi. This optimized workflow will thus reduce labor burdens, improve the accuracy of the data, and provide an easy means of generating current building footprint maps in the city for effective planning. With Google Colab's cloud infrastructure, relatively large datasets can be processed using minimal hardware, hence enhancing real-time collaboration without much reliance on high-end computational resources. This automated methodology significantly improves speed, accuracy, and standardization in the extraction of data while offering huge benefits to urban planning through reduced labor costs and more informed decisions.
Funding
This work did not receive any external funding.
Code Availability
Codes can be share upon request.
Acknowledgments
The authors would like to acknowledge the support of Google Colab and the open-source community for providing the tools that made this work possible. Additionally, we thank the developers of the `MapMiner` and `holoviews` Python packages for their contributions to the success of this methodology.
Conflicts of Interest
The authors declare no conflicts of interest in this research.
References
- Abujayyab, S. K. , Almajalid, R., Wazirali, R., Ahmad, R., Taşoğlu, E., Karas, I. R., & Hijazi, I. Integrating object-based and pixel-based segmentation for building footprint extraction from satellite images. Journal of King Saud University-Computer and Information Sciences 2023, 35, 101802. [Google Scholar]
- Baqa, M. F. , Chen, F., Lu, L., Qureshi, S., Tariq, A., Wang, S.,... & Li, Q. Monitoring and modeling the patterns and trends of urban growth using urban sprawl matrix and CA-Markov model: A case study of Karachi, Pakistan. Land 2021, 10, 700. [Google Scholar]
- Brovelli, M. A. , & Zamboni, G. A new method for the assessment of spatial accuracy and completeness of OpenStreetMap building footprints. ISPRS International Journal of Geo-Information 2018, 7, 289. [Google Scholar]
- Brunsdon, C. , & Openshaw, S. (2024). Error simulation in vector GIS using neural computing methods. In Innovations in GIS (pp. 177–200). CRC Press.
- Campoverde, C. (2023). Automatic building roof plane structure extraction from remote sensing data for lod2 3D city modelling (Master's thesis, University of Twente).
- Daranagama, S. , & Witayangkurn, A. Automatic building detection with polygonizing and attribute extraction from high-resolution images. ISPRS International Journal of Geo-Information 2021, 10, 606. [Google Scholar]
- Fan, H. , Zipf, A., Fu, Q., & Neis, P. Quality assessment for building footprints data on OpenStreetMap. International Journal of Geographical Information Science 2014, 28, 700–719. [Google Scholar]
- Ge, H. , Qiu, S., Hou, Q., Wang, J., & Ai, C. Development of a large-scale horizontal curve inventory for safety analysis using open GIS data. Intelligent Transportation Infrastructure 2024, liae015. [Google Scholar]
- Genale, A. S. Big Data Analytics for Geospatial Application Using Python. Ethics, Machine Learning, and Python in Geospatial Analysis 2024, 254-278.
- Guo, H. , Du, B., Wu, C., Su, X., & Zhang, L. Expediting Building Footprint Segmentation from High-resolution Remote Sensing Images via progressive lenient supervision. arXiv 2023, arXiv:2307.12220. [Google Scholar]
- Guo, H. , Du, B., Zhang, L., & Su, X. A coarse-to-fine boundary refinement network for building footprint extraction from remote sensing imagery. ISPRS Journal of Photogrammetry and Remote Sensing 2022, 183, 240–252. [Google Scholar]
- Hecht, R. , Kunze, C., & Hahmann, S. Measuring completeness of building footprints in OpenStreetMap over space and time. ISPRS International Journal of Geo-Information 2013, 2, 1066–1091. [Google Scholar]
- Kedron, P. , Li, W., Fotheringham, S., & Goodchild, M. Reproducibility and replicability: Opportunities and challenges for geospatial research. International Journal of Geographical Information Science 2021, 35, 427–445. [Google Scholar]
- Kumar, V. Ali, A., & Chaudhuri, S. S. (2023). RNCE: A New Image Segmentation Approach. In Computer Vision and Machine Intelligence: Proceedings of CVMI 2022 (pp. 553–563). Singapore: Springer Nature Singapore.
- Lightfoot, D. R. , & Butler, D. R. Recognition and assessment of error in geographic information systems. Photogrammetric Engineering and Remote Sensing 1987, 53, 1423–1430. [Google Scholar]
- Liu, T. , Yao, L., Qin, J., Lu, N., Jiang, H., Zhang, F., & Zhou, C. Multi-scale attention integrated hierarchical networks for high-resolution building footprint extraction. International Journal of Applied Earth Observation and Geoinformation 2022, 109, 102768. [Google Scholar]
- Mutanga, O. , & Kumar, L. Google earth engine applications. Remote sensing 2019, 11, 591. [Google Scholar]
- Rajamani, T. , Sevugan, P., & Ragupathi, S. Automatic building footprint extraction and road detection from hyperspectral imagery. Journal of Electronic Imaging 2023, 32, 011005–011005. [Google Scholar]
- Rastogi, K. , Bodani, P., & Sharma, S. A. Automatic building footprint extraction from very high-resolution imagery using deep learning techniques. Geocarto International 2022, 37, 1501–1513. [Google Scholar]
- Restrepo-Carmona, J. A. , Zuluaga, J. C., Velásquez, M., Zuluaga, C., Villamil, R. M., Morales, O.,... & Vásquez, R. E. Smart Supervision of Public Expenditure: A Review on Data Capture, Storage, Processing, and Interoperability with a Case Study from Colombia. Information 2024, 15, 616. [Google Scholar]
- Shackelford, A. K. , Davis, C. H., & Wang, X. (2004, September). Automated 2-D building footprint extraction from high-resolution satellite multispectral imagery. In IGARSS 2004. 2004 IEEE International Geoscience and Remote Sensing Symposium (Vol. 3, pp. 1996–1999). IEEE.
- Tamiminia, H. , Salehi, B., Mahdianpari, M., Quackenbush, L., Adeli, S., & Brisco, B. Google Earth Engine for geo-big data applications: A meta-analysis and systematic review. ISPRS journal of photogrammetry and remote sensing 2020, 164, 152–170. [Google Scholar]
- Wu, Q. geemap: A Python package for interactive mapping with Google Earth Engine. Journal of Open Source Software 2020, 5, 2305. [Google Scholar] [CrossRef]
- Xu, Y. , Chen, Z., Xie, Z., & Wu, L. Quality assessment of building footprint data using a deep autoencoder network. International Journal of Geographical Information Science 2017, 31, 1929–1951. [Google Scholar]
Figure 1.
Google earth pro for obtaining latitude /longitude readings.
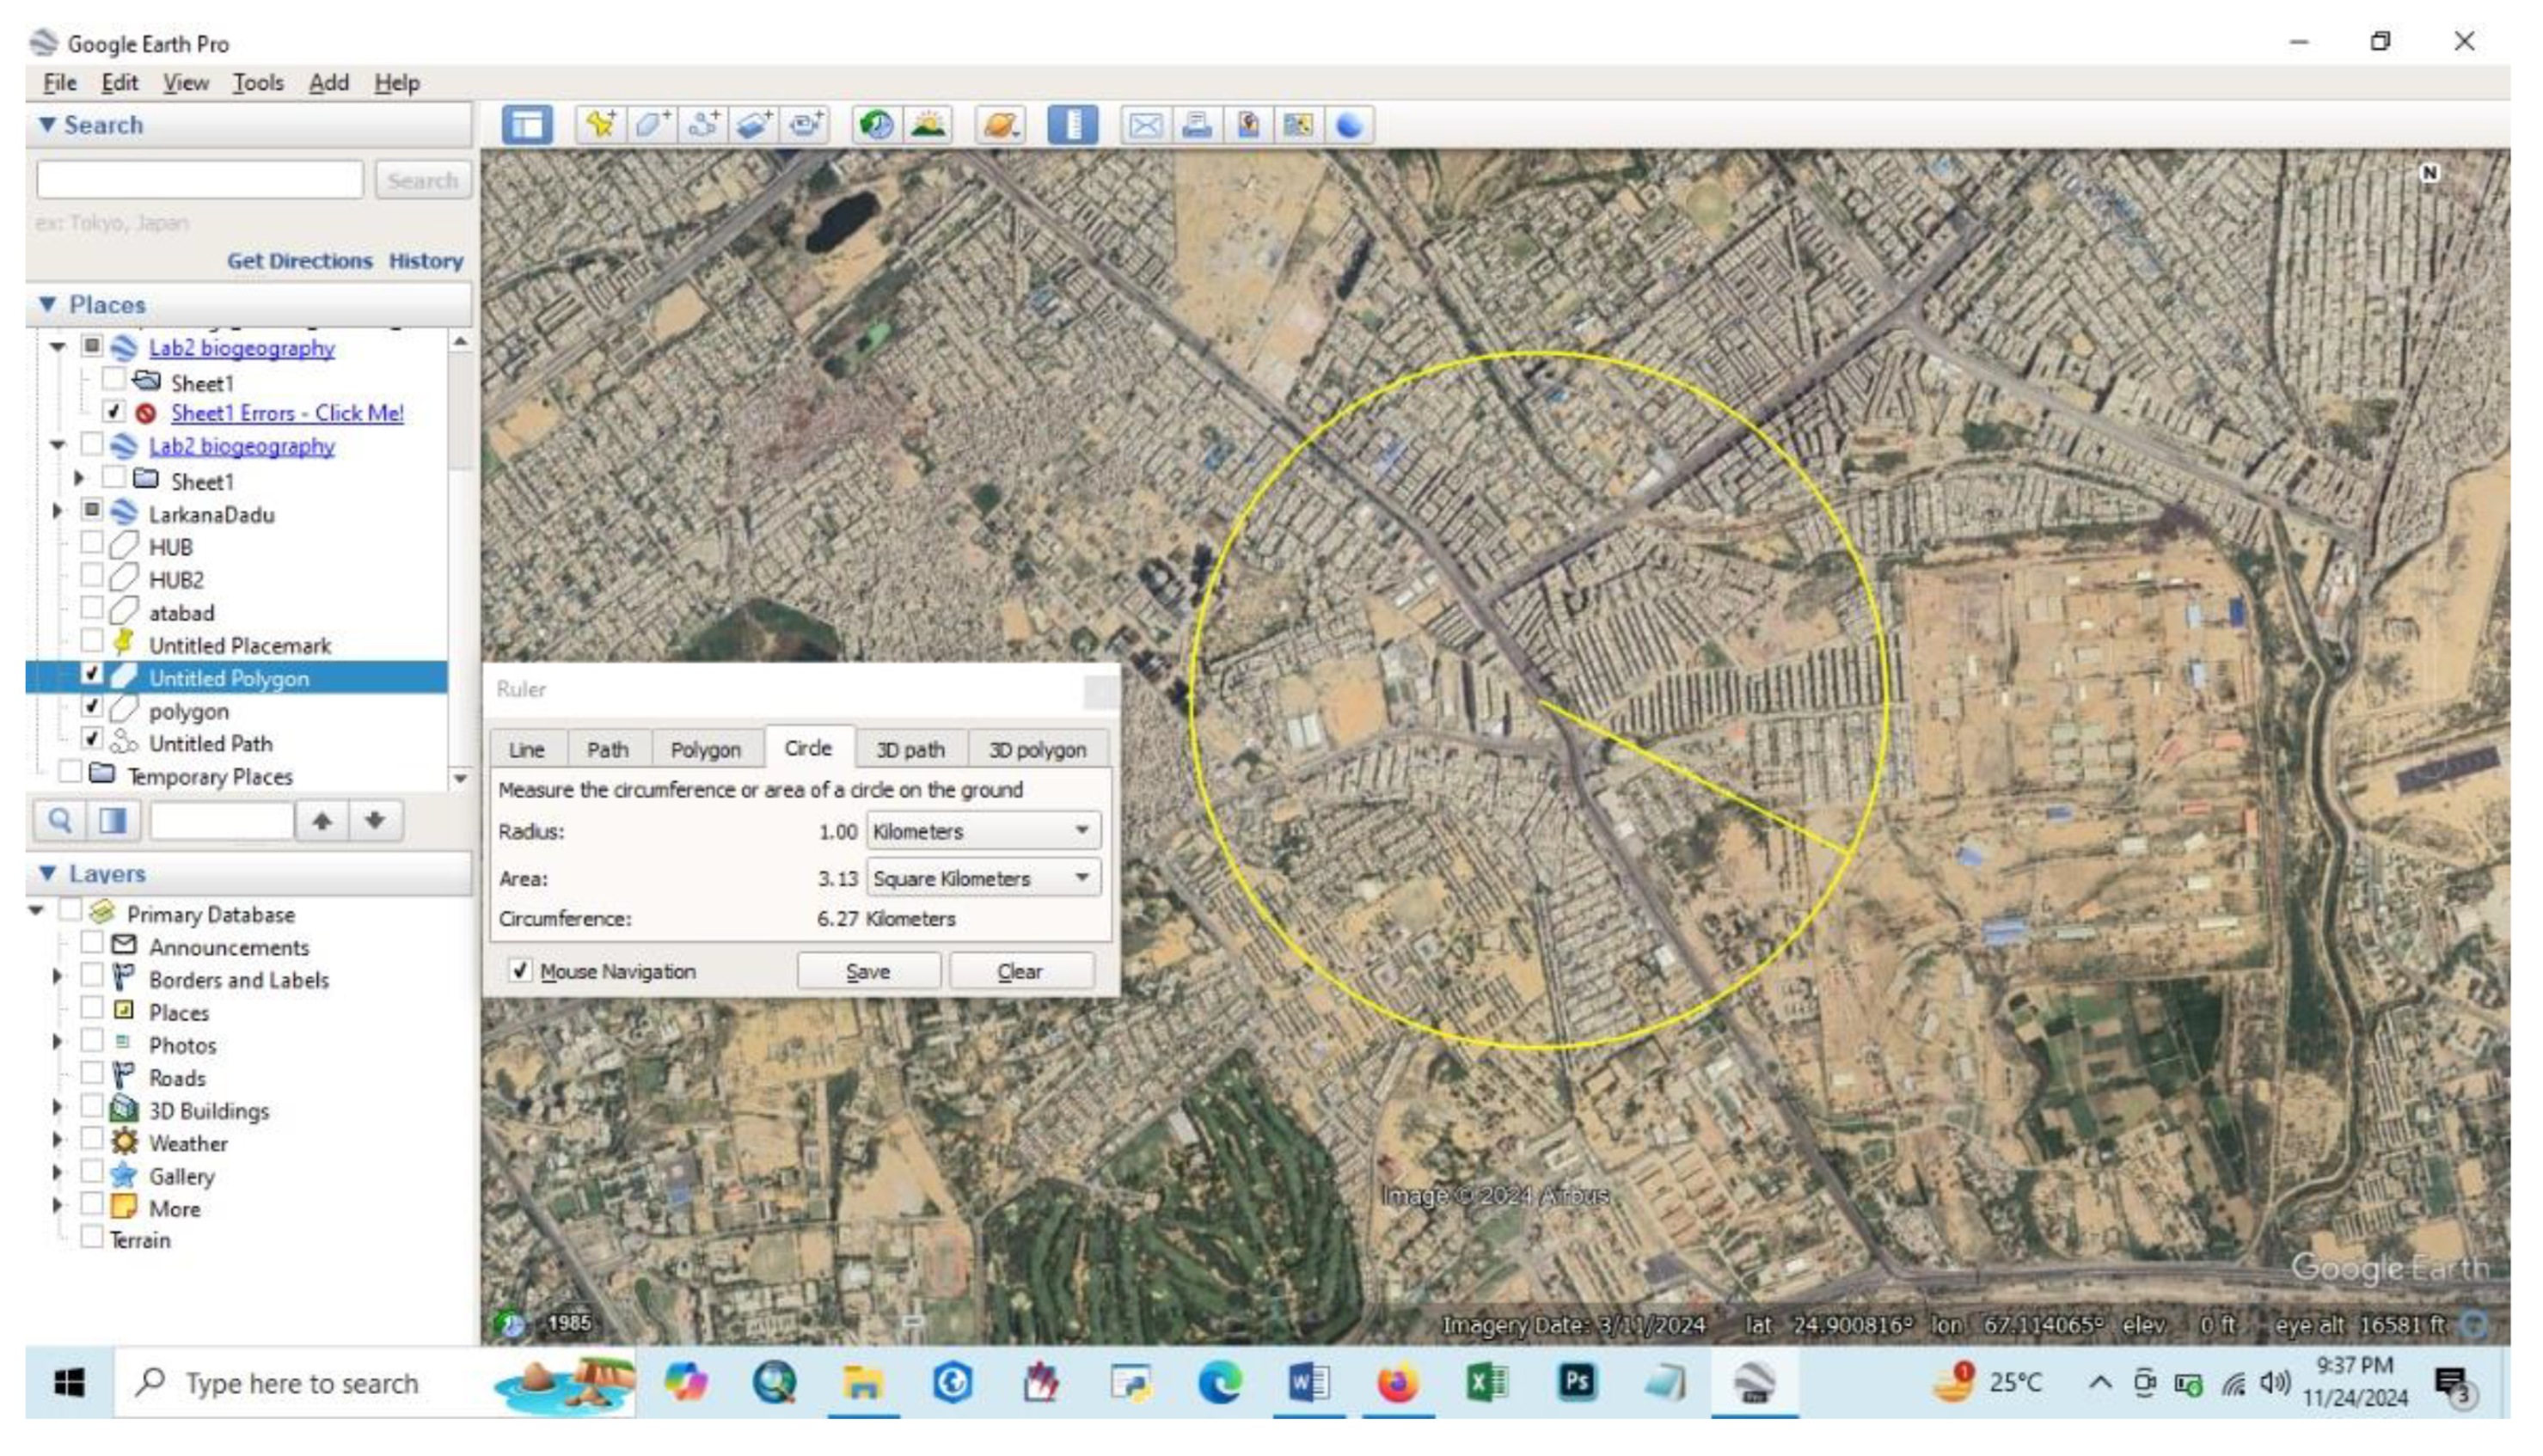
Figure 2.
automation for building footprint extraction.
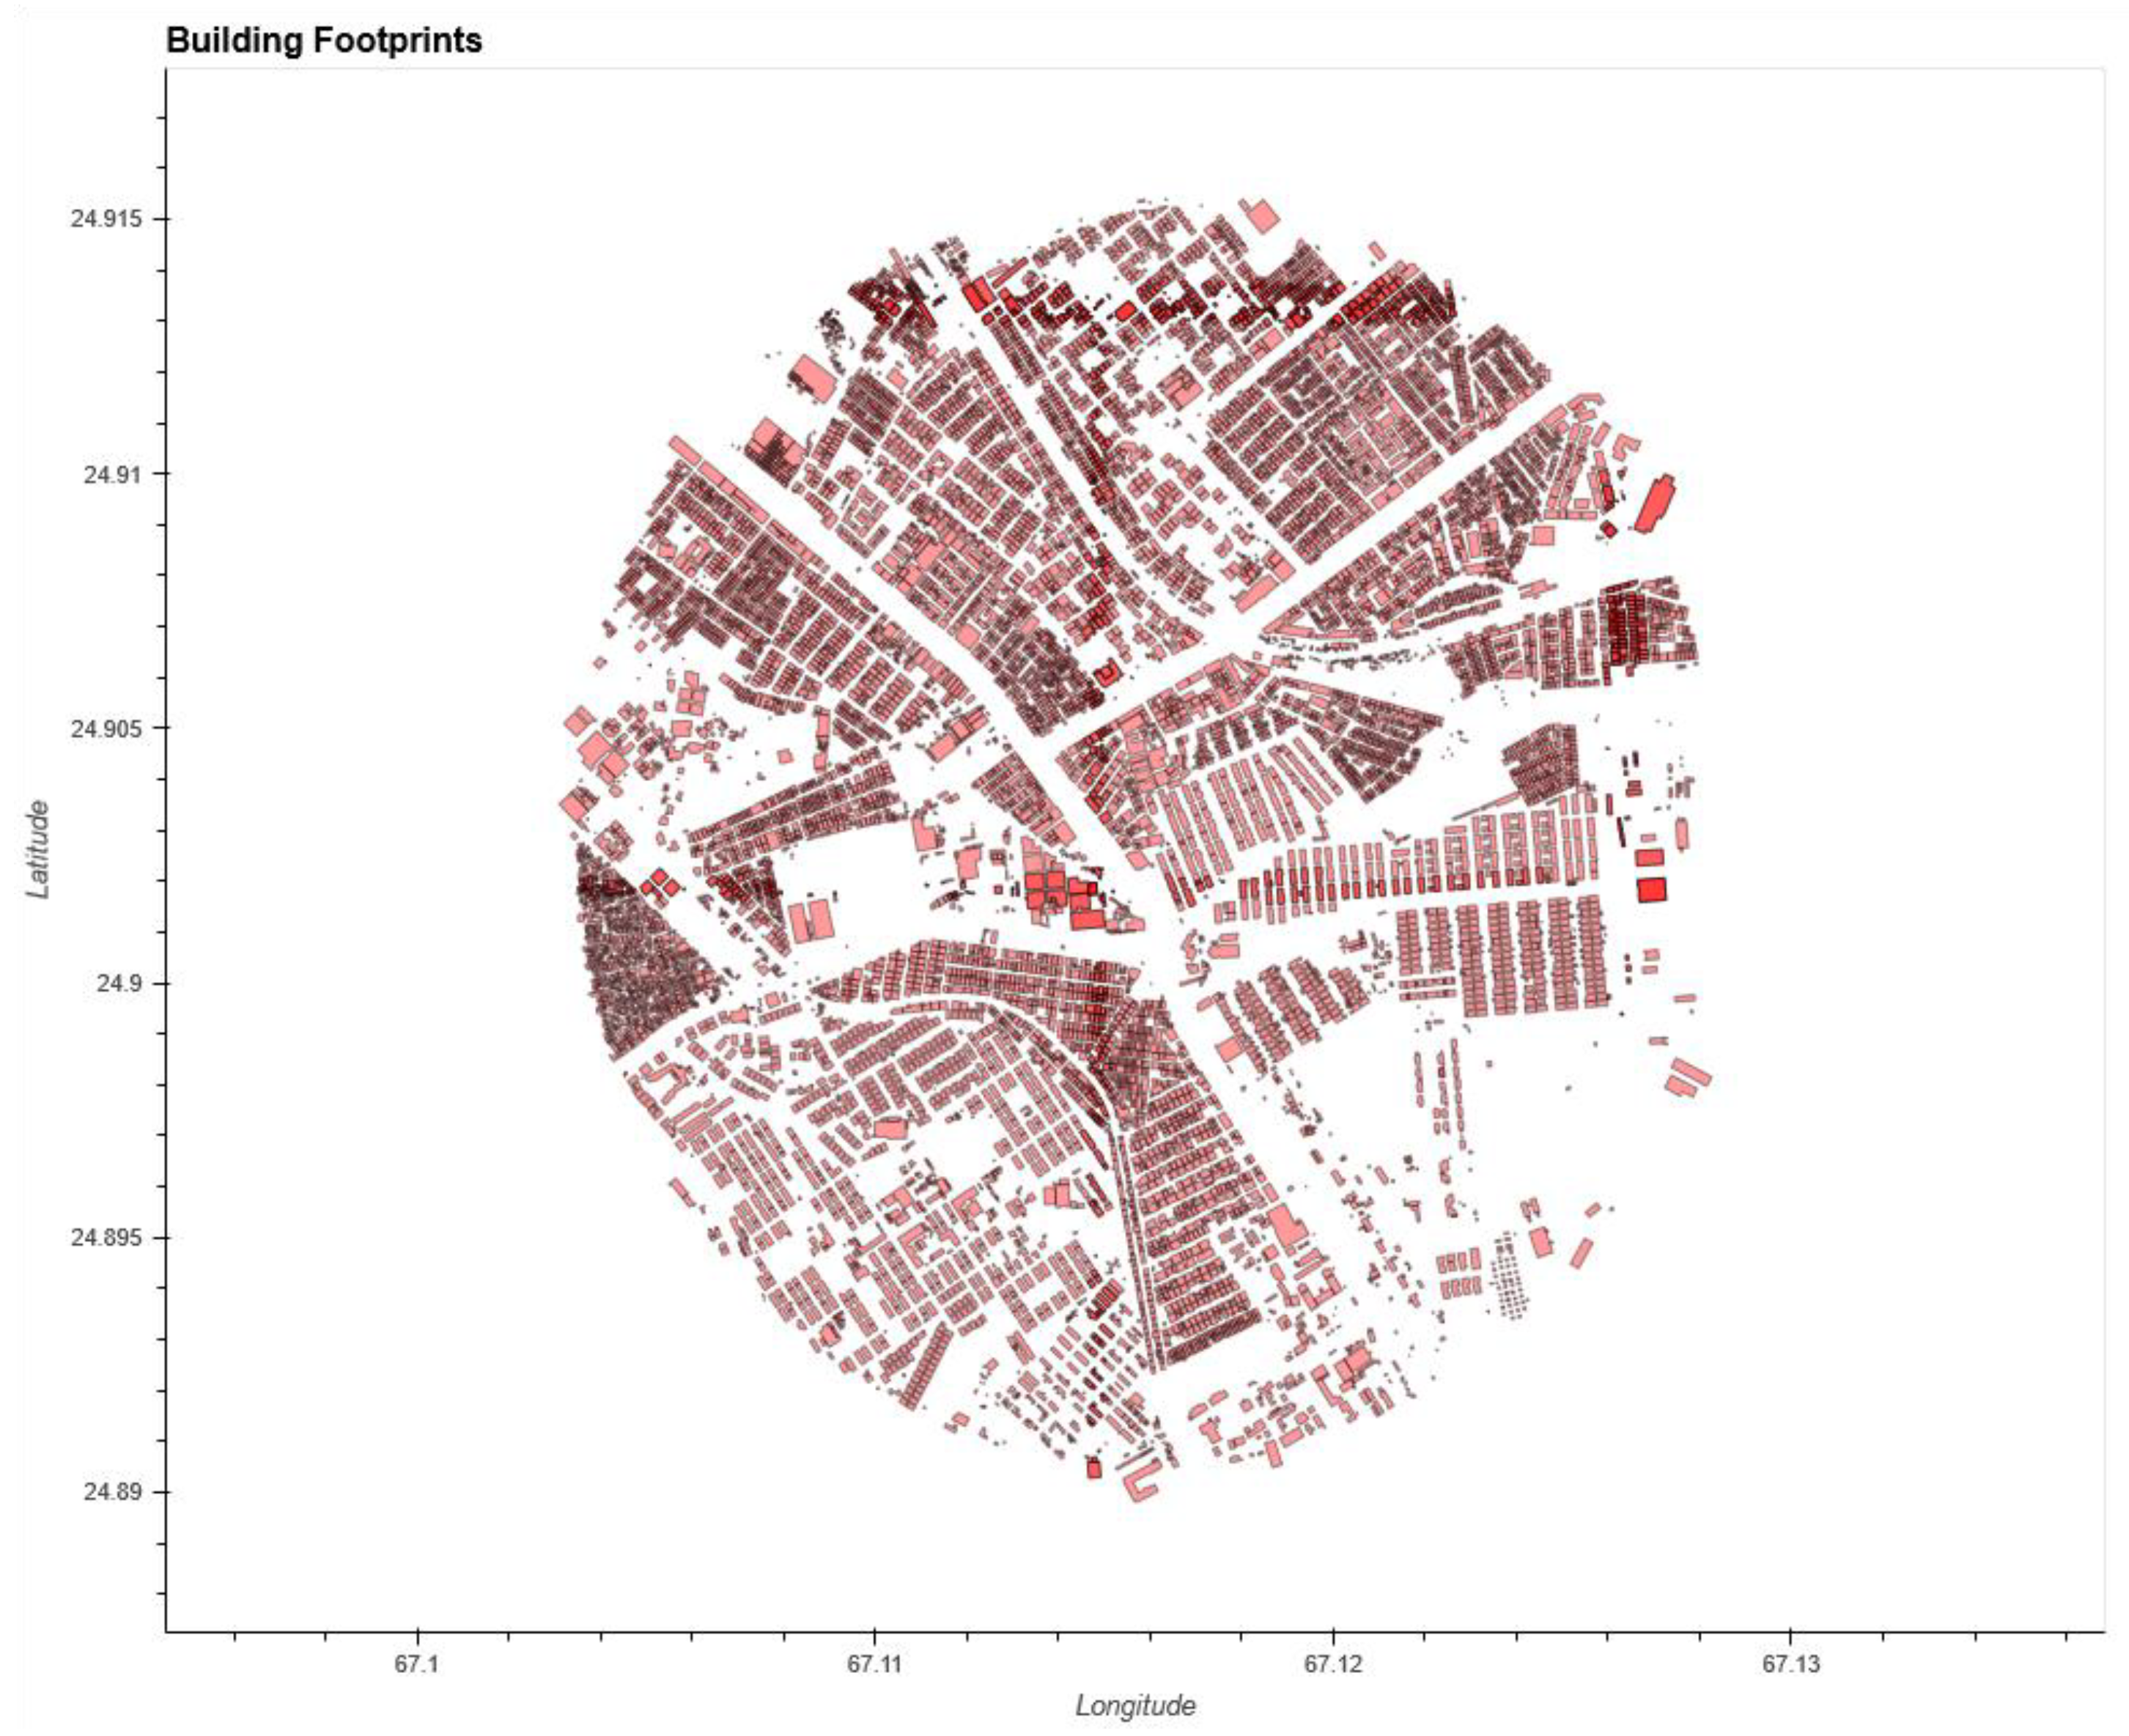
Figure 3.
Building footprint extraction with Esri Satellite image.
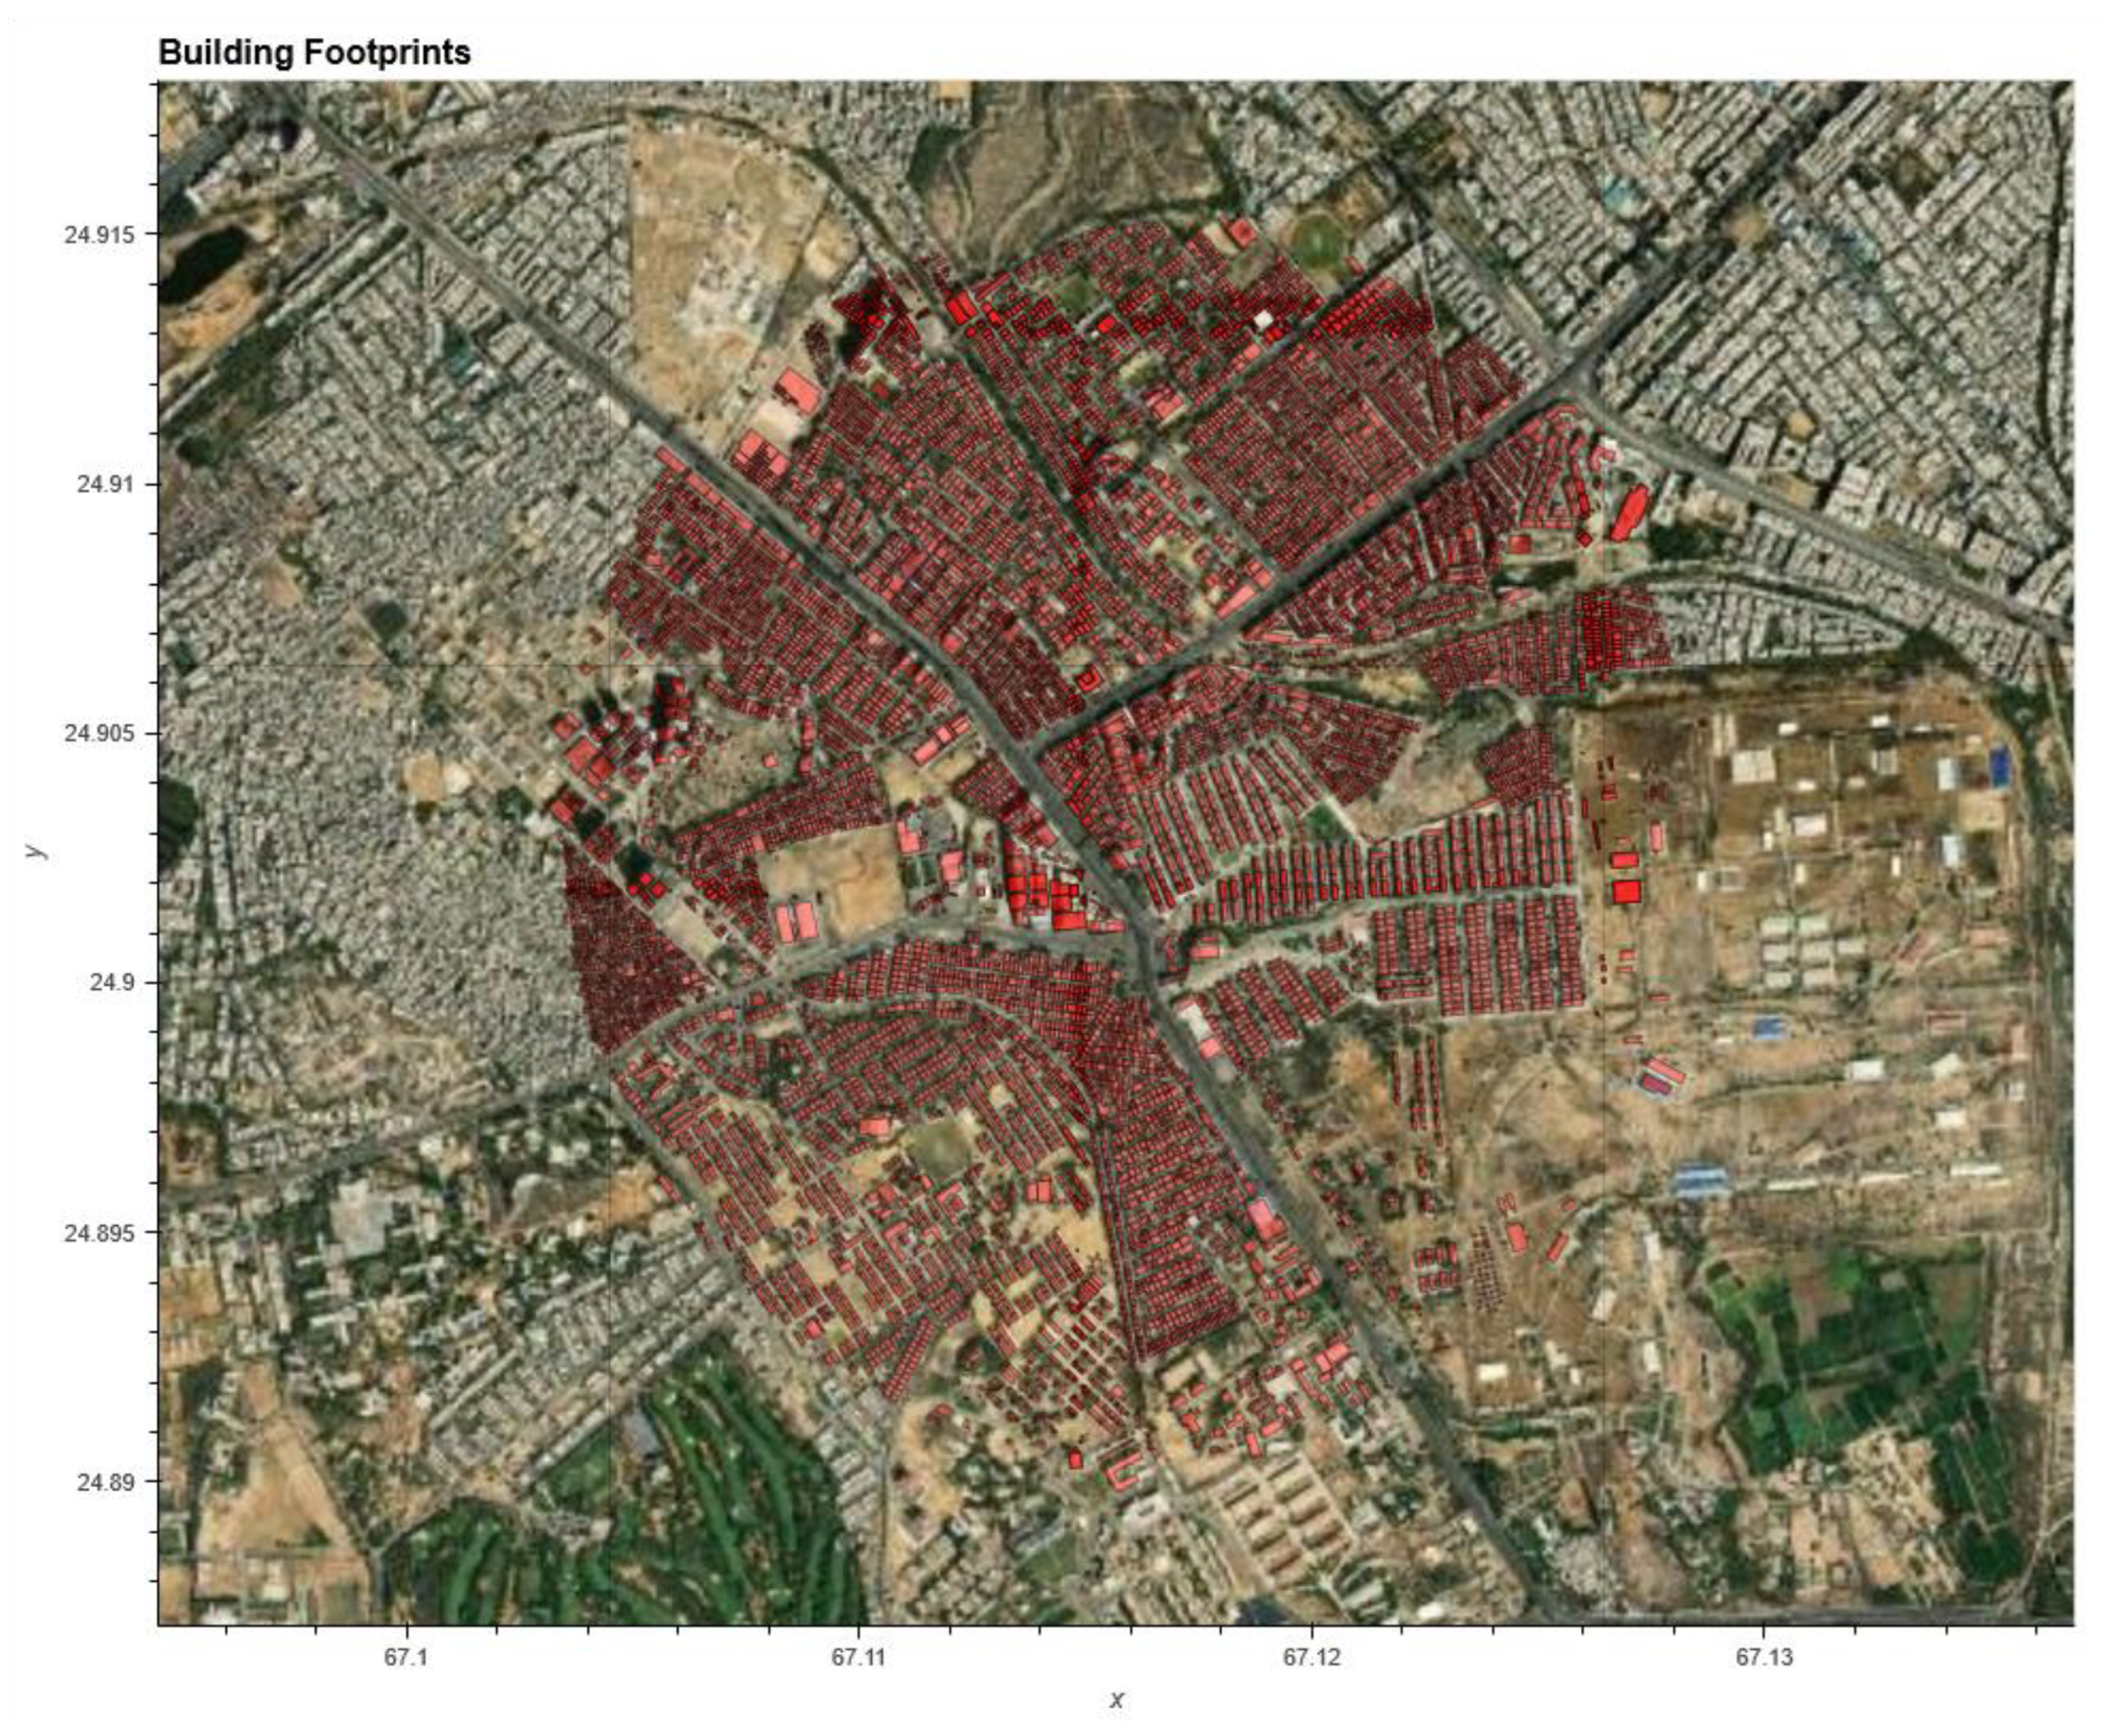
Figure 4.
polygon plot size.
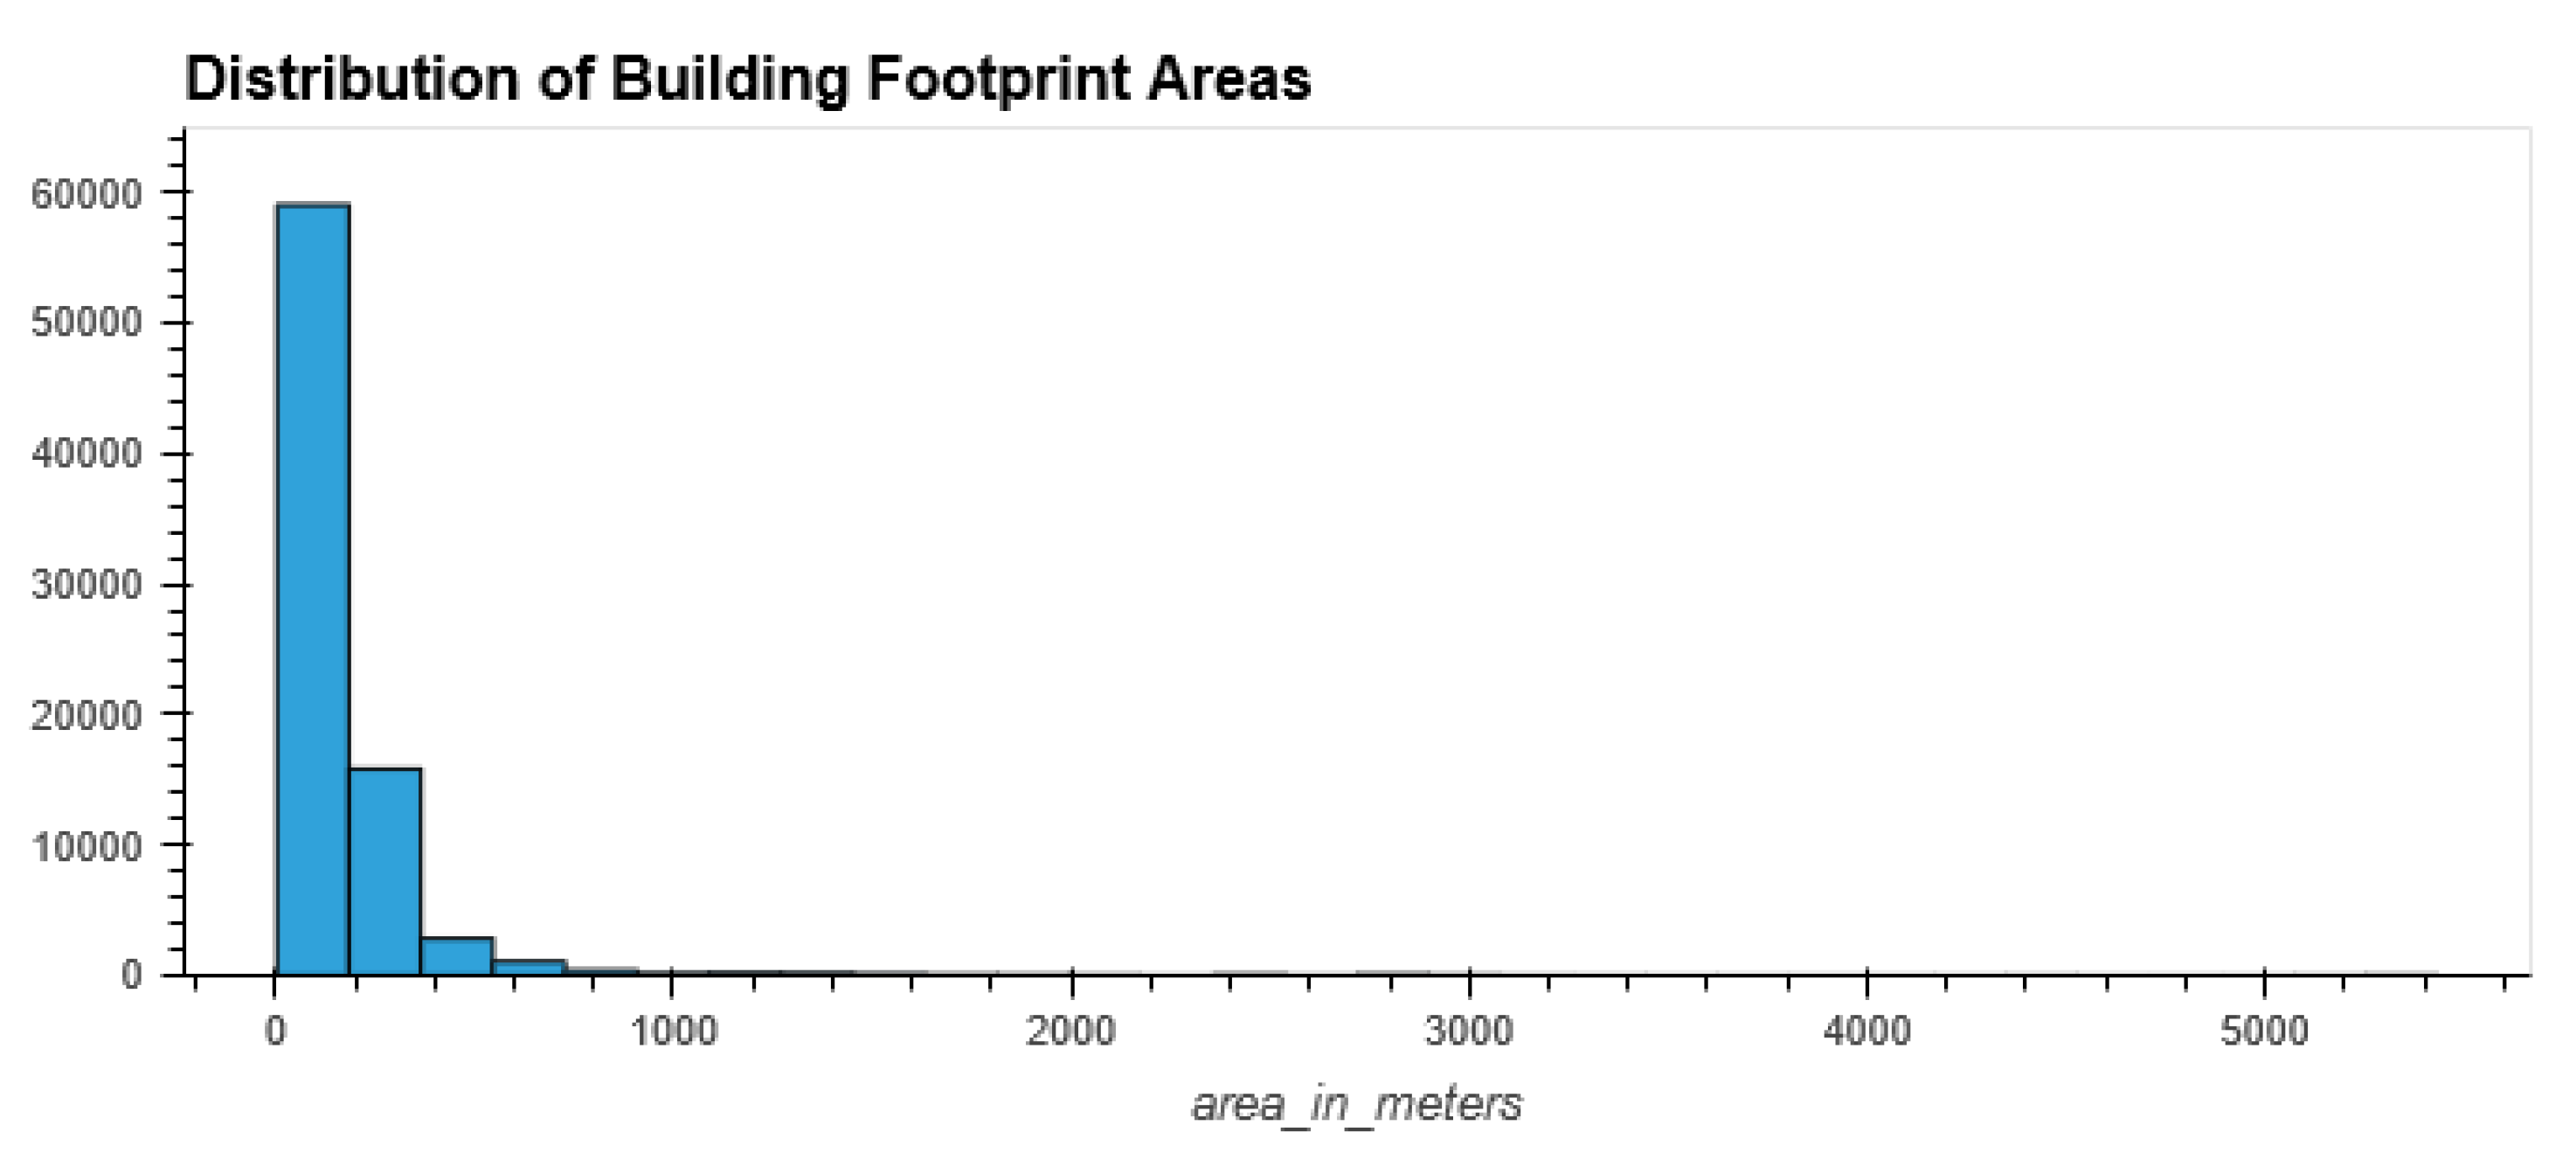
Figure 5.
(a) Extracted data open in ARCGIS (b) extracted data in Lay out form.
Disclaimer/Publisher’s Note: The statements, opinions and data contained in all publications are solely those of the individual author(s) and contributor(s) and not of MDPI and/or the editor(s). MDPI and/or the editor(s) disclaim responsibility for any injury to people or property resulting from any ideas, methods, instructions or products referred to in the content. |
© 2024 by the authors. Licensee MDPI, Basel, Switzerland. This article is an open access article distributed under the terms and conditions of the Creative Commons Attribution (CC BY) license (http://creativecommons.org/licenses/by/4.0/).
Copyright: This open access article is published under a Creative Commons CC BY 4.0 license, which permit the free download, distribution, and reuse, provided that the author and preprint are cited in any reuse.


