
Submitted:
17 July 2025
Posted:
18 July 2025
You are already at the latest version
Abstract
Accurate representation of population distribution is essential for a wide range of spatial analysis applications, including urban planning, disaster risk management, and resource allocation. This study presents a high-resolution gridded population dataset for Butuan City, Philippines, generated using Google Open Buildings and a dasymetric mapping approach. Building footprints with adequate confidence levels were extracted, validated, and classified to distinguish residential from non-residential structures. Population counts were then proportionally allocated to residential buildings based on their footprint area, reflecting spatial variations in population density. These estimates were aggregated into a fine-resolution gridded surface to create a continuous population distribution map. The dataset was applied in a flood hazard exposure assessment, demonstrating its potential to support detailed vulnerability analyses. The findings underscore the value of open geospatial data and high-resolution population mapping for improving spatial analyses and decision-making in both rapidly urbanizing and more stable or rural areas.
Keywords:
gridded population mapping
; Google Open Building Footprints
; dasymetric mapping
; spatial analysis
; Butuan City
; Philippines
1. Introduction
Accurate population distribution data is essential for effective urban planning, emergency response, and socioeconomic development. Traditional methods that rely solely on aggregated census data often fail to capture localized variations in population density[1]. While useful for broad-scale analyses, these methods fall short in reflecting differences in residential density and occupancy at finer spatial scales [2]. In contrast, dasymetric mapping offers a promising alternative by redistributing population data into smaller, more meaningful spatial units using ancillary data related to built structures—such as building type, footprint, and floor area—which are more closely associated with where people actually live [3].
Recent advancements in geospatial technologies and the increasing availability of open datasets have enhanced the accessibility and accuracy of dasymetric population mapping [4]. Among the most valuable sources of ancillary data are building footprints. Several datasets—such as those from Microsoft, Meta (Facebook), OpenStreetMap, and Google—have been made publicly available and are commonly used in spatial analysis. However, the quality and spatial coverage of these datasets vary considerably. While some offer broad geographic reach, their completeness, positional accuracy, and geometric consistency are often uneven across regions—especially in low-resource or rapidly urbanizing areas [5,6]. These variations can influence the reliability of spatial analyses that depend on detailed and consistent representations of the built environment.
Among the available sources, the Google Open Building Footprints dataset offers several strengths in terms of spatial precision and usability. Although it does not provide complete global coverage, it targets high-need regions, including parts of Africa, Asia, and Latin America. The dataset features high-resolution building outlines extracted from satellite imagery using deep learning, resulting in geometrically clean and topologically consistent polygons. Each building footprint is also accompanied by a confidence score, which allows users to filter features based on detection certainty [7]. These attributes make the dataset particularly useful for generating high-resolution gridded population surfaces and for supporting spatial analysis in areas where official building data are limited or unavailable.
In this study, we leveraged the Google Open Buildings dataset to map population distribution, focusing on Butuan City, a rapidly urbanizing regional center in the Caraga Region of Mindanao, Philippines. As the city continues to expand, accurate information on population density and spatial distribution is vital for informing local development policies that promote sustainable urban growth, equitable resource allocation, and resilient infrastructure planning [8]. Such data are especially critical in support of disaster risk management, as Butuan City faces recurring flood hazards [9] that threaten both human settlements and development gains.
The study has three main objectives: (1) to extract and classify residential building footprints from the Google Open Buildings dataset to serve as the basis for population disaggregation; (2) to generate a 10-meter resolution gridded population map of Butuan City using a dasymetric mapping approach; and (3) to demonstrate the utility of the resulting dataset by assessing population exposure to flood hazards. This application provides valuable insight into the spatial distribution of flood risk across the city and illustrates the broader potential of open data-driven population maps for supporting local-scale spatial analysis and decision-making.
2. Materials and Methods
2.1. Datasets Used
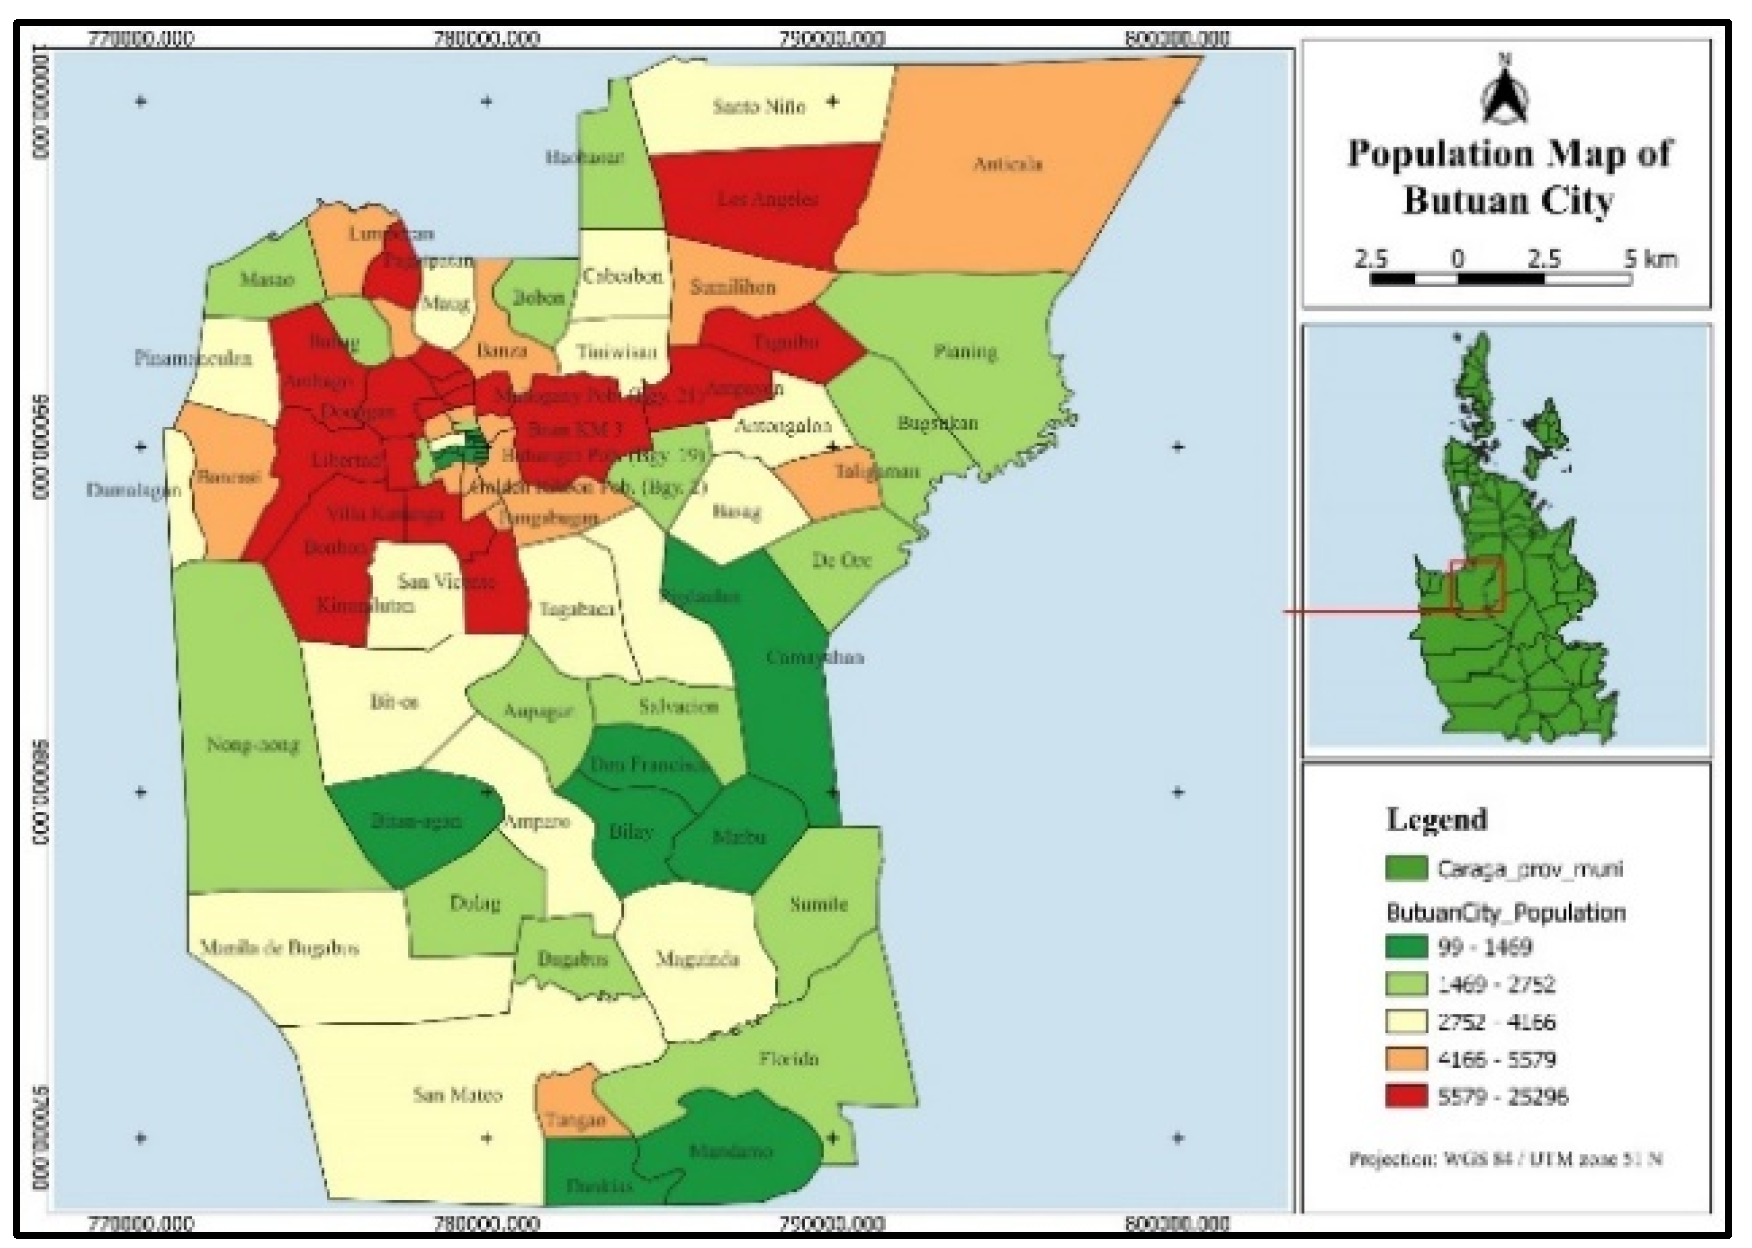
To support the generation of a high-resolution gridded population map and the subsequent flood exposure analysis, multiple datasets were compiled and integrated. The most recent barangay-level population data for Butuan City, from the year 2020, were obtained from the Philippine Statistics Authority (PSA, https://psa.gov.ph/classification/psgc/barangays/1630400000). For the spatial extent of administrative boundaries, barangay boundary data were sourced from UNOCHA Philippines via the Humanitarian Data Exchange (HDX, https://data.humdata.org/dataset/cod-ab-phl). These boundaries were essential for linking population figures to spatial units, as shown in Figure 1, which illustrates the 2020 population distribution across Butuan City’s barangays. The total land area of Butuan City is approximately 817 km² [9], encompassing a mix of urban, peri-urban, and rural zones that influence population distribution and flood vulnerability patterns.
Figure 1.
Barangay-level population distribution in Butuan City, Philippines, based on 2020 census data from the Philippine Statistics Authority (PSA).
Figure 1.
Barangay-level population distribution in Butuan City, Philippines, based on 2020 census data from the Philippine Statistics Authority (PSA).
To capture built infrastructure for dasymetric population disaggregation, we used the Google Open Building Footprints dataset, downloaded from https://sites.research.google/gr/open-buildings/. To complement this, OpenStreetMap (OSM) data were downloaded from Geofabrik (https://download.geofabrik.de/), offering additional building attributes—such as use classification—that supported the identification of residential buildings. The high-resolution satellite imagery of Butuan City available in Google Earth Pro was used as a visual reference to support manual inspection, dataset validation, and spatial alignment of building footprints and administrative boundaries.
For the flood exposure assessment, flood hazard maps covering Butuan City were utilized. These maps were developed under the Geo-informatics for the Systematic Assessment of Flood Effects and Risks (GeoSAFER) Mindanao program and obtained from the Caraga Center for Geo-Informatics (CCGeo) of Caraga State University. Representing multiple rainfall return periods (2-year, 5-year, 10-year, 25-year, 50-year, and 100-year events), the hazard layers were produced at a high spatial resolution of 1 meter and provide detailed delineations of flood-prone areas within the city.
2.2. Accuracy Assessment and Refinement of Google Open Building Footprints
The accuracy of the Google Open Buildings dataset was assessed and refined to ensure its reliability for dasymetric mapping and population distribution analysis in Butuan City. This step was crucial for improving the precision of the dataset and ensuring that the building footprints accurately reflected real-world structures. A systematic validation process was implemented to evaluate the usability of the footprints and to filter out erroneous or uncertain detections. This refinement ensured that only high-confidence, spatially accurate footprints were retained for the population redistribution process, aligning population data with actual residential built-up areas.
The validation of building footprints in Butuan City formed part of a broader quality assessment conducted across all cities and municipalities within the Caraga Region. Given the varying number of building footprints across administrative units, a statistically sound approach was adopted to ensure representativeness. A minimum required sample size was calculated based on the city or municipality with the fewest footprints, using the standard formula for estimating sample size for proportions [10]:
where (for 95% confidence), p (expected proportion of correct classifications), and (margin of error). This baseline sample size was then proportionally scaled for other cities and municipalities according to their total number of building footprints, ensuring adequate statistical representation across the region. For Butuan City, which had a total of 146,004 building footprints, the resulting sample size was 13,371. This sample was subsequently used in the visual validation process to assess the accuracy of the dataset and to establish a confidence threshold for filtering usable building footprints.
2.3. Visual Validation and Confidence Thresholding
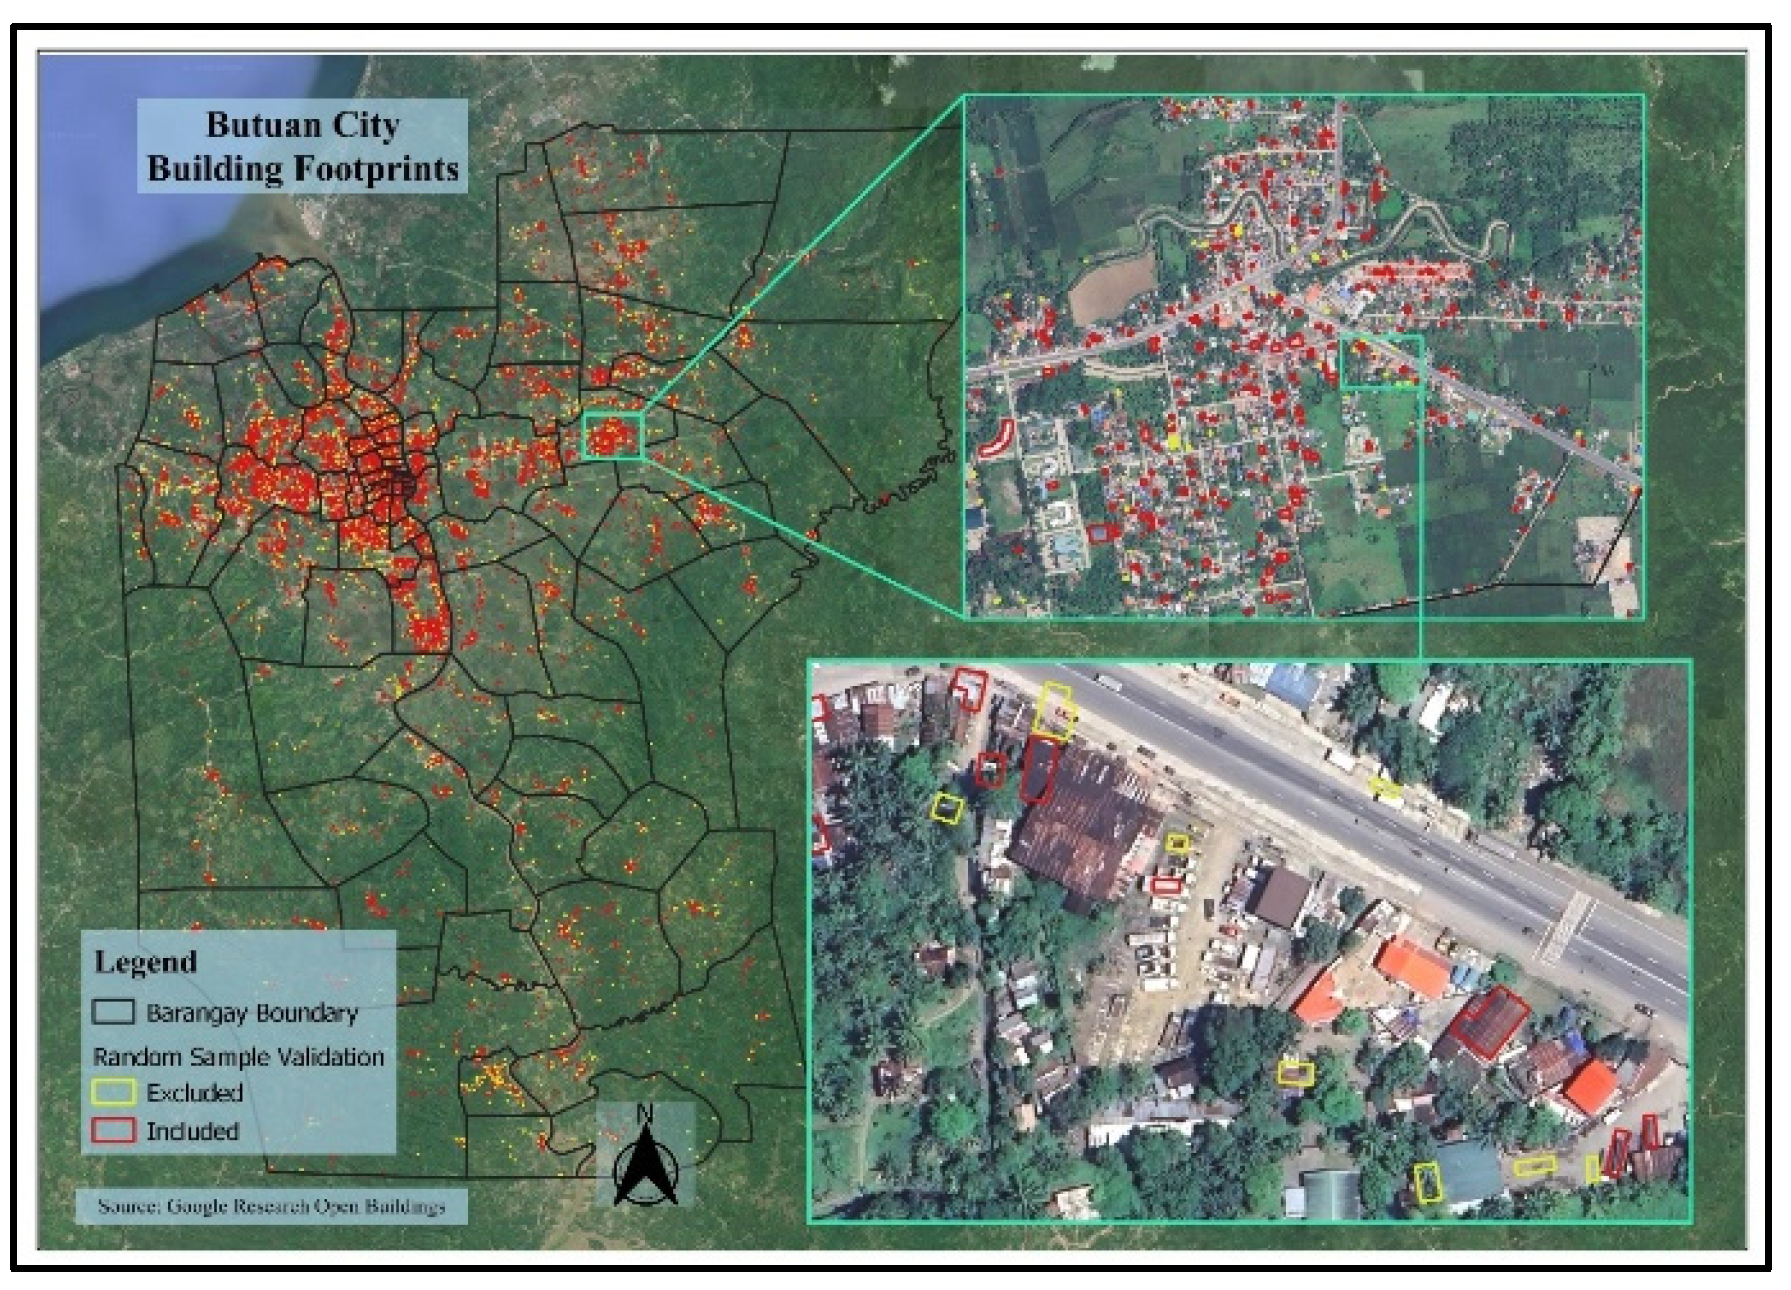
Each sampled building footprint was visually validated using high-resolution satellite imagery from Google Earth Pro. Footprints were classified as either included (1) or excluded (0) based on their spatial correspondence with actual structures visible in the imagery. A footprint was considered included if it aligned well with the roof or structural outline of a building, allowing for minor positional discrepancies as long as the footprint area matched the observed structure. Footprints that were significantly misaligned, partially missing, or did not correspond to any identifiable structure were excluded.
As previously noted, each Google Open Building footprint is associated with a confidence score, ranging from 0 to 1, indicating the likelihood that the detected shape is indeed a building. After validation, the minimum confidence score among all included (i.e., confirmed) footprints was identified and used as a threshold to filter the entire dataset. Only those footprints with a confidence score equal to or greater than this threshold were retained for subsequent steps in the dasymetric mapping workflow. This ensured that only footprints with empirically validated reliability were used for population redistribution.
Finally, the overall accuracy of the dataset was estimated by calculating the proportion of included (valid) footprints within the validated random sample. This measure provided an important indicator of the dataset’s quality and suitability for spatial analysis applications in the study area.
2.4. Residential Building Classification
To distinguish residential from non-residential buildings, supplementary data from OSM were utilized. Building use classifications—such as commercial, industrial, and educational—were extracted from OSM and spatially overlaid with the validated Google Open Building Footprints. Footprints that overlapped with non-residential structures in the OSM dataset were flagged and excluded from the population redistribution process. For building footprints not classified in OSM, their likely use was inferred based on local knowledge of the area and verified through visual interpretation of high-resolution satellite imagery in Google Earth Pro. This combined approach ensured that population counts were assigned exclusively to residential structures, thereby minimizing the risk of misallocating population data to buildings not intended for habitation, such as warehouses, schools, or commercial establishments.
2.5. Estimation of Population per Building
Population values from the 2020 census were disaggregated from the barangay level to individual residential buildings using a proportional weighting approach based on footprint area. The weight assigned to each building was calculated as:
where is the area of the building and is the total residential building area within the barangay. The estimated population for each building was then computed as:
This dasymetric technique ensures that larger buildings receive a proportionally higher population allocation, reflecting the likely residential capacity associated with footprint size. The result is a more realistic and spatially refined distribution of population across the study area, avoiding the overgeneralization common in uniform or choropleth-based methods (e.g., as illustrated in Figure 1).
2.6. Gridded Population Mapping at 10-Meter Resolution
To translate these building-level population estimates into a format suitable for spatial analysis and integration with other geospatial layers, the data were further processed into a 10-meter resolution gridded population surface—the primary output of this study. A regular lattice of square grid cells (10 × 10 meters) was generated to cover the full extent of Butuan City, ensuring that all residential footprints were captured within the analysis area.
Population values were spatially allocated to the grid cells based on the spatial overlap with building footprints. Where a footprint intersected multiple cells, the population value was proportionally distributed among the affected cells to maintain spatial accuracy. This process yielded a fine-scale view of population density patterns, enabling localized analysis of population concentrations.
2.7. Flood Hazard Exposure Assessment
To evaluate the practical utility of the gridded population dataset, it was applied to assess potential flood hazard exposure within the flood-prone areas of Butuan City. The analysis focused on areas covered by flood hazard maps developed under the GeoSAFER Mindanao program, which primarily include floodplains and other hydrologically susceptible zones rather than the city in its entirety. These maps represent rainfall return periods of 2, 5, 10, 25, 50, and 100 years, and classify flood risk into three levels: low, moderate, and high.
The population grid was spatially intersected with each hazard scenario to identify grid cells that fall within mapped flood hazard zones. For each return period and hazard level, population values from the intersecting cells were summed to estimate the number of individuals potentially exposed to flooding. While this analysis does not represent exposure citywide, it provides critical insight into the spatial distribution of population at risk within the flood hazard map coverage, illustrating how high-resolution population data can support targeted disaster preparedness and risk reduction planning in vulnerable areas.
3. Results and Discussion
3.1. Accuracy of Google Open Building Footprints
Validation results showed that about 79% of the sampled building footprints were correctly identified as real structures, confirming the generally high accuracy of the Google Open Building Footprints dataset in Butuan City. The spatial distribution of included and excluded buildings (Figure 2) reveals that most misclassified footprints were isolated and not concentrated in any particular zone, suggesting a consistent performance across the study area.
Figure 2.
Validation results of the randomly sampled building footprints from the Google Open Buildings dataset in Butuan City. Background satellite image © Google.
Figure 2.
Validation results of the randomly sampled building footprints from the Google Open Buildings dataset in Butuan City. Background satellite image © Google.
The confidence scores of validated footprints ranged from 0.6527 to 0.9696, with a mean of 0.788 and a standard deviation of 0.065, indicating a narrow spread and relatively uniform detection quality. The minimum confidence score of included buildings (0.6527) was used as the threshold for the entire dataset, resulting in about 99% (144,490 out of 146,004) of footprints being retained for subsequent analysis.
This high retention rate demonstrates that the dataset is sufficiently reliable for spatial population modeling. The small proportion of excluded footprints is unlikely to introduce significant bias, particularly as they are dispersed and exhibit no systematic spatial pattern.
3.1. Refined and Classified Building Footprints
Among the validated building footprints, 142,966 (or ~99%) were identified as residential, while 1,524 were classified as non-residential, comprising structures such as schools, commercial buildings, public institutions, industrial facilities, churches, hospitals, and transportation-related buildings. The spatial distribution of these classes is shown in Figure 3. Table 1 presents the frequency of each building type. Residential buildings (Figure 4) overwhelmingly dominate the built environment, followed by educational and commercial structures. The relatively small number of non-residential buildings highlights the city’s primarily residential land use pattern.
Figure 3.
Classified building footprints based on OSM data and visual verification.
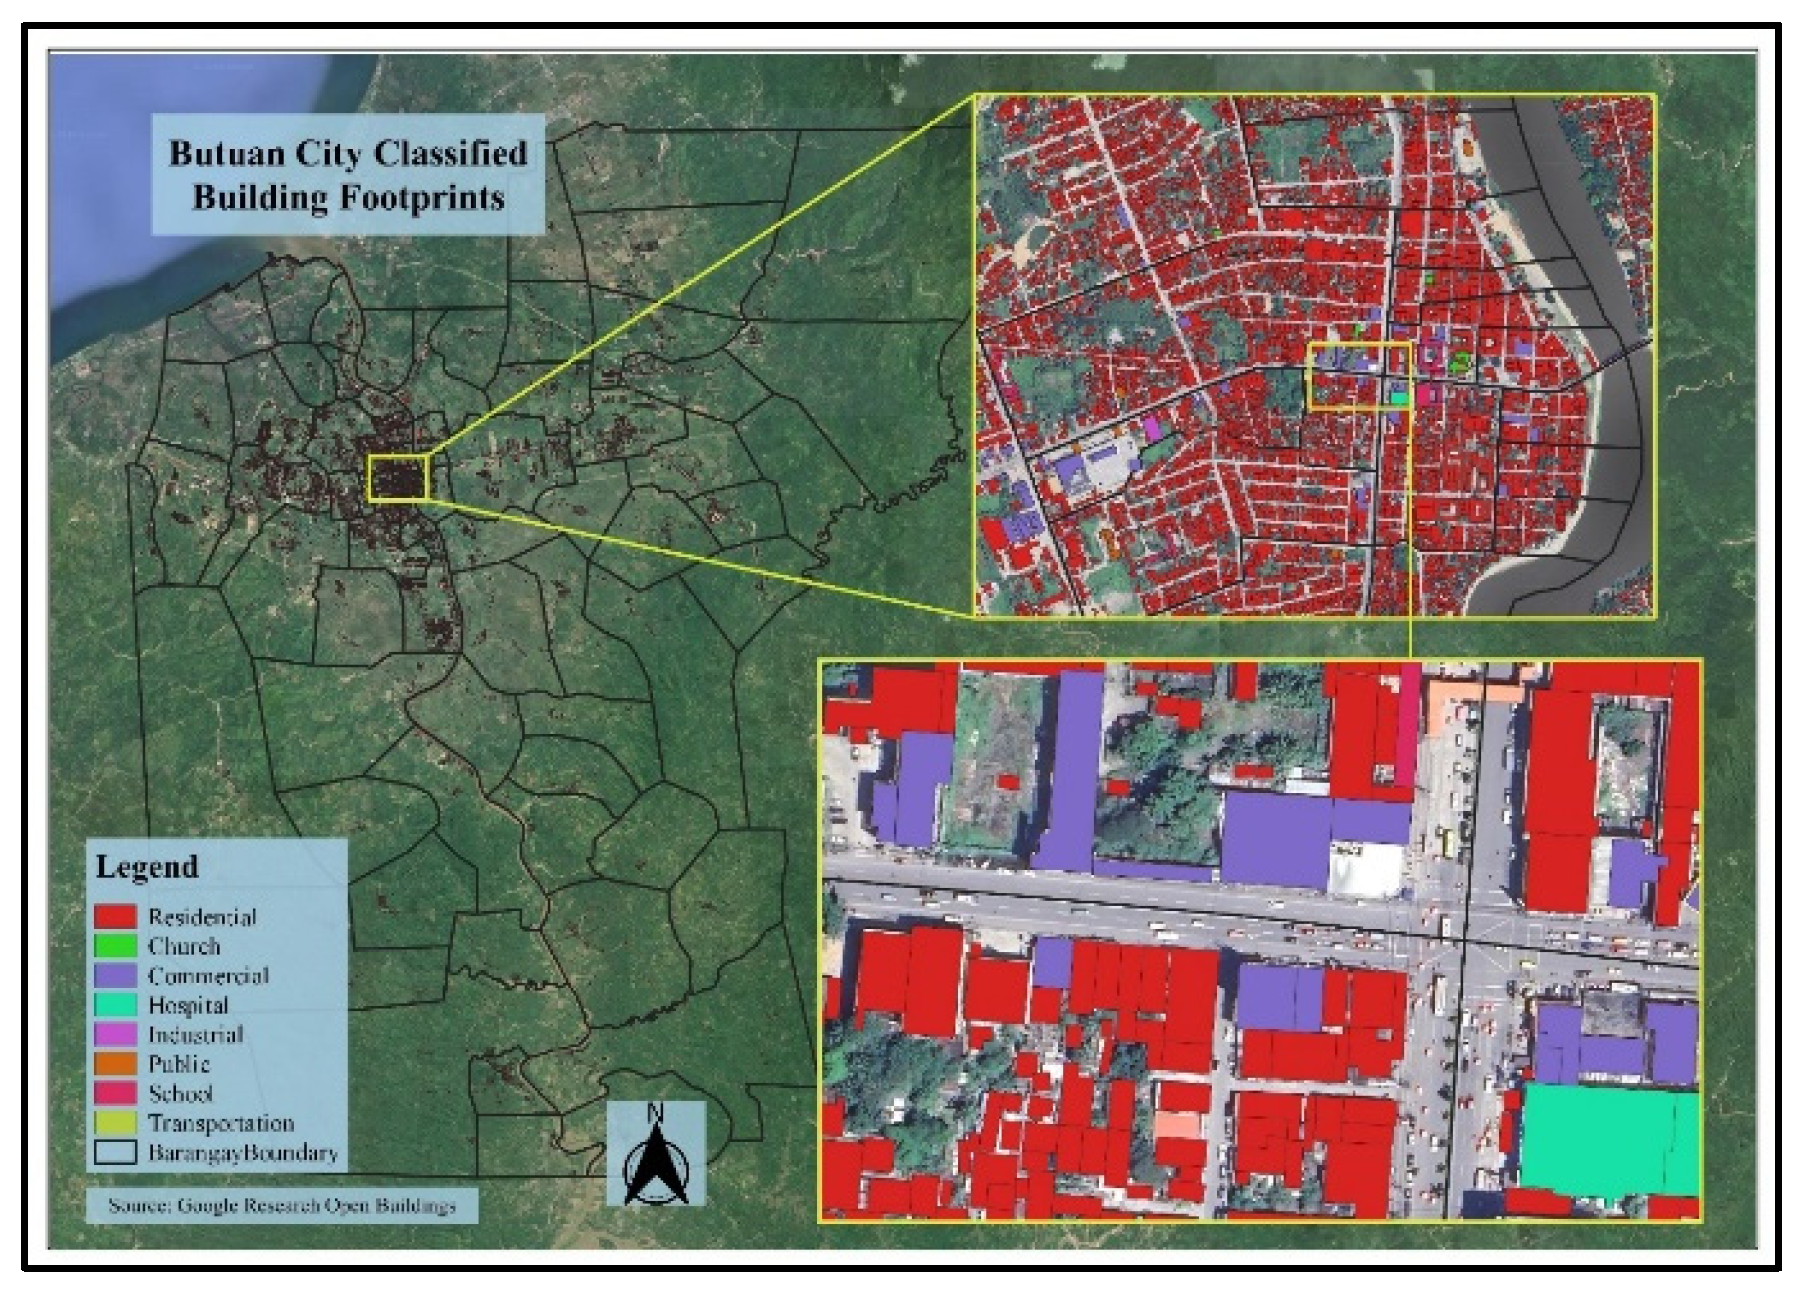
Figure 4.
Residential building footprints used for population redistribution.
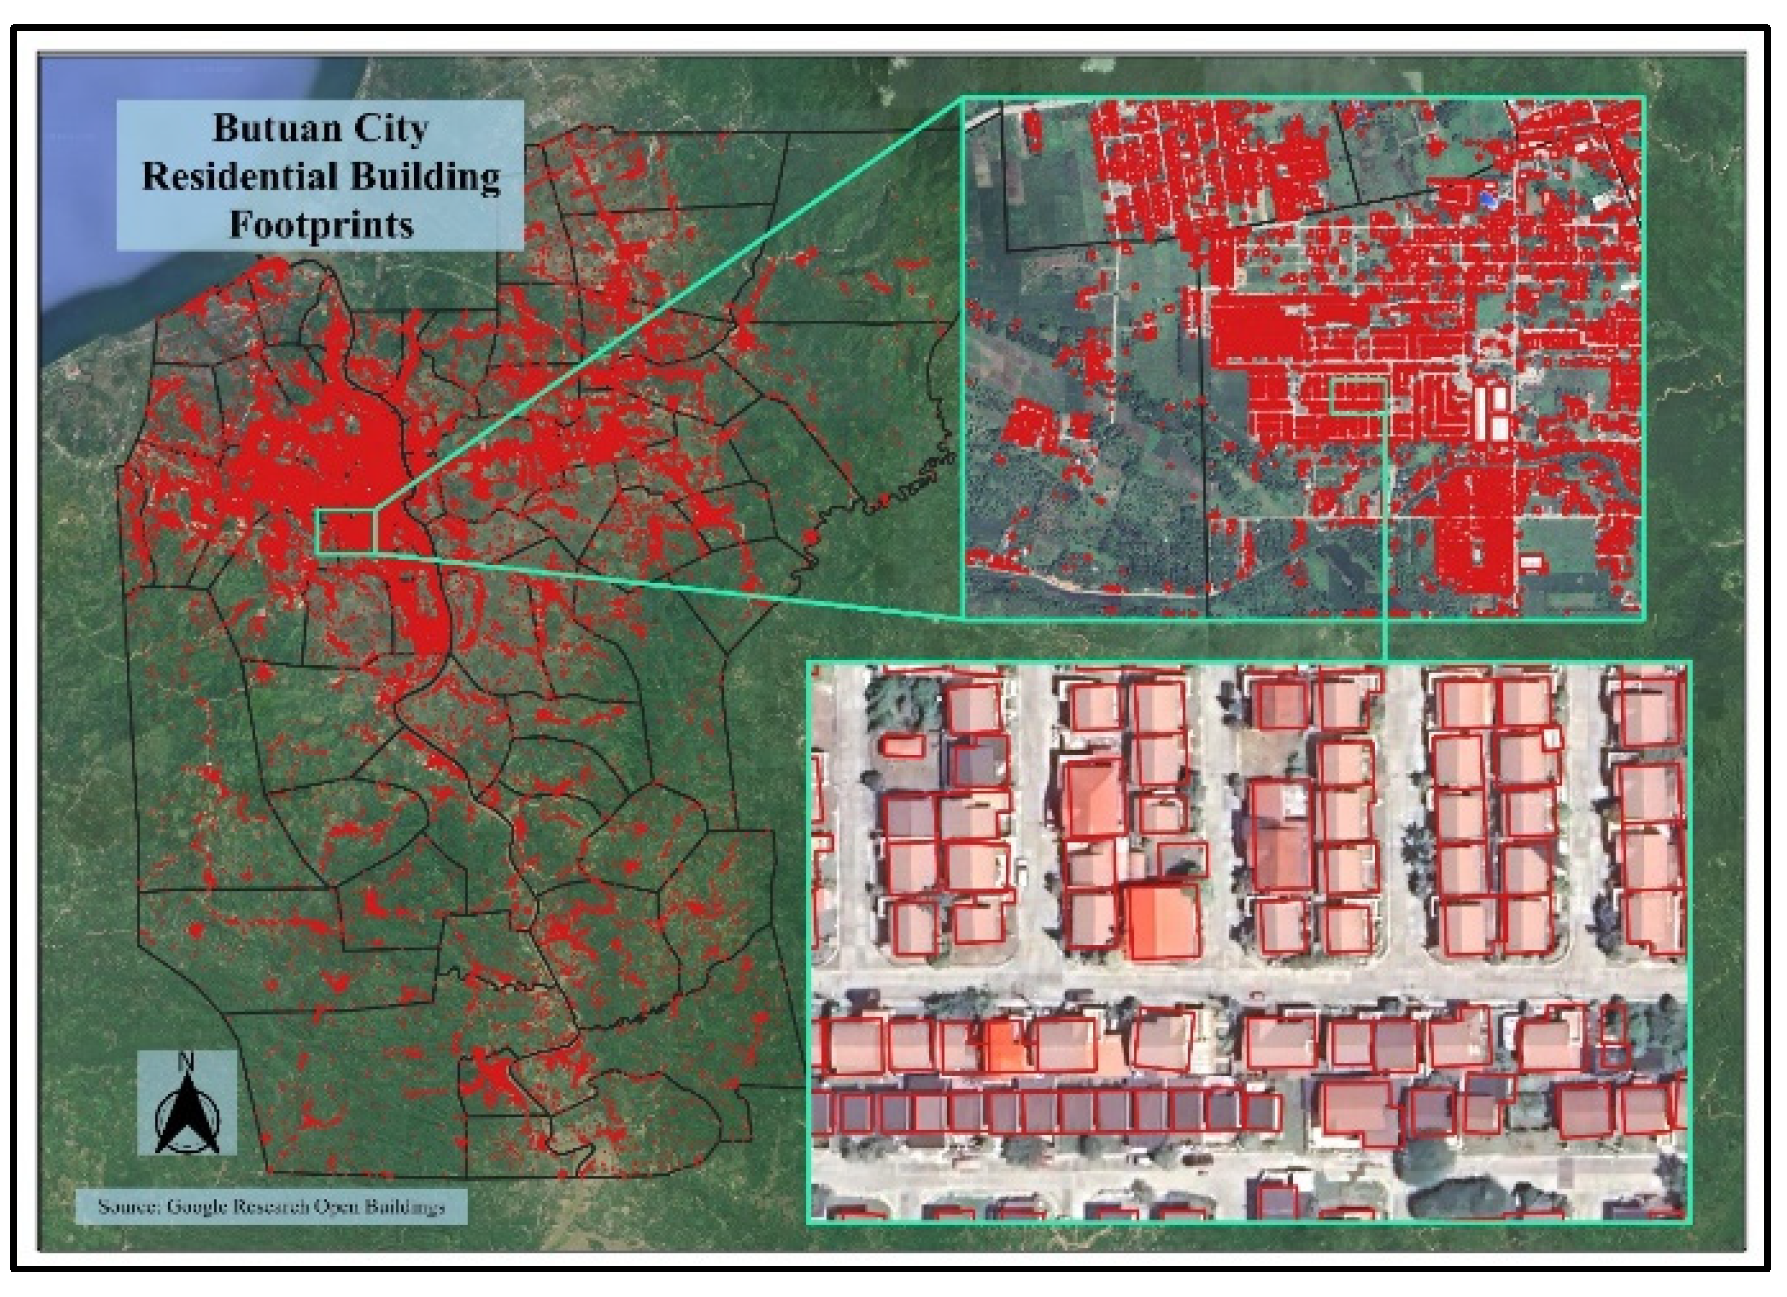

Table 1.
Number of buildings by classification.
| Classification | Number of Buildings |
| Residential | 142966 |
| School | 742 |
| Commercial | 493 |
| Public | 175 |
| Industrial | 44 |
| Church | 41 |
| Transportation | 16 |
| Hospital | 13 |
| Total | 144,490 |
3.3. Population Estimates at the Building Level
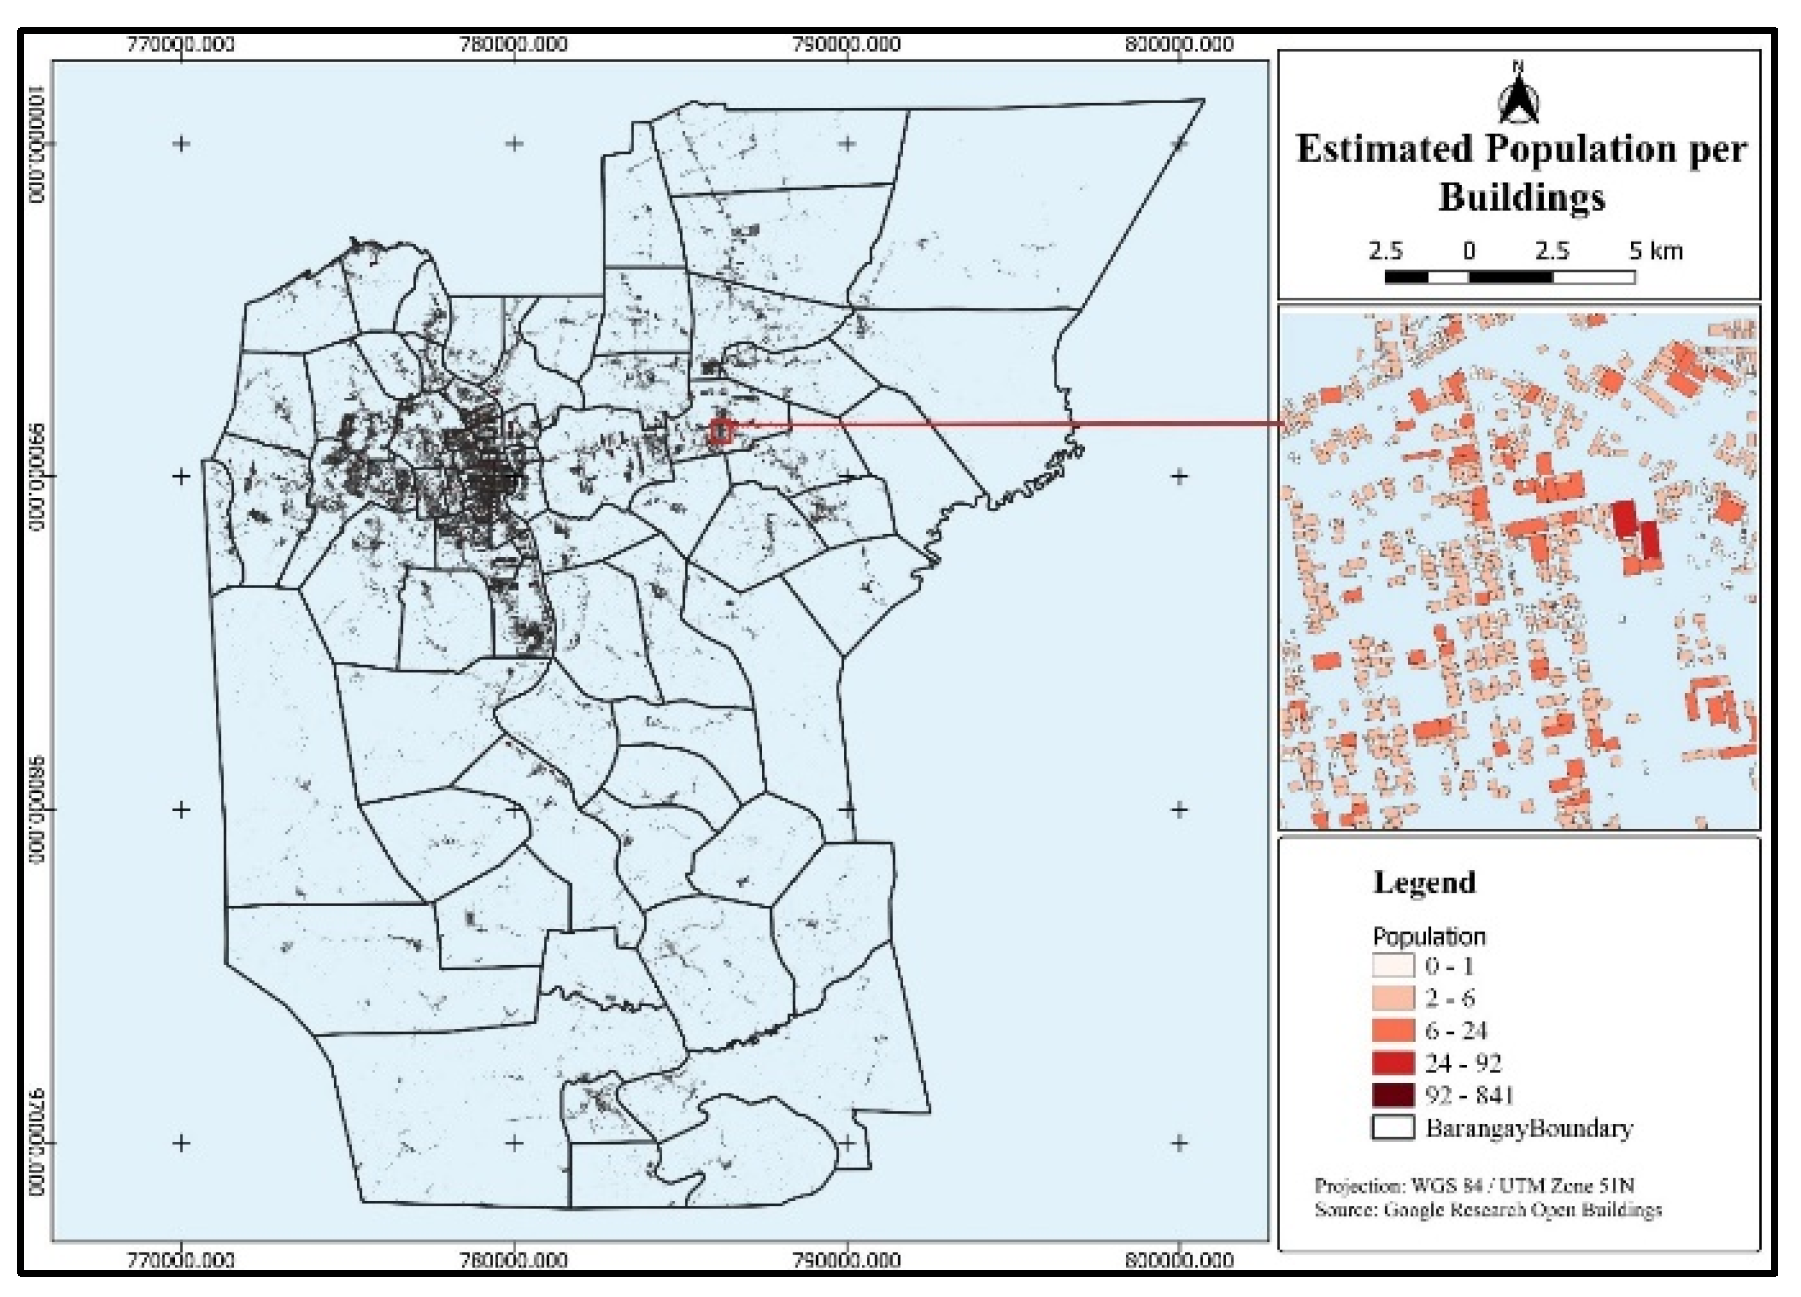
Figure 5 presents the estimated population assigned to each residential building footprint in Butuan City. Results show a wide range of population values—from 1 to 841 individuals per building—reflecting the variability in building sizes and residential capacity across the urban landscape. Higher population estimates are concentrated in larger building footprints, particularly in denser urban barangays, while smaller structures in peripheral areas correspond to lower population counts.
The map reveals distinct spatial patterns in residential intensity, with clusters of high-population buildings observed in the city center and along major road corridors. These results offer a more realistic representation of population distribution than uniform or administrative-level allocations, as they capture localized variations driven by building size and density.
Figure 5.
Estimated population per residential building footprint in Butuan City, 2020.
3.4. Gridded Population Map at 10-Meter Resolution
The gridded population map shown in Figure 6 provides a detailed visualization of population distribution in Butuan City at a 10 × 10-meter resolution. The estimated population per grid cell ranges from 1 to 11 individuals. This high-resolution dataset enables more precise identification of population concentrations than traditional choropleth or zonal representations.
Figure 6.
Gridded population map of Butuan City for the year 2020, showing estimated population per 10 × 10 meter cell.
Figure 6.
Gridded population map of Butuan City for the year 2020, showing estimated population per 10 × 10 meter cell.
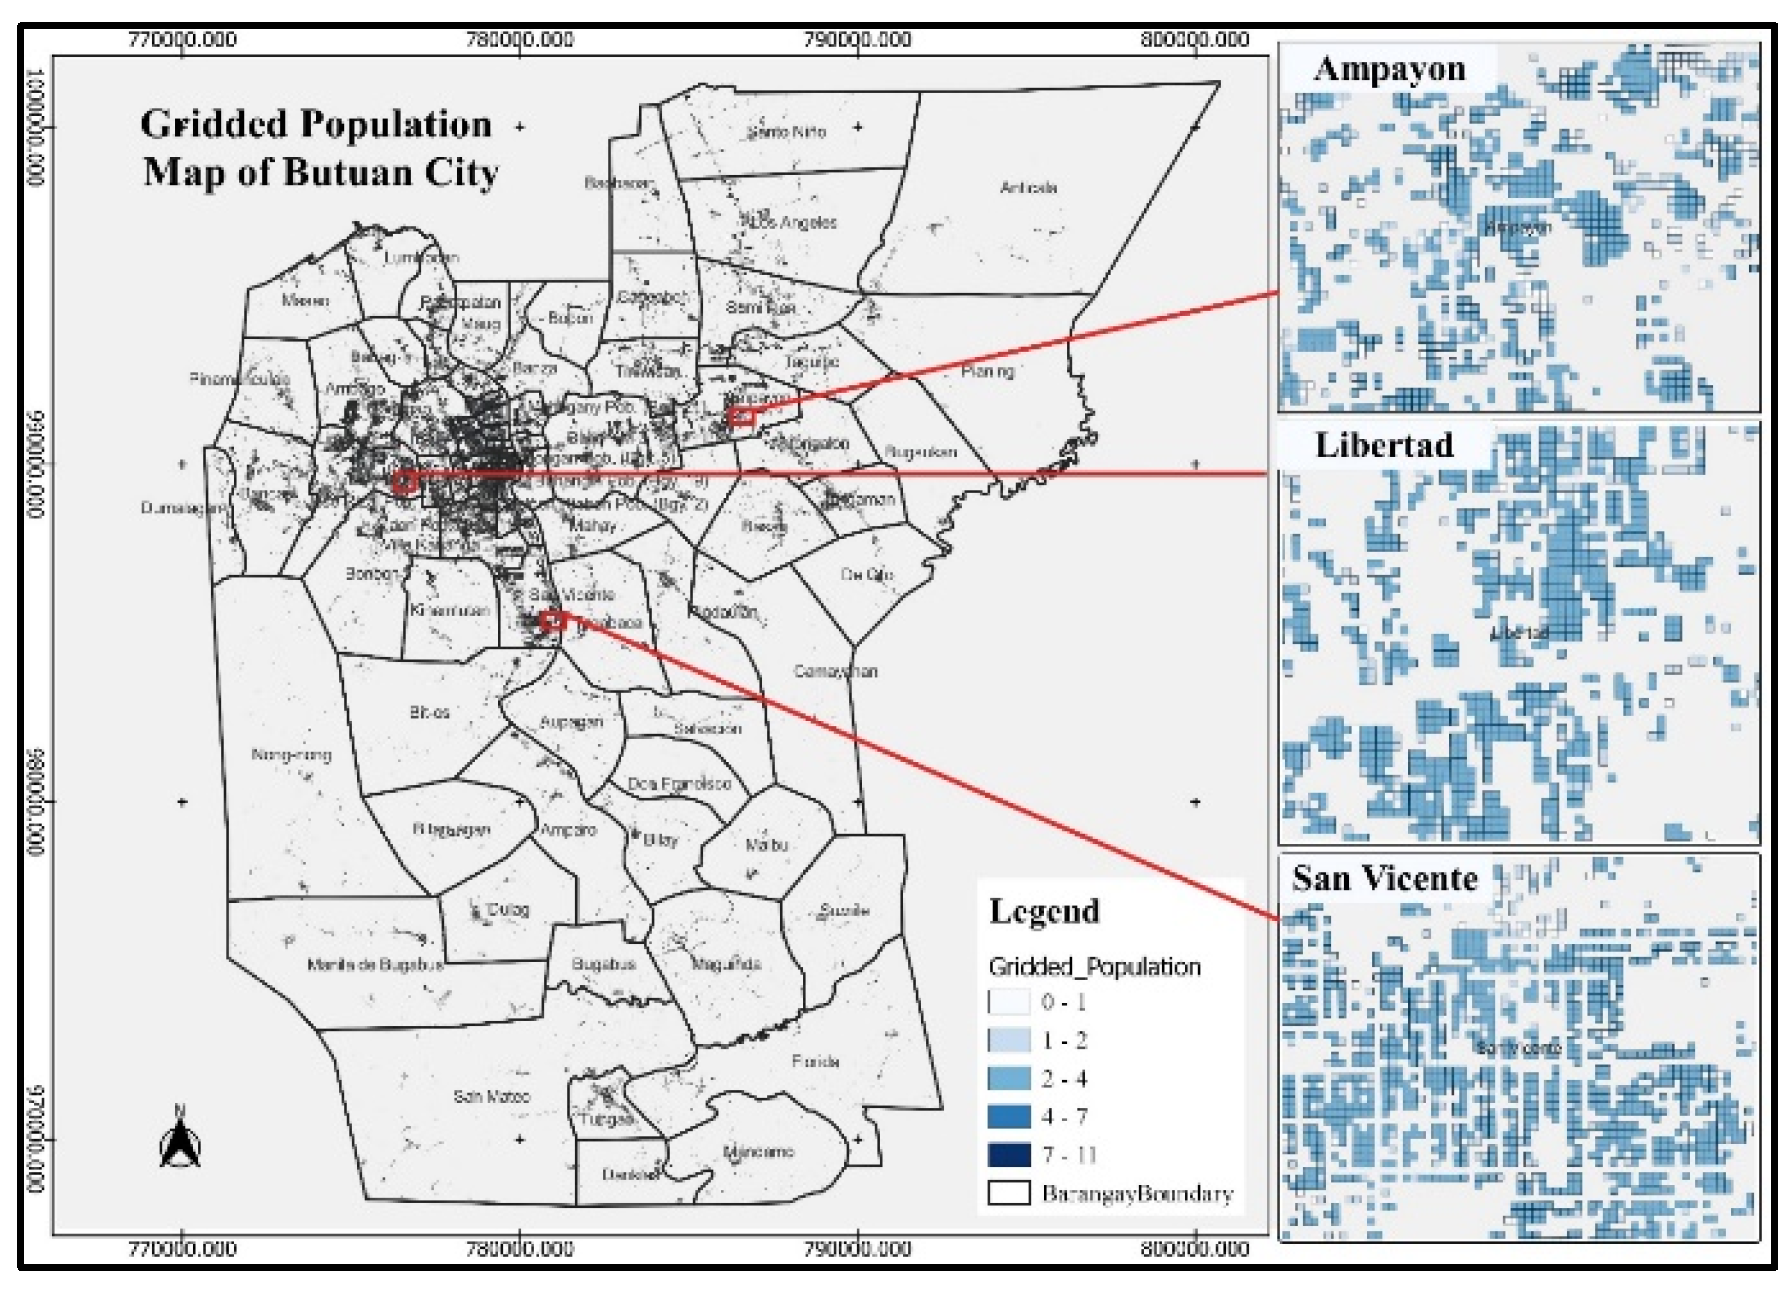
As observed in the map, barangays such as Ampayon, Libertad, and San Vicente exhibit clusters of highly populated grid cells, corresponding with established residential zones. In contrast, lower-density grid cells appear in transitional and peri-urban areas, consistent with less intensive land use. This gridded population dataset has high potential to support various applications, including flood exposure analysis, infrastructure planning, and monitoring of urban development patterns.
3.5. Application of the Gridded Population Map for Flood Hazard Exposure Analysis
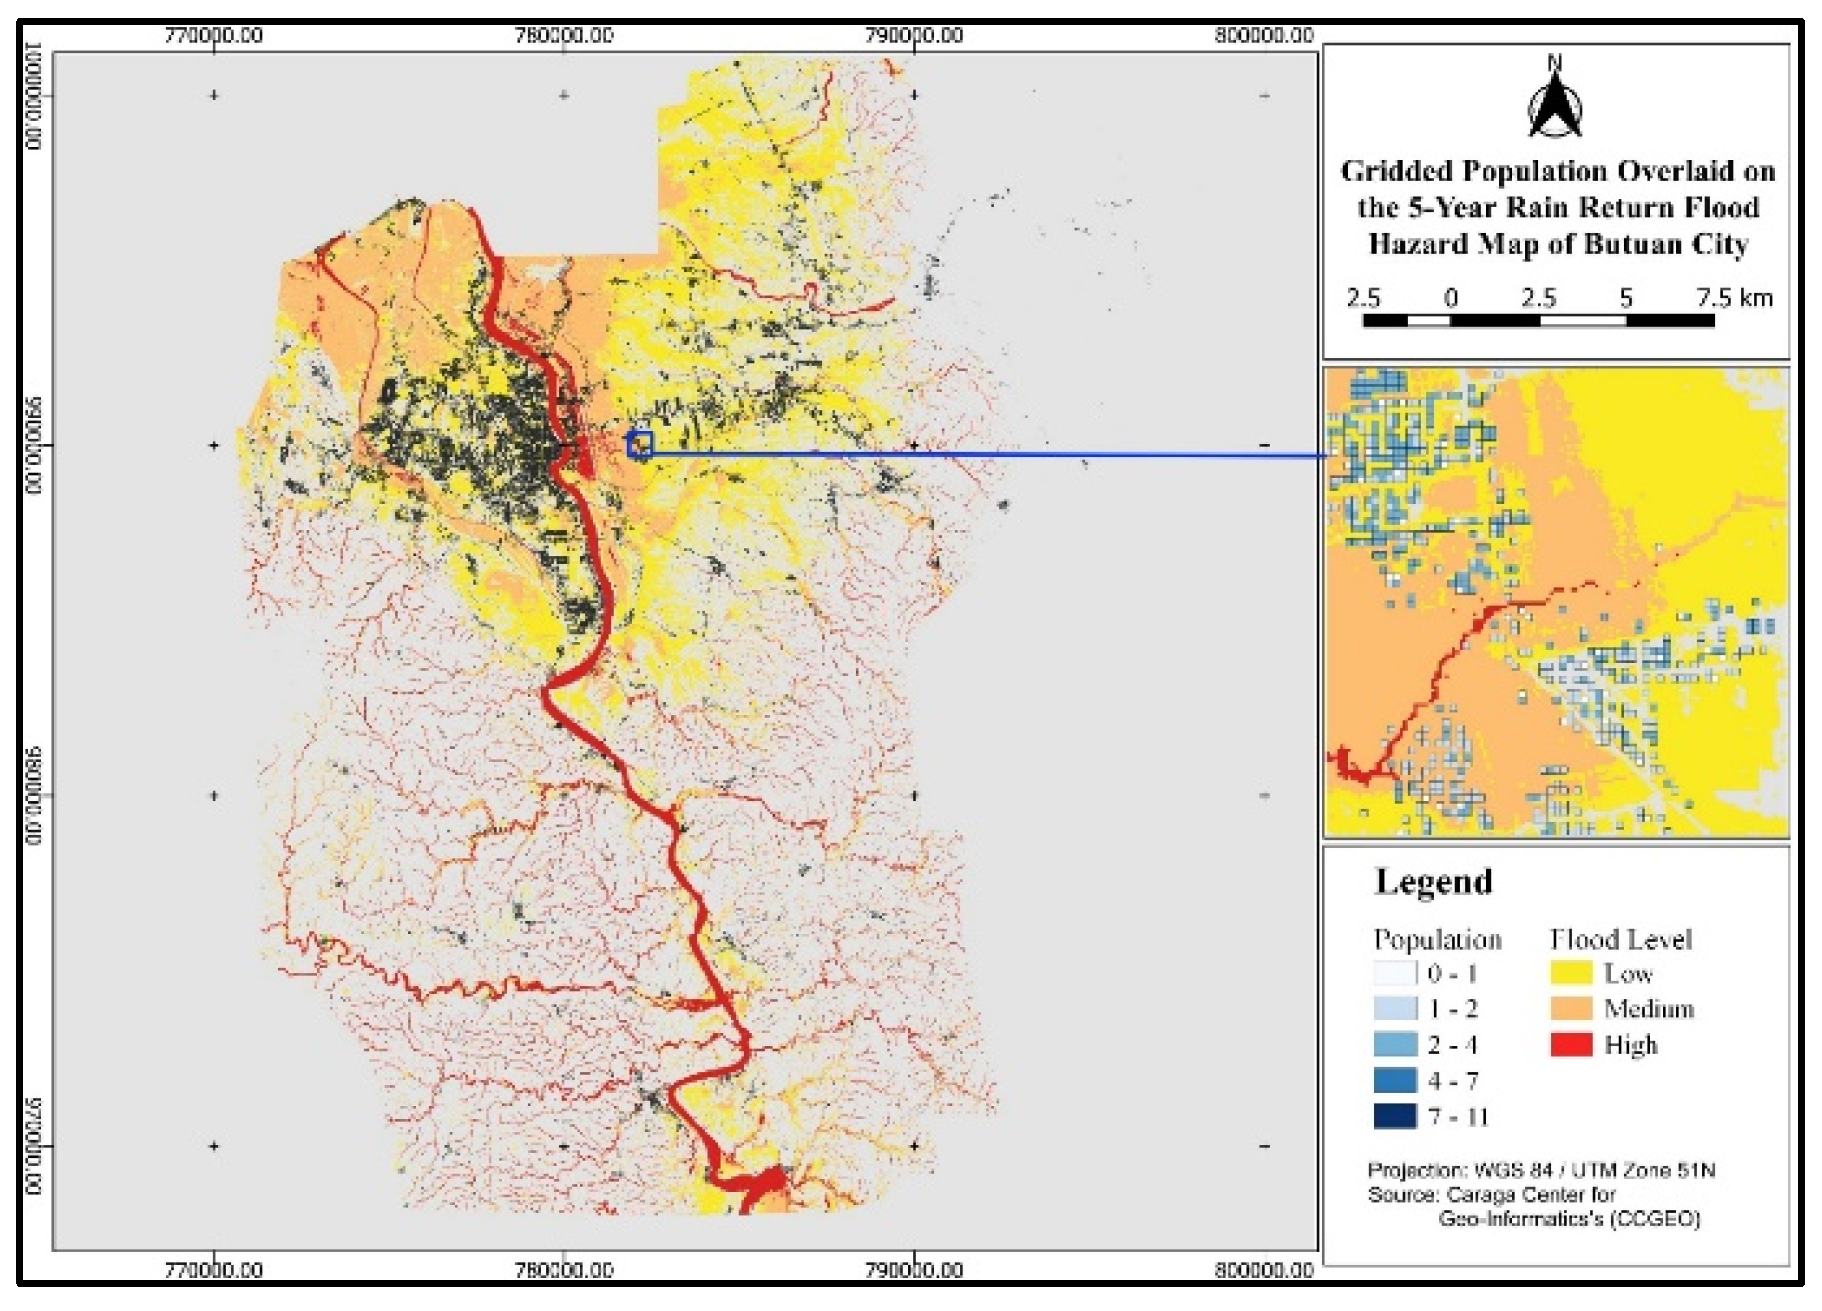
The gridded population dataset was used to estimate the number of people potentially affected by flooding in Butuan City under six different rainfall return scenarios (2, 5, 10, 25, 50, and 100 years). Figure 7, Figure 8, Figure 9, Figure 10, Figure 11 and Figure 12 show the overlay of the population data with flood hazard zones classified as low, medium, and high hazard levels.
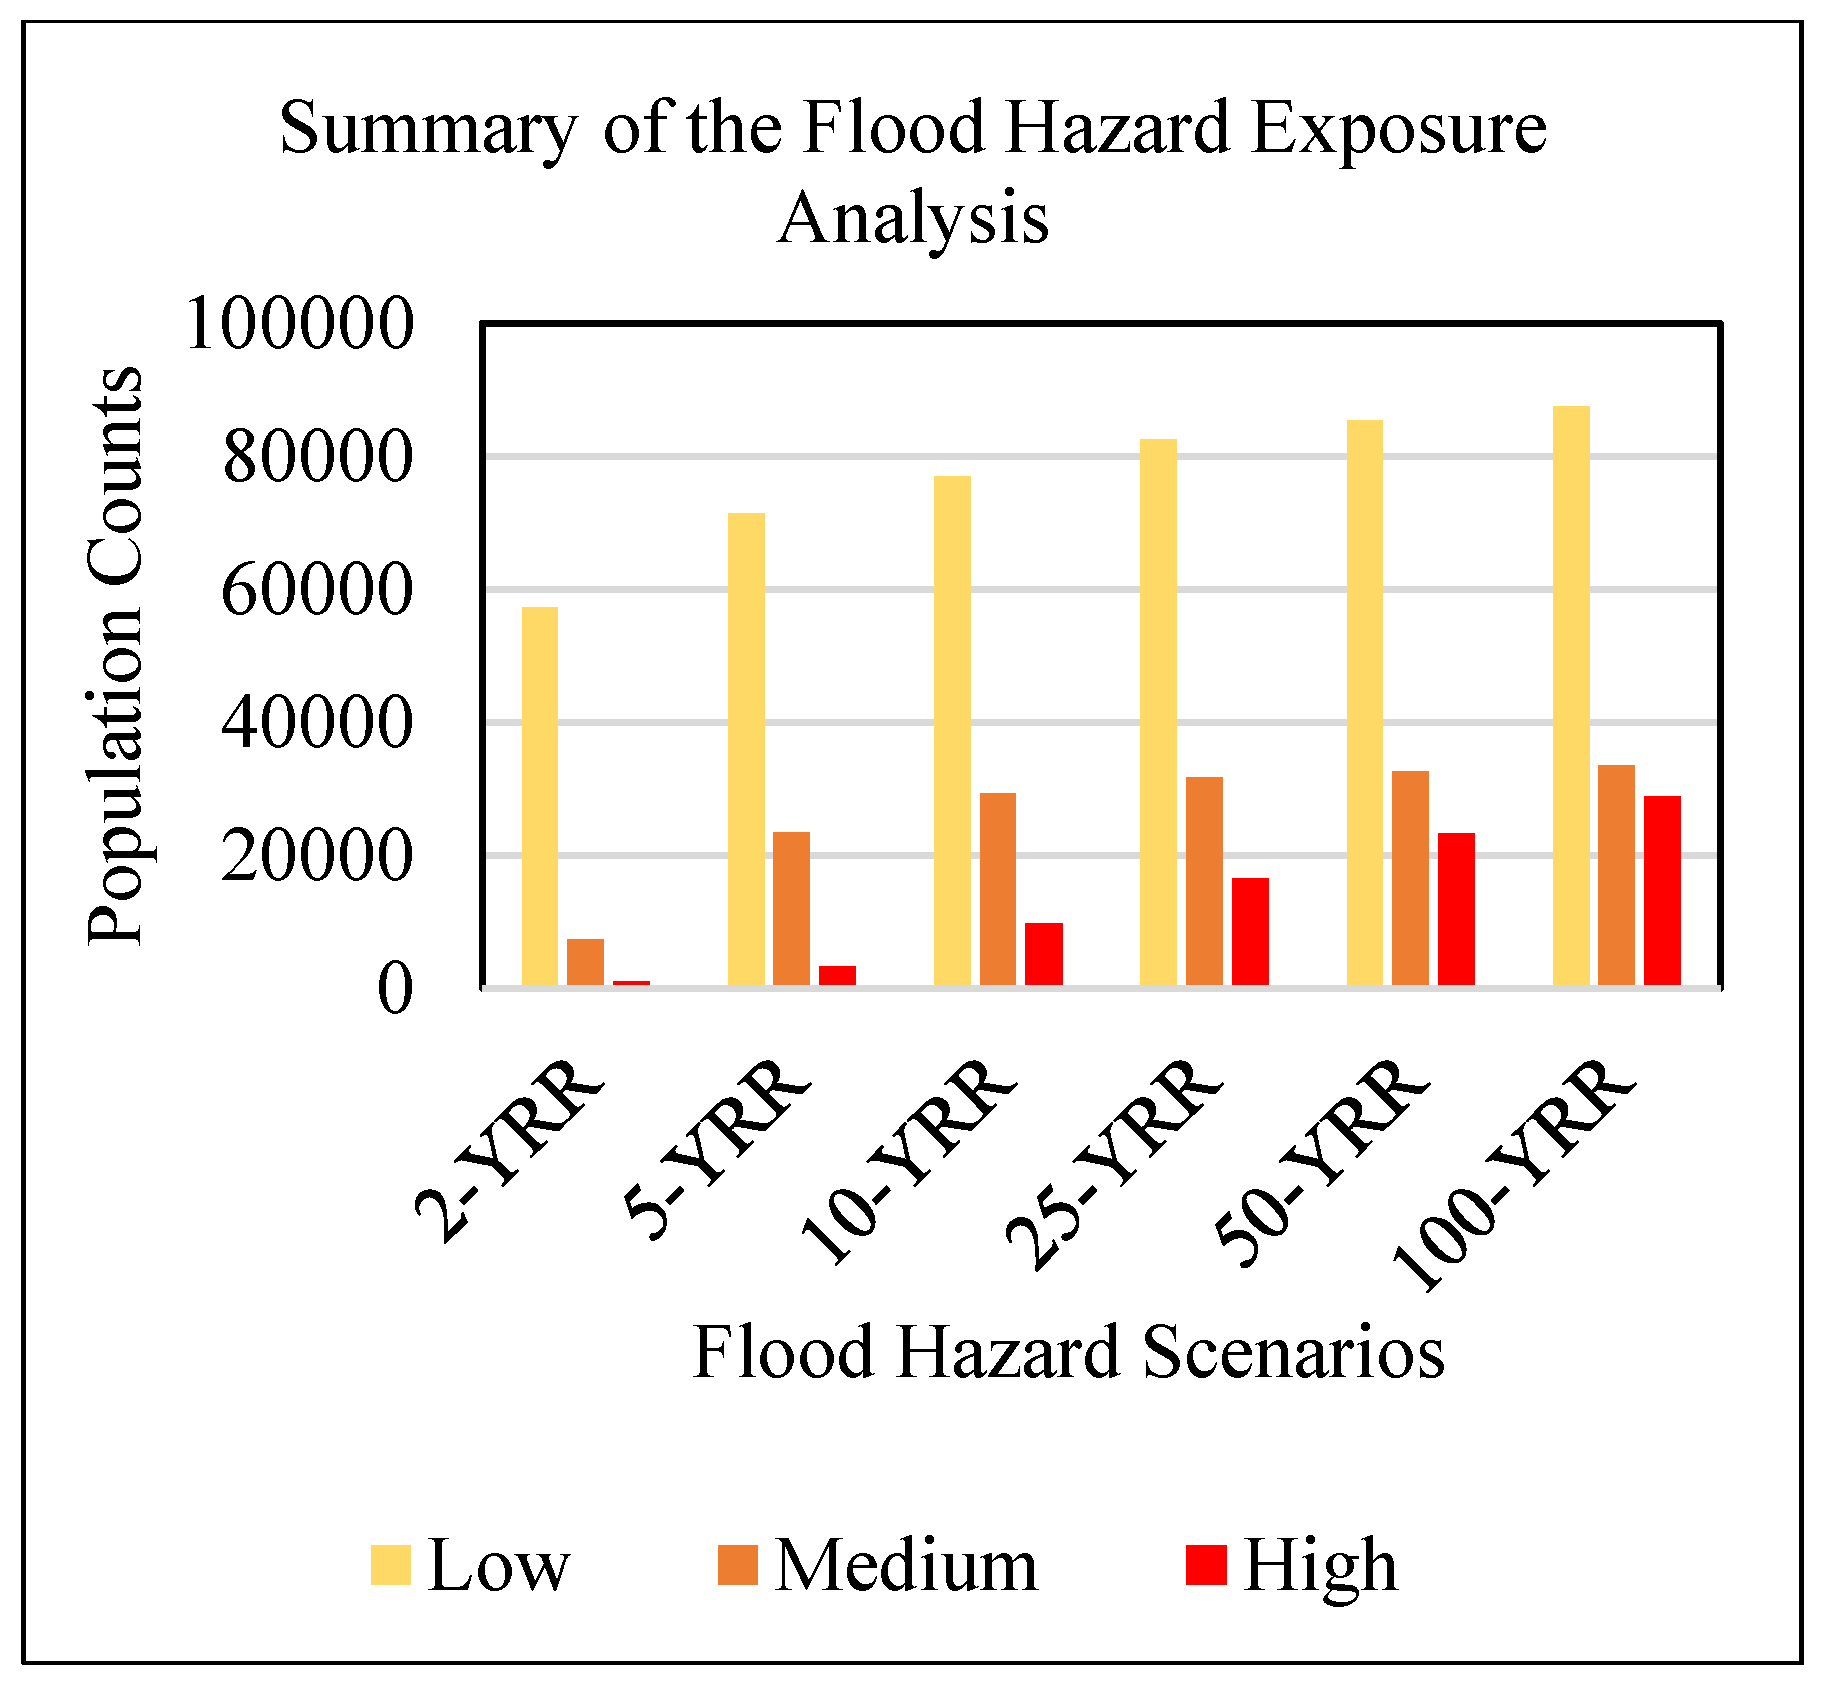
Under the 2-year return period, approximately 65,662 individuals would be exposed to flooding, with the majority falling under the low-hazard category. This increases to 98,231 individuals under the 5-year scenario, and further to 115,851 under the 10-year scenario. The 25-year, 50-year, and 100-year scenarios show progressively higher exposure levels, reaching 130,695, 141,248, and 149,739 individuals, respectively, which is equivalent to about 40% of Butuan City’s population.
Figure 13 summarizes the total number of affected individuals for each return period, broken down by hazard level. The results clearly show that population exposure increases with flood severity, which is expected as flood extents widen with increasing rainfall intensity.
Figure 7.
Map of estimated population exposure to flood hazards in Butuan City under the 2-year rainfall return period, showing affected individuals by hazard level.
Figure 7.
Map of estimated population exposure to flood hazards in Butuan City under the 2-year rainfall return period, showing affected individuals by hazard level.
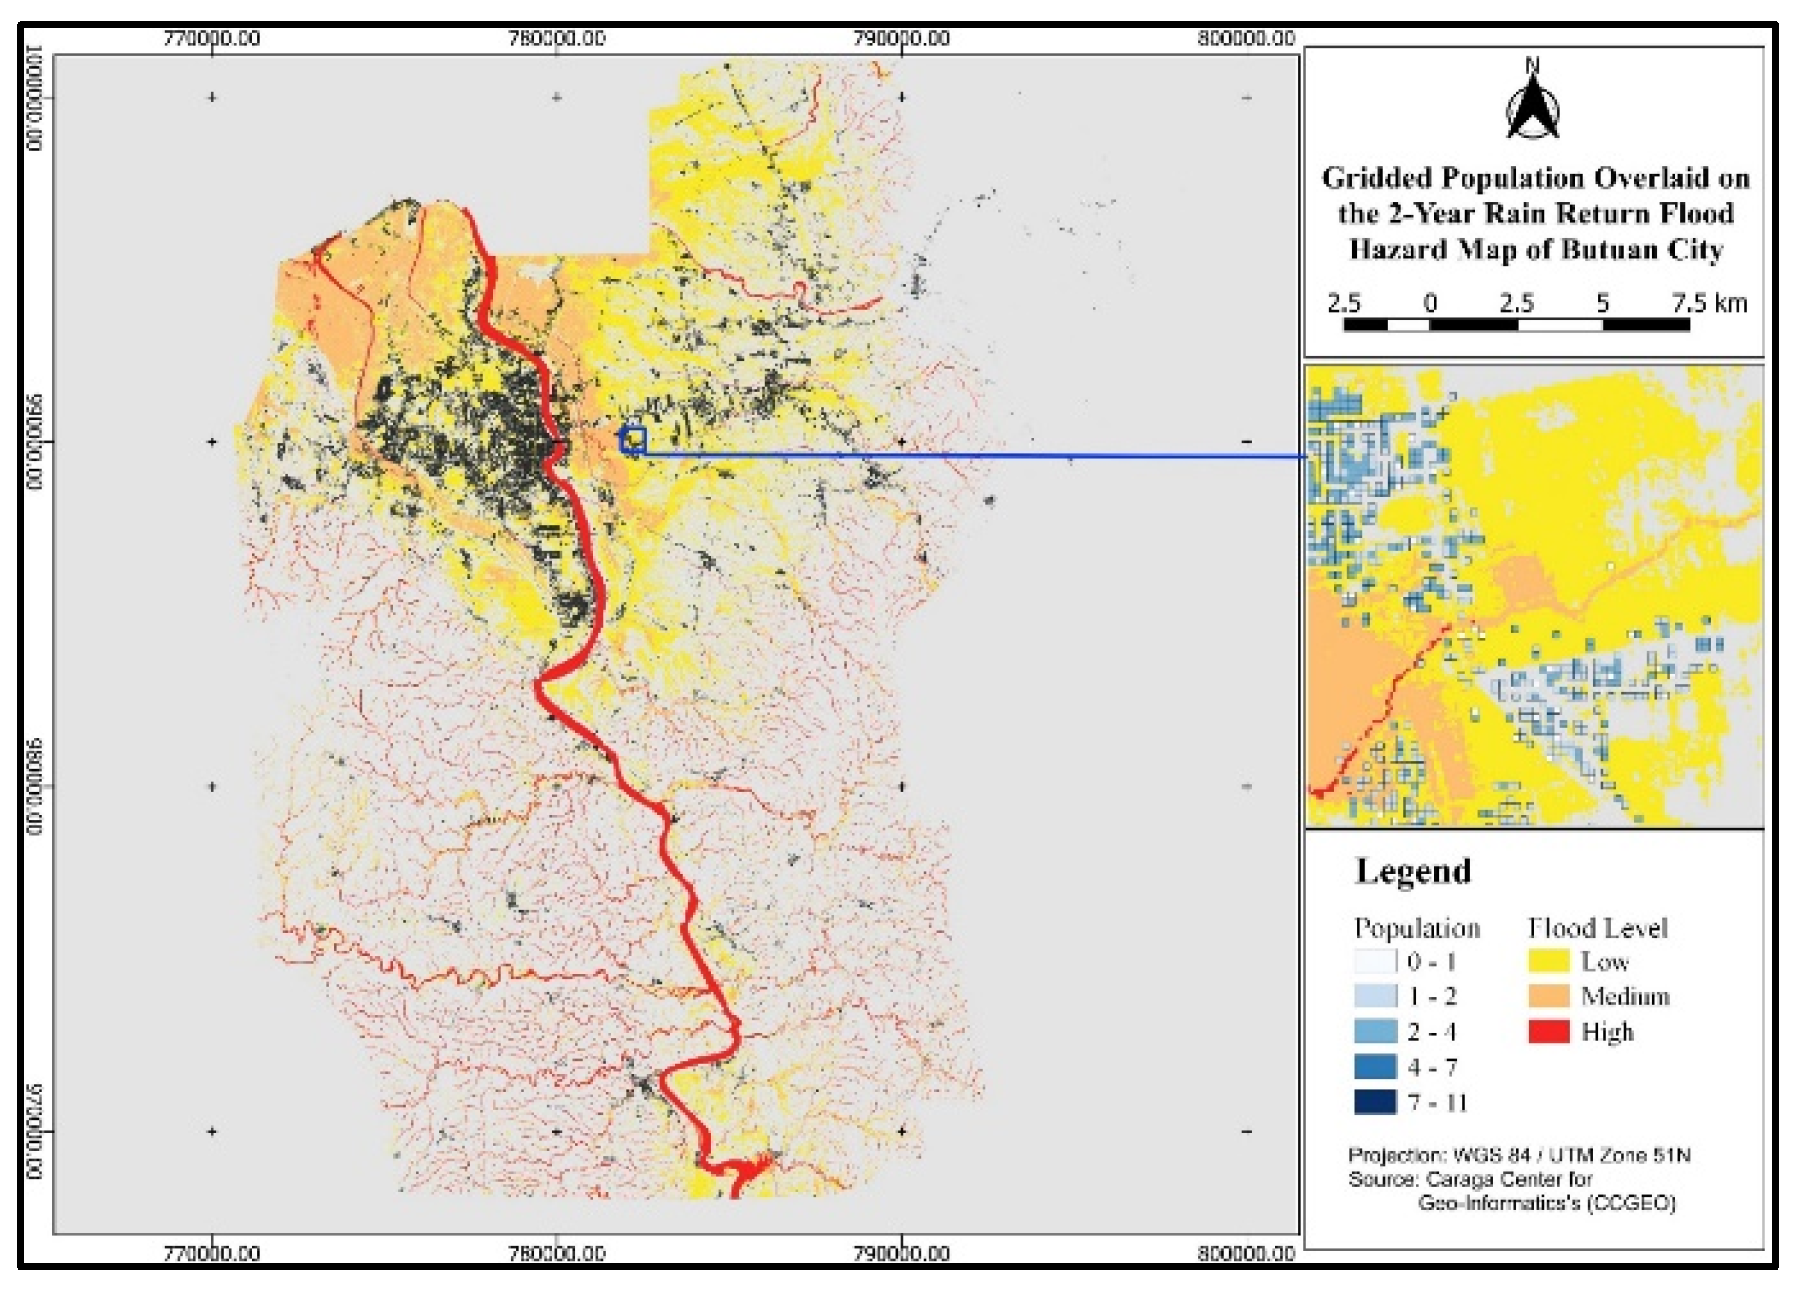
Figure 8.
Map of estimated population exposure to flood hazards in Butuan City under the 5-year rainfall return period.
Figure 8.
Map of estimated population exposure to flood hazards in Butuan City under the 5-year rainfall return period.
What distinguishes this study from previous exposure assessments is its population-based approach. Earlier studies often estimated exposure based solely on the number of affected buildings [11,12,13]. While this provides structural-level insights, it does not reflect how many people may be impacted. By contrast, this study provides direct estimates of the affected population, which is more relevant for planning emergency response, allocating resources, and designing risk reduction strategies.
Quantifying the number of potentially affected individuals allows for a more people-centered perspective in disaster risk management. It enables local governments to better anticipate needs—such as evacuation capacity, relief goods, and medical services—based on the actual number of residents in flood-prone areas, not just the number of structures. This approach also strengthens the link between population data and hazard exposure, making the analysis more useful for preparedness planning, spatial prioritization, and policy formulation at the local level.
Figure 9.
Map of estimated population exposure to flood hazards in Butuan City under the 10-year rainfall return period.
Figure 9.
Map of estimated population exposure to flood hazards in Butuan City under the 10-year rainfall return period.
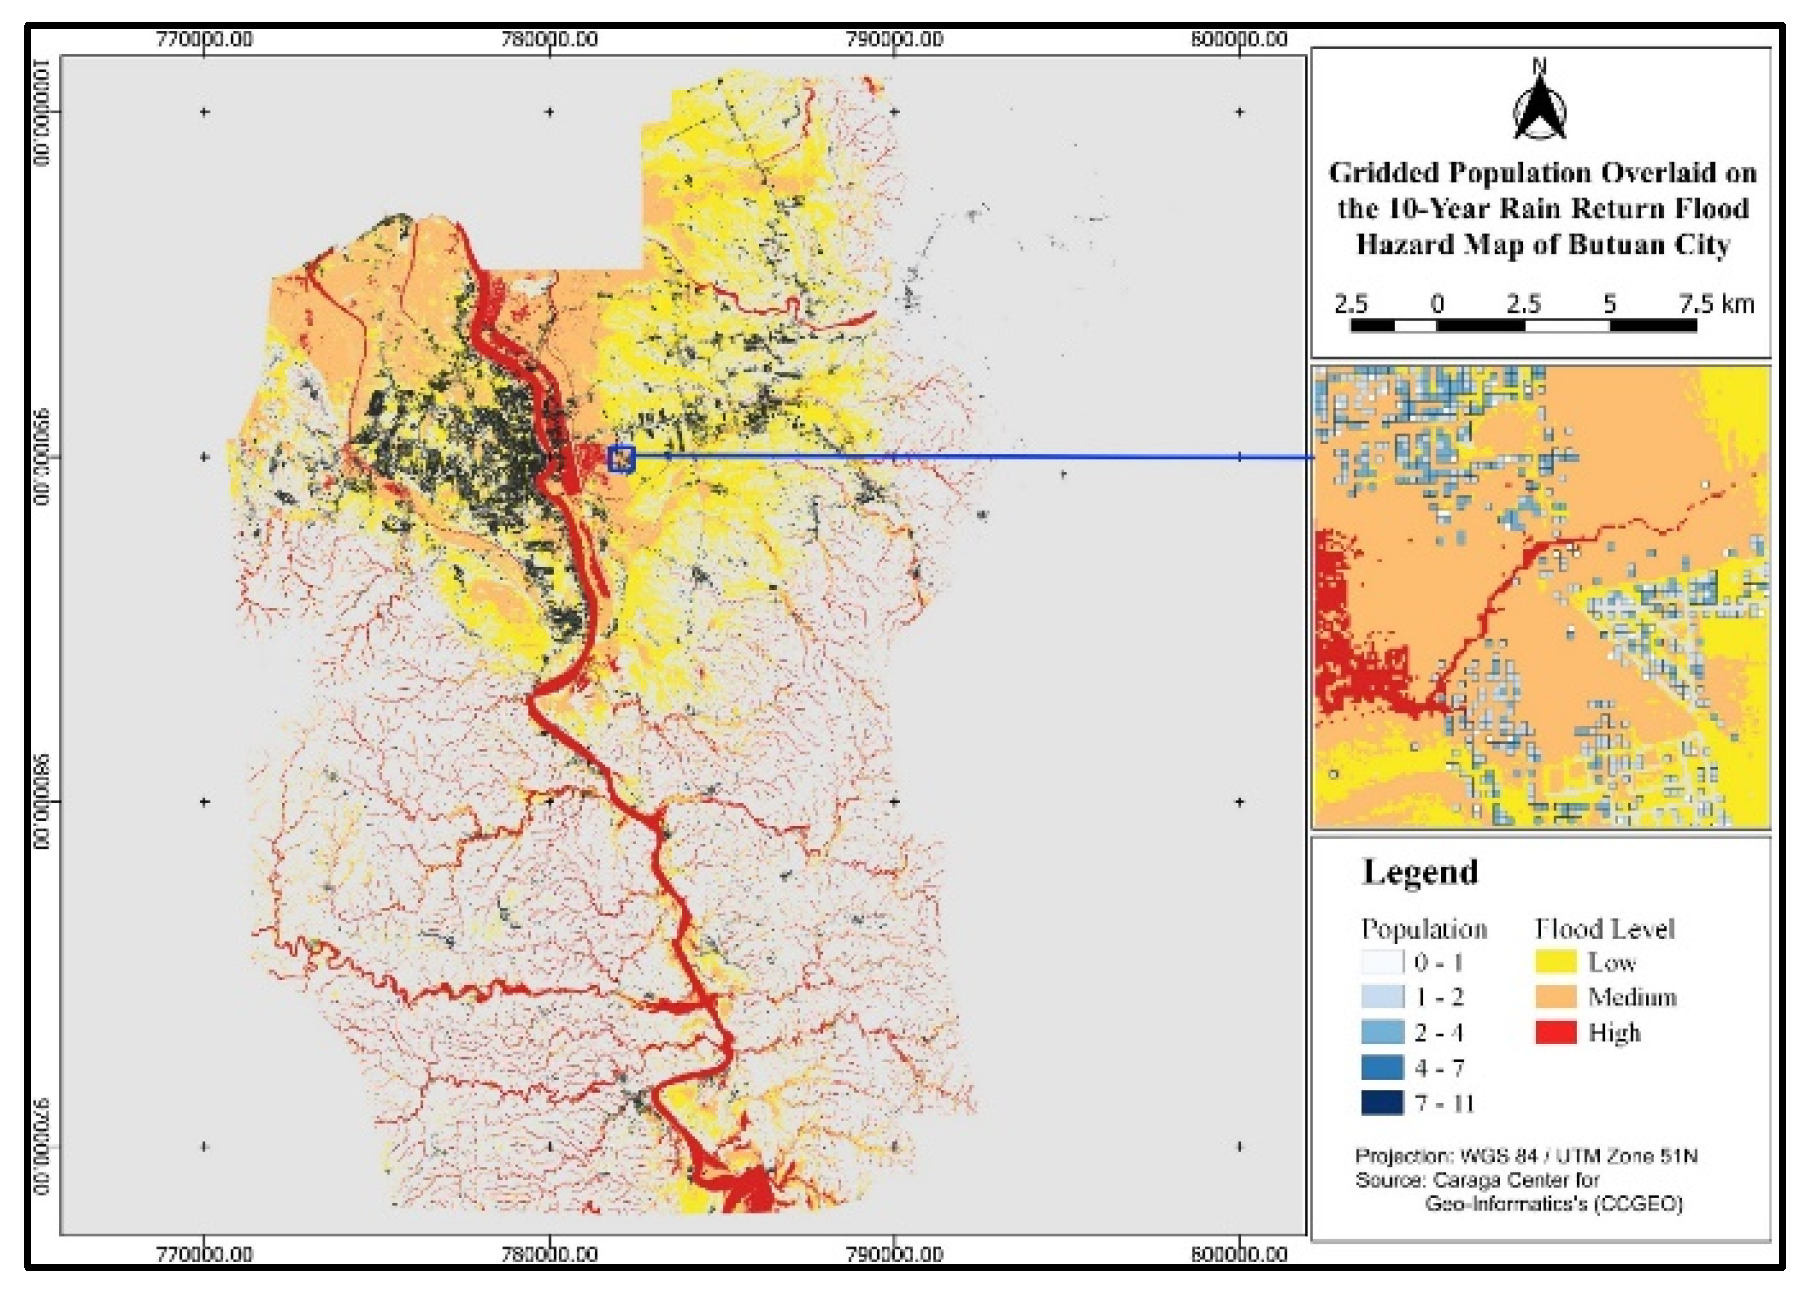
Figure 10.
Map of estimated population exposure to flood hazards in Butuan City under the 25-year rainfall return period.
Figure 10.
Map of estimated population exposure to flood hazards in Butuan City under the 25-year rainfall return period.
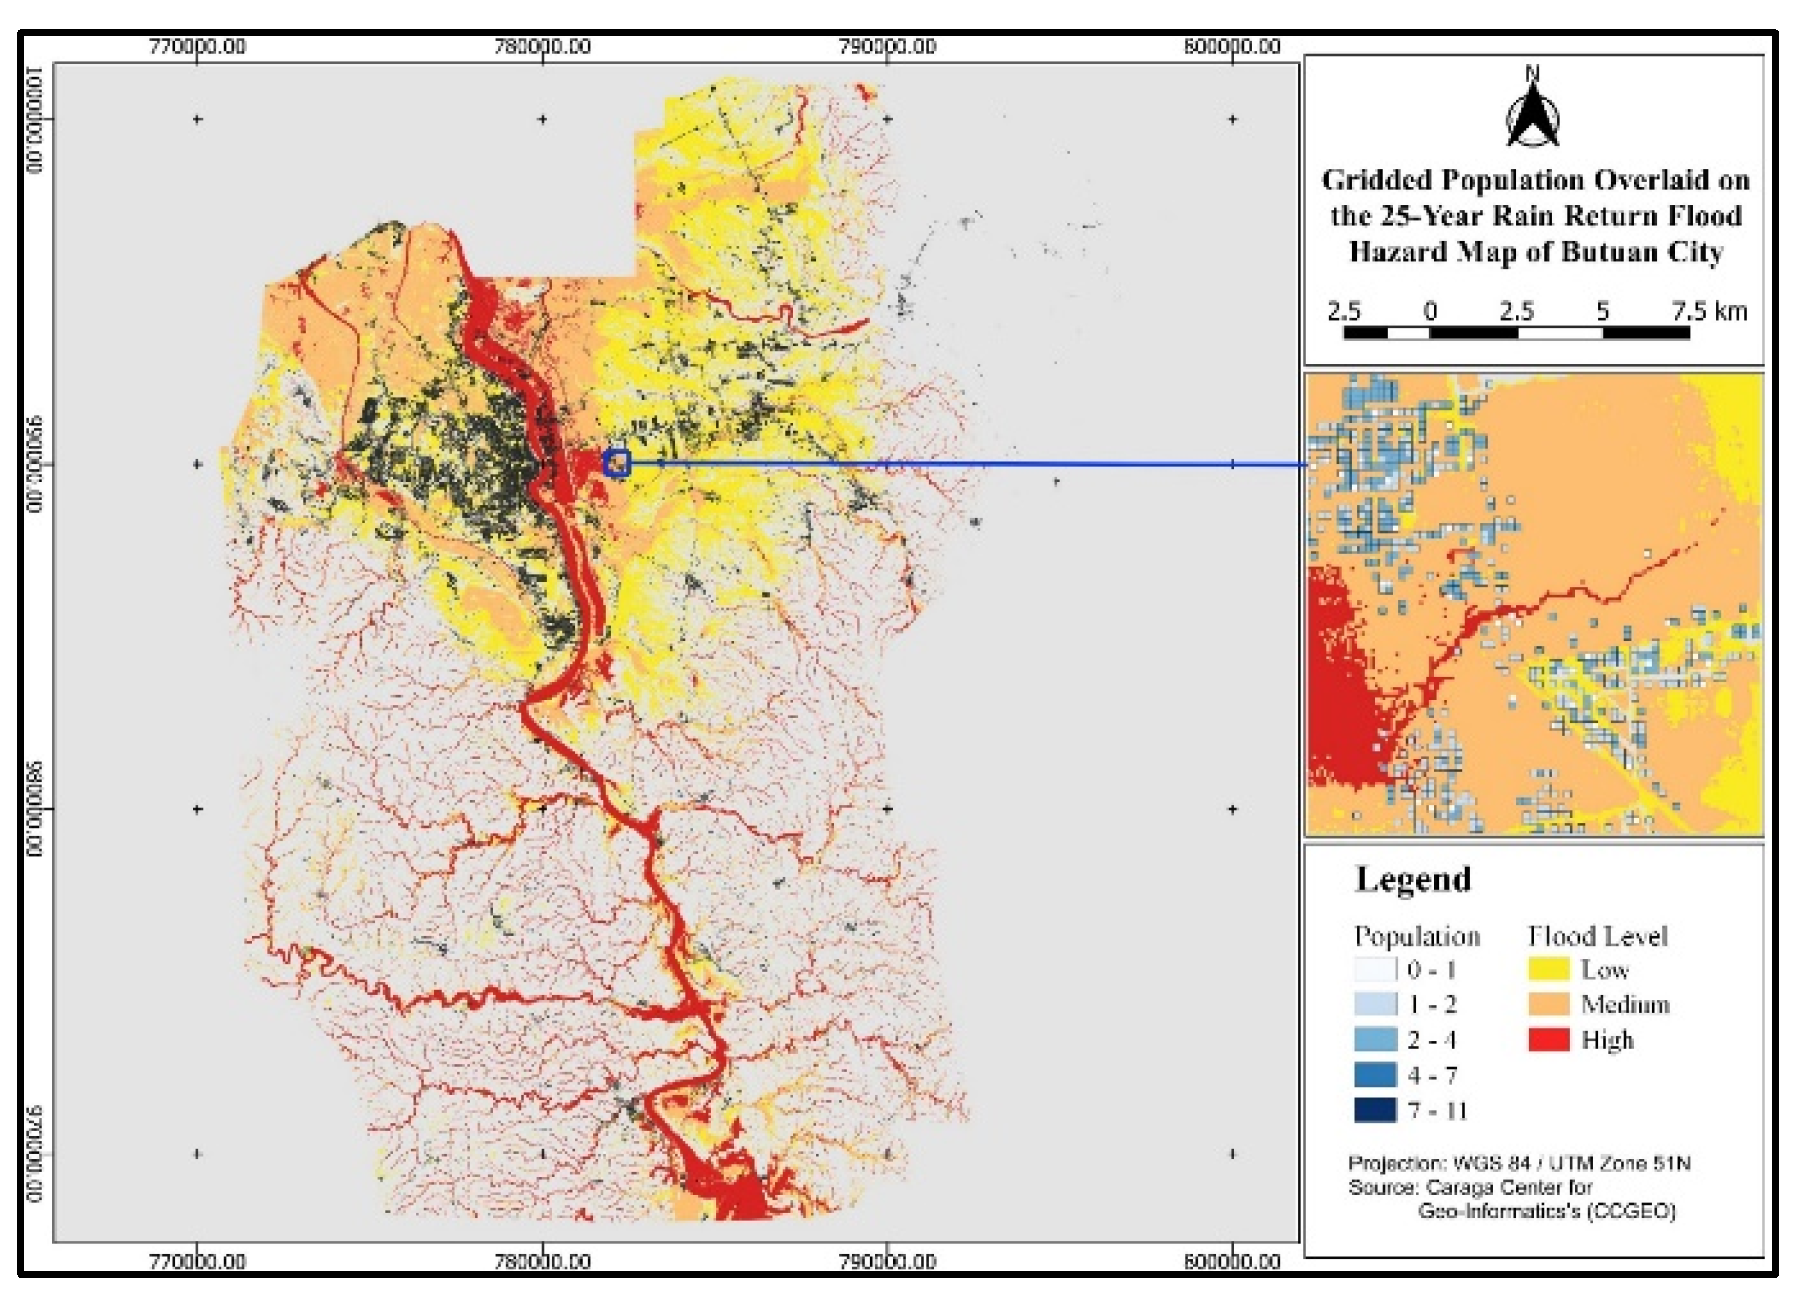
Figure 11.
Map of estimated population exposure to flood hazards in Butuan City under the 50-year rainfall return period.
Figure 11.
Map of estimated population exposure to flood hazards in Butuan City under the 50-year rainfall return period.

Figure 12.
Map of estimated population exposure to flood hazards in Butuan City under the 100-year rainfall return period.
Figure 12.
Map of estimated population exposure to flood hazards in Butuan City under the 100-year rainfall return period.
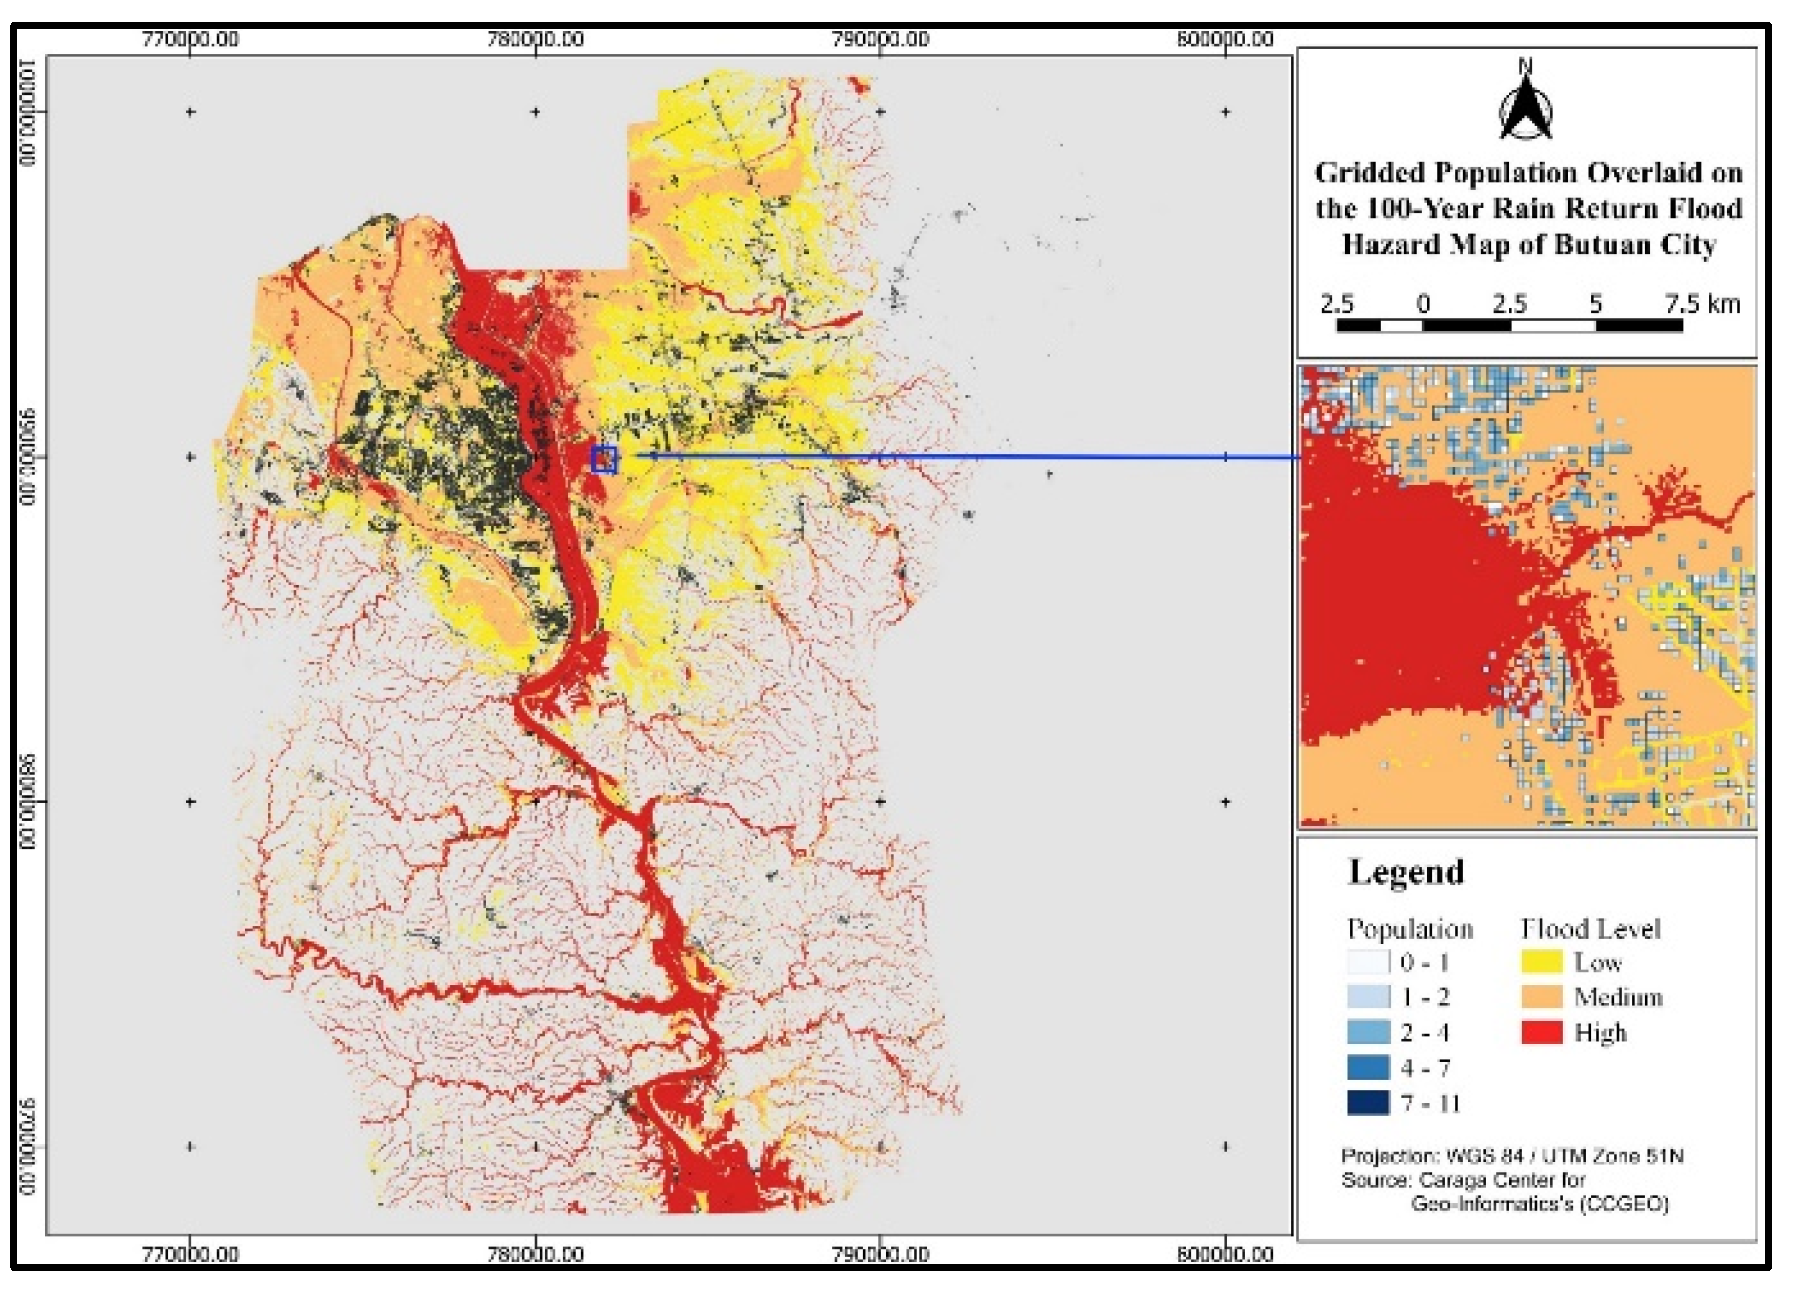
Figure 13.
Summary of population exposure across low, medium, and high flood hazard levels for all rainfall return periods. Exposure estimates reflect only the areas covered by the flood hazard maps.
Figure 13.
Summary of population exposure across low, medium, and high flood hazard levels for all rainfall return periods. Exposure estimates reflect only the areas covered by the flood hazard maps.
4. Conclusions and Outlook
This study developed a high-resolution gridded population dataset for Butuan City, Philippines using dasymetric mapping with refined Google Open Building Footprints. Residential building footprints were identified and used to redistribute barangay-level population data proportionally based on footprint area. The resulting dataset provides a more detailed and realistic picture of population distribution, especially in urban areas where building size and density vary widely.
The gridded population map was used to assess population exposure to multiple flood scenarios. By overlaying the population data with flood hazard maps, the study estimated the number of people at risk rather than just counting affected buildings, as done in many previous studies. This approach provides more meaningful insights for local governments and disaster planners by identifying not only where flood risks are concentrated, but also how many people may be affected. This enables better-targeted preparedness, resource allocation, and response planning.
While the method provides improved spatial resolution and greater relevance for planning, it has several limitations. The accuracy of results depends on the quality and timeliness of the input datasets, including building footprints and census data. Outdated or incomplete data can affect the reliability of the population estimates. Additionally, the use of footprint area as the sole basis for population redistribution does not account for differences in building height, occupancy type, or housing density.
Future work could enhance the gridded population mapping process by incorporating additional variables such as building height or residential use intensity. This would be especially important in urban centers with multi-story housing. Moreover, the current approach assume static population distribution and do not reflect seasonal or temporary shifts in population. Further research should explore how to integrate dynamic population data to better support time-sensitive applications such as disaster response or service delivery planning.
Overall, the study shows that gridded population datasets generated from open geospatial data can provide valuable insights for local-scale risk assessment and urban management. With further refinement, these methods can support more responsive and informed decision-making, especially in rapidly growing cities.
References
- Balk, D.L.; Deichmann, U.; Yetman, G.; Pozzi, F.; Hay, S.I.; Nelson, A. , “Determining Global Population Distribution: Methods, Applications and Data,” 2006, pp. 119–156. [CrossRef]
- Leyk, S.; et al. The spatial allocation of population: a review of large-scale gridded population data products and their fitness for use. Earth Syst Sci Data 2019, 11, 1385–1409. [Google Scholar] [CrossRef]
- Mennis, J.; Hultgren, T. Intelligent Dasymetric Mapping and Its Application to Areal Interpolation. Cartogr Geogr Inf Sci 2006, 33, 179–194. [Google Scholar] [CrossRef]
- Ricker, B.; Kraak, M.J.; Roth, R.E. , “The promise of dasymetric maps for monitoring progress towards the United Nations Sustainable Development Goals,” 2021, 3, 249. Abstracts of the ICA 2021, 3, 249. [Google Scholar] [CrossRef]
- Chamberlain, H.R.; Darin, E.; Adewole, W.A.; Jochem, W.C.; Lazar, A.N.; Tatem, A.J. , “Building footprint data for countries in Africa: To what extent are existing data products comparable? ,” Comput Environ Urban Syst 2024, 110, 102104. [Google Scholar] [CrossRef]
- Gonzales, J.J. , “Building-Level Comparison of Microsoft and Google Open Building Footprints Datasets,” in 12th International Conference on Geographic Information Science (GIScience 2023), 2023, pp. 35:1-36:6.
- Google, “Open Buildings A dataset of building footprints to support social good applications,” 2025.
- Baskaran, V.; Velkennedy, R.; Murugan, S.; Theerumalai, G. Modeling and prediction of the achievement level with related goals for SDG 11: Sustainable Cities and Communities. Proceedings of International Exchange and Innovation Conference on Engineering & Sciences (IEICES) 2022, 8, 19–24. [Google Scholar] [CrossRef]
- Ajoc, M.L.T.; Seno, B.M.; Gagula, A.C. “Assessing the Efficacy of Newly-Constructed Drainage Canals in Butuan City Proper, Philippines through Field Survey and Hydrologic Modelling Approach. Proceedings of International Exchange and Innovation Conference on Engineering & Sciences (IEICES) 2024, 10, 831–837. [Google Scholar] [CrossRef]
- Cochran, W.G.; Techniques, S.; York, E.N. , 1977.
- Makinano-Santillan, M.; Santillan, J.R. , “Flood hazard mapping of River Basins in Caraga Region, Mindanao, Philippines through the CSU Phil-LiDAR 1 project,” in 36th Asian Conference on Remote Sensing: Fostering Resilient Growth in Asia, ACRS 2015, Quezon City, Metro Manila, 2015.
- Santillan, J.R.; Morales, E.M.O.; Makinano-Santillan, M. , “Flood evidens: A web-based application for near-real time flood event visualization and damage estimations,” in 36th Asian Conference on Remote Sensing: Fostering Resilient Growth in Asia, ACRS 2015, Quezon City, Metro Manila, 2015.
- Santillan, J.R.; Morales, E.M.O.; Makinano-Santillan, M.; Amora, A.M.; Marqueso, J.T.; Gingo, A.L. , “A web GIS-based visualization and analytical platform for near-real time flood characterization, forecasting and impact assessment,” in 40th Asian Conference on Remote Sensing: Progress of Remote Sensing Technology for Smart Future, ACRS 2019, Daejeon, 2019.
Disclaimer/Publisher’s Note: The statements, opinions and data contained in all publications are solely those of the individual author(s) and contributor(s) and not of MDPI and/or the editor(s). MDPI and/or the editor(s) disclaim responsibility for any injury to people or property resulting from any ideas, methods, instructions or products referred to in the content. |
© 2025 by the authors. Licensee MDPI, Basel, Switzerland. This article is an open access article distributed under the terms and conditions of the Creative Commons Attribution (CC BY) license (https://creativecommons.org/licenses/by/4.0/).
Copyright: This open access article is published under a Creative Commons CC BY 4.0 license, which permit the free download, distribution, and reuse, provided that the author and preprint are cited in any reuse.


