1. Introduction
Snack consumption has surged in recent years, driven by their convenience and the evolving lifestyle patterns of modern populations (Monteiro et al., 2013). Among these options, protein bars are often perceived as a healthier choice. However, many conventional protein bars contain high levels of sugar, which may negatively impact metabolic health (Thakur et al., 2022). Excessive sugar intake is strongly associated with poor metabolic outcomes (Sturt, 2011). Sugary snacks can cause rapid spikes in blood glucose, followed by a sharp decline—commonly known as a “sugar crash.” This sudden drop in energy often triggers cravings and repetitive consumption, contributing to unhealthy eating patterns (Mantantzis et al., 2019). Thus, foods with minimal impact on blood glucose are increasingly recognized as essential for promoting metabolic well-being.
In Chile, snacking is a deeply ingrained dietary habit, with around 25% of individuals reporting snack consumption during mid-morning, mid-afternoon, or late evening (Faculty of Medicine & Faculty of Economics and Business, 2012). Moreover, snacks contribute over one-quarter of the daily energy intake for children and adolescents (Jensen et al., 2019). Given the global rise in obesity and diabetes, Chile faces a particularly concerning scenario where over 70% of the population is classified as overweight or obese (Ministry of Health, 2017). This issue reflects a broader global trend, where obesity rates have tripled since 1975, with over 1.9 billion adults categorized as overweight and 650 million as obese (Ahmed & Konje, 2023). The obesity crisis has significantly influenced consumer behavior, driving a shift toward healthier dietary options. Consumers are increasingly prioritizing snacks with reduced sugar content, functional ingredients, and clean labels that support metabolic health, weight management, and sustained energy release.
In parallel with the health crisis, sports, and physical activity have gained traction as individuals seek to improve their lifestyles and overall well-being. Sports participation in Chile is on the rise, with over 40% of individuals reporting moderate physical activity at least once weekly. Globally, this trend has fueled the sports nutrition market, which is projected to reach USD 81.5 billion by 2030 (Tyler, 2024). However, many existing products in the market still rely heavily on sugar as a primary energy source, undermining their perceived health benefits. This growing awareness highlights a significant market opportunity for innovative, functional snack products that align with evolving consumer needs.
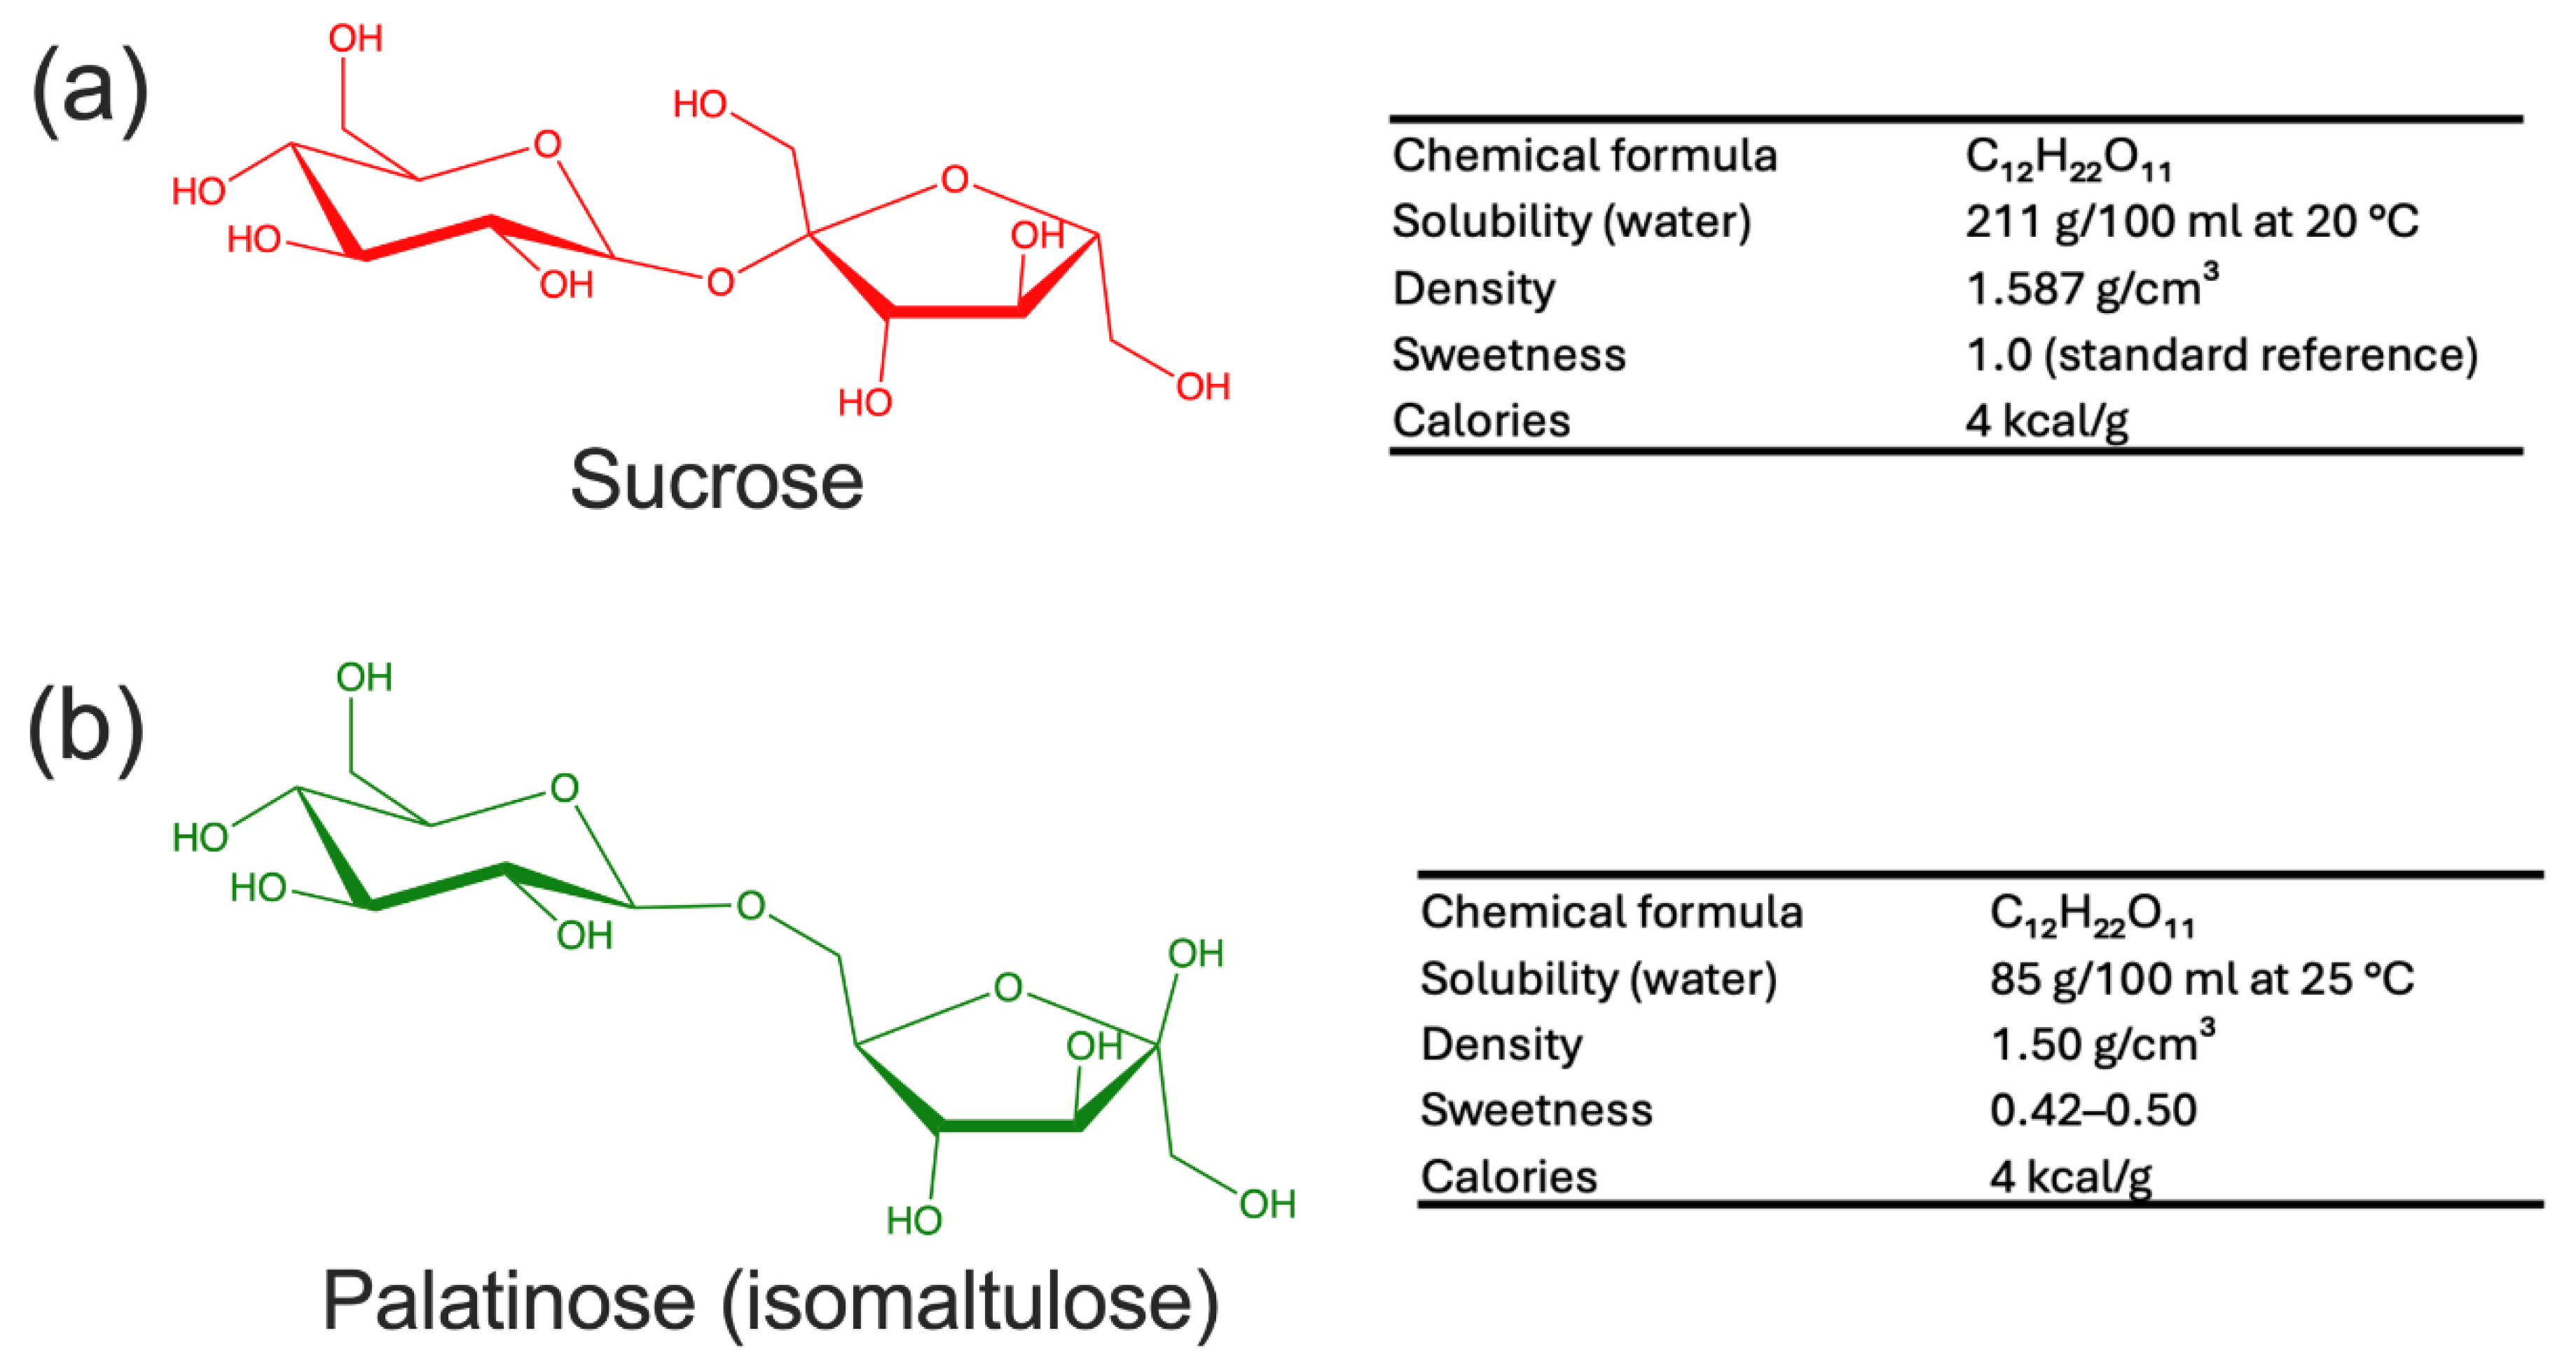
The Chilean snack bar market exemplifies this potential, reaching USD 85.3 million in 2023, with an annual growth rate projected at 3.9% until 2032 (Expert Market Research, 2024). Cereal-based snacks (CBS) remain popular in this dynamic market due to their traditional appeal, while animal-based protein snacks (ABPS) emphasize natural ingredients and functional benefits. At the forefront of innovation are NotProtein® snack bars (NPSB), which leverage cutting-edge technology and plant-based proteins to deliver improved nutritional profiles. These products, formulated with isomaltulose (Palatinose®)—a disaccharide composed of glucose and fructose linked by a stable α-1,6 glycosidic bond—are specifically designed to offer a lower glycemic impact and sustained energy release compared to conventional sugar-based formulations (Kokubo et al., 2022; Maresch et al., 2017). The unique structure of isomaltulose makes it to be digested slower by intestinal enzymes, resulting in a slower release of glucose into the bloodstream and providing metabolic benefits over time (
Figure 1).
This report evaluated the glycemic impact of NPS, a plant-based protein bar formulated with isomaltulose to minimize blood sugar spikes, compared to two leading snack products in the Chilean market: CBS and ABPS. The findings underscore the potential of innovative formulations like NPS to support metabolic health, providing consumers with smarter, healthier snack alternatives.
2. Materials and Methods
2.1. Test Foods
The study evaluated three snack bars currently available in the Chilean market. The Not Company developed NPSB. CBS was chosen for its popularity as a top-selling cereal snack bar, widely marketed as a snack for schoolchildren. ABPS is one of Chile’s leaders in the protein bar category. A glucose solution was used as the control food (GC).
2.1.1. Proximate Analysis.
Proximate analysis was performed by Food Center Laboratory of the Institute of Nutrition and Food Technology (INTA) at University of Chile. The moisture determination was performed using the gravimetric method according to NCh 841:2018 and protocol LCA-PRE-011. Total ash was also determined using a gravimetric method following NCh 842:2018 and protocol LCA-PRE-002. The protein content was quantified using the Kjeldahl method, based on ISP.PART-711.02-173 (2014), protocol LCA-PRE-006. The acid hydrolysis Mojonnier method was employed to determine total fat, following AOAC Official Methods 935.38, 925.32, and 922.06, according to protocol LCA-PRE-035. Total integrated dietary fiber was analyzed using an enzymatic-gravimetric-HPLC method, following AOAC Official Method 2011.25 and protocol LCA-PRE-003. Available carbohydrates were obtained by difference, subtracting the contribution of moisture, ash, protein, total fat, and total dietary fiber from 100%. Finally, energy content was calculated using the Atwater factors 4, 9, and 2 for proteins, total fats, carbohydrates, and total soluble dietary fiber, respectively (Latimer, 2023).
2.2. Study Design
2.2.1. Subjects
The participants were ten healthy adults (six females and four males) aged 20 to 54, with body mass index (BMI) values between 20 and 24.3 kg/m². Anthropometric measurements, including weight and height, were taken using standardized procedures (Soares et al., 2024). Participants were selected based on inclusion criteria that required them to be healthy adults who had maintained a stable body weight over the past six months and were not using supplements or medications. Individuals were excluded if they had diagnosed medical conditions, allergies, intolerances to the test foods, or, in the case of women, a diagnosis of polycystic ovary syndrome. All participants were instructed to follow their regular diet throughout the study. Participation was voluntary, and each individual provided informed consent before the study began.
2.2.2. Experimental Procedure
The study was conducted at the Nutrition Department of the University of Chile and received approval from the Ethical Committee of Research in Human Subjects (CEISH, by its Spanish acronym) of the School of Medicine, University of Chile. The experimental procedure adhered to the ISO 26642:2010 guidelines for determining the glycemic index (GI).
Participants consumed the equivalent of 25 g of available carbohydrate for each bar, or a control sample composed of 25 g of glucose dissolved in 250 mL of water. Capillary blood samples were obtained via finger puncture at baseline (0 min, fasting glucose) and at subsequent intervals of 15, 30, 45, 60, 90, and 120 min after consumption. Blood glucose levels were measured using an Accu-Chek Instant glucometer (Roche Diabetes Care Inc., Indiana, US).
Participants were required to fast overnight (12 h) before the test and instructed to avoid alcohol consumption or vigorous physical activity on the morning of the assessment.
2.3. Glycemic Index Calculation
The incremental area under the curve (iAUC) for each test food was determined geometrically using the trapezoidal rule according to the ISO 26642:2010 guidelines. Fasting blood glucose levels were set as the baseline, and this area was excluded from the calculations.
The GI for each test food was calculated using Equation (4):
where iAUC
test food represents the iAUC calculated for each snack bar, and iAUC
control food corresponds to the iAUC derived from the GC.
The final GI value for each snack bar was obtained by averaging the GI values calculated individually for each of the 10 participants.
2.4. Glycemic Load Calculation
The glycemic load (GL) for each test food was determined following the method described by Salmerón et al. (1997). The calculation was performed using Equation (5):
where GI
Test food represents the GI of the test food and the available carbohydrates are expressed in g/serving.
2.5. Kinetic and Thermodynamic Analysis
The kinetic and thermodynamic parameters of the test foods were determined to evaluate the foods’ glycemic responses. The analysis included the following parameters:
2.5.1. Time to Peak
This is the time between ingestion and the moment when the maximum blood glucose level is reached.
2.5.2. Absorption and Clearance Rates (Rab and Rcl) and Kinetic Constants (kab and kcl)
C0 (mg/dL) is the initial blood glucose concentration, Cpeak is the maximum concentration, and Cfinal is the concentration when blood glucose stabilizes at a constant value. Similarly, t0, tpeak, and tfinal denote the times associated with the above-mentioned points, measured in minutes.
Kinetic constants were calculated by dividing the Rab or Rcl by C0.
2.5.3. Gibbs Free Energy
The standard Gibbs free energy change (∆G’) was calculated using Equation (5):
where R is the universal gas constant (8.314 J/mol × K), T is the absolute temperature in Kelvin (310 K (37 °C)), and K is the equilibrium constant of the process (Equation (6)).
2.6. Statistical Analysis
Differences in the iAUC, GI, and GL among the snack bars were assessed using the Friedman test and Tukey’s post-hoc analysis for pairwise comparisons. A p-value < 0.05 was considered statistically significant.
Additionally, the thermodynamic and kinetic analysis values were analyzed using one-way ANOVA to determine significant differences among the snack bars, ensuring robust statistical validation of the observed trends.
3. Results
3.1. Chemical and Nutritional Composition of the Evaluated Snacks
The evaluated snack bars showed significant differences in their compositions. CBS had the highest content of available carbohydrates (66.8 g/100 g) and total sugars (40.1 g/100 g), along with a low protein content (5.9 g/100 g) and total fiber (4.9 g/100 g). In contrast, ABPS and NPSB exhibited similar nutritional profiles regarding protein content (34.5 g/100 g each). However, NPSB stood out with its high total fiber content (23.1 g/100 g) and lower proportion of available carbohydrates (11.4 g/100 g) (
Table 1).
3.2. Study Design and Participant Characteristics
The study involved 10 healthy participants (fasting glucose = 88.4 ± 3.8 mg/dL, fasting insulin = 6.9 ± 2.9 μL U/mL, and homeostatic model assessment for insulin resistance (HOMA-IR) = 1.5 ± 0.6 pmol × mmol). Each participant consumed an isocarbohydrate portion (25 g total) of the tested bars, and the postprandial glycemic response was monitored for 2 h.
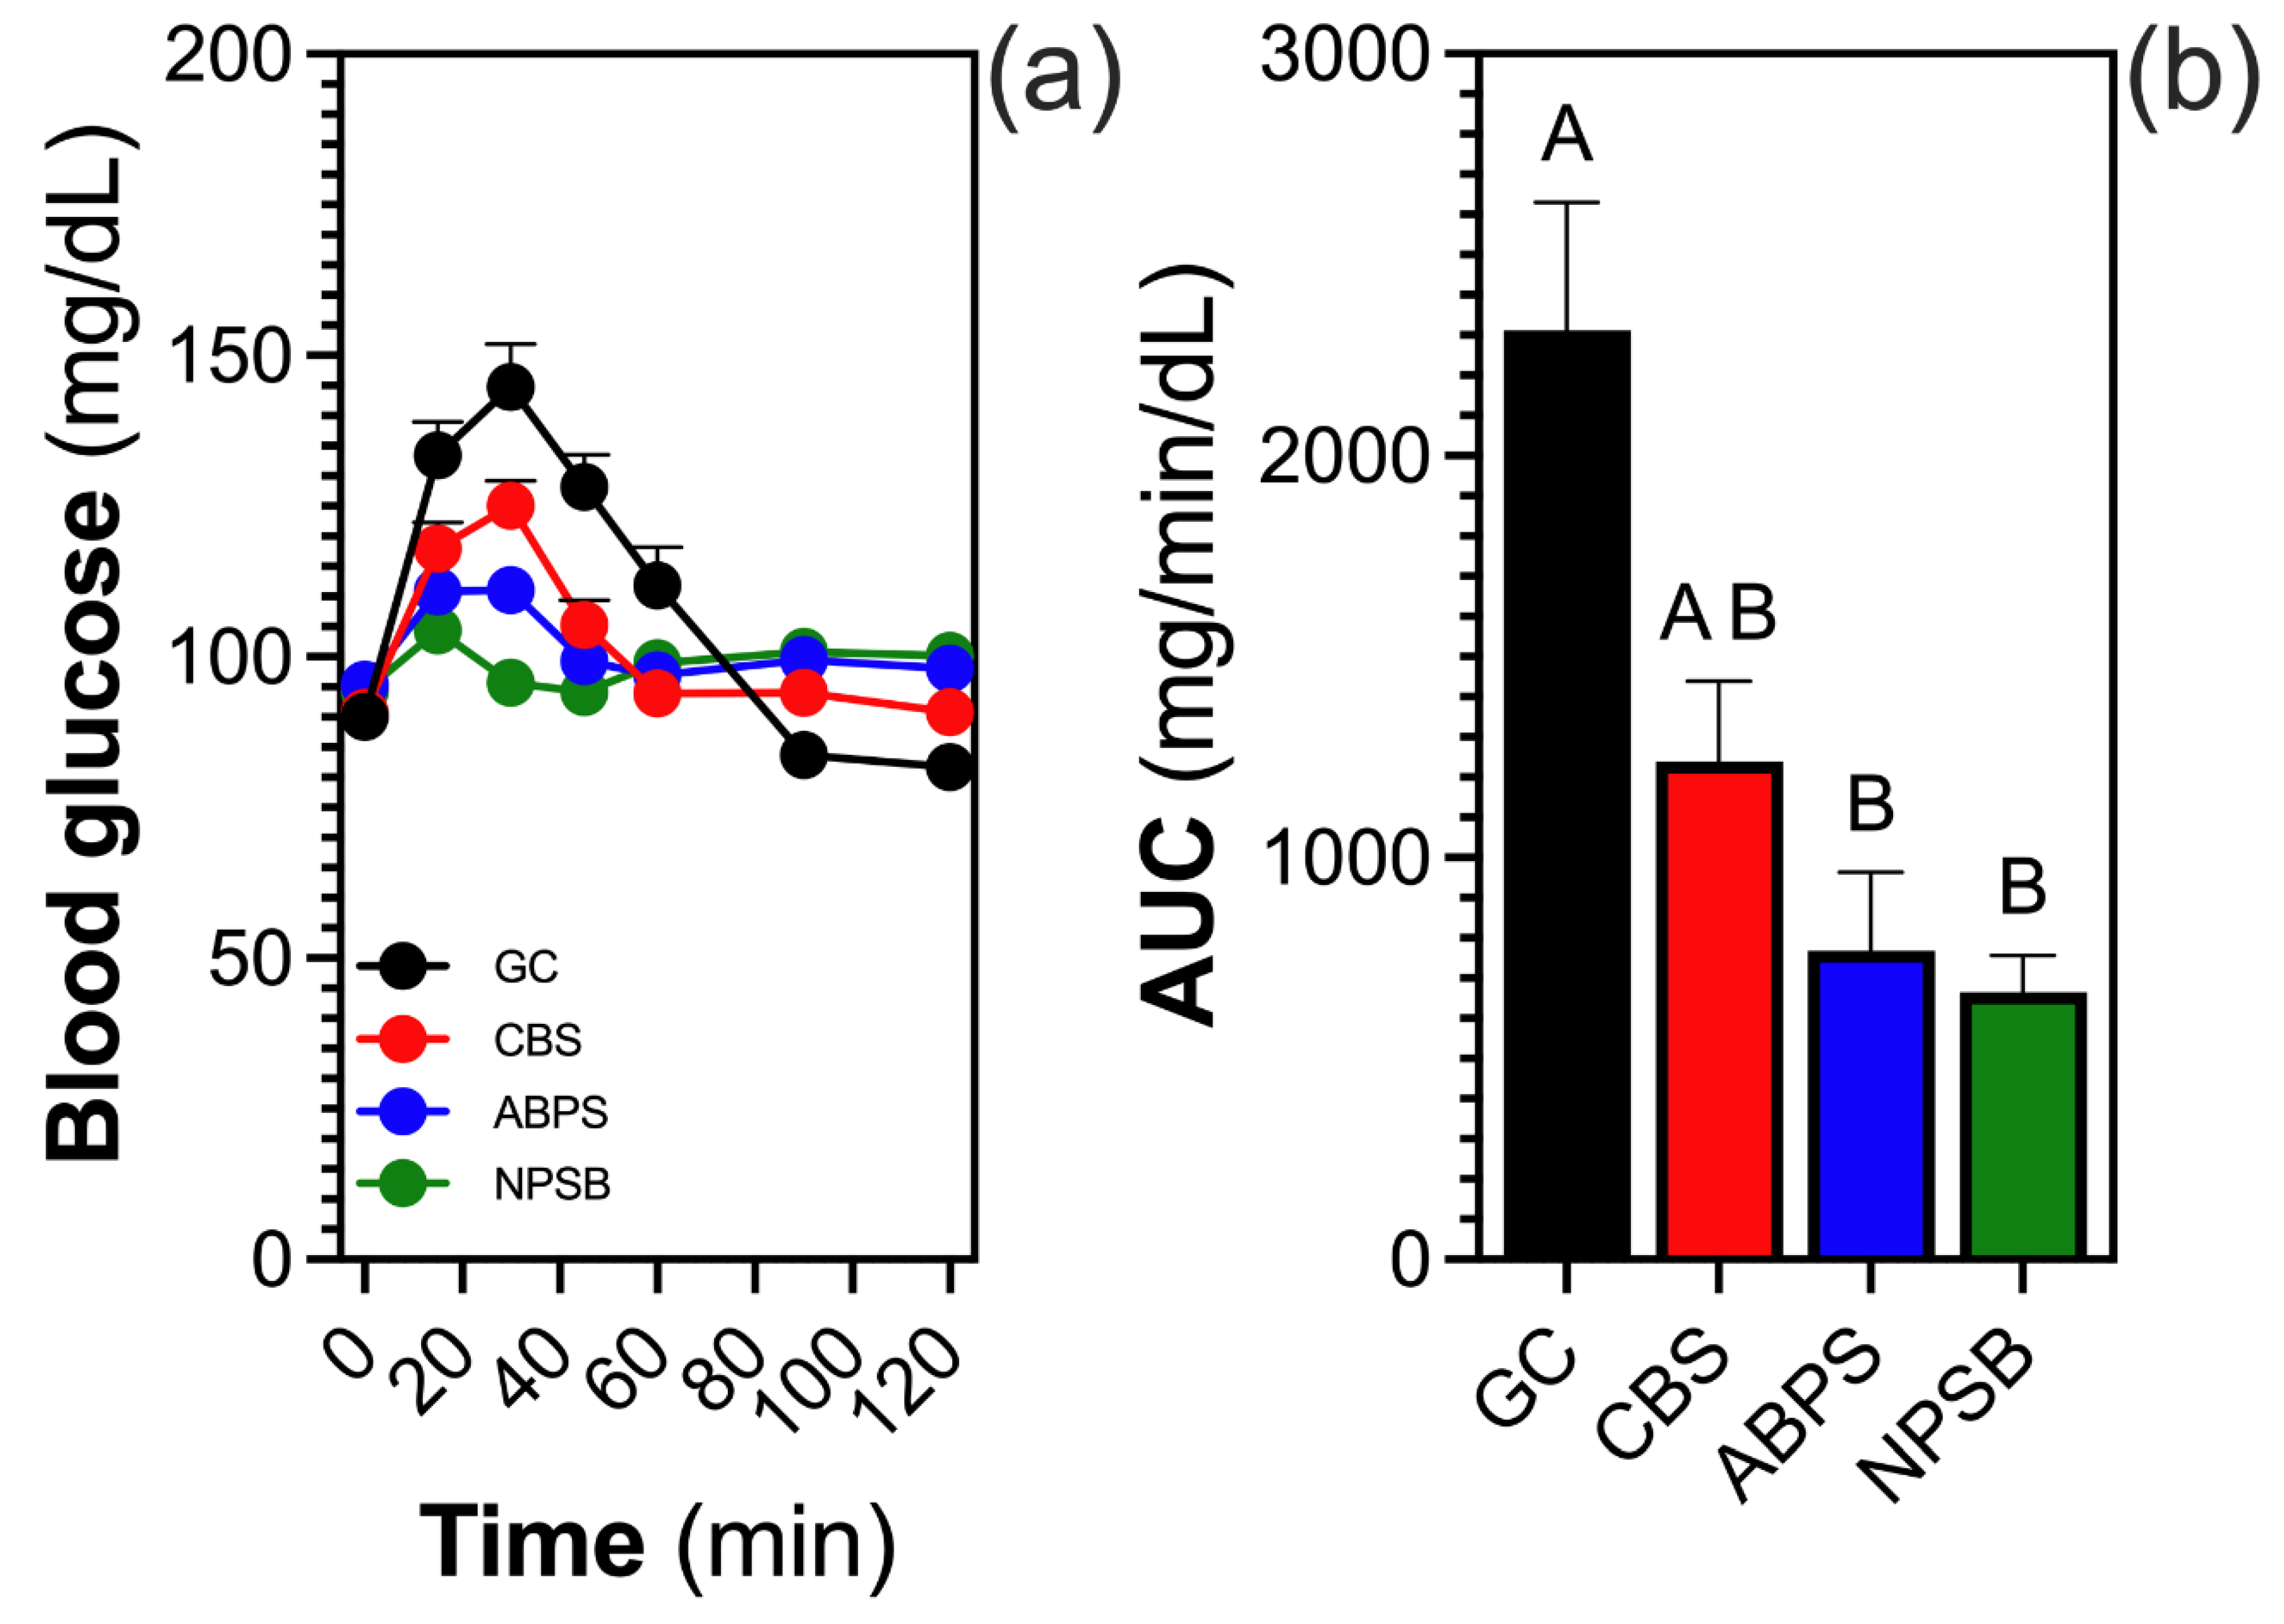
3.3. Glycemic Response and iAUC
Glycemic response variations were observed across the tested bars (
Figure 2A). The NSPB resulted in the smallest increase in blood glucose levels, followed by ABPS. By contrast, CBS elicited the highest glycemic response, approaching that of the GC (control). Blood glucose levels peaked at 15 min post-consumption for the NSPB and ABPS samples, whereas CBS peaked at 30 min. A decline in glucose levels was noted at 30 min for NSPB, whereas this decline occurred at 45 min for ABPS. For CBS, glucose levels continuously decreased until 60 min, at which point all bars demonstrated similar levels. Thereafter, blood glucose levels remained comparable until the 120 min mark, with CBS exhibiting slightly lower values during this period (
Figure 2A).
The iAUC analysis revealed that NPSB elicited the lowest glycemic response, followed by ABPS and CBS. However, no significant differences were observed among them (
Figure 1B).
3.4. Glycemic Index and Glycemic Load
The GI analysis revealed that CBS exhibited the highest value (83.7 ± 27.1), whereas NPSB and ABPS indicated 42.9 ± 13.6 and 39.9 ± 12.6, respectively, with no significant differences between the latter two (
Table 2). Furthermore, NPSB presented the lowest GL value (4.4), followed by ABPS (7.0) and CBS (10.8) (
Table 2).
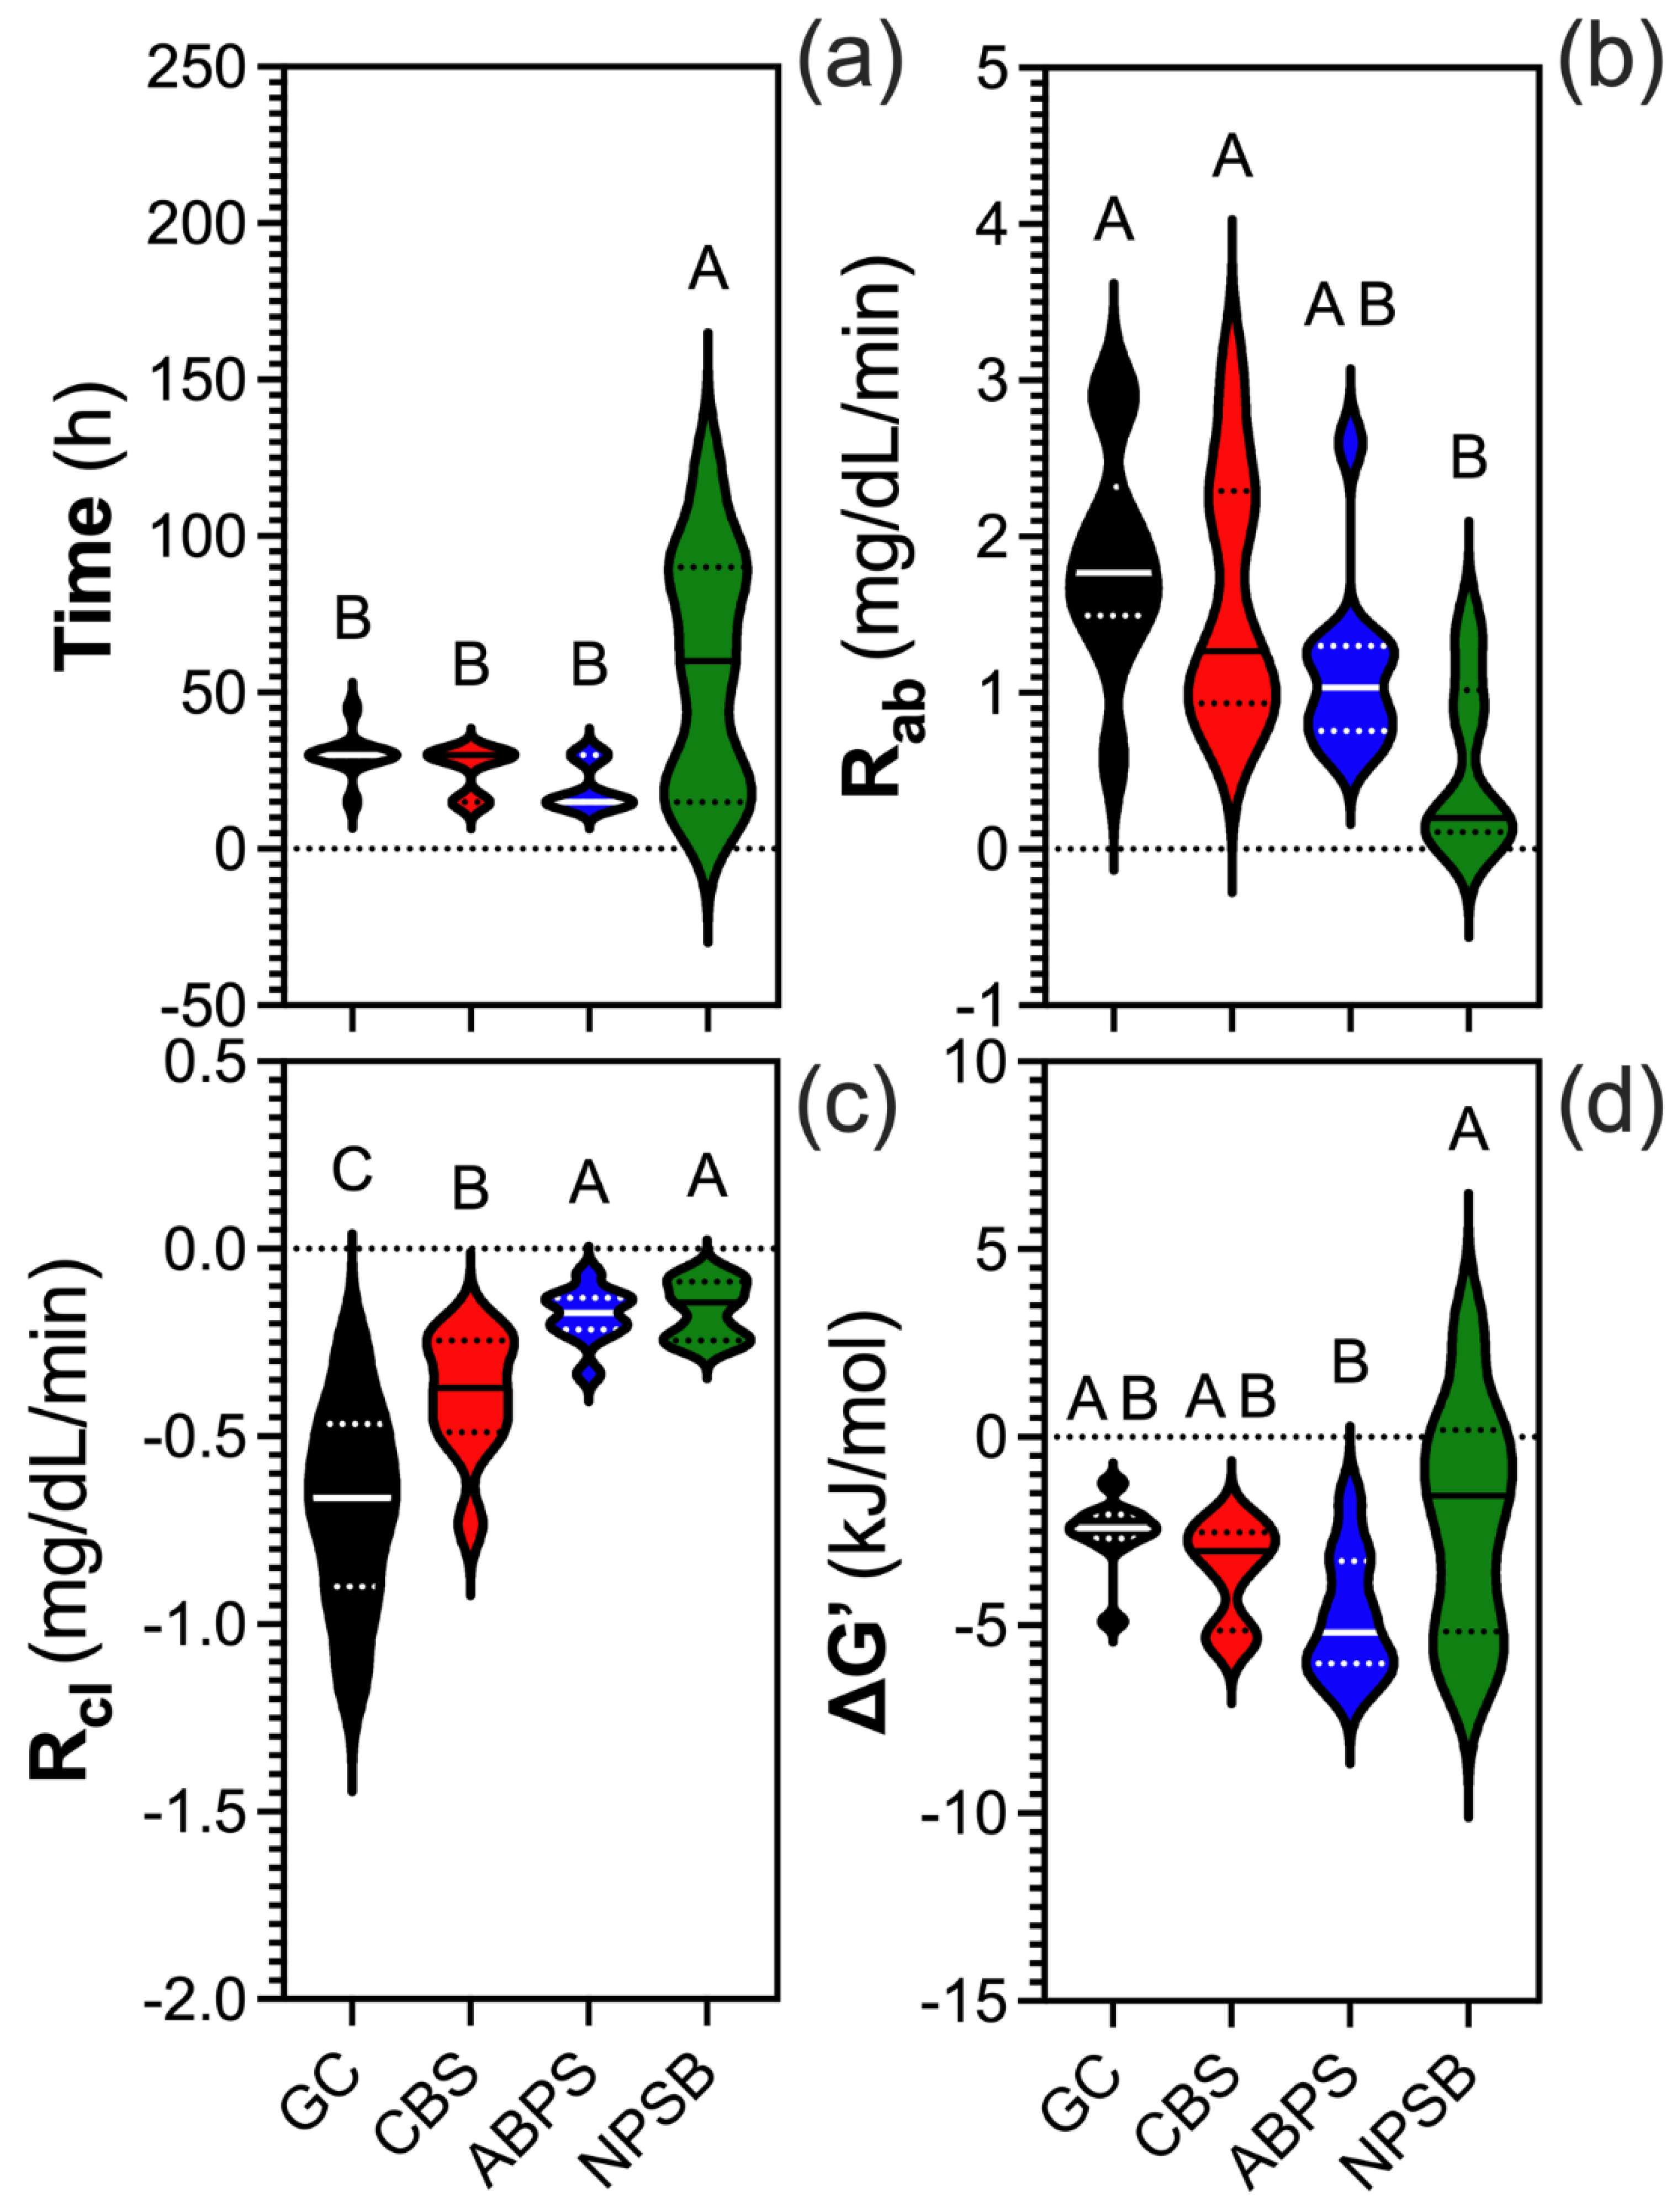
3.5. Metabolic Parameters
The time to reach peak glucose levels varied significantly among the samples. NPSB required the longest time to reach peak glucose levels, in contrast with CBS, ABPS, and the GC, which peaked around 30 min (
Figure 3A). NPSB exhibited the lowest glucose R
ab, similar to ABPS, whereas CBS and the GC showed the highest R
ab (
Figure 3B). By contrast, NPSB had the highest glucose R
cl, comparable to ABPS, whereas the lowest R
cl corresponded to the GC and CBS (
Figure 2C).
The changes in Gibbs free energy (ΔG’) further underscore the balance in metabolic dynamics. NPSB had a ΔG’ close to zero, indicating a near-equilibrium state where the absorption and clearance rates are closely aligned (
Figure 3D). On the other hand, ABPS exhibited a more negative ΔG’, reflecting a moderate imbalance where absorption slightly exceeded clearance. CBS and the GC had significantly negative ΔG’ values compared to NPSB, but less negative than ABPS.
4. Discussion
The NPSB bar exhibited the most favorable glycemic profile among the three bars tested. Although no significant differences were observed in GI due to data variability, a subject-by-subject analysis revealed a clear trend. The CBS bar showed the highest GI, aligning with its higher content of available carbohydrates compared with the other bars. The GI, which measures the rate at which a food raises blood glucose levels, is an inherent characteristic of carbohydrate-rich foods. However, the GI does not account for the glycemic impact of portion size, which is why GL is more informative. Among the bars, NPSB had the lowest GL (4.4), followed by ABPS (7.0) and CBS (10.8), indicating that its consumption had a lower and more controlled glycemic impact.
Several factors influence the glycemic response, including the type and amount of carbohydrates, the presence of other nutrients such as proteins, fats, and fiber, and individual physiological differences (de Aquino Souza Miskinis et al., 2023; de Souza et al., 2022). The NPSB bar was formulated to minimize its glycemic impact, avoiding the sharp glucose spikes and subsequent crashes commonly associated with sweet snacks. To achieve this, isomaltulose, a slow-digesting disaccharide that promotes a gradual and sustained rise in blood glucose, was used as the primary carbohydrate in the NPSB bar formulation (Aguiar & Cazarin, 2021; Angarita Dávila et al., 2019; Miao et al., 2015).
Isomaltulose and sucrose provide approximately 4 kcal/g, yet their metabolism rates differ considerably (Sawale et al., 2017). Sucrose, which has an α-1,2 glycosidic bond, is rapidly hydrolyzed by intestinal invertase (sucrase) activity (Km ~10 mM; Vmax ~143 μmol/min/mg), releasing glucose and fructose for absorption (Her et al., 2018; Manoochehri et al., 2020). By contrast, isomaltulose, which has an α-1,6 glycosidic bond, undergoes a slower hydrolysis, resulting in a prolonged release of its monosaccharides and avoiding abrupt glucose spikes. This slower metabolism is attributed to isomaltulose’s higher Km and lower Vmax, supporting its classification as a slow-release carbohydrate (Sokołowska et al., 2022).
The results show that the ΔG’ of the NPSB is close to zero, which is favorable because it indicates the reaction is near equilibrium. This result reflects a balance between the absorption and clearance rates, promoting metabolic harmony. By contrast, although CBS and the GC have less negative ΔG’ values, closer to that of the NPSB, their absorption and clearance rates exhibit significant differences. This finding suggests that ΔG’ alone is insufficient to fully assess the metabolic response and must be interpreted alongside the magnitudes of Rab and Rcl. On the other hand, ABPS shows a more negative ΔG’, indicating an imbalance in metabolic rates, with absorption outweighing clearance, which may not align with an optimized metabolic objective. This analysis underscores the importance of integrating multiple variables for a comprehensive understanding of the results. These findings are supported by the data previously reported for isomaltulose vs. sucrose, suggesting a more stable and efficient metabolic profile for the former, improving postprandial glycemia and overall energy balance in the case of the NPSB, which uses isomaltulose in its formulation.
The nutritional composition further contributed to the glycemic impact of the different bars. CBS primarily contained wheat flour and sucrose, whereas ABPS incorporated date paste. The GI of these ingredients varied significantly, with isomaltulose being the lowest (32), followed by date paste (60) and sucrose (65). Additionally, the NPSB contained more protein than CBS (but was comparable to ABPS) and had the highest fiber content among the bars. Proteins and fiber slow gastric emptying and glucose absorption, reducing the glycemic response (Pasmans et al., 2022).
The variability observed in the data emphasized the consistency of NPSB’s glycemic effect, with its glycemic curve remaining nearly flat compared to the curves of the other bars. This behavior was noteworthy because a flatter curve minimizes glucose peaks and troughs, promoting metabolic stability (McHill & Butler, 2024).
Finally, the analysis of metabolic parameters highlighted the superior efficiency of NPSB, which exhibited the lowest Rab and the highest Rcl. These findings and its ΔG’ closer to the equilibrium underscored NPSB’s optimal postprandial glucose regulation. This is relevant because repeated glucose and insulin spikes are strongly associated with the development of metabolic disorders such as type 2 diabetes and obesity. Incorporating insights from nutritional chemistry, the balanced amino acid profile and digestibility of NPSB’s plant-based proteins, alongside its controlled glycemic impact, exemplify how innovative formulations can address metabolic health and protein quality demands in functional food products. In a global context where such conditions affect a substantial portion of the population, products like NPSB are a tangible example of how scientific innovation can drive the creation of functional foods that improve metabolic and energy health.
5. Conclusions
This study highlights the potential of NPSB to address the paradox of traditional snack and protein bars, which are often marketed as energy-boosting yet may lead to sugar spikes, subsequent energy crashes, and increased cravings. By incorporating isomaltulose as its primary carbohydrate, NPSB minimizes blood sugar fluctuations, delivering sustained energy without the abrupt peaks and troughs associated with high-sugar snacks. This glycemic stability aligns with consumer expectations of satiety, balanced energy levels, and improved overall health.
The findings demonstrate that NPSB provides a low glycemic load and supports metabolic efficiency, as evidenced by its reduced blood glucose absorption rate, faster glucose clearance, and ΔG’ values closer to equilibrium. Such characteristics are fundamental in the context of global public health challenges, where the prevalence of conditions like type-2 diabetes and obesity continues to rise. By rethinking snack formulations to balance functionality, health, and indulgence, NPSB demonstrates the potential of science-driven innovation to create products that meet consumer needs while promoting healthier lifestyles.
Author Contributions
Conceptualization, A.B.G. and R.A.C.; methodology, A.B.G. and R.A.C.; validation, A.B.G., D.V., and R.A.C.; formal analysis, A.B.G. and R.A.C.; investigation, A.B.G. and R.A.C.; resources, R.A.C.; data curation, A.B.G. and R.A.C.; writing—original draft preparation, A.B.G. and R.A.C.; writing—review and editing, A.B.G., D.V., and R.A.C.; visualization, A.B.G. and R.A.C.; supervision, R.A.C.; project administration, R.A.C.; funding acquisition, R.A.C. All authors have read and agreed to the published version of the manuscript.
Funding
This research received no external funding.
Institutional Review Board Statement
The study was conducted in accordance with the Declaration of Helsinki and approved by Ethical Committee of Research in Human Subjects (CEISH, by its Spanish acronym) of the School of Medicine, University of Chile.
Informed Consent Statement
Informed consent was obtained from all subjects involved in the study.
Data Availability Statement
The data supporting the findings of this study are available from the corresponding authors upon reasonable request. Due to ethical restrictions and participant confidentiality, raw data, including participant glucose measurements and demographic details, are not publicly accessible. Processed data used for statistical analyses, as well as graphical representations, can be provided in anonymized form upon request.
Acknowledgments
The authors thank Nathalie Llanos and Verónica Sambra from the Faculty of Medicine at the University of Chile for their valuable collaboration in conducting glycemia analyses on the study participants. These analyses were performed as part of a contracted service, ensuring technical rigor and objectivity. Their expertise and support were fundamental to the development of this research. The authors would also like to thank Catriel Giuliano (CRDO) for their invaluable support during this study. We further extend our gratitude to Louise Mackinlay McKerrow (CMO), Matías Muchnick (CEO), and Felipe Correa (Sr. Manager of Marketing for Chile and Argentina) at The Not Company for their encouragement and contributions to this project.
Conflicts of Interest
The authors declare no conflicts of interest.
References
- Aguiar, L.M.; Cazarin, C.B.B. In vitro and in vivo methods to predict carbohydrate bioaccessibility. Current Opinion in Food Science 2021, 42, 69–75. [Google Scholar] [CrossRef]
- Ahmed, B.; Konje, J.C. The epidemiology of obesity in reproduction. In Best Practice and Research: Clinical Obstetrics and Gynaecology; Bailliere Tindall Ltd., 2023; Vol. 89. [Google Scholar] [CrossRef]
- Angarita Dávila, L.; Bermúdez, V.; Aparicio, D.; Céspedes, V.; Escobar Ma, C.; Durán-Agüero, S.; Cisternas, S.; de Assis Costa, J.; Rojas-Gómez, D.; Reyna, N.; López-Miranda, J. Effect of Oral Nutritional Supplements with Sucromalt and Isomaltulose versus Standard Formula on Glycaemic Index, Entero-Insular Axis Peptides and Subjective Appetite in Patients with Type 2 Diabetes: A Randomised Cross-Over Study. Nutrients 2019, 11(7). [Google Scholar] [CrossRef] [PubMed]
- de Aquino Souza Miskinis, R.; do Nascimento L, Á.; Colussi, R. Bioactive compounds from acerola pomace: A review. Food Chemistry 2023, 404, 134613. [Google Scholar] [CrossRef] [PubMed]
- de Souza WF, C.; Almeida FL, C.; de Castro RJ, S.; Sato, H.H. Isomaltulose: From origin to application and its beneficial properties – A bibliometric approach. Food Research International 2022, 155, 111061. [Google Scholar] [CrossRef] [PubMed]
- Expert Market Research. Chile cereal bars market, 2024.
- Faculty of Medicine, U. of C.,; Faculty of Economics and Business, U. of C. National Food Consumption Survey 2010-2011, 2012.
- Her, C.; Singh, J.; Krishnan, V.V. Effect of sucralose on the enzyme kinetics of invertase using real-time NMR spectroscopy and progress curve analysis. Carbohydrate Research 2018, 455, 5–9. [Google Scholar] [CrossRef] [PubMed]
- Jensen, M.L.; Corvalán, C.; Reyes, M.; Popkin, B.M.; Taillie, L.S. Snacking patterns among Chilean children and adolescents: is there potential for improvement? Public Health Nutrition 2019, 22(15), 2803–2812. [Google Scholar] [CrossRef] [PubMed]
- Kokubo, E.; Morita, S.; Nagashima, H.; Oshio, K.; Iwamoto, H.; Miyaji, K. Blood Glucose Response of a Low-Carbohydrate Oral Nutritional Supplement with Isomaltulose and Soluble Dietary Fiber in Individuals with Prediabetes: A Randomized, Single-Blind Crossover Trial. Nutrients 2022, 14(12). [Google Scholar] [CrossRef] [PubMed]
- Official Methods of Analysis. In Official Methods of Analysis of AOAC INTERNATIONAL; Latimer, G. W., Ed.; Oxford University Press, 2023. [Google Scholar] [CrossRef]
- Manoochehri, H.; Hosseini, N.F.; Saidijam, M.; Taheri, M.; Rezaee, H.; Nouri, F. A review on invertase: Its potentials and applications. Biocatalysis and Agricultural Biotechnology 2020, 25, 101599. [Google Scholar] [CrossRef]
- Mantantzis, K.; Schlaghecken, F.; Sünram-Lea, S.I.; Maylor, E.A. Sugar rush or sugar crash? A meta-analysis of carbohydrate effects on mood. Neuroscience & Biobehavioral Reviews 2019, 101, 45–67. [Google Scholar] [CrossRef]
- Maresch, C.C.; Petry, S.F.; Theis, S.; Bosy-Westphal, A.; Linn, T. Low Glycemic Index Prototype Isomaltulose—Update of Clinical Trials. Nutrients 2017, 9(4). [Google Scholar] [CrossRef] [PubMed]
- McHill, A.W.; Butler, M.P. Eating Around the Clock: Circadian Rhythms of Eating and Metabolism. Annual Review of Nutrition 2024, 44, 25–50. [Google Scholar] [CrossRef] [PubMed]
- Miao, M.; Jiang, B.; Cui, S.W.; Zhang, T.; Jin, Z. Slowly Digestible Starch—A Review. Critical Reviews in Food Science and Nutrition 2015, 55(12), 1642–1657. [Google Scholar] [CrossRef] [PubMed]
- Ministry of Health. National Health Survey 2016–2017, 2017.
- Monteiro, C.A.; Moubarac, J.-C.; Cannon, G.; Ng, S.W.; Popkin, B. Ultra-processed products are becoming dominant in the global food system. Obesity Reviews 2013, 14(S2), 21–28. [Google Scholar] [CrossRef] [PubMed]
- Pasmans, K.; Meex RC, R.; van Loon LJ, C.; Blaak, E.E. Nutritional strategies to attenuate postprandial glycemic response. Obesity Reviews 2022, 23(9), e13486. [Google Scholar] [CrossRef] [PubMed]
- Salmerón, J.; Manson, J.E.; Stampfer, M.J.; Colditz, G.A.; Wing, A.L.; Willett, W.C. Dietary Fiber, Glycemic Load, and Risk of Non—insulin-dependent Diabetes Mellitus in Women. JAMA 1997, 277(6), 472–477. [Google Scholar] [CrossRef] [PubMed]
- Sawale, P.D.; Shendurse, A.M.; Mohan, M.S.; Patil, G.R. Isomaltulose (Palatinose) – An emerging carbohydrate. Food Bioscience 2017, 18, 46–52. [Google Scholar] [CrossRef]
- Soares, B.; Gouveia, C.; Albuquerque, D.; Pinho, P. Impact and Classification of Body Stature and Physiological Variability in the Acquisition of Vital Signs Using Continuous Wave Radar. Applied Sciences 2024, 14(2). [Google Scholar] [CrossRef]
- Sokołowska, E.; Sadowska, A.; Sawicka, D.; Kotulska-Bąblińska, I.; Car, H. A head-to-head comparison review of biological and toxicological studies of isomaltulose, d-tagatose, and trehalose on glycemic control. Critical Reviews in Food Science and Nutrition 2022, 62(21), 5679–5704. [Google Scholar] [CrossRef] [PubMed]
- Sturt, J. Higher consumption of sugar-sweetened beverages is associated with increased risk of developing type 2 diabetes or metabolic syndrome. Evidence Based Nursing 2011, 14(2), 35. [Google Scholar] [CrossRef] [PubMed]
- Thakur, M.; Sharma, C.; Mehta, A.; Torrico, D.D. Health claim effects on consumer acceptability, emotional responses, and purchase intent of protein bars. Journal of Agriculture and Food Research 2022, 8, 100291. [Google Scholar] [CrossRef]
- Tyler, C. Booming sports nutrition market fueled by fitness awareness. Available online: https://Www.Linkedin.Com/Pulse/Booming-Sports-Nutrition-Market-Fueled-Fitness-Awareness-Tyler-Msljc/.
|
Disclaimer/Publisher’s Note: The statements, opinions and data contained in all publications are solely those of the individual author(s) and contributor(s) and not of MDPI and/or the editor(s). MDPI and/or the editor(s) disclaim responsibility for any injury to people or property resulting from any ideas, methods, instructions or products referred to in the content. |
© 2024 by the authors. Licensee MDPI, Basel, Switzerland. This article is an open access article distributed under the terms and conditions of the Creative Commons Attribution (CC BY) license (http://creativecommons.org/licenses/by/4.0/).