
Submitted:
05 December 2024
Posted:
06 December 2024
You are already at the latest version
Abstract
One of the most important advantages of drip irrigation is the possibility of achieving high uniformity of water distribution. However, this uniformity can be prejudiced when using water with high iron content, which can cause emitters to clog. This study aimed to verify the efficiency of the chlorination, aeration, decantation and filtration processes carried out to remove the iron from irrigation water, and to investigate the effect of iron on the water distribution uniformity. Four similar irrigation systems with five models of emitters were installed. The results showed that (i) there was a significant difference in the emitters’ behavior in relation to susceptibility to clogging, when using water with high iron content; (ii) the use of disk filters alone was not able to promote significant reductions in the iron quantity, as a way to prevent the clogging of emitters; and (iii) the use of aerators followed by sedimentation tanks made it possible to achieve a considerable improvement in the water application uniformity for emitters that were more sensitive to clogging caused by the use of water with high iron content.
Keywords:
clogging
; iron
; uniformity
; chlorination
Introduction
Emitter clogging is one of the biggest problems in drip irrigation systems, as even a small percentage of clogged emitters can create a major reduction in the uniformity of water application (Solé-Torres et al., 2021; Ramachandrula & Kasa, 2022), with impacts on crop yield and production cost (Wei et al., 2008; Shi et al., 2022). According to Shen et al. (2022) and Zhang et al. (2022), biological clogging is the most likely cause of low uniformity of water application in irrigation equipment.
The problem of sensitivity to clogging varies with the characteristics of the emitter (Pereira et al., 2020) and the water used for irrigation, and emitters may become obstructed by physical, chemical and biological agents (Singh et al., 2021; Shi et al., 2022; Duran-Ros et al., 2009; Liu & Huang, 2009). The identification of this issue can be a complex task, since the various agents present in the water can interact with each other to aggravate the problem (Shen et al., 2022).
In several regions of Brazil, water with high levels of iron is frequently found, and this element can cause serious clogging problems. Mendes et al. (2008) found total Fe values of above 3 mg L-1 in well water in the municipality of Congo-PB. Nakayama et al. (2007) established that water that will be used without restriction in irrigation must have an iron concentration of lower than 0.1 mg L-1. The use of water with an iron content higher than 1.5 mg L-1 in drip irrigation systems presents a high risk of dripper clogging.
According to Nakayama et al. (2007), iron in surface waters is generally found in the form of precipitate, while in the deeper layers of reservoirs with a lack of oxygen it can be found in the ferrous state (FeO). However, reduced iron (Fe2+), which is soluble, can oxidize when passing through a filtration system, becoming insoluble (Fe3+), and can end up precipitating and causing obstruction of the emitters (Vieira et al., 2004).
Costa (2000) worked with drippers from five different manufacturers, which supplied water containing an iron content of 3.0 mg L-1, and observed a reduction in flow rate of between 34% and 87% after 200 h of operation.
To avoid the precipitation of iron in the form of scale in the emitters, it can be precipitated and filtered before it enters the irrigation system by oxidizing it to an insoluble form through chlorination. However, care must be taken when applying chlorine to drip irrigation systems: Coelho et al. (2008) and Hou et al. (2023) pointed out that extreme doses of chlorine can damage an emitter’s compensation membrane, affecting its regulation.
The introduction of aeration to the sedimentation tank is a simple and economical solution for eliminating suspended solids and some chemical precipitates such as iron, which form when water is aerated (Rebosura et al., 2021; Yazid et al., 2021; Nakayama et al., 2007). The size of the tank depends on the volume of water to be treated, the size of the sediments present in the water and the desired quality at the outlet. The tanks are designed to ensure a certain amount of time for the water to remain in the tank, with periods of 15 to 60 minutes commonly adopted for laminar and turbulent flow decanters, respectively (Azevedo Neto et al., 1987).
The aims of this study were to evaluate the uniformity of water application in drip irrigation systems and the efficiency of treatment processes involving chlorination, aeration, sedimentation and filtration in regard to removing excess iron from irrigation water, as well as their effects on changing the flow rates of five dripper models due to clogging.
Materials and Methods
The experiment was carried out near the Federal University of Viçosa, Brazil, where a surface water source was found with a total iron content greater than 1.5 mg L-1, a suitable area was available for setting up the experiment, and an artesian well with water with a low iron content was also present.
To carry out the experiment, four drip irrigation systems (each one applying one treatment) were installed, each occupying an area of 7.6 by 25 m. The systems were assembled using five dripper models (G1, G2, G3, G4 and G5) from five drip irrigation equipment manufacturers; the characteristics of these drippers, as provided by the manufacturers, are presented in Table 1.
In order to facilitate the water distribution uniformity tests, the lines were extended transversely over eight smooth wire strands, spaced 3.00 m apart, and were stretched and leveled at approximately 1.5 m above the floor. In the manifold line of each irrigation system, which was 7.6 m long, 25 mm diameter PVC pipes were suspended over the first wire at a height of 1.5 m, and 40 connectors were inserted in each line. For each dripper model, eight lateral lines of length 25 m were installed, with a spacing of 0.15 m between the lines for the same model and a distance of 0.40 m between the lines of one model and another, with a total of 40 lines.
The eight lines of the same model were inserted in sequence, with only their positioning being randomly selected (Figure 1); the exception was the “tape” type model, which was installed at the beginning or end of the line, since the recommended service pressure for this is 68.67 kPa, meaning that a pressure control valve and pressure measurement point are required beforehand to maintain the recommended service pressure.
Since periodic opening of the end of the lateral lines of emitters can cause a reduction in clogging caused by the presence of iron in the irrigation water, automatic cleaning valves were installed in half of the lines (of each emitter model).
As the implementation involved four systems with 40 lines each, the total assembly consisted of 160 lines. All systems received filtration with 120 mesh disk filters with a capacity of 7.0 m3 h-1. In System 3 (S3), filtration was associated with the aeration and decantation process, and in S4, filtration was associated with aeration, decantation and chlorination. Figure 1 shows the assembly of the irrigation systems.
S1 was supplied with water from a well, with a total iron content of less than 0.1 mg L-1. The other three systems (S2, S3 and S4) were supplied with water from a reservoir, with an iron content of between 2.6 and 4.0 mg L-1, located 30 m away from the first yard.
The daily water application routine consisted of two intermittent periods of 4 h with a 2-h interval between applications. The total application time for the treatments was 300 h.
The system operated with a service pressure at the end of the lateral lines of between 98.1 and 117.72 kPa, except for the “tape” type model, which operated with a service pressure of 68.67 kPa. The filters were cleaned whenever there was a 20% drop in service pressure, measured at a valve installed after the filters.
In S3 and S4, which required aeration, two aerators were installed with four square trays (referred to here as “trays”) measuring 0.50 m on each side, overlapped and spaced 0.30 m apart. These aerators were sized according to the recommendations of Azevedo Neto et al. (1987) and installed inside 500 L boxes, which served as collection tanks. The water was pumped over the highest tray, fell into the collection tank and was then passed to a sedimentation tank.
The tanks were designed for clarification of colloidal waters, following the recommendations of Azevedo Neto et al. (1987), with an area of 3.0 m2 for a flow rate of 3.20 m3 h-1, a length:width ratio of 3:1, and a height of 1.0 m. The water retention time in the tank was approximately 1 h.
Chlorine application was continuous throughout the entire period of operation of S4. Sodium hypochlorite was used at a concentration of 12% active chlorine. The product was diluted in water in a 50 L plastic box and injected into the piping after the pump and before the aerator, using a Venturi injector. The amount applied was monitored using a free chlorine analysis kit to maintain a free chlorine content of between 0.5 and 1.0 mg L-1 at the ends of the lines.
At the beginning of the study, water samples were collected from the tanks and the reservoir and sent to the Water Quality Laboratory of the Soil Department at Universidade Federal de Viçosa, Brazil, for analysis of calcium, magnesium, manganese and total solids. Water samples were collected from all systems, after every 50 h of operation, for analysis at four points: at the intake, in the sedimentation tank, after the filtration system, and in the drippers located at the ends of the lines. From these samples, values for the total iron content, pH and water temperature were obtained.
Water distribution uniformity assessments and dripper flow measurements were performed on the first day and after every 50 h of system operation, giving a total of six assessments (0 to 250 h). In each assessment, water volumes were collected using a 250 mL graduated cylinder, and the flow rates for the eight drippers in each lateral line were calculated, with 320 drippers per system, according to the methodology proposed by Merriam and Keller (1978) and modified by Denículi et al. (1980), over 3 min.
Based on the emitter flow rates, the distribution uniformity coefficient (CUD) was calculated following the methodology proposed by Keller and Karmeli (1975). According to Cararo et al. (2006), the average emitter flow rate can be considered a good parameter to evaluate changes in the proper functioning of the emitters.
The experiment was set up using a split-split plot scheme, with the systems (S1, S2, S3 and S4) allocated to the plots, the equipment models (G1, G2, G3, G4 and G5) to the sub-plots, and the different periods of flow and CUD evaluation to the sub-subplots, where the latter were analyzed using a univariate scheme of repeated measures over time. To do this, a completely randomized design was used, with four replications.
To compare the effect of the systems on the flow and CUD of each dripper model, an analysis of variance and a Tukey test were performed. Prior to the analysis of variance, the variables were subjected to verification of the assumptions of normality (Shapiro-Wilk) and homoscedasticity (Levene). To assess the different evaluation periods, a sphericity test (Mauchly’s W) and correction of the degrees of freedom (Greenhouse-Geisser and Huynh-Feldt methods) were performed. For all procedures, a level of 5% for the type I error was considered.
Results and Discussion
Water Analysis Results
The results of the water analysis showed average concentrations of 0.53 and 0.75 mmolc L-1 for calcium and magnesium, respectively, not implying a risk of clogging of the emitters (Nakayama et al., 2007). The same occurred for the manganese and total solids content, which were 0.08 and 29 mg L-1, respectively.
Table 2 presents the results for the iron levels in water samples collected at the intake, in the sedimentation tanks, after the filters, and in the pre-selected drippers located at the ends of the lateral lines. It can be seen from this table that the total iron level in the water from the reservoir varied over time at all collection points. A variation of 2.6 to 4.0 mg L-1 in the total iron concentration at the intake was observed during the experiment. This variation is due to the process of iron solubilization in the soil, due to anaerobic conditions during rainy periods, which causes leaching and transport to the water table, and subsequently to rivers and lakes (Ford, 1993).
A comparison of the results of the analyses of water collected after the filters in Table 2 with the results of the analyses of water collected at a previous point, either in the sedimentation tanks (Systems 3 and 4) or at the source (System 2) did not show significant reductions in the iron content, indicating that the filter did not remove this element. Similar results have previously been found in water samples collected in irrigation systems located in the northern region of the state of Espírito Santo, Brazil (Cordeiro, 2002) and in the state of São Paulo (Hernandez & Petinari, 1998), proving that sand, screen and disk filters were not efficient in removing this element.
A reduction in the total iron content was observed in water samples collected in the sedimentation tank (System 3, Table 2), in relation to those collected at the source, although this effect was not seen for System 4, where the water was treated with sodium hypochlorite. It should be noted that the water was held in the tank for one hour.
The water samples collected from the drippers located at the ends of the lateral lines for Systems 3 and 4 did not show reductions in the total iron content compared with those obtained at the previous collection point (after the filters). However, the opposite was found for System 2; this is probably due to the action of the decanters (Systems 3 and 4), which promoted the sedimentation of the particles inside the reservoir, while in System 2, sedimentation occurred inside the pipes and also due to the action of iron bacteria, which produce mucilage to which the suspended particles bind, thus increasing clogging.
Flow Rate Variation of the Dripper Models Throughout the Evaluations
The flow rates of the emitters were determined for four dripper lines and eight sampling points per line, during the seven assessments. The Tukey test between the average flow rates of the drippers evaluated in the lines installed with and without an end-of-line cleaning valve showed a significant difference for 13 comparisons among the 140 analyzed. Of these 13, nine showed positive effects for the use of valves, and four showed negative effects. The low number of occurrences (13) and their variability (nine with an increase and four with a decrease in flow) indicated that these differences should not be attributed to the use of valves. It is worth noting that periodic opening of the end of the lateral line is effectively a preventive measure for the removal of sedimented particles inside the hoses; however, in the present study, the use of valves was not efficient in avoiding obstruction of the drippers.
Table 3 presents the results of the analysis of variance for the flow values. The values analyzed here were significant for all variables separately, at the 1% probability level. However, there were no significant differences for the interactions between the system × valve, model × system × valve and evaluation × valve × system × model.
Table 4 presents the average flow rates measured in the lines installed with valves, for all dripper models used, and the respective average results between the systems. The average flow rates of the lateral lines that were not equipped with cleaning valves are not shown, since no statistical difference was found from an analysis of variance with 5% probability when they were compared with the use of valves. Since the dripper models had different flow rates, it was not possible to compare them with each other.
A comparison between the results for the systems in Table 4 indicates that model G1 had the lowest flow rates in system S2, for all evaluations performed after 100 h of operation, showing the difference from the other systems, except for S3, with 300 h of operation. In these two systems, partial and total clogging of the drippers was observed. The use of aerators and sedimentation tanks in S4, associated with the chlorination process, contributed to reducing the clogging problems in the drippers. All systems showed a tendency towards reduced flow rates over time, with the greatest variations occurring in systems S2 and S3, a finding that is in agreement with the results reported by Souza et al. (2006). In S1, the reduction observed in the last evaluation was caused by the development of algae at the water outlets of the drippers.
A significant difference was found for model G2 when comparing the average flow rates between the systems after 200 h of operation, with the lowest flow rate in system S4. This reduction may have been caused by the continuous use of chlorine causing damage to the dripper’s silicone diaphragm. Teixeira et al. (2008) concluded that the effect of chemical damage to the emitters’ self-compensating membranes is manifested in the form of an expansion in their volume, which causes the membrane to press on the outlet orifice, reducing the emitter’s flow rate. Other studies (Lequette et al., 2021; Hou et al., 2023; Wang et al., 2023) have also found a loss of pressure compensation capacity in drippers that were subjected to the action of chlorine.
In S2, an increase in the average flow rate was observed after 300 h compared to the initial flow rate, which was close to the nominal flow rate for this model. This increase in flow rate may have occurred due to the model’s self-cleaning mechanism. According to the manufacturer, “water enters the dripper through a filter designed to prevent dirt particles from entering the water passages; any particles that could cause clogging will be expelled through the wide water passages or will increase the differential pressure, causing the diaphragm to momentarily increase the cross-sectional volume of the water outlet and expel the dirt from the system.”
Since the water supplying this system had a high total iron content, favoring the growth of iron bacteria, the mucilage formed by these microorganisms inside the drippers may have contributed to the continuous operation of this self-cleaning mechanism, since such mucilage adheres strongly to the internal walls of the drippers, although the same effect was not observed for the other treatments due to the aeration and decantation processes used in systems S3 and S4, and the water with low iron content that was supplied to S1. Resende et al. (2000) observed a reduction in flow rate for a similar model after 1,200 h of operation, where the water supplying the system had a concentration of 0.05 mg L-1 of Fe2+ and a low content of suspended solids. Martins et al. (2010) observed a reduction in the flow rate for a dripper of around 6.13% using ferruginous water.
For model G3, a significant reduction in the average flow rate corresponding to system S2 was observed after 100 h of operation (Table 4). In S3, a reduction in flow rate was observed after 200 h of operation, although this increased in the following evaluations. System S1 had average flows between those of S4 and S3 in the last evaluation. In this evaluation, S2 continued to present the lowest flows. Finally, these results show that the preventive measures used to reduce clogging in the drippers were not efficient for this model.
In the first evaluation, a significant difference for model G4 was found when the average flow rates were compared between the systems. It was observed that the average flow rates were higher than the nominal flow rate of the dripper, except for the value found for system S2. Similar results were found in the following evaluations, with a variation of 2.15 L h-1 in the fourth evaluation of system S1 to 2.92 L h-1 in the second evaluation of system S4. This variation is excessive for a self-compensating model with a nominal flow rate of 2.30 L h-1. According to the manufacturer, this variation occurred due to manufacturing problems with the batch used in this experiment, and had already been corrected. The lower values for systems S1 and S2 found in the last evaluation compared to systems S3 and S4 should not be attributed to clogging problems, considering the nominal flow rate of the dripper.
For system S2 of model G5, the average flow rate found in the first evaluation was lower in relation to the other systems, a trend that persisted over all the evaluations; this was due to the use of only a filter in this system, which was not efficient in avoiding obstructions arising from the precipitation of iron in the lines, combined with the presence of iron bacteria. In system S1, a reduction in flow rates was observed, which was due to partial clogging caused by algae.
It can be seen from the data in Table 4 that the development of algae in system S1 caused clogging in all dripper models, with more significant reductions in flow rate for models G1 and G5. The use of a disk filter alone in system S2 was not efficient in preventing clogging with reduced flow rate in dripper models G1, G3 and G5, even though the latter two had self-cleaning mechanisms.
For model G2, an unexpected increase in flow occurred, a finding that was previously observed by Ravina et al. (1992). Model G4 proved to be more resistant to clogging due to its construction characteristics, with a small reduction in the average flow. This difference in sensitivity to clogging for different emitter models was also proven by Ribeiro et al. (2010), who considered the internal architecture of the drippers to be the determining factor in the characterization of the clogging process.
Distribution Uniformity
Table 5 presents the results of an analysis of variance for the DU values. This analysis showed a significant difference at the 1% probability level for all sources of variation and their interactions. When performing the analysis, the DU calculated for the lines with and without valves were considered as repetitions, since they did not differ from each other.
The DU values in the first two assessments were higher than 90% for all models (Figure 2), which can be considered excellent according to the classification proposed by Merriam and Keller (1978).
For an operating time of 100 h (third assessment), a significant reduction was observed at a 5% probability level, using the Tukey test, in the uniformity in system S2 of models G1, G3 and G5, with values of 38.2%, 78.8% and 72.5%, respectively. In the other treatments, the DU remained above 90%, corresponding to the variations in flow rates in Table 4.
In the evaluation carried out after 150 h (fourth assessment), models G1, G3 and G5 presented even lower results for S2, with values of 5.4%, 64.3% and 56.1%, respectively, which can be considered poor to unacceptable for a drip irrigation system. System S3 also presented a significant difference to model G1, with a value of 67.7%.
At 200 and 250 h, the trend towards the reduction in DU found at 150 h of operation for models G1, G3 and G5 continued, the results of which show the effects of using water with high iron content and highlight the differences between the models used in terms of resistance to clogging. Model G5 showed uniformity at 250 h, classified as good in system S3, without, however, differing statistically, by the Tukey test at 5% probability, from S1 and S4.
In the last assessment (at 300 h), model G1 had the best DU values for systems S1 and S4 (Figure 2). In S1, a tendency towards a decrease in uniformity was observed, which can be explained by partial clogging caused by algae. The presence of these organisms in system S1 had already been observed at the beginning of the study. Model G2 (Figure 2) gave excellent DU values in all systems over 300 h of operation, despite the flow variations (Table 4). These variations were uniform in the drippers evaluated here, and did not affect the uniformity of water distribution.
Model G3 showed drippers with total clogging in S2, at 300 h, with DU values of 33.2%, caused by iron precipitation and the presence of iron bacteria. In S3, the use of a disk filter for aeration and decantation was not sufficient to avoid clogging in some drippers, which was caused by the high concentration of iron in the water. The best results for this model were observed in systems S1 and S4, with S1 indicating a tendency towards a reduction in flow, with a CUD value of 82.8%, due to the development of algae.
The 90.4% DU obtained for S4 highlights the effect of chlorine treatment in association with filtration, aeration and sedimentation tanks. Model G4 (Figure 2) gave results that were similar to those of G2 for the 300 h operating time, with no significant difference in the DU values. For systems S1, S3 and S4, these values were classified as excellent, while for S2, the results were good; this model showed good uniformity in all systems, in all assessments.
Model G5 (Figure 2) gave the best results in the last assessments (300 h) for systems S1, S3 and S4. It could also be observed that model G5 gave a higher value in the last assessments (300 h) in relation to the evaluation carried out at 250 h, which was due to an increase in the flow of some drippers; this was probably due to an increase in pressure during the operation of the system or a movement in the lines, causing the removal of the particles that were obstructing the drippers.
Conclusion
Significant differences in the behavior of the studied emitters were found in relation to the uniformity of water application and susceptibility to clogging, in water conditions with high iron content. The use of automatic cleaning valves had no effect on the flow reduction for the drippers studied. The use of disk filters alone was not able to achieve reductions in iron content to prevent clogging. The use of aerators followed by sedimentation tanks gave a significant improvement in the uniformity of water application for “tape” type emitters, which are more sensitive to clogging caused by the use of water with high iron content. The use of aerators and sedimentation tanks in association with a chlorination process contributed to reducing the problems of dripper clogging, and proved to be the best treatment among those studied here.
References
- Azevedo Neto, J.M. Técnica de Abastecimento e Tratamento de Água, 3rd ed. CETESB/ASCETESB: São Paulo, Vol. 2, 1987; 320 p.
- Cararo, D.C. et al. Analysis of clogging in drip emitters during wastewater irrigation. Applied Engineering in Agriculture 2006, 22(2), 251–257. [CrossRef]
- Coelho, R.D. et al. Caracterização hidráulica de gotejadores autocompensantes expostos à aplicação dinâmica de cloro livre (Parte II). Irriga 2008, 13(3), 411–425.
- Cordeiro, E. de A. Influência do tratamento de água ferruginosa no desempenho de sistema de irrigação por gotejamento. Viçosa. 2002. 92 f. Dissertation (Mestrado em Engenharia Agrícola), Universidade Federal de Viçosa.
- Costa, C.C. Estudo da susceptibilidade de tubos gotejadores ao entupimento por precipitados químicos de ferro. Lavras. 2000. 85 f. Dissertation (Mestrado em Engenharia Agrícola) Universidade Federal de Lavras.
- Denículi, W. et al. Uniformidade de distribuição de água, em condições de campo num sistema de irrigação por gotejamento. Revista Ceres 1980, 27(50), 155–162.
- Duran-Ros, M.; Puig-Bargués. J.; Arbat, G.; Barraga, J.; Cartagena, F.R. de. Effect of filter, emitter and location on clogging when using effluents. Agricultural Water Management 2009, 96, 67–79. [CrossRef]
- Ford, H.W. Iron ochre and related sludge deposits in subsurface drain lines. Cooperative Extension Service University of Florida, Gainesville, FL. Circular 671. 8 p. 1993.
- Hernandez, F.B.T.; Petinari, R.A. Qualidade de água para irrigação localizada. XXVII Congresso Brasileiro de Engenharia Agrícola, Lavras. Anais. p. 58–60, 1998.
- Hou, P.; Xiao, Y.; Muhammad, T.; Zhou, B.; Song, P.; Zhou, Y.; ... & Li, Y. Multi-factorial failure of pressure-compensating emitters in drip fertigation systems: An in-situ sampling investigation. Agricultural Water Management 2023, 275, 108036. [CrossRef]
- Keller, J.; Karmeli, D. Trickle irrigation design. Glendora: Rain Bird Sprinkler Manufacturing, 1975. 133p.
- Lequette, K.; Ait-Mouheb, N.; Adam, N.; Muffat-Jeandet, M.; Bru-Adan, V.; Wery, N. Effects of the chlorination and pressure flushing of drippers fed by reclaimed wastewater on biofouling. Science of the Total Environment 2021, 758, 143598. [CrossRef]
- Liu, H.; Huang, G. Laboratory experiment on drip emitter clogging with fresh water and treated sewage effluent. Agricultural Water Management 2009, 96, 745–756. [CrossRef]
- Martins, C.C. et al. Aplicação de cloro orgânico no tratamento de tubogotejador utilizado na irrigação com água ferruginosa. Acta Scientiarum Agronomy 2010, 32(1), 1–5.
- Mendes, J. da S.; Chaves, L.H.G.; Chaves, I. de B. Qualidade da água para consumo humano em comunidades rurais do município de Congo, PB. Revista Ciência Agronômica 2008, 39(02), 333–342.
- Merriam, J.L.; Keller, J. Farm Irrigation System Evaluation: A Guide For Management. Logan: Utah State University, 1978. 271p.
- Nakayama, F.S.; Boman, B.J.; Pitts, D.J. Maintenance. In: Lamm, F.R.; Ayars, J.E.; Nakayama, F.S. Microirrigation for Crop Production. Elsevier: Amsterdam, p. 289–430. 2007.
- Pereira, D.J.S.; Lavanholi, R.; de Araújo, A.C.; de Camargo, A. P.; Ait-Mouheb, N.; Frizzone, J.A.; Molle, B. Evaluating sensitivity to clogging by solid particles in irrigation emitters: Assessment of a laboratory protocol. Journal of Irrigation and Drainage Engineering 2020, 146(11), 04020033. [CrossRef]
- Ramachandrula, V.R.; Kasa, R.R. Prevention and treatment of drip emitter clogging: a review of various innovative methods. Water Practice & Technology 2022, 17(10), 2059–2070. [CrossRef]
- Ravina, I.; Paz, E.; Sofer, Z.; Marcu, A.; Shisha, A.; Sagi, G. Control of emitter clogging in drip irrigation with reclaimed wastewater. Irrigation Science 1992, 13, 129-139. [CrossRef]
- Rebosura Jr., M.; Salehin, S.; Pikaar, I.; Keller, J.; Sharma, K.; Yuan, Z. The impact of primary sedimentation on the use of iron-rich drinking water sludge on the urban wastewater system. Journal of Hazardous Materials 2021, 402, 124051.
- Resende, R.S.; Coelho, D.R.; Piedade, S.M.S. Suscetibilidade de gotejadores ao entupimento de causa biológica. Revista Brasileira de Engenharia Agrícola e Ambiental 2000, 4(3), 368–375. [CrossRef]
- Ribeiro, P.A.A. de A.; Coelho, R.D.; Teixeira, M.B. Entupimento de tubos gotejadores convencionais com aplicação de cloreto de potássio (branco e vermelho) via duas qualidades de água. Engenharia Agrícola 2010, 30, 279–287.
- Shen, Y.; Puig-Bargués, J.; Li, M.; Xiao, Y.; Li, Q.; Li, Y. Physical, chemical and biological emitter clogging behaviors in drip irrigation systems using high-sediment loaded water. Agricultural Water Management 2022, 270, 107738. [CrossRef]
- Shi, K.; Lu, T.; Zheng, W.; Zhang, X.; Zhangzhong, L. A review of the category, mechanism, and controlling methods of chemical clogging in drip irrigation system. Agriculture 2022, 12(2), 202. [CrossRef]
- Singh, D.; Patel, N.; Singh, N.; Rosin, K. G.; Yadav, D.; Singh, S.; Gupta, A.K.; Kumawat, A.; Sharma, V.K.; Kumar, M. Emitter Clogging and Hydraulic Performance of Drip System under Different Water Qualities and Placement Techniques. Food Science and Engineering 2021, 112-125. [CrossRef]
- Solé-Torres, C.; Lamm, F.R.; Duran-Ros, M.; Arbat, G.; de Cartagena, F.R.; Puig-Bargués, J. Assessment of microirrigation field distribution uniformity procedures for pressure-compensating emitters under potential clogging conditions. Transa+ctions of the ASABE 2021, 64(3), 1063–1071. [CrossRef]
- Souza, J.A.A. de; Cordeiro, E. de A.; Costa, E.L. da. Aplicação de hipoclorito de sódio para recuperação de gotejadores entupidos em irrigação com água ferruginosa. Revista Brasileira de Engenharia Agrícola e Ambiental 2006, 10(1), 5–9.
- Teixeira, M.B.; Coelho, R.D.; Mélo, R.F. de. Avaliação de danos químicos em membranas de compensação de gotejadores, causados pela aplicação dinâmica de dose extrema de cloro livre (Parte I). Irriga 2008, 13, 392–410.
- Vieira, G.H.S. et al. Recuperação de gotejadores obstruídos devido à utilização de águas ferruginosas. Revista Brasileira de Engenharia Agrícola e Ambiental 2004, 8(1), 1–6.
- Wang, H.; Zhong, H.; Ling, G.; Hu, X.; Wang, W. Response of emitter clogging characteristics to fertilizer type and concentration based on fertigation. Irrigation Science 2023, 41(6), 769–782. [CrossRef]
- Wei, Q. et al. Rapid evaluations of anticlogging performance of drip emitters by laboratorial short-cycle tests. Journal of Irrigation and Drainage Engineering 2008, 134(3), 298–304.
- Yazid, E.A.; Wafi, A.; Saraswati, A. Techniques for reducing iron (Fe) content in groundwater: An article review. Journal of Islamic Pharmacy 2021, 6(1), 40–45. [CrossRef]
- Zhang, J.; Xiao, Y.S.; Wu, Y.; Jia, F.; Li, S.; Zhou, B.; Li, Y. Effects of microorganisms on clogging process and clogging substances accumulation of drip irrigation emitters using the high-sediment water sources. Irrigation Science 2022, 40(6), 845–856. [CrossRef]
Figure 1.
Diagram of the water application system used in a study of the effect of using water with high iron content, with and without treatment, on the clogging of emitters and on the uniformity of water distribution in drip irrigation systems.
Figure 1.
Diagram of the water application system used in a study of the effect of using water with high iron content, with and without treatment, on the clogging of emitters and on the uniformity of water distribution in drip irrigation systems.
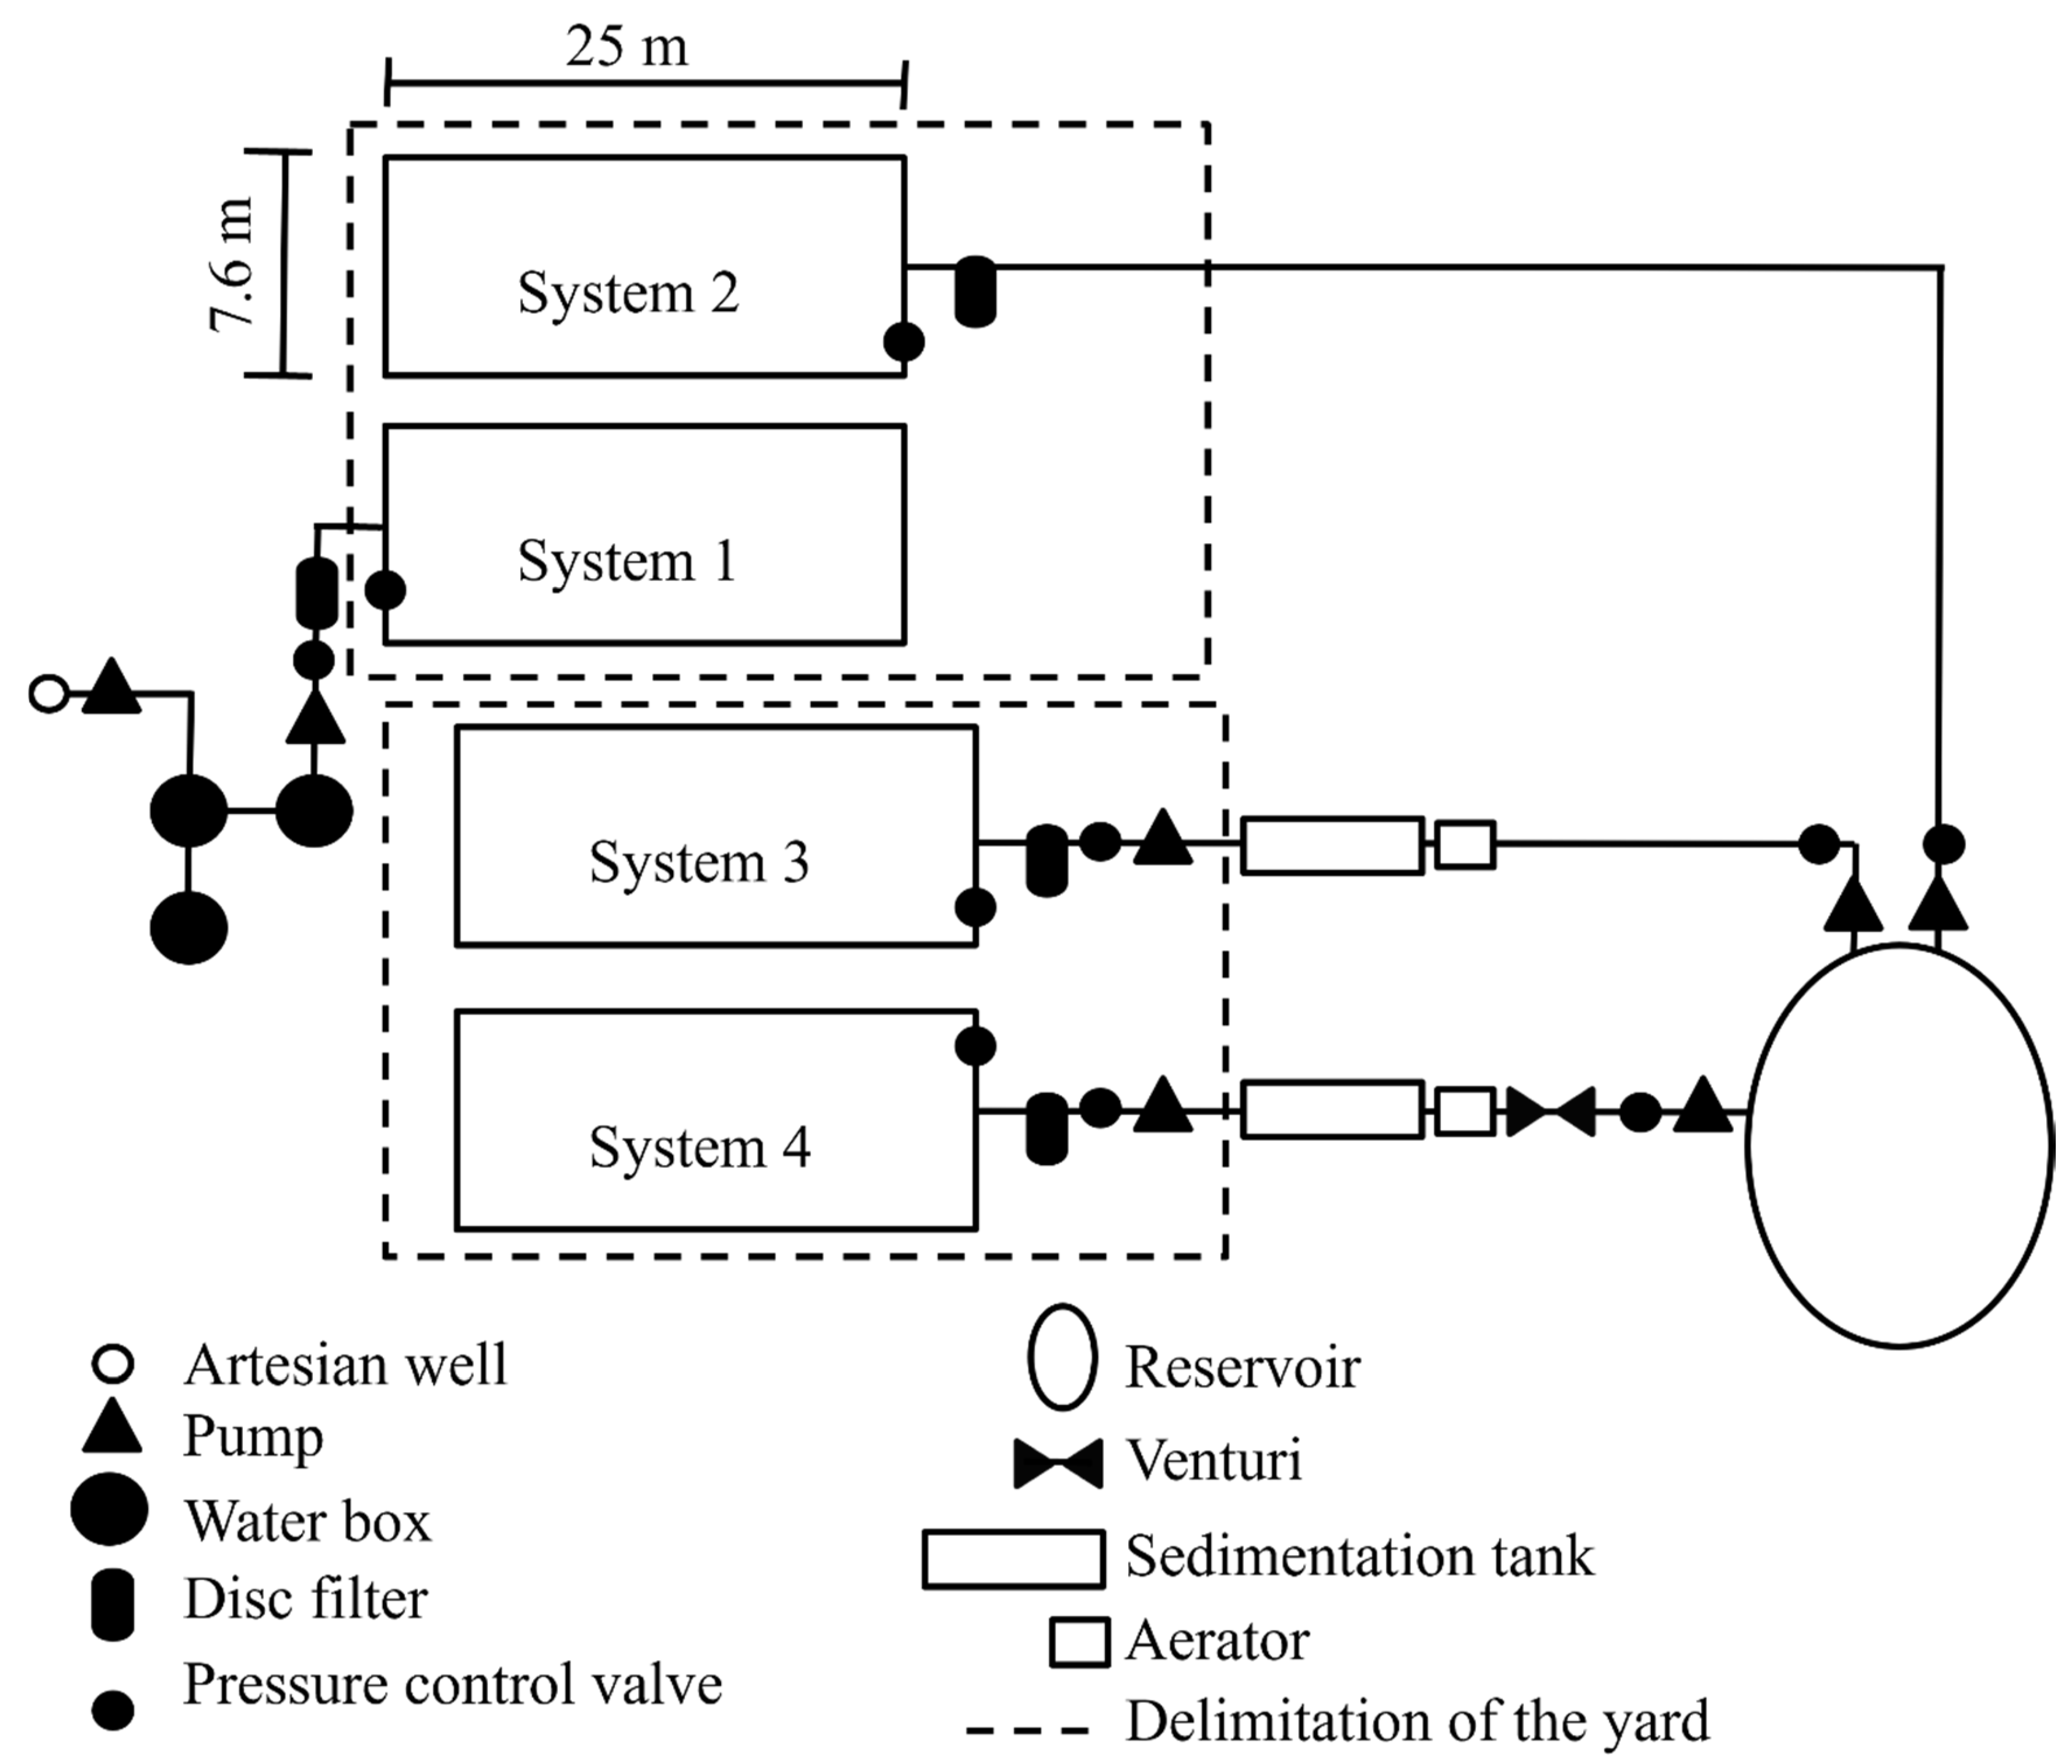
Figure 2.
DU values over several evaluations for models G1 to G5 with treatments T1, T2, T3 and T4, for systems S1, S2, S3 and S4.
Figure 2.
DU values over several evaluations for models G1 to G5 with treatments T1, T2, T3 and T4, for systems S1, S2, S3 and S4.
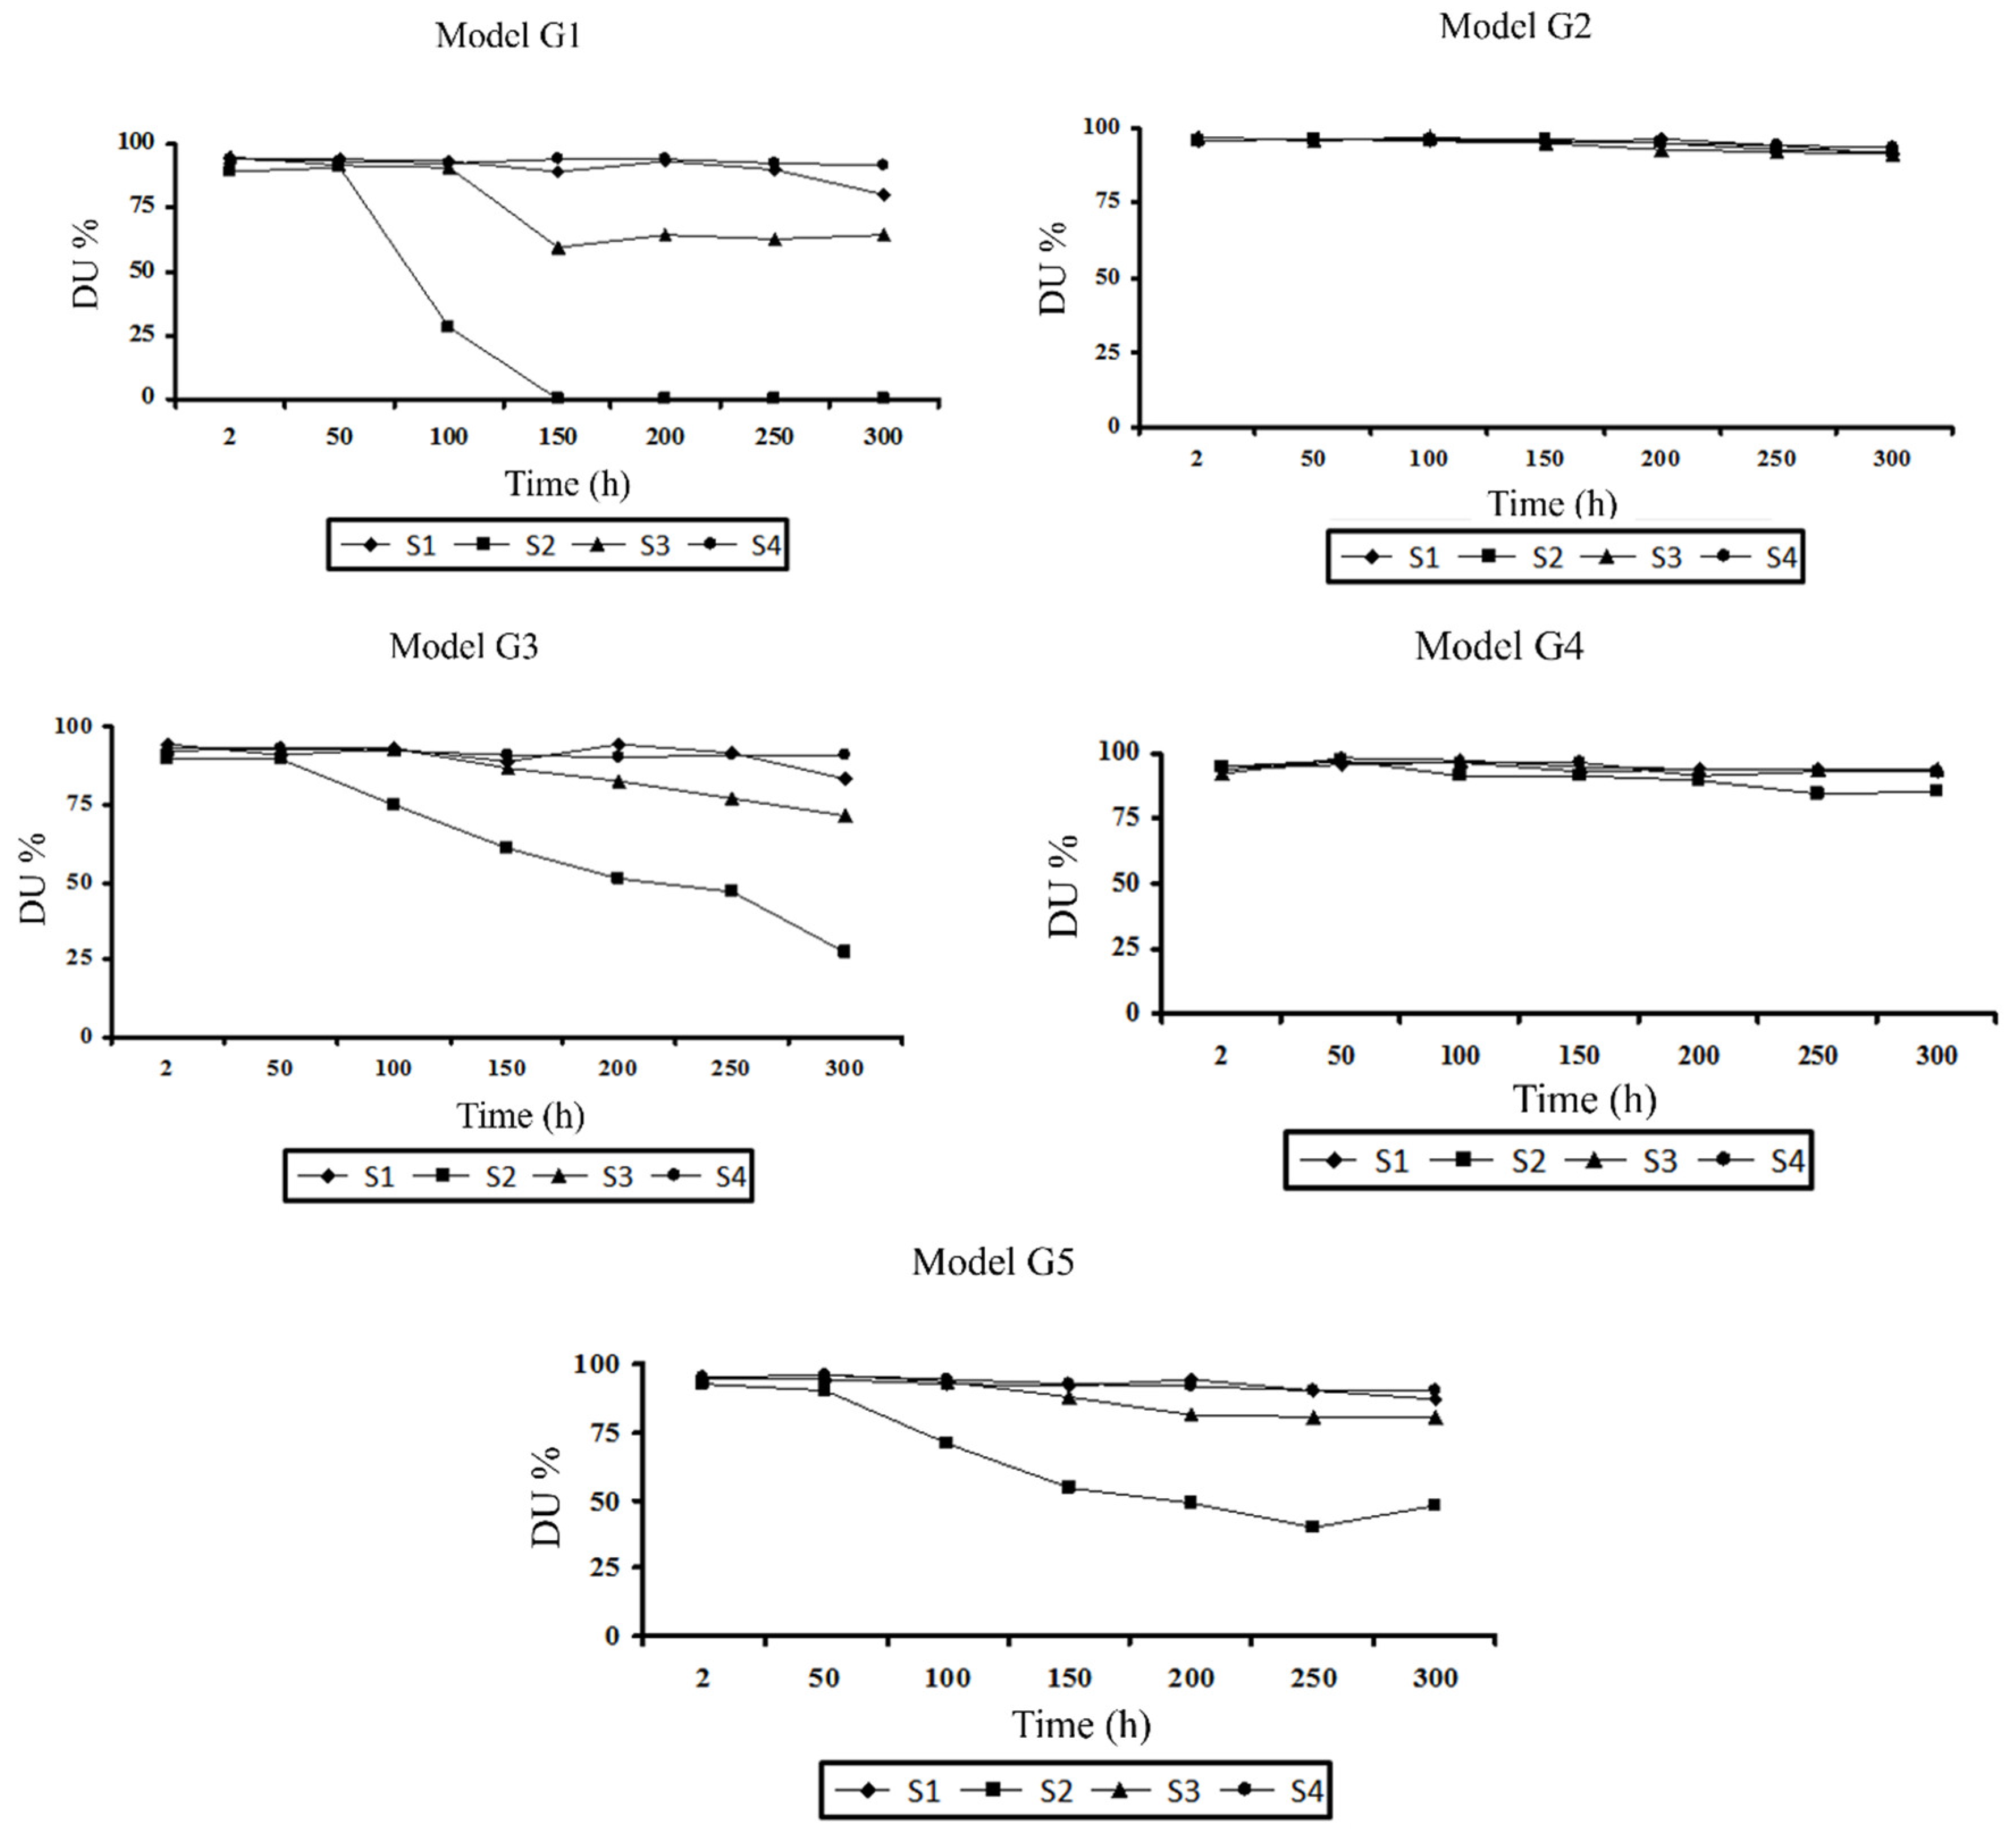

Table 1.
Technical summary of the drip tube models used by different manufacturers.
| Model | Type | Flow rate (L h-1) |
Internal diameter (mm) | Outer diameter (mm) | Pressure (kPa) |
Dripper spacing (m) |
| G1 | Tape | 0.74 | 15.8 | – | 68.67 – 98.1 | 0.20 |
| G2 | SC1 | 2.30 | 13.7 | 16.0 | 49.05 – 392.4 | 0.75 |
| G3 | SC | 3.40 | 13.7 | 16.0 | 58.86 – 392.4 | 1.00 |
| G4 | SC | 2.30 | 13.7 | 16.0 | 58.86 – 392.4 | 0.75 |
| G5 | SC | 2.10 | 14.8 | 16.0 | 49.05 – 343.3 | 0.75 |
1SC - Self-compensating.
Table 2.
Results of analyses of water collected over time, at intakes and at various points in systems 2, 3 and 4.
Table 2.
Results of analyses of water collected over time, at intakes and at various points in systems 2, 3 and 4.
| Iron content in irrigation water (mg L-1) | ||||||||||
| Time of operation (h) | Water source | System 2 | System 3 | System 4 | ||||||
| 1 | 2, 3 and 4 | F* | Dr | St | F | Dr | St | F | Dr | |
| 0 | < 0.10 | 2.80 | 2.60 | 2.20 | 2.20 | 2.20 | 2.20 | 2.30 | 2.20 | 1.90 |
| 50 | < 0.10 | 4.00 | 3.90 | 3.70 | 3.30 | 3.40 | 3.40 | 3.80 | 3.40 | 3.40 |
| 100 | < 0.10 | 2.60 | 2.50 | 2.50 | 2.30 | 2.10 | 2.10 | 1.80 | 1.80 | 1.70 |
| 150 | < 0.10 | 3.00 | 2.80 | 2.00 | 2.40 | 2.40 | 2.30 | 2.80 | 2.70 | 2.50 |
| 200 | < 0.10 | 3.20 | 2.70 | 1.80 | 2.60 | 2.60 | 2.40 | 3.00 | 3.00 | 3.00 |
| 250 | < 0.10 | 2.80 | 2.60 | 1.60 | 2.50 | 2.50 | 2.30 | 2.90 | 3.30 | 3.10 |
*F = filter; Dr = dripper; St = sedimentation tank.
Table 3.
Analysis of variance for flow values.
| Sources of variation | G.F. | Sum of squares | Mean square | F | Significance |
| System | 3 | 4.6671 | 1.5557 | 65.72 | ** |
| Residue (a) | 12 | 0.2840 | 0.0236 | ||
| Model | 4 | 803.5583 | 200.8896 | 17.777.84 | ** |
| Valve | 1 | 0.03184 | 0.03118 | 2.81 | ** |
| Model × valve | 4 | 0.2071 | 0.0517 | 4.57 | ** |
| Model × assessment | 12 | 5.4318 | 0.4526 | 39.96 | ** |
| System. × valve | 3 | 0.0089 | 0.0029 | 0.26 | |
| Model × syst. × val. | 12 | 0.1231 | 0.0102 | 0.91 | |
| Residue (b) | 108 | 1.2234 | 0.0113 | ||
| Assessment | 6 | 5.0612 | 0.8435 | 125.09 | ** |
| Ass. × syst. | 18 | 1.2732 | 0.0707 | 10.49 | ** |
| Ass. × model | 24 | 2.5159 | 0.1048 | 15.54 | ** |
| Ass. × val. | 6 | 0.1985 | 0.0330 | 4.90 | ** |
| Ass. × model × val. | 24 | 0.4098 | 0.01707 | 2.53 | ** |
| Ass. × model × syst. | 72 | 4.3111 | 0.0598 | 8.87 | ** |
| Ass. × syst. × val. | 18 | 0.4748 | 0.02637 | 3.91 | ** |
| Ass. × val. × syst. × mod | 72 | 0.4784 | 0.0066 | 0.98 | |
| Residue (c) | 720 | 4.8551 | 0.0067 | ||
| Total | 1119 |
Table 4.
Average flow rates (L h-1) of models G1 to G5 with valves in systems S1 to S4 and average results between systems for each model.
Table 4.
Average flow rates (L h-1) of models G1 to G5 with valves in systems S1 to S4 and average results between systems for each model.
| Mod. | System | Time (h) | ||||||
| 2 | 50 | 100 | 150 | 200 | 250 | 300 | ||
| G1 | S1 | 0.82 a | 0.73 a | 0.71 a | 0.62 a | 0.71 a | 0.68 a | 0.58 a |
| S2 | 0.87 a | 0.77 a | 0.46 b | 0.36 b | 0.37 b | 0.36 b | 0.37 b | |
| S3 | 0.85 a | 0.77 a | 0.71 a | 0.63 a | 0.66 a | 0.68 a | 0.46 ab | |
| S4 | 0.80 a | 0.75 a | 0.77 a | 0.75 a | 0.79 a | 0.71 a | 0.60 a | |
| G2 | S1 | 2.26 a | 2.24 a | 2.25 a | 2.23 a | 2.24 ab | 2.21 ab | 2.09 c |
| S2 | 2.23 a | 2.29 a | 2.28 a | 2.32 a | 2.35 a | 2.35 a | 2.49 a | |
| S3 | 2.34 a | 2.22 a | 2.29 a | 2.33 a | 2.25 ab | 2.27 ab | 2.29 b | |
| S4 | 2.32 a | 2.23 a | 2.22 a | 2.21 a | 2.16 b | 2.14 b | 2.06 c | |
| G3 | S1 | 3.39 a | 3.50 a | 3.38 a | 3.25 ab | 3.39 a | 3.31 a | 3.19 ab |
| S2 | 3.31 a | 3.40 a | 3.16 b | 3.15 b | 3.08 b | 2.94 b | 2.80 c | |
| S3 | 3.41 a | 3.48 a | 3.42 a | 3.34 a | 3.20 ab | 3.25 a | 3.32 a | |
| S4 | 3.46 a | 3.54 a | 3.34 a | 3.33 a | 3.32 a | 3.32 a | 3.12 b | |
| G4 | S1 | 2.42 a | 2.33 c | 2.51 a | 2.15 c | 2.50 ab | 2.37 b | 2.31 b |
| S2 | 2.25 b | 2.17 c | 2.26 b | 2.27 bc | 2.35 bc | 2.19 c | 2.21 b | |
| S3 | 2.48 a | 2.67 b | 2.41 ab | 2.40 b | 2.27 c | 2.42 ab | 2.56 a | |
| S4 | 2.51 a | 2.92 a | 2.52 a | 2.60 a | 2.58 a | 2.54 a | 2.58 a | |
| G5 | S1 | 2.17 a | 2.12 ab | 2.01 a | 1.96 a | 1.97 a | 1.97 a | 1.61 b |
| S2 | 2.05 a | 1.99 b | 1.75 b | 1.53 b | 1.80 b | 1.62 b | 1.54 b | |
| S3 | 2.20 a | 2.13 ab | 2.01 a | 1.97 a | 1.88 ab | 2.00 a | 1.89 a | |
| S4 | 2.20 a | 2.17 a | 2.12 a | 2.08 a | 2.03 a | 1.90 a | 1.77 a | |
Means followed by the same letter vertically, for each model, do not differ significantly by the Tukey test, at 5% probability.
Table 5.
Analysis of variance in the DU values.
| Sources of variation | G.F. | Sum of squares | Mean square | F | Significance |
| System | 3 | 26461.34 | 8820.44 | 906.14 | ** |
| Residue (a) | 4 | 71.12 | 17.78 | ||
| Model | 4 | 17821.44 | 4455.36 | 457.71 | ** |
| Assessment | 6 | 10713.06 | 1785.51 | 183.43 | ** |
| Assessment × model | 24 | 7087.25 | 295.30 | 30.34 | ** |
| Assessment × system | 18 | 11621.65 | 645.64 | 66.33 | ** |
| Model ×system | 12 | 21432.39 | 1786.03 | 183.48 | ** |
| Assess. × model × syst. | 72 | 9660.39 | 134.17 | 13.78 | ** |
| Residue (b) | 136 | 1323.83 | 9.73 | ||
| Total | 279 |
Disclaimer/Publisher’s Note: The statements, opinions and data contained in all publications are solely those of the individual author(s) and contributor(s) and not of MDPI and/or the editor(s). MDPI and/or the editor(s) disclaim responsibility for any injury to people or property resulting from any ideas, methods, instructions or products referred to in the content. |
© 2024 by the authors. Licensee MDPI, Basel, Switzerland. This article is an open access article distributed under the terms and conditions of the Creative Commons Attribution (CC BY) license (http://creativecommons.org/licenses/by/4.0/).
Copyright: This open access article is published under a Creative Commons CC BY 4.0 license, which permit the free download, distribution, and reuse, provided that the author and preprint are cited in any reuse.


