Submitted:
05 December 2024
Posted:
06 December 2024
You are already at the latest version
Abstract
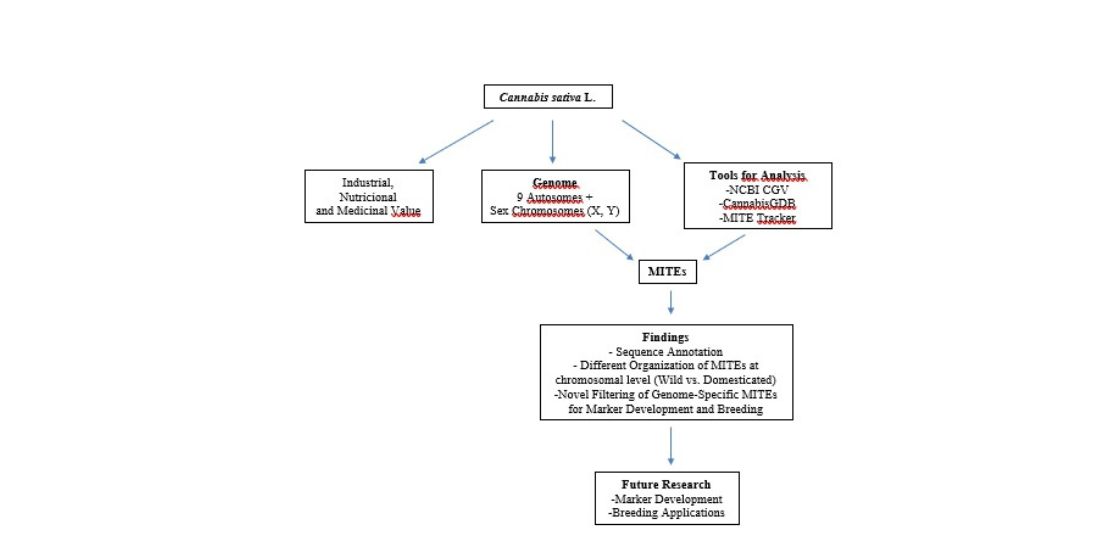
Cannabis sativa L. is a globally cultivated plant with significant industrial, nutritional, and medicinal value. Its genome, comprising nine autosomes and sex chromosomes (X and Y), has been extensively studied, particularly in the context of precise breeding for specific enduses. Recent advances have facilitated genome-wide analyses through platforms like the NCBI Comparative Genome Viewer (CGV) and CannabisGDB, enabling comparative studies across multiple Cannabis genotypes. Despite the abundance of genomic data, a particular group of transposable elements, known as miniature inverted-repeat transposable elements (MITEs), remains underexplored in Cannabis. MITEs are non-autonomous Class II DNA transposons characterized by high copy numbers and insertion preference in non-coding regions, potentially affecting gene expression. In the present study, we report the sequence annotation of MITEs in wild-type and domesticated Cannabis genomes. Interestingly, different patterns of MITE distribution in wild and domesticated Cannabis genomes at chromosome level findings were identified. We also developed a simple and innovative protocol to identify genome-specific MITE families offering valuable tools for future research on marker development focused on important genetic variation for breeding in Cannabis sativa.
Keywords:
Cannabis
; MITEs
; wild and domesticated genomes
1. Introduction
Cannabis (Cannabis sativa L.) is an erect annual herb with a dioecious breeding system [1]. It has a diploid genome (2n = 20) with a karyotype composed of nine autosomes and a pair of sex chromosomes (X and Y) [1]. From its centre of domestication in Central Asia, Cannabis has spread worldwide. It has been cultivated for millennia either as hemp, for fiber and grain, or for its cannabinoid synthesis for medicinal or recreational purposes [2,3]. Cannabis has considerable industrial, nutritional and medical value and information, about its genome is extensive and valuable for precise breeding considering previously described specific enduses.
A sequencing milestone was obtaining the first Cannabis draft whole genome covering 534 Mb generated from Purple Kush (PK) a drug-type strain widely used for its medicinal effects [1]. Recently, online platforms such as the NCBI Comparative Genome Viewer (CGV) [4] and CannabisGDB [5], among others, have significantly facilitated genome-wide analyses considering several Cannabis genotypes. CGV offers a user-friendly environment to compare up to15 Different Cannabis genotype genomes from chromosome to intrachromosome and gene region scales including drug-type cultivars Purple Kush [6], Jamaican Lion DASH [7], hemp-type cultivars Cannbio2 [8], Finola [6], Pink Pepper, Abacus, and feral- or wild-type genotype JL [9]. CannabisGDB is a comprehensive genomics database covering Cannabis genotypes Purple Kush, Jamaican Lion DASH, Finola, CBDRx, Pineapple Banana Bubba Kush, LA Confidential, Chemdog91, and Cannatonic, with genomic tools to analyze and compare at variety, gene locus, metabolite, and protein level [5].
Both platforms offer valuable tools for understanding the evolution of the Cannabis sativa L. genome and how diversity can be generated within this species. Genome-level genetic variation or diversity analysis is a compelling tool for shedding light on the driving forces behind processes such as domestication, breeding, and adaptation in animals and plants [6], including Cannabis.
An interesting source of genetic variation which has not been studied extensively within Cannabis genome is a particular group of transposable elements (TEs) [7] known as miniature inverted-repeat transposable elements (MITEs) [8]. TEs are divided into two classes according to whether their transposition intermediate is RNA (class 1) or DNA (class 2). Also, each group of TEs contains autonomous and non-autonomous elements depending on the presence or absence of coding regions associated with transposition [7,9]. MITEs are class two DNA transposons nonautonomous elements, small in length -typically 70 bp to 600 bp- with well-defined structural features- terminal inverted repeats (TIRs) longer than ten bp flanked by small direct repeats (target site duplication, TSD, 2-10 bp long) at both ends of the element- [7,10]. MITEs are frequently found in or near plant genes [8,11,12,13,14], and evidence of these elements potentially altering gene expression in plants has been described [12,15,16,17,18].
MITEs are also known for their very high copy numbers per genome compared to their related autonomous class II and class I transposons [7,19]. Their success in proliferating within the host genome is mainly due to their insertion preference for non-coding regions (promoters, introns, and untranslated regions), which leads to the generation of stable or neutral mutations while avoiding disruption of the exonic regions of genes [19]. MITE-generated mutations in non-coding regions near genes can be used as a potential molecular marker system in plant genetics and breeding [17,20,21,22,23] and to understand evolution processes like domestication [19,24,25].
As the structural features defining MITEs are well-characterized, computational approaches have been employed to identify and annotate MITE sequences within genomes [10,14,26,27,28]. With different algorithms to discover MITEs, these programs exhibit advantage and disadvantages concerning speed, memory use efficiency and false positive scoring, among other parameters [14,20] positioning detect MITE [26] as one of the most efficient, precise and comprehensive in detecting MITEs, and MITE Tracker [14] as the most accurate and meticulous in filtering of false positives [29].
In the present study, we report the sequence annotation of MITEs in wild-type and domesticated Cannabis genomes. Based on this information, we analyze MITE order and organization at the chromosome level in wild and domesticated Cannabis genomes. We also developed a simple and innovative protocol to identify genome-specific MITE families offering valuable tools for future research on marker development focused on valuable genetic variation for breeding in Cannabis sativa.
2. Materials and Methods
2.1. MITE Discovery, Annotation and Organization
The Cannabis sativa genome assemblies of the wild-type variety JL, deposited at NCBI under Bioproject number PRJNA562042 [30], and of the high-CBD hemp cultivar CBDRx, GenBank assembly accession GCA_900626175.2 [31] were used for MITEs discovery and annotation.
The software MITE Tracker [14] was used to find and annotation of full MITEs and cluster them into high-sequence homology families using the following parameters: TSD elements length 2-10 nucleotides (nt), MITE length 50-650 nt, copy number threshold=3 with 95-95 homology and coverage.
We organized the chromosomes of the JL and CBDRx genomes based on synteny using the main view of the CGV (“ideogram view”) [4], where pairwise alignments serve as connectors that linking syntenic regions between the two assemblies at the chromosomal level. The identified pairs of chromosomes with syntenic regions were then used to determine MITE content and physical organization, considering chromosome arms, telomeric, and centromeric regions.
2.2. Genome-Specific MITEs Identification
For genome-specific MITE identification, the software MITE Tracker [14] was run using previous parameters, including, in this case, both, the JL and CBDRx genomes in a single run. This approach allowed us to establish MITE families by identifying highly homologous (more than 95%) MITE members (at least three by default) previously defined in chromosomes from both genomes. With this strategy, we identified MITE families with members occurring exclusively in the JL or CBDRx genomes or both genomes.
2.3. Potential Uses of Genome-Specific MITES for Fingerprinting and Molecular Markers Developement
We conducted individual NCBI BLAST searches using subsets of genome-specific MITEs from JL and CBDRx and random MITEs selected from each JL and CBDRx genomes (single run). The searches were against the “whole-genome shotgun contigs” database, restricted to the organism “Cannabis sativa (taxid:3483)” and optimized for highly similar sequences (megablast). Four distinct datasets were obtained using the second highest identity value of each MITE BLAST, as the first identity value was consistently the original JL or CBDRx sequence. After that, an ANOVA was performed to explore significant differences among groups using the F statistic from the scipy.stats library [32,33] with a p-value < 0.05. Regarding significant differences between datasets, pairwise differences between groups were identified using Tukey’s HSD with FWER = 0.05.
To explore the potential use of CBDRx genome-specific MITEs in developing molecular markers for physically linked traits, the nearest genes of these MITEs were searched through BLAST searches against the “refseq_reference_genomes” database, restricted to the organism “Cannabis sativa (taxid:3483)”. After identifying the nearest genes for each MITE using Genome Data Viewer, we investigated the functions of the proteins encoded by these genes through BlastKOALA [34]. To achieve this, the nearest genes to CBDRx genome-specific MITEs were filtered by removing duplicates and gene codes lacking the corresponding protein-coding sequences in the reference Cannabis genome Pink Pepper ASM2916894v1 (GCF_029168945.1). The protein sequences of the remaining genes associated with MITEs were then analyzed using the BlastKOALA platform.
3. Results
3.1. MITE Discovery, Annotation, and Organization
MITE densities at both the whole genome and chromosome scales were consistently higher in JL than CBDRx (Table 1). Using MITE Tracker on the JL genome, 691 families were identified, encompassing 14,444 MITEs (File S1). Chromosome CM022971.1 exhibited the highest density of 23 MITEs/Mb, while chromosomes CM022969.1, CM022967.1, CM022968.1, and CM022973.1 showed the lowest density, each with 15 MITEs/Mb (Table 1).
In comparison, the CBDRx genome yielded 649 families and 10,903 MITEs (File S2), with Chromosome NC_044379.1 exhibiting the highest density of 14 MITEs/Mb (Table 1).
3.2. Genome-Specific MITEs Identification
The whole genome alignment between JL and CBDRx was the first step in comparing chromosome pairs based on syntenic information (Figure 1). Only chromosomes three (CM022967.1, NC_044372.1) and six (CM022970.1, NC_044377.1) consistently shared syntenic information and chromosome numbering. Inconsistencies were observed between syntenic information and chromosome numbering in the remaining chromosomes.
The dominant pattern in MITE distribution along JL chromosomes (Figure 2, in blue) was characterized by the highest frequency values observed within the centromeric region, with lower MITE frequencies observed towards both telomeres (chromosomes CM022965.1, CM022967.1, CM022969.1, CM022970.1, and CM022972.1). The opposite pattern (highest MITE frequencies associated with telomeric regions and lowest MITE frequencies within the centromere) was observed in chromosomes CM022966.1, CM022971.1, and CM022773.1 while different patterns from previous ones were noted in chromosomes CM022968.1, and CM022974.1.
In contrast to JL chromosomes, the dominant pattern in MITE distribution along CBDRx chromosomes (Figure 2, in orange) was characterized by the highest MITE frequencies associated with telomeric regions and the lowest MITE frequencies around the centromere (chromosomes NC_44373.1, NC_033370.1, NC_044372.1, NC_044374.1, NC_044375.1, NC_044377.1, NC_044371.1, NC_044376.1, NC_044378.1). A second pattern, observed in chromosome NC_044379.1, featured the highest MITE frequencies in one telomere, progressively decreasing through the centromere and towards the second telomere.
When comparing pairs of syntenic chromosomes, CM022966.1/NC_044374.1, CM02273.1/NC_044378, and CM022971.1/NC_044371.1 were the sole combinations sharing a similar telomeric MITE distribution, while the other syntenic chromosome pairs showed inconsistencies in MITE distribution (Figure 2).
3.3. Finding Genome-Specific MITEs
Including the JL and CBDRx genomes in a single run of MITE Tracker allowed the identification of a total number of 1024 MITE families based on 31155 MITEs (File S3). Among these families, 979 included MITEs belonging to CBDRx and JL genomes (Table S1). Twenty-one MITE families were detected exclusively in the JL genome. One of them, family F964, comprised 53 MITEs distributed across the ten JL chromosomes. The other 20 JL genome-specific MITE families were constituted by three to nine MITE elements each. Regarding the CBDRx genome, 24 genome-specific MITE families were detected, with four families comprising 19, 18, 16, and 10 MITEs, and the remaining 21 families containing three to seven MITEs each (Table S1).
3.4. Potential Uses of Genome-Specific MITES for Fingerprinting and Molecular Markers Development
To explore the use of genome-specific MITES for fingerprinting, individual NCBI BLAST searches were managed using subsets of genome-specific MITEs from JL and CBDRx (both genomes in a single run of MITE Tracker). The same was done with random MITEs selected from JL and CBDRx genomes (runs of MITE Tracker with separate genomes). Thus, four distinct datasets were obtained based on the second-highest identity values as described in Materials and Methods. Mean identity values obtained in genome-specific MITEs (only in JL and only in CBDRx, Figure S1) were consistently lower (96.59 and 96.7%, respectively) than mean identity values obtained in random MITEs selected from individual genomes (98.59 and 98.66%, respectively). Significant differences among groups were obtained (F= 4.166, P=0.0084) with significant pairwise differences detected in combinations CBDRx vs. only in CBDRx (p= 0.0005) and only in CBDRx vs. only in JL (p=0.0133). The remaining pairwise combinations showed no differences in NCBI BLAST identity values (p>0.05, Figure S1). Considering the potential of genome-specific MITES for developing molecular markers for interesting traits, its nearest genes were searched performing BLAST searches against the CBDRx reference genome. With this approach, after excluding duplications and genes not present in the Cannabis sativa reference proteome, 127 genes associated with CBDRx genome-specific MITEs were analyzed.
To investigate the functions of the proteins encoded by these genes, a BlastKOALA search [34] was conducted, resulting in the annotation of 61 entries (48%). Mapping against BRITE hierarchies [35] identified matches with 25 hierarchical groups distributed across three protein families: (i) metabolism (six groups), (ii) genetic information processing (13 groups), and (iii) signaling and cellular processes (six groups).
The most represented groups included ko01000 Enzymes (24 entries), ko02000 Transporters (seven entries), and ko03400 DNA Repair and Recombination Proteins (five entries), as shown in Figure 3.
4. Discussion
4.1. MITEs Density Within Cannabis Sativa Genomes
In this work, the software MITE Tracker was chosen due to its effectiveness in detecting MITEs concerning false-positive rates and processing efficiency in complex genomes [20]. This is the first time this program has been used in Cannabis research. Additionally, we proposed a novel and simple method for identifying genome-specific MITEs.
Previous research analyzing MITEs across 38 plant genomes, including Cannabis [36] utilizing the software tools MITE Digger [27], MITE-Hunter [10], and RSPB [37], revealed a wide variation in MITE densities. These ranged from 0.34 MITEs/Mb in Selaginella moellendorffii to 480 MITEs/Mb in Oryza sativa, with Cannabis sativa exhibiting a density of 140 (Table S2). The MITE density values reported previously [36] were 8 (JL) and 11.5 (CBDRx) times higher than the densities obtained using MITE Tracker in our study (Table 1). Similar patterns were observed in rice, with 140 MITEs/Mb compared to 45.4 MITEs/Mb [14], and in Vitis vinifera, with 125 MITEs/Mb compared to 37 MITEs/Mb [38]. This suggests a reduced MITE detection rate in MITE Tracker compared to earlier MITE discovery tools used by Chen et al. [36]. In contrast, Ou et al. [39] reported similar levels of high specificity (≥ 95%) and accuracy (≥ 94%), along with moderate sensitivity (79–81%) but somewhat lower precision (64–79%) when assessing the performance of MITE Tracker and MITE Hunter alongside other MITE discovery tools.
Interestingly, our study revealed a higher density of MITEs in the wild-type JL’s smaller genome than the larger, domesticated CBDRx genome (Table 1). This observation contrasts with the positive correlation (r=0.72) between MITE number and genome size reported by Chen et al. [36].
A second study on draft genomes of Triticum and Aegilops species proposed that different levels of MITE proliferation occurred in A, B and D subgenomes [40]. For example, the A subgenome exhibited a progressive increase in MITE frequency corresponding to levels of polyploidization but not necessarily related to genome size, as observed in Triticum urartu (AA), T. durum (AABB), and T. aestivum (AABBDD). A similar pattern was observed in the B subgenome for T. durum and T. aestivum. However, the subgenome D differed, with MITE frequencies being similar in Aegilops tauschii (DD) and T. aestivum (Table S2). In summary, a contrasting variation in the frequency of MITE copies in bread wheat close relatives T. urartu (3.14 MITEs/Mb) and Ae. tauschii (6.96 MITEs/Mb) was detected previously [40].
Variation in the number and frequency of MITE copies among closely related species has been reported within the genus Arabidopsis. For instance, the genome of Arabidopsis lyrata contains 87.88 MITEs/Mb, in contrast to Arabidopsis thaliana, which exhibits 27.12 MITEs/Mb [36], see Table S2. A more recent study focused on tea tree (Camellia sinensis) modern cultivars also reported variation in MITE copy frequencies considering C. sinensis var. sinensis with 11.97 MITEs/Mb, and C. sinensis var. assamica with 7.61 [41].
The mechanisms underlying the differing frequencies of MITE proliferation among genetically similar genotypes remain unclear. In our study, a single run of the JL and CBDRx genomes in MITE Tracker allowed us to identify 1,024 MITE families, most of which had members in both genomes. Moreover, a significant portion of the differences in MITE proliferation between the JL and CBDRx genomes could be attributed to the ten most successful MITE families in terms of copy number. This small group of families includes 722 (18.7%) JL-specific MITEs (Table S1), contrasting with the 21 families and 134 MITE members detected exclusively in the JL genome when run alone on MITE Tracker. These findings suggest a relaxation in JL genome of a hypothetical general mechanism regulating MITE multiplication, whereby larger families may have a greater likelihood of proliferating compared to smaller ones.
Regarding MITE distribution within Cannabis sativa chromosomes, two distinct patterns of MITE distribution within syntenic JL and CBDRx chromosomes were observed. Most CBDRx chromosomes exhibited a terminal MITE distribution, characterized by higher MITE densities (MITEs/Mb) in telomeric regions and reduced densities in centromeric (pericentric) areas. In contrast, most JL chromosomes displayed a mostly pericentric distribution, with elevated MITE densities near centromeres and lower values in telomeric regions (Figure 2). Terminal MITE distributions have been previously reported in monocots such as Brachypodium distachyon, Oryza sativa, and Sorghum bicolor, as well as in eudicots like Vitis vinifera, Glycine max, and Aquilegia coerulea [42]. Pericentric MITE distributions have only been documented in the eudicots Arabidopsis thaliana and Brassica rapa [42]. These authors also observed a strong correlation between MITE terminal distribution in most eudicots and monocots and global gene density due to the general gene/MITE association, and interestingly, contrasting with pericentric MITE location, which disagrees with the terminal global gene profile observed in Brassicaceae [42]. Unfortunately, the available JL genome sequence data [30] lacked annotated genes, preventing us from directly comparing our findings with those from Brassicaceae genomes [42]. MITEs showed a pericentric distribution in these eudicots’ genomes, while genes followed a terminal distribution within chromosomes.
To overcome the inconvenience of lacking annotated genes in the JL genome, we performed a syntenic comparison of CBDRx /JL genome sequences using the NCBI Comparative Genome Viewer (CGV) tool [4] (see Figure 1). The comparisons of the genome sequences revealed, in the first order, inconsistencies in terms of the numbering of chromosomes: only chromosomes three (22967/44372) and six (22970/44377) shared number designations and synteny, and the remaining chromosomes did not. Also, most syntenic chromosome pairs revealed by CGV exhibit major rearrangements as inversions and translocations including complete chromosomes - e.g., 22974 / 44379- and partial or complete chromosome arms - e.g., 22965/44373, 22966 / 44370, 22967/44372, 22968/44374, 22969/44375, 22970/44377, 22972/44376. A different situation with conserved syntenic telocentric regions was observed in chromosome pairs 22971/44371 and 22973/44378 (Figure 1).
In agreement with our analysis, comparisons of JL, cs10 (aka CBDRx), Purple Kush, Finola, and Cannbio-2 genome sequences revealed inconsistencies between these genome sequences regarding orientation and numbering of chromosomes [43].
Interestingly, in our study, all cases of JL chromosomes displaying pericentric MITE distributions also showed chromosome arm inversions and/or translocations, in terms that MITE and gene-rich telomeric regions in CBDRx chromosomes showed synteny with the pericentric region of the corresponding JL chromosome suggesting pericentric distribution of MITEs and genes in JL chromosomes as observed in Figure 4 (see also Figure 1 and Figure 2). The pericentric distributions of MITEs and genes in JL chromosomes with chromosome arms inversions would be an alternative pattern to the terminal (telomeric) distributions of MITES and genes observed in most eudicots and monocots and pericentric MITE locations combined with terminal gene distribution described previously for Brasicaceae [42].
4.2. Potential of SNPs of Genome-Specific MITEs in Fingerprinting and Breeding
In our study, genome-specific MITEs are defined by genome-specific SNP´s within the constrained set of the JL and CBDRx genomes included in a single run of MITE Tracker. We hypothesize that genome-specific MITEs would exhibit a significantly higher number of mutations (and SNPs) than those identified from MITE tracker individual runs. We expected lower identity values in genome-specific MITEs compared to ordinary MITEs. In agreement with this argument, consistently lower identity values for genome-specific MITEs, compared to those of randomly selected MITEs from a single genome and estimated to be 2% lower, were observed in our study (CBDRx 98.7%, only in CBDRx 96.7%, JL 98.6%, only in JL 96.6%, see Figure S1).
Some inherent characteristics of MITEs, such as their genomic distribution (often located near or within genes) and sequence structure (the combination of flanking sequences and conserved terminal inverted repeats, TIRs) [14], allow for the design of MITE-specific primers. These primers facilitate their amplification across different genotypes, enabling dominant marker scoring based on presence/absence variation of MITEs. Consequently, these DNA structures serve as valuable tools for marker development in various applications, including QTL mapping, molecular breeding, and genetic fingerprinting [20,41,44]. Chang, O’Donoughue and Bureau [45] demonstrated using inter-MITE polymorphism for fingerprinting barley cultivars and performing genetic similarity analysis.
A similar approach was employed by Dai et al., [23], where 80 polymorphic markers derived from 55 MITEs were developed and used to evaluate genetic diversity in a panel of B. napus accessions, comprising 101 natural and 25 synthetic genotypes. Additionally, two of these markers were anchored to candidate genes associated with agronomic traits. The insertion of TEs into genes that affect various crop traits has been well-documented [23]. For instance, Studer et al., [46] showed that inserting a TE in the regulatory region of a maize domestication gene acted as an enhancer of gene expression, partially explaining the increased apical dominance in maize. Moreover, MITEs have a higher potential for gene regulation and phenotypic influence than other types of TEs.
In our study, 41.6% of CBDRx genome-specific MITEs were located within 5,000 bp of the nearest gene, 8.6% were found within 500 bp, and three were identified as being inserted into genes. Similarly, Feng [47] identified 18 members of a specific MITE family in annotated rice sequences. Of these, 40% were in introns, 30% were less than 530 bp from a coding sequence, and 20% were situated between 1 and 5 kb from a coding sequence; however, none were found within coding regions.
In this context, our approach to identifying genome-specific MITEs contributes to discovering JL and CBDRx genome-specific mutations for marker development. The strategy of using MITE Tracker with two genomes to identify genome-specific MITEs can be extended to various Cannabis genotypes and genome pairs from other crops. Depending on genome size, breeding or research objectives, and data availability, MITE Tracker could also be used to detect specific MITEs at the chromosome level, considering syntenic chromosomes from more than two genotypes. Further studies are required to validate these findings. To the best of our knowledge, MITE Tracker has been utilized exclusively for MITE annotation at the genome level in a diverse range of single genomes, including crops such as wheat and rice [14], Eragrostis [48], finger millet [49], Ethiopian mustard [50], white fonio [51], and potato [52]; insects such as moths [53,54] and subterranean termites [55] and fungi such as the barley covered smut fungus (Ustilago hordei) [56]and Zymoseptoria tritici [57], among other organisms. Consequently, our approach of employing MITE Tracker to analyze two genomes simultaneously is both novel and a promising strategy for identifying genome-specific mutations to facilitate marker development for selection and fingerprinting, among other uses.
5. Conclusions
When comparing the JL and CBDRx genomes, auantitative (MITE count per Mb) and qualitative (physical distribution along chromosomes) differences in MITE organization were identified. The wild-type JL genome exhibited a higher MITE frequency (count per Mb) with a predominantly pericentromeric distribution, contrasting with the domesticated CBDRx genome, which showed a lower MITE frequency and a primarily telomeric distribution.
Also, our approach leveraging MITE Tracker to analyze two genomes simultaneously, represents a novel and effective strategy for identifying genome-specific MITEs. This methodology facilitated the discovery of JL and CBDRx specific mutations, offering valuable insights for marker development, selection, and fingerprinting applications.
Supplementary Materials
The following supporting information can be downloaded at the website of this paper posted on Preprints.org, Figure S1: Dispersion of NCBI BLAST second highest identity values considering four different MITEs datasets; Table S1: JL and CBDRx MITEs organized by families and chromosomes, Table S2. MITE frequences at genome level in differents organisms.; File S1: MITEs annotation of JL genome, File S2 MITEs annotation of CBDRx genome, File S3: MITEs annotation of the JL and CBDRx genomes in a single run of MITE Tracker.
Author Contributions
Conceptualization, M.Q., C.C., F.F., L.S.V. and M.H. ; methodology, J.M.C., L.S.V., F. F. M.Q., C.C., E.S. and M.H.; software, J.M.C., L.S.V. and F. F.; validation, M.Q., C.C., L.S.V. and M.H.; formal analysis, M.Q., C.C., L.S.V. and M.H.; investigation, M.Q., C.C. and M.H.; resources, M.Q.and M.H.; data curation, M.Q., C.C. and M.H.; writing—original draft preparation, M.Q., C.C. and M.H.; writing—review and editing, M.Q., C.C. and M.H.; visualization, M.Q., C.C. and M.H.; supervision, M.H.; project administration, M.Q., E.S. and M.H.; funding acquisition, M.Q.and M.H. All authors have read and agreed to the published version of the manuscript.
Funding
This research was funded by INTA, grant numbers PTi512, PEi071 and PEi084.
Institutional Review Board Statement
Not applicable.
Data Availability Statement
The original contributions presented in this study are included in the article/supplementary material. Further inquiries can be directed to the corresponding author(s).
Acknowledgments
Special thanks to Marina Omelchenko (NIH/NLM/NCBI) for giving us access to the Comparative Genome Viewer (CGV) considering JL and CBDRx genomes.
Conflicts of Interest
The authors declare no conflicts of interest.
References
- van Bakel, H.; Stout, J.M.; Cote, A.G.; Tallon, C.M.; Sharpe, A.G.; Hughes, T.R.; Page, J.E. The Draft Genome and Transcriptome of Cannabis Sativa. Genome Biol 2011, 12. [Google Scholar] [CrossRef]
- ElSohly, M.A.; Gul, W. Constituents of Cannabis Sativa. In Handbook of Cannabis; Pertwee, R., Ed.; Oxford University Press, 2014; pp. 3–22.
- Clarke, R.C.; Merlin, M.D. Cannabis Domestication, Breeding History, Present-Day Genetic Diversity, and Future Prospects. CRC Crit Rev Plant Sci 2016, 35, 293–327. [Google Scholar] [CrossRef]
- Rangwala, S.H.; Rudnev, D. V; Ananiev, V. V; Oh, D.-H.; Asztalos, A.; Benica, B.; Borodin, E.A.; Bouk, N.; Evgeniev, V.I.; Kodali, V.K.; et al. The NCBI Comparative Genome Viewer (CGV) Is an Interactive Visualization Tool for the Analysis of Whole-Genome Eukaryotic Alignments. PLoS Biol 2024, 22, e3002405. [Google Scholar] [CrossRef]
- Cai, S.; Zhang, Z.; Huang, S.; Bai, X.; Huang, Z.; Zhang, Y.J.; Huang, L.; Tang, W.; Haughn, G.; You, S.; et al. CannabisGDB: A Comprehensive Genomic Database for Cannabis Sativa L. Plant Biotechnol J 2021, 19, 857–859. [Google Scholar] [CrossRef] [PubMed]
- Andersson, L.; Purugganan, M. Molecular Genetic Variation of Animals and Plants under Domestication. Proceedings of the National Academy of Sciences 2022, 119. [Google Scholar] [CrossRef] [PubMed]
- Feschotte, C.; Jiang, N.; Wessler, S.R. Plant Transposable Elements: Where Genetics Meets Genomics. Nat Rev Genet 2002, 3, 329–341. [Google Scholar] [CrossRef]
- Bureau, T.E.; Wessler, S.R. Tourist: A Large Family of Small Inverted Repeat Elements Frequently Associated with Maize Genes. Plant Cell 1992, 4, 1283–1294. [Google Scholar] [CrossRef] [PubMed]
- Wicker, T.; Sabot, F.; Hua-Van, A.; Bennetzen, J.L.; Capy, P.; Chalhoub, B.; Flavell, A.; Leroy, P.; Morgante, M.; Panaud, O.; et al. A Unified Classification System for Eukaryotic Transposable Elements. Nat Rev Genet 2007, 8, 973–982. [Google Scholar] [CrossRef]
- Han, Y.; Wessler, S.R. MITE-Hunter: A Program for Discovering Miniature Inverted-Repeat Transposable Elements from Genomic Sequences. Nucleic Acids Res 2010, 38. [Google Scholar] [CrossRef]
- Bureau, T.E.; Wessler, S.R. Mobile Inverted-Repeat Elements of the Tourist Familyare Associated with the Genes of Many Cereal Grasses. Proceedings of the National Academy of Sciences 1994, 91, 1411–1415. [Google Scholar] [CrossRef] [PubMed]
- Lu, C.; Chen, J.; Zhang, Y.; Hu, Q.; Su, W.; Kuang, H. Miniature Inverted-Repeat Transposable Elements (MITEs) Have Been Accumulated through Amplification Bursts and Play Important Roles in Gene Expression and Species Diversity in Oryza Sativa. Mol Biol Evol 2012, 29, 1005–1017. [Google Scholar] [CrossRef] [PubMed]
- Benjak, A.; Boué, S.; Forneck, A.; Casacuberta, J.M. Recent Amplification and Impact of MITEs on the Genome of Grapevine (Vitis Vinifera L.). Genome Biol Evol 2009, 1, 75–84. [Google Scholar] [CrossRef]
- Crescente, J.M.; Zavallo, D.; Helguera, M.; Vanzetti, L.S. MITE Tracker: An Accurate Approach to Identify Miniature Inverted-Repeat Transposable Elements in Large Genomes. BMC Bioinformatics 2018, 19, 348. [Google Scholar] [CrossRef]
- Xu, L.; Yuan, K.; Yuan, M.; Meng, X.; Chen, M.; Wu, J.; Li, J.; Qi, Y. Regulation of Rice Tillering by RNA-Directed DNA Methylation at Miniature Inverted-Repeat Transposable Elements. Mol Plant 2020, 13, 851–863. [Google Scholar] [CrossRef] [PubMed]
- Naito, K.; Zhang, F.; Tsukiyama, T.; Saito, H.; Hancock, C.N.; Richardson, A.O.; Okumoto, Y.; Tanisaka, T.; Wessler, S.R. Unexpected Consequences of a Sudden and Massive Transposon Amplification on Rice Gene Expression. Nature 2009, 461, 1130–1134. [Google Scholar] [CrossRef] [PubMed]
- Yin, S.; Wan, M.; Guo, C.; Wang, B.; Li, H.; Li, G.; Tian, Y.; Ge, X.; King, G.J.; Liu, K.; et al. Transposon Insertions within Alleles of BnaFLC.A10 and BnaFLC.A2 Are Associated with Seasonal Crop Type in Rapeseed. J Exp Bot 2020, 71, 4729–4741. [Google Scholar] [CrossRef] [PubMed]
- Jeong, H.; Yun, Y.B.; Jeong, S.Y.; Cho, Y.; Kim, S. Characterization of Miniature Inverted Repeat Transposable Elements Inserted in the CitRWP Gene Controlling Nucellar Embryony and Development of Molecular Markers for Reliable Genotyping of CitRWP in Citrus Species. Sci Hortic 2023, 315, 112003. [Google Scholar] [CrossRef]
- Naito, K.; Cho, E.; Yang, G.; Campbell, M.A.; Yano, K.; Okumoto, Y.; Tanisaka, T.; Wessler, S.R. Dramatic Amplification of a Rice Transposable Element during Recent Domestication. Proceedings of the National Academy of Sciences 2006, 103, 17620–17625. [Google Scholar] [CrossRef]
- Venkatesh; Nandini, B. Miniature Inverted-Repeat Transposable Elements (MITEs), Derived Insertional Polymorphism as a Tool of Marker Systems for Molecular Plant Breeding. Mol Biol Rep 2020, 47, 3155–3167. [Google Scholar] [CrossRef]
- von Zitzewitz, J.; Szűcs, P.; Dubcovsky, J.; Yan, L.; Francia, E.; Pecchioni, N.; Casas, A.; Chen, T.H.H.; Hayes, P.M.; Skinner, J.S. Molecular and Structural Characterization of Barley Vernalization Genes. Plant Mol Biol 2005, 59, 449–467. [Google Scholar] [CrossRef]
- Vaschetto, L.M. Miniature Inverted-Repeat Transposable Elements (MITEs) and Their Effects on the Regulation of Major Genes in Cereal Grass Genomes. Molecular Breeding 2016, 36, 30. [Google Scholar] [CrossRef]
- Dai, S.; Hou, J.; Qin, M.; Dai, Z.; Jin, X.; Zhao, S.; Dong, Y.; Wang, Y.; Wu, Z.; Lei, Z. Diversity and Association Analysis of Important Agricultural Trait Based on Miniature Inverted-Repeat Transposable Element Specific Marker in Brassica Napus L. Oil Crop Science 2021, 6, 28–34. [Google Scholar] [CrossRef]
- Poretti, M.; Praz, C.R.; Meile, L.; Kälin, C.; Schaefer, L.K.; Schläfli, M.; Widrig, V.; Sanchez-Vallet, A.; Wicker, T.; Bourras, S. Domestication of High-Copy Transposons Underlays the Wheat Small RNA Response to an Obligate Pathogen. Mol Biol Evol 2020, 37, 839–848. [Google Scholar] [CrossRef]
- Castanera, R.; Vendrell-Mir, P.; Bardil, A.; Carpentier, M.; Panaud, O.; Casacuberta, J.M. Amplification Dynamics of Miniature Inverted-repeat Transposable Elements and Their Impact on Rice Trait Variability. The Plant Journal 2021, 107, 118–135. [Google Scholar] [CrossRef]
- Ye, C.; Ji, G.; Liang, C. DetectMITE: A Novel Approach to Detect Miniature Inverted Repeat Transposable Elements in Genomes. Sci Rep 2016, 6, 19688. [Google Scholar] [CrossRef]
- Yang, G. MITE Digger, an Efficient and Accurate Algorithm for Genome Wide Discovery of Miniature Inverted Repeat Transposable Elements. BMC Bioinformatics 2013, 14, 186. [Google Scholar] [CrossRef]
- Hu, J.; Zheng, Y.; Shang, X. MiteFinder: A Fast Approach to Identify Miniature Inverted-Repeat Transposable Elements on a Genome-Wide Scale. In Proceedings of the 2017 IEEE International Conference on Bioinformatics and Biomedicine (BIBM); IEEE, November 2017; pp. 164–168.
- Satovic, E.; Cvitanic, E.T.; Plohl, M. Tools and Databases for Solving Problems in Detection and Identification of Repetitive DNA Sequences. Period Biol 2020, 121–122, 7–14. [Google Scholar] [CrossRef]
- Gao, S.; Wang, B.; Xie, S.; Xu, X.; Zhang, J.; Pei, L.; Yu, Y.; Yang, W.; Zhang, Y. A High-Quality Reference Genome of Wild Cannabis Sativa. Hortic Res 2020, 7, 73. [Google Scholar] [CrossRef]
- Grassa, C.J.; Weiblen, G.D.; Wenger, J.P.; Dabney, C.; Poplawski, S.G.; Timothy Motley, S.; Michael, T.P.; Schwartz, C.J. A New Cannabis Genome Assembly Associates Elevated Cannabidiol (CBD) with Hemp Introgressed into Marijuana. New Phytol 2021, 230, 1665–1679. [Google Scholar] [CrossRef]
- Seabold, S.; Perktold, J. Statsmodels: Econometric and Statistical Modeling with Python; 2010.
- Virtanen, P.; Gommers, R.; Oliphant, T.E.; Haberland, M.; Reddy, T.; Cournapeau, D.; Burovski, E.; Peterson, P.; Weckesser, W.; Bright, J.; et al. SciPy 1.0: Fundamental Algorithms for Scientific Computing in Python. Nat Methods 2020, 17, 261–272. [Google Scholar] [CrossRef]
- Kanehisa, M.; Sato, Y.; Morishima, K. BlastKOALA and GhostKOALA: KEGG Tools for Functional Characterization of Genome and Metagenome Sequences. J Mol Biol 2016, 428, 726–731. [Google Scholar] [CrossRef] [PubMed]
- Kanehisa, M.; Sato, Y. KEGG Mapper for Inferring Cellular Functions from Protein Sequences. Protein Science 2020, 29, 28–35. [Google Scholar] [CrossRef] [PubMed]
- Chen, J.; Hu, Q.; Zhang, Y.; Lu, C.; Kuang, H. P-MITE: A Database for Plant Miniature Inverted-Repeat Transposable Elements. Nucleic Acids Res 2014, 42. [Google Scholar] [CrossRef] [PubMed]
- Lu, C.; Chen, J.; Zhang, Y.; Hu, Q.; Su, W.; Kuang, H. Miniature Inverted-Repeat Transposable Elements (MITEs) Have Been Accumulated through Amplification Bursts and Play Important Roles in Gene Expression and Species Diversity in Oryza Sativa. Mol Biol Evol 2012, 29, 1005–1017. [Google Scholar] [CrossRef]
- Onetto, C.A.; Ward, C.M.; Borneman, A.R. The Genome Assembly of Vitis Vinifera Cv. Shiraz. Aust J Grape Wine Res 2023, 2023. [Google Scholar] [CrossRef]
- Ou, S.; Su, W.; Liao, Y.; Chougule, K.; Agda, J.R.A.; Hellinga, A.J.; Lugo, C.S.B.; Elliott, T.A.; Ware, D.; Peterson, T.; et al. Benchmarking Transposable Element Annotation Methods for Creation of a Streamlined, Comprehensive Pipeline. Genome Biol 2019, 20. [Google Scholar] [CrossRef] [PubMed]
- Keidar-Friedman, D.; Bariah, I.; Kashkush, K. Genome-Wide Analyses of Miniature Inverted-Repeat Transposable Elements Reveals New Insights into the Evolution of the Triticum-Aegilops Group. PLoS One 2018, 13. [Google Scholar] [CrossRef] [PubMed]
- Rohilla, M.; Mazumder, A.; Saha, D.; Pal, T.; Begam, S.; Mondal, T.K. Genome-Wide Identification and Development of Miniature Inverted-Repeat Transposable Elements and Intron Length Polymorphic Markers in Tea Plant (Camellia Sinensis). Sci Rep 2022, 12. [Google Scholar] [CrossRef]
- Boutanaev, A.M.; Osbourn, A.E. Multigenome Analysis Implicates Miniature Inverted-Repeat Transposable Elements (MITEs) in Metabolic Diversification in Eudicots. Proceedings of the National Academy of Sciences 2018, 115, E6650–E6658. [Google Scholar] [CrossRef]
- Braich, S.; Baillie, R.C.; Spangenberg, G.C.; Cogan, N.O.I. A New and Improved Genome Sequence of Cannabis Sativa. GigaByte 2020, 2020, 1–13. [Google Scholar] [CrossRef] [PubMed]
- Hadagali, S.; Stelmach-Wityk, K.; Macko-Podgórni, A.; Cholin, S.; Grzebelus, D. Polymorphic Insertions of DcSto Miniature Inverted-Repeat Transposable Elements Reveal Genetic Diversity Structure within the Cultivated Carrot. J Appl Genet 2024. [Google Scholar] [CrossRef] [PubMed]
- Chang, R.-Y.; O’Donoughue, L.S.; Bureau, T.E. Inter-MITE Polymorphisms (IMP): A High Throughput Transposon-Based Genome Mapping and Fingerprinting Approach. Theoretical and Applied Genetics 2001, 102, 773–781. [Google Scholar] [CrossRef]
- Studer, A.; Zhao, Q.; Ross-Ibarra, J.; Doebley, J. Identification of a Functional Transposon Insertion in the Maize Domestication Gene Tb1. Nat Genet 2011, 43, 1160–1163. [Google Scholar] [CrossRef]
- Feng, Y. Plant MITEs: Useful Tools for Plant Genetics and Genomics. Genomics Proteomics Bioinformatics 2003, 1, 90–100. [Google Scholar] [CrossRef]
- VanBuren, R.; Man Wai, C.; Wang, X.; Pardo, J.; Yocca, A.E.; Wang, H.; Chaluvadi, S.R.; Han, G.; Bryant, D.; Edger, P.P.; et al. Exceptional Subgenome Stability and Functional Divergence in the Allotetraploid Ethiopian Cereal Teff. Nat Commun 2020, 11, 884. [Google Scholar] [CrossRef] [PubMed]
- Devos, K.M.; Qi, P.; Bahri, B.A.; Gimode, D.M.; Jenike, K.; Manthi, S.J.; Lule, D.; Lux, T.; Martinez-Bello, L.; Pendergast, T.H.; et al. Genome Analyses Reveal Population Structure and a Purple Stigma Color Gene Candidate in Finger Millet. Nat Commun 2023, 14, 3694. [Google Scholar] [CrossRef]
- Yim, W.C.; Swain, M.L.; Ma, D.; An, H.; Bird, K.A.; Curdie, D.D.; Wang, S.; Ham, H.D.; Luzuriaga-Neira, A.; Kirkwood, J.S.; et al. The Final Piece of the Triangle of U: Evolution of the Tetraploid Brassica Carinata Genome. Plant Cell 2022, 34, 4143–4172. [Google Scholar] [CrossRef] [PubMed]
- Wang, X.; Chen, S.; Ma, X.; Yssel, A.E.J.; Chaluvadi, S.R.; Johnson, M.S.; Gangashetty, P.; Hamidou, F.; Sanogo, M.D.; Zwaenepoel, A.; et al. Genome Sequence and Genetic Diversity Analysis of an Under-Domesticated Orphan Crop, White Fonio (Digitaria Exilis). Gigascience 2021, 10. [Google Scholar] [CrossRef]
- Zavallo, D.; Crescente, J.M.; Gantuz, M.; Leone, M.; Vanzetti, L.S.; Masuelli, R.W.; Asurmendi, S. Genomic Re-Assessment of the Transposable Element Landscape of the Potato Genome. Plant Cell Rep 2020, 39, 1161–1174. [Google Scholar] [CrossRef]
- Klai, K.; Zidi, M.; Chénais, B.; Denis, F.; Caruso, A.; Casse, N.; Mezghani Khemakhem, M. Miniature Inverted-Repeat Transposable Elements (MITEs) in the Two Lepidopteran Genomes of Helicoverpa Armigera and Helicoverpa Zea. Insects 2022, 13, 313. [Google Scholar] [CrossRef]
- Klai, K.; Chénais, B.; Zidi, M.; Djebbi, S.; Caruso, A.; Denis, F.; Confais, J.; Badawi, M.; Casse, N.; Mezghani Khemakhem, M. Screening of Helicoverpa Armigera Mobilome Revealed Transposable Element Insertions in Insecticide Resistance Genes. Insects 2020, 11, 879. [Google Scholar] [CrossRef] [PubMed]
- Martelossi, J.; Forni, G.; Iannello, M.; Savojardo, C.; Martelli, P.L.; Casadio, R.; Mantovani, B.; Luchetti, A.; Rota-Stabelli, O. Wood Feeding and Social Living: Draft Genome of the Subterranean Termite Reticulitermes Lucifugus (Blattodea; Termitoidae). Insect Mol Biol 2023, 32, 118–131. [Google Scholar] [CrossRef]
- Depotter, J.R.L.; Ökmen, B.; Ebert, M.K.; Beckers, J.; Kruse, J.; Thines, M.; Doehlemann, G. High Nucleotide Substitution Rates Associated with Retrotransposon Proliferation Drive Dynamic Secretome Evolution in Smut Pathogens. Microbiol Spectr 2022, 10. [Google Scholar] [CrossRef] [PubMed]
- Fouché, S.; Badet, T.; Oggenfuss, U.; Plissonneau, C.; Francisco, C.S.; Croll, D. Stress-Driven Transposable Element De-Repression Dynamics and Virulence Evolution in a Fungal Pathogen. Mol Biol Evol 2020, 37, 221–239. [Google Scholar] [CrossRef] [PubMed]
Figure 1.
Whole genome alignment between Cannabis sativa JL a.k.a. ASM1303036v1 (GCA_013030365.1) and Cannabis sativa CBDRx a.k.a. cs10 (GCF_900626175.2) chromosomes. Reciprocal best placed alignments are shown in green (forward) and purple (reverse) connectors, minimum alignment size was set in 10000bp. Chromosome Number and NCBI sequence accession codes are as it follows: In JL genome: chromosome 1:CM022965.1, 2:CM022966.1, 3:CM022967.1, 4:CM022968.1, 5:CM022969.1, 6:CM022970.1, 7:CM022971.1, 8:CM022972.1, 9:CM022973.1, X:CM022974.1; in CBDRx genome; chromosome 1:NC_044371.1, 2:NC_044375.1, 3:NC_044372.1, 4:NC_044373.1, 5:NC_044374.1, 6:NC_044377.1, 7:NC_044378.1, 8:NC_044379.1, 9:NC_044376.1, X:NC_044370.1.

Figure 2.
Patterns of MITE distribution in Cannabis sativa JL (blue) and CBDRx (orange) chromosomes. Chromosomes are referred to by their sequence accession code, with the chromosome number in parentheses. The vertical axis indicates the cumulative number of MITEs located in each chromosome interval. The horizontal axis represents the chromosome length divided into ten equal sections.
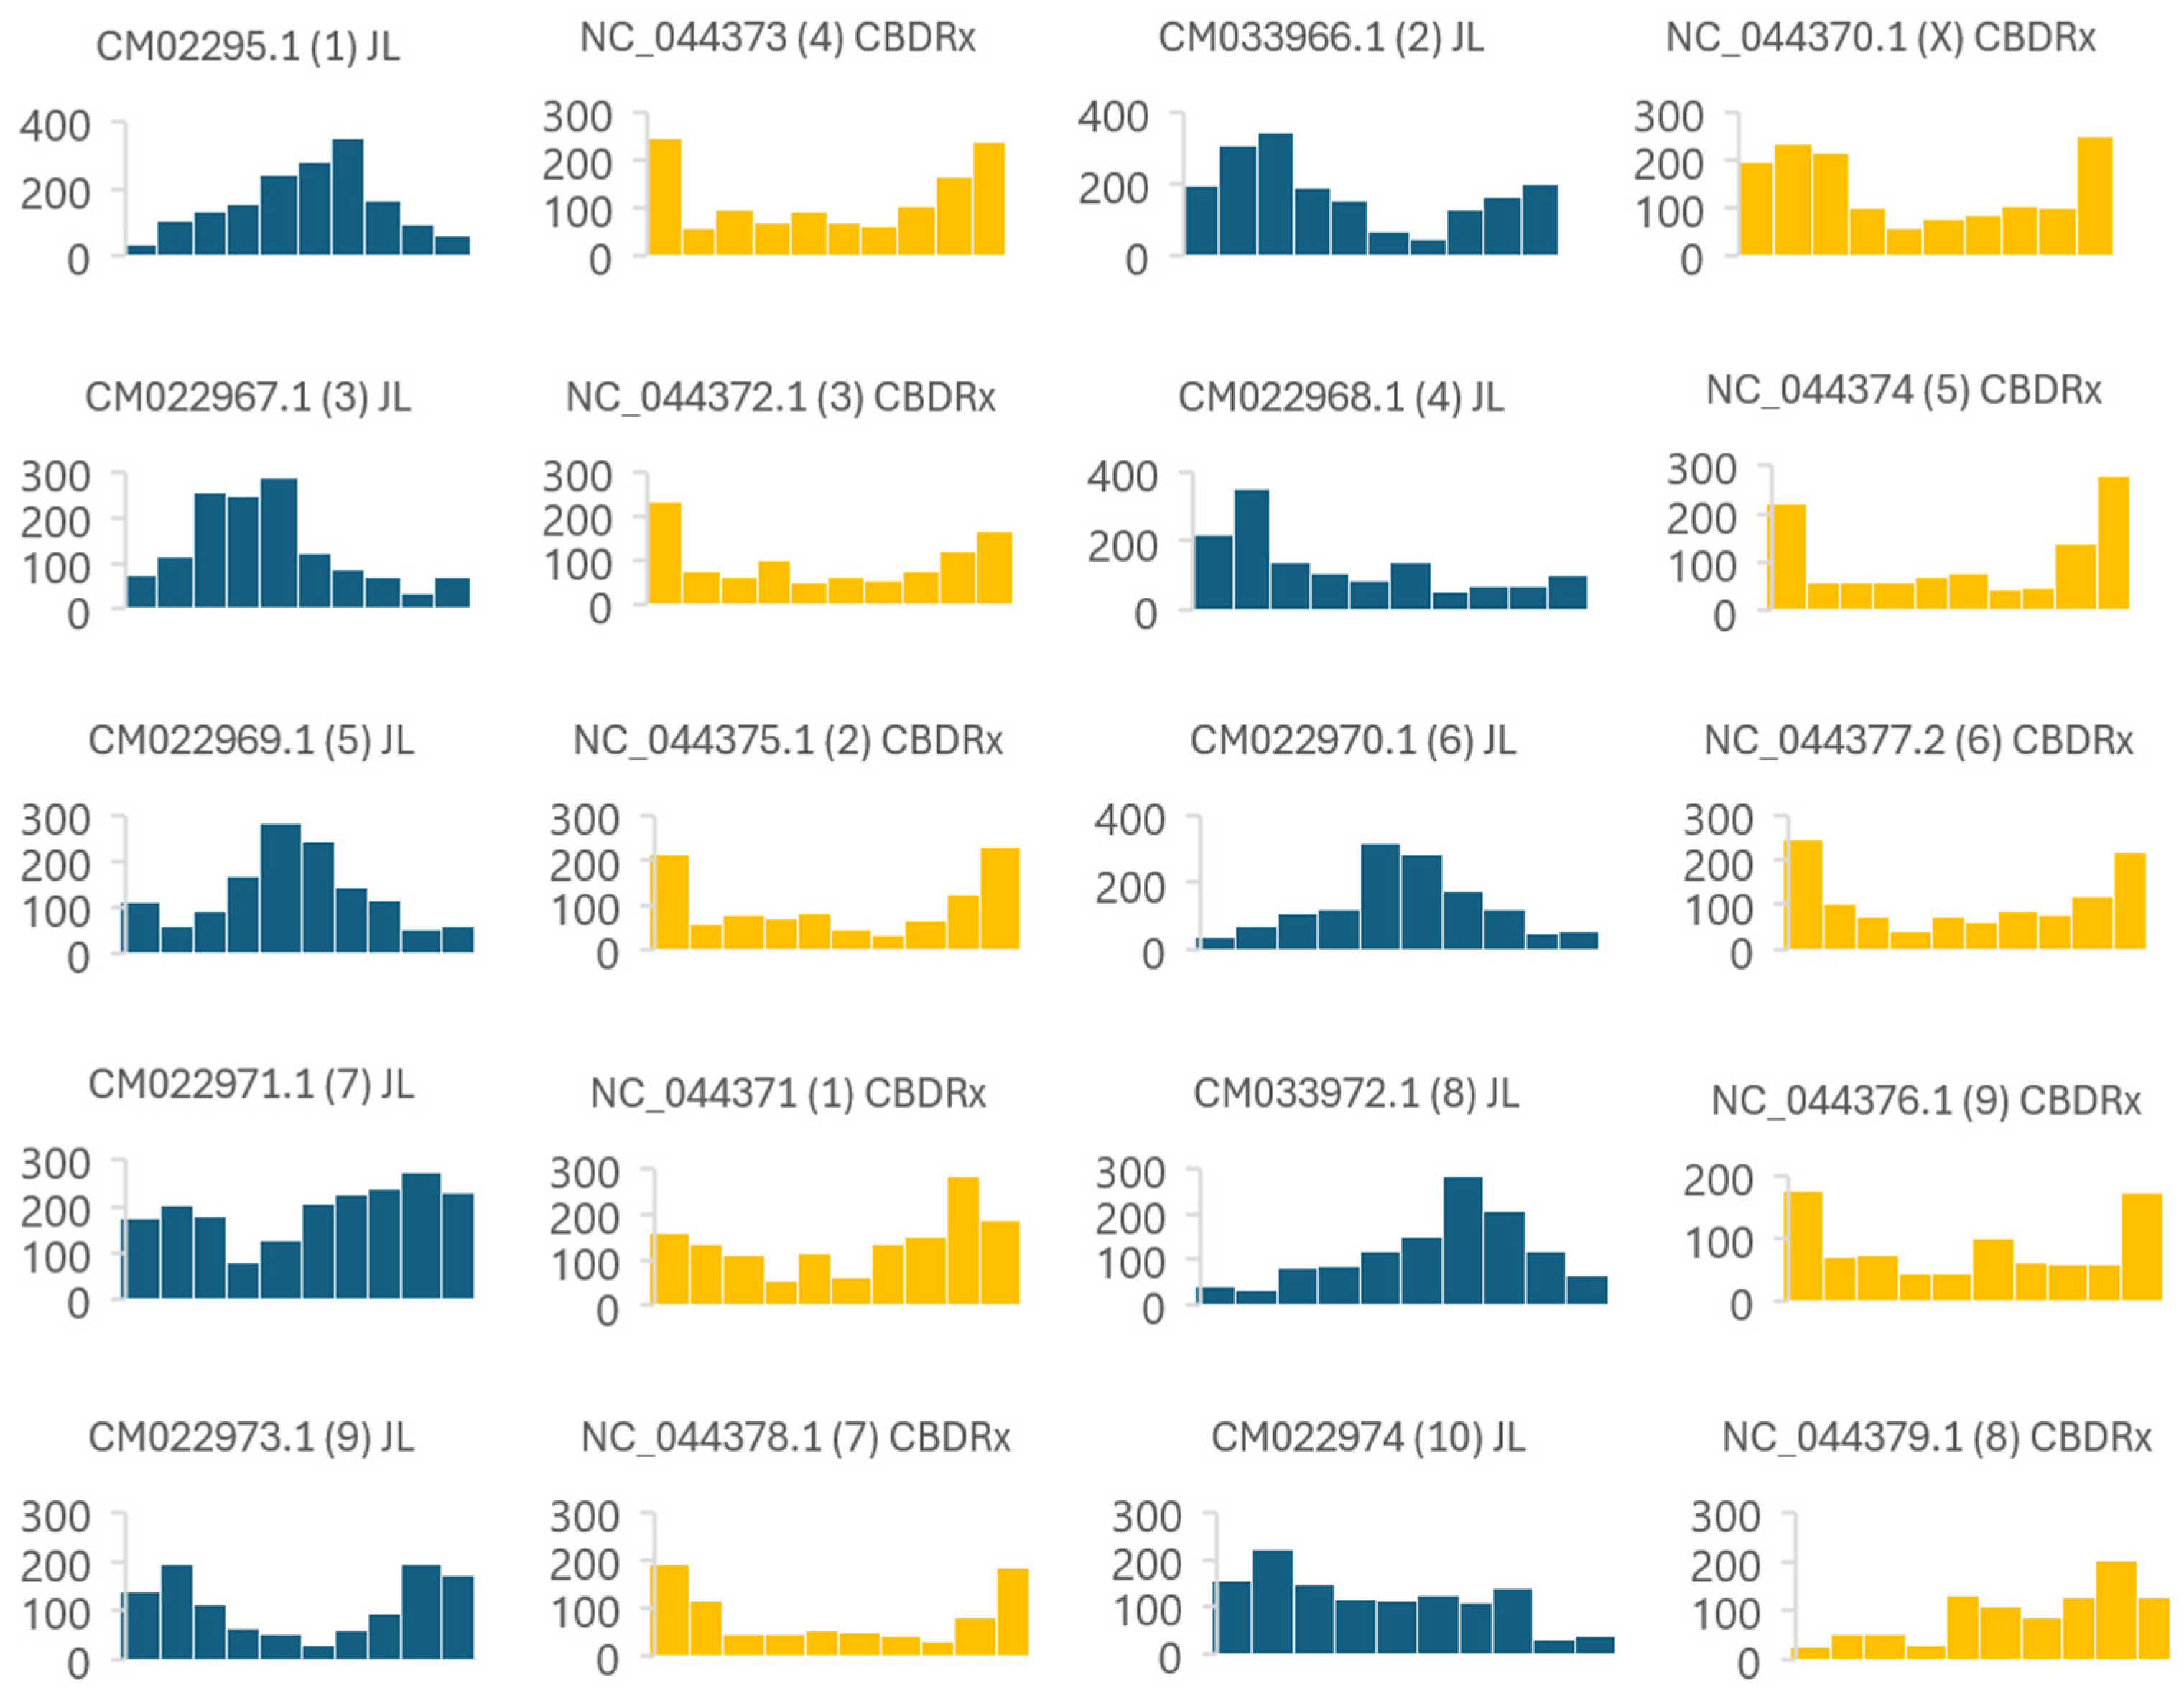
Figure 3.
Functional annotation of 127 genes (entries) located near (less than 1000bp) CBDRx genome specific MITEs against BRITE hierarchical groups.
Figure 3.
Functional annotation of 127 genes (entries) located near (less than 1000bp) CBDRx genome specific MITEs against BRITE hierarchical groups.
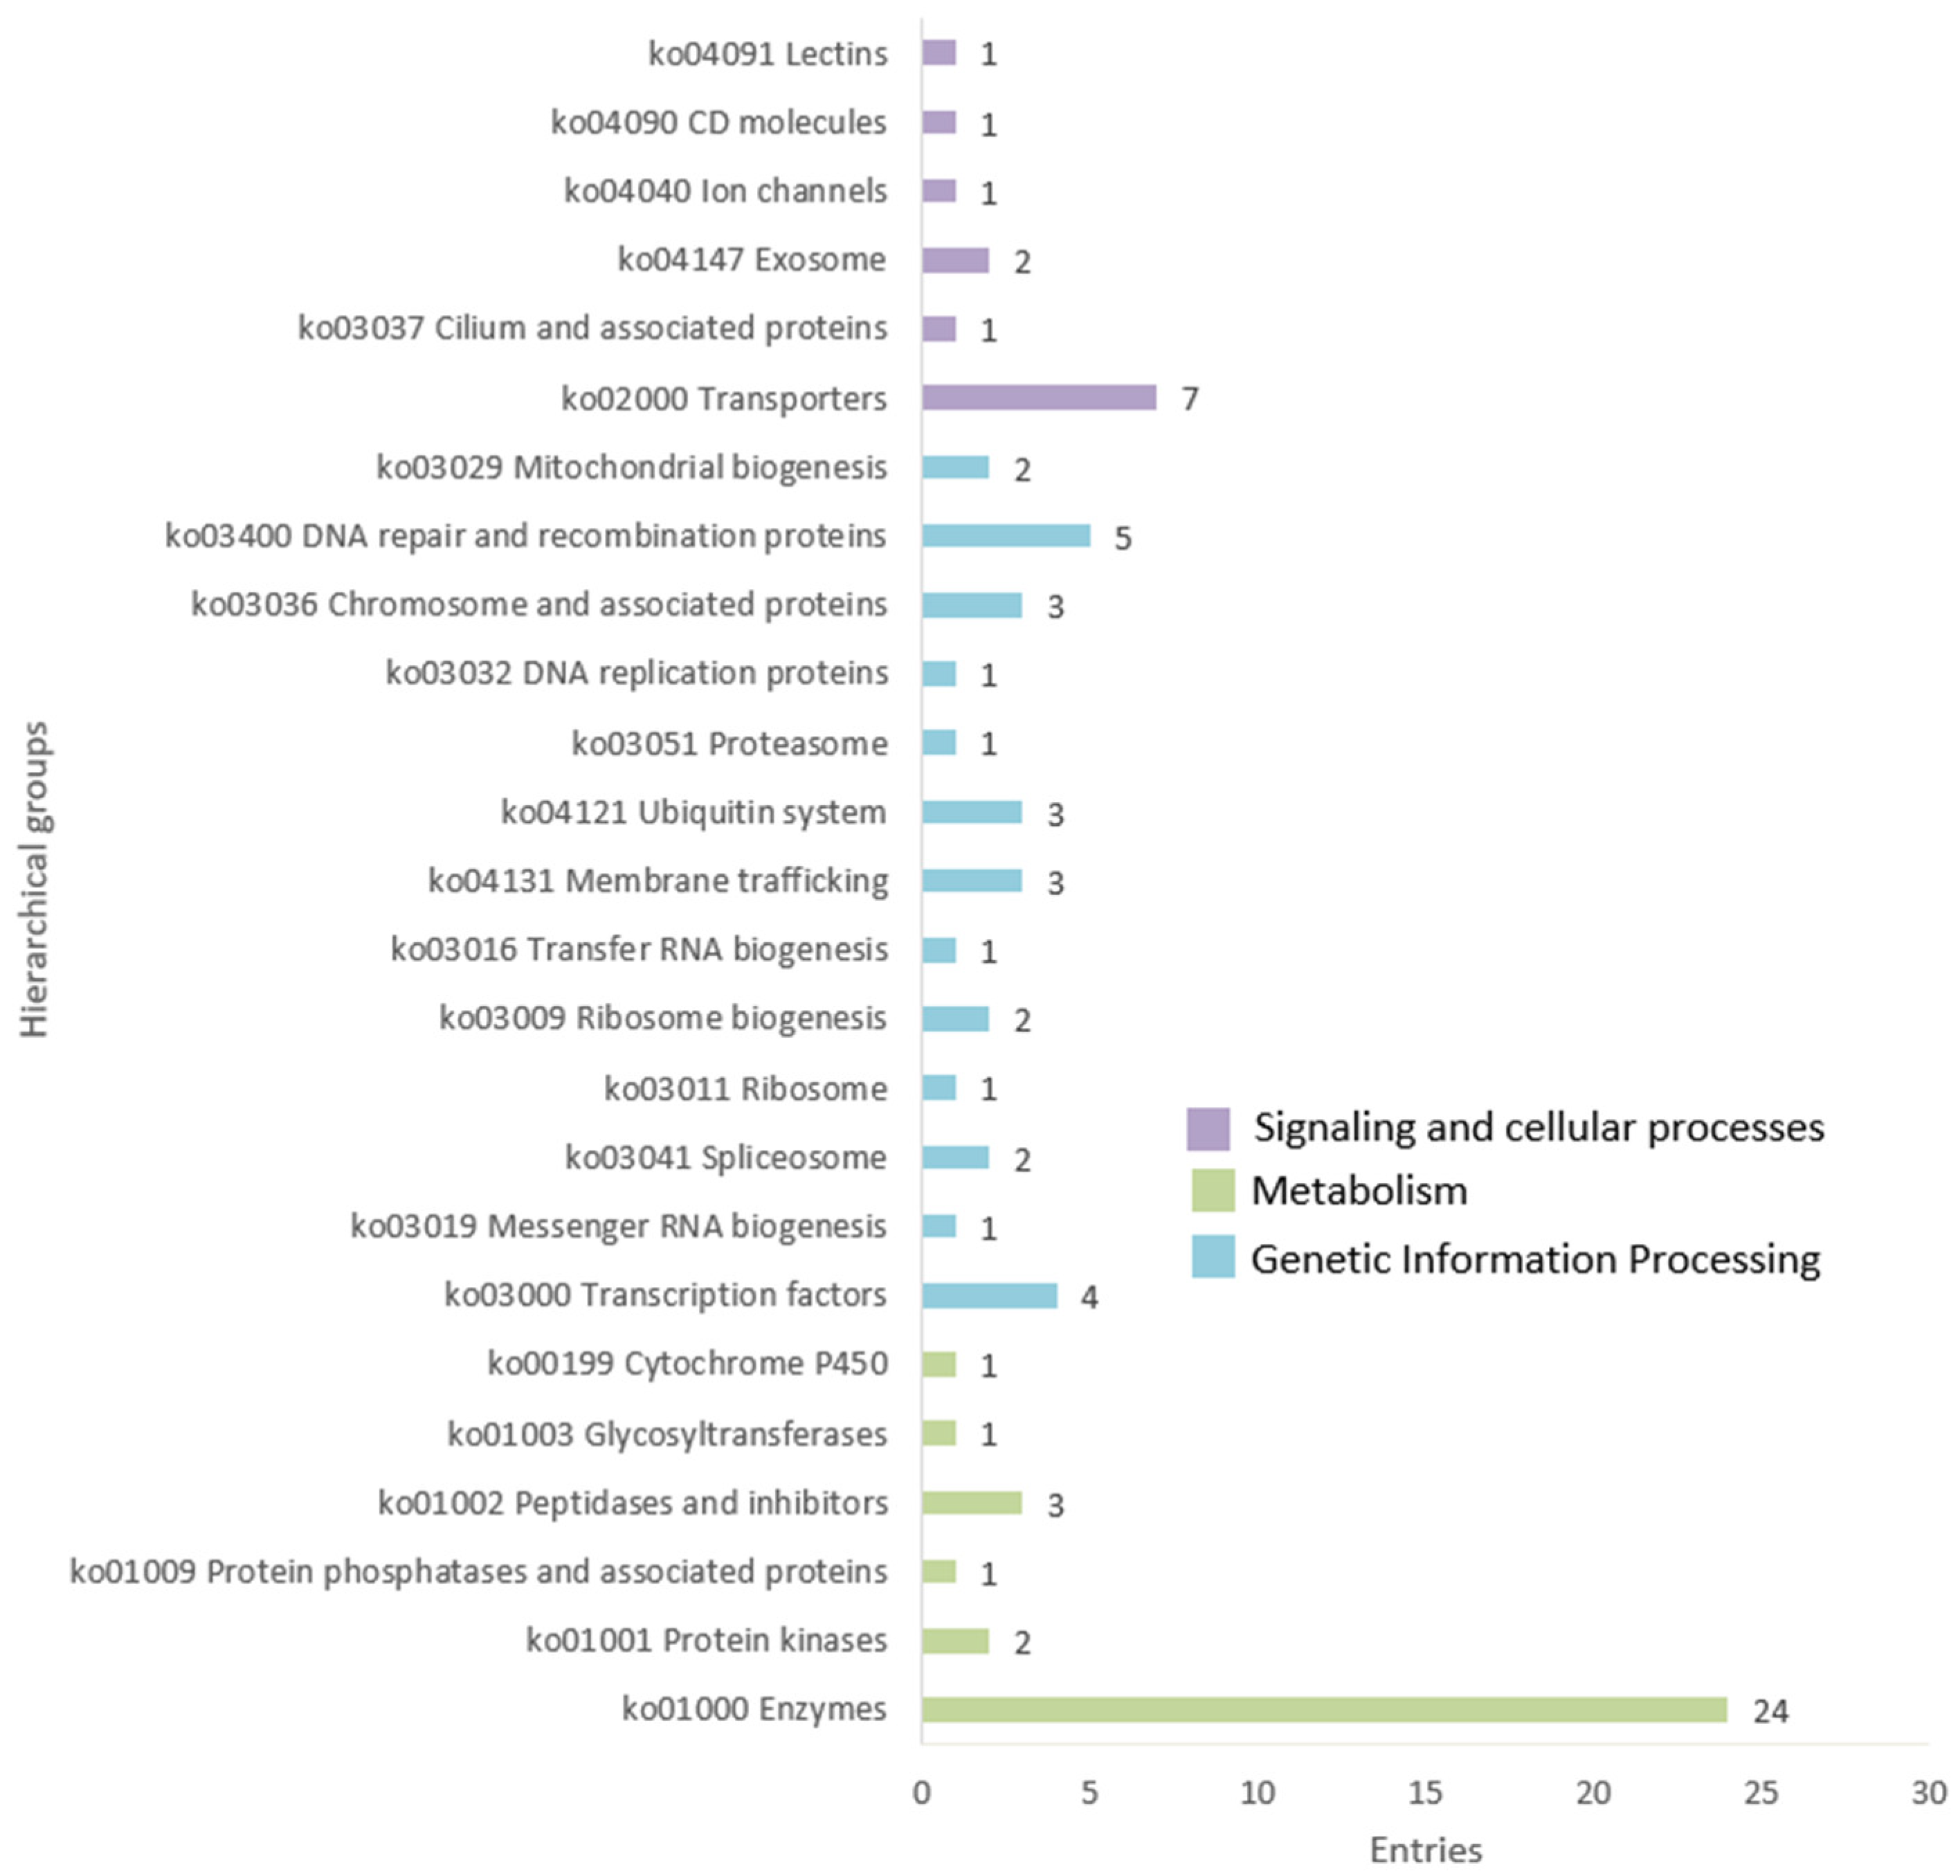
Figure 4.
Organization of synthenic regions and MITEs within CM022965.1 and NC_044373 Cannabis sativa chromosomes. In middle, synthenic alignment between Cannabis sativa JL chromosome CM022965.1 (1) and CBDRx chromosome NC_044373.1 (4). Reciprocal best placed alignments are shown in light green (forward) and purple (reverse) connectors, minimum alignment size was set in 10000bp. In NC_044373 gene content is also indicated in dark green. In up and botton, patterns of MITE distribution in JL chromosome CM022965.1 (blue) and CBDRx chromosome NC_044373.1 (orange). The vertical axis indicates the number of MITEs located in each chromosome interval. The horizontal axis represents the chromosome length divided into ten equal sections.
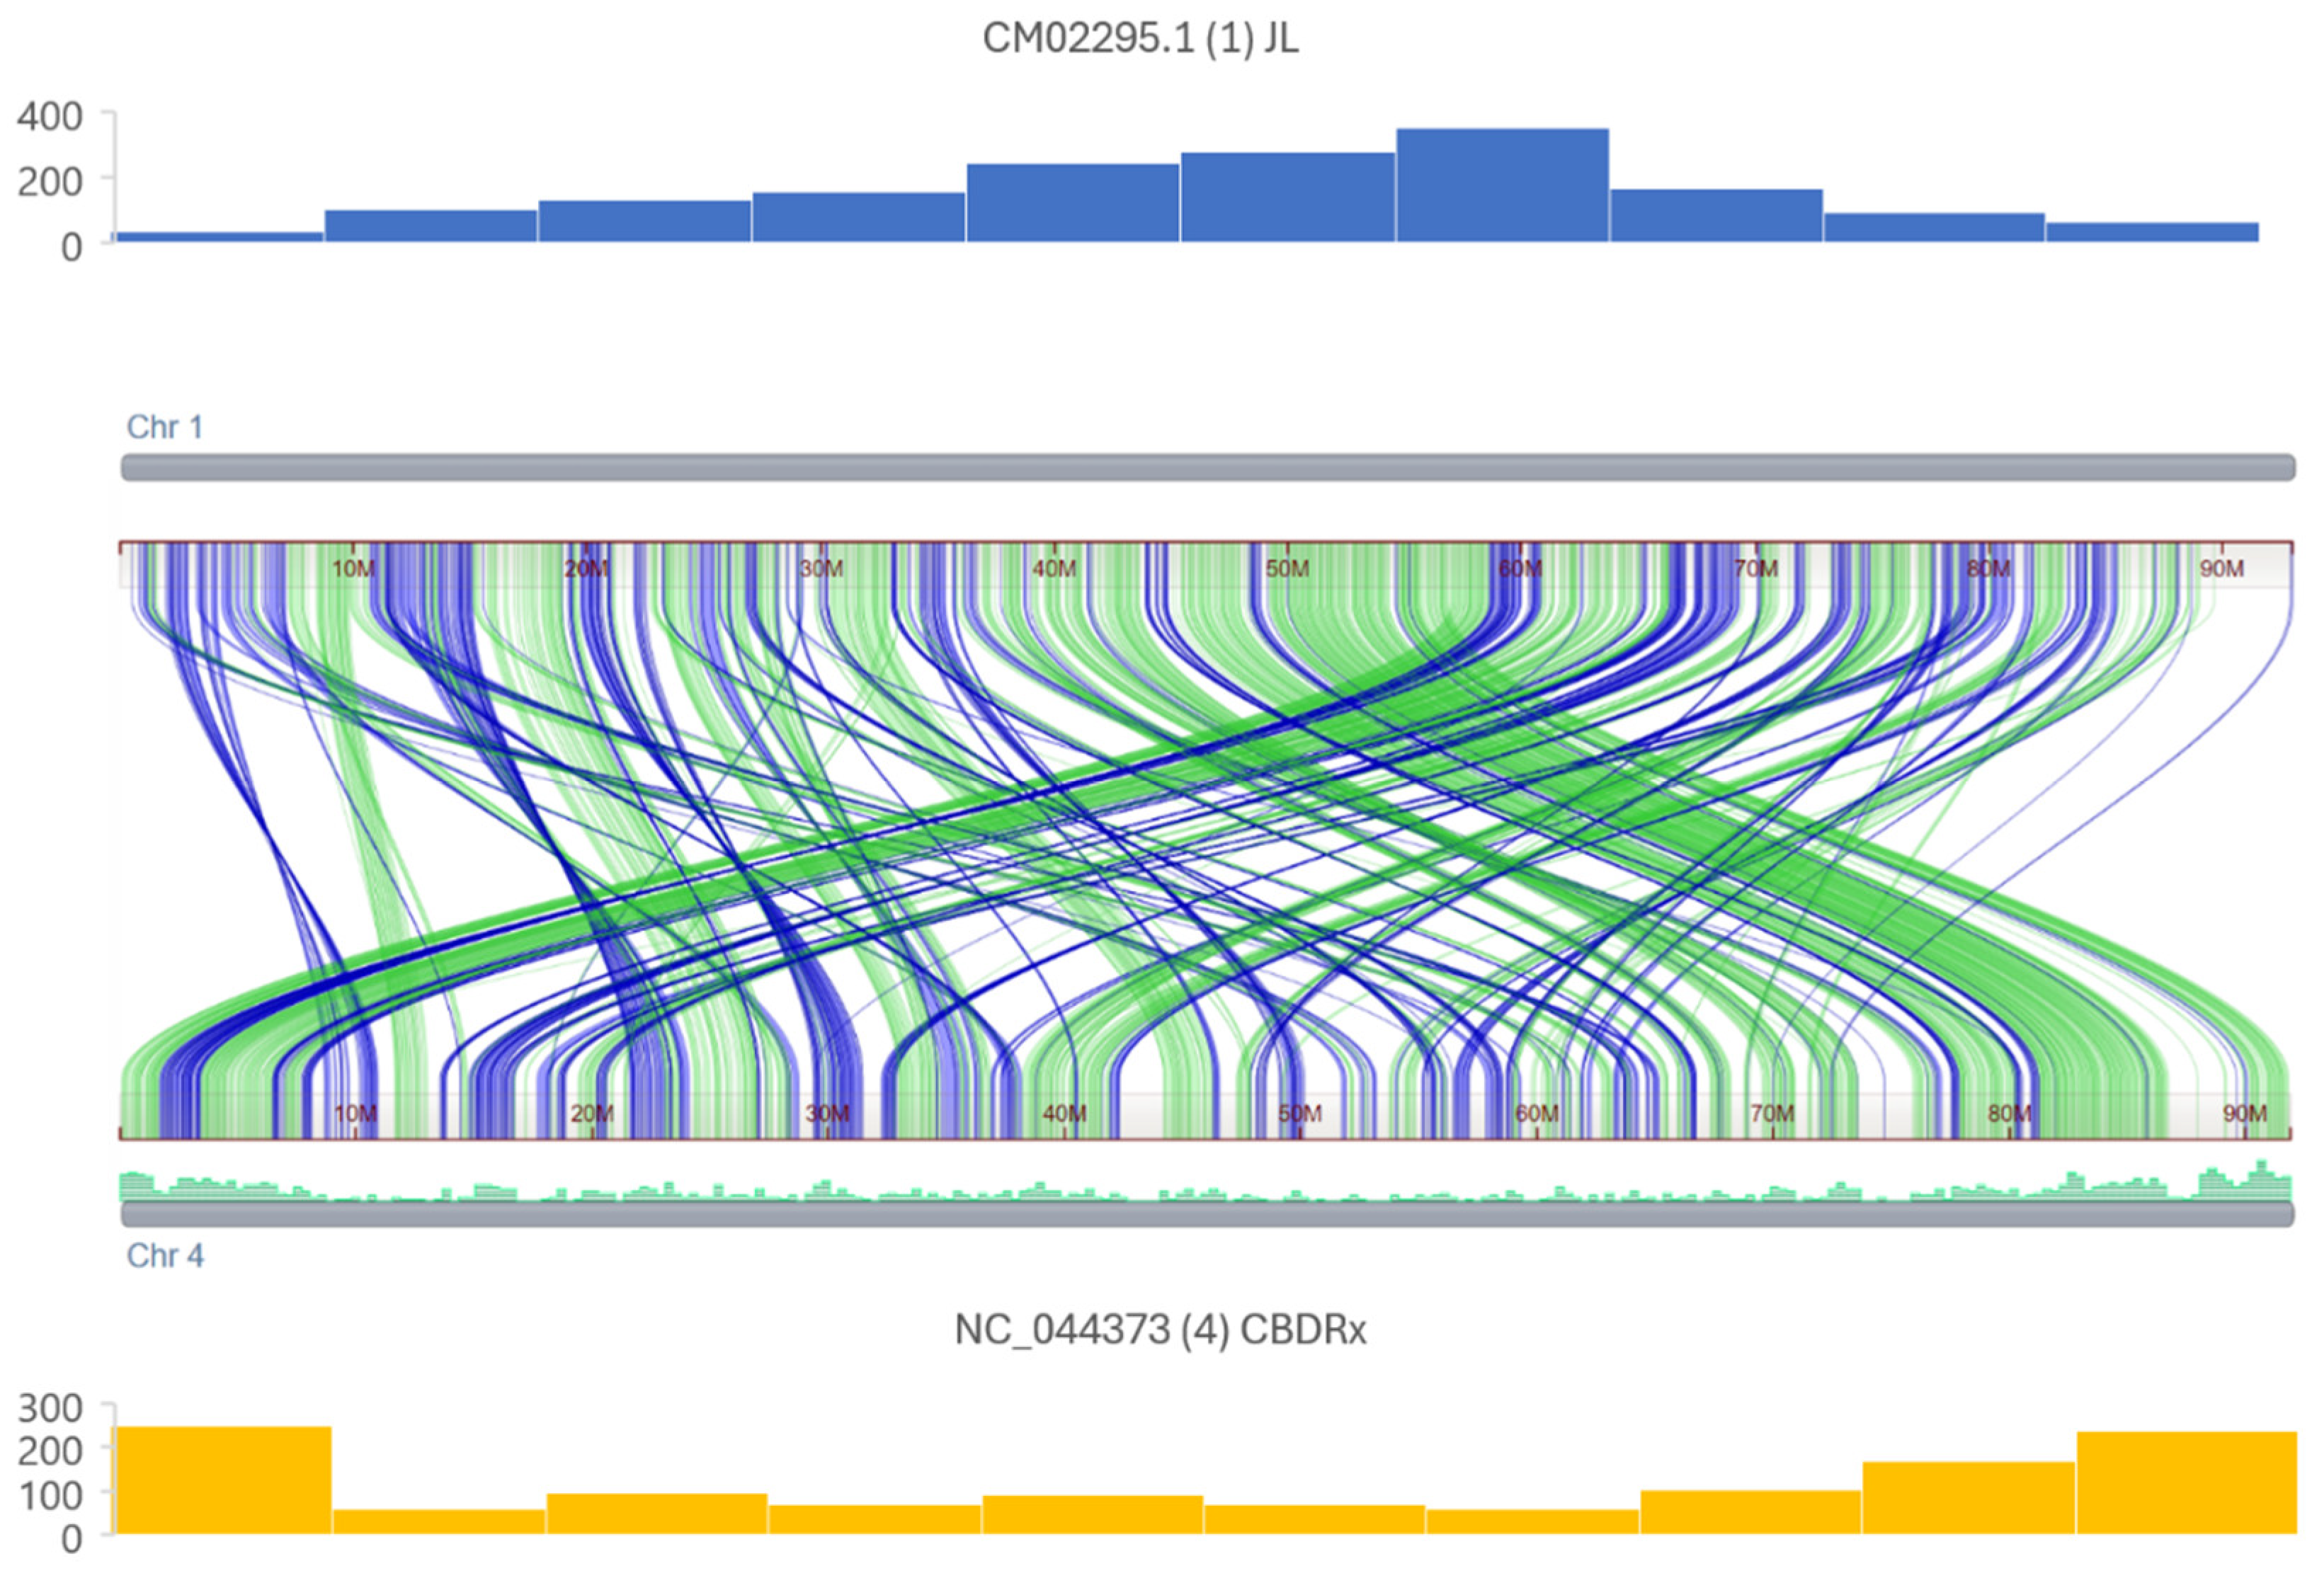

Table 1.
Frequency of MITEs (number of MITEs per Mb) in the chromosomes of Cannabis sativa JL and CBDRx genomes.
Table 1.
Frequency of MITEs (number of MITEs per Mb) in the chromosomes of Cannabis sativa JL and CBDRx genomes.
| CBDRx | JL | |||||||
|---|---|---|---|---|---|---|---|---|
| Chr. Accession | Mb | MITEs | MITEs/Mb | Chr. Accesion | Mb | MITEs | MITEs/Mb | |
| NC_044371.1 | 101,21 | 1394 | 13 | CM022971.1 | 80,62 | 1934 | 23 | |
| NC_044375.1 | 96,35 | 998 | 10 | CM022969.1 | 83,00 | 1327 | 15 | |
| NC_044372.1 | 94,67 | 997 | 10 | CM022967.1 | 89,82 | 1370 | 15 | |
| NC_044373.1 | 91,91 | 1201 | 13 | CM022965.1 | 93,00 | 1612 | 17 | |
| NC_044374.1 | 88,18 | 1050 | 11 | CM022968.1 | 83,22 | 1320 | 15 | |
| NC_044377.1 | 79,34 | 1099 | 13 | CM022970.1 | 82,47 | 1334 | 16 | |
| NC_044378.1 | 71,24 | 844 | 11 | CM022973.1 | 69,09 | 1104 | 15 | |
| NC_044379.1 | 64,62 | 929 | 14 | CM022974.1 | 54,53 | 1192 | 21 | |
| NC_044376.1 | 61,56 | 861 | 13 | CM022972.1 | 70,97 | 1177 | 16 | |
| NC_044370.1 | 104,99 | 1423 | 13 | CM022966.1 | 91,28 | 1791 | 19 | |
| Totals | 854,49 | 10903 | 12,1 | 807,90 | 14444 | 17,2 1 | ||
(1) The data include chromosome sizes (Mb), and the total number of MITEs identified in each chromosome.”.
Disclaimer/Publisher’s Note: The statements, opinions and data contained in all publications are solely those of the individual author(s) and contributor(s) and not of MDPI and/or the editor(s). MDPI and/or the editor(s) disclaim responsibility for any injury to people or property resulting from any ideas, methods, instructions or products referred to in the content. |
© 2024 by the authors. Licensee MDPI, Basel, Switzerland. This article is an open access article distributed under the terms and conditions of the Creative Commons Attribution (CC BY) license (http://creativecommons.org/licenses/by/4.0/).
Copyright: This open access article is published under a Creative Commons CC BY 4.0 license, which permit the free download, distribution, and reuse, provided that the author and preprint are cited in any reuse.


