Submitted:
05 December 2024
Posted:
05 December 2024
Read the latest preprint version here
Abstract
Dyslexia is a learning disorder impacting reading, writing, calculation, memory, and spelling abilities. It is a neurodevelopmental condition affecting approximately 5-10% of the population. The use of eye tracking combined with machine learning algorithms for dyslexia detection is an emerging and promising approach. This method has shown high accuracy in diagnosing dyslexia among students without the need for traditional classification techniques. The article explores how this innovative technique is utilized by various medical professionals to identify dyslexia in individuals to enhance their quality of life. Challenges related to reading, writing, speaking, and spelling are common among many individuals; hence, the utilization of eye-tracking analysis and machine learning methods for dyslexia identification is crucial. A novel supervised learning classifier approach will be introduced based on online data consisting of eye-tracking reading videos from 98 dyslexic and 88 non-dyslexic subjects. Frequency spectrum analysis is conducted using a short-time Fourier transform to assess temporal frequency significance in spectral values with dimension reduction achieved through PCA. Dyslexia assessment typically involves evaluating an individual's reading, and language skills alongside cognitive and psychological aspects through experiments, observations of behavior patterns, and interviews with the individuals and their families. Electroencephalography (EEG) signals play a vital role in brain-computer interface activities; however, predicting dyslexia can be intricate and resource-intensive. To address this challenge, brain signal data from the Massive Open Online Courses (MOOC) dataset is harnessed to gauge comprehension levels during lecture videos by analyzing attention and mediation parameters based on power spectrum transformed EEG data features extraction followed by frequency bands classification using artificial intelligence for predictive purposes. Binary classification along with deep neural networks leveraging Keras and TensorFlow frameworks are employed in this study." Binary classification using deep learning has both advantages and disadvantages. This study aims to develop a framework for addressing regression issues by creating a deep neural network. The objective is to design a model capable of analyzing EEG brain signals to predict the presence of dyslexia indicators in individuals. This involves constructing a binary classifier to distinguish between dyslexic and non-dyslexic individuals, to enable early detection for timely interventions. Accurate diagnosis is crucial not only for identifying dyslexia but also for ruling out other conditions that may impact reading, writing, memory, and language skills. Through proper assessment and evaluation, dyslexia can be accurately identified, allowing affected individuals to receive necessary academic and life support. Evaluation metrics such as "Receive Operating Characteristic (ROC)" and Area Under Curve (AUC) will be employed to assess precision, recall, and F1-Score. Additionally, feature selection techniques will be utilized to model input variables from EEG signals about target features, aiding in distinguishing relevant from irrelevant information.
Keywords:
Dyslexia
; EEG Signal
; Frequency Bands
; Machine Learning
; Data Analytics
1. Introduction and Related Works
Dyslexia is unrelated to intelligence, and those affected can have average or above-average intellectual abilities. It is a lifelong condition that cannot be eradicated but can be effectively managed through appropriate interventions and support. It is estimated that dyslexia impacts approximately 5-10% of the population, and early detection and intervention can greatly enhance an individual's academic performance and overall quality of life.
Dyslexic individuals encounter difficulties in reading, writing, word formation, letter naming, numerical understanding, and color recognition. Consequently, dyslexia is a neurological condition that manifests as challenges in reading, writing, and spelling. The Yale Center for Dyslexia and Creativity consolidates research on dyslexia1, shedding light on its nature and effects on individuals. Numerous publications delve into defining the scientific aspects of dyslexia – from diagnosis to treatment – categorizing them as follows:
"Overcoming Dyslexia" [1] provides a detailed exploration of dyslexia's causes, diagnosis methods, and practical strategies for parents, educators, and individuals with dyslexia.
"Dyslexia: A Practitioner's Handbook" [2] offers an extensive overview of dyslexia incorporating contemporary research findings along with assessment techniques and treatment approaches.
"Understanding Dyslexia and Other Learning Disabilities" [3] presents insights into dyslexia alongside other learning disorders concerning their origins, identification procedures, diagnostic criteria, and available treatments.
"The Dyslexic Advantage" [4] challenges conventional views by highlighting the strengths and benefits possessed by individuals with dyslexia rather than focusing solely on deficits.
"Multisensory Teaching of Basic Language Skills" outlines effective multisensory teaching methods tailored for individuals with dyslexia or other language-based learning challenges.
Dyslexia stands out as one of the most impactful learning disorders affecting an estimated 5-12% of the population [5-7]. This condition significantly hampers educational achievements as well as the social-emotional well-being of those affected.
Despite having normal vision and intelligence levels comparable to non-dyslexic individuals, scientific indicators such as difficulty in pronouncing unfamiliar words due to auditory issues are common among people with dyslexia. Notably different eye movements during reading compared to typical readers have been observed in individuals with dyslexia [5]. Research continues to explore these differences associated with eye movements to better understand the underlying difficulties posed by this condition. Deciphering and identifying printed words during reading is a crucial aspect [5, 6]. Utilizing speech as a means to stimulate brain functions and enhance the quality of life for individuals with disabilities has been explored in laboratory experiments focusing on speech imagery for practical applications.
The integration of deep learning through electroencephalography (EEG) has shown promising results in speech assessment compared to conventional machine learning techniques [8]. The realm of artificial intelligence (AI) is increasingly being explored in healthcare and medicine, particularly concerning youth and children [12, 13].
Research has delved into various dyslexia groups, evaluating 89 children aged 8-12 using three machine learning technologies categorized as normal, neutral, or dyslexic. A study involving 2679 children aged 7-9 revealed a strong correlation between reading speed and accuracy. Moreover, an experimental approach incorporating 32 linguistic reading exercises for Spanish speakers included 3644 participants aged between 7-17 [11].
Further investigations on eye tracking technology employing Random Forest (RF) and Support Vector Machine (SVM) classifiers have highlighted SVM as the preferred choice due to its higher accuracy compared to the Random Forest model [12, 13]. Early detection models for dyslexia aim to identify symptoms such as delayed speech development, challenges in acquiring new vocabulary, difficulty in word formation, or struggles with recalling letters, numbers, or colors before formal schooling begins [14].
Early diagnosis plays a pivotal role in offering timely assessments and interventions for children with dyslexia, potentially leading to improved outcomes later in life. Studies by Al-Barhamtoshy and Motaweh underscore the significance of writing activities as indicative of dyslexia. Observations suggest that writing and typing tasks exhibit high sensitivity towards detecting dyslexia-related patterns in the left hemisphere of the brain compared to the right hemisphere. A study emphasizing Theta power spectrum alterations in the left frontal region of these children's brains further underlines its association with dyslexia indicators. Notably, an increase in Theta activity correlates with heightened mental workload [15]. A retrospective research endeavor involving EEG analysis during the COVID-19 pandemic focused on understanding EEG signal characteristics among 36 patients [16]. Our study utilizes machine learning and deep learning techniques to detect attention deficit, reading, and writing challenges through standard activities.
The subsequent sections will delve into the dataset we developed and the machine/deep learning models employed. Section 2 will detail the research methodology, while Section 3 will present our framework for analyzing and diagnosing dyslexia in comparison to others, along with the corresponding computed results. Section 4 will provide additional discussion and comparative assessments of related studies. Lastly, a summary and concluding remarks will be outlined in Section 5.
2. Research Methodology
In terms of research methodology, a systematic approach was adopted to identify relevant dyslexia issues and appropriate dataset domains. This involved defining digitized datasets and key deep-learning topics. Following the collection of digitized data, we studied and analyzed the most pertinent dyslexia indicators before implementing them in our work. Notably, EEG was used to interpret input signals from individuals with learning disabilities alongside conventional learners.
Data acquisition was facilitated through Massive Open Online Courses (MOOC) video clips to enable flexible learning opportunities. Subsequently, all data underwent comprehensive analysis involving processing, labeling, feature extraction, classification, and detection. The EEG data covered five bands of dyslexia indicators, with a preprocessing model employed to eliminate signal artifacts such as spikes or movements.
The methodological design encompassed sequential stages starting from data collection through to processing. Initial preprocessing steps focused on noise removal from EEG signals to ensure signal quality. Subsequently, cleaned EEG data underwent feature extraction utilizing Mel Frequency Cepstral Coefficients (MFCC), elliptic filters, and pass filters across five frequency bands. A central inquiry driving this study is the relationship between confusion and dyslexia since confusion plays a critical role in dyslexia detection. Individuals with dyslexia often experience confusion when reading or spelling due to their condition's nature; thus, an individual's threshold for confusion significantly impacts their frequency of errors.
The dataset utilized in this study was sourced from https://www.kaggle.com/wanghaohan/confused-eeg containing snippets from online courses offered by edX [17]. Brain activity recordings were obtained from ten university students who watched these courses.
To conclude this research effectively, it is essential to address key questions regarding the primary indicators utilized in predicting dyslexia bands among individuals. The effectiveness of utilizing deep learning in diagnosing dyslexia and the study of attention and mediation data in this context is explored. The paper investigates key features that differentiate dyslexia from neurotypical individuals. Additionally, eye tracking during reading is employed to identify children at risk of dyslexia and long-term reading difficulties. By capturing real-time eye movements during reading, accurate assessments of the reading process can be obtained without requiring unrelated responses from the subject. This method offers a continuous record of reading efficiency and precision, distinguishing it from current screening techniques.
3. Model Architecture
The model architecture outlined in Figure 1 depicts the sequential stages of the proposed dyslexia classification framework. Beginning with data collection, the framework progresses through preprocessing, analysis, classification, and evaluation phases. Preprocessing involves utilizing smooth and band-pass filters across five frequency bands: Delta (0.5-4 Hz), Theta (4-8 Hz), Alpha (8-14 Hz), Beta (14-30 Hz), and Gamma (30-42 Hz). Mel Frequency Cepstral Coefficients (MFCCs) are applied to process EEG signals received from brain activity, leading to feature extraction for each band with corresponding labels denoting Dyslexia, Attention Deficit, or Autism.
The algorithm employs training and evaluation via cross-validation to establish the target model for prediction. This iterative process involves training the model and analyzing output results across multiple validation cycles defined by iteration values. Hyperparameters are utilized for dyslexic prediction comparison, with metrics such as F1 measure, precision, recall, and overall accuracy assessed using a confusion matrix. Considering potential data imbalance issues affecting accuracy interpretation, Algorithm 1 details the training and cross-validation procedures implemented in this study.
| Algorithm 1 Training and cross-validation evaluation |
|
Begin For i =1, 2, ... iteration-cycles Do For a suitable hyperparameters Do Predict suitable cross-validation folds // five cross-validation is the default For each cross-validation fold Do Select suitable classifier Fit and Compile the model with data Store results with the configuration Prepare, Compile, and Store Confusion Matrix End End End Store experimental results according to the precision, recall, and F-measure End |
Early detection of dyslexia is a prominent subject in the upcoming discussions involving experts from neuro and computational sciences. Machine learning models have shown promise in distinguishing dyslexic readers and individuals with reading difficulties through eye movement analysis. To enhance this identification process, a hybrid model combining Random Forest (RF) as a crucial feature with a Support Vector Machine (SVM) classifier has been proposed. This study delves into dyslexia, characterized by challenges in reading and understanding written content.
Our research focuses on analyzing brain signals using Electroencephalography (EEG) channels located in the left hemisphere (FP1, F3, F7, C3, T7, P3, P7, O1) and the right hemisphere (FP2, F4, F8, C4, T8, P4, P8, O2). The brain signals are divided into different bands using "Mel Frequency Cepstral Coefficients (MFCCs)". These bands include the Delta-band (Bd), Theta-band (Bt), Alpha-band (Ba), Beta-band (Bb), and Gamma-band (Bg), ordered from low to high frequencies. By applying thresholds for Theta, Beta/Theta, and Gamma bands to identify dyslexic conditions within each band bi generated by MFCCs analysis.
Following processing of all bands derived from MFCC analysis based on pre-defined thresholds for dyslexia criteria; individuals are categorized into either the dyslexic group di or normal group nj. The algorithm for Band Identification and Classification yields sets of dyslexic and normal participants. The experimental dataset utilized is deemed relatively clean with threshold values adjusted according to noise levels within the dataset.
|
Algorithm2: Bands Identification and Classification |
| Begin Result: D, N the set of dyslexic and normal people D ← {} N ← {} While has next band Do p ← next people band b1, b2, … b5 ← MFCC(p) For bi { b1, b2, … b5} Do If bi satisfies dyslexic-condition, Then d ← argmaxdi {| di ∩ bi | }; If | d bi| > Threshold Then D ← D U {di} Else // don’t satisfies dyslexic (i.e. normal) N ← N U {bi} Endif Endfor Return D, N End While End |
3.2. Dyslexia Prediction Model
A key shared symptom among the five identified bands related to dyslexia is eye tracking issues, such as scattering, attention problems, and confusion during various activities. The proposed approach involves gathering eye-tracking data from both dyslexic and non-dyslexic learners during teaching sessions, followed by the application of machine learning or deep learning algorithms to differentiate between individuals with dyslexia and those without. Attention plays a crucial role in addressing challenges associated with prolonged tasks, particularly in instances where individuals are required to wait before completing a specific assignment. Variances in brain wave signals have been observed between individuals with attention deficit hyperactivity disorder and those without [19], with studies focusing on evaluating the Theta Beta ratio in EEG brain signals [21-24]. Research indicates that this ratio tends to decrease during experimental observations. In analyzing each participant's EEG signal, the following parameters are taken into account:
- The duration of the brain signal recorded during the teaching session for each participant.
- The time interval of the received EEG signal (measured in seconds) is set at 120 seconds.
- Manual tagging and categorization of each participant's record into one of three groups: dyslexic, attention deficit, or autism.
- Examination of an attention deficit parameter within the signal interval for each participant.
3.2.1. Delta Waves
Delta waves represent brain waves that can vary significantly in speed, depending on their frequency measured in hertz (Hz). These slowest brain waves are commonly found in infants and young children and are associated with deep relaxation and rejuvenating sleep. Their presence is often noted in cases of brain traumas, learning difficulties, mental blocks, and severe ADHD symptoms. Inadequate production of delta waves leads to compromised sleep quality and an inability to properly restore both the body and mind. Adequate generation of delta waves supports immune function, natural healing processes, restorative sleep cycles, and a sense of complete rejuvenation.
3.2.2. Theta Waves
Theta waves fall within a frequency range of 4 to 8 Hz and occur when an individual is in a dream-like state or experiences transitions between sleep and wakefulness states. Referred to as the twilight state by some sources [5, 9, 10, 24], theta waves reflect a particular level of consciousness characterized by these oscillations between different states. Theta waves are generally associated with a lack of mental alertness, indicating that the individual is either overly relaxed or unfocused at that specific moment.
3.2.3. Alpha Waves
Alpha waves fall between theta and beta waves on the brain wave spectrum. These waves are typically present in healthy, awake adults when they are resting with their eyes closed, with frequencies ranging from 8 to 13 Hz. Neurologists often measure alpha rhythms at the back of the head while the patient's eyes are shut.
3.2.4. Beta Waves
Beta waves, with frequencies ranging from 14 to 30 Hz, suggest that an individual is concentrating on a specific task. They reflect alertness and focused mental activity. Hans Berger linked beta waves to attentive focus and identified three frequency ranges within beta rhythms: gamma (30–60 Hz), beta 1 (14–20 Hz), and beta 2 (21–30 Hz). Various potential functions of beta rhythms have been proposed, including synchronizing cortical representations, inhibiting movement, and motor planning, maintaining the status, signaling decision-making, and focusing action-selection network functions.
3.2.5. Gamma Waves
The fastest brain waves are gamma waves, with frequencies ranging from 30-42 Hz. These highly precise gamma waves play a key role in assessing people's perception and consciousness during conscious perception processes. They are particularly relevant for memory processes, attention, working memory, and long-term memory, as well as conditions such as schizophrenia, hallucinations, Alzheimer's disease, and epilepsy.
In refining dyslexic diagnoses following initial classification results that may lead to dual outcomes (dyslexic or non-dyslexic autistic), a refinement phase is crucial. The process involves analyzing bands b1 through b5 to identify band bi based on satisfying threshold conditions for Theta and Beta/Theta or Gamma. Classification accuracy is achieved by calculating averages for Theta band values, Beta/Theta ratios, and Gamma band values to derive an overall average parameter (a). In our study, it was determined that a value of a = 1.5 yielded the most optimal outcomes, as not all threshold criteria exceeded a demonstrated significance. Further computations are necessary to explore additional sub-correlations, such as Beta1 and Beta2, as well as Gamma1 and Gamma2. While not definitive in comparison to the threshold, this could potentially serve as an additional parameter for analysis [5, 9, 10, 24].
3.3. Frequencies Bands of Dyslexia and Diagnosis Refinement
Regarding Frequency Bands for Dyslexia, there is evidence indicating that individuals with dyslexia may display variations in neural activity within specific brain frequency bands. Various studies have identified differences associated with dyslexia across different frequency bands, summarized in Table 1.
Research has indicated that individuals with dyslexia might exhibit reduced beta activity waves in regions linked to language processing and phonological awareness within the left hemisphere of the brain. Similarly, decreased gamma activity has been observed in areas involved in language processing and phonological awareness among those with dyslexia. Additionally, alterations in alpha activity within parietal brain regions responsible for attention and spatial processing have been noted among individuals with dyslexia. Furthermore, an increase in delta activity within temporal brain regions related to auditory information processing has also been reported.
It is essential to acknowledge that these findings are not universally consistent across all studies and can vary depending on specific tasks and conditions utilized in prior research efforts. Further investigations are required to enhance our understanding of the neural mechanisms underlying dyslexia and their implications for reading and language challenges.
Unfortunately, due to differences in research methodologies and focal points regarding dyslexia-related neural correlates in frequency bands, a direct comparison of these studies is unfeasible. The indicators presented in Table 1 outline the connections between frequencies, bands, activities, brain regions involved, and markers for dyslexia.
As an option, we can offer general information about the research techniques applied to investigate the neural aspects of dyslexia. These methods may encompass functional magnetic resonance imaging (fMRI), magnetoencephalography (MEG), and electroencephalography (EEG). Through these approaches, researchers can observe brain activity in individuals with dyslexia as they engage in language-related tasks like reading or phonological awareness exercises. By scrutinizing patterns of neural activity, researchers can uncover insights into the fundamental mechanisms of dyslexia and how they contrast with typical reading abilities. It is essential to acknowledge that while these methods have their constraints, further investigation is necessary for a more comprehensive understanding of the neural correlates of dyslexia.
Moreover, EEG has the potential to disclose information about the overall brain condition associated with attention. Alpha (8–14 Hz) and Theta (4-8 Hz) frequency ranges have been correlated with activities related to attention. Variations in attention or cognitive involvement may be reflected by alterations in the intensity or synchronization of these frequency bands.
It is noteworthy that not all individuals with dyslexia manifest these characteristics, highlighting the need for additional research to fully grasp the neurological mechanisms at play in dyslexia. Furthermore, ongoing work in this area suggests that future breakthroughs could emerge. The amplitude of Theta and Gamma band signals from both hemispheres during language tasks and periods of rest are illustrated for males and females in Figure 2.
Despite being a relatively recent area of exploration, there is mounting evidence supporting the applicability of measuring mediation processes using EEG. Given that mediation involves cognitive and emotional processes, EEG can capture neural manifestations of these activities. For example, researchers have utilized EEG to explore cognitive control strategies utilized in mediation such as reaction suppression and conflict monitoring. Event-related potentials linked to conflict monitoring and error detection, like error-related negativity (ERN), can be identified through EEG recordings.
The EEG can provide insights into the psychological aspects of meditation by measuring brain activity related to emotional processing and regulation, such as the late positive potential (LPP) or frontal alpha asymmetry (FAA). Proper experimental design, data analysis methods, and integration with other assessments are crucial for accurate quantification of meditation and attention using EEG. This tool enables a detailed study of the neurological connections to meditation and attention by offering precise assessments of brain activity.
3.4. The Cost Criteria
Analyzing the likelihood of dyslexia helps classify individuals into class one (dyslexic) or class zero (normal) using traditional logistic regression models. The log function is employed in computational calculations, with cost criteria represented by an equation involving summation over all data points. Achieving accuracy in deep learning involves handling balanced or unbalanced datasets, with custom callbacks like ROC or AUC scores used to address dataset imbalances.
In the realm of neural networks' architecture, modern predictors can surpass human experts in detection accuracy through machine learning techniques within AI frameworks. Fine-tuning neural network architectures using Keras and TensorFlow libraries presents a challenge that may require multiple training iterations to optimize model performance. Determining the input layer dimension for neural networks relies on dataset characteristics; therefore, a function is needed to handle this issue efficiently. The optimization of network architecture involves deciding on the number of hidden layers and neurons for optimal performance. For these reasons, individuals may seek to explore their methods, conduct experiments, or adopt established architectural standards.
3.5. EEG Data Additional Processing
This section presents a typical additional function illustration. It outlines eight steps for developing an EEG band processing roadmap. Step 8 focuses on extracting and characterizing cortical alpha rhythm features for the sequence:
1. Load EEG data from the stream file and associate it with a list of channel names and corresponding bands' frequencies in Hertz.
2. Filter and process the data into a pass-band ranging from 1 to 42 Hz based on standard bands' frequencies.
3. Transform the data into a time series showing amplitudes and frequency oscillations within Alpha frequency bands using Theta, Delta, and Alpha bands.
4. Group the processed data into four microstates (A, B, C, and D) sequences using methods like K-means clustering.
5. Analyze the frequencies of the four micro-states to assign labels to each sequence.
- Calculate the distribution of micro-state labels P(x₁ = s)
- Identify label Si ∈ {A, B, C, D}
- Compute empirical peaks per second (PPS)
6. Evaluate Shannon Entropy: H = - ∑P(Xi = Si) log P(Xt =Si)
7. Determine Markov process sequences for cortical Alpha rhythm (alpha = 0.01)
P0= test-Markov0 (x, n_maps, alpha)
P1= test-Markov1 (x, n_maps, alpha)
P2= test-Markov2 (x,n_maps,alpha)
8. Calculate the transition matrix over time-based on a specified time window length (L). Segment the dataset into non-overlapping blocks 'r' and calculate a transition matrix for each block.
P3 = Conditional-Homogeneity-Test (x, n_maps, L, alpha)
3.6. Hidden Layers Architecture
The complexity of deep learning costs often arises from balancing too many features versus insufficient parameters. Consequently, experimental testing is crucial for understanding parameter behaviors accurately when designing hidden layer architectures. This necessitates techniques such as cross-validation network optimization or hyperparameter optimization. Various data processing procedures and analysis methods are employed in deriving EEG measurements related to attention and mediation. Common approaches in EEG research include:
Event-Related Potentials (ERPs): ERPs reflect attentional and cognitive activities through time-locked EEG responses surrounding specific events or stimuli epochs that are averaged to enhance signal-to-noise ratios for ERP assessments. The core computation in ERP analysis is depicted by the following formula:
ERP(t) = Baseline signal - Average signal at time t ….
In this context, ERP(t) refers to the event-related potential at a specific time t. The subtraction of the average signal at the time of interest yields the baseline signal, typically from a pre-stimulus period.
Power spectral analysis examines how power in the EEG signal is distributed across different frequency bands, offering insights into attention-related neural processes. The equation for power spectral analysis is:
PSD(f) = |FFT(signal(t))|2 ………….
Here, PSD(f) represents the power spectral density at frequency f. It is calculated using the squared absolute value of the FFT of the EEG signal at a particular time point.
Connectivity analysis delves into functional connectivity or communication between diverse brain regions through metrics like coherence, phase synchronization, and imaginary coherence. Various connectivity analysis equations exist based on the chosen metric. For example, coherence between two EEG signals at frequency f can be computed using this formula:
Coherence(f) = |Cross-Spectral Density(XY(f))|2 /(Spectral Density(X(f)) * Spectral Density(Y(f)) ……………....
In this equation, Spectral Density(X(f)) and Spectral Density(Y(f)) represent the spectral densities of signals X and Y at frequency f respectively, while Cross-Spectral Density(XY(f)) denotes their cross-spectral density.
It is crucial to note that actual analysis methods may vary depending on research objectives, experimental design, and software tools utilized. Specialized software such as EEGLAB and Field-Trip are commonly employed by researchers for these calculations. These formulas provide simplified illustrations of key concepts within EEG analysis. The field comprises numerous advanced techniques beyond these foundational calculations, reflecting its intricate and multidimensional nature.
4. Evaluation and Experimental Results
Assuming no prior knowledge of the original data labeling, a model is created using deep neural networks to differentiate between dyslexic and non-dyslexic brain signals. The model evaluates input signals and provides diagnostic percentage values. Figure 3 illustrates the proposed detailed framework to analyze the EEG signals during the inputting of the four activities (mental, reading, writing, and math calculation).
In a case study involving MOOC (massive open online course) video watching and mental activity, a dataset from 10 trainers was analyzed. The videos included teaching materials on various scientific subjects like algebra and geometry, with additional videos designed to induce confusion. Dyslexia indicators such as confusion, attention, spelling errors, reading mistakes, and disorientation were identified. Data sourced from Kaggle was used to study brain electrical activity for demographic information about patients. The objective is to develop a deep neural network capable of predicting dyslexic indicators based on brain signal features. A reference classifier in Figure 4 outlines dimensions influencing early dyslexia diagnosis based on behaviors observed during MOOC video watching. Measurement indicators for each behavior are specified within the framework.
The experiment employed six hidden layers due to complex correlations between dyslexia indicators and EEG signal features. The network architecture consisted of 512 neurons in the first layer gradually reducing to 16 neurons before the output decision using a binary classifier. The sigmoid activation function constrained network outputs between Zero and One.
4.1. Case 1: MOOC Watching
The dataset included EEG signals from 12812 participants during MOOC watching for training purposes. Table 2 presents data from the first 20 participants, including learner ID, video ID, attention levels, mediation indicators, and different brainwave bands along with predefined labels indicating dyslexic or non-dyslexic status. Participant identifiers and labels were anonymized for privacy reasons using color codes.
According to Table 3, learners 1 and 10 have been identified as dyslexic students due to attention-related issues, contrasting with learners 2, 3, 4, 5, 6, 7, 8, and 9. Therefore, an examination of signal analysis, classification, and their interrelations will be conducted. An expert has diagnosed learner 5 with dyslexic behavior and observed that this learner exhibited higher Theta and Theta-Beta ratios compared to others.
In the second test group, which consists of the last 10 students in the dataset, three individuals exhibit signs of dyslexia. Specifically, student #4, #5, and #10 displayed Theta wave values of 148692, 192887, and 1184366 respectively, indicating potentially higher levels compared to their peers. Notably, student #10 demonstrates potential dyslexic traits based on their Theta and Theta/Beta 1 parameter values, suggesting heightened attention levels. Additionally, students #4 and #5 also show positive attention indicators. Conversely, students #1, #2, #3, and #6 exhibit positive mediation indications (as shown in Table 4).
The framework proposed utilizes accuracy, precision, recall, and F1-Score as performance metrics. A threshold metric value is then calculated to enhance performance beyond these measures. The "Receive Operating Characteristic (ROC)" method is employed to determine the optimal threshold value by maximizing the True Positive Rate (TPR) and minimizing False Positive Rate (FPR).
to be maximum, and
to be minimum
The ROC curves and AUC scores are utilized to determine the most effective model for categorizing the suggested framework. The interpretation of ROC curves is illustrated in Figure 5. A custom callback within the Keras library is employed to compute the ROC curve and assess the AUC score while training the proposed model. The calculation of the correlation coefficient by the computational model necessitates an examination of the calculation method to comprehend its significance, which is formulated as follows: The numerator in this formula represents the summation of the product of the difference between each value of the first parameter and its mean with that of the second parameter and its mean. The denominator comprises the product of each variable's standard deviation multiplied by the number of data samples.
4.2. Case 2: Eye Tracking during Reading Activity
The second case study involved 89 participants in the control group and 88 participants in the dyslexic group. All individuals were instructed to read the same text paragraph, while their eye-tracking saccades and fixations were recorded for classification analysis. The classification process utilized K-means and SVM algorithms. The data collected included x-y coordinates from both the left and right eyes, leading to the observation of vectors with specific parameters:
- -
- Lx: x coordinate of the left eye
- -
- Ly: y coordinate of the left eye
- -
- Rx: x coordinate of the right eye
- -
- Ry: y coordinate of the right eye
In cases where discrepancies existed between data lengths from the left and right eyes, adjustments were made to equalize vector lengths before proceeding with the classification process as illustrated in Figure 6.
Eye tracking, unlike traditional screening methods that rely on verbal responses, offers an objective way to evaluate the reading process in real time without requiring the subject to provide a spoken or written assessment. This study's dataset includes 97 high-risk individuals with early word decoding difficulties and 88 low-risk individuals selected from a larger group of 2,165 second-grade schoolchildren. By utilizing predictive modeling and statistical resampling techniques, classification models were developed using eye-tracking data of less than one minute, demonstrating high accuracy in distinguishing between high-risk and low-risk subjects. While dyslexia is primarily language-based, the findings indicate that eye movements during reading can be indicative of individual reading ability, making eye tracking a valuable tool for identifying children at risk for long-term reading challenges.
The study conducted as part of the Kronoberg Reading Development Project involved 185 subjects (Swedish school children between 1989 and 2010) from an initial group of 2,165 second-grade students. Among them, 103 individuals were identified in 1989 as having difficulty developing word reading skills at a normal rate. This high-risk group consisted of 82 males (7.7% of all males) and 21 females (1% of all females), meeting specific inclusion criteria such as being native Swedish speakers, scoring in the lower fifth percentile on standardized word decoding tests, and receiving confirmation of persistent reading difficulties from their teachers. Individuals with intellectual disabilities were excluded from the selection process. The primary concern that needs attention is the varying lengths of data. Alternative approaches entail selecting a fixed number of features (n), resulting in an n-dimensional dataset where each dimension signifies a feature. This process necessitates a thorough grasp of the domain, considering multiple assumptions regarding feature selection. In cases of incomplete domain knowledge, crucial aspects of the signal may be overlooked during feature selection. When opting to process the raw signal, equalizing lengths involves either padding or data interpolation. However, augmenting temporal data with information can alter the significance of temporal and spectral properties within the signal. Frequency transformation is applied to time series data, typically preserving vital information within the dataset but also leading to varying signal lengths in the spectral domain. Modifying signals in the frequency domain permits adjustments without affecting time characteristics. To prevent signal distortion, a sliding window approach can be adopted, creating frequency groups or bins across the signal while maintaining shared fractions between neighboring bins to capture specific time-domain aspects without explicitly including or excluding features. By employing an equal number of bins throughout the signal and retaining consistent proportions of shared frequencies between adjacent bins, specific time-domain characteristics can be captured systematically without arbitrary decisions on feature inclusion or exclusion, resulting in uncompressed data condensed into a sum.
This study focuses on extracting saccades and fixation features for eyes using supervised learning and SVM classification techniques with a concentration on exact coordinate locations of both left and right eyes during reading tasks where all participants read identical lines of text. Discrepancies between left and right eye movements are visualized through yellow and red lines representing the readings from each eye as shown in Figure 6. The orange plotted line depicts the combination of two lines superimposed on each other, with some red and yellow lines not intersecting. This visualization showcases the readings from the left eye (yellow) and right eye (red). Individual participant data can be modified by representing each participant in a distinct vector, resulting in varying vector lengths or inconsistencies. Consequently, the K-means method is utilized for classification post-normalization, achieved through adding zeros at the end of vectors or averaging all vector values. This process leads to an enhanced accuracy score (improved from 69.35% to 72.11% and further to 73.12%), facilitating the visualization of a confusion matrix. The confusion matrix indicates that shorter vectors are associated with normal candidates while longer ones correspond to dyslexic individuals.
To enhance model accuracy, a Short-Time Fourier Transform (STFT) is employed to ascertain the standard average frequency and phase content of each participant's signal as it evolves. In this context, the lengthy time signal is segmented into equal shorter segments, followed by STFT computation for each segment using the formula:
Here, w(Ⴀ) denotes the window function (Hann or Gaussian), s(t) represents the signal for each participant (dyslexic or normal), and S(Ⴀ, w) stands for the Fourier transform of s(t) w(t-Ⴀ), reflecting the phase and magnitude of the participant's signal over time post computing average power spectra. Ⴀ and w represent the time and frequency axes respectively. Figure 7 portrays a classification accuracy rate of 96.24% after dividing the time signal into four equal segments.
4.3. Case 3: Opening and Closing Eye Tracking Activity
The EEG biosignal is captured by monitoring the two states of the eyes - opening and closing. When the eyes open or close, brain neurons are activated, producing EEG time-series patterns. A machine/deep learning model has been proposed to recognize and classify these patterns. This model processes the EEG signal to determine whether a person's eyes are open or closed using supervised machine/deep learning techniques. The first method involves statistical feature extraction to identify features like mean, standard deviation, skewness, Kurtosis, Band power, etc., which are then used for training, classification, and prediction. The second approach employs a Neural Network: Multilayer Perceptron’s by utilizing 14 electrode values for training and classification. The third method utilizes the Recurrent Neural Network: LSTM network to train on EEG signals and predict the output based on the last layer ('0' for opening and '1' for closing). Four performance metrics are utilized to assess these models. An illustration in Figure 1 showcases how the EEG technique can be utilized for monitoring and identifying brain activities.
The analysis is centered around 14 EEG values representing 14 electrodes capturing statistical information related to both eye-opening and eye-closing activities. Additional statistical computations such as minimum, maximum, mean, and standard deviation are conducted. Consequently, Figure 5 evaluates the time series data concerning eye-opening and eye-closing activities. Furthermore, Table 5 presents a comparative assessment of the four methods used to predict eye activities associated with opening and closing.
A research paper titled "Predicting risk of dyslexia with an online gamified test" was published in PLOS ONE, detailing the second case study. The dataset consisted of more than 3600 participants (desktop data), with the study successfully identifying over 80% of individuals with dyslexia. Subsequently, a new dataset comprising over 1300 cases (tablet data) was used to test the proposed model. The evaluation accuracy indicated a recall rate exceeding 78% for identifying dyslexia in children aged 12 years and above. This research demonstrates that machine learning techniques, as implemented in our new model, can effectively observe and detect dyslexia. A comparative evaluation of the proposed dataset is presented in Table 6.
Based on the findings of the analysis, a strong relationship exists between Attention and Mediation, while a weaker connection is observed among Attention, Mediation, and Theta.
When examining the EEG data of participants engaged in educational video sessions designed for teaching and training purposes:
The EEG frequencies of participants can be evaluated across different spectrum categories such as Delta (1-4 Hz), Theta (4-8 Hz), Alpha (8-14 Hz), Beta (14-30 Hz), and Gamma (30-42 Hz).
- 5.
- This data can be utilized to anticipate levels of confusion, attention, or mental focus among individuals, thereby enabling the prediction of confused students.
- 6.
- Various correlation parameters between frequency bands can be studied to forecast and identify specific characteristics related to attention and mediation.
- 7.
- By analyzing the correlation parameters across frequency bands within a sample containing numerous dyslexic participants, it may be feasible to diagnose dyslexia.
- 8.
- With a substantial dataset comprising dyslexic participants for training and testing purposes, it becomes possible to establish thresholds for feature selection leading to early diagnosis based on signals from Attention, Mediation, Theta, Beta, and Gamma.
In a study conducted by Keshavarzi et al. (2022) [28], it was highlighted that the Delta band holds more significance compared to Theta and Alpha bands. Their research revealed notable differences in neural responses within the Delta band between individuals with dyslexia and those without during "neural entrainment to rhythmic audiovisual speech", potentially presenting new avenues for diagnosis or intervention.
Several datasets have been examined to scrutinize neurophysiological mechanisms aiding in the early detection of individuals with disabilities. Some datasets explore emotions—both positive and negative—in identifying frequency bands linked to learning disorders. Another dataset focuses on impaired speech signals associated with dyslexia within the Delta band frequency.
5. Conclusions
Overall, the proposed methodology outlined in this framework has demonstrated potential in predicting dyslexia using band frequencies like Theta and Beta waves from EEG signals. As this represents an initial exploration into EEG signal analysis for early diagnosis purposes, further detailing is required; however, this framework offers a foundation for future research involving other indicators of dyslexia. Parameters such as attention confusion and mediation play crucial roles in identifying dyslexia cases. Previous studies have suggested that mistakes made by dyslexic individuals in reading, math, and spelling are often attributed to the confusion they experience.
To investigate the impacts of specific activities on frequency bands of interest, relevant stimuli must be employed. Statistical analyses were carried out on these frequencies' bands of interest through sample tests. Correlations among statistical computations relating to five distinct bands—attention, mediation—and participant classification were considered while elucidating neural responses concerning stimuli across participants’ different bands. Relationships among frequency bands of interest along with attention, and mediation levels are calculated; multiple frequency bands are explored in testing specific hypotheses.
Future work will encompass dataset curation involving EEG signals recorded during activities like reading text aloud or under dictation conditions for spelling practice as well as engaging in written math tasks involving mental calculations. Thus far phonological reading (alphanumeric & non-alphanumeric), phonological awareness during spell dictation exercises for math computations alongside visual-spatial working memory during cognitive tasks have been analyzed; additional investigations will be undertaken in forthcoming studies."
Notes
-
1https://dyslexia.yale.edu/ (access on 20-05-2023).
Acknowledgments
This work was supported by the Deanship of Scientific Research (DSR), King Abdulaziz University, Jeddah, under grant no. (611-933-1435). The authors, therefore, gratefully acknowledge the DSR's technical and financial support.
References
- [1]. S. Shaywitz, and J. Shaywitz. (2020). Overcoming Dyslexia, Second Edition, On Amazon.
- [2], G. Reid, (2016). Dyslexia: A Practitioner's Handbook, Wiley Publisher.
- [3], L. Segel, (2013). Understanding Dyslexia and Other Learning Disabilities. Available online: https://pacificedpress.
- [4], J. Birsh, (2018). Multisensory Teaching of Basic Language Skills, Paul Brookes Publishing Co. Available online: https://www.amazon.com/Multisensory-Teaching-Basic-Language-Skills/dp/1681252260? 9818. [Google Scholar]
- [5] N., Z. Al Dahhan, J. R Kirby, R. Hung, and D. P Munoz, (2022). 2022. [Google Scholar] [CrossRef]
- [6]. A. Isabel Dias Reis, S. [6]. A. Isabel Dias Reis, S. Araújo, I. Salomé Morais and L. Faísca, (2020). Reading and reading-related skills in adults with dyslexia from different orthographic systems: A review and meta-analysis, Adults with Dyslexia, 2020, https://www.researchgate. 3442. [Google Scholar]
- [7]. J. Thomas Panachakel and A. G. 2021. [CrossRef]
- [8]. C. Cooney, A. Korik, R. Folli and D. Coyle. Evaluation of Hyperparameter Optimization in Machine and Deep Learning Methods for Decoding Imagined Speech. EEG 2020, 20, 4629. [Google Scholar] [CrossRef]
- [9], H. Al-Barhamtoshy and D. Motaweh, (2017). Diagnosis of Dyslexia using Computation Analysis, International Conference on Informatics, Health & Technology (ICIHT 2017), 21-, http://ieeexplore.ieee.org/stamp/stamp.jsp? 23 February 7899. [Google Scholar]
- [10], H. Al-Barhamtoshy and D. Motaweh. Diagnosis of Dyslexia using Computation Analysis. Journal of Engineering Technology 2017, 6, 462–482, wwwjoetsitecom/wp. [Google Scholar]
- [11]. J. Thomas Panachakel, A. [11]. J. Thomas Panachakel, A. Ganesan Ramakrishnan, (2021). 2021. [Google Scholar] [CrossRef]
- [12]. S. Visram, D. [12]. S. Visram, D. Leyden, O. Annesley, D. Bappa and N. J. Sebire, (2021). Perceptions and attitudes of Children and Young People to Artificial Intelligence in Medicine, Research Gate, 2021. Available online: https://www.researchgate. 3552. [Google Scholar]
- [13], S. Visram, D. Leyden, O. Annesley, D. Bappa and N. J. Sebire, (2022). Engaging children and young people on the potential role of artificial intelligence in medicine, Pediatric Research, Springer, 2022, https://www.nature. 4139. [Google Scholar]
- [14], N. Izzati Mat Razi, A. Abdul Rahman and N. Kamaruddin. Detecting learning disabilities based on neuro-physiological interface of affect (NPIoA). Indonesian Journal of Electrical Engineering and Computer Science 2020, 19, 163–170. [Google Scholar]
- [15] S., K.Y. Winnie, W. H. Wong, J. N. Mak, R. H. M. Chan. An Evaluation of Mental Workload with Frontal EEG. Public Library of Science (PLOS) ONE 2017, 12, e0174949. [Google Scholar] [CrossRef]
- [16], A. Maria Petrescu, D. Taussig and V. Bouilleret. Electroencephalogram (EEG) in COVID-19: A Systematic Retrospective Study. Clinical Neurophysiology 2020, 50, 155–165. [Google Scholar]
- [17] K., H. Muhaimin and F. A. Bachtiar, (2022). Classification of Electroencephalogram Data on Massive Open Online Course Studying Process Using Gated Recurrent Unit, 2022, Association for Computing Machinery. [CrossRef]
- [18], C. Clifton, Staub A, Rayner K (2007). Eye movements in reading words and sentences In: van Gompel R (ed) Eye Movements: A Window on Mind and Brain, Elsevier, Amsterdam, pp 341–372.
- [19] P., A. Eleni and J. Lagopoulos, (2016). “Resting State EEG Hemispheric Power Asymmetry in Children with Dyslexia,” Frontiers in Pediatrics, vol. 4, 2016. [CrossRef]
- [20] National Institute for Health and Care Excellence, “Attention Deficit Hyperactive Disorder,” British Psychological Society, p. 14, 2018.
- [21], P. Zoccolotti, M. De LucaID, C. V. Marinelli and D. Spinelli, (2021). Predicting individual differences in reading, spelling and maths in a sample of typically developing children: A study in the perspective of comorbidity, PLoS ONE, vol. 2021. [Google Scholar] [CrossRef]
- [22], H. Yaacob, H. Omar, D. Handayani, and R. Hassan. Emotional Profiling Through Supervised Machine Learning of Interrupted EEG Interpolation. International Journal of Advanced Computer Research 2019, 9, 242–251. [Google Scholar] [CrossRef]
- [23], H. Perera, M. Shiratuddin, K. Wong, K. Fullarton. EEG Signal Analysis of Writing and Typing Between Adults with Dyslexia and Normal Controls. International Journal of Interactive Multimedia and Artificial Intelligence 2018, 5, 62. [Google Scholar] [CrossRef]
- [24] P., A. Eleni and J. Lagopoulos, “Resting State EEG Hemispheric Power Asymmetry in Children with Dyslexia”, Frontiers in Pediatrics, vol. 4, 2016.
- [25], R.; Narain, (2022). Analyzing the Brain Waves Data Using Python. Available online: https://www.datatobiz.com/blog/ brain-waves-data-using-python/ (accessed on day month year).
- [26], D.; Radečić. ROC and AUC - How to Evaluate Machine Learning Models in No Time, hands-on examples in Python. Available online: https://towardsdatascience.com/roc-and-auc-how-to-evaluate-machine-learning-models-in-no-time-fb2304c83a7f (accessed on day month year).
- [27], M. Keshavarzi, K. Mandke, A. Macfarlane, L. Parvez, F. Gabrielczyk, A. Wilson and U. Goswami, (2022). Atypical delta-band phase consistency and atypical preferred phase in children with dyslexia during neural entrainment to rhythmic audio-visual speech, NeuroImage: Clinical Vol. 2022; 35. [Google Scholar] [CrossRef]
- [28], L. Moctezuma, M. Molinas, (2019). Sex differences observed in a study of EEG of linguistic activity and resting-state: Exploring optimal EEG channel configurations. Available online: https://ieeexplore.ieee. 8733. [Google Scholar]
Figure 1.
Proposed Research Methodology.
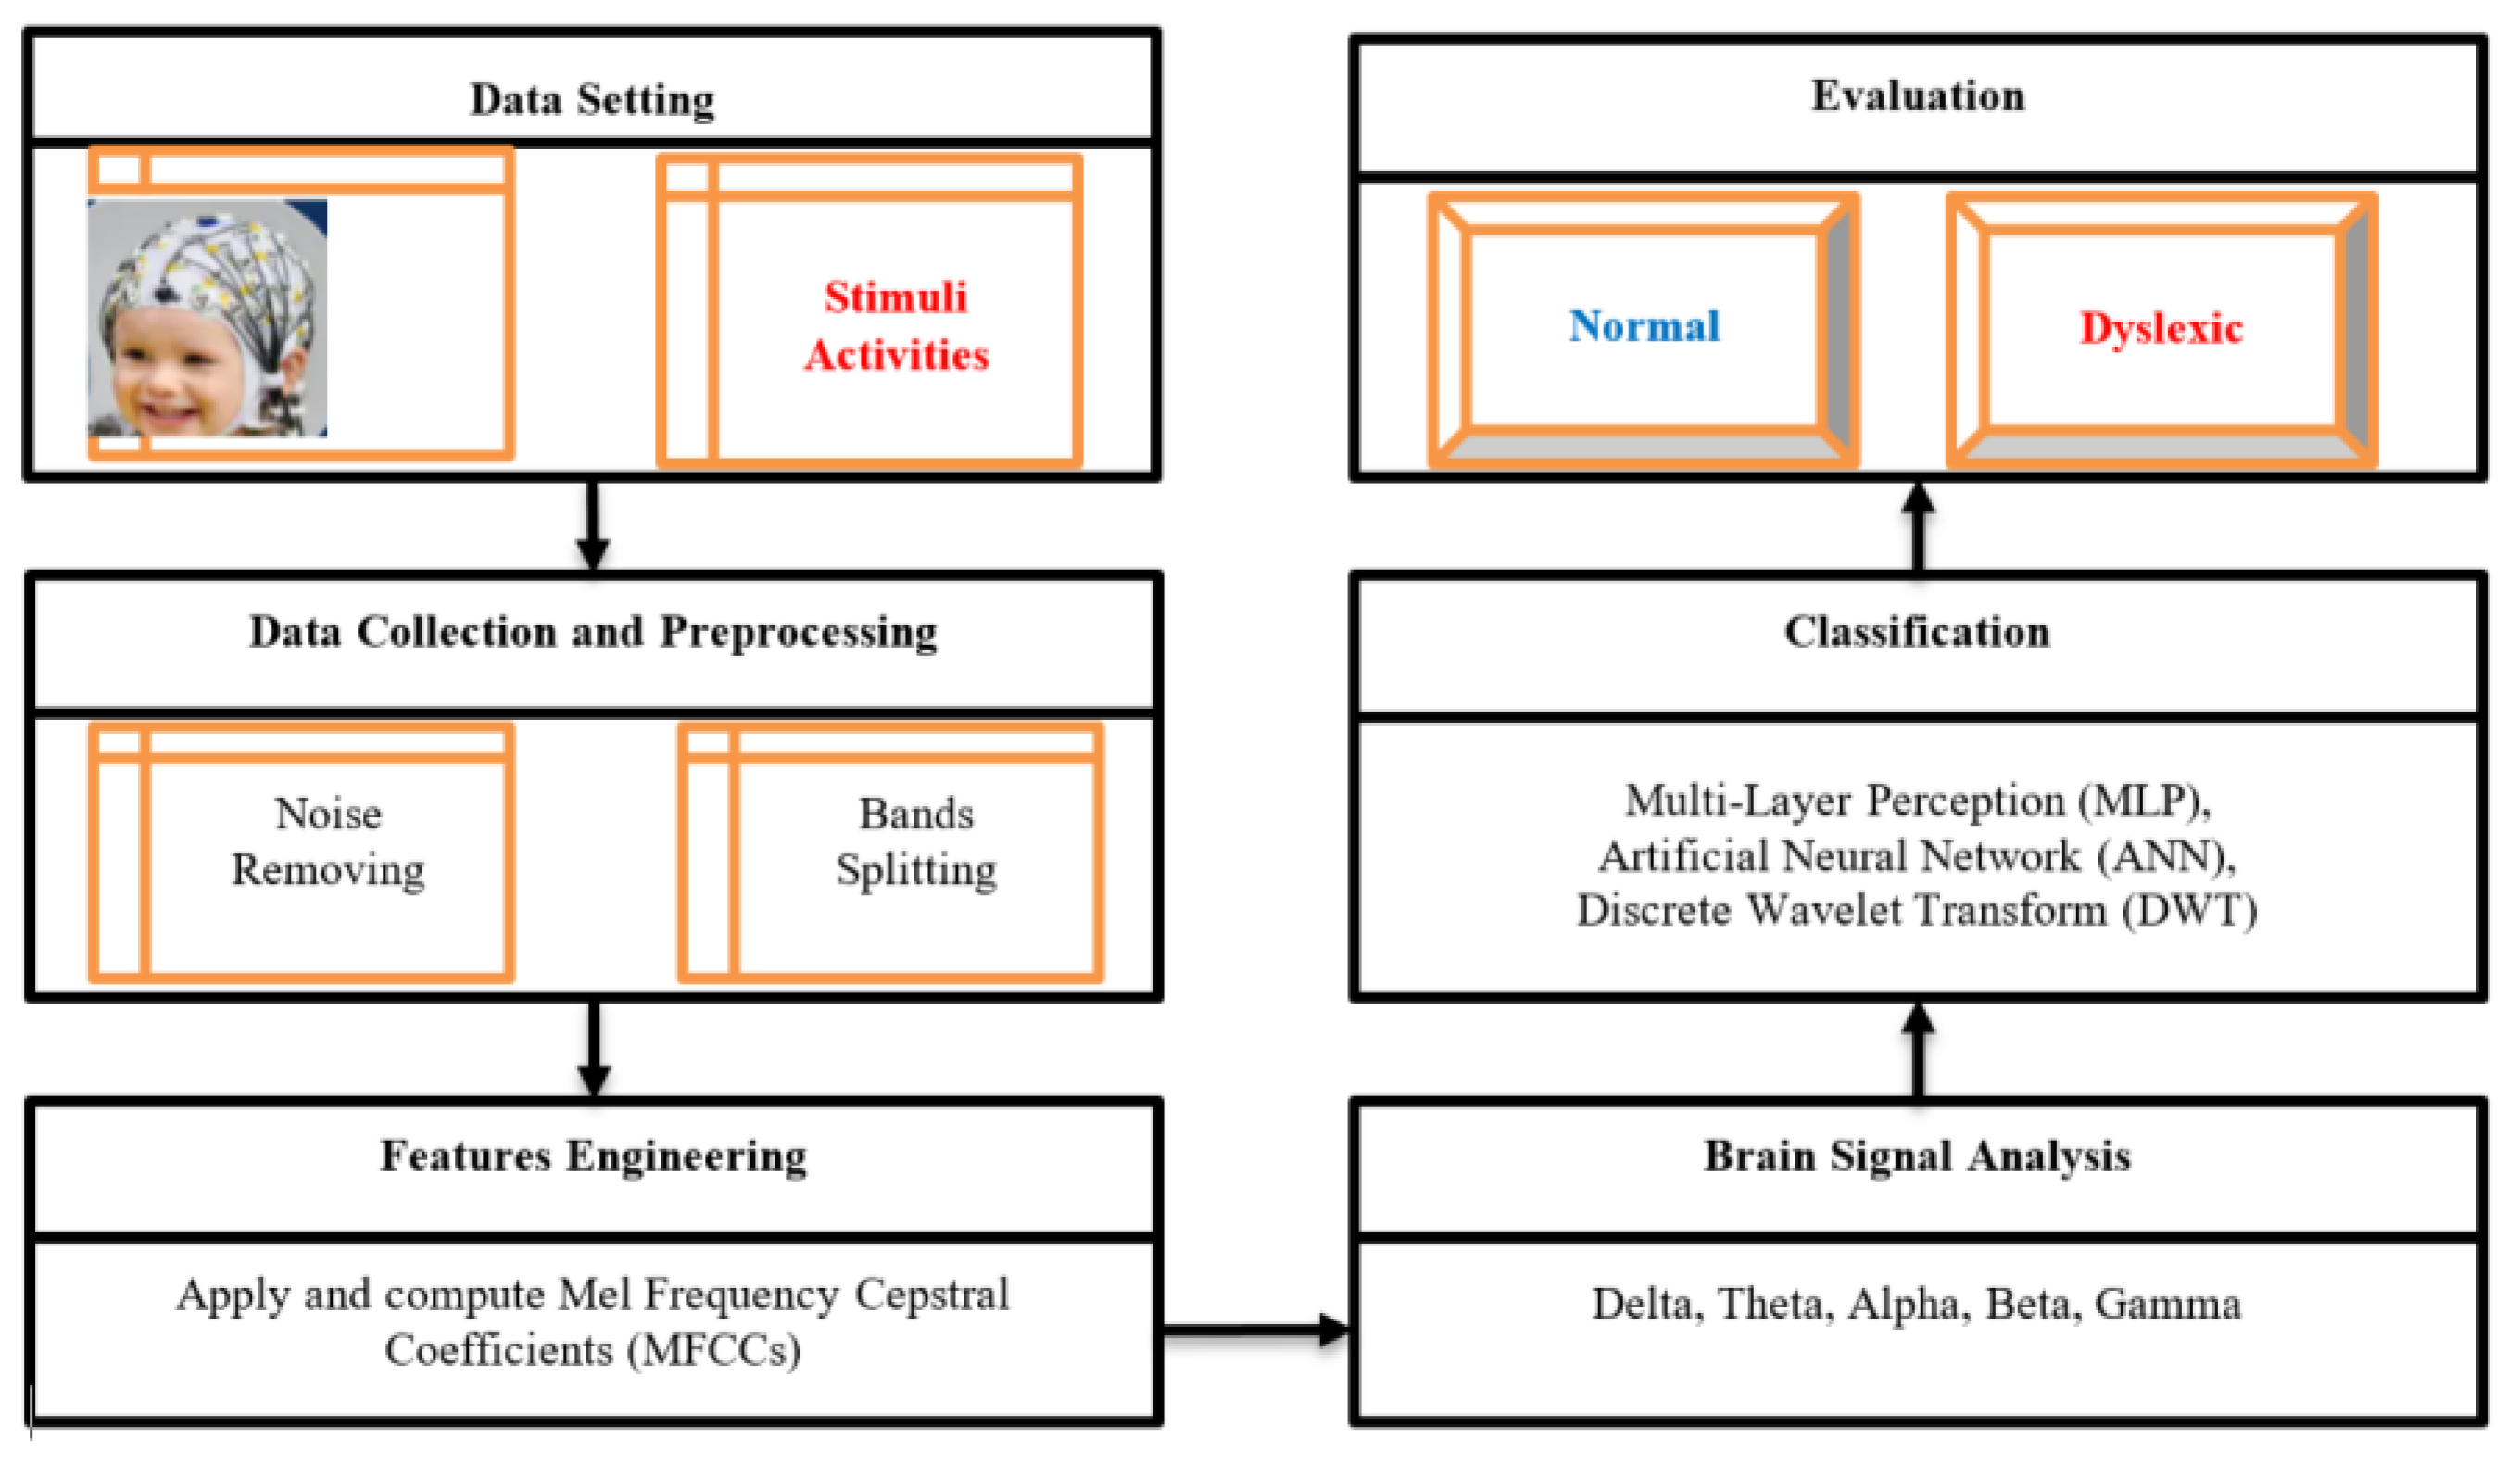
Figure 2.
Comparison of mean amplitude in Theta (4-4 Hz), Alpha (8-14 Hz), Beta (14-30 Hz), and Gamma (31-42 Hz) frequency bands between the left and right hemispheres was conducted during linguistic activity and resting-state among males and females using the EEG raw signal with 14 bits [14].
Figure 2.
Comparison of mean amplitude in Theta (4-4 Hz), Alpha (8-14 Hz), Beta (14-30 Hz), and Gamma (31-42 Hz) frequency bands between the left and right hemispheres was conducted during linguistic activity and resting-state among males and females using the EEG raw signal with 14 bits [14].
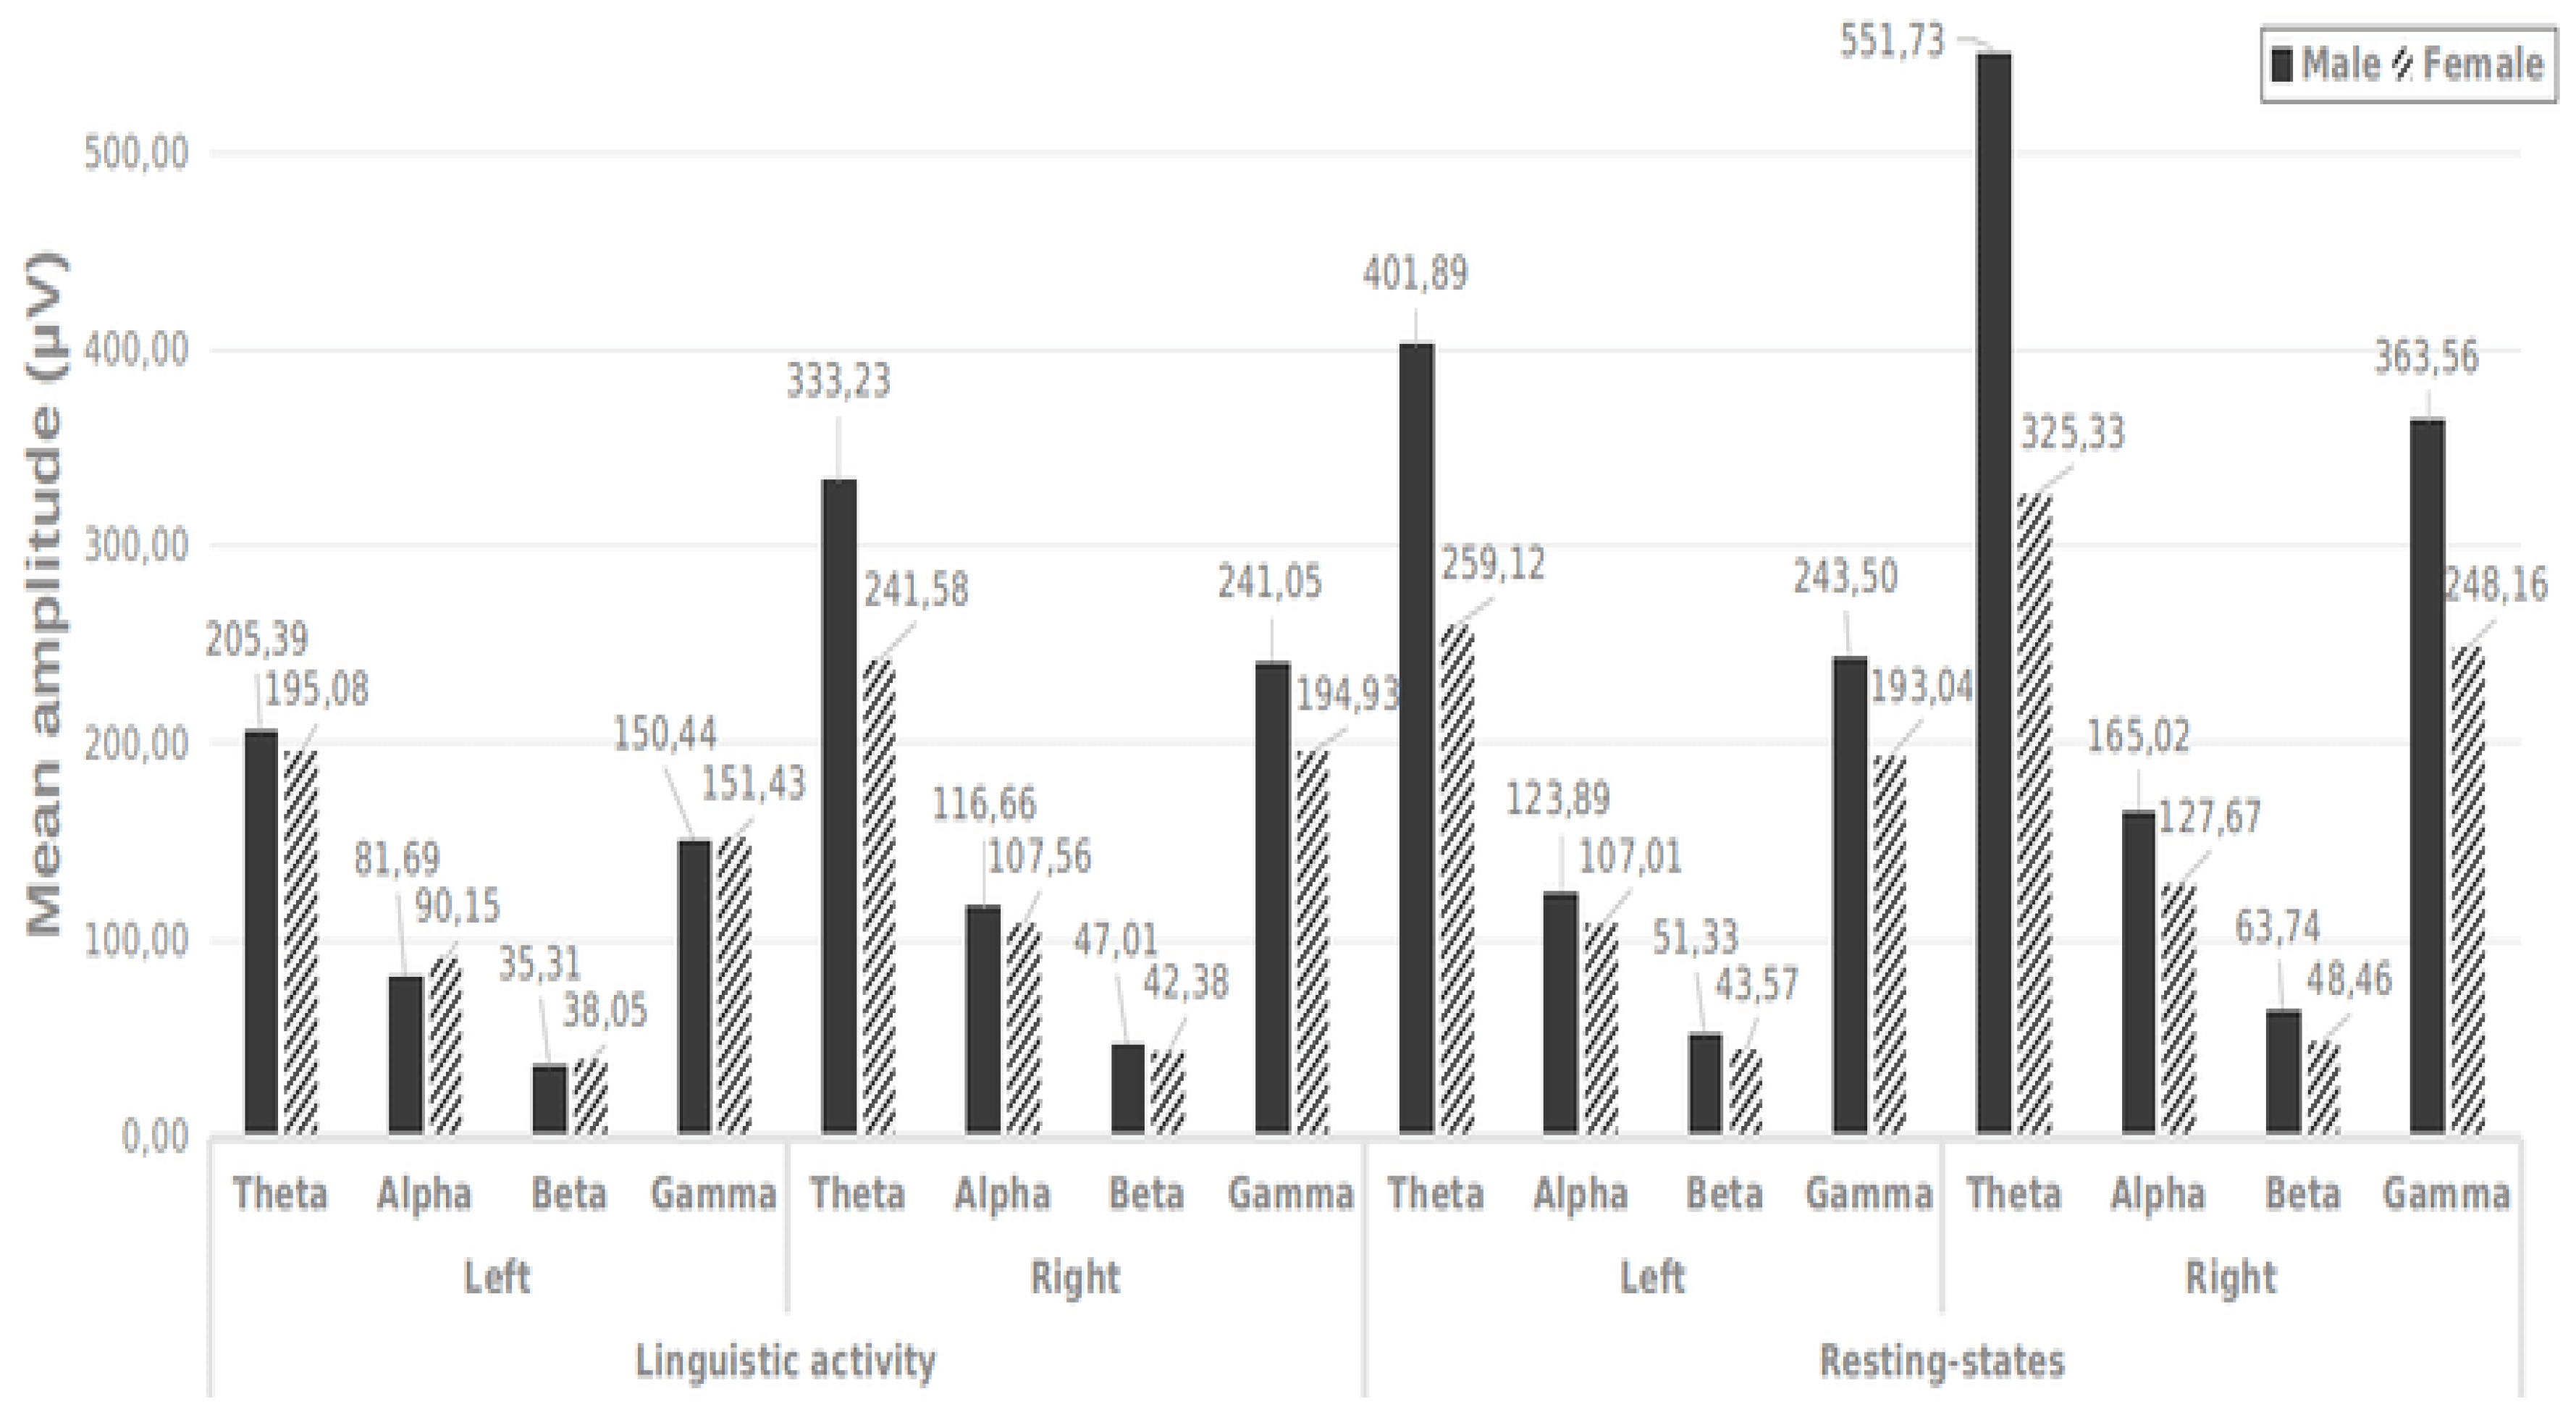
Figure 3.
A proximal model framework is used to analyze EEG signals generated during text reading, written spelling, math tasks, and mental activities. This analysis aims to identify indicators of conditions such as dyslexia, autism, or normal cognitive function.
Figure 3.
A proximal model framework is used to analyze EEG signals generated during text reading, written spelling, math tasks, and mental activities. This analysis aims to identify indicators of conditions such as dyslexia, autism, or normal cognitive function.
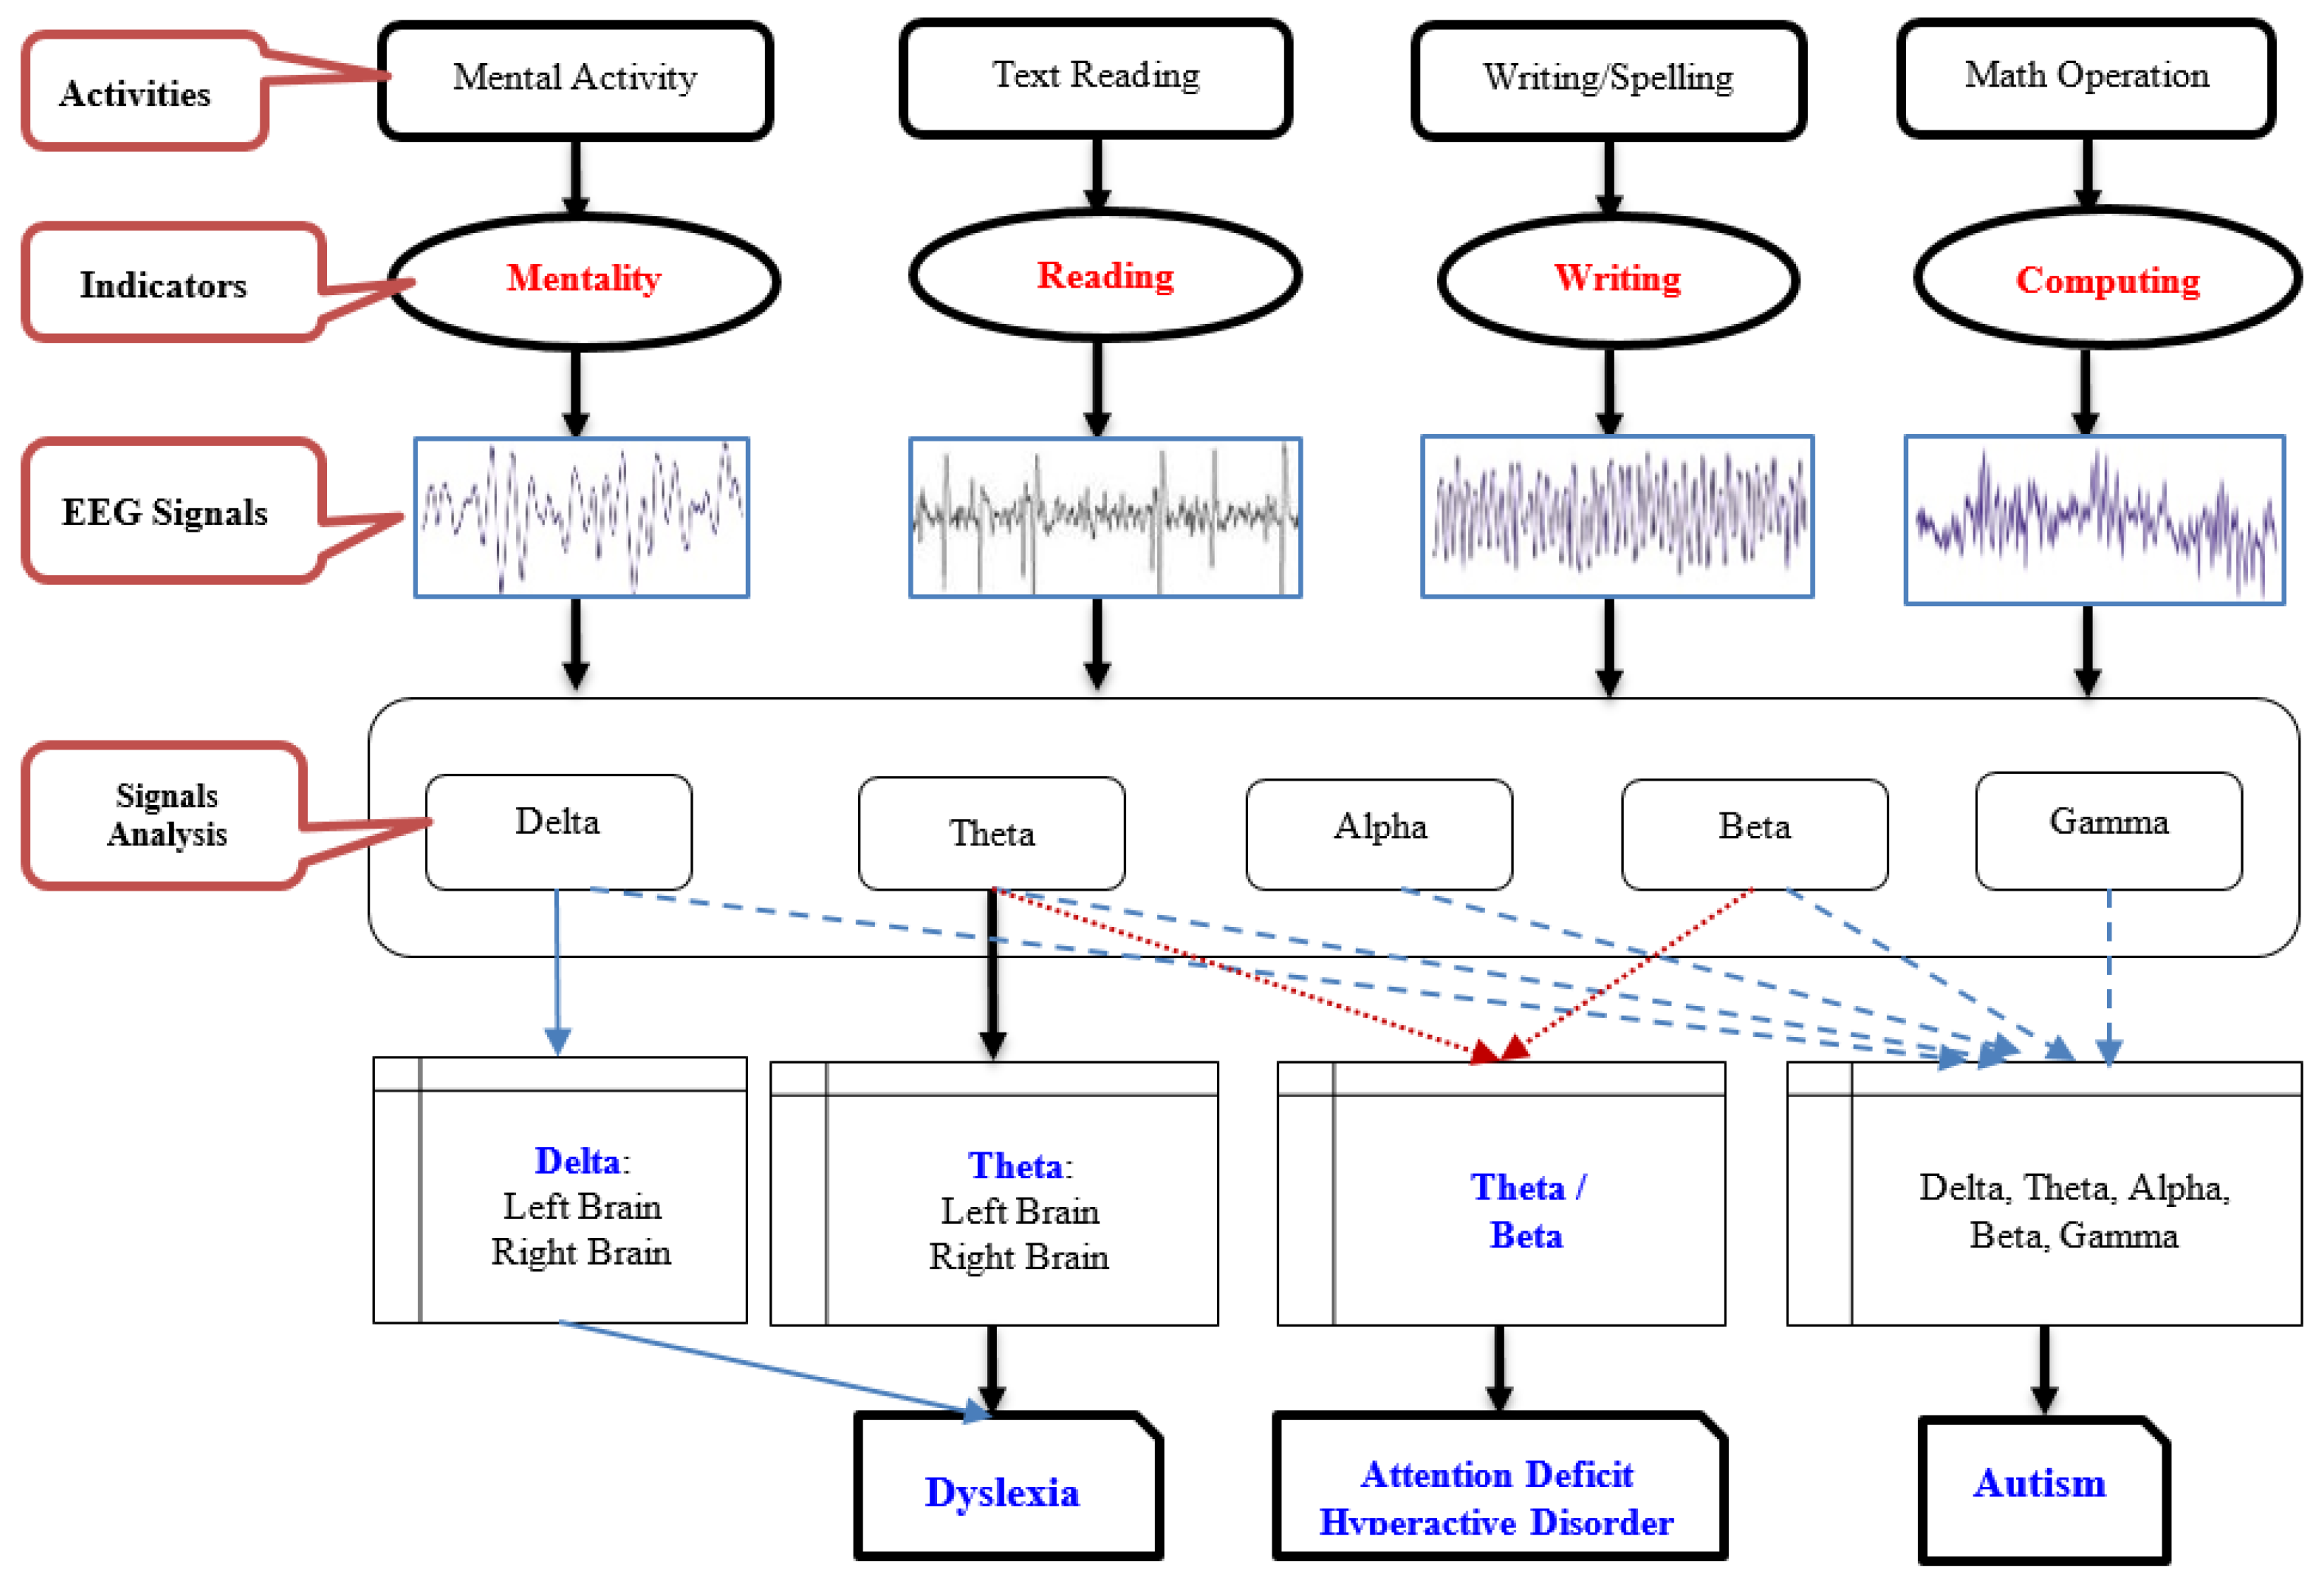
Figure 4.
The network topology is designed to establish the number of hidden layers and the corresponding number of hidden neurons in the neural network architecture.
Figure 4.
The network topology is designed to establish the number of hidden layers and the corresponding number of hidden neurons in the neural network architecture.
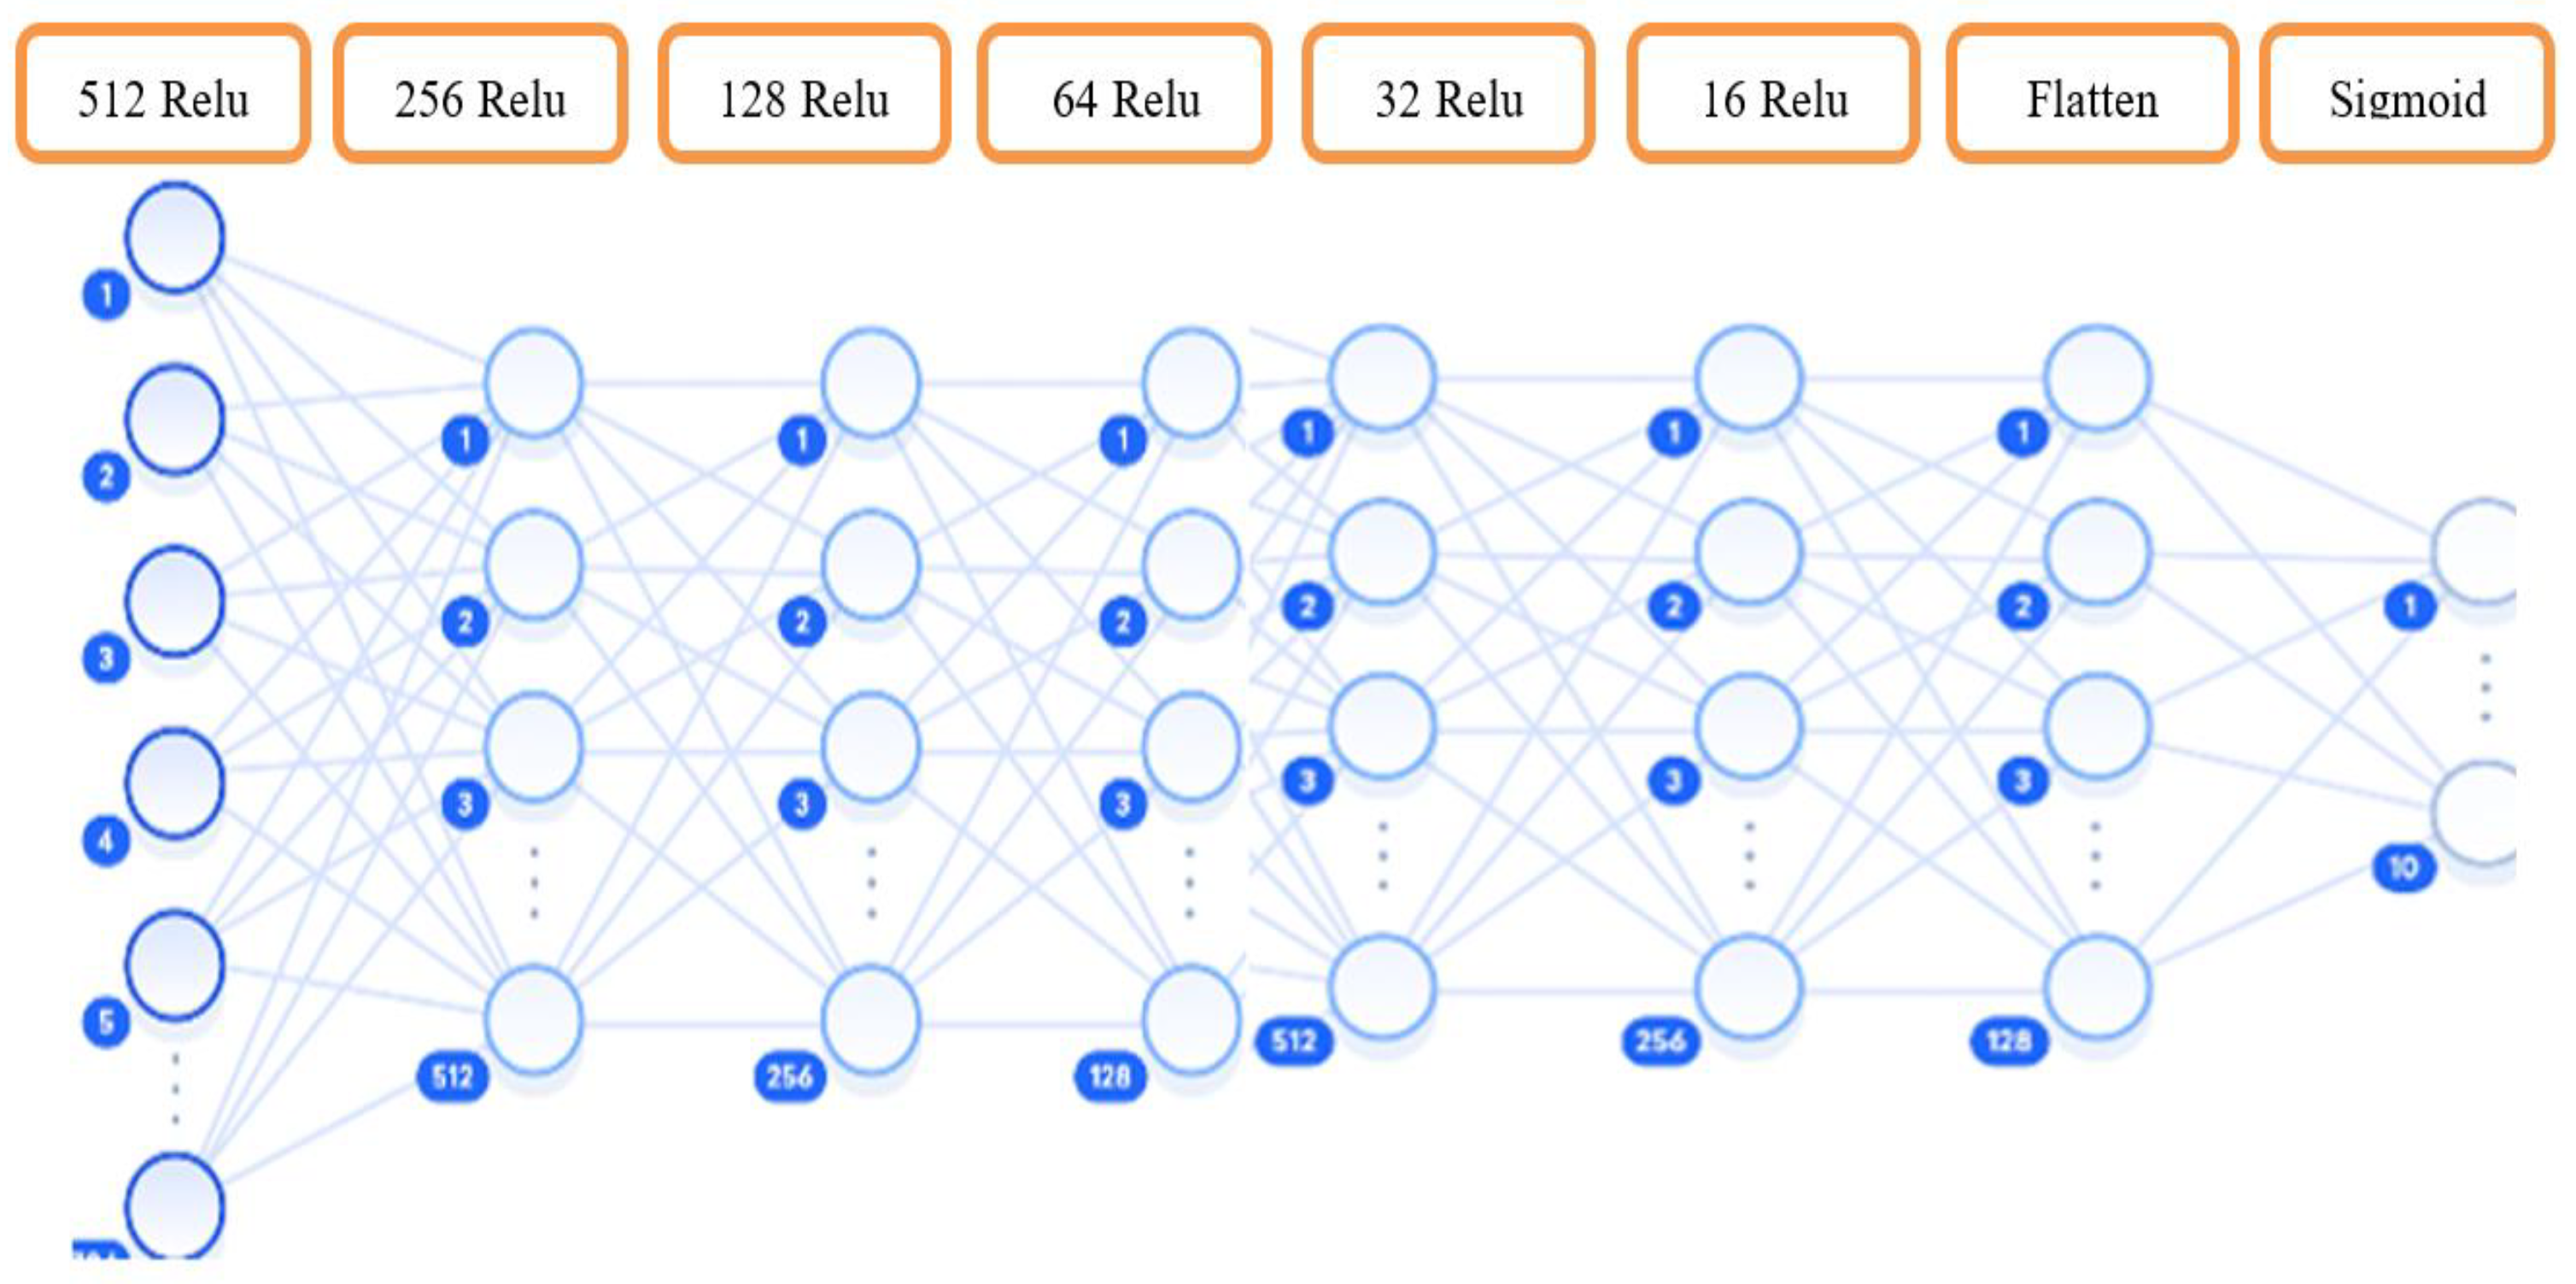
Figure 5.
ROC curves for various machine learning models are depicted after executing Keras_Regression_Deeper.py.
Figure 5.
ROC curves for various machine learning models are depicted after executing Keras_Regression_Deeper.py.
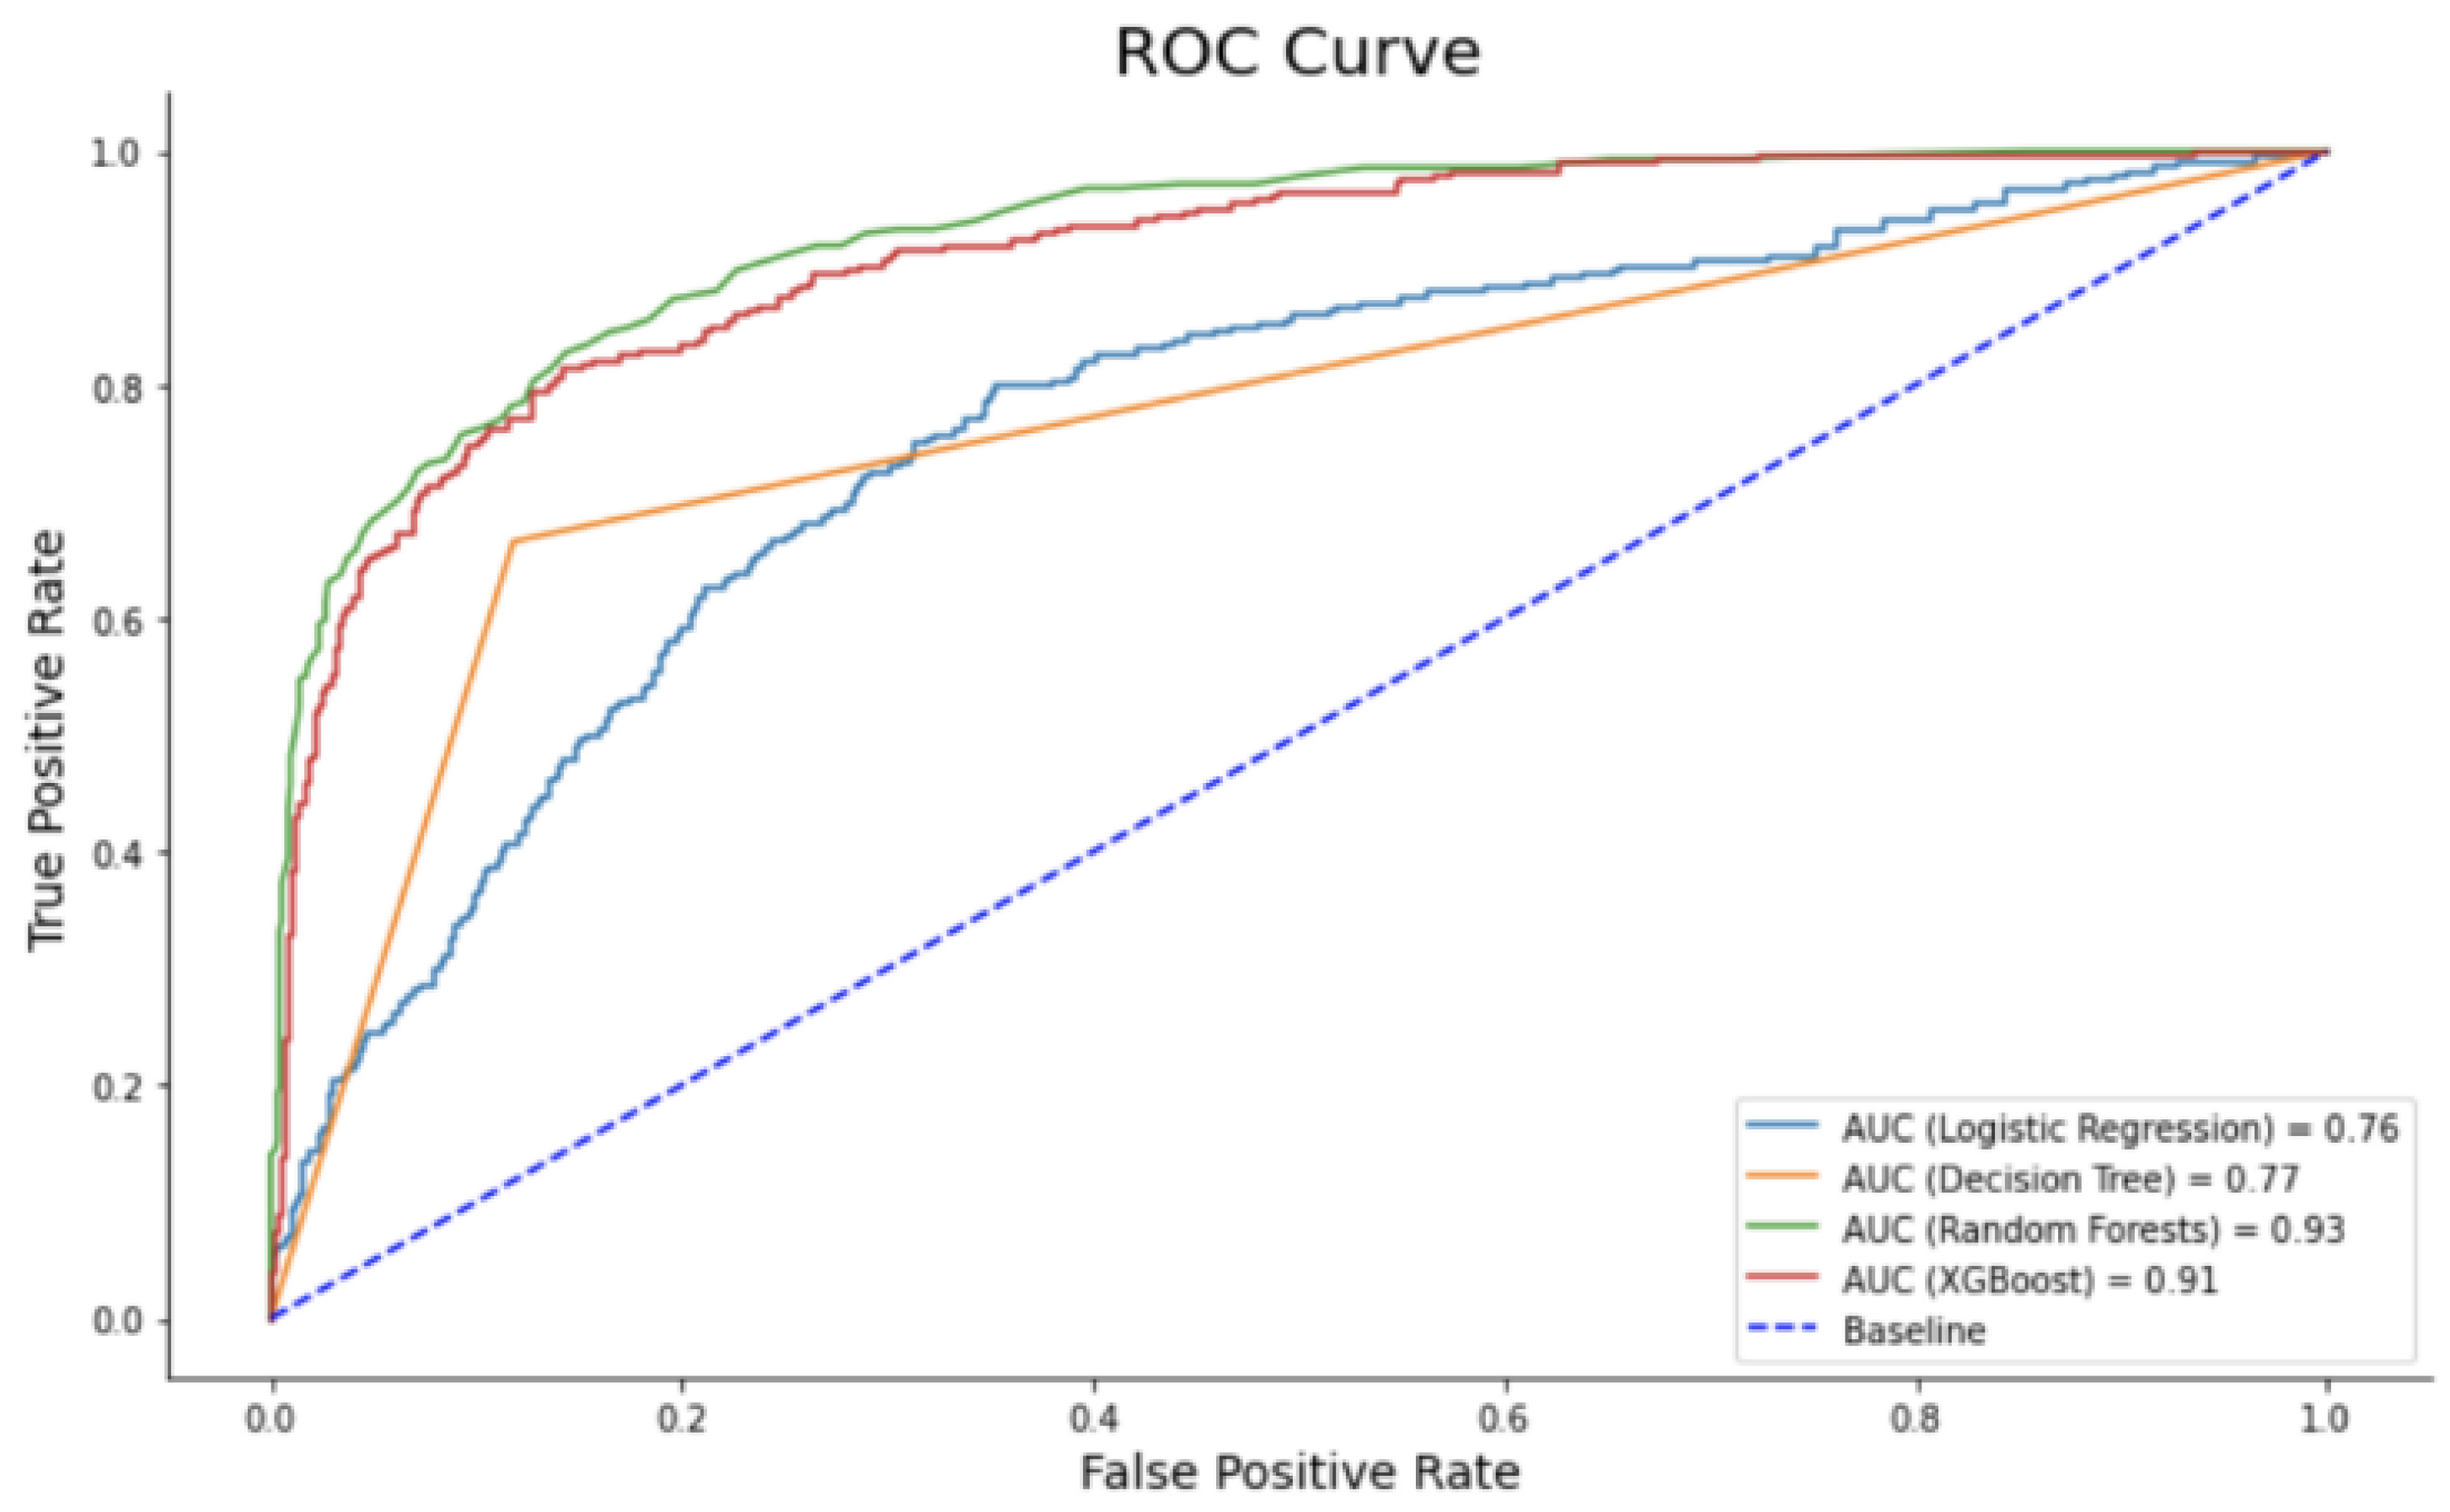
Figure 6.
Discrepancies in eye movements during reading between the left and right eyes are highlighted.
Figure 6.
Discrepancies in eye movements during reading between the left and right eyes are highlighted.
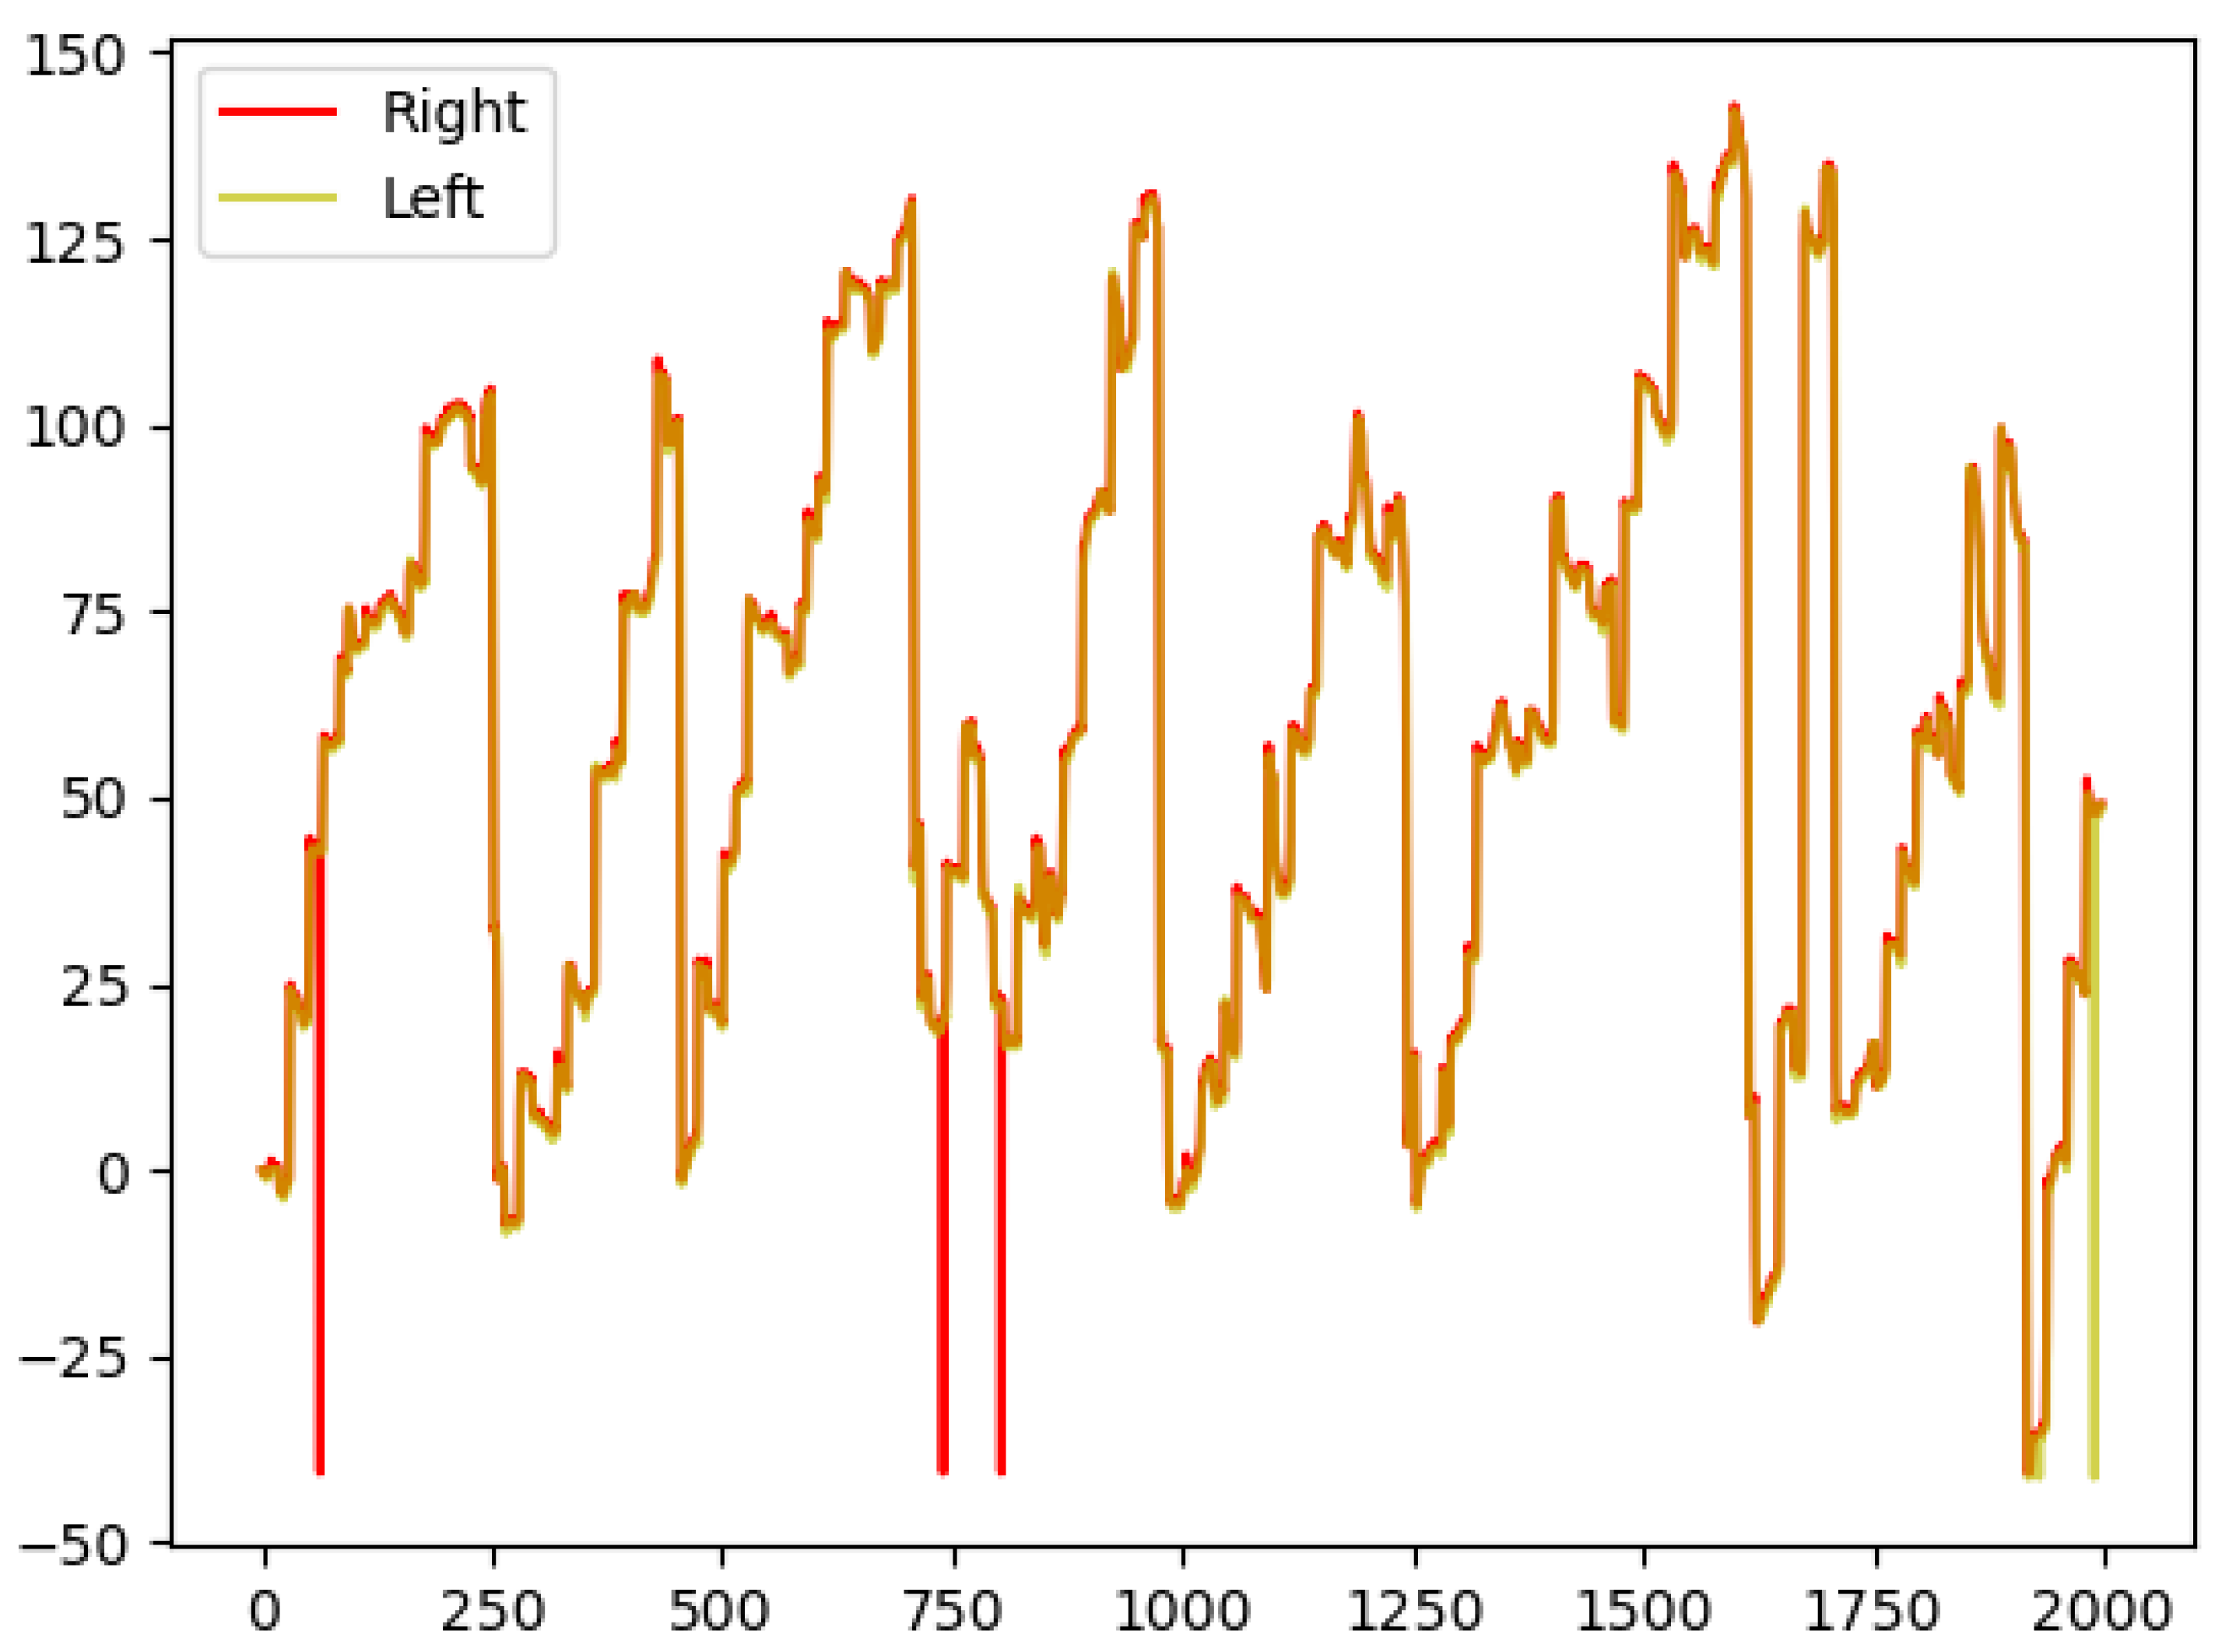
Figure 7.
This visual representation illustrates four segments from a single participant with an accuracy exceeding 96%.
Figure 7.
This visual representation illustrates four segments from a single participant with an accuracy exceeding 96%.
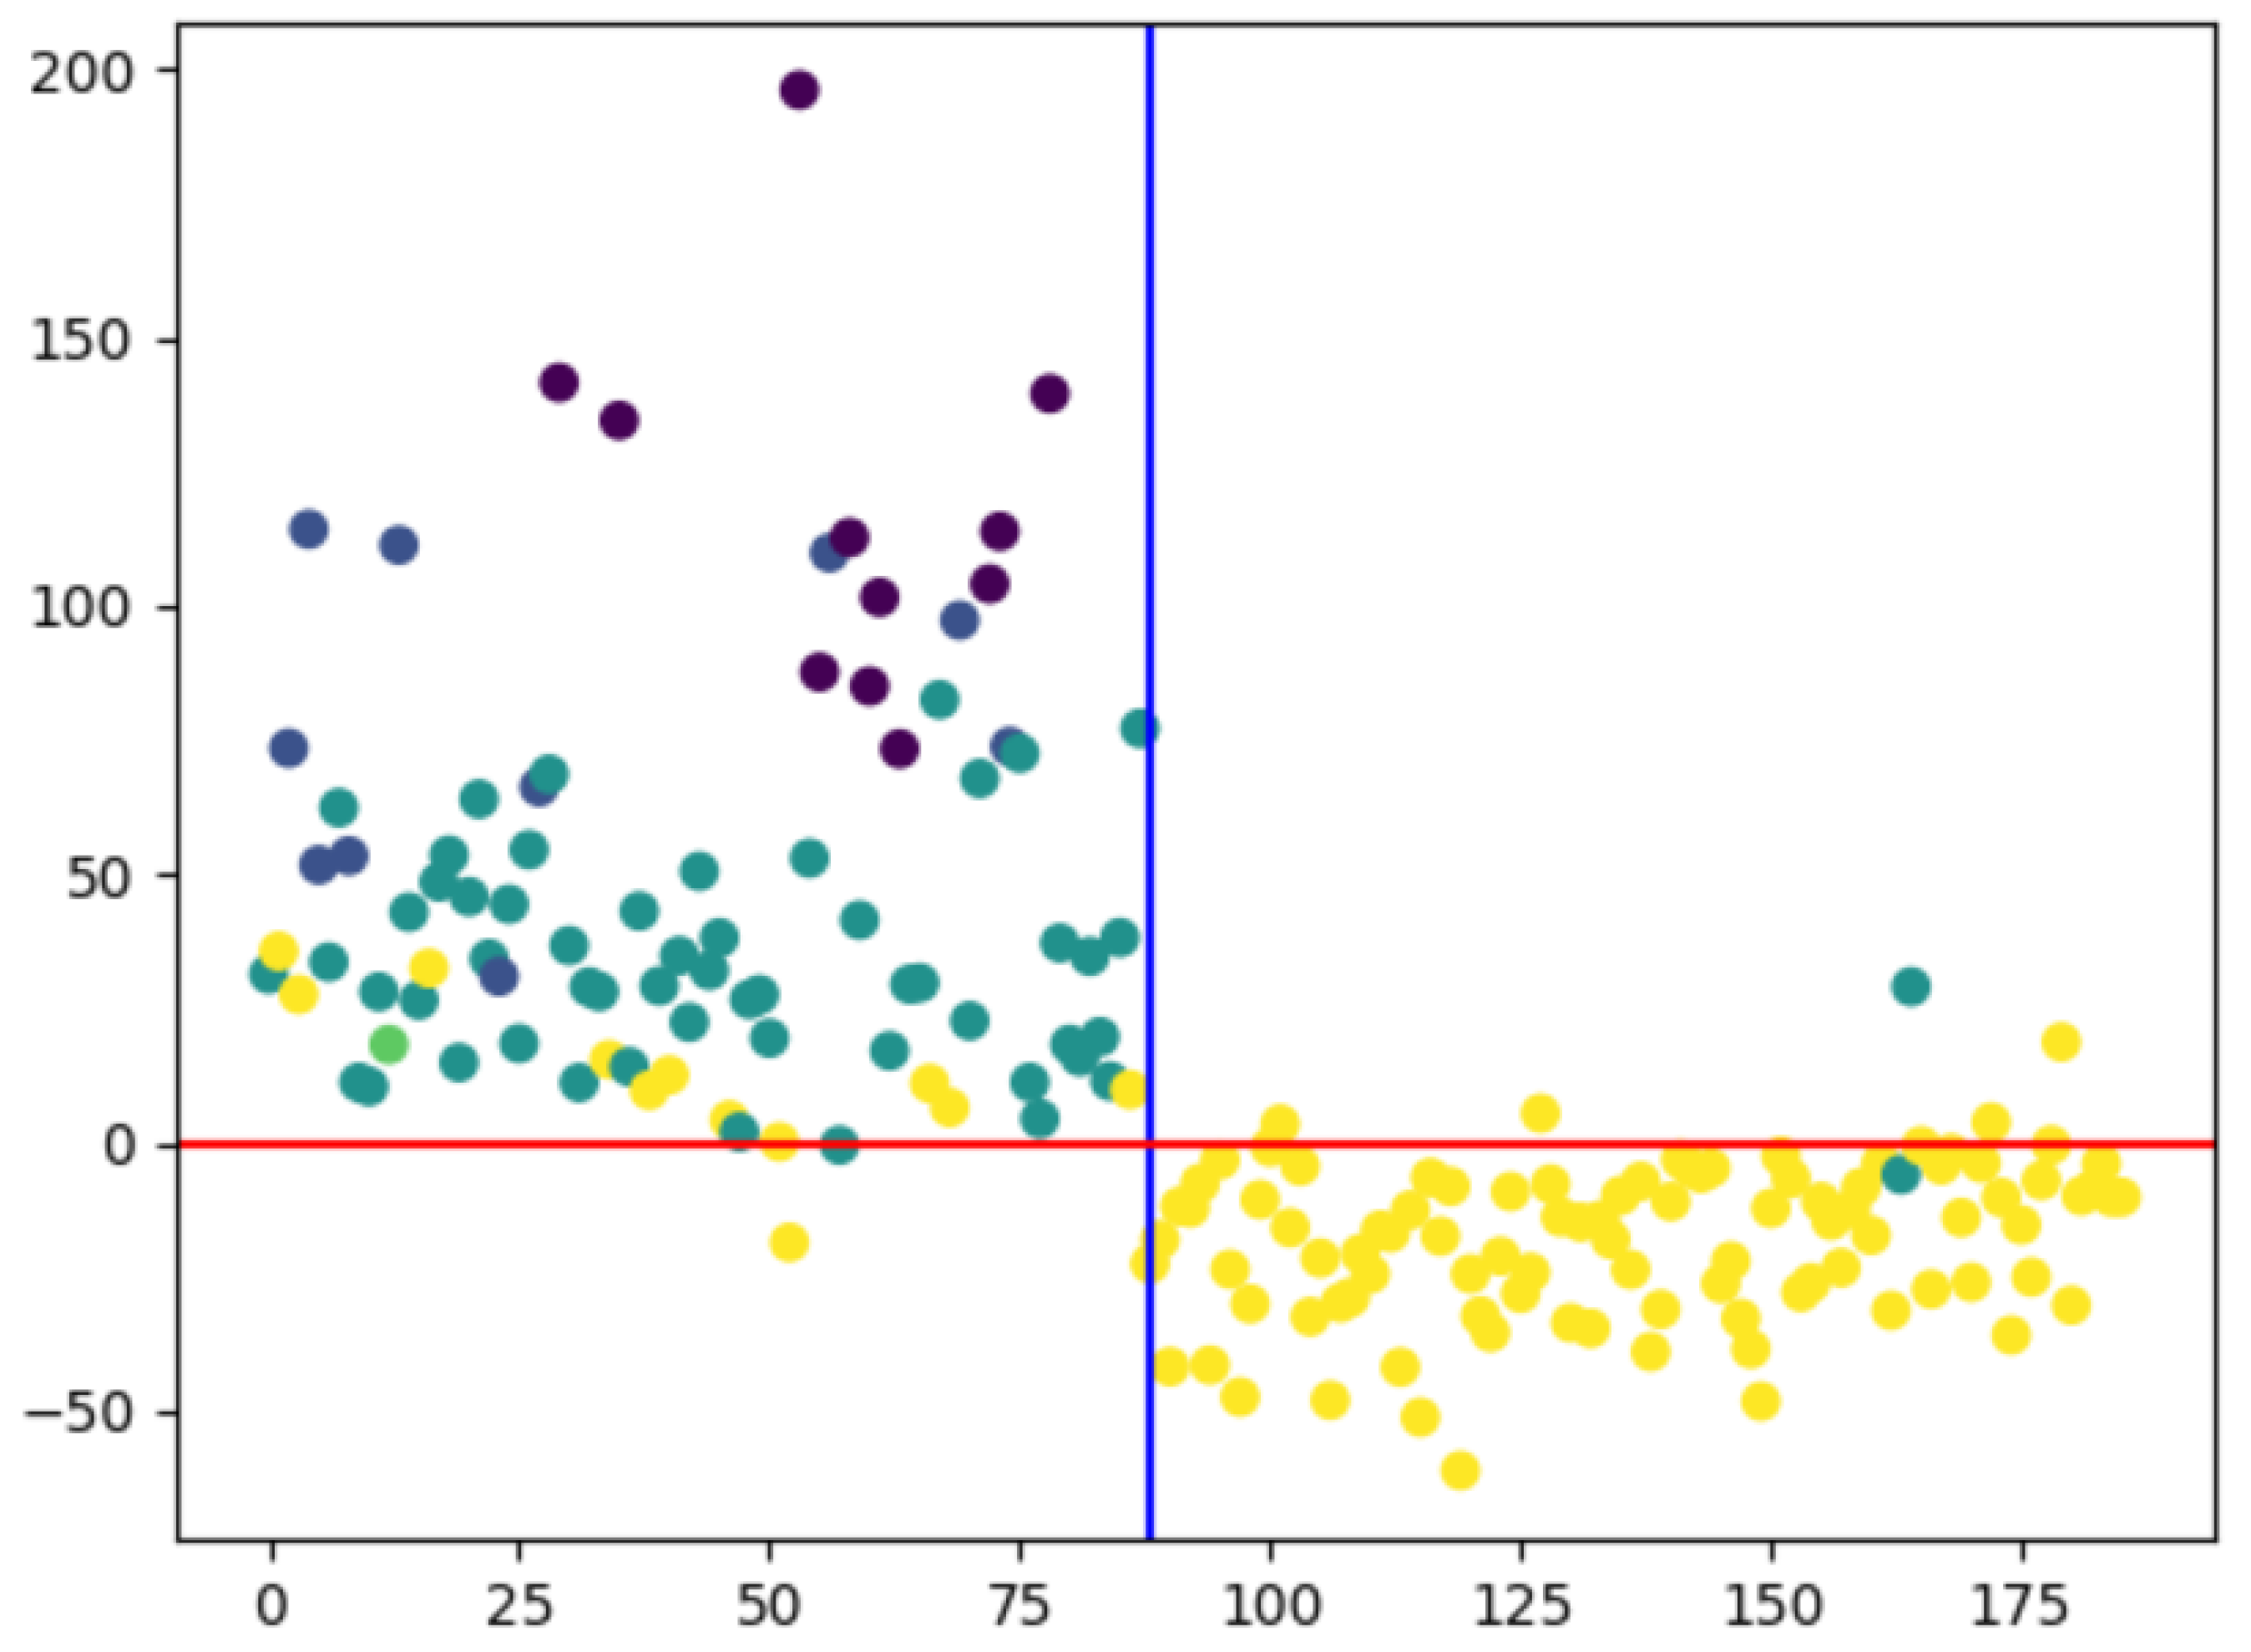

Table 1.
presents a summary of the indicators related to frequency bands and frequencies investigated in dyslexia research.
Table 1.
presents a summary of the indicators related to frequency bands and frequencies investigated in dyslexia research.
| Bands | Indicator | Bands range | Brain regions involved | Implications |
|---|---|---|---|---|
| Delta | Increased activity | 1 : <4 Hz | Temporal regions involved in processing auditory information | Dyslexic people may have difficulty processing and discriminating between different sounds |
| Theta | Change activity | 4:<8 Hz | The left remains more active as compared to the right during the covert speech | Mediation or attention improved visual memory accuracy after the right prefrontal |
| Alpha | Difference in activity | 8: <14 Hz | Parietal regions involved in attention and spatial processing | Dyslexic may exhibit difficulties with attention and spatial awareness |
| Beta | Reduced activity | 14:<30 Hz | Left hemisphere regions involved in language processing and phonological awareness | Dyslexic may exhibit difficulties with phonological processing and language acquisition |
| Gamma | Reduced activity | 30:42 Hz | Left hemisphere regions involved in language processing and phonological awareness | Difficulty processing, rapid changes in sound, or detecting phonemic differences |
Table 2.
EEG activity signals of the brain, reflecting cortical electrical activity while watching MOOC videos, are recorded.
Table 2.
EEG activity signals of the brain, reflecting cortical electrical activity while watching MOOC videos, are recorded.
| Learners | Theta | Count | Beta1 | Count | Beta2 | Count | Theta/Beta1 | Theta/Beta2 | Attention | Mediation |
|---|---|---|---|---|---|---|---|---|---|---|
| 1 | 116851 | 4 | 5171 | 6 | 18233 | 5 | 22.60 | 5171 | 56 | 43 |
| 2 | 41729 | 4 | 4331 | 6 | 3926 | 5 | 9.63 | 4331 | 40 | 35 |
| 3 | 16494 | 3 | 18938 | 5 | 4436 | 5 | 0.87 | 18938 | 47 | 48 |
| 4 | 67143 | 3 | 9773 | 5 | 13860 | 5 | 6.87 | 9773 | 47 | 57 |
| 5 | 72675 | 3 | 4612 | 5 | 4704 | 5 | 15.76 | 4612 | 44 | 53 |
| 6 | 12595 | 3 | 3130 | 5 | 15745 | 4 | 4.02 | 3130 | 44 | 66 |
| 7 | 33117 | 3 | 3406 | 5 | 5975 | 4 | 9.72 | 3406 | 43 | 69 |
| 8 | 15732 | 3 | 2266 | 4 | 11602 | 4 | 6.94 | 2266 | 40 | 61 |
| 9 | 6516 | 3 | 6365 | 4 | 21231 | 4 | 1.02 | 6365 | 43 | 69 |
| 10 | 111295 | 3 | 3536 | 4 | 3961 | 4 | 31.47 | 3536 | 47 | 69 |
Table 3.
EEG activity signals of the brain collected during viewing MOOCs video courses (first 10 records).
Table 3.
EEG activity signals of the brain collected during viewing MOOCs video courses (first 10 records).
| Learners | Theta | Count | Beta1 | Count | Beta2 | Count | Theta/Beta1 | Theta/Beta2 | Attention | Mediation |
| 1 | 31135 | 1 | 40864 | 1 | 4847 | 1 | 0.76 | 40864 | 53 | 61 |
| 2 | 95727 | 1 | 25570 | 1 | 19102 | 1 | 3.74 | 25570 | 64 | 61 |
| 3 | 18650 | 1 | 12578 | 1 | 20930 | 1 | 1.48 | 12578 | 51 | 63 |
| 4 | 148692 | 1 | 7846 | 1 | 3058 | 1 | 18.95 | 7846 | 51 | 63 |
| 5 | 192887 | 1 | 25088 | 1 | 17833 | 1 | 7.69 | 25088 | 54 | 41 |
| 6 | 94153 | 1 | 55903 | 1 | 758 | 1 | 1.68 | 55903 | 64 | 38 |
| 7 | 64087 | 1 | 9758 | 1 | 19191 | 1 | 6.57 | 9758 | 61 | 35 |
| 8 | 6896 | 1 | 3826 | 1 | 25005 | 1 | 1.80 | 3826 | 60 | 29 |
| 9 | 1767 | 1 | 44968 | 1 | 2876 | 1 | 0.04 | 44968 | 60 | 29 |
| 10 | 1E+06 | 1 | 10966 | 1 | 445383 | 1 | 108.00 | 10966 | 64 | 29 |
Table 4.
EEG activity signals of the brain are collected while watching video courses of MOOCs (last 10 records).
Table 4.
EEG activity signals of the brain are collected while watching video courses of MOOCs (last 10 records).
| Learners | Theta | Count | Beta1 | Count | Beta2 | Count | Theta/Beta1 | Theta/Beta2 | Attention | Mediation |
|---|---|---|---|---|---|---|---|---|---|---|
| 1 | 31135 | 1 | 40864 | 1 | 4847 | 1 | 0.76 | 40864 | 53 | 61 |
| 2 | 95727 | 1 | 25570 | 1 | 19102 | 1 | 3.74 | 25570 | 64 | 61 |
| 3 | 18650 | 1 | 12578 | 1 | 20930 | 1 | 1.48 | 12578 | 51 | 63 |
| 4 | 148692 | 1 | 7846 | 1 | 3058 | 1 | 18.95 | 7846 | 51 | 63 |
| 5 | 192887 | 1 | 25088 | 1 | 17833 | 1 | 7.69 | 25088 | 54 | 41 |
| 6 | 94153 | 1 | 55903 | 1 | 758 | 1 | 1.68 | 55903 | 64 | 38 |
| 7 | 64087 | 1 | 9758 | 1 | 19191 | 1 | 6.57 | 9758 | 61 | 35 |
| 8 | 6896 | 1 | 3826 | 1 | 25005 | 1 | 1.80 | 3826 | 60 | 29 |
| 9 | 1767 | 1 | 44968 | 1 | 2876 | 1 | 0.04 | 44968 | 60 | 29 |
| 10 | 1E+06 | 1 | 10966 | 1 | 445383 | 1 | 108.00 | 10966 | 64 | 29 |
Table 5.
A comparative evaluation of EEG signals based on eye state classification is presented in Table 5.
Table 5.
A comparative evaluation of EEG signals based on eye state classification is presented in Table 5.
| Model | Approach | Precision | Recall | F1 | Accuracy |
|---|---|---|---|---|---|
| Old model2 | SVM | 70.59 | 72.48 | 71.52 | 69.89 |
| LR | 54.04 | 58.54 | 56.20 | 52.40 | |
| NN | 57.20 | 68.84 | 62.48 | 58.06 | |
| RNN: LSTM | 66.86 | 71.37 | 69.04 | 67.53 | |
| Our model | SVM | 51.21 | 99.99 | 67.74 | 51.23 |
| LR | 70.78 | 93.41 | 80.21 | 76.98 | |
| NN | 67.10 | 81.89 | 73.76 | 70.90 | |
| RNN: LSTM | 72.32 | 83.72 | 79.12 | 79.65 |
Table 6.
Features evaluation as a comparative evaluation of predicting dyslexia risk as published in PLOS ONE.
Table 6.
Features evaluation as a comparative evaluation of predicting dyslexia risk as published in PLOS ONE.
| Model | Approach | Precision | Recall | F1 | Accuracy |
|---|---|---|---|---|---|
| Old model3 | RF | 86.50 | 89.31 | 87.52 | 88.00 |
| LR | 85.24 | 88.15 | 86.96 | 87.01 | |
| SVM | 87.56 | 89.78 | 88.91 | 88.95 | |
| Our Model | RF | 87.14 | 89.56 | 88.27 | 88.19 |
| LR | 86.26 | 88.69 | 87.98 | 87.78 | |
| SVM | 88.00 | 89.85 | 89.50 | 89.11 |
Disclaimer/Publisher’s Note: The statements, opinions and data contained in all publications are solely those of the individual author(s) and contributor(s) and not of MDPI and/or the editor(s). MDPI and/or the editor(s) disclaim responsibility for any injury to people or property resulting from any ideas, methods, instructions or products referred to in the content. |
© 2024 by the authors. Licensee MDPI, Basel, Switzerland. This article is an open access article distributed under the terms and conditions of the Creative Commons Attribution (CC BY) license (http://creativecommons.org/licenses/by/4.0/).
Copyright: This open access article is published under a Creative Commons CC BY 4.0 license, which permit the free download, distribution, and reuse, provided that the author and preprint are cited in any reuse.


