
Submitted:
04 December 2024
Posted:
05 December 2024
You are already at the latest version
Abstract
To assess the associations between serum and dietary polyunsaturated fatty acids (PUFAs), as well as the inflammatory potential of diet measured by the Children’s Dietary Inflammatory Index (C-DIITM), and recurrent respiratory infections (RRIs) in children. We enrolled 44 children aged 3-16 years with RRIs and 44 healthy controls. Dietary intake was assessed using a 7-day food record from which PUFAs intake and C-DIITM were calculated. Serum PUFAs levels were determined using gas-liquid chromatography-mass spectrometry. The dietary assessment showed a significantly lower fiber intake in children with RRIs. The RRI group had a higher inflammatory potential in the diet than healthy controls. Children with RRIs have higher serum levels of linoleic, arachidonic, and eicosapentaenoic acids than healthy subjects. A pro-inflammatory diet was positively associated with serum n-6 PUFAs levels in both the groups. A high inflammatory potential of diet, body mass index over 75 percentile, and short breastfeeding duration were identified as risk factors for RRIs. The inflammatory potential of diet is strongly associated with RRIs in children and related to their PUFAs status. Promoting breastfeeding and healthy dietary habits during childhood are crucial for implementing effective preventive management strategies.
Keywords:
polyunsaturated fatty acids
; children's dietary inflammatory index
; diet
; children
; recurrent respiratory infections
Introduction
Respiratory tract infections are the most common cause of pediatric morbidity worldwide. In developing countries, recurrent respiratory infections (RRIs) are the leading cause of childhood mortality, resulting in over two million deaths annually [1]. Children with RRIs often require frequent healthcare services, treatment with antibiotics, and surgical procedures, and are more prone to asthma development in early life [2]. Moreover, RRIs harm the socio-economic sector, leading to absences from daycare or school, and are associated with difficulties in the child’s social integration and parental absence from work [2].
Although RRIs are rarely associated with true primary immunodeficiency, this is likely related to the immaturity of the immune system, particularly in the first years of life, when humoral and phagocytic immunity is not yet capable of combatting infectious agents [3]. While appropriate reference values obtained from environmental and genetic risk factors predisposing children to RRIs have been available for some time, and studies concerning better prevention and control of infections remain limited. It is postulated that diet may play an important role among the modifiable risk factors [4].
Optimal nutritional status is important to support immune reactivity [5]. Several reports have highlighted the beneficial effects of polyunsaturated fatty acids (PUFAs) in the prevention or treatment of various health conditions in children, including inflammation [6]. Wang et al. found differences in the PUFAs blood profile in children with RRIs in comparison to healthy subjects [7]. Although the role of dietary n-3 PUFAs supplementation in the occurrence of respiratory infections was examined just in a few studies, there has been a beneficial effect of supplementation on upper respiratory infections in the first year of life [8], and in older children [9]. Consistent with this evidence, other studies have shown that the Mediterranean diet, characterized by high consumption of fresh, natural products like fruits, vegetables, whole grain cereals, pulses, extra virgin olive oil, and nuts, known to be rich in PUFAs, may significantly contribute to symptom reduction in children with recurring colds and frequent inflammatory complications [10].
However, disentangling the effect of a single nutrient for other nutrients is very difficult, given the wide range of interactions between nutrients. Along with a plethora of data supporting the role of dietary components in inflammatory and immune processes, tools have been developed to quantify the overall effect of nutrition on the inflammatory response. The Dietary Inflammatory Index (DII®) is a scoring algorithm for quantifying the inflammatory effect of diet on inflammation [11]. More recently, a dietary inflammatory index for children (C-DIITM) has been derived from The DII® with the use of a database on pediatric population-based food consumption [12]. The DII® or one of its variants, including the C-DIITM, has now been validated with inflammatory biomarkers in over 50 studies worldwide. Previous studies involving children and adolescents have reported associations between C-DII® scores and cardiovascular disease, obesity, and asthma 3. To date, the relationship between RRIs in children and the C-DIITM has not been investigated.
The objective of this study was to investigate the association between the serum profile of PUFAs and the inflammatory potential of diet measured by the C-DIITM in children with RRIs compared with healthy children without RRIs. The secondary aim was to identify the diet-related risk factors for RRIs..
2. Materials and Methods
2.1. Study groups
This single-center study included eighty-eight children of both sexes, born as full-term infants. The sample size calculation, taking into account the prevalence of RRI in European countries and the population of children aged 3–17 years in Poland, according to 2021 data from the Central Statistical Office - GUS), confirmed that the number of study participants is adequate (minimum of 88 individuals). The study was conducted between August 2011 and March 2012. The participants were divided into two groups:
The RRI group consisted of 44 children aged 3-16 years who visited the Clinic of Pediatric Immunology and Rheumatology at Wroclaw Medical University. These visits were made with family doctors’ appointment for diagnostic test as a day patient. To include for the RRI group, a child had to meet at least one of the following criteria [13]:
1) more than six respiratory infections per year,
2) more than one respiratory infection per month involving the upper airways between September and April,
3) more than three respiratory infections per year involving the lower airways.
Children diagnosed with primary or secondary immunodeficiency disease were excluded from the RRI group.
The control group consisted of 44 healthy children aged 2.5-17 years who visited an outpatient department for a routine medical follow-up. Medical history was obtained, and physical examination was performed to ensure the child was healthy and in good physical condition.
Exclusion criteria for both groups included any of the following:
- Systemic diseases or chronic inflammatory diseases,
- History of any illness that affected growth,
- Acute febrile illness based on medical history and clinical examination,
- Family history of immunologic defects,
- Current breastfeeding,
- Intake of PUFA-containing supplements.
The study protocol was approved by the Ethics Committee of Wroclaw Medical University.
Written consent was obtained from the parents or legal guardians of the participants, and from participants over 16 years of age, before participation in the study.
2.2. Study design
Eligible participants underwent interviews and medical examinations by experienced physicians during their visit to the one-day clinic or outpatient department. The number and types of respiratory infections per year were determined from medical records and medical history, along with data on the child’s breastfeeding duration. Parents or legal guardians of all participants (from both group) completed the questionnaire with Warning Signs of Immunodeficiency adapted from the International Union of Immunological Societies Expert Committee [14].
Height and weight were measured by the same person before breakfast using standardized methods and equipment. To evaluate the nutritional status of the children in a clinical setting, body weight, height, and body mass index (BMI) percentiles were used and the results were compared with the relevant percentile curves [15]. The assessment categorized children as follows: within the 25th - 75th percentile range (indicating normal growth), below the 25th percentile (indicating deficient body mass or short stature), or above the 75th percentile (indicating excess weight or height) [15].
2.3. Dietary assessment
The dietary intake of each study participant was analyzed using a 7-day dietary record (5 weekdays and 2 weekend days). To minimize the seasonal influence on nutrient intake, the number of participants in both study groups was matched according to the season of the year. Parents were instructed to record all food and beverages consumed at home. They were asked to obtain information on the type and quantity of products consumed by the child from the person who held custody of the child in their absence. These food records were verified by a trained dietician and analyzed using the computer program Dieta 6.0 (National Food and Nutrition Institute, Poland). Macronutrient and the most critical micronutrient intake (Ca, Fe, vitamin A and C) and the respective percentage of recommendations for Polish children were calculated [16]. Data of physical activity (excluding children less than 7 years old) and taking dietary supplements were also collected. Dietary data extracted from 7-day dietary records were used to calculate C-DIITM scores for all participants according to Khan et al [12]. C-DIITM included 27 components: energy, protein, carbohydrates, total fat, fiber, vitamins A, B1, B2, B3, B6, B12, C, D, E, and folate; saturated fatty acids; monounsaturated fatty acids; PUFAs; n-3 fatty acids; n-6 fatty acids; β-carotene; cholesterol; caffeine; alcohol; iron; magnesium; and zinc. An inflammatory score was assigned to each dietary component based on its literature-derived effects on various inflammatory markers according to Shivappa et al. [11]. The intake of these dietary components was compared with a children population-based food consumption database with Z-scores standardized per 1000 kcal, then the overall C-DIITM score was calculated for each participant’s.
2.4. Laboratory analyses
Venous blood samples for laboratory analyses were drawn in the early morning between 8 and 9 a.m. after overnight fasting. Whole blood samples were used for functional and cytometric tests on the day of blood collection (only in RRI group). Serum separated from blood samples was stored in the Eppendorf test tubes at a temperature of –70 ° C until measurements of serum immunoglobulin and PUFA concentrations.
2.4.1. Immunological parameters
The following measurements were performed in RRI group: complete blood count (CBC); subpopulations of lymphocytes CD3+, CD3+CD4+, CD3+CD8+, CD3–CD56+, and CD19+; the phagocytic activity (phagocytic index) of polymorphonuclear (PMN) leukocytes in the blood; complement haemolytic activity of human serum (CH50) and immunoglobulins concentrations: IgG, IgA, and IgM in the serum. When medical history revealed the possibility of allergy, the total IgE level was assessed. Serum immunoglobulin concentrations were measured by the turbidimetry method; lymphocyte phenotypes were identified by using the Beckman EPICS XL-MCL flow cytometer (Beckman Coulter, USA); the phagocytic index was defined as the mean values of Staphylococcus aureus 209P bacteria ingested per 100 PMN cells; and the complement haemolytic activity of human serum against IgG-opsonized sheep red blood cells (the intensity of haemolysis) was estimated on a spectrophotometer (DYNATECH MR 5000, Dynex Technologies, Chantilly, Virginia, USA) at λ = 540 nm and quantitatively calculated according to the standard hemolytic curve.
2.4.2. PUFA concentrations in serum
Serum PUFA concentrations were determined in both RRI and control groups. Using method as described elsewhere [17]. Briefly, lipids were extracted from serum samples (0.2 ml) with hexane-ethanol mixture, then an organic phase was collected and evaporated under nitrogen. After adding methanol solutions of internal standard (C23:0) and butylated hydroxytoluene (BHT) as an antioxidant agent, fatty acids in samples were converted to the corresponding fatty acids methyl esters (FAME) by addition of methanol and acetyl chloride at 85 0C for 3 h. The FAME were extracted twice using hexane and then concentrated by evaporation under nitrogen. Analysis was performed by gas chromatography coupled with mass spectrometry (GC-MS Quantum XLS, Thermo Fisher). FAME were identified by comparison with the standards and corresponding mass spectra, and quantified with help of internal standard.
2.5. Statistical analyses
Statistical analyses were performed using Statistica 13.0 (StatSoft, Poland). Differences between the RRI and control groups were assessed using Student's t-test, Mann-Whitney U test, and χ2 test, depending on the type of variables and their distribution. Correlations between the dietary variables and serum concentrations of PUFAs were calculated using the Pearson coefficient with Box-Cox transformation for variables that were not normally distributed. The odds of RRIs were calculated in a multivariable-adjusted model using R-4.3.1. p-values < 0.05. In case of statistically significant results of the tests the post-hoc power analysis was performed using G*POWER 3.1 software
3. Results
3.1. Characteristics of the groups
The characteristics of the study groups are presented in Table 1. The groups were similar in terms of age, sex, weight, and height. Upon grouping based on BMI and breastfeeding duration, higher percentages of children above the 75th percentile BMI and breastfeeding below 6 months were present in the RRI group than in the control group (p=0.0068 and p=0.033, respectively). The number of siblings were also differently distributed in RRI and control group (p=0.0001). Serum IgA concentrations lower than the reference range were observed in five children (12%) with RRIs, serum total IgE levels above the reference range in eight children (33%), and eosinophilia in six children (14%) (Table 1). All children with RRIs had serum IgG and IgM levels and subpopulations of CD3+, CD3+CD4+, CD3+CD8+, CD3–56+, and CD19+, phagocytic index, and CH50 within the reference range.
3.2. Analysis of diet
The analysis of the children's diets focused on evaluating the C-DIITM values and intake of macronutrients, critical micronutrients, and fatty acids (Table 2). The diet of children with RRIs provided significantly less fiber (7.97 g/1000 kcal vs 9.43 g/1000 kcal, p=0.0039) and vitamin A (98.2 %RDA vs 131.5 %RDA, p=0.039) compared to the control group. Moreover, the diet of children with RRIs had a higher proportion of pro-inflammatory components, as indicated by higher C-DIITM scores (0.26 vs -0.92, p<0.0001).
3.3. Serum PUFA profile
Serum levels of linoleic acid (LA), arachidonic acid (AA), and eicosapentaenoic acid (EPA) were significantly higher in the RRI group than in the control group (p=0.0085, p=0.014, and p=0.0009, respectively) (Table 3).
3.4. The relation of dietary parameters to serum PUFA and the impact of dietary related factors on RRI risk
Table 4 presents significant Pearson correlations between dietary factors and serum PUFA levels after adjustment for selected confounders, including sex, age, BMI percentile range, and time of breastfeeding in the past. In the RRI group, the energy intake from LA and total PUFAs was positively related to serum ALA concentration (r=0·43 and 0·42, respectively, p≤0·005). Dietary ALA and total PUFAs were inversely associated with PUFA n-6/n-3 ratio in serum in this group (r=-0·36 and -0·32, respectively, p≤0·046). Moreover, a positive correlation was observed between serum AA level and energy-adjusted fat intake (r=0·42, p=0·007) and C-DIITM (r=0·55, p=0·000), while a negative correlation was found with LC-PUFAs (r=-0·33, p=0·040) and fiber intake (r=-0·48, p=0·002). Fiber intake also showed a moderate positive correlation with serum DHA (r=0·43, p=0·005) and a negative correlation with serum n-6/n-3 PUFA ratio (r=0·49, p=0·001). In the control group, energy intake and C-DIITM score were positively associated with serum LA (r=0·33 and 0·35, respectively, p≤0.035), while for energy intake from PUFAs, a negative correlation was found with LA level in serum (r=-0·36, p=0·022). C-DIITM was also positively related to serum n-6/n-3 PUFA ratio (r=0·41, p=0·008); an opposite association between fiber intake and serum AA was observed in healthy subjects (r=-0·36, p=0·024).
3.5. Estimation of the RRI risk associated with the studied parameters
Medical history data and dietary estimates allowed us to identify the potential risk factors for RRIs in children. BMI above the 75th percentile (OR=3.42, 95%CI 0.92-12.72) and an increase in the proinflammatory potential of the diet (OR=4.80, 95%CI 1.73-13.30) were risk factors for RRIs (Figure 1). Moreover, the OR value markedly decreased as the children grew older. There was also a trend in increasing the risk of RRIs with a shorter duration of breastfeeding below 12 months, although this was only discernible for exponentiated data (OR= 3.27, 95%CI 0.91-11.68).
4. Discussion
To the best of our knowledge, this is the first study to focus on the association between the dietary inflammatory potential measured by C-DIITM scores and serum concentration of PUFAs in children with RRIs and the risk of RRIs in children.
In our RRI group, one-third of the children had elevated IgE levels and 14% had eosinophilia. With this background, it is important to note that non-recognized allergic diseases have clinical presentations similar to RRIs. Furthermore, atopic disease is a strong determinant of all upper respiratory tract infections [18]. In this regard, it is interesting to note that Toivonen et al. reported that asthma was diagnosed in 12% of children with respiratory infections [2].
The analysis of the children's diets revealed that the key distinguishing factors in the diets of children with RRIs were lower fiber intake and a higher C-DIITM score (more pro-inflammatory diet) compared to the control group. Nutrients such as fiber, vitamins A, C, and D, and PUFAs have been shown to independently reduce inflammation in the respiratory tract [4,5], and all are included within the C-DIITM score. Fibers exert an anti-inflammatory effect on C-DIITM scores. Thus, it is easy to determine how its intake can improve airway inflammation by promoting the release of anti-inflammatory cytokines and improving glucose control. This effect could be amplified by fiber modulating the gut-related immune response through short-chain fatty acid synthesis through the fermentation of soluble fiber [19]. Interestingly, several studies have reported that patients with asthma tend to consume less fiber compared to healthy controls [20]. Han et al. showed that a higher DII® score was associated with elevated fractional exhaled nitric oxide (a marker of eosinophilic airway inflammation) and increased odds of current wheezing in children [21]. In our study we found a significant positive association between the C-DIITM score and the risk of RRIs. An increase in the inflammatory potential of the diet was associated with an almost 5-fold increase in disease risk.
In the current study, we found higher serum levels of LA, AA, and EPA in children with RRIs than in the healthy controls. Few studies have explored the association between serum PUFA levels and infections in children. One multinational study investigated the relationship between serum PUFA in early childhood and common infections and found positive associations between serum AA and DHA levels and IgG levels against influenza A virus, serum LA levels with a count of Coxsackievirus B (CVB) infections, and a higher n-3 PUFA level with a decreased risk of CVB infection in young children [22]. Wang et al. observed lower levels of LA in viral infection compared to bacterial infection in febrile children, suggesting enhanced lipogenesis and fatty acid uptake in the host cell during viral replication [7]. Few previous studies examining blood PUFAs in children with allergies have reported inconsistent results, such as increased LA and AA levels in plasma [23] and increased EPA levels both in the plasma and cell membranes [24] which is in line with the present study and contributes to the understanding of altered PUFAs metabolism in children with RRIs and allergies.
In our study, we observed no clear correlations between the dietary intake of PUFAs and their serum levels in either the RRI or control groups. Similar findings have been reported in studies involving healthy children and obese pubertal children with metabolic syndrome [25]. Several previous studies have indicated that the concentration of fatty acids in the blood reflects individual endogenous metabolism rather than dietary intake [26].Among dietary components, with the strongest association being found for fiber intake, which exhibited a negative correlation with serum AA levels in both groups and a positive correlation with DHA levels in children with RRIs. We previously demonstrated that children with allergies had lower serum levels of LA than healthy children who followed a vegetarian diet [17]. A vegetarian diet rich in fiber (particularly fermentable fraction), is associated with various beneficial metabolic effects.
It should be noted that our study is the first to reveal the relationship between C-DIITM and PUFAs profile in the blood. An important finding was the positive relationship between higher C-DIITM scores (indicating a pro-inflammatory diet) and serum AA levels in children with RRIs. At the same time, in healthy subjects, C-DIITM was positively related to serum n-6/n-3 PUFAs ratio. The theoretical background of the “linoleic acid pro-inflammatory paradigm” was built on an enhanced synthesis of pro-inflammatory eicosanoids derived from AA and diminished synthesis of anti-inflammatory eicosanoids from EPA and DHA. However, an increasing amount of evidence from human studies suggests that n-6 PUFAs also provide some anti-inflammatory activity, similar to n-3 PUFAs [27]. Considering the results of our study, we assume that PUFAs metabolism, including potential defects in desaturation and elongation or increased beta-oxidation of lipids, differs between RRIs and healthy individuals. Moreover, PUFAs metabolism is influenced by selected nutrients and their metabolites in a complex manner. Overall, our results, along with those from previous studies [17,28], align with existing evidence concerning the associations between diet and immune conditions.
An additional conclusion of this study concerns the diet-related risk factors of RRIs in children. We found that an increased risk of RRIs was associated with a BMI above the 75th percentile, consumption of a high pro-inflammatory diet, and a shortened duration of breastfeeding. Similar to our results, other studies have demonstrated the association between breastfeeding duration of up to 6 months and an increased risk of RRIs [29]. Previous investigations have also demonstrated that children who ate a high pro-inflammatory diet had higher BMI and were more likely to reveal higher levels of inflammatory cytokines [30]. Moreover, consumption of a pro-inflammatory diet during childhood is associated with asthma and increases the odds of current wheezing in adults and children with allergic (atopic) wheezing [20]. Our results support the hypothesis that a nutritionally adequate, anti-inflammatory diet in children and adolescents with a healthy weight is associated with a reduced risk of infection.
Despite its strengths, this study has several limitations. Although the sample size was relatively small, the study design enabled us to identify significant associations and provide a comprehensive picture of these interactions. The cross-sectional design of the study and absence of dietary interventions make causal inferences difficult. Thus, we were not able to conclude whether the presence of RRIs leads to a more pro-inflammatory diet or whether a pro-inflammatory diet leads to RRIs in children. Nevertheless, this study provides a rationale for appropriate intervention studies.
5. Conclusions
In our study, we showed that the serum PUFAs profile of children with RRIs was significantly different from that of healthy children, regardless of the absence of differences in dietary PUFAs intake. Diet quality, particularly in terms of inflammatory potential, is strongly and positively associated with RRIs in children. The inflammatory potential of diet and nutritional status assessment may represent crucial factors in comprehensive interventions to combat RRIs as well as for establishing rational preventive dietary management.
Abbreviations: AA: arachidonic acid; ALA, alpha-linolenic acid; BMI, body mass index; C-DIITM, Children’s Dietary Inflammatory Index; CVB, Coxsackievirus B; DHA, docosahexaenoic acid; DII®, Dietary Inflammatory Index; EPA, eicosapentaenoic acid; LA, linoleic acid; MAR, Mean Adequacy Ratio; PUFAs, polyunsaturated fatty acids; RRIs, recurrent respiratory infections; .
Author Contributions
Conceptualization, D.G. and A.P.; methodology, B.S. and J.R.H.; validation, B.S. and J.R.H.; investigation, K.S, M.P., L.Z., M.D.W., and N.Z.; writing—original draft preparation, D.G. and K.S.; writing—review and editing, D.G. and A.P., supervision, A.P.; funding acquisition, A.P.. All authors have read and agreed to the published version of the manuscript.
Funding
This work was supported by Wroclaw Medical University grant No. ST-653 funding.
Institutional Review Board Statement
The study was conducted in accordance with the Declaration of Helsinki, and approved by Ethics Committee of Wroclaw Medical University (KB – 162/2011).
Informed Consent Statement
Informed consent was obtained from all subjects involved in the study.
Data Availability Statement
The data presented in this study are openly available in FigShare at 10.6084/m9.figshare.27948459.
Acknowledgments
The authors would like to thank Professor Krzysztof Kujawa from Wroclaw Medical University for his valuable advice and support with the statistical analysis. We thank all participating children and families for their invaluable contribution to the study.
Conflicts of Interest
The authors declare no conflict of interest. The Wroclaw Medical University had no role in the design, analyses and in the writing of the manuscript.
References
- Rudan, I.; Boschi-Pinto, C.; Biloglav, Z.; Mulholland, K.; Campbell, H. Epidemiology and Etiology of Childhood Pneumonia. Bulletin of the World Health Organization. May 2008, pp 408–416. https://doi.org/10.2471/BLT.07.048769.
- Toivonen, L.; Karppinen, S.; Schuez-Havupalo, L.; Teros-Jaakkola, T.; Vuononvirta, J.; Mertsola, J.; He, Q.; Waris, M.; Peltola, V. Burden of Recurrent Respiratory Tract Infections in Children: A Prospective Cohort Study. Pediatr Infect Dis J 2016, 35, e362–e369. https://doi.org/10.1097/INF.0000000000001304.
- Simon, A. K.; Hollander, G. A.; McMichael, A. Evolution of the Immune System in Humans from Infancy to Old Age. Proceedings of the Royal Society B: Biological Sciences. Royal Society of London December 23, 2015. https://doi.org/10.1098/rspb.2014.3085.
- Chiappini, E.; Santamaria, F.; Marseglia, G. L.; Marchisio, P.; Galli, L.; Cutrera, R.; de Martino, M.; Antonini, S.; Becherucci, P.; Biasci, P.; et al. Prevention of Recurrent Respiratory Infections: Inter-Society Consensus. Ital J Pediatr. BioMed Central Ltd December 1, 2021. https://doi.org/10.1186/s13052-021-01150-0.
- Shao, T.; Verma, H. K.; Pande, B.; Costanzo, V.; Ye, W.; Cai, Y.; Bhaskar, L. V. K. S. Physical Activity and Nutritional Influence on Immune Function: An Important Strategy to Improve Immunity and Health Status. Front Physiol. Frontiers Media S.A. October 8, 2021. https://doi.org/10.3389/fphys.2021.751374.
- Calder, P. C. Omega-3 Polyunsaturated Fatty Acids and Inflammatory Processes: Nutrition or Pharmacology? Br J Clin Pharmacol 2013, 75, 645–662. https://doi.org/10.1111/j.1365-2125.2012.04374.x.
- Wang, X.; Nijman, R.; Camuzeaux, S.; Sands, C.; Jackson, H.; Kaforou, M.; Emonts, M.; Herberg, J. A.; Maconochie, I.; Carrol, E. D.; et al. Plasma Lipid Profiles Discriminate Bacterial from Viral Infection in Febrile Children. Sci Rep 2019, 9. https://doi.org/10.1038/s41598-019-53721-1.
- Birch, E. E.; Khoury, J. C.; Berseth, C. L.; Castañeda, Y. S.; Couch, J. M.; Bean, J.; Tamer, R.; Harris, C. L.; Mitmesser, S. H.; Scalabrin, D. M. The Impact of Early Nutrition on Incidence of Allergic Manifestations and Common Respiratory Illnesses in Children. J Pediatr 2010, 156. https://doi.org/10.1016/j.jpeds.2010.01.002.
- Thienprasert, A.; Samuhaseneetoo, S.; Popplestone, K.; West, A. L.; Miles, E. A.; Calder, P. C. Fish Oil N-3 Polyunsaturated Fatty Acids Selectively Affect Plasma Cytokines and Decrease Illness in Thai Schoolchildren: A Randomized, Double-Blind, Placebo-Controlled Intervention Trial. J Pediatr 2009, 154, 391–395. https://doi.org/10.1016/j.jpeds.2008.09.014.
- Calatayud, F. M.; Calatayud, B.; Gallego, J. G.; González-Martín, C.; Alguacil, L. F. Effects of Mediterranean Diet in Patients with Recurring Colds and Frequent Complications. Allergol Immunopathol (Madr) 2017, 45, 417–424. https://doi.org/10.1016/j.aller.2016.08.006.
- Shivappa, N.; Steck, S. E.; Hurley, T. G.; Hussey, J. R.; Hébert, J. R. Designing and Developing a Literature-Derived, Population-Based Dietary Inflammatory Index. Public Health Nutr 2014, 17, 1689–1696. https://doi.org/10.1017/S1368980013002115.
- Khan, S.; Wirth, M. D.; Ortaglia, A.; Alvarado, C. R.; Shivappa, N.; Hurley, T. G.; Hebert, J. R. Design, Development and Construct Validation of the Children’s Dietary Inflammatory Index. Nutrients. MDPI AG August 1, 2018. https://doi.org/10.3390/nu10080993.
- 13 Gruppo di studio di Immunologia della società Italiana di Pediatria. Le Infezioni Ricorrenti Nel Bambino: Definizione Ed Approccio Diagnostico. Riv Immunol Allergol Pediatrica 1988, 2, 127–134.
- Notarangelo, L. D. Primary Immunodeficiencies. J Allergy Clin Immunol 2010, 125 (2 SUPPL. 2). https://doi.org/10.1016/j.jaci.2009.07.053.
- Palczewska, I. , Niedźwiedzka, Z. Somatic Development Indices in Children and Youth of Warsaw (in Polish). Med Wieku Rozwoj 2001, 5, 18–118.
- Jarosz, M.; Rychlik, E.; Stoś, K.; Charzewska, J. Normy żywienia dla populacji Polski i ich zastosowanie. Narodowy Instytut Zdrowia Publicznego – Państwowy Zakład Higieny: Warszawa, Poland, 2020, ISBN: 978-83-65870-28-5.
- Gorczyca, D.; Paściak, M.; Szponar, B.; Gamian, A.; Jankowski, A. An Impact of the Diet on Serum Fatty Acid and Lipid Profiles in Polish Vegetarian Children and Children with Allergy. Eur J Clin Nutr 2011, 65, 191–195. https://doi.org/10.1038/ejcn.2010.231.
- Peeters, D.; Verhulst, P.; Vaessen-Verberne, A. A. P. H.; Van Den Tweel, X. W.; Noordzij, J. G.; Driessen, G. J. A. Low Prevalence of Severe Underlying Pathology in Children with Recurrent Respiratory Tract Infections. Pediatr Infect Dis J 2021, 40, E424–E426. https://doi.org/10.1097/INF.0000000000003256.
- Alwarith, J.; Kahleova, H.; Crosby, L.; Brooks, A.; Brandon, L.; Levin, S. M.; Barnard, N. D. The Role of Nutrition in Asthma Prevention and Treatment. Nutr Rev 2020, 78, 928–938. https://doi.org/10.1093/nutrit/nuaa005.
- Berthon, B. S.; MacDonald-Wicks, L. K.; Gibson, P. G.; Wood, L. G. Investigation of the Association between Dietary Intake, Disease Severity and Airway Inflammation in Asthma. Respirology 2013, 18, 447–454. https://doi.org/10.1111/resp.12015.
- Han, Y. Y.; Forno, E.; Shivappa, N.; Wirth, M. D.; Hébert, J. R.; Celedón, J. C. The Dietary Inflammatory Index and Current Wheeze Among Children and Adults in the United States. J Allergy Clin Immunol Pract 2018, 6, 834-841.e2. https://doi.org/10.1016/j.jaip.2017.12.029.
- Hakola, L.; Oikarinen, M.; Niinistö, S.; Cuthbertson, D.; Lehtonen, J.; Puustinen, L.; Sioofy-Khojine, A. B.; Honkanen, J.; Knip, M.; Krischer, J. P.; Erlund, I.; Hyöty, H.; Virtanen, S. M. Serum 25-Hydroxyvitamin D and Fatty Acids in Relation to the Risk of Microbial Infections in Children: The TRIGR Divia Study. Clin Nutr 2022, 41, 2729–2739. https://doi.org/10.1016/j.clnu.2022.10.017.
- Ekström, S.; Sdona, E.; Klevebro, S.; Hallberg, J.; Georgelis, A.; Kull, I.; Melén, E.; Risérus, U.; Bergström, A. Dietary Intake and Plasma Concentrations of PUFAs in Childhood and Adolescence in Relation to Asthma and Lung Function up to Adulthood. Am J Clin Nutr 2022, 115, 886–896. https://doi.org/10.1093/ajcn/nqab427.
- Griese, M. I.; Schur, N. I.; Laryea, M. D.; Bremer, H.; Reinhardt, D.; Biggemann, B. Fatty Acid Composition of Phospholipids of Plasma and of Mononuclear Blood Cells in Children with Allergic Asthma and the Influence of Glucocorticoids; Springer, 1990; Vol. 149.
- Burrows, T.; Berthon, B.; Garg, M. L.; Collins, C. E. A Comparative Validation of a Child Food Frequency Questionnaire Using Red Blood Cell Membrane Fatty Acids. Eur J Clin Nutr 2012, 66, 825–829. https://doi.org/10.1038/ejcn.2012.26.
- Schulze, M. B.; Minihane, A. M.; Saleh, R. N. M.; Risérus, U. Intake and Metabolism of Omega-3 and Omega-6 Polyunsaturated Fatty Acids: Nutritional Implications for Cardiometabolic Diseases. Lancet Diabetes Endocrinol. Lancet Publishing Group November 1, 2020, pp 915–930. https://doi.org/10.1016/S2213-8587(20)30148-0.
- Zhao, J. V.; Schooling, C. M. The Role of Linoleic Acid in Asthma and Inflammatory Markers: A Mendelian Randomization Study. Am J Clin Nutr 2019, 110, 685–690. https://doi.org/10.1093/ajcn/nqz130.
- Gorczyca, D.; Postępski, J.; Czajkowska, A.; Paściak, M.; Prescha, A.; Olesińska, E.; Gruenpeter, A.; Lachór-Motyka, I.; Szponar, B. The Profile of Polyunsaturated Fatty Acids in Juvenile Idiopathic Arthritis and Association with Disease Activity. Clin Rheumatol 2017, 36, 1269–1279. https://doi.org/10.1007/s10067-017-3586-9.
- Zhou, B.; Niu, W.; Liu, F.; Yuan, Y.; Wang, K.; Zhang, J.; Wang, Y.; Zhang, Z. Risk Factors for Recurrent Respiratory Tract Infection in Preschool-Aged Children. Pediatr Res 2021, 90, 223–231. https://doi.org/10.1038/s41390-020-01233-4.
- Zhang, C.; Ren, W.; Li, M.; Wang, W.; Sun, C.; Liu, L.; Fang, Y.; Liu, L.; Yang, X.; Zhang, X.; Li, S. Association Between the Children’s Dietary Inflammatory Index (C-DII) and Markers of Inflammation and Oxidative Stress Among Children and Adolescents: NHANES 2015-2018. Front Nutr 2022, 9. https://doi.org/10.3389/fnut.2022.894966.
Figure 1.
Forest plot of multiple regression model with selected predictors of respiratory tract infections (RRIs). Due to the failure to meet the linearity condition, the following ordinal variables were used: age (1 = <6 y; 2 = 6–12 y; 3 = >12 y), breastfeeding (1 = >12 months; 2 = 7–12 months; 3 = 0–6 months; 4 = 0 months), children dietary inflammatory index - C-DIITM (1 = 1st tertile; 2 = 2nd tertile; 3 = 3rd tertile). For percentile BMI (kg/m2) the 25-75th range was used as a reference, BMI (High) = <25th BMI percentile, BMI (Low) = >75th BMI percentile. C-DIITM tertiles: 1st from -4.11 to -1.01; 2nd from -0.94 to 0.29; 3rd from 0.39 to 3.32. L – linear component; C –quadratic component; Q – qubic component..
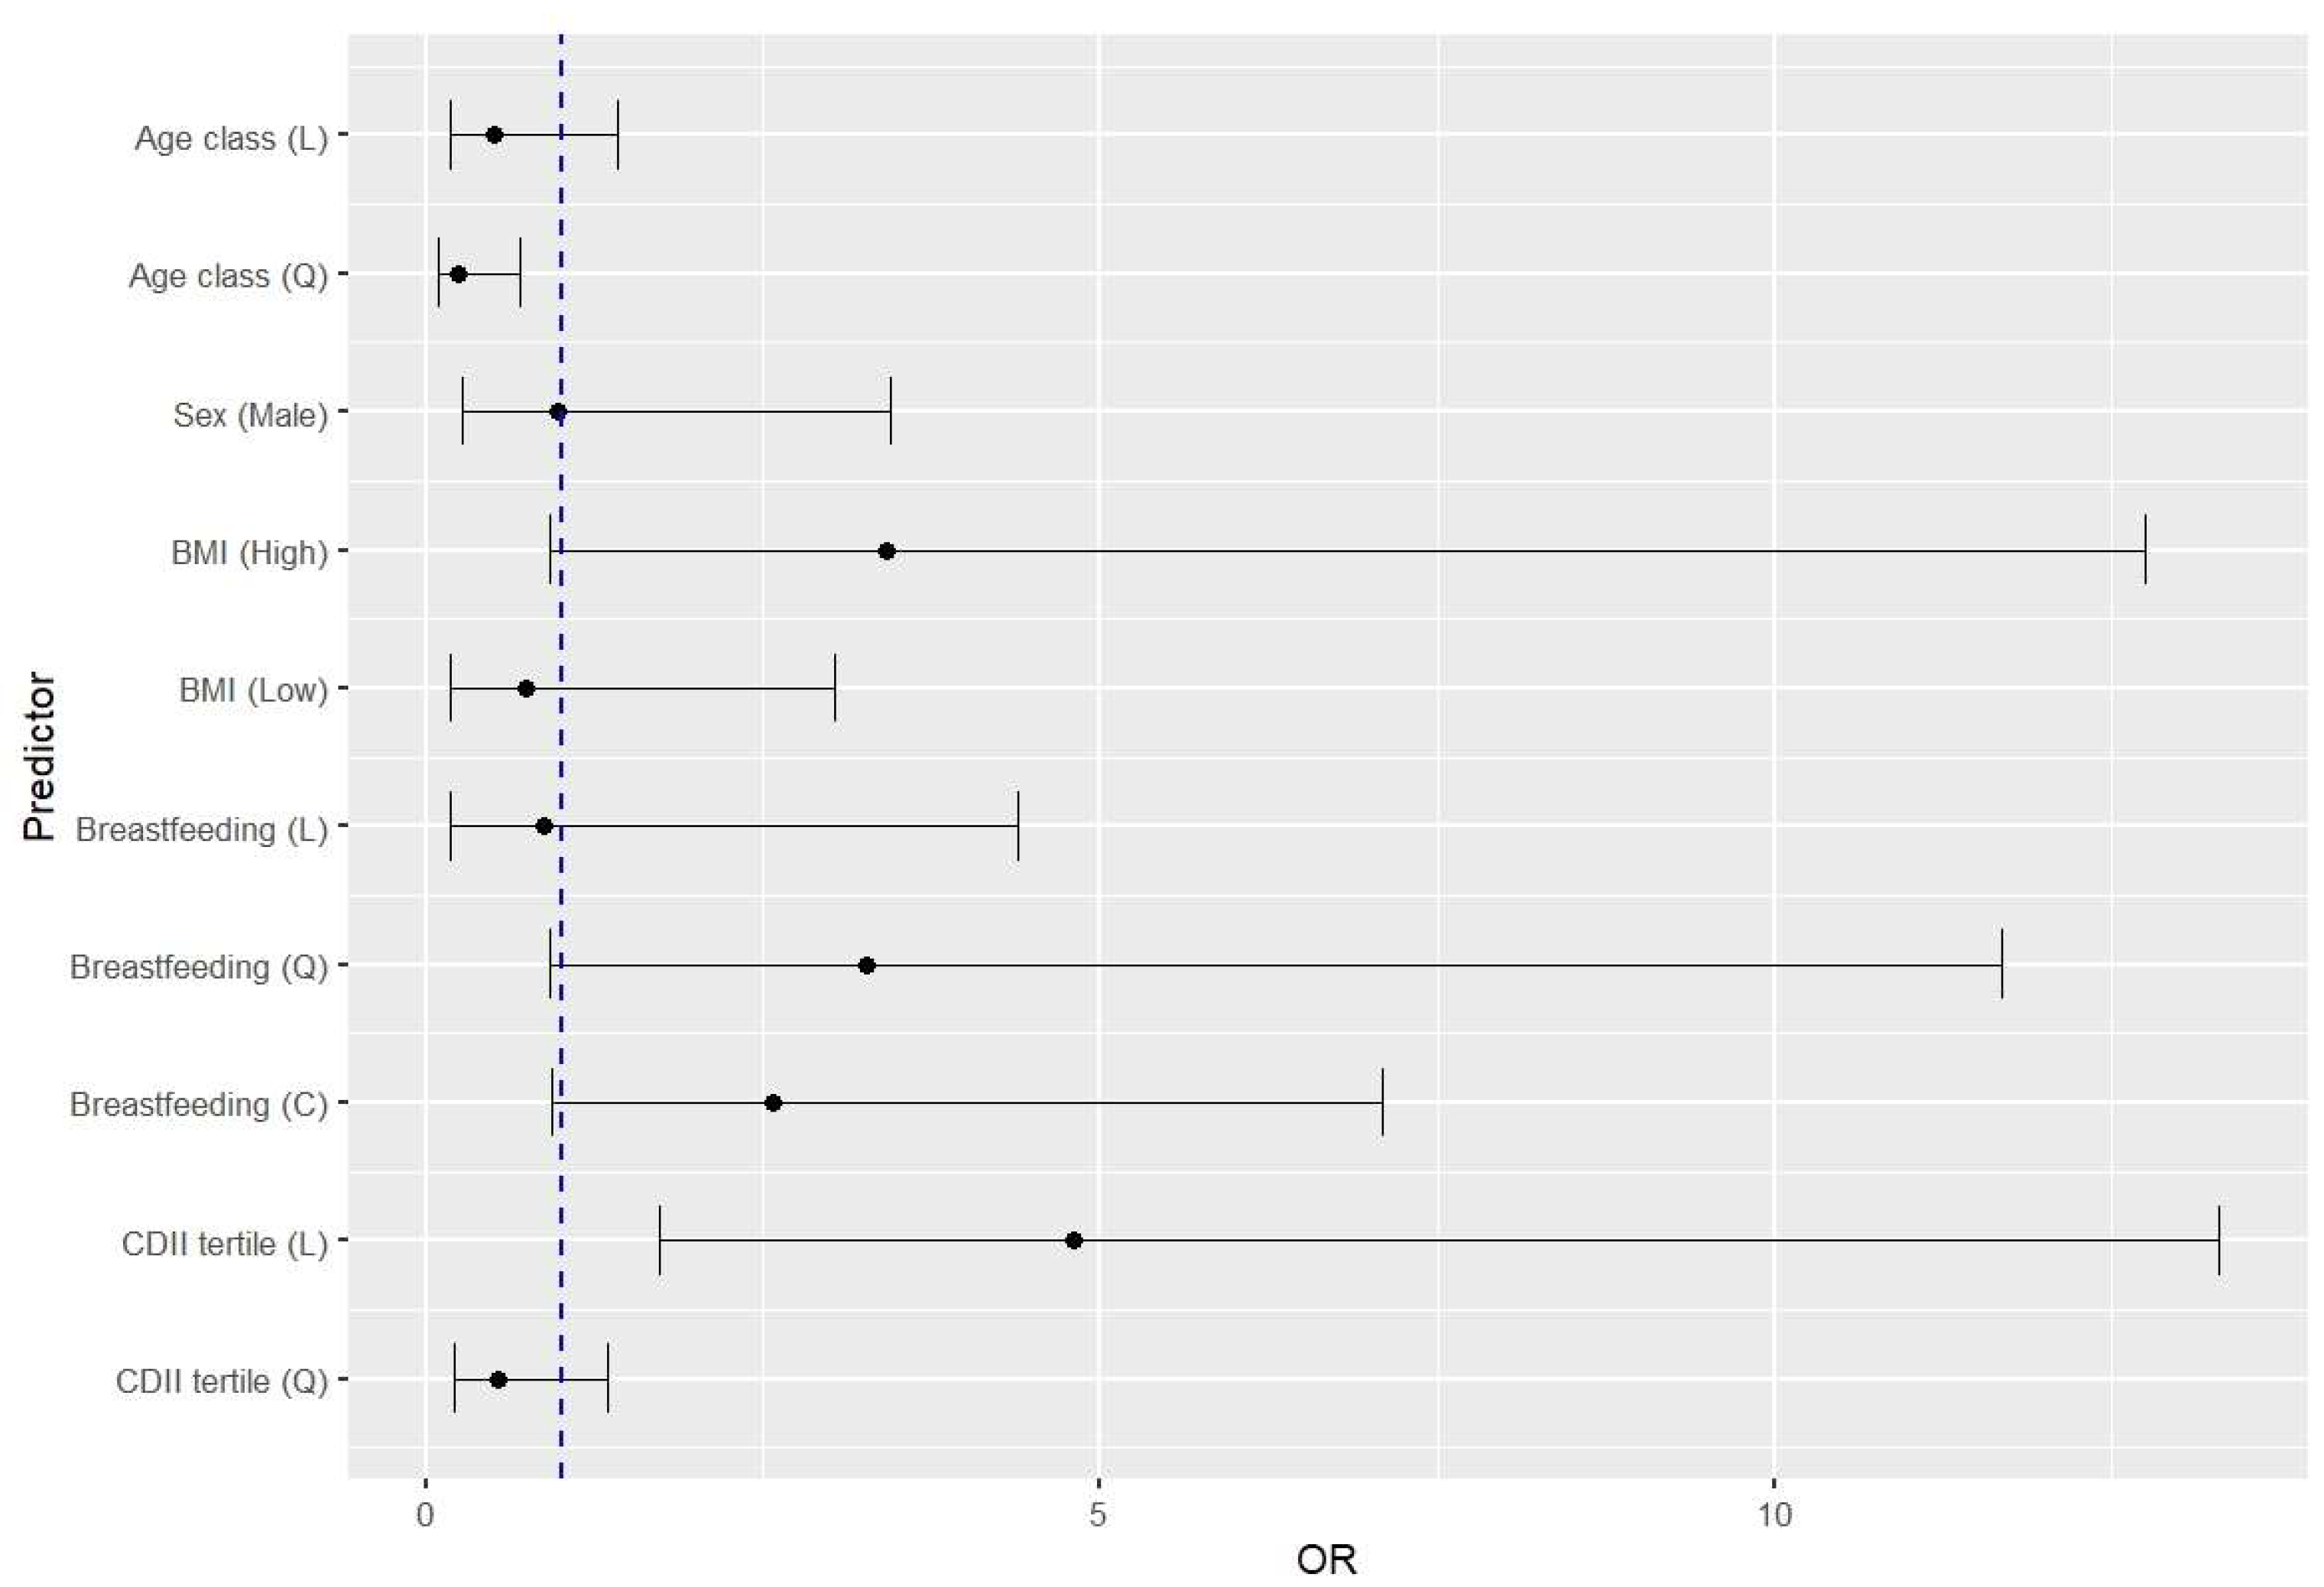

Table 1.
Characteristics of children with RRI and healthy controls.
| RRI group (n=44) | Control group (n=44) | p-value | |
| Age (y), median (Q1-Q3) | 6.5 (3.0–16.3) | 6.3 (2.5–17.0) | 0.49 |
| Sex, female/male, n (%)/n(%) | 20/24 | 20/24 | 0.99 |
| Weight (percentile ranges), n (%) | |||
| <25 | 5 | 6 | 0.58 |
| 25-75 | 21 | 25 | |
| >75 | 18 | 13 | |
| Height (percentile ranges), n (%) | |||
| <25 | 6 | 3 | 0.57 |
| 25-75 | 25 | 26 | |
| >75 | 13 | 15 | |
| BMI (percentile ranges), n (%) | |||
| <25 | 4 | 11 | 0.0068 |
| 25-75 | 16 | 23 | |
| >75 | 24 | 10 | |
| Breastfeeding (months), n (%) | |||
| 0 | 9 | 2 | |
| 1-6 | 12 | 23 | 0.033 |
| 7-12 | 17 | 14 | |
| >12 | 6 | 5 | |
| Subjects with IgA levels lower than the normal range depended on age, n (%) | 5 | ·· | ·· |
| Subjects with IgE levels higher than the normal range depended on age, n (%) | 8 | ·· | ·· |
| Subjects with eosinophilia, n (%) | 6 | ·· | ·· |
Differences with p <0.05, in bold.
Table 2.
Dietary intakes, dietary fat composition, and energy adjusted children’s dietary inflammatory index (C-DII) in RRI and control group; median (Q1 – Q3).
Table 2.
Dietary intakes, dietary fat composition, and energy adjusted children’s dietary inflammatory index (C-DII) in RRI and control group; median (Q1 – Q3).
| Dietary parameter | RRI group | Control group | p-value |
| Energy | |||
| Intake, kcal% EER | 1493 (1308 – 1831)91.6 (70.3 – 123.8) | 1397 (1261 - 1900)92.7 (68.1 – 111.0) | 0.7280.210 |
| Protein | |||
| Intake, g/1000 kcal% RDA | 38.3 (33.4 – 41.1)235.2 (140.6 – 285.6) | 37.8 (35.1- 42.1)277.1 (145.5 – 271.6) | 0.9660.299 |
| Carbohydrates (available) | |||
| Intake, g/1000 kcal%RDA | 135.2 (123.6 – 146.5)156.9 (134.5 – 188.3) | 135.3 (122.9 - 142.6)149.2 (122.7 – 194.4) | 0.1720.817 |
| Fiber | |||
| Intake, g/1000 kcal% AI | 7.97 (6.75 – 8.90)77.8 (70.2 – 94.3) | 9.43 (7.41 – 10.91)103.5 (75.1 – 116.3) | 0.0040.006 |
| Fat | |||
| Intake, g/1000 kcal% RDA | 33.0 (28.4 – 35.5)87.6 (67.5 – 113.6) | 33.1 (28.0 - 38.4)83.0 (43.4 - 156.4) | 0.2200.344 |
| SFA, % energy | 12.0 (9.6 – 13.3) | 11.7 (10.5 – 13.7) | 0.368 |
| MUFA, % energy | 10.7 (9.0 – 12.2) | 10.3 (8.6 – 12.8) | 0.160 |
| PUFA, % energy | 3.33 (2.52 – 4.25) | 3.86 (2.70 – 4.81) | 0.073 |
| LA, % energy | 2.73 (2.17 – 3.55) | 3.17 (2.27 – 3.87) | 0.083 |
| ALA, % energy | 0.42 (0.34 – 0.58) | 0.45 (0.37 – 0.56) | 0.394 |
| AA intake, mg/day | 54.5 (33.5 – 102.6) | 55.4 (28.5 – 92.7) | 0.730 |
| EPA intake, mg/day | 7.4 (3.27 – 16.71) | 14.8 (3.97 – 35.7) | 0.104 |
| DHA intake, mg/day | 26.4 (9.08 – 43.69) | 33.3 (17.6 – 60.1) | 0.224 |
| VLC-PUFA, % AI | 15.3 (6.6 – 24.6) | 20.4 (11.4 – 46.6) | 0.107 |
| n-6/n-3 FA ratio | 6.02 (4.64 – 7.30) | 6.00 (4.71 – 7.62) | 0.689 |
| Vitamin A, %RDA | 103.2 (77.6 – 189.6) | 138.1 (99.1 – 239.3) | 0.039 |
| Vitamin C, %RDA | 104.1 (65.9 – 128.7) | 109.5 (73.2 – 196.3) | 0.157 |
| Calcium, %RDA | 56.5 (35.6 – 68.9) | 57.3 (40.9 – 81.9) | 0.486 |
| Iron, %RDA | 71.0 (56.8 – 86.2) | 82.9 (61.6 – 100.1) | 0.104 |
| C-DII | 0.26 (0.95 – 2.53) | -0.92 (-1.30 – 1.66) | 0.000 |
Differences with p <0.05, in bold. EER – estimated energy requirements; RDA – recommended dietary allowance; AI – average intake; SFA – saturated fatty acids; MUFA – monounsaturated fatty acids; PUFA – polyunsaturated fatty acids; LA – linolein acid; ALA – α-linolenic acid; AA – arachidonic acid; EPA – eicosapentaenoic acid; DHA – docosahexaenoic acid, VLC-PUFA – very long chain-PUFA, n-6/n-3 FA ratio – the ratio of fatty acids from n-6 to n-3 family; C-DII - energy adjusted children’s dietary inflammatory index
Table 3.
Serum PUFA in children with RRI and healthy controls (mg/dl).
| Fatty acid | RRI group | Control group | p-value |
| LA | 59.78 (41.51-79.11) | 51.28 (36.00-78.23) | 0.025 |
| AA | 12.62 (6.92-20.18) | 10.59 (6.98-18.22) | 0.042 |
| ALA | 1.57 (0.61-3.46) | 1.89 (0.42-3.62) | 0.911 |
| EPA | 1.74 (0.76-3.05) | 1.30 (0.55-2.69) | 0.007 |
| DHA | 2.76 (1.32-8.75) | 2.38 (1.20-4.47) | 0.113 |
| n-6/n-3 FA ratio | 12.52 (4.64-22.40) | 12.52 (4.99-21.52) | 0.841 |
Differences with p <0.05, in bold. LA – linolein acid; ALA – α-linolenic acid; AA – arachidonic acid; EPA – eicosapentaenoic acid; DHA – docosahexaenoic acid; , n-6/n-3 FA ratio –the ratio of fatty acids from n-6 to n-3 family.
Table 4.
Correlations of dietary fat components, C-DIITM, and fiber with the level of PUFAs in serum adjusted by age, sex, BMI percentile, and breastfeeding duration.
Table 4.
Correlations of dietary fat components, C-DIITM, and fiber with the level of PUFAs in serum adjusted by age, sex, BMI percentile, and breastfeeding duration.
| Serum PUFAs | ||||||
| LA | AA | ALA | EPA | DHA | PUFA n-6/n-3 | |
| RRI group | ||||||
| Fat, intake/1000 kcal | 0.15 (0.35) | 0.39 (0.013, 0.784) | 0.16 (0.32) | 0.07 (0.65) | -0.08 (0.62) | 0.10 (0.56) |
| LA, % energy of diet | -0.08 (0.63) | -0.14 (0.40) | 0.42 (0.007, 0.851) | 0.12 (0.48) | 0.11 (0.50) | -0.25 (0.12) |
| ALA, % energy of diet | -0.17 (0.31) | -0.15 (0.36) | 0.09 (0.59) | 0.12 (0.45) | 0.34 (0.032, 0.649) | -0.36 (0.03, 0.706) |
| PUFAs, % energy of diet | -0.01 (0.94) | -0.20 (0.21) | 0.39 (0.0012, 0.784) | 0.11 (0.48) | 0.18 (0.28) | -0.32 (0.046, 0.591) |
| n-3 PUFAs, % energy of diet | -0.01 (0.94) | -0.20 (0.21) | 0.04 (0.82) | -0.10 (0.54) | -0.34 (0.031, 0.561) | -0.20 (0.22) |
| EPA, mg/day | -0.16 (0.32) | -0.34 (0.032, 0.591) | -0.12 (0.48) | -0.06 (0.74) | 0.02 (0.91) | 0.02 (0.89) |
| DHA, mg/day | -0.21 (0.14) | -0.34 (0.031, 0.561) | 0.05 (0.75) | -0.18 (0.25) | 0.14 (0.39) | -0.11 (0.50) |
| Fiber, intake/1000 kcal | -0.20 (0.21) | -0.44 (0.004, 0.888) | 0.05 (0.77) | -0.04 (0.80) | 0.45 (0.005, 0.904) | -0.47 (0.002, 0.932) |
| C-DIITM | 0.29 (0.07) | 0.55 (<0.0001, 0.989) | -0.09 (0.57) | -0.05 (0.77) | -0.29 (0.07) | 0.30 (0.06) |
| Control group | ||||||
| Fat, intake/1000 kcal | 0.12 (0.48) | -0.15 (0.35) | -0.01 (0.95) | -0.06 (0.69) | -0.15 (0.37) | 0.15 (0.35) |
| LA, % energy of diet | -0.18 (0.26) | 0.01 (0.93) | -0.04 (0.80) | -0.16 (0.33) | -0.07 (0.66) | 0.03 (0.86) |
| ALA, % energy of diet | -0.14 (0.38) | 0.17 (0.29) | -0.08 (0.64) | 0.19 (0.23) | -0.09 (0.60) | -0.09 (0.57) |
| PUFAs, % energy of diet | -0.22 (0.18) | -0.02 (0.91) | -0.07 (0.69) | -0.10 (0.55) | -0.07 (0.65) | -0.01 (0.95) |
| n-3 PUFAs, % energy of diet | -0.04 (0.83) | -0.22 (0.18) | -0.18 (0.27) | 0.06 (0.71) | -0.23 (0.15) | 0.13 (0.41) |
| EPA, mg/day | -0.14 (0.38) | -0.28 (0.082) | -0.24 (0.13) | 0.31 (0.052) | -0.05 (0.75) | -0.09 (0.56) |
| DHA, mg/day | -0.05 (0.76) | -0.31 (0.05) | -0.10 (0.56) | 0.01 (0.95) | 0.03 (0.84) | -0.05 (0.76) |
| Fiber, intake/1000 kcal | 0.13 (0.41) | -0.31 (0.049, 0.561) | -0.11 (0.50) | -0.04 (0.82) | 0.20 (0.21) | -0.11 (0.50) |
| C-DIITM | 0.24 (0.13) | 0.20 (0.22) | 0.05 (0.75) | -0.23 (0.15) | -0.25 (0.13) | 0.37 (0.018, 0.722) |
Data are presented Pearson’s correlation coefficient - r (p-value), correlations with p <0.05 and post-hoc power, in bold. AA, arachidonic acid; ALA, α-linolenic acid; C-DIITM, energy-adjusted children’s dietary inflammatory index; DHA, docosahexaenoic acid; LA, linoleic acid; LC-PUFAs, long-chain PUFAs; PUFAs, polyunsaturated fatty acids; PUFA n-6/n-3, ratio of PUFAs from n-6 to n-3 family.
Disclaimer/Publisher’s Note: The statements, opinions and data contained in all publications are solely those of the individual author(s) and contributor(s) and not of MDPI and/or the editor(s). MDPI and/or the editor(s) disclaim responsibility for any injury to people or property resulting from any ideas, methods, instructions or products referred to in the content. |
© 2024 by the authors. Licensee MDPI, Basel, Switzerland. This article is an open access article distributed under the terms and conditions of the Creative Commons Attribution (CC BY) license (http://creativecommons.org/licenses/by/4.0/).
Copyright: This open access article is published under a Creative Commons CC BY 4.0 license, which permit the free download, distribution, and reuse, provided that the author and preprint are cited in any reuse.


