
Submitted:
04 December 2024
Posted:
05 December 2024
You are already at the latest version
Abstract
Abstract: Serum creatinine levels are the most used clinical marker to estimate renal function as Glomerular Function Rate, because it is simple, fast, and inexpensive. However, Creatinine has limitations, as its levels can be influenced by factors such as advanced age, physical activity, protein-rich diets, male gender, medications, and ethnicity. Serum Cystatin C and its combination with Serum creatinine may serve as an alternative since these factors do not affect it. Most creatinine synthesis occurs in the muscle, making it a valuable marker for assessing lean body mass within body composition. This measurement is crucial for evaluating and monitoring nutritional status in patients with chronic kidney disease. This review aimed to discuss the literature on creatinine metabolism, its advantages and disadvantages in assessing renal function, and its utility in measuring lean body mass. The variability in creatinine generation rate among individuals should be considered when assessing the glomerular function rate.
Keywords:
Creatinine metabolism
; Glomerular Filtration Rate
; Muscle mass markers
; Cystatin C
; Chronic Kidney Disease
; Creatinine Kinetics
; CKD Biomarkers.
1. Introduction
Creatinine (Cr) was discovered by French chemist Michel Eugène Chevreul in 1832 while investigating the composition of skeletal muscle. He named the component "creatinine," derived from the Greek word kreas, meaning meat.
Cr, chemically known as α-methyl guanidoacetic acid, is a substance that appears as white crystalline particles in its pure state. It has a molecular weight of 113.1 Daltons and behaves as a cation in aqueous solutions.
It is consistently produced as part of normal muscle cells, serving as the final product of creatine (Crn) and phosphocreatine (PCrn) metabolism, dietary protein intake, extrarenal degradation and urinary excretion [1].
Serum Creatinine (SCr) concentration is the most used clinical indicator for assessing glomerular function rate (GFR). Its widespread use is based on the correlation of its concentration with the precise measurement of GFR using the clearance of substances like inulin (the gold standard) [2]. The broad availability, technical simplicity, and low cost of Cr measurement contribute to its use in routine renal function assessment.
Despite these practical advantages, Cr has limitations as a GFR marker. These include the imprecision of conventional quantification methods, which rely on chemical reactions (Jaffé) prone to interference from other molecules. Certain medications, such as cimetidine, trimethoprim, and abemaciclib, inhibit tubular secretion of Cr by competing for secretion pathways, thereby increasing SCr levels and lead to erroneous estimates of GFR (decreased) [3]. Additionally, Cr levels vary with muscle mass, dietary protein intake, and creatine supplementation. Levels tend to decrease with aging, in females, and in individuals of white ethnicity [4].
In patients with chronic kidney disease (CKD), it is important to determine lean body mass (LBM) as part of nutritional status monitoring. Methods such as Bioimpedance Analysis (BIA) and Dual-Energy X-ray Absorptiometry (DEXA) are used, but these are sophisticated techniques with limited accessibility in many hospitals due to their cost and the need for specialized personnel and equipment. Consequently, Cr index (CI) or Cr kinetic where SCr is used, has been a marker of LBM [5].
The objective of this review was to describe Cr metabolism, the factors influencing its serum concentration, and the considerations required for interpreting Cr concentration as a marker of GFR and muscle mass, in healthy individuals and CKD patients.
2. Creatinine Synthesis
The molecule of Cr is an α-methyl guanidoacetic acid with a molecular weight of 113.13 Da. And is distributed through total body water (TBW).
SCr is formed through a spontaneous non-enzymatic anhydration of Crn in muscle cells. This conversion of Crn to Cr is influenced by pH and temperature; this process is done at a constant rate (1% of body Crn and 2.6% of PCrn per day is changed to Cr) [6].
The degradation of Crn can be limited or may not occur in environments with very low or very high pH. A pH above 12.1 favors the deprotonation of the acid group, which hinders the intramolecular cyclization to form Cr. Conversely, when the pH is below 2.5, the amide functional group of the Crn molecule is protonated, also preventing intramolecular cyclization [7]. As shown in Figure 1.
A pH above 12.1 induces deprotonation of the acidic group, hindering intramolecular cyclization towards Cr. Conversely, when the pH is below 2.5, the amide group of the Crn molecule protonates, which also prevents intramolecular cyclization towards Cr [7].
3. Creatine Sources
Crn comes from two main sources, 50% exogenous: from food, phosphate creatine (PCr), commercial Cr, and 50% endogenous (from muscle, Crn, Creatine phosphate (PCr), recycled Cr, and glycine + arginine), of which only 2% is converted to Cr. More than 80% of SCr is sent to the kidney, where it is filtered and secreted. The remaining 20% is cleared through the gut microbiota, as shown in Figure 2 [8].
3.1. Creatine from Exogenous Sources In Foods
Exogenous Crn primarily comes from the diet and its processing. Some of the main foods where Cr can be found are shown in Table 1.
Cooked Meat
The cooking process is known to convert a fraction of the Crn contained in meat into Cr [9]. Around 20-30 years ago, some studies demonstrated that the intake of cooked meat (225-500g) significantly increased the concentration of SCr [10, 11].
Preiss et al. conducted a study that demonstrated the effect to intake of cooked meat compared to uncooked meat increases SCr by 20.5 mmol/L during the first 1 to 2 hours and by 18.5 mmol/L between 3 and 4 hours postprandial in healthy subjects and in stage 3 chronic CKD. Furthermore, the estimated glomerular function rate (eGFR) calculated with SCr decreased by 24.5 mL/min/1.73 m² between the first 1 and 2 hours and by 20 mL/min/1.73 m² at 3-4 hours postprandial, calculated using 3 methods [12]. Misclassification of CKD is possible if measurements are made after meals containing cooked meat.
Since meat is the primary source of exogenous Crn, vegans and vegetarians have a reduced intake of this essential compound, resulting in decreased muscle Crn stores, so supplementation helps to compensate for this reduction [13].
Creatine as a Dietary Supplement
Crn is an ergogenic supplement that has been used by athletes to increase strength gains. Various forms of commercial Crn exist; however, Crn monohydrate has been the most extensively studied, and its formulation has shown benefits in short-duration, high-intensity weightlifting, as well as in cycling [14]. In a review on the utility of Crn, it was found that its supplementation may improve post-exercise recovery, including injury prevention, thermoregulation, rehabilitation, and neuroprotection following a concussion in animal models, as well as enhancing functional capacity in individuals with spinal cord injury [15]. Additionally, its clinical applications have been investigated in neurodegenerative diseases such as muscular dystrophy, Parkinson's disease, and Huntington's disease, as well as in diabetes, osteoarthritis, fibromyalgia, aging, cerebral and cardiac ischemia, and depression in adolescents and pregnant women [16].
Research conducted in various age groups that received Crn supplements at doses of 0.3 to 0.8 g/kg/day for up to 5 years has demonstrated that supplementation with Crn does not pose negative health risks. Moreover, these studies suggest that Crn may provide several benefits for both general health and physical performance [16].
Supplementation with Crn an increase in total SCr concentration of 10% to 30%, followed by an increase in PCr accumulation of 10% to 40% [17].
Burke et al. found that supplementation with Crn helped to improve low Crn reserves in the muscles of vegetarians, who showed more significant increases in fat-free mass (FFM), maximal strength, and type II muscle fiber area compared to those following an omnivorous diet [18].
Creatinine Metabolic Pool
Basic indicators of Cr metabolism in a patient with CKD on Hemodialysis (HD). Pool: 27.27 mmol, Production: 10.17 mmol, Appearance: 8.39 mmol, Degradation: 1.79 mmol.
The content of Cr in the tissues and its concentration in the extracellular fluid (ECW) (and serum) remain stable unless there is acute muscular destruction, urinary tract obstruction or acute kidney failure. The pool of Cr has two pathway access: a) the endogenous generation in the muscles as the final product of the Crn metabolism through recycling, and b) the intake as Cr or its precursor, Crn in meat or supplements. The Cr is eliminated by two pathways, primarily by the kidneys through filtration and secretion, and to a lesser extent by metabolism in the gut microbiota [4]. As seen in Figure 2.
Crn is synthesized mainly in the liver and is transported into the bloodstream via a specific transporter to the muscles, which contain approximately 98% of the total body Crn reserves.
3.2. Creatine from Endogenous Sources
The synthesis of Crn begins in the kidneys primarily with the transfer of the amino group from arginine (Arg) to glycine (Gly), producing L-ornithine and guanidinoacetic acid (GAA). This first step is catalyzed by the enzyme L-arginine aminotransferase (AGAT). The second step involves the methylation of guanidinoacetic acid through the action of S-adenosyl-L-methionine:N-guanidoacetate methyltransferase (GAMT) which transfers a methyl group from S-adenosylmethionine (SAM), thereby forming Crn. as shown in Figure 3.
The highest concentrations of Cr and PCr are found in skeletal muscle, heart, sperm, and photoreceptor cells of the retina in mammals.
A large amount of PCr is available in fast-twitch skeletal muscles for the immediate regeneration of hydrolyzed adenosine triphosphate (ATP) during short periods of intense work [8]. The synthesized Crn reaches the designated tissues through the transport of blood vessels and intracellular transport mediated by a neurotransmitter called the Crn transporter, which depends on chloride and sodium ions.
Crn and its phosphorylated form are crucial for maintaining ATP reserves in cells with high energy demands, such as myocytes, cardiomyocytes, hepatocytes, enterocytes, inner ear cells, renal cells, sperm cells, and photoreceptors. The enzyme creatine kinase (CK) initiates the reversible transfer reaction after reaching the intracellular space, leading to the creation of PCr [8]. As shown in Figure 4.
4. Elimination
Cr, being a small molecular weight molecule and not bound to proteins, distributes throughout the total body water and is filtered by the glomerulus. However, the estimation of its serum concentration can be significantly influenced by factors beyond glomerular filtration, such as extrarenal elimination and tubular secretion. Glomerular filtration is the initial step for its elimination from the body. Thus, SCr is predominantly excreted by glomerular ultrafiltration, so when GFR decreases, Cr accumulates.
The glomerular fenestrated endothelium allows small molecules like Cr to pass freely through its pores. The pores of this endothelium are large enough to permit the passage of water and small solutes but small enough to retain blood cells and larger proteins. The glomerular basement membrane filters molecules based on size and electrical charge, and although Cr is relatively small, its passage through the basement membrane is also facilitated by its solubility in water. Podocyte cells surround the glomerular capillaries, and their extensions (called pedicels) form filtration slits that allow Cr to pass freely into the Bowman’s capsule space [20]. Once Cr crosses the glomerular barrier, it becomes part of the glomerular filtrate and flows into the proximal tubules of the nephron.
The first studies on the secretion of Cr indicated that it accounted for 10% to 40% of urinary Cr excretion (UCrE) in healthy subjects [21]. More recently, studies such as the one by Imamura et al. indicated that tubular secretion contributes significantly to renal Cr elimination, accounting for 30% to 60% of the total elimination of Cr [22].
Zhang et al. analyzed data from different cohorts of the Modification of Diet in Renal Disease (MDRD) study, the African American Study of Kidney Disease and Hypertension (AASK), and the Mayo Clinic to determine the correlation between creatinine clearance (CrCl) and estimated glomerular filtration rate (eGFR) in patients with varying degrees of renal function. The results indicated that the CrCl/eGFR ratio is increased in patients with reduced eGFR due to increased tubular secretion of Cr in this group, which is not accounted for; thus, in these cases, CrCl tends to overestimate eGFR [23].
Urakami et al. demonstrated that in the renal proximal tubules, the Basolateral Organic Cation Transporters: hOAT1 (SLC22A6), hOAT3 (SLC22A8), and hOCT2 (SLC22A2) are primarily expressed in the basolateral membrane and play a crucial role in the uptake of organic compounds from the blood, with Cr being an endogenous substrate of hOCT2 [24]. Additionally, Tanihara et al. revealed that the proteins MATE1 and MATE2-K, which are responsible for the exchange of protons and organic cations in the brush border membrane of the proximal tubules, also accept Cr as a substrate, facilitating efficient transcellular transport in conjunction with hOCT2 [25].
And since various drugs act as substrates for these transporters, they interfere with the tubular secretion of Cr, affecting SCr concentrations, as will be discussed later.
It is important to note that Jones and Burnett previously estimated that 16-66% of synthesized Cr has extrarenal degradation routs by intestinal microbiota in patients with decreased renal function [26].
4.1. Extrarenal Degradation of Creatinine by Gut Microbiota
Bacteria and fungi capable of degrading Crn and Cr through metabolic pathways have been identified in the droppings of chickens and pigeons, as well as in human urine, feces, and the bacterial flora of the human colon. These bacteria may be particularly relevant in kidney disease. In uremic patients with significantly elevated SCr levels, it is believed that Cr diffuses into the intestinal tract, where it induces the activity of creatininease, creatinase, and creatinine deaminase, ultimately resulting in the breakdown of part of the body's Cr reserves and its partial recycling.
There are at least four alternative pathways for microbial degradation of Cr. The first pathway is the degradation to 1-methylhydantoin, in which certain microorganisms, such as Bacillus, Clostridium, and Escherichia, degrade Cr into 1-methylhydantoin and ammonia, using Cr as a nitrogen source. The second pathway is the degradation to N-carbamoyl-sarcosine, where strains like Pseudomonas and Brevibacterium convert 1-methylhydantoin into N-carbamoyl-sarcosine and sarcosine. The third pathway involves degradation to Crn where different species, including Alcaligenes, Arthrobacter, and Tissierella, use creatininase to convert Cr into Crn, which is subsequently metabolized to urea and sarcosine through the action of creatinase. Finally, the fourth pathway is the degradation to methylguanidine, where Pseudomonas stutzeri has been observed to convert Cr into methylguanidine and acetic acid, and this methylguanidine can be broken down by certain Alcaligenes strains, producing methylamine and urea [8]. See Figure 5.
5. Factors That Influence Serum Creatinine Concentration
As mentioned previously, Cr levels can be affected by various factors. Some may increase Cr levels, including a high-protein diet, Crn supplementation, muscle mass, and certain medications. Conversely, factors that can decrease Cr concentrations include degradation by intestinal microbiota, advanced age, and nutritional deficiencies. See Figure 6.
5.1. Drugs that Increase Serum Creatinine Concentrations
Cimetidine
Cimetidine is an H2 receptor antagonist that inhibits gastric acid secretion at a dose of 1.6 g/day. This medication SCr concentrations by an average of 15% in patients with normal renal function [27, 28]. High single doses of cimetidine, such as 300 mg intravenously or 800 mg orally, resulted in a reduction in both endogenous and exogenous CrCl (14C-Creatinine) by 20±30% in healthy volunteers. This effect is attributed to a decrease in UCrE and an accumulation of SCr until a new steady state is reached. However, there were no concomitant changes in GFR when measured with inulin [3, 29].
Cimetidine has a high affinity for the organic cation transporter OCT2 and the multidrug and toxin extrusion transporters (MATE) in the luminal membrane of the proximal tubules, similar to Cr [30]. Therefore, cimetidine inhibits the tubular secretion of Cr, meaning that the absorption of cimetidine blocks the tubular secretion of Cr, resulting in a CrCl close to or identical to the clearance measured with Iohexol, which is also considered a gold standard for measuring glomerular filtration [31].
Therefore, the blockage of tubular secretion of Cr with cimetidine has proven to be a useful tool for measuring the glomerular filtration rate in kidney transplant recipients with SCr concentrations less than 2.5 mg/L. It has been observed that the clearance calculated using the MDRD formula was similar to that obtained after the administration of cimetidine, reinforcing its viability as an alternative method in this context. [32].
Trimethoprim
Trimethoprim is an antibacterial that inhibits the enzyme dihydrofolate reductase [33]. Clinical studies have demonstrated that at therapeutic doses, it elevates SCr concentrations by 15% to 30% and reduces CrCl by 20% to 25%, without affecting glomerular filtration measured with iodothalamate. [34, 35].
This effect of trimethoprim is explained by the inhibition of Na/K ATPase present in the basal membrane of the epithelial cells of the distal tubule, as well as the OCT2 transporter and the MATE 1/2-K transporters in the proximal tubule [36, 37].
Salicylates
Salicylates can induce an increase in SCr concentration by altering the binding of Cr to serum proteins or competitively inhibiting the tubular secretion of Cr under certain conditions (salt depletion, advanced age, liver cirrhosis, renal diseases, and renal insufficiency) [38-40].
Abemaciclib
Abemaciclib is a cyclin-dependent kinase 4 and 6 inhibitor indicated for the treatment of metastatic breast cancer. This medication has been shown to increase SCr concentrations by 10-40%, with peak Cr levels occurring 10-12 hours after administration. However, this increase is reversible and demonstrates a gradual decrease over time [41, 42].
The GFR calculated using the CKD-EPI (Chronic Kidney Disease Epidemiology Collaboration) formula shows a decrease following the administration of abemaciclib, but there are no changes in GFR measured with Iohexol or in the eGFR calculated from serum concentrations of CysC. Furthermore, no significant changes were observed in urinary concentrations of neutrophil gelatinase-associated lipocalin (NGAL) and kidney injury molecule 1 (KIM-1), which are biomarkers of renal damage, normalized to Cr.
These data, along with the changes observed in the pharmacokinetics of metformin, suggest that the elevations in SCr concentrations observed in clinical studies of abemaciclib are due to a reversible inhibition of renal tubular secretion of Cr rather than acute kidney injury [43].
Integrase Inhibitors
Drugs used for the treatment of HIV, such as Dolutegravir (DTG), Raltegravir (RAL), and Elvitegravir (EVG), have been associated with an increase in SCr concentrations. In the VIKING study, which compared the efficacy of DTG versus RAL, the administration of DTG resulted in an increase in Cr levels between 0.084-0.105 mg/dL, with this effect being more evident on the 6th and 8th days after administration, reaching a plateau by week 4 without further progression [44].
In the SPRING-2 study, patients treated with DTG showed an increase of 14.6 μmol/L in SCr concentrations after 96 weeks of treatment. Similarly, an increase in Cr of 8.2 μmol/L was observed following the administration of RAL. Additionally, the change in CrCl calculated using the Cockcroft-Gault formula was -19.6 ml/min in the DTG group and -9.3 ml/min in the RAL group, both at week 96 [45]. Furthermore, in additional studies of patients treated with DTG, either alone or in combination with Tenofovir disoproxil fumarate (TDF), renal function estimated by Cr (eGFRCr) and by Cystatin C (eGFRCys) was compared. The results indicated that treatment with DTG was associated with a significant increase in Cr and a reduction in eGFRCr, while Cystatin C concentrations and eGFR_Cys remained unchanged [46, 47].
This pattern, where there is a rapid but small increase in SCr concentrations that subsequently levels off without further progression, is typical of the blockade of Cr secretion via OCT2 [48].
These transporters involved in the secretion of Cr are illustrated in Figure 7.
Glucocorticoids
Glucocorticoids are catabolic hormones from the corticosteroid family, commonly used to suppress, prevent, or reduce immune responses [49]. Due to the catabolic effect of glucocorticoids, there is a release of Crn at the muscular level, which is subsequently converted into Cr, leading to increased serum levels as well as urinary excretion [50].
5.2. Sex
A longitudinal study evaluated urinary Cr excretion and CrCl in men and women. The results showed that men excreted 33% more Cr daily than women, even after adjusting for weight. The difference was attributed to men's greater lean body mass, contributing to higher production and, consequently, the elimination of Cr. Regarding SCr concentrations, men exhibited levels that were 21% higher compared to women [51].
The results of the Third National Health and Nutrition Examination Survey (NHANES) conducted in the United States indicated that women had Cr levels approximately 22% lower than men [52].
5.3. Race, Ethnicity
In the study mentioned above, James et al. reported that Black subjects had a Cr production rate 5% higher compared to White individuals. This difference was attributed to greater muscle mass, rather than a higher protein intake in their diet, as potassium excretion was lower in this group [51].
Hsu C-Y et al. found a 10.7% increase in SCr concentrations in comparison to non-Black subjects [53]. Similarly, this was attributed to a higher muscle mass in this population group [54]. In this same study, muscle mass and SCr were evaluated in HD patients. It was found that SC r values for Black, Asian, and Hispanic patients were higher than those for non-Hispanic White patients, with differences of more than 1.68 mg/dL, 1.61 mg/dL, and 0.83 mg/dL, respectively. However, these differences among the various groups persisted even after adjusting for intracellular water.
Black patients had SCr concentrations very similar to those of Asian patients, with a minimal difference of only 0.03 mg/dL. However, the concentrations were significantly higher compared to Hispanic and non-Hispanic White patients. Unlike other studies, this study suggests that the higher SCr concentration may not be exclusively due to a greater amount of muscle mass [55].
Since the results challenge established knowledge, further studies are essential to clarify these findings and better understand the factors involved in SCr about muscle mass.
5.4. Physical Activity
Individuals with moderate/intense physical activity presented significantly higher SCr and albumin levels compared to those with sedentary or light physical activity, and higher urinary Cr excretion ( UCrE) than sedentary individuals. There were no differences in serum CysC, urea, microalbuminuria, or measured CrCl between these groups. People with moderate/intense physical activity tended to lower CrCl and GFR (Cockcroft-Gault and MDRD equations) compared to sedentary individuals, though these differences did not reach statistical significance [56].
Individuals with higher levels of physical activity had lower body weight, BMI, waist circumference, and body fat content, as well as greater muscle mass compared to those who were sedentary or had light physical activity.
These results demonstrate that intense physical activity directly influences body composition, reducing body fat and increasing LBM. In contrast, serum CysC did not differ between groups. These findings further corroborate that CysC is not influenced by muscle mass [56].
Another study conducted by Beunders et al. showed a significant increase in SCr immediately after an exercise session, with concentrations rising from 58 ± 13 to 71 ± 11 µmol/L. The increase in SCr levels induced by exercise could imply a significant reduction in GFR of −34 ± 33 mL/min/1.73 m² [57].
5.5. Age
In adults, the lean body mass decreases with age, and most of this loss of lean tissue can be attributed to skeletal muscle atrophy. The excretion of Cr also decreases with age, which likely reflects the reduction in muscle mass [58].
In patients over 65 years old, a cutoff value of SCr of 1.7 mg/dL was used to identify renal insufficiency and it was found that 87.4% of patients with renal insufficiency confirmed by the Cockcroft-Gault formula to estimate GFR had SCr levels of 1.7 mg/dL or lower. These findings highlight the limitations of using SCr as a standalone marker for detecting renal insufficiency in older individuals. This is because SCr can underestimate renal function caused by the reduction in muscle mass characteristic of this population. Therefore, formulas that consider other parameters are recommended for a more accurate evaluation [59].
6. Biochemical Measurement in the Laboratory
The normal range of SCr for adult men typically ranges from 0.74 to 1.35 mg/dL (65.4 to 119.3 μM) while for adult women, it ranges from 0.59 to 1.04 mg/dL (52.2 to 91.9 μM) [60]. The daily UCrE in healthy individuals ranges from 0.8 to 2.0 g/day. Elevated SCr levels, exceeding 1000 μM, can indicate renal dysfunction or muscle disorders.
Several conventional methods are available for measuring Cr levels, including colorimetric, spectrophotometric, and chromatographic techniques. While these methods are highly sensitive and selective, they also have drawbacks such as being time-consuming, requiring sample pre-treatment, high-cost instrumentation, and requiring skilled personnel to operate the equipment [61].
Colorimetric methods are based on the Jaffé reaction, which dates back to 1886. SCr reacts with picric acid in an alkaline medium, forming a red-colored complex at a wavelength between 510–520 nm. This method is simple, fast, and inexpensive.
One issue with this measurement is that, in addition to SCr, other positively charged molecules, such as proteins, glucose, acetoacetate, ascorbic acid, and uric acid, also react with picric acid as positive interferents. At the same time, there are also negative interferents, the most significant of which is bilirubin. Therefore, this technique has low specificity. In samples with elevated bilirubin levels, SCr values appear reduced because bilirubin in alkaline media oxidizes to biliverdin, forming a colorless compound that diminishes the color of the reaction. Non-creatinine chromogens can interfere with the assay, causing errors of up to 20% in normal individuals [1].
Enzymatic Measurement
The Cr present in the sample is converted to creatine Crn by the action of the enzyme Cr amidohydrolase. The resulting Crn is then hydrolyzed to sarcosine and urea through the action of the enzyme Crn amidinohydrolase. Next, sarcosine oxidase promotes the oxidative demethylation of sarcosine, produucing glycine, formaldehyde, and hydrogen peroxide.
In the presence of peroxidase, the hydrogen peroxide formed reacts with N-ethyl-N-sulfopropyl-m-toluidine (ESPMT) and 4-aminoantipyrine, producing a quinoneimine with a maximum absorbance at 546 nm. The intensity of the color of the reaction product is directly proportional to the Cr concentration in the sample [62].
Another enzymatic method available for measuring Cr utilizes the enzyme Cr amidohydrolase. This method involves a four-step reaction process, ultimately measuring the decrease in NADH (Nicotinamide Adenine Dinucleotide) with a reading at 340 nm. Unlike the other enzymatic method, which relies on photometric readings outside the UV range, this method uses UV readings. The error in determining Cr impacts medical decisions based on guidelines. Standardizing Cr by increasing accuracy and reducing variation between laboratories helps prevent incorrect classification and treatment of patients [62].
The estimation of GFR from SCr is adequate for diagnosing, staging, and monitoring CKD progression in most clinical circumstances. However, like all diagnostic tests, the interpretation is influenced by the test´s variable characteristics in selected clinical circumstances and the pre-test probability of disease. In particular, an isolated reduced GFR is more likely to be a false positive in otherwise healthy individuals than in those with risk factors for kidney disease or markers of renal damage [63].
7. Evaluation of Glomerular Filtration Rate
GFR is measured through clearances (Urine (mg/min)/Plasma/volume), and with endogenous or exogenous metabolites of glomerular filtration.
The recommendation for GFR evaluation, according to the 2024 Kidney Disease Improving Global Outcomes (KDIGO) clinical practice guidelines, is to assess renal function as GFR, along with the serum concentration of endogenous filtration markers. It is suggested to express GFR as eGFR in milliliters per minute per 1.73 m² rather than milliliters per minute. Additionally, two-stage tests are recommended: an initial test followed by confirmation tests when necessary. Cr based eGFR is the recommended initial test, while confirmation tests such as Cys C based eGFR, Cr-Cys C based eGFR, or CrCl are indicated in specific cases where Cr based eGFR is less accurate [63].
The equations used to estimate GFR allow it to be calculated from serum concentrations of endogenous filtration markers, eliminating the need for direct renal clearance measurements. These markers include low molecular weight metabolites (such as Cr, <1000 Da) and low molecular weight proteins (such as CysC, 1000-20,000 Da).
The serum concentration of these markers is inversely related to GFR. It is also influenced by other physiological factors, known as "non-GFR-related determinants," which include their generation, renal tubular handling (reabsorption and secretion), and extrarenal elimination. For clinical practice, a specific equation is chosen for each marker or a combination of these to routinely report GFR [64]. See Table 2.
The combination of Cr and CysC for GFR calculation emerged because the race factor was removed to prevent discrimination.
8. Limitations of Serum Creatinine
Due to Cr's complex metabolism, measuring eGFR has various limitations. One of the main limitations is that changes in muscle mass, such as in patients with chronic diseases, malnutrition, or advanced age, lead to an overestimation of GFR. On the other hand, individuals with greater muscle mass or higher protein intake may experience the opposite effect.
Changes in muscle mass are of great importance in patients with chronic kidney disease, as they often experience increased protein catabolism due to processes such as metabolic acidosis, pro-inflammatory cytokines, uremia, and even dialysis itself [65].
This is why CysC has been employed for estimating GFR. These results have proven to be more accurate in reflecting renal function in patients since its synthesis is not influenced by the patient's anthropometric characteristics or non-nephrological comorbidities.
In individuals with low muscle mass, such as older adults, individuals with amputations, or those with chronic diseases affecting muscle tissue, the estimated GFR overestimated the kidney function.
The recalibrated four-variable MDRD equation calculates GFR adjusted for body surface area, considering SCr, age, gender, and ethnicity but not muscle mass. Therefore, in individuals with higher muscle mass, this equation often underestimates the actual GFR [66].
It is also important to note that all formulas for calculating GFR do not consider other common factors, such as the intake of cooked red meat and the effect that some medications may have.
9. Cystatin C
CysC is a proteinase inhibitor belonging to family 2 of the cystatin superfamily. It consists of a nonglycosylated polypeptide chain of 120 amino acid residues [67].
Grubb et al. first determined its structure in 1981 [68]. Later, it was discovered that the human CysC gene, along with its promoter, is of a constitutive type, ensuring its constant production in all nucleated cells [69]. Although it is found in all body fluids, its concentration is higher in cerebrospinal fluid and seminal plasma [70]. Its structure is shown in Figure 8.
Due to its molecular weight (13 kDa), its positive charge, and an isoelectric point of 9.3, this molecule is freely filtered by the renal glomerulus under conditions where renal function is not impaired [71]. It is then reabsorbed and fully catabolized by the cells of the proximal tubules, with this absorption occurring through the megalin endocytic receptor. Unlike Cr, it does not undergo tubular secretion [72]. However, it is essential to note that albuminuria can interfere with this process since CysC and albumin are reabsorbed in the proximal tubule via megalin-facilitated endocytosis [73]. Albuminuria can reduce the reabsorption of CysC and, consequently, increase its excretion in urine, due to the competition between the two molecules for the same transport mechanism.
A point in favor of using CysC is that its serum values are not influenced by physiological factors such as age, sex, race, diet, and muscle mass. The study conducted by Chen et al. in the UK Biobank showed that GFR based on CysC identifies five times more participants with a TFG < 60 mL/min/1.73 m² compared to the estimate using Cr in individuals from South Asia. Furthermore, the use of CysC allowed for the detection of a population with chronic kidney disease who were at high risk of death, heart failure, and cardiovascular atherosclerotic diseases—risks that were not identified when using Cr as a marker [74].
Additionally, data from the UK Biobank study showed that, unlike Cr, CysC can assess kidney function independently of ethnic origin [75].
However, other pathological factors, such as hyperthyroidism and hypothyroidism, can affect serum CysC levels. It has been shown that in untreated hyperthyroid patients, serum CysC levels are higher than in euthyroid patients, and CysC levels decrease once appropriate treatment is initiated. On the other hand, in hypothyroid patients who were not receiving any treatment, serum CysC levels were lower than in euthyroid patients, and CysC levels increased after receiving the appropriate treatment[76-78].
Its measurement is typically carried out using turbidimetric (PETIA) or nephelometric (PENIA) immunoassays. This because PETIA and PENIA provide several advantages, including fast processing times, minimal interference from other substances, and improved accuracy. One of the main advantages is that they are less susceptible to interference from factors that affect the measurement of Cr, such as hemolysis, lipemia, and jaundice, providing a more reliable assessment of renal function [79].
Although it has been shown that CysC concentrations can be influenced by pathological conditions such as obesity, inflammation, smoking, steroid treatments, and thyroid disorders [80], this marker is not significantly infielders by the physiological factors unlike Cr, CysC offers a more reliable and consistent measurement of renal function. CysC is a better tool in assessing the risk of renal and cardiovascular across populations groups, ensuring greater consistency in different clinical settings. The different characteristics of Cr and CysC are summarized in the Table 3:
10. Utility of Creatinine as Body Composition Marker
Body Composition
Body composition evaluations include evaluations at different levels of organization, from the subcellular and cellular level to the whole body. From the clinical perspective, human body composition can be divided into two main compartments: water compartments and fat mass. Lean mass and cellular mass are calculated based on water compartments and are influenced by age, sex, and race.
Body composition measurement can be performed using different technologies, such as isotopic dilution, computed tomography, magnetic resonance imaging, X-ray densitometry (DEXA), and other more sophisticated technologies. However, indirect, low-cost, and non-invasive methods in clinical practice are commonly used to determine human body composition, such as bioelectrical impedance (BIA) and skinfold thickness. Muscle mass is highly variable between the elderly and children and can be substantially modified through physical exercise, as previously mentioned [56].
Bioimpedance
BIA is a method for estimating body composition by conducting a low-intensity multifrequency current through the human body. Higher frequencies (>50 kHz) are transmitted through the water into the cells and extracellular space, and low frequencies (<50 kHz) are transmitted through water only in the extracellular spaces. Fat Mass is more resistant than non-fat cells.
Intracellular water is calculated based on total body and extracellular water differences. Lean Body Mass is calculated from intracellular water, assuming a constant intracellular water content, usually around 70%[82]:
Total body water= Extracellular Water + Intracellular Water
Lean body mass = ICW /0.70
In dialysis patients, the relationship between compartments is abnormal due to muscle wasting and intracellular and extracellular edema. Therefore, BIA measurements show an increased ICW and overestimate LBM because ICW is greater than 70% (used as a reference in normal subjects). This presumed edema introduces a systematic error in the calculation of LBM. An alternative method is necessary to assess how much BIA overestimates LBM. Among other alternative methods is Cr kinetics, which measures only muscle mass. However, information on this is very scarce.
Creatinine Kinetics, Creatinine Index.
Cr generation is an indirect measure of muscle mass because muscle metabolism is the main source of Cr production. Mitch y col [4] conducted a study decades ago on creatine metabolismin patients with CKD, specifically the production and excretion of Cr
Despite its utility in inferring muscle mass, they observed that Cr excretion did not fully explain SCr levels. They concluded that part of this Cr is metabolized endogenously. As SCr increased, creatine was recycled rather than excreted in the urine. Therefore, the need arose to consider the complete Cr metabolism in estimating LBM. Later, Keshaviah [83] defined a formula for calculating LBM in patients on Peritoneal Dialysis (PD), which is still used today.
The kinetics of Cr is based on the principle that Cr generation is proportional to LBM in patients with constant protein consumption. This technique considers the sum of Cr ex-cretion and metabolic degradation. Cr excretion includes only urinary excretion in non-dialysis patients and Cr content in drained dialysis solutions, plus urinary excretion obtained from residual renal function. At the same time, metabolic degradation is propor-tional to body weight and SCr concentrations. Therefore, the sum of degradation and ex-cretion should, in a steady state, equal the Cr production rate. The kinetics of Cr is based on the principle that Cr generation is proportional to LBM in patients with constant protein consumption, as shown in Table 4:
Subsequently, Bhatla B et al. [84] correlated measurements of LBM using Cr kinetics, bioimpedance, and DEXA in patients with PD and found a high association. Cr kinetics has also been used to assess protein nutritional status in patients with HD [85]. Recently, the same authors found that the CI or Cr kinetics is a surrogate tool for measuring muscle mass in patients with kidney damage [86], and added urea distribution to the formula in patients on HD. Since then, no studies have referred to this method in patients with PD.
Recently, Cr kinetics is recommended in the KDOQI (Kidney Disease Outcomes Quality Initiative) guidelines to measure muscle mass in patients with CKD [87]. However, the procedure has the disadvantage that it requires a 24-hour urine collection and drained PD solutions, which can sometimes be difficult for the patient. Additionally, meat consumption and creatine supplements increase UCrE, which must be accounted for when calculating Cr kinetics. In anuric HD patients, Cr kinetics is based on the SCr levels before and after HD.
The methods to calculate and use the CI according to the KDOQI guidelines are highlighted in Table 5 [5]:
Cr kinetics' utility in assessing nutritional status has been questioned; it is not accepted that UCr is associated with muscle mass [88]. On the other hand, such an association is accepted as long as the subjects have no nutritional restrictions and 24-hour urine was collected over three consecutive days [89]. These two studies were conducted in healthy subjects; however, in patients with kidney damage, such as those on PD, Cr excretion may be inaccurate since it does not consider recycling and Cr returns to circulation, which is why these patients have high SCr values. It is also necessary to consider the losses of Cr in the drained PD solution that the patient should collect.
11. Conclusions
Creatinine measurements are an easy and widely available technique for routinely estimating the Glomerular Filtration Rate and muscle mass. Both evaluations are essential in following patients with Chronic Kidney Disease with and without dialysis treatments. Despite its utility in daily clinical work, the medical team should know its limitations. The factors that influence its concentration in serum/plasma and urine limit the use of Cr in estimating the Glomerular Filtration Rate. Alternative or complementary measurements of Cystatin C must be considered when evaluating kidney function. However, the utility of Cr is good in the daily clinical setting when using Cr kinetics as a direct measurement of lean body mass compared to electrical bioimpedance, which underestimates muscle mass in patients with edema, such as those with CKD.
References
- Levey, A. and L. Inker, Assessment of Glomerular Filtration Rate in Health and Disease: A State of the Art Review. Clinical Pharmacology & Therapeutics 2017, 102, 405–419. [Google Scholar]
- Dodge, W.F. , Comparison of Endogenous Creatinine Clearance With Inulin Clearance. Archives of Pediatrics & Adolescent Medicine 1967, 113, 683. [Google Scholar] [CrossRef] [PubMed]
- Andreev, E., M. Koopman, and L. Arisz, A rise in plasma creatinine that is not a sign of renal failure: which drugs can be responsible? J Intern Med 1999, 246, 247–252. [Google Scholar] [CrossRef] [PubMed]
- Mitch, W.E., V. U. Collier, and M. Walser, Creatinine Metabolism in Chronic Renal Failure. Clinical Science 1980, 58, 327–335. [Google Scholar]
- Clinical practice guidelines for nutrition in chronic renal failure. K/DOQI, National Kidney Foundation. Am J Kidney Dis 2000, 35, S17–s104. [Google Scholar]
- Kashani, K., M. H. Rosner, and M. Ostermann, Creatinine: From physiology to clinical application. European Journal of Internal Medicine 2020, 72, 9–14. [Google Scholar]
- Kreider, R., R. Jäger, and M. Purpura, Bioavailability, Efficacy, Safety, and Regulatory Status of Creatine and Related Compounds: A Critical Review. Nutrients 2022, 14, 1035. [Google Scholar] [CrossRef]
- Wyss, M. and R. Kaddurah-Daouk, Creatine and Creatinine Metabolism. Physiological Reviews 2000, 80, 1107–1213. [Google Scholar]
- Camara, A.A. , et al., The twenty-four hourly endogenous creatinine clearance as a clinical measure of the functional state of the kidneys. J Lab Clin Med 1951, 37, 743–763. [Google Scholar]
- Jacobsen, F.K. , et al., Pronounced increase in serum creatinine concentration after eating cooked meat. BMJ 1979, 1, 1049–1050. [Google Scholar] [CrossRef]
- Mayersohn, M., K. Conrad, and R. Achari, The influence of a cooked meat meal on creatinine plasma concentration and creatinine clearance. British Journal of Clinical Pharmacology 1983, 15, 227–230. [Google Scholar] [PubMed]
- Preiss, D.J. , et al., The influence of a cooked-meat meal on estimated glomerular filtration rate. Annals of Clinical Biochemistry: International Journal of Laboratory Medicine 2007, 44, 35–42. [Google Scholar] [CrossRef] [PubMed]
- Rogerson, D. , Vegan diets: practical advice for athletes and exercisers. J Int Soc Sports Nutr 2017, 14, 36. [Google Scholar] [CrossRef] [PubMed]
- Hall, M. and T. H. Trojian, Creatine Supplementation. Current Sports Medicine Reports 2013, 12, 240–244. [Google Scholar] [CrossRef]
- Jacobs, P.L. , et al., Oral creatine supplementation enhances upper extremity work capacity in persons with cervical-level spinal cord injury. Arch Phys Med Rehabil 2002, 83, 19–23. [Google Scholar] [CrossRef]
- Kreider, R.B. , et al., International Society of Sports Nutrition position stand: safety and efficacy of creatine supplementation in exercise, sport, and medicine. J Int Soc Sports Nutr 2017, 14, 18. [Google Scholar] [CrossRef]
- Egierska, D. and M. Perszke, What do we know about creatine supplementation? Journal of Education, Health and Sport 2022, 12, 19–26. [Google Scholar]
- Burke, D.G. , et al., Effect of creatine and weight training on muscle creatine and performance in vegetarians. Med Sci Sports Exerc 2003, 35, 1946–1955. [Google Scholar] [CrossRef]
- Brosnan, M.E. and J. T. Brosnan, The role of dietary creatine. Amino Acids 2016, 48, 1785–1791. [Google Scholar]
- McMurray, M.D., J. E. Trivax, and P.A. McCullough, Serum Cystatin C, Renal Filtration Function, and Left Ventricular Remodeling. Circulation: Heart Failure 2009, 2, 86–89. [Google Scholar]
- Levey, A.S., R. D. Perrone, and N.E. Madias, Serum Creatinine and Renal Function. Annual Review of Medicine 1988, 39, 465–490. [Google Scholar] [CrossRef] [PubMed]
- Imamura, Y. , et al., Prediction of Fluoroquinolone-Induced Elevation in Serum Creatinine Levels: A Case of Drug–Endogenous Substance Interaction Involving the Inhibition of Renal Secretion. Clinical Pharmacology & Therapeutics 2011, 89, 81–88. [Google Scholar] [CrossRef] [PubMed]
- Zhang, X. , et al., Tubular secretion of creatinine and kidney function: an observational study. BMC Nephrol 2020, 21, 108. [Google Scholar] [CrossRef] [PubMed]
- Urakami, Y. , et al., Creatinine Transport by Basolateral Organic Cation Transporter hOCT2 in the Human Kidney. Pharmaceutical Research 2004, 21, 976–981. [Google Scholar] [CrossRef]
- Tanihara, Y. , et al., Substrate specificity of MATE1 and MATE2-K, human multidrug and toxin extrusions/H+-organic cation antiporters. Biochemical Pharmacology 2007, 74, 359–371. [Google Scholar] [CrossRef]
- Jones, J.D. and P.C. Burnett, Creatinine Metabolism in Humans with Decreased Renal Function: Creatinine Deficit. Clinical Chemistry 1974, 20, 1204–1212. [Google Scholar] [CrossRef]
- Blackwood, W.S. , et al. , CIMETIDINE IN DUODENAL ULCER Controlled Trial. The Lancet 1976, 308, 174–176. [Google Scholar]
- Haggie, S.J., D. C. Fermont, and J.H. Wyllie, TREATMENT OF DUODENAL ULCER WITH CIMETIDINE. The Lancet 1976, 307, 983–984. [Google Scholar]
- Dubb, J.W. , et al., Effect of cimetidine on renal function in normal man. Clinical Pharmacology & Therapeutics 1978, 24, 76–83. [Google Scholar] [CrossRef]
- Burt, H.J. , et al., Metformin and cimetidine: Physiologically based pharmacokinetic modelling to investigate transporter mediated drug–drug interactions. European Journal of Pharmaceutical Sciences 2016, 88, 70–82. [Google Scholar] [CrossRef]
- Stehlé, T. , et al., Creatinine clearance after cimetidine administration in a new short procedure: comparison with plasma and renal clearances of iohexol. Clinical Kidney Journal 2020, 13, 587–596. [Google Scholar] [CrossRef] [PubMed]
- Kabat-Koperska, J. , et al., Creatinine Clearance after Cimetidine Administration—Is It Useful in the Monitoring of the Function of Transplanted Kidney? Renal Failure 2007, 29, 667–672. [Google Scholar] [CrossRef] [PubMed]
- Masters, P.A. , et al. , Trimethoprim-Sulfamethoxazole Revisited. Archives of Internal Medicine 2003, 163, 402. [Google Scholar] [CrossRef] [PubMed]
- Roy, M.T. , et al., Effect of Co-trimoxazole and Sulfamethoxazole on Serum Creatinine in Normal Subjects. Therapeutic Drug Monitoring 1982, 4, 77–80. [Google Scholar] [CrossRef]
- Kastrup, J. , et al., The Effect of Trimethoprim on Serum Creatinine. British Journal of Urology 1985, 57, 265–268. [Google Scholar] [CrossRef]
- Yokoyama, S. , et al., Impact of trimethoprim on serum creatinine, sodium, and potassium concentrations in patients taking trimethoprim-sulfamethoxazole without changes in glomerular filtration rate. Journal of Clinical Pharmacy and Therapeutics 2022, 47, 1409–1417. [Google Scholar] [CrossRef]
- Nakada, T., T. Kudo, and K. Ito, Quantitative Consideration of Clinical Increases in Serum Creatinine Caused by Renal Transporter Inhibition. Drug Metabolism and Disposition 2023, 51, 1114–1126. [Google Scholar] [CrossRef]
- D'Agati, V. , Does aspirin cause acute or chronic renal failure in experimental animals and in humans? American Journal of Kidney Diseases 1996, 28, S24–S29. [Google Scholar] [CrossRef]
- Muther, R.S. , Aspirin-Induced Depression of Glomerular Filtration Rate in Normal Humans: Role of Sodium Balance. Annals of Internal Medicine 1981, 94, 317. [Google Scholar] [CrossRef]
- Berg, K.J. , Acute effects of acetylsalicylic acid in patients with chronic renal insufficiency. European Journal of Clinical Pharmacology 1977, 11, 111–116. [Google Scholar] [CrossRef]
- Patnaik, A. , et al., Efficacy and Safety of Abemaciclib, an Inhibitor of CDK4 and CDK6, for Patients with Breast Cancer, Non–Small Cell Lung Cancer, and Other Solid Tumors. Cancer Discovery 2016, 6, 740–753. [Google Scholar] [CrossRef] [PubMed]
- Sledge, G.W. , et al., MONARCH 2: Abemaciclib in Combination With Fulvestrant in Women With HR+/HER2− Advanced Breast Cancer Who Had Progressed While Receiving Endocrine Therapy. Journal of Clinical Oncology 2017, 35, 2875–2884. [Google Scholar] [CrossRef] [PubMed]
- Chappell, J.C. , et al., Abemaciclib Inhibits Renal Tubular Secretion Without Changing Glomerular Filtration Rate. Clin Pharmacol Ther 2019, 105, 1187–1195. [Google Scholar] [CrossRef] [PubMed]
- Eron, J.J. , et al., Safety and Efficacy of Dolutegravir in Treatment-Experienced Subjects With Raltegravir-Resistant HIV Type 1 Infection: 24-Week Results of the VIKING Study. The Journal of Infectious Diseases 2013, 207, 740–748. [Google Scholar] [CrossRef] [PubMed]
- Raffi, F. , et al., Once-daily dolutegravir versus twice-daily raltegravir in antiretroviral-naive adults with HIV-1 infection (SPRING-2 study): 96 week results from a randomised, double-blind, non-inferiority trial. The Lancet Infectious Diseases 2013, 13, 927–935. [Google Scholar] [CrossRef]
- Lu, L. , et al., Comparison of Renal Function Biomarkers of Serum Creatinine and Cystatin C in HIV-Infected People on Dolutegravir-Containing Therapy. Infect Drug Resist 2022, 15, 1695–1706. [Google Scholar] [CrossRef]
- Palich, R. , et al., Plasma cystatin C as a marker for estimated glomerular filtration rate assessment in HIV-1-infected patients treated with dolutegravir-based ART. Journal of Antimicrobial Chemotherapy 2018, 73, 1935–1939. [Google Scholar] [CrossRef]
- Koteff, J. , et al., A phase 1 study to evaluate the effect of dolutegravir on renal function via measurement of iohexol and para-aminohippurate clearance in healthy subjects. Br J Clin Pharmacol 2013, 75, 990–996. [Google Scholar] [CrossRef]
- Williams, D.M. , Clinical Pharmacology of Corticosteroids. Respiratory Care 2018, 63, 655–670. [Google Scholar] [CrossRef]
- Van Acker, B.A.C. , et al. , Effect of Prednisone on Renal Function in Man. Nephron 1993, 65, 254–259. [Google Scholar]
- James, G.D. , et al., A Longitudinal Study of Urinary Creatinine and Creatinine Clearance in Normal Subjects: Race, Sex, and Age Differences. American Journal of Hypertension 1988, 1, 124–131. [Google Scholar] [CrossRef] [PubMed]
- Köttgen, A. , et al., Serum cystatin C in the United States: the Third National Health and Nutrition Examination Survey (NHANES III). Am J Kidney Dis 2008, 51, 385–394. [Google Scholar] [CrossRef] [PubMed]
- Hsu, C.-Y. , et al. , Race, Genetic Ancestry, and Estimating Kidney Function in CKD. New England Journal of Medicine 2021, 385, 1750–1760. [Google Scholar] [PubMed]
- Goldwasser, P., A. Aboul-Magd, and M. Maru, Race and creatinine excretion in chronic renal insufficiency. American Journal of Kidney Diseases 1997, 30, 16–22. [Google Scholar]
- Delgado, C. , et al., Muscle Mass and Serum Creatinine Concentration by Race and Ethnicity among Hemodialysis Patients. J Am Soc Nephrol 2024, 35, 66–73. [Google Scholar] [CrossRef]
- Baxmann, A.C. , et al., Influence of Muscle Mass and Physical Activity on Serum and Urinary Creatinine and Serum Cystatin C. Clinical Journal of the American Society of Nephrology 2008, 3, 348–354. [Google Scholar] [CrossRef]
- Beunders, R., C. C.W.G. Bongers, and P. Pickkers, The effects of physical exercise on the assessment of kidney function. Journal of Applied Physiology 2020, 128, 1459–1460. [Google Scholar] [CrossRef]
- Welle, S. , et al., Utility of creatinine excretion in body-composition studies of healthy men and women older than 60 y. The American Journal of Clinical Nutrition 1996, 63, 151–156. [Google Scholar] [CrossRef]
- Swedko, P.J. , et al., Serum creatinine is an inadequate screening test for renal failure in elderly patients. Arch Intern Med 2003, 163, 356–360. [Google Scholar] [CrossRef]
- Medicine, A.B.o.I. ABIM laboratory test reference ranges – 24. 2024 [cited 2024 July 18]; Available from: https://www.abim.org/Media/bfijryql/laboratory-reference-ranges.pdf. 20 January.
- Pundir, C.S., P. Kumar, and R. Jaiwal, Biosensing methods for determination of creatinine: A review. Biosensors and Bioelectronics 2019, 126, 707–724. [Google Scholar] [CrossRef]
- Peake, M. and M. Whiting, Measurement of serum creatinine--current status and future goals. Clin Biochem Rev 2006, 27, 173–184. [Google Scholar] [PubMed]
- Stevens, P.E. , et al., KDIGO 2024 Clinical Practice Guideline for the Evaluation and Management of Chronic Kidney Disease. Kidney International 2024, 105, S117–S314. [Google Scholar] [CrossRef] [PubMed]
- Levey, A.S. , et al., Kidney Disease, Race, and GFR Estimation. Clinical Journal of the American Society of Nephrology 2020, 15, 1203–1212. [Google Scholar] [CrossRef] [PubMed]
- Kittiskulnam, P. , et al., Sarcopenia and its individual criteria are associated, in part, with mortality among patients on hemodialysis. Kidney International 2017, 92, 238–247. [Google Scholar] [CrossRef] [PubMed]
- Levey, A. , et al., Expressing the MDRD study equation for estimating GFR with IDMS traceable (gold standard) serum creatinine values. J Am Soc Nephrol 2005, 16, 69A. [Google Scholar]
- Grubb, A. , Cystatin C as a Biomarker in Kidney Disease. 2011, Elsevier. 291-312.
- Grubb, A. and H. Löfberg, Human gamma-trace, a basic microprotein: amino acid sequence and presence in the adenohypophysis. Proceedings of the National Academy of Sciences 1982, 79, 3024–3027. [Google Scholar] [CrossRef]
- Abrahamson, M. , et al., Structure and expression of the human cystatin C gene. Biochemical Journal 1990, 268, 287–294. [Google Scholar] [CrossRef]
- Abrahamson, M. , et al., Isolation of six cysteine proteinase inhibitors from human urine. Their physicochemical and enzyme kinetic properties and concentrations in biological fluids. J Biol Chem 1986, 261, 11282–11289. [Google Scholar] [CrossRef]
- Grubb, A.O. , Cystatin C-Properties and use as diagnostic marker. 2001, Elsevier. 63-99.
- Kaseda, R. , et al., Megalin-mediated endocytosis of cystatin C in proximal tubule cells. Biochemical and Biophysical Research Communications 2007, 357, 1130–1134. [Google Scholar] [CrossRef]
- Nejat, M. , et al., Albuminuria increases cystatin C excretion: implications for urinary biomarkers. Nephrology Dialysis Transplantation 2012, 27, iii96–iii103. [Google Scholar] [CrossRef]
- Chen, D.C. , et al., Differential Associations of Cystatin C Versus Creatinine-Based Kidney Function With Risks of Cardiovascular Event and Mortality Among South Asian Individuals in the UK Biobank. Journal of the American Heart Association.
- Chen, D.C. , et al., Cystatin C- and Creatinine-based Estimated GFR Differences: Prevalence and Predictors in the UK Biobank. Kidney Medicine 2024, 6, 100796. [Google Scholar] [CrossRef] [PubMed]
- Jayagopal, V. , et al., Paradoxical Changes in Cystatin C and Serum Creatinine in Patients with Hypo- and Hyperthyroidism. Clinical Chemistry 2003, 49, 680–681. [Google Scholar] [CrossRef] [PubMed]
- Wiesli, P. , et al. , Serum cystatin C is sensitive to small changes in thyroid function. Clinica Chimica Acta 2003, 338, 87–90. [Google Scholar]
- Fricker, M. , et al., Impact of thyroid dysfunction on serum cystatin C. Kidney International 2003, 63, 1944–1947. [Google Scholar] [CrossRef]
- Hossain, M.A. , et al., Comparing Measures of Cystatin C in Human Sera by Three Methods. American Journal of Nephrology 2009, 29, 381–391. [Google Scholar] [CrossRef]
- Stevens, L.A. , et al., Factors other than glomerular filtration rate affect serum cystatin C levels. Kidney International 2009, 75, 652–660. [Google Scholar] [CrossRef]
- Spencer, S., R. Desborough, and S. Bhandari, Should Cystatin C eGFR Become Routine Clinical Practice? Biomolecules 2023, 13, 1075. [Google Scholar] [CrossRef]
- Wang, Z. , et al., Hydration of fat-free body mass: new physiological modeling approach. American Journal of Physiology-Endocrinology and Metabolism 1999, 276, E995–E1003. [Google Scholar] [CrossRef]
- Keshaviah, P.R. , et al., Lean body mass estimation by creatinine kinetics. Journal of the American Society of Nephrology 1994, 4, 1475–1485. [Google Scholar] [CrossRef]
- Bhatla, B. , et al., Lean Body Mass Estimation by Creatinine Kinetics, Bioimpedance, and Dual Energy X-Ray Absorptiometry in Patients on Continuous Ambulatory Peritoneal Dialysis. ASAIO Journal 1995, 41, M442–M446. [Google Scholar] [CrossRef]
- Canaud, B. , et al., Creatinine kinetic modelling: a simple and reliable tool for the assessment of protein nutritional status in haemodialysis patients. Nephrol Dial Transplant 1995, 10, 1405–1410. [Google Scholar] [PubMed]
- Canaud, B. , et al., Clinical and predictive value of simplified creatinine index used as muscle mass surrogate in end-stage kidney disease haemodialysis patients—results from the international MONitoring Dialysis Outcome initiative. Nephrology Dialysis Transplantation 2020, 35, 2161–2171. [Google Scholar] [CrossRef] [PubMed]
- Ikizler, T.A. , et al., KDOQI Clinical Practice Guideline for Nutrition in CKD: 2020 Update. American Journal of Kidney Diseases 2020, 76, S1–S107. [Google Scholar] [CrossRef] [PubMed]
- Iacone, R. , et al., Validation of daily urinary creatinine excretion measurement by muscle-creatinine equivalence. Journal of Clinical Laboratory Analysis 2018, 32, e22407. [Google Scholar] [CrossRef]
- Forbes, G. and G. Bruining, Urinary creatinine excretion and lean body mass. The American Journal of Clinical Nutrition 1976, 29, 1359–1366. [Google Scholar]
Figure 1.
Effect of pH on creatinine stability.
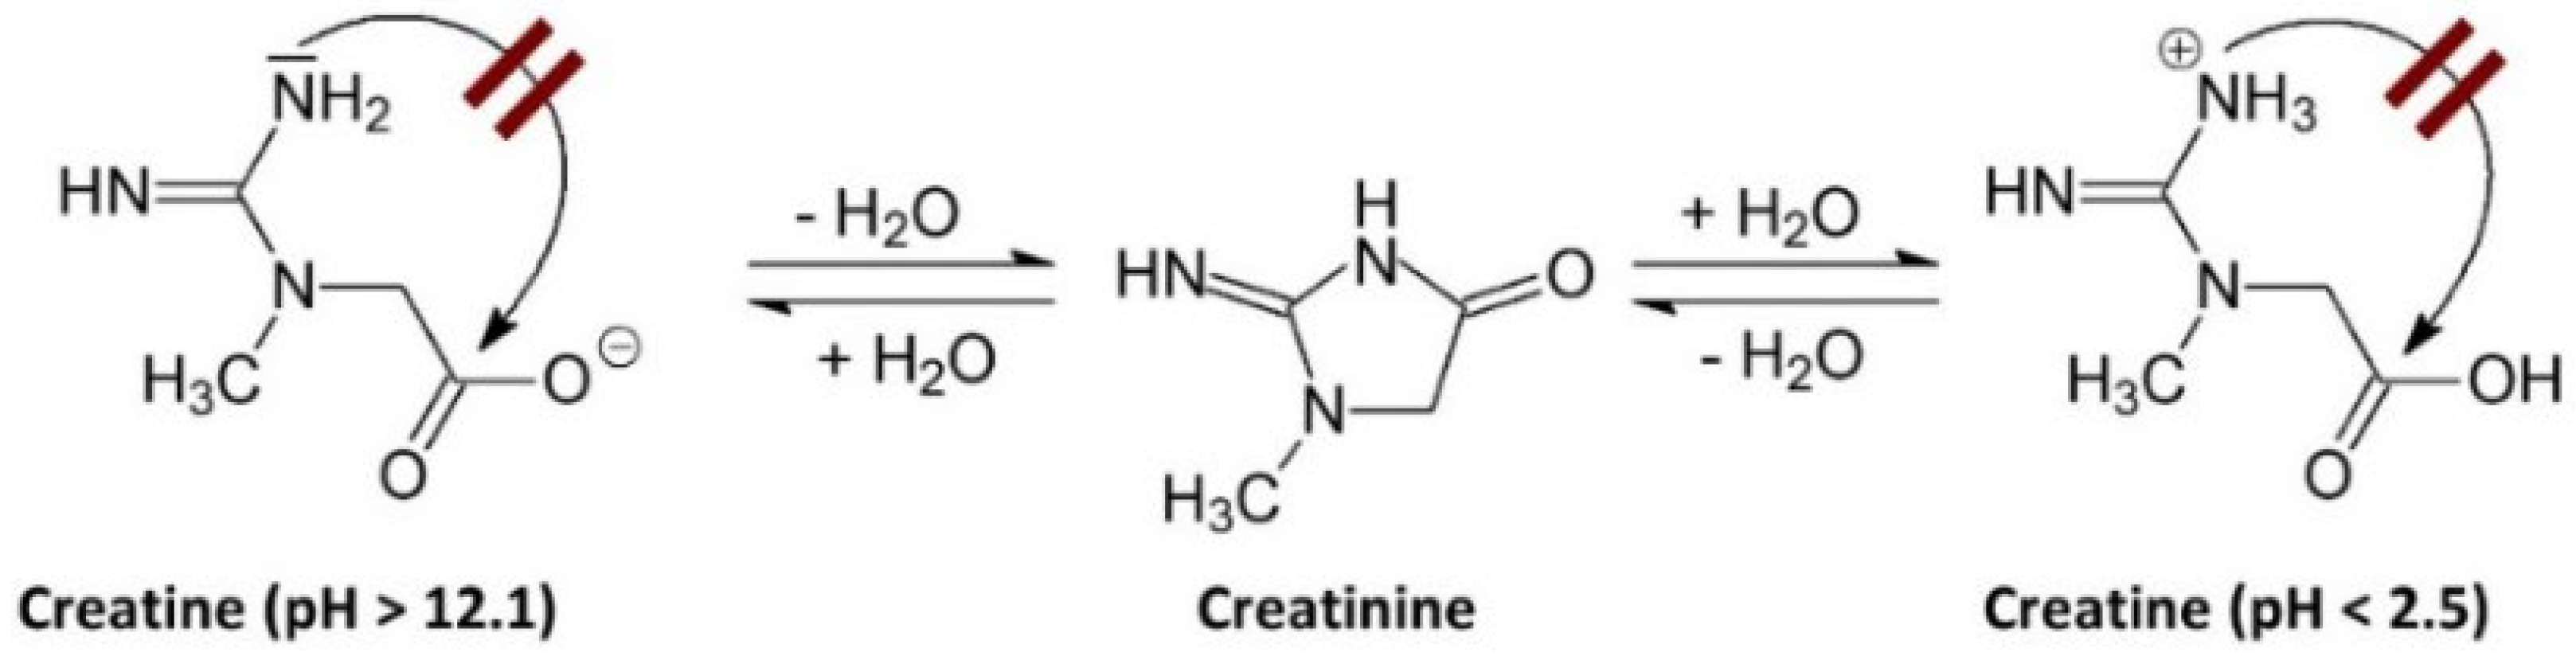
Figure 2.
Main Sources and Pathways of Creatinine Elimination.
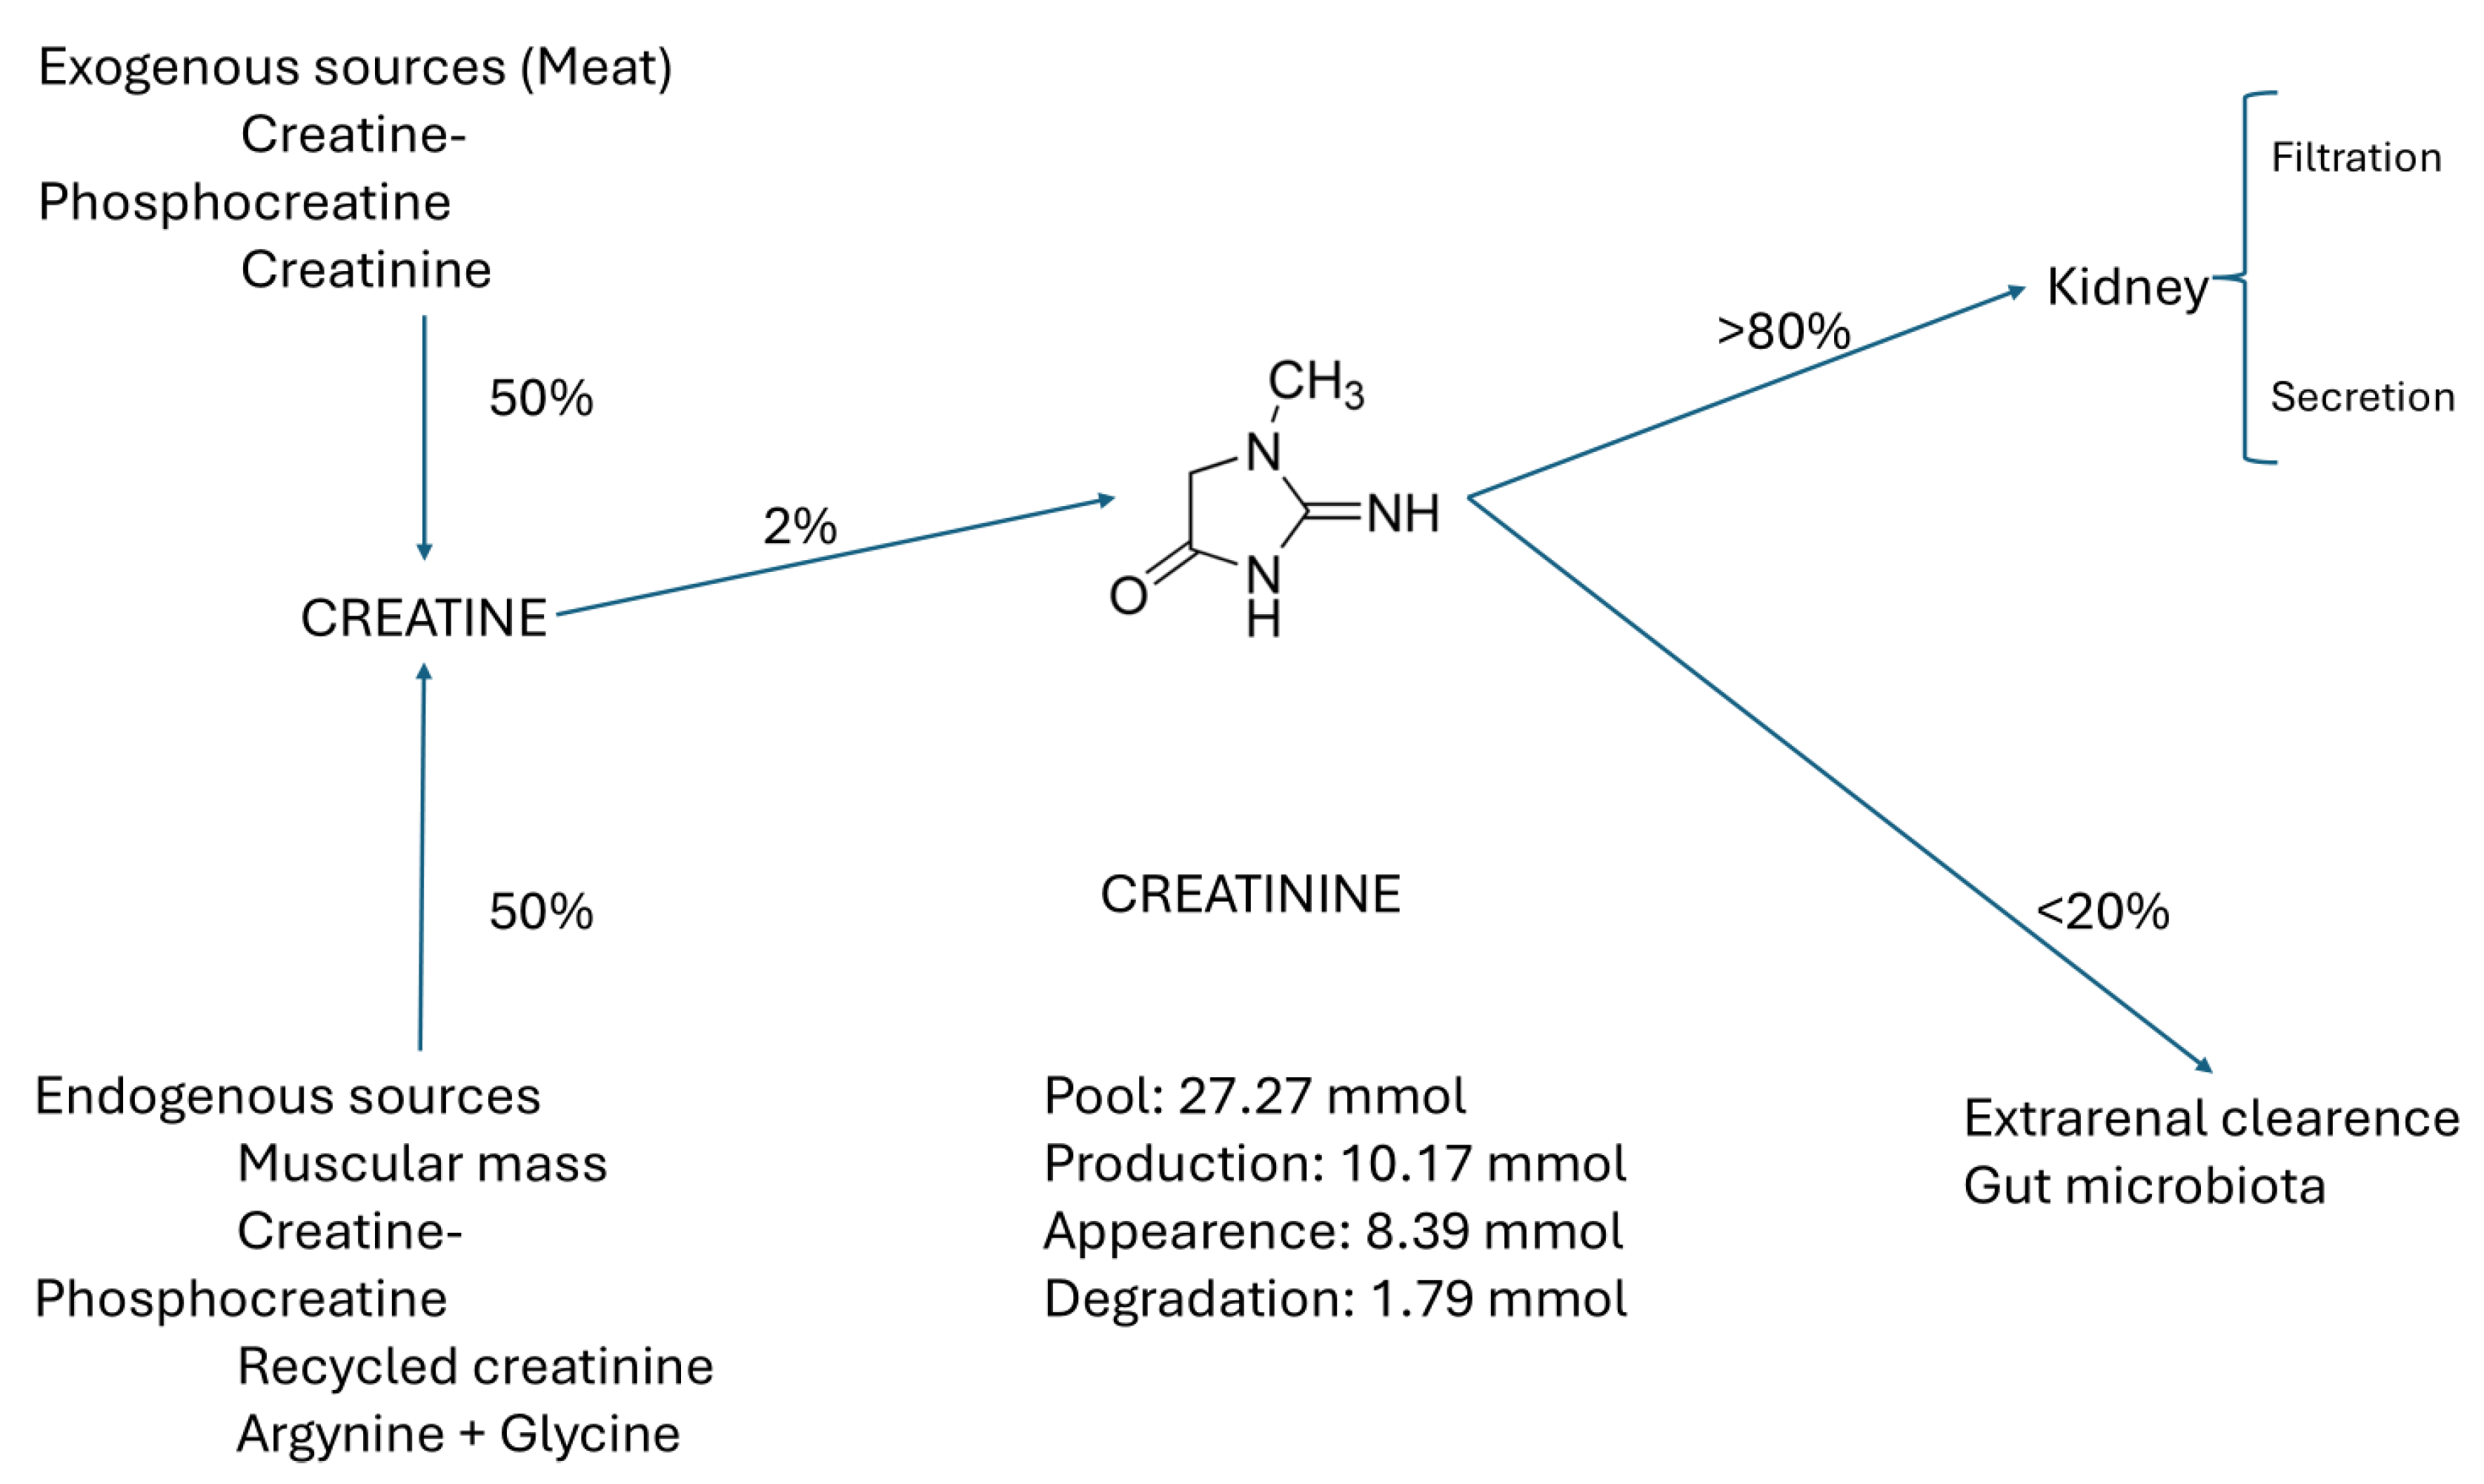
Figure 3.
Creatine Metabolism.
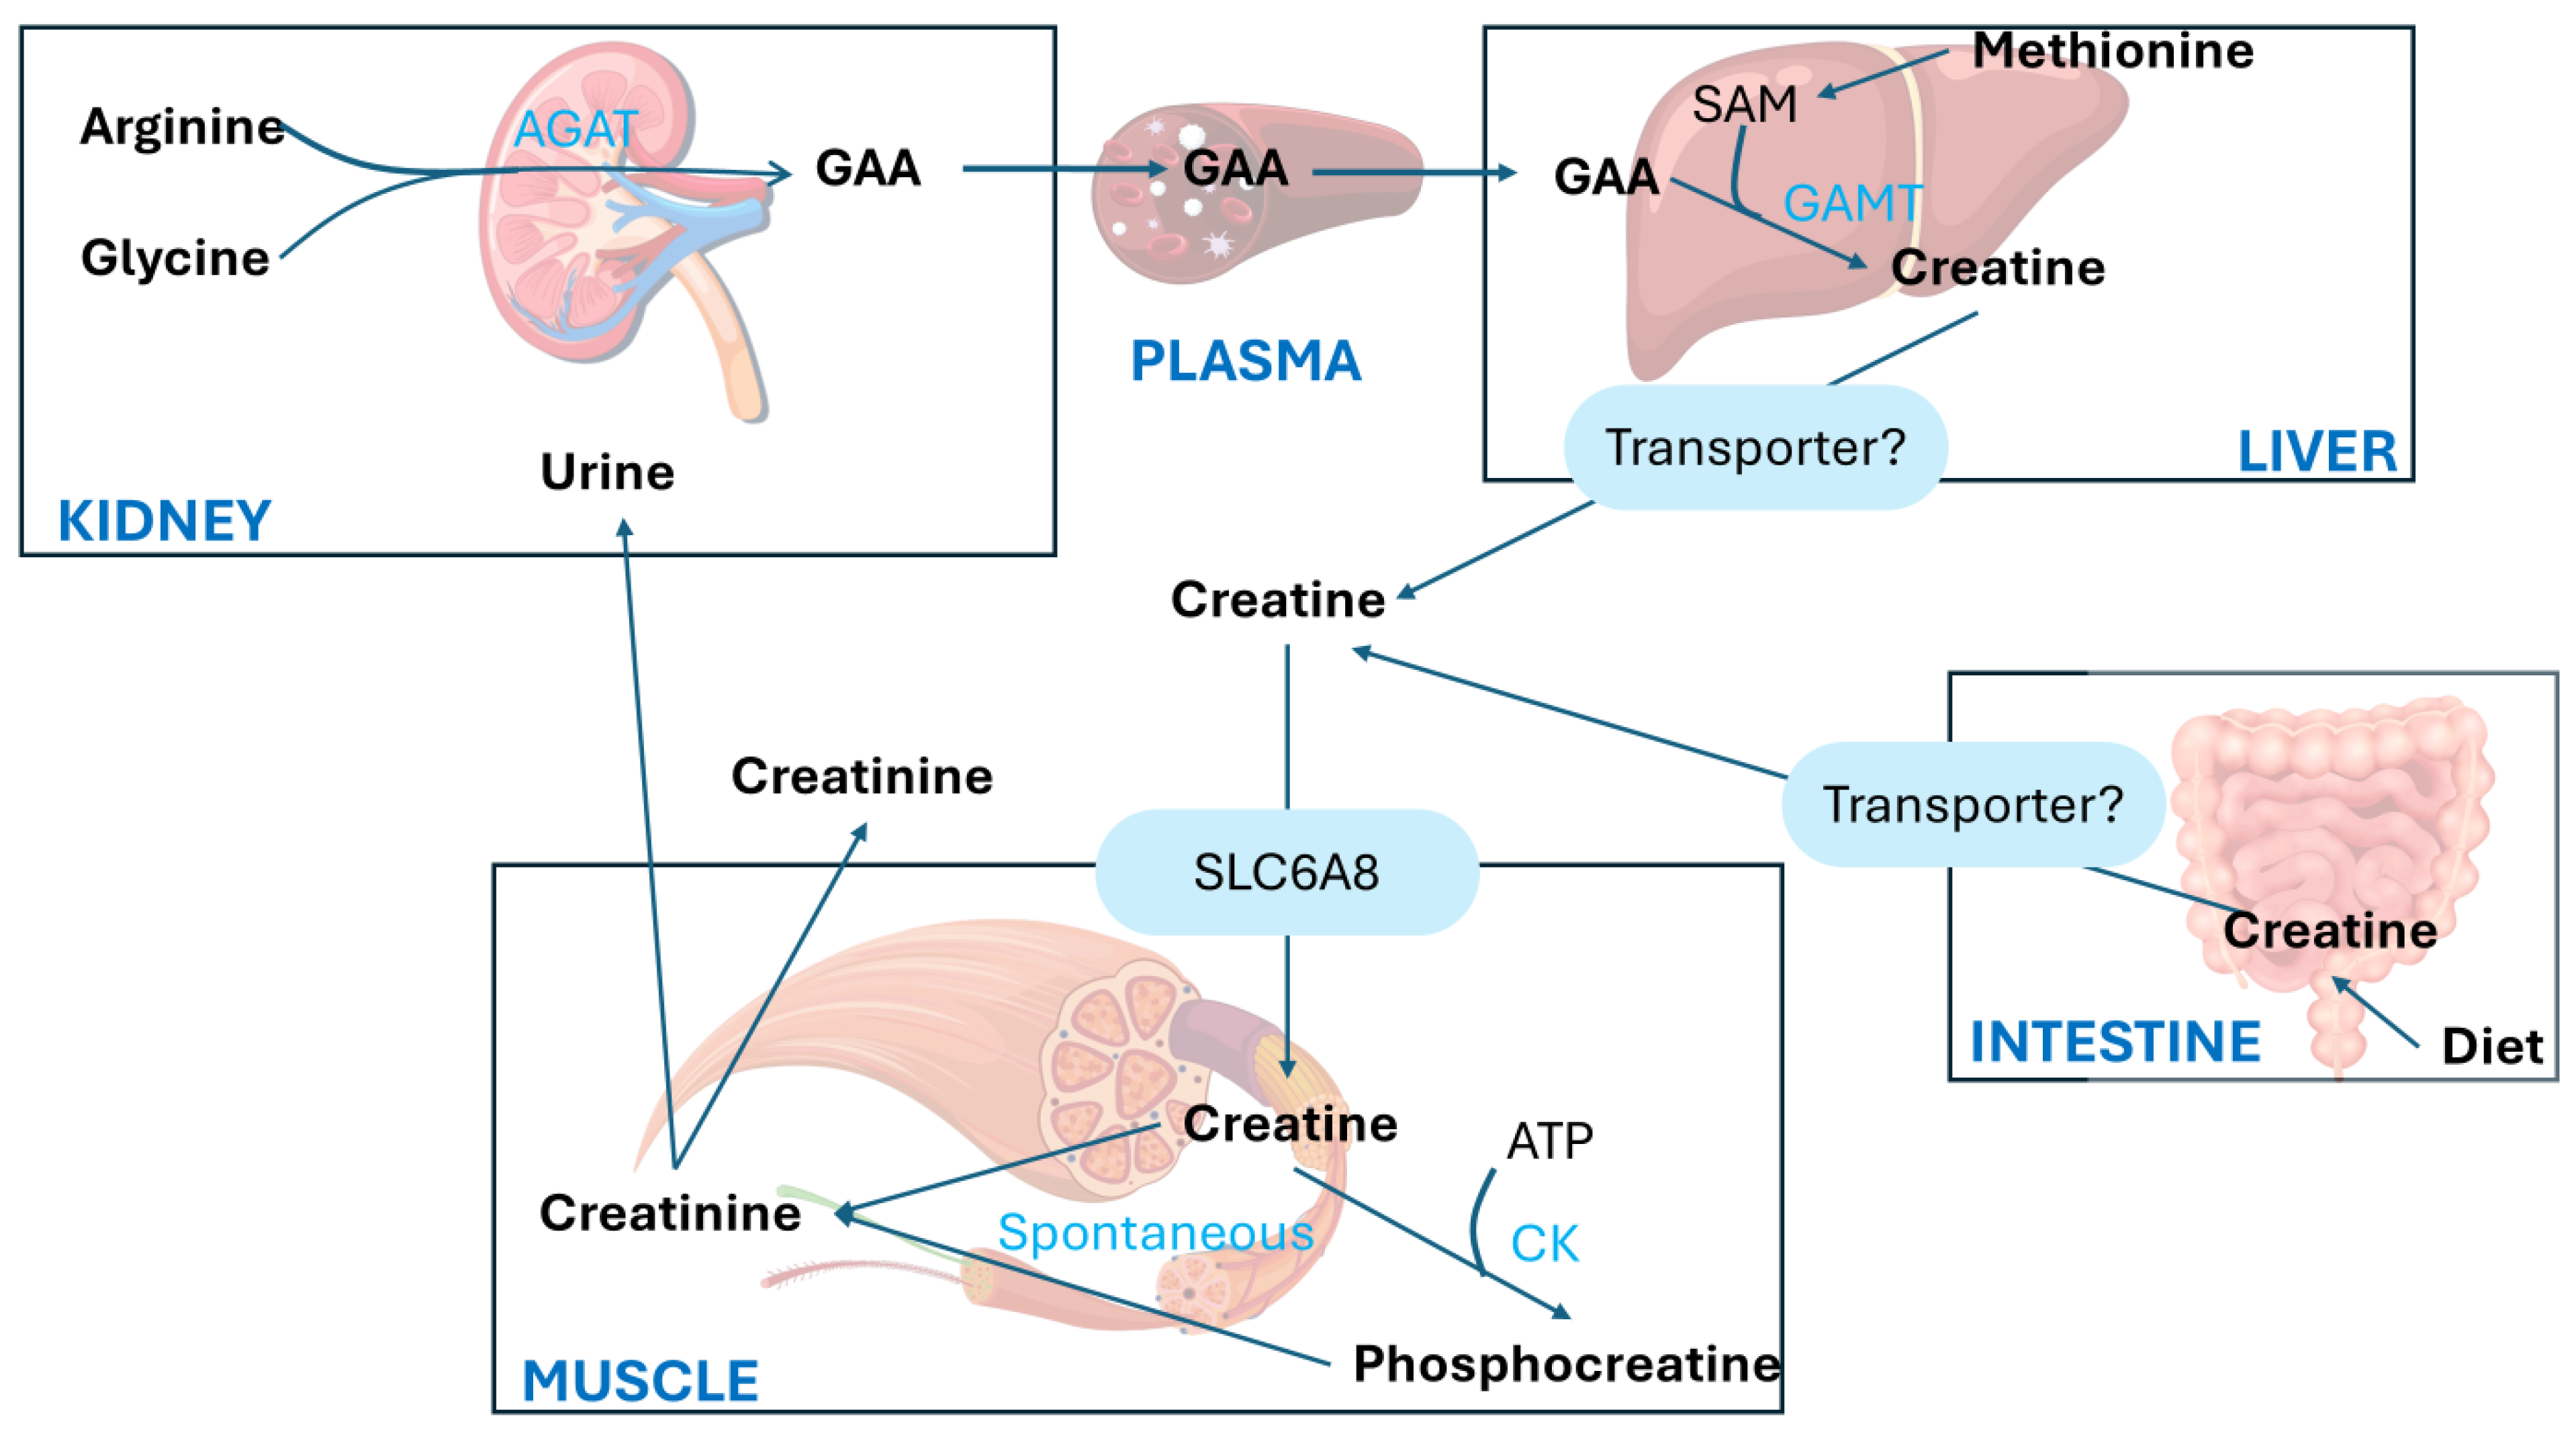
Figure 4.
Creatine kinase reaction.
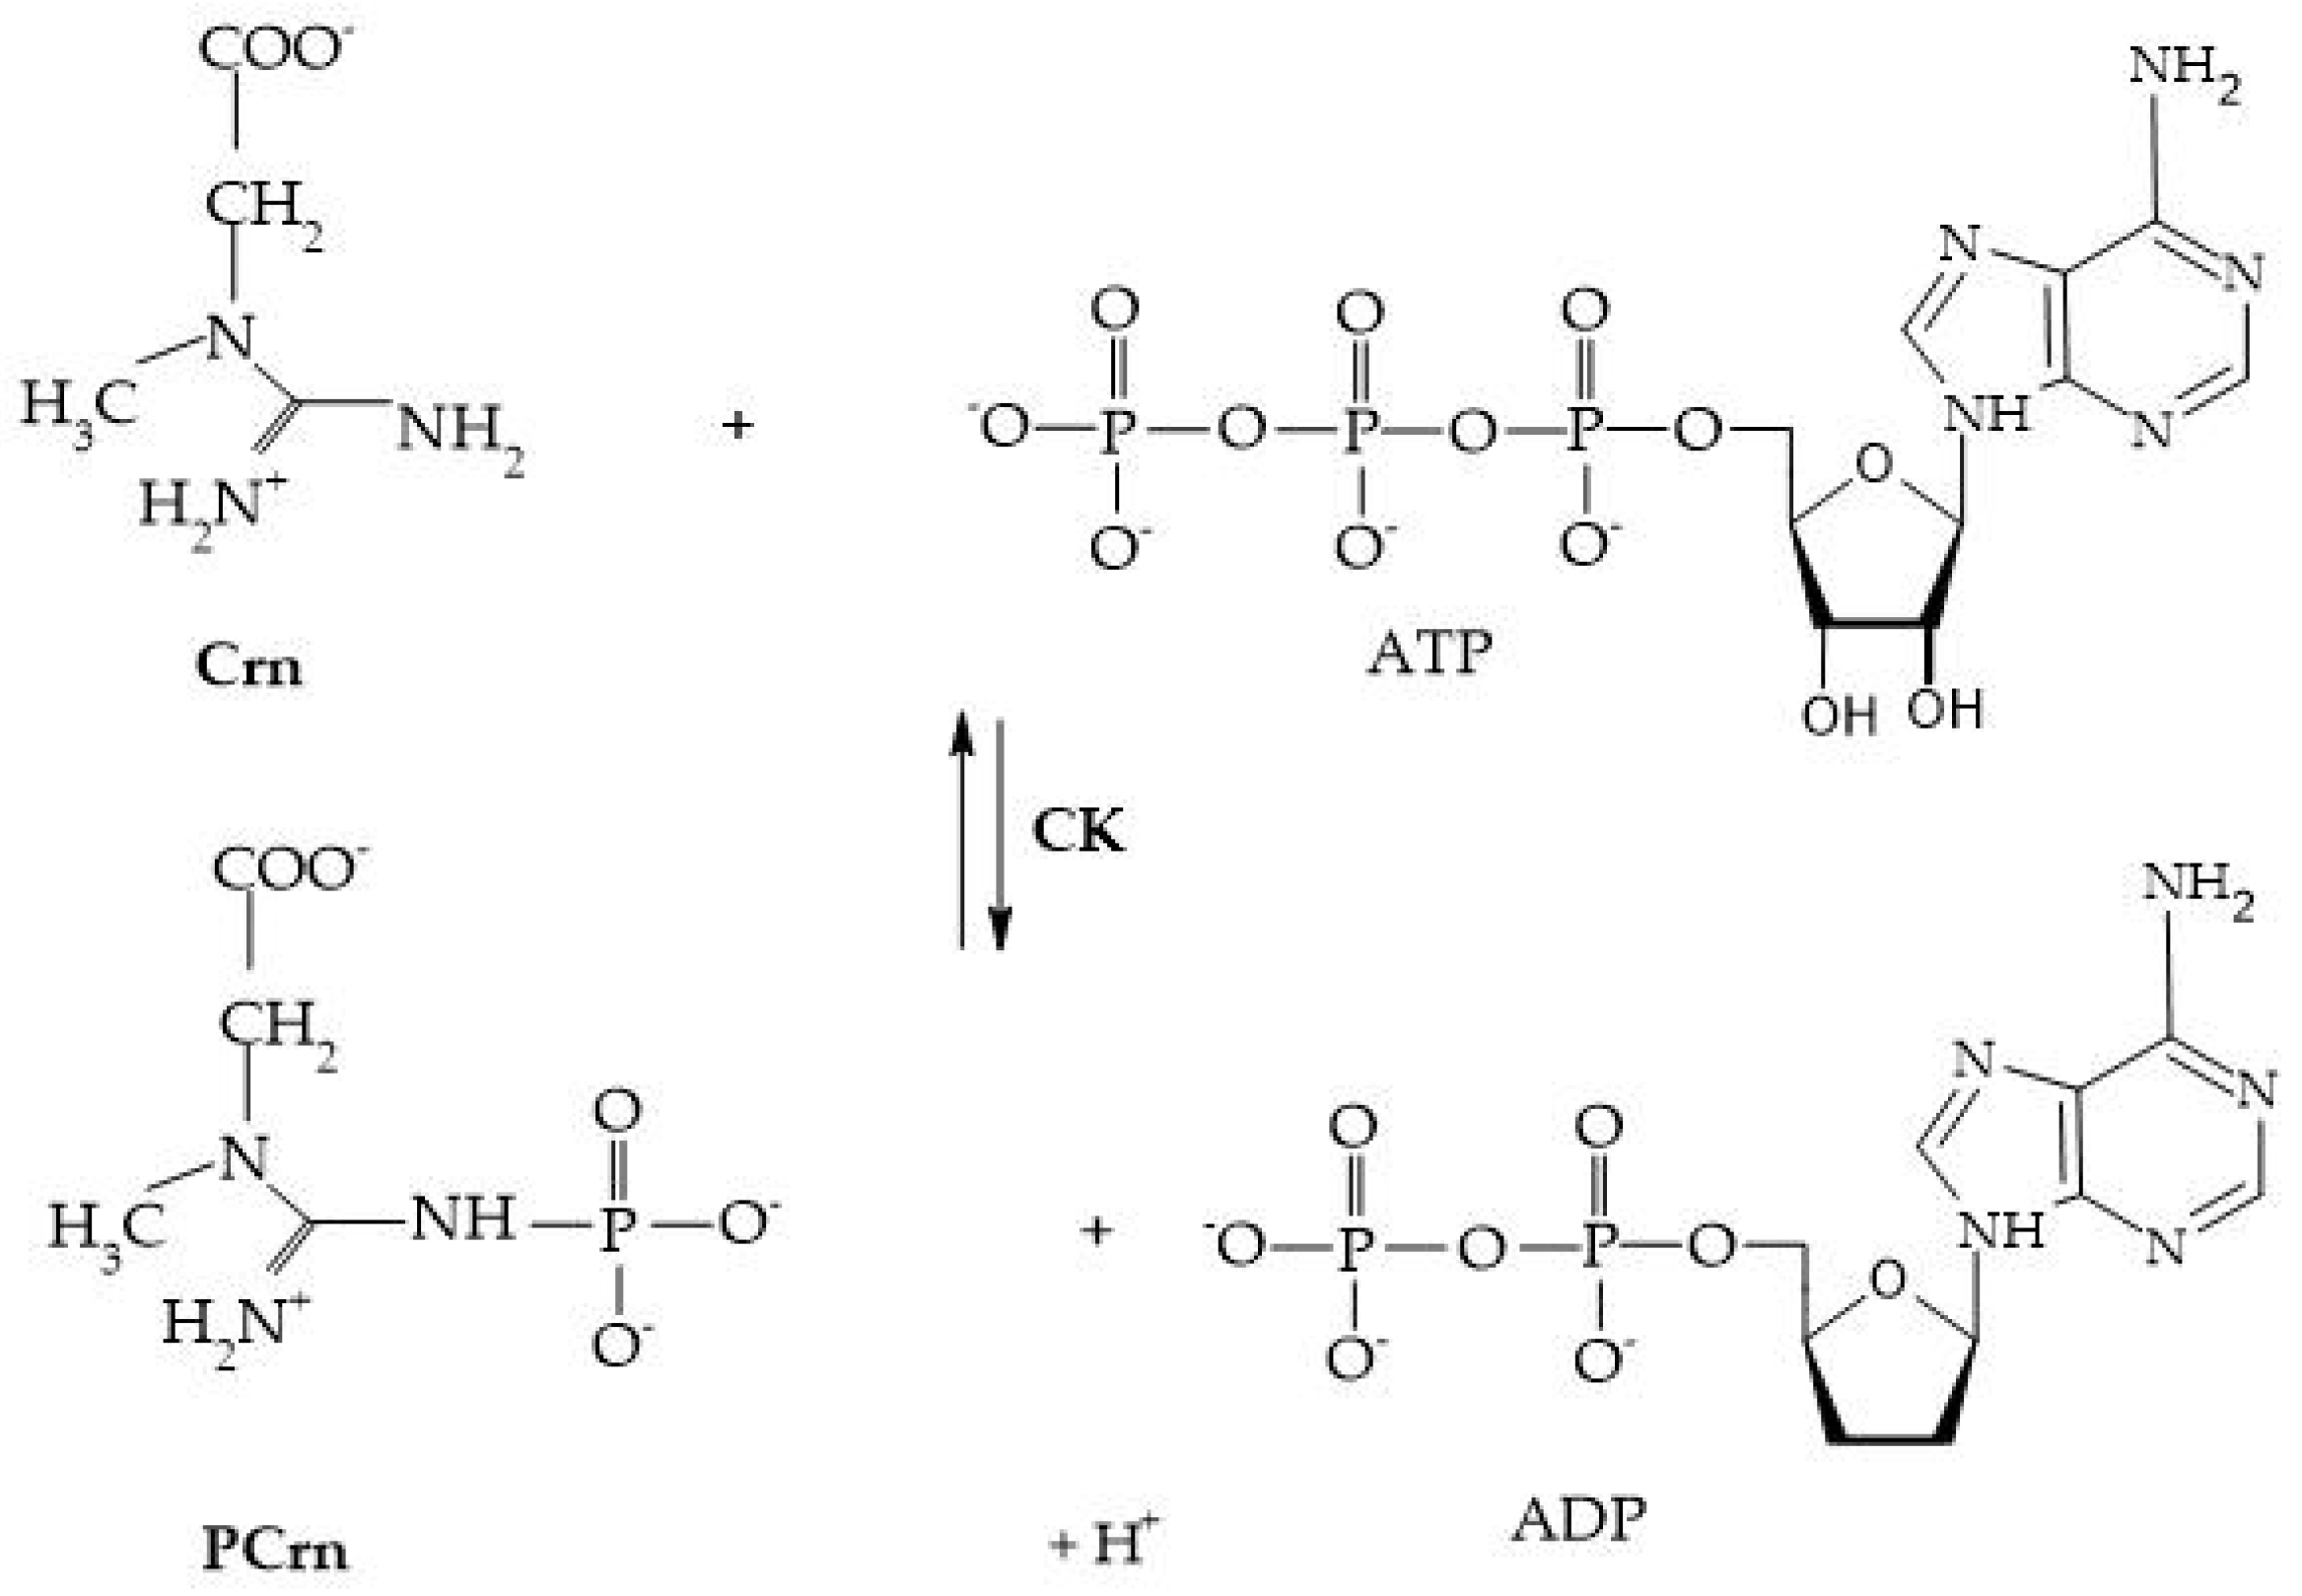
Figure 5.
Degradation of creatinine by the intestinal microbiota.
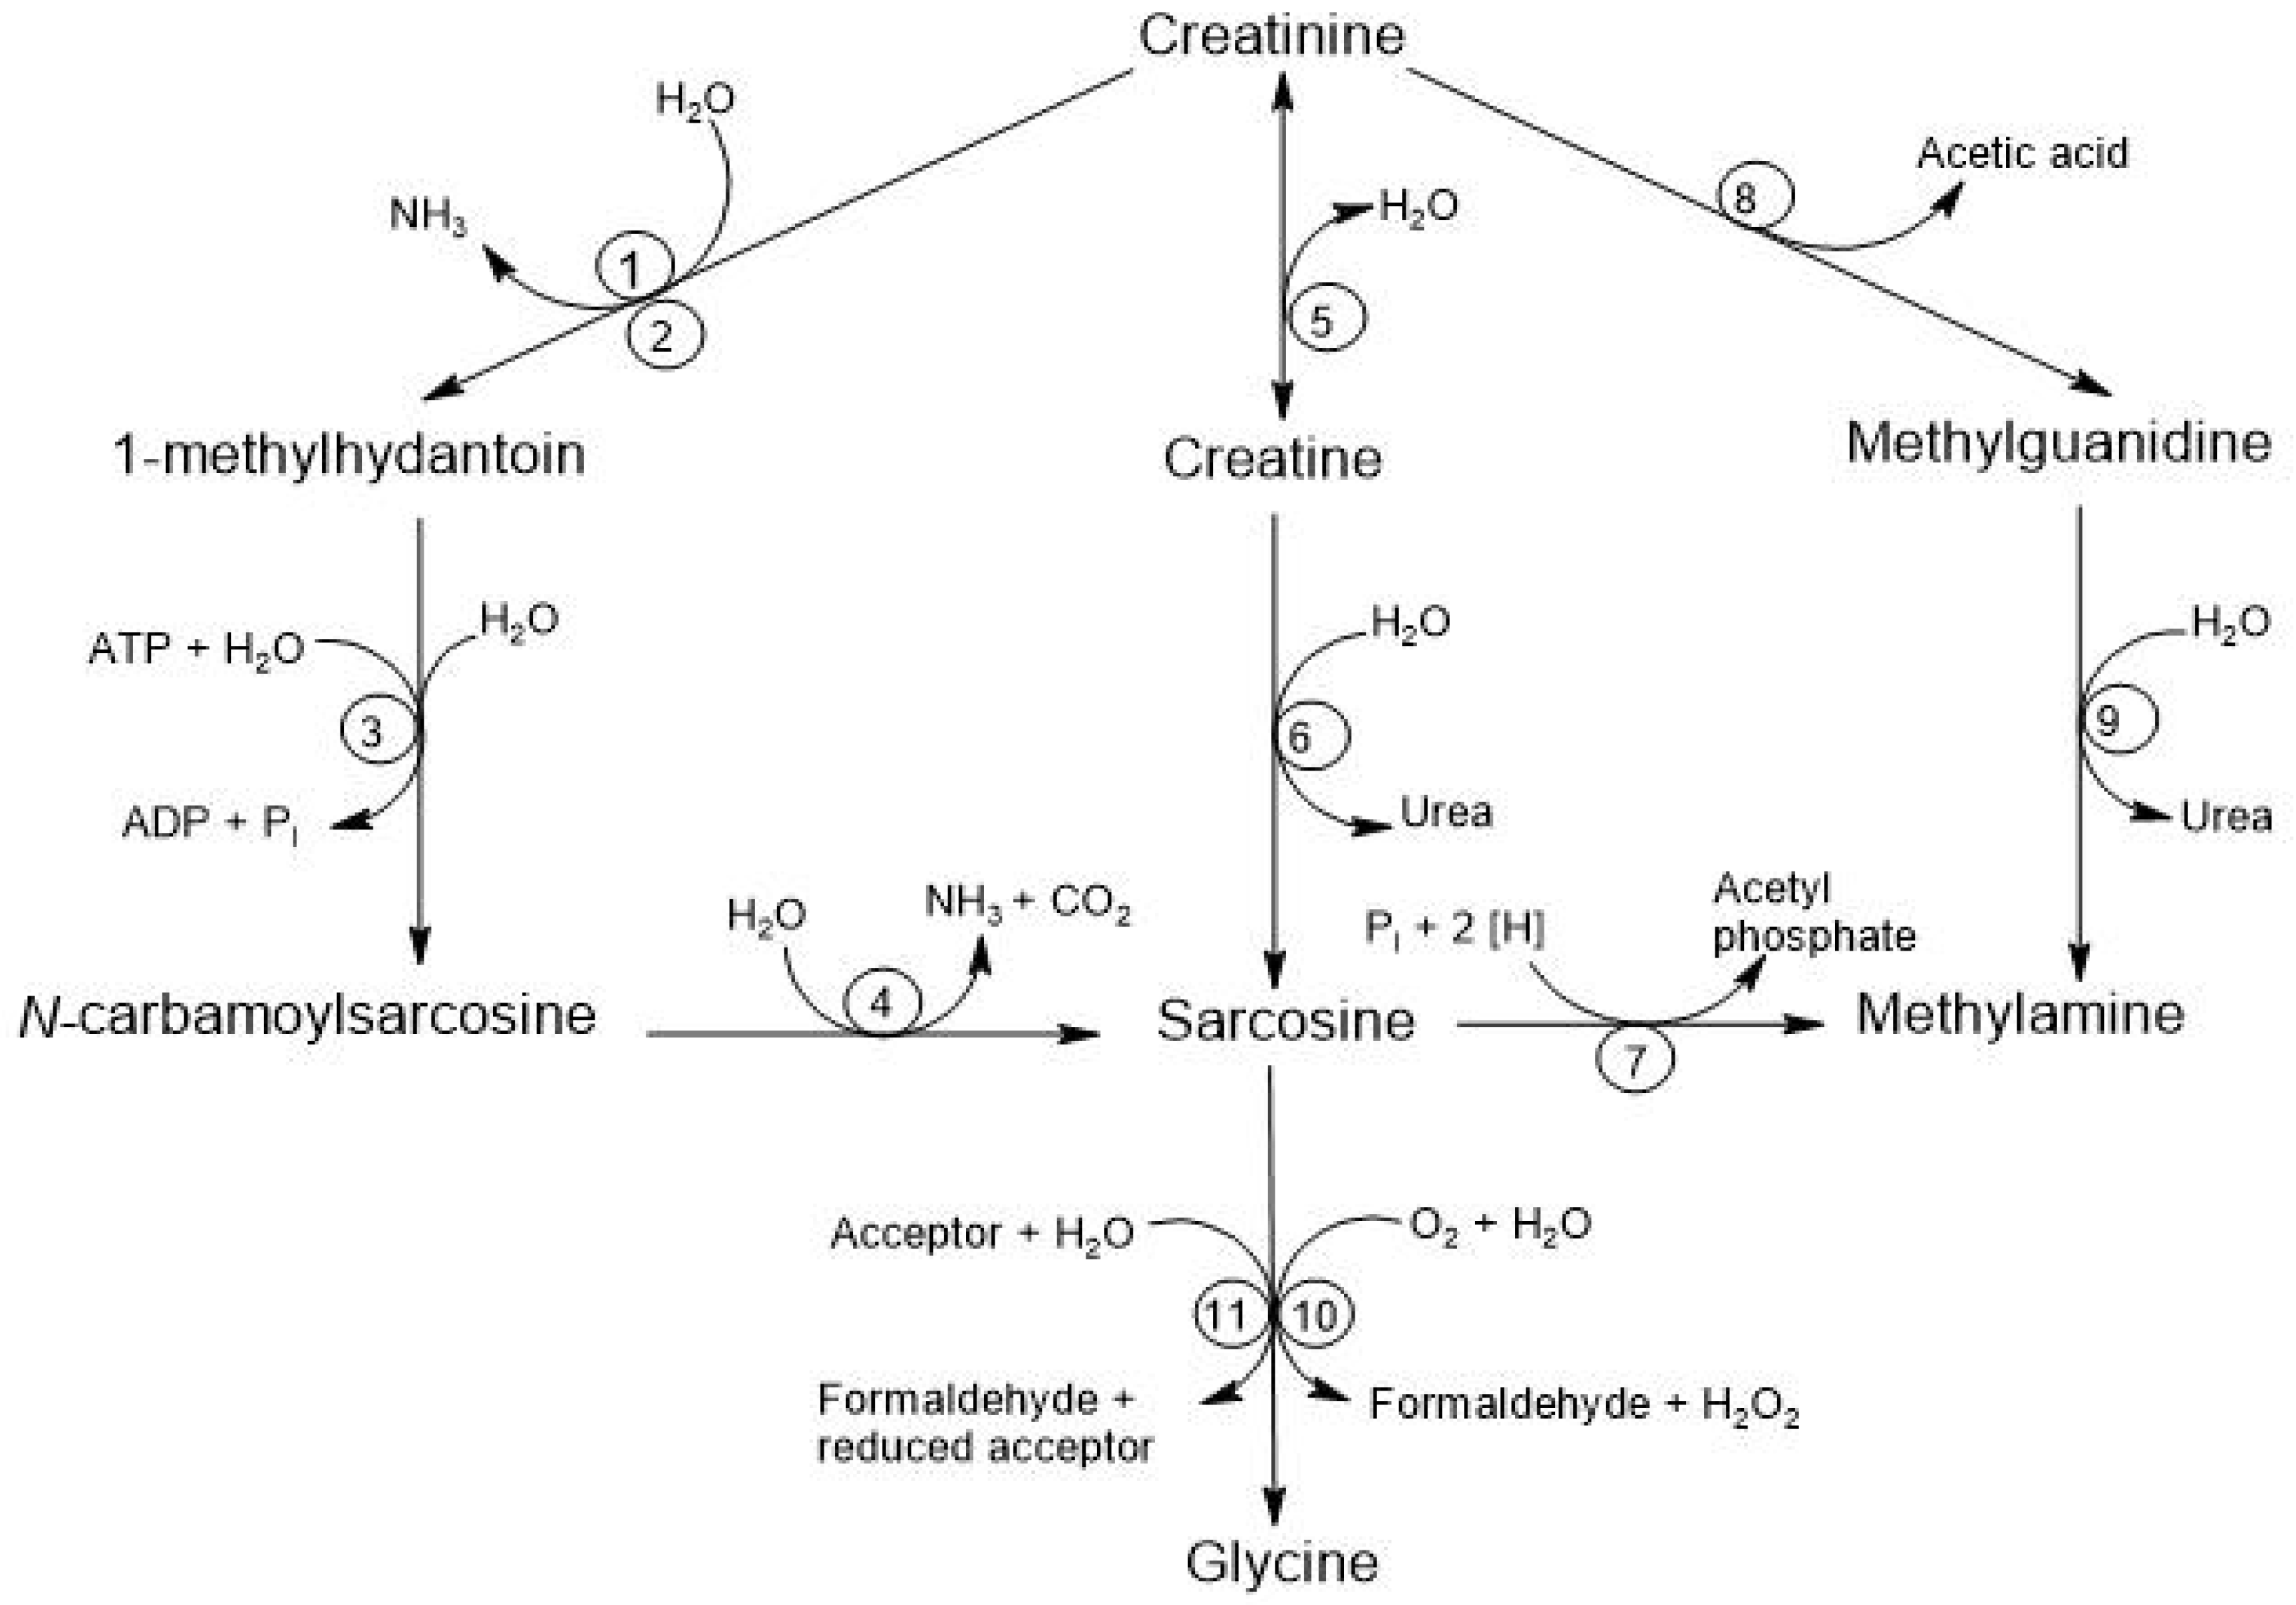
Figure 6.
Factors that influence serum creatinine concentration.
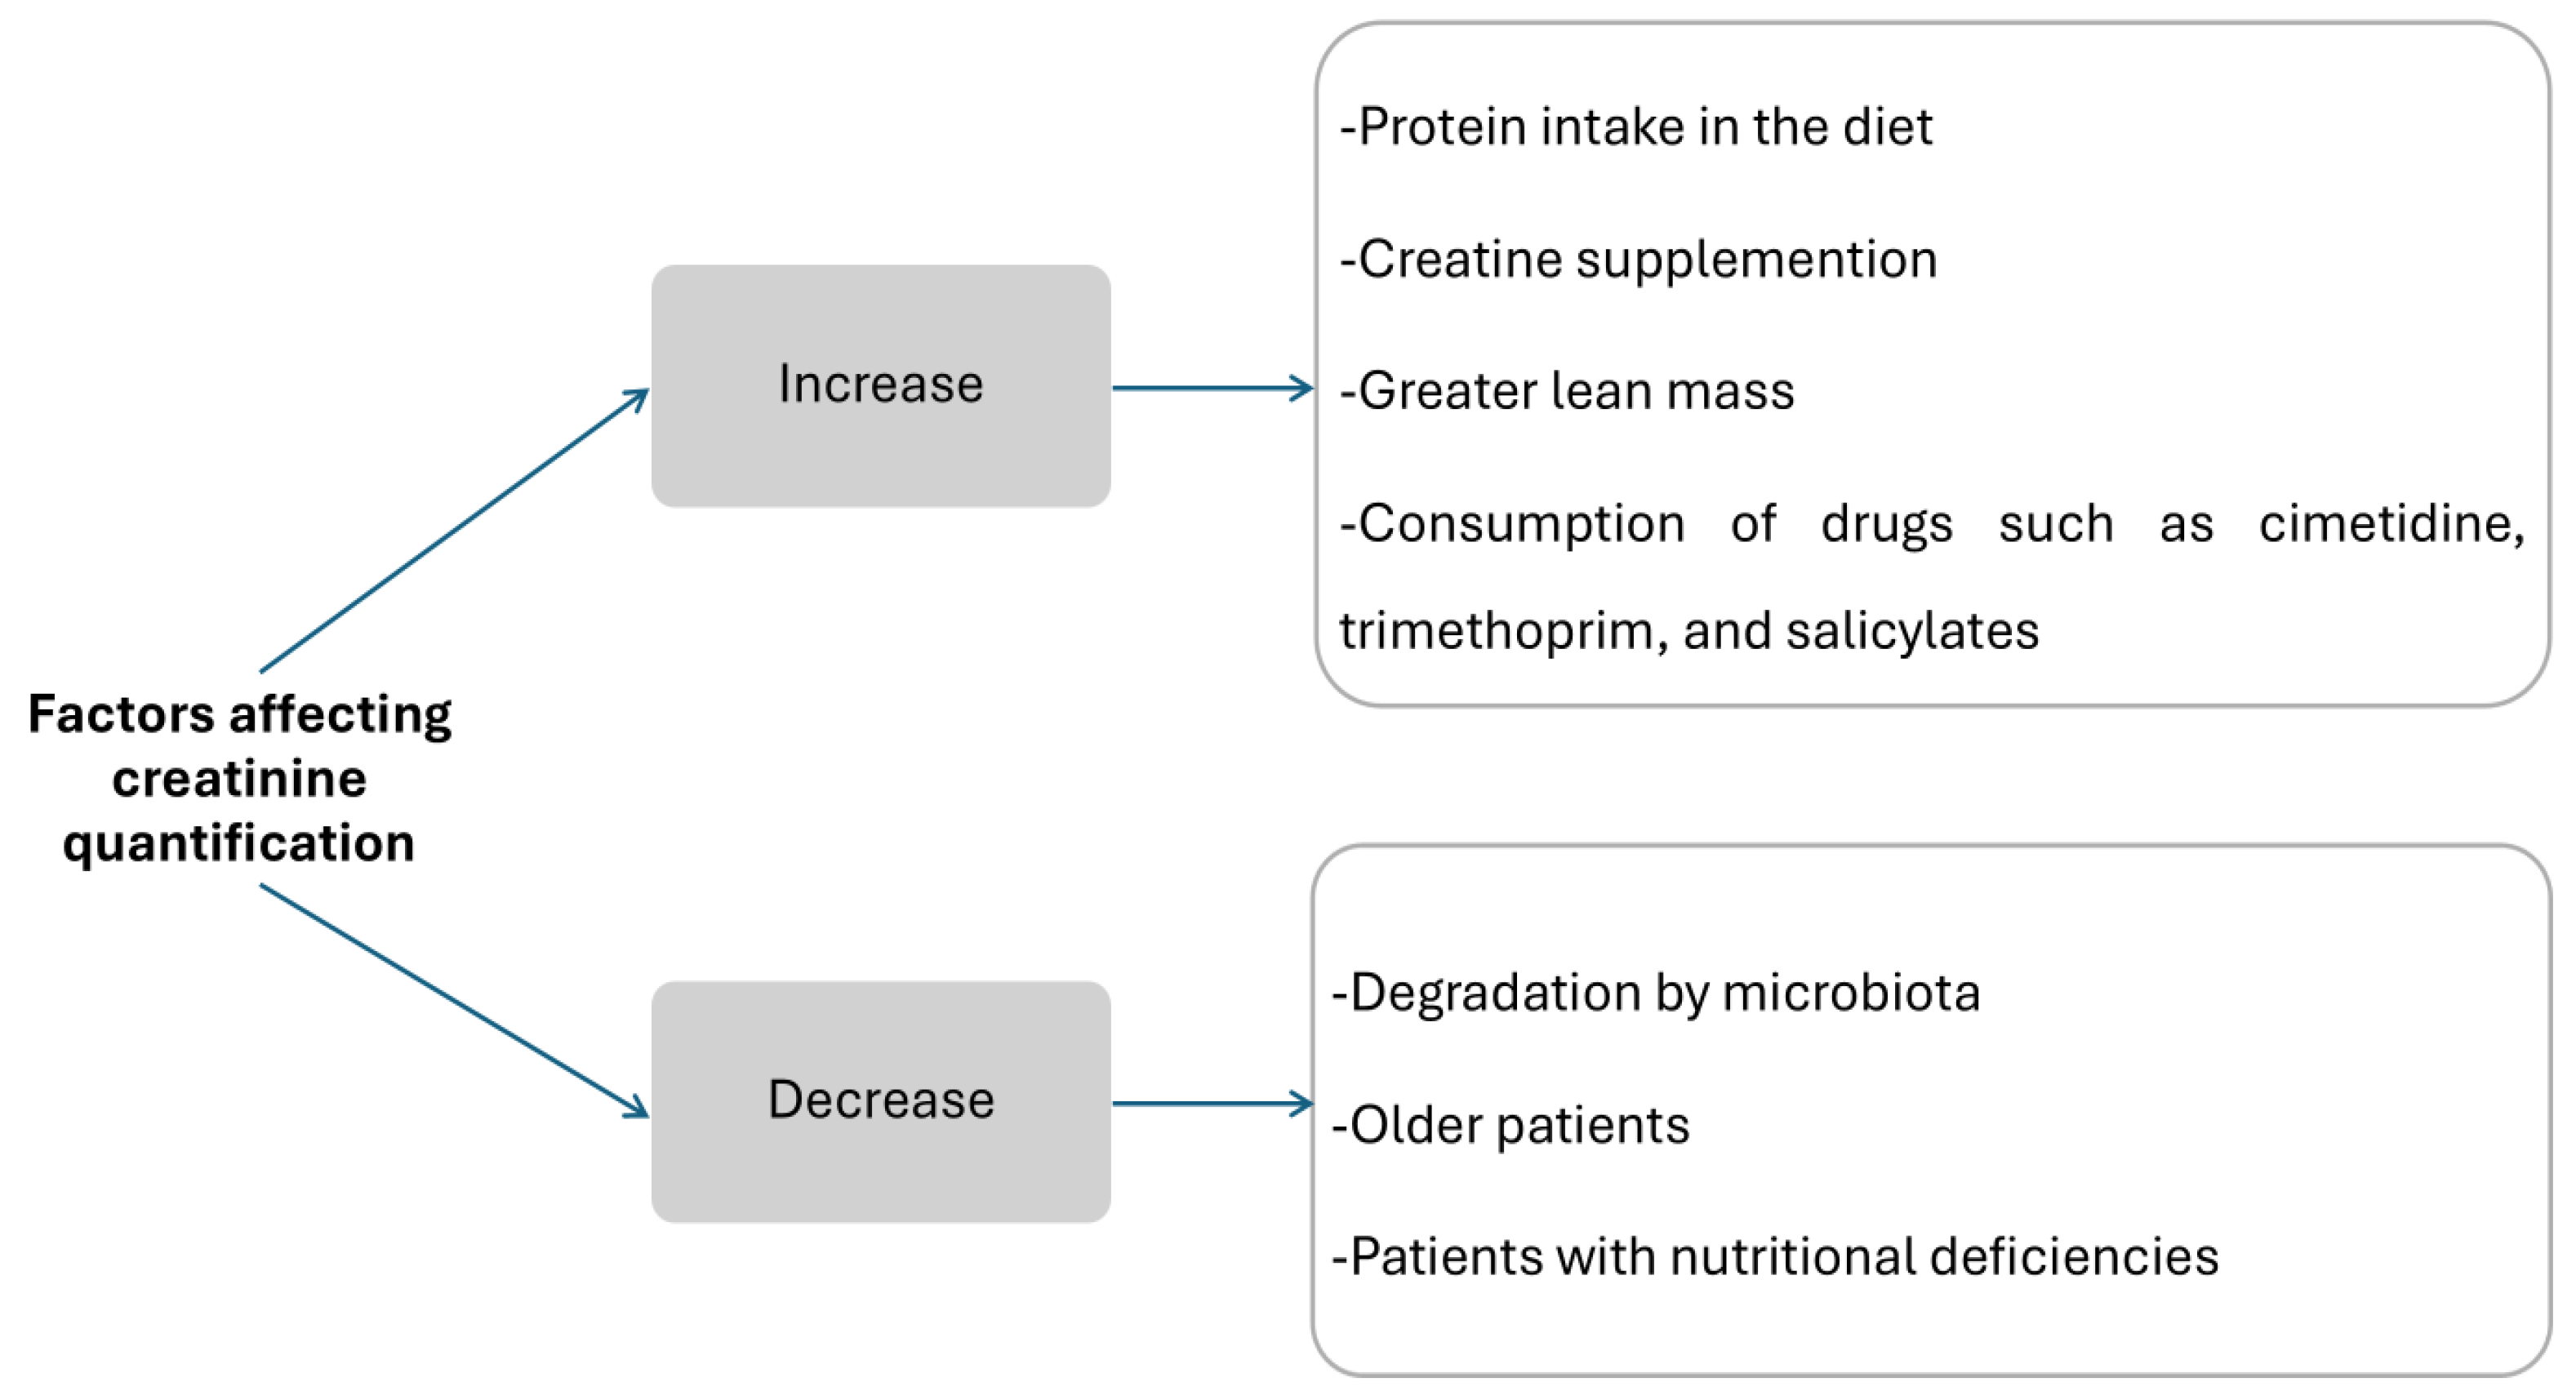
Figure 7.
Drug Transporters in Proximal Kidney Cells.
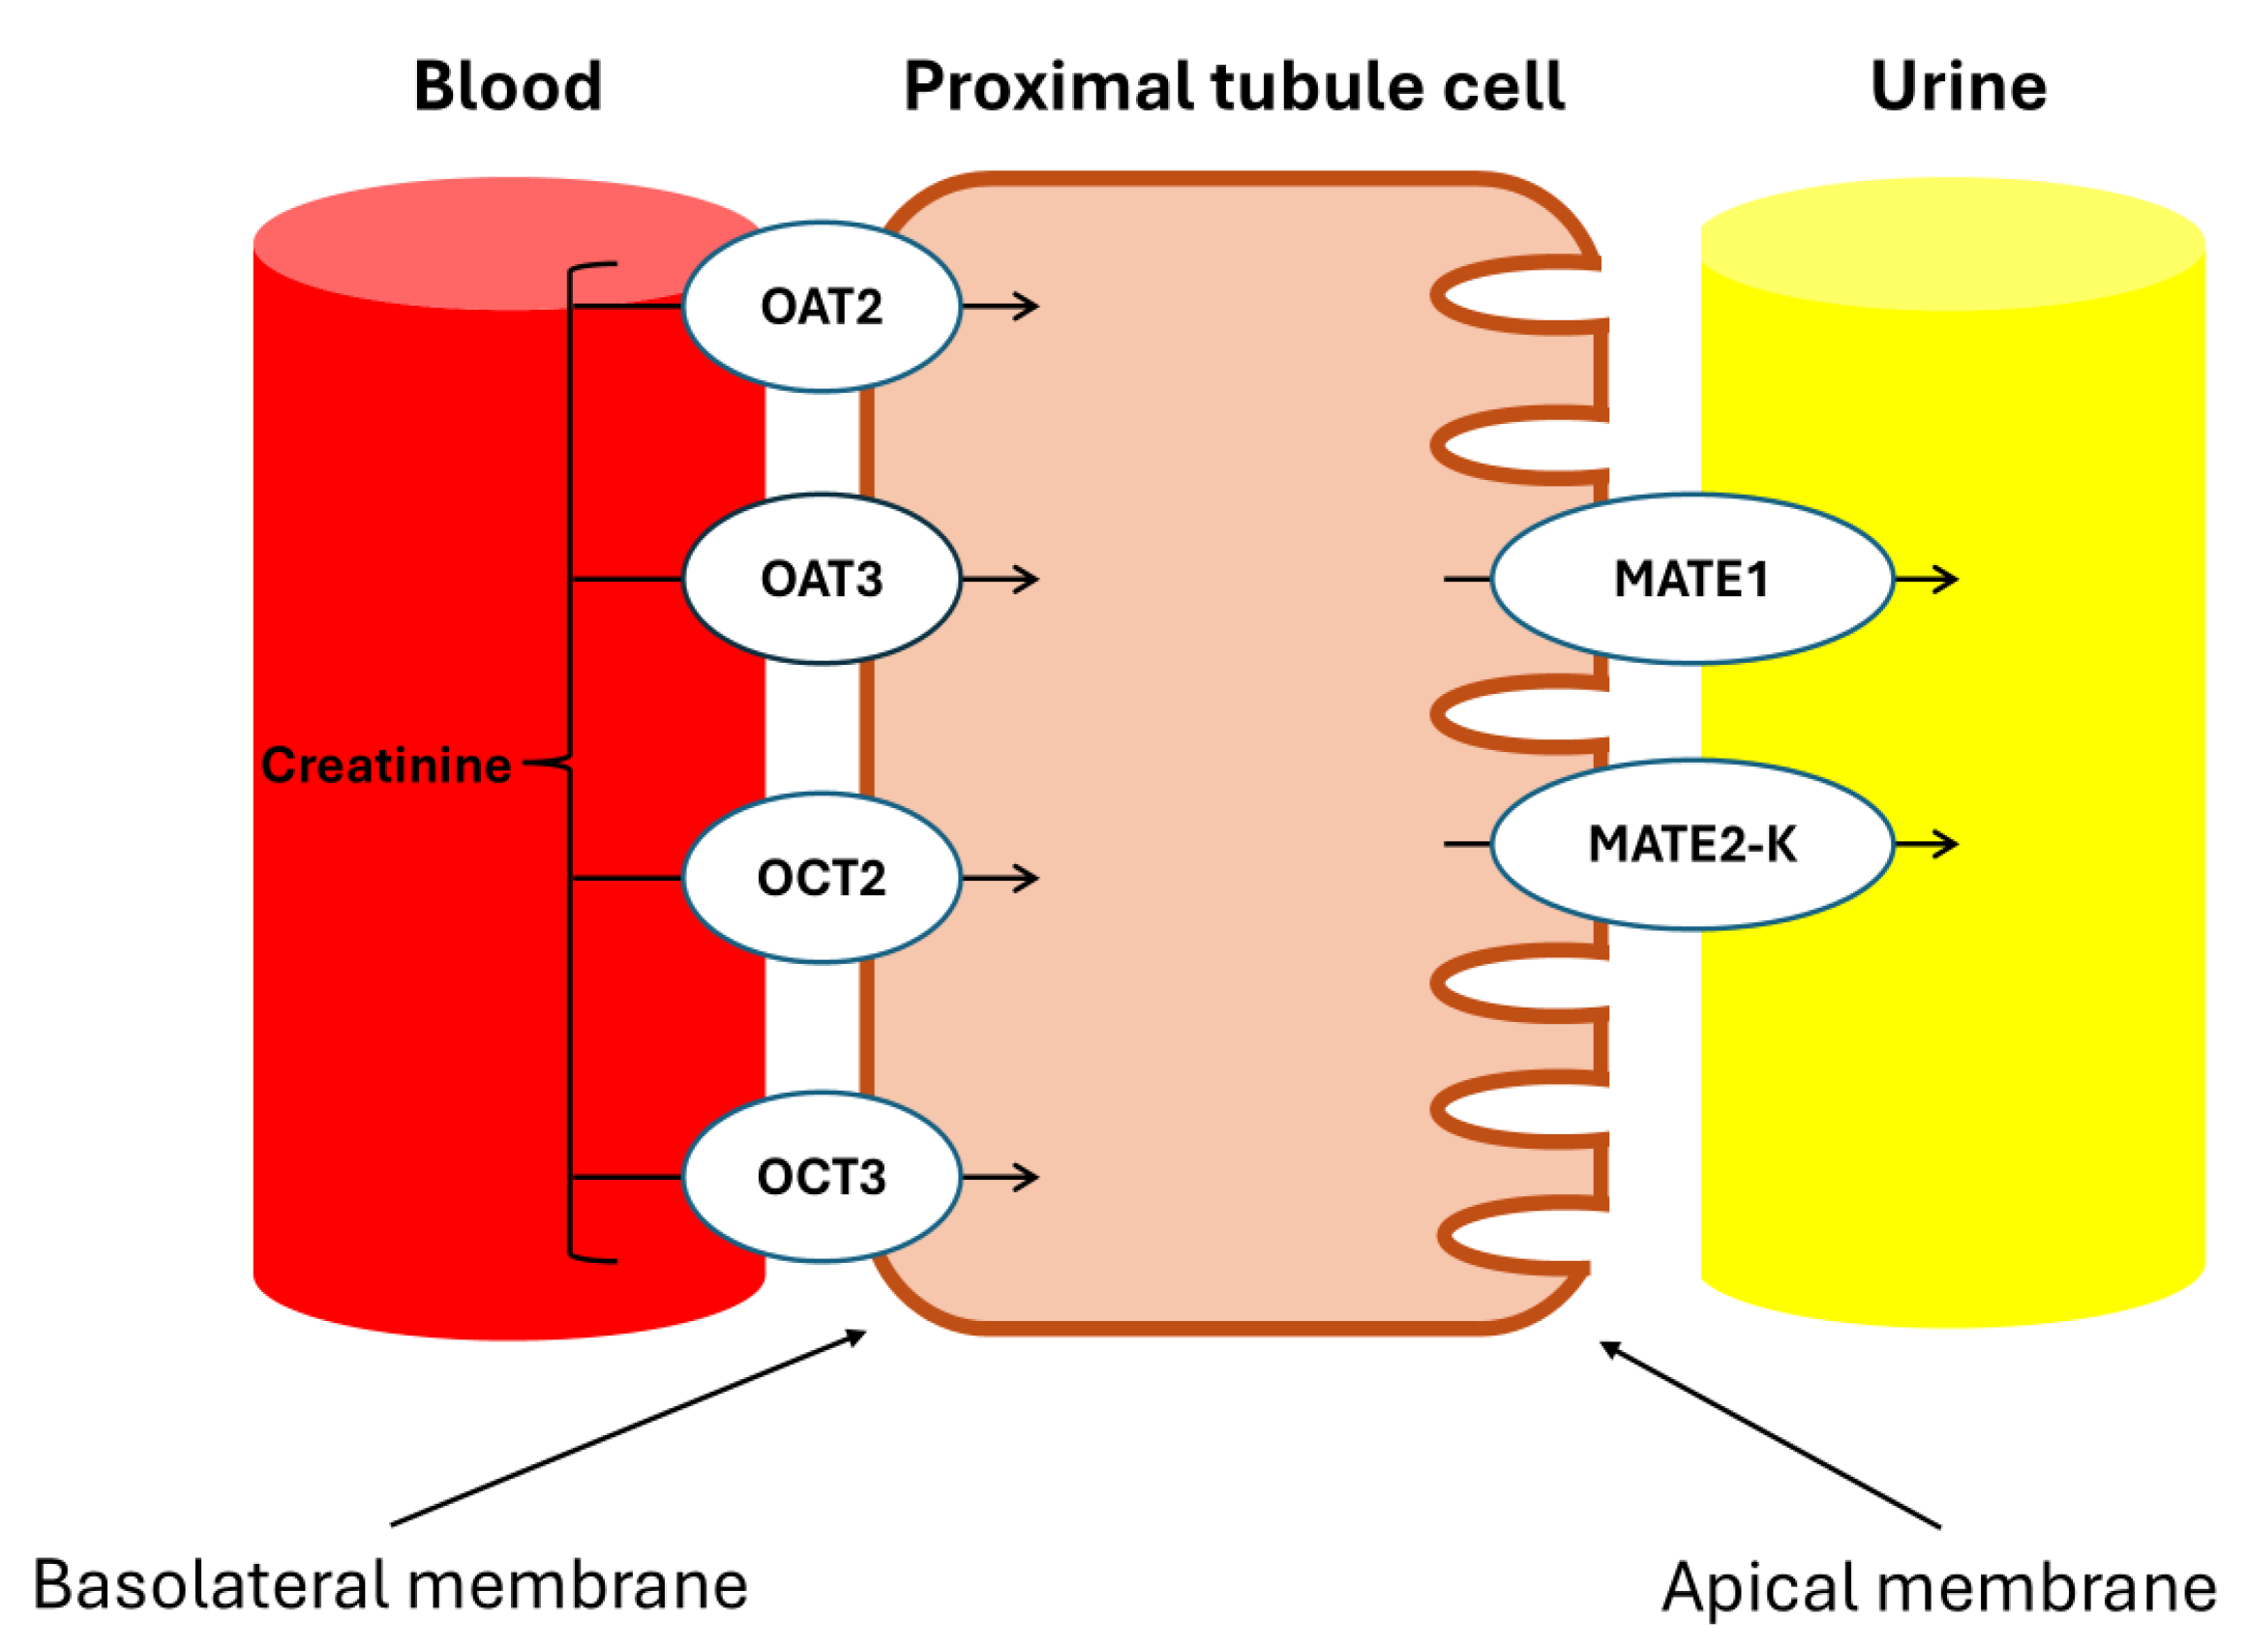
Figure 8.
The Structure of Cystatin C Molecular formula of Cystatin C, C22H40N8O5 [19].
Figure 8.
The Structure of Cystatin C Molecular formula of Cystatin C, C22H40N8O5 [19].

Table 1.
Creatine in Foods.
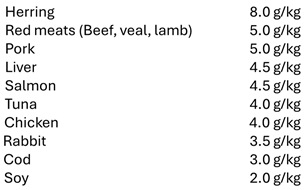 |
Table 2.
Formulas to determine renal function.
| Formula | |
|---|---|
| CrCl | = UCr (mg/dL) * (Urine vol. 24 h ml / (1440 min) / SCr (mg/dL) |
| Cockcroft-Gault | = [(140 - age) * weight in kg] / (72 * SCr * 0.85 (women) |
| MDRD 4 |
= (175 * SCr-1.154) * (age-0.203) * 1 (men) = (175 * SCr-1.154) * (age-0.203) * 0.742 (women) |
| MDRD 6 |
= (170 * SCr-0.999) * (age-0.176) * (BUN-0.17) * (albumin0.318) * 1 (men) = (170 * SCr-0.999) * (age-0.176) * (BUN-0.17) * (albumin0.318) * 0.762 (women) |
| CKD-EPI |
= 141 * (SCr/0.9)-1.209 * (0.993age) (men) = 144 * (SCr/0.9)-1.209 * (0.993age) (women) |
| CKD-EPI CysC |
= 133 * (sCysC/0.8)-1.328 * (0.996age) (men) = 133 * (sCysC/0.8)-1.328 * (0.996 age) * 0.932 (women) |
| CKD-EPI CrCysC |
= 135 * (SCr/0.9)-0.601 * (sCysC/0.8)-0.711 * (0.995age) (men) = 130 * (SCr/0.7)-0.601 * (sCysC/0.8)-0.711 * (0.995age) (women) |
MDRD= Modification of Diet in Renal Disease;CKD-EPI=Chronic Kidney Disease Epidemiology Collaboration; CKD-EPI CrCysC= Chronic Kidney Disease Epidemiology Collaboration equation using both serum creatinine and cystatin C; CrCl= Creatinine Clearance; UCr=Urinary Creatinine; SCr= Serum creatinine; CysC= Cystatin C; sCysC= Serum Cystatin C [63].
Table 3.
Summary of the function, processing, filtration, and factors affecting creatinine and cystatin C.
Table 3.
Summary of the function, processing, filtration, and factors affecting creatinine and cystatin C.
| Creatinine | Cystatin C | |
|---|---|---|
| Function | Heterocyclic nitrogenous compound of 113 Da. Produced from creatine in muscle. | Endogenous protein of 13 kDa. Synthesized by all nucleated cells. Cysteine protease inhibitor. |
| Renal processing | Excreted by the kidneys, mainly via glomerular filtration, with a small amount through tubular secretion. | Freely filtered by the glomeruli. Reabsorbed and catabolized by renal proximal tubular cells. |
| Basal production | Constant. | Constant. |
| Factors that decrease it | Aging, female sex, neuromuscular disease, malnutrition, hyperthyroidism. | Hypothyroidism. |
| Factors that increase it | Black ethnicity, higher muscle mass, rhabdomyolysis, high-protein diet, supplements, steroid treatment, various medications. | Chronic inflammation, obesity, hyperthyroidism, chronic smoking. |
Ref. [81].
Table 4.
Formulas used in creatinine kinetics.
| Formula | |
|---|---|
| Fat free mass | = 0.029 * Creatinine Production (mg/day) + 7.35 |
| Creatinine Production (mg/day) | = Excretion + Metabolic Degradation |
| Creatinine Excretion (mg/day) | = (Urine Volume) * (Urinary Creatinine) + (Dialysis Volume) *(Creatinine in Dialysis Liquid) |
| Metabolic Degradation (mg/day) | = 0.38 * Serum Creatinine (mg/dL) * Total Body Weight (kg) |
Ref. [83].
Table 5.
Formulas to calculate the Creatinine Index.
| Formula | |
|---|---|
| Edema-free lean body mass (kg) |
= (0.029 kg/mg/24 h) * creatinine index (mg/24h) + 7.38 kg |
| Creatinine Index (mg/24 h) |
= Dialysate (or ultrafiltrate) * creatinine (mg/24h) + urine creatinine (mg/24h) + change in body creatinine pool (mg/24h) + creatinine degradation (mg/24h) |
|
Change in body creatinine pool (mg/24 h) |
= Serum creatinine (mg/dL)f – [serum creatinine (mg/dL)i)] * [24/h/(time interval between the i and f measurements)] * [body weight (kg) * (0.50 L/kg)] |
| Creatinine degradation rate (mg/24 h) |
= 0.38 dL/kg/24 h * serum creatinine (mg/dL) * Body weight (kg) |
Disclaimer/Publisher’s Note: The statements, opinions and data contained in all publications are solely those of the individual author(s) and contributor(s) and not of MDPI and/or the editor(s). MDPI and/or the editor(s) disclaim responsibility for any injury to people or property resulting from any ideas, methods, instructions or products referred to in the content. |
© 2024 by the authors. Licensee MDPI, Basel, Switzerland. This article is an open access article distributed under the terms and conditions of the Creative Commons Attribution (CC BY) license (http://creativecommons.org/licenses/by/4.0/).
Copyright: This open access article is published under a Creative Commons CC BY 4.0 license, which permit the free download, distribution, and reuse, provided that the author and preprint are cited in any reuse.


