Submitted:
02 September 2025
Posted:
02 September 2025
You are already at the latest version
Abstract
Background/Objectives: Chronic kidney disease (CKD) is a progressive, often irreversible condition where accurate estimation of glomerular filtration rate (GFR) is essential for staging and guiding therapy. Serum creatinine is widely used but influenced by non-renal factors, while alternative markers such as cystatin C and beta-2 microglobulin (β2M) may improve accuracy. This study evaluated the diagnostic performance of creatinine, cystatin C, and β2M for GFR estimation using the 2021 CKD-EPI equations in patients with moderate to severe CKD. Methods: This exploratory study analyzed data from 45 patients with CKD stages 3–4. Serum creatinine, cystatin C, and β2M were measured, and GFR was estimated using the 2021 CKD-EPI creatinine (eGFRcr) and creatinine–cystatin C (eGFRcr-cys) equations. Receiver operating characteristic (ROC) curve analysis was performed at a predefined threshold of 30 mL/min/1.73 m² to evaluate diagnostic accuracy in distinguishing between moderate and severe CKD. Results: Serum creatinine demonstrated high diagnostic accuracy (AUC = 0.977 for eGFRcr; 0.957 for eGFRcr-cys). Cystatin C showed perfect specificity (100%) and excellent predictive accuracy (AUC = 0.908 for eGFRcr; 0.978 for eGFRcr-cys), significantly outperforming creatinine at the severe CKD threshold (p = 0.019). β2M demonstrated balanced diagnostic performance (AUC = 0.901 for eGFRcr; 0.974 for eGFRcr-cys), with sensitivity and specificity above 90% under the eGFRcr-cys equation. Conclusions: A multi-marker evaluation using creatinine, cystatin C, and β2M within the 2021 CKD-EPI equations enhances diagnostic precision for GFR estimation in CKD. These findings provide preliminary evidence and support the clinical utility of multi-marker approaches in refining CKD staging and guiding earlier therapeutic interventions.
Keywords:
Chronic kidney disease (CKD)
; moderate to severe CKD
; glomerular filtration rate (GFR)
; 2021 CKD-EPI Equations
; serum creatinine
; cystatin C
; beta-2 microglobulin (β2M)
; biomarkers
; diagnostic accuracy
; ROC curve
1. Introduction
Chronic kidney disease (CKD) is a major global health problem, affecting nearly 10% of the population and contributing to substantial morbidity, mortality, and healthcare costs. In Malaysia, the prevalence has reached 15.5%, reflecting the growing burden of non-communicable diseases such as diabetes and hypertension [1]. The progressive decline in kidney function in CKD is often accompanied by chronic inflammation, protein–energy malnutrition, and increased cardiovascular risk, making timely detection and accurate staging essential for patient management and therapeutic intervention [2].
The glomerular filtration rate (GFR) is widely recognized as the most reliable indicator of overall kidney function. Both the Kidney Disease: Improving Global Outcomes (KDIGO) and the National Kidney Foundation–Kidney Disease Outcomes Quality Initiative (KDOQI) guidelines classify chronic kidney disease (CKD) into five stages based on GFR values. CKD stages 3 to 5, which represent moderate to severe dysfunction, are defined by GFR thresholds of 30–59 mL/min/1.73 m² (stage 3), 15–29 mL/min/1.73 m² (stage 4), and <15 mL/min/1.73 m² (stage 5), irrespective of kidney damage [3]. Direct measurement of GFR using exogenous filtration markers such as inulin, iohexol, or iothalamate provides high accuracy but is limited by cost, complexity, and lack of practicality in routine care [4]. Consequently, clinical practice relies on endogenous serum biomarkers for GFR estimation.
Serum creatinine remains the most widely used marker, supported by its low cost, wide availability, and inclusion in validated equations such as the CKD-EPI formula. However, its diagnostic performance is affected by non-renal factors, including age, sex, muscle mass, and dietary intake, which can lead to under- or over-estimation of kidney function [5]. To address these limitations, the CKD-EPI group has refined their equations, most recently introducing the 2021 formulas that incorporate creatinine alone or in combination with cystatin C, and which importantly eliminate race-based adjustments to improve equity and accuracy [6].
Cystatin C, a low molecular weight protein produced by all nucleated cells, is eliminated almost exclusively through glomerular filtration. Its relatively constant production and reduced influence from extrarenal factors make it a promising alternative or complementary biomarker. Several studies have demonstrated the superior accuracy of cystatin C over creatinine in specific populations, and its incorporation into the 2012 and 2021 CKD-EPI equations has improved precision and reduced bias in GFR estimation [7,8].
Beta-2 microglobulin (β2M) is another low molecular weight protein filtered by the glomeruli and reabsorbed in the proximal tubules. Its serum concentration rises in parallel with declining kidney function, and panel-based equations that include β2M have shown improved diagnostic accuracy across diverse populations [9]. However, β2M may also be influenced by systemic inflammation and lymphoproliferative conditions, limiting its reliability as a standalone marker [10,11].
The aim of this study was to evaluate the diagnostic performance of serum creatinine, cystatin C, and β2M in estimating GFR among patients with CKD stages 3–4 using the 2021 CKD-EPI equations. Specifically, we assessed their correlation with eGFR and their diagnostic accuracy in distinguishing between moderate and severe CKD. By incorporating β2M alongside conventional markers, this study provides preliminary insights into the potential of a multi-marker strategy to refine CKD staging and support more precise therapeutic decision-making.
2. Materials and Methods
2.1. Patients’ Samples
This retrospective observational study involved the analysis of laboratory data from 45 patients (22 males and 23 females; aged 25–75 years) with chronic kidney disease (CKD) stages 3 to 4 who attended the Nephrology Clinic at the Institute of Urology and Nephrology, Kuala Lumpur Hospital. All data were obtained from routine clinical testing. The study was conducted in accordance with the Declaration of Helsinki and was approved by the Institutional Review Board of Ministry of Health’s Medical Research Ethics Committee (MREC) [NMRR ID-25-02170-XEB (IIR)].
2.2. Cystatin C, Beta-2 Microglobulin (β2M) and Creatinine Assays
Serum cystatin C and β2M levels were measured using a particle-enhanced nephelometric assay (PENIA) on a Siemens nephelometer system (Siemens Healthcare Diagnostics, Germany). Serum creatinine was measured using the modified Jaffe method on a Roche chemistry analyzer (Roche Diagnostics, Germany).
2.3. GFR Estimation
The estimated glomerular filtration rate (eGFR) was calculated using the 2021 CKD-EPI equations for creatinine and creatinine-cystatin C:
2.3.1.2021. CKD-EPI Creatinine Formula (eGFRcr)
The creatinine-based eGFR (eGFRcr) was calculated using the following formula:
eGFRcr (mL/min/1.73 m2) = 142 x (Scr / A)-B x 0.9938Age x (1.012 if female)
Where Scr is serum creatinine (mg/dL); A and B depend on sex and creatinine level:
| Sex | Creatinine Level | A | B |
| Female | ≤ 0.7 mg/dL | 0.7 | -0.241 |
| Female | > 0.7 mg/dL | 0.7 | -1.200 |
| Male | ≤ 0.9 mg/dL | 0.9 | -0.302 |
| Male | > 0.9 mg/dL | 0.9 | -1.200 |
2.3.2.2021. CKD-EPI Creatinine-Cystatin C Formula (eGFRcr-cys)
The creatinine-cystatin c-based eGFR (eGFRcr-cys) was calculated as:
eGFRcr-cys (mL/min/1.73 m2) = 135 x (Scr / A)-B x (Scys / C)-D x 0.9938Age x (1.012
if female)
Where Scr is serum creatinine (mg/dL) and Scys is serum cystatin C (mg/dL); A, B, C
and D depend on sex and levels of creatinine and cystatin c:
| Sex |
Creatinine Level |
Cystatin C Level |
A | B | C | D |
| Female | ≤ 0.7 mg/dL | ≤ 0.8 mg/dL | 0.7 | -0.219 | 0.8 | -0.323 |
| Female | ≤ 0.7 mg/dL | > 0.8 mg/dL | 0.7 | -0.219 | 0.8 | -0.778 |
| Female | > 0.7 mg/dL | ≤ 0.8 mg/dL | 0.7 | -0.544 | 0.8 | -0.323 |
| Female | > 0.7 mg/dL | > 0.8 mg/dL | 0.7 | -0.544 | 0.8 | -0.778 |
| Male | ≤ 0.9 mg/dL | ≤ 0.8 mg/dL | 0.9 | -0.144 | 0.8 | -0.323 |
| Male | ≤ 0.9 mg/dL | > 0.8 mg/dL | 0.9 | -0.144 | 0.8 | -0.778 |
| Male | > 0.9 mg/dL | ≤ 0.8 mg/dL | 0.9 | -0.544 | 0.8 | -0.323 |
| Male | > 0.9 mg/dL | > 0.8 mg/dL | 0.9 | -0.544 | 0.8 | -0.778 |
2.4. Statistical Methods
2.4.1. Correlation Analysis
The relationship between serum creatinine, cystatin C, and β2M with estimated GFR was evaluated using correlation analysis of their reciprocal values to linearize the curvilinear relationship with eGFRcr and eGFRcr-cys. Correlation analysis was also performed to assess the association between eGFRcr and eGFRcr-cys. Pearson correlation coefficients (r) and coefficient of determination (R2) were calculated, with statistical significance defined as P < 0.05. All analyses were performed using SPSS for Windows, version 29.0.1.0 (IBM Corp., Armonk, NY, USA).
2.4.2. Receiver Operating Curve (ROC) Analysis
The diagnostic accuracy of reciprocal serum cystatin C and serum creatinine was assessed using ROC curve analysis to discriminate between patients with moderate (CKD stage 3) and severe (CKD stage 4) kidney dysfunction. A predefined eGFR threshold of 30 mL/min/1.73 m² was applied to classify kidney function.
ROC curves were generated by plotting sensitivity against 1 – specificity. The area under the curve (AUC) and 95% confidence intervals (CI) were calculated using the binomial exact method. Sensitivity, specificity, positive predictive value (PPV), and negative predictive value (NPV) were determined, with the optimal cut-off value identified using the Youden Index. Comparisons between AUCs of different GFR markers were performed using the DeLong method. Statistical significance was defined as P < 0.05. All analyses were conducted using MedCalc for Windows, version 23.09 (MedCalc Software Ltd, Ostend, Belgium).
3. Results
3.1. Relationship between Serum Cystatin C, Creatinine, and β2M with GFR
To evaluate the relationship between each biomarker and estimated GFR, Pearson correlation coefficients were calculated. Estimated GFR based on serum creatinine (eGFRcr) demonstrated strong correlations with serum creatinine (r = 0.906; n=45), serum cystatin C (r = 0.775; n=45) and serum β2M (r = 0.836; n=45) (Table 1A).
Estimated GFR based on the combined serum creatinine-cystatin C equation (eGFRcr-cys) also exhibited strong correlations with serum creatinine (r = 0.806; n=45), serum cystatin C (r = 0.960; n=45) and serum β2M (r = 0.944; n=45) (Table 1B).
Additionally, eGFRcr showed a strong correlation (r = 0.914; n=45) with eGFRcr-cys, as shown in Figure 1.
3.2. Diagnostic Accuracy Comparison between Serum Creatinine, Cystatin C and β2M
The diagnostic performance of each biomarker was assessed using ROC curve analysis. At a cut-off of 30 mL/min per 1.73m2, ROC analysis demonstrated that area under curve (AUC) of serum creatinine [AUC = 0.977 (95% CI: 0.882-0.999)] was comparable to that of serum cystatin C (P = 0.1035) [AUC = 0.908 (95% CI: 0.784-0.974)] and serum β2M (P = 0.1003) [AUC = 0.901 (95% CI: 0.775-0.970)] using the 2021 CKD-EPI Creatinine Formula (eGFRcr) (Figure 2A).
Using the CKD EPI-Creatinine-Cystatin C Formula (eGFRcr-cys), the ROC curve plots showed that AUC for serum creatinine [AUC = 0.957 (95% CI: 0.850-0.995)] was comparable to that of serum cystatin C (P = 0.4295) [AUC = 0.978 (95% CI: 0.883-0.999)] and serum β2M (P = 0.5465) [AUC = 0.974 (95% CI: 0.877-0.999)] (Figure 2B).
At the predefined cut-off of 30 mL/min per 1.73 m², the sensitivity, specificity, positive predictive value (PPV), negative predictive value (NPV), and Youden Index for each GFR marker were determined.
Using the 2021 CKD-EPI Creatinine Formula (eGFRcr), serum creatinine showed a sensitivity of 93.1%, specificity of 93.75%, PPV of 94.8%, and NPV of 91.3%, with a Youden Index of 0.87. Serum cystatin C demonstrated a sensitivity of 68.97%, specificity of 100%, PPV of 100%, and NPV of 78.6%, with a Youden Index of 0.69. Serum β2M exhibited a sensitivity of 82.76%, specificity of 87.50%, PPV of 85.2%, and NPV of 85.1%, with a Youden Index of 0.70 (Table 2A).
When using the CKD EPI-Creatinine-Cystatin C Formula (eGFRcr-cys), serum creatinine achieved a sensitivity of 100%, specificity of 77.27%, PPV of 80.6%, and NPV of 100%, with a Youden Index of 0.77. Serum cystatin C showed a sensitivity of 86.96%, specificity of 100%, PPV of 100%, and NPV of 84.0%, with a Youden Index of 0.87. Serum β2M demonstrated a sensitivity of 91.30%, specificity of 95.45%, PPV of 95.2%, and NPV of 91.7%, with a Youden Index of 0.87 (Table 2B).
4. Discussion
Chronic kidney disease (CKD) remains a growing global health burden, with a prevalence of 15.5% in Malaysia and increasing rates worldwide [1,2]. Reliable estimation of glomerular filtration rate (GFR) is central to CKD evaluation, risk stratification, and guiding treatment strategies. While serum creatinine is the most widely used biomarker due to its availability and cost-effectiveness, its accuracy is often compromised by non-renal factors such as muscle mass, age, and diet [5]. This limitation is particularly relevant in populations with diverse body compositions, such as the Malaysian cohort studied here.
Our findings reinforce the diagnostic robustness of creatinine when interpreted with the 2021 CKD-EPI formula, showing high sensitivity and specificity in differentiating between CKD stages 3 and 4. Previous local work comparing the Modification of Diet in Renal Disease (MDRD) and Chronic Kidney Disease Epidemiology Collaboration (CKD-EPI) equations against isotopic GFR methods in Malaysian patients confirmed the superiority of CKD-EPI, further supporting its use in this context [12].
Cystatin C demonstrated superior specificity (100%) and higher predictive accuracy at the critical threshold of 30 mL/min/1.73 m². This underscores cystatin C’s clinical utility as a confirmatory marker for advanced kidney dysfunction, particularly in cases where creatinine-based estimates may be misleading. These results align with multicenter studies demonstrating cystatin C’s added value in risk prediction beyond creatinine and with evaluations showing its clinical utility and cost-effectiveness in primary care CKD management [13,14]. Together, these findings suggest that cystatin C could improve diagnostic precision and optimize resource allocation in CKD care.
Importantly, this study also highlights the diagnostic value of beta-2 microglobulin (β2M). While not yet widely used in routine nephrology practice, β2M demonstrated balanced sensitivity and specificity (>90% under the creatinine–cystatin C formula), suggesting its potential as a complementary biomarker. β2M’s independence from muscle mass makes it attractive for use in elderly or frail patients, though its interpretation must consider confounding influences such as systemic inflammation or lymphoproliferative disorders [11,15]. From a biological perspective, the role of inflammation and oxidative stress in CKD progression may partly explain the utility of β2M, as it reflects both glomerular filtration and tubular handling.
Few studies in Asia have evaluated the 2021 CKD-EPI equation. For example, Pakistani and Korean cohorts have assessed its performance in creatinine-based GFR estimation and its impact on CKD prevalence and risk prediction [16,17]. In China, the ES-CKD study validated a β2M-based GFR equation and compared it with cystatin C–inclusive equations, demonstrating improved accuracy with multi-marker approaches [18]. A large multi-country analysis further showed variable effects of the 2021 CKD-EPI equation across Asian populations [19]. Our study extends this body of work by evaluating a three-marker panel (creatinine, cystatin C, and β2M) within the 2021 CKD-EPI equations in a Malaysian CKD cohort, providing novel regional data.
The integration of multiple biomarkers, particularly creatinine, cystatin C, and β2M, reflects a broader movement toward multi-marker strategies in CKD biology and diagnosis. Such approaches may improve staging accuracy, inform risk prediction for cardiovascular complications, and guide earlier therapeutic interventions. This is particularly relevant given the close interplay between CKD, chronic inflammation, and cardiovascular disease, which remains the leading cause of mortality among patients with end-stage kidney disease [3].
A key limitation of this study is the relatively small cohort (n=45), which restricts generalizability. Nevertheless, this represents one of the first Malaysian datasets evaluating the 2021 CKD-EPI equations in combination with cystatin C and β2M, offering preliminary insights into their clinical performance in a real-world population. Larger, multicenter studies are needed to validate these findings and to assess additional emerging markers such as β-trace protein, which, when combined with β2M, may yield even greater diagnostic accuracy across diverse ethnic groups without reliance on race-based adjustments [11]. Cost-effectiveness studies will also be essential to support broader adoption of cystatin C and β2M in routine practice, particularly in resource-constrained healthcare systems [14].
Our findings highlight that while serum creatinine remains a reliable primary marker for GFR estimation, cystatin C provides superior specificity in identifying severe CKD, and β2M offers balanced diagnostic performance as a complementary marker. From a biological perspective, cystatin C and β2M not only reflect renal filtration but are also associated with systemic processes such as inflammation and cardiovascular risk, underscoring their relevance beyond kidney function alone. Diagnostic integration of these markers, particularly within the 2021 CKD-EPI equations, improves accuracy at critical thresholds and may reduce reliance on creatinine alone, which is influenced by extrarenal factors.
Clinically, adopting a multi-marker strategy could facilitate earlier identification of patients at higher risk of CKD progression and related complications, enabling timely interventions such as tighter blood pressure and metabolic control, avoidance of nephrotoxic drugs, and earlier referral for nephrology care. These therapeutic implications are especially relevant in Malaysia and other regions with rising CKD prevalence, where cost-effectiveness and accessibility remain critical considerations.
5. Conclusions
This study shows that while serum creatinine remains reliable for GFR estimation, cystatin C offers superior specificity and β2-microglobulin provides balanced diagnostic performance. A multi-marker evaluation within the 2021 CKD-EPI equations enhances diagnostic precision and may reduce reliance on creatinine alone, which is influenced by extrarenal factors. These findings support the clinical utility of multi-marker strategies to improve staging accuracy, enable earlier identification, and support better CKD management.
Author Contributions
Conceptualization, N.A.B. and N.H.H; Data curation, N.A.B. and N.I.H., Formal analysis, N.A.B., N.I.H., S.N.A.R., Z.A.H., A.H. and N.H.H.; Funding acquisition, A.H. and N.H.H; Methodology, N.A.B., N.I.H and N.H.H..; Project administration, N.A.B. and N.H.H.; Resources, N.A.B., N.I.H. and S.N.A.R.; Software, N.A.B. and N.I.H.; Supervision, N.A.B. and N.H.H.; Visualization, N.A.B. and N.H.H; writing—original draft preparation, N.A.B.; writing—review and editing, N.A.B., N.I.H., S.N.A.R., Z.A.H., A.H. and N.H.H. All authors have read and agreed to the published version of the manuscript.
Funding
This research was registered under the National Medical Research Register (NMRR) (RSCH ID-25-03258-ROB) and received no external funding. The article processing charge (APC) was funded by the NATIONAL INSTITUTES OF HEALTH (NIH) MALAYSIA, Ministry of Health Malaysia.
Institutional Review Board Statement
The study was conducted in accordance with the Declaration of Helsinki and approved by the Institutional Review Board of MINISTRY OF HEALTH’S MEDICAL RESEARCH ETHICS COMMITTEE (MREC) [Protocol code: NMRR ID-25-02170-XEB (IIR); Date of approval: 21 August 2025].
Informed Consent Statement
In accordance with the Malaysian Guidelines for Good Clinical Practice and international ethical standards, informed consent was waived because this retrospective study used de-identified data and posed no foreseeable risk of harm to participants.
Data Availability Statement
The data sets generated during and/or analyzed during the current study are available from the corresponding author upon reasonable request.
Acknowledgments
The authors thank the Director General of Health Malaysia and the Director of the Institute of Medical Research (IMR), Malaysia, for permitting us to publish this article. During the preparation of this manuscript, the authors used ChatGPT (OpenAI, GPT-4, https://chat.openai.com/, accessed on 31 August 2025) to assist with language editing. After using this tool, the authors have reviewed and edited the content as needed and took full responsibility for the final version.
Conflicts of Interest
The authors declare no conflicts of interest.
Abbreviations
The following abbreviations are used in this manuscript:
| AUC | Area under the curve |
| CI | confidence intervals |
| CKD | Chronic kidney disease |
| CKD-EPI | Chronic Kidney Disease Epidemiology Collaboration |
| eGFR | Estimated glomerular filtration rate |
| eGFRcr | The 2021 CKD-EPI creatinine equation |
| eGFRcr-cys | The 2021 CKD-EPI creatinine–cystatin C equation |
| GFR | Glomerular filtration rate |
| KDIGO | The Kidney Disease: Improving Global Outcomes |
| KDOQI | The National Kidney Foundation–Kidney Disease Outcomes Quality Initiative |
| MDRD | Modification of Diet in Renal Disease |
| NPV | negative predictive value |
| P | P-value |
| PENIA | particle-enhanced nephelometric assay |
| PPV | positive predictive value |
| r | Pearson correlation coefficients |
| R2 | Coefficient of determination |
| ROC | Receiver operating characteristic |
| β2M | Beta-2 microglobulin |
References
- Saminathan, T.A.; Hooi, L.S.; Mohd Yusoff, M.F.; Ong, L.M.; Bavanandan, S.; Rodzlan Hasani, W.S.; Tan, E.Z.Z.; Wong, I.; Rifin, H.M.; Robert, T.G.; et al. Prevalence of Chronic Kidney Disease and Its Associated Factors in Malaysia; Findings from a Nationwide Population-Based Cross-Sectional Study. BMC Nephrol 2020, 21, 344. [Google Scholar] [CrossRef] [PubMed]
- Levin, A.; Tonelli, M.; Bonventre, J.; Coresh, J.; Donner, J.-A.; Fogo, A.B.; Fox, C.S.; Gansevoort, R.T.; Heerspink, H.J.L.; Jardine, M.; et al. Global Kidney Health 2017 and beyond: A Roadmap for Closing Gaps in Care, Research, and Policy. Lancet 2017, 390, 1888–1917. [Google Scholar] [CrossRef] [PubMed]
- Stevens, P.E.; Ahmed, S.B.; Carrero, J.J.; Foster, B.; Francis, A.; Hall, R.K.; Herrington, W.G.; Hill, G.; Inker, L.A.; Kazancıoğlu, R.; et al. KDIGO 2024 Clinical Practice Guideline for the Evaluation and Management of Chronic Kidney Disease. Kidney Int 2024, 105, S117–S314. [Google Scholar] [CrossRef] [PubMed]
- Porrini, E.; Ruggenenti, P.; Luis-Lima, S.; Carrara, F.; Jiménez, A.; de Vries, A.P.J.; Torres, A.; Gaspari, F.; Remuzzi, G. Estimated GFR: Time for a Critical Appraisal. Nat Rev Nephrol 2019, 15, 177–190. [Google Scholar] [CrossRef] [PubMed]
- Seegmiller, J.C.; Eckfeldt, J.H.; Lieske, J.C. Challenges in Measuring Glomerular Filtration Rate: A Clinical Laboratory Perspective. Adv Chronic Kidney Dis 2018, 25, 84–92. [Google Scholar] [CrossRef] [PubMed]
- Inker, L.A.; Eneanya, N.D.; Coresh, J.; Tighiouart, H.; Wang, D.; Sang, Y.; Crews, D.C.; Doria, A.; Estrella, M.M.; Froissart, M.; et al. New Creatinine- and Cystatin C–Based Equations to Estimate GFR without Race. N Engl J Med 2021, 385, 1737–1749. [Google Scholar] [CrossRef] [PubMed]
- Hoek, F.J. A Comparison between Cystatin C, Plasma Creatinine and the Cockcroft and Gault Formula for the Estimation of Glomerular Filtration Rate. Nephrol Dial Transplant 2003, 18, 2024–2031. [Google Scholar] [CrossRef] [PubMed]
- Inker, L.A.; Schmid, C.H.; Tighiouart, H.; Eckfeldt, J.H.; Feldman, H.I.; Greene, T.; Kusek, J.W.; Manzi, J.; Van Lente, F.; Zhang, Y.L.; et al. Estimating Glomerular Filtration Rate from Serum Creatinine and Cystatin C. N Engl J Med 2012, 367, 20–29. [Google Scholar] [CrossRef] [PubMed]
- Inker, L.A.; Couture, S.J.; Tighiouart, H.; Abraham, A.G.; Beck, G.J.; Feldman, H.I.; Greene, T.; Gudnason, V.; Karger, A.B.; Eckfeldt, J.H.; et al. A New Panel-Estimated GFR, Including Β2-Microglobulin and β-Trace Protein and Not Including Race, Developed in a Diverse Population. Am J Kidney Dis 2021, 77, 673–683.e1. [Google Scholar] [CrossRef] [PubMed]
- Barton, K.T.; Kakajiwala, A.; Dietzen, D.J.; Goss, C.W.; Gu, H.; Dharnidharka, V.R. Using the Newer Kidney Disease: Improving Global Outcomes Criteria, Beta-2-Microglobulin Levels Associate with Severity of Acute Kidney Injury. Clin Kidney J 2018, 11, 797–802. [Google Scholar] [CrossRef] [PubMed]
- Inker, L.A.; Tighiouart, H.; Coresh, J.; Foster, M.C.; Anderson, A.H.; Beck, G.J.; Contreras, G.; Greene, T.; Karger, A.B.; Kusek, J.W.; et al. GFR Estimation Using β-Trace Protein and Β2-Microglobulin in CKD. Am J Kidney Dis 2016, 67, 40–48. [Google Scholar] [CrossRef] [PubMed]
- Jalalonmuhali, M.; Lim, S.K.; Md Shah, M.N.; Ng, K.P. MDRD vs. CKD-EPI in Comparison to 51Chromium EDTA: A Cross Sectional Study of Malaysian CKD Cohort. BMC Nephrol 2017, 18, 363. [Google Scholar] [CrossRef] [PubMed]
- Shlipak, M.G.; Matsushita, K.; Ärnlöv, J.; Inker, L.A.; Katz, R.; Polkinghorne, K.R.; Rothenbacher, D.; Sarnak, M.J.; Astor, B.C.; Coresh, J.; et al. Cystatin C versus Creatinine in Determining Risk Based on Kidney Function. N Engl J Med 2013, 369, 932–943. [Google Scholar] [CrossRef] [PubMed]
- Shardlow, A.; McIntyre, N.J.; Fraser, S.D.S.; Roderick, P.; Raftery, J.; Fluck, R.J.; McIntyre, C.W.; Taal, M.W. The Clinical Utility and Cost Impact of Cystatin C Measurement in the Diagnosis and Management of Chronic Kidney Disease: A Primary Care Cohort Study. PLoS Med 2017, 14, e1002400. [Google Scholar] [CrossRef] [PubMed]
- Barton, K.T.; Kakajiwala, A.; Dietzen, D.J.; Goss, C.W.; Gu, H.; Dharnidharka, V.R. Using the Newer Kidney Disease: Improving Global Outcomes Criteria, Beta-2-Microglobulin Levels Associate with Severity of Acute Kidney Injury. Clin Kidney J 2018, 11, 797–802. [Google Scholar] [CrossRef] [PubMed]
- Safdar, A.; Akram, W.; Khan, M.A.; Tahir, D.; Butt, M.H. Comparison of EKFC, Pakistani CKD-EPI and 2021 Race-Free CKD-EPI Creatinine Equations in South Asian CKD Population: A Study from Pakistani CKD Community Cohort. PLoS One 2024, 19, e0300428. [Google Scholar] [CrossRef]
- Kim, J.H.; Kang, M.; Kang, E.; Ryu, H.; Jeong, Y.; Kim, J.; Park, S.K.; Jeong, J.C.; Yoo, T.-H.; Kim, Y.; et al. Comparison of Cardiovascular Event Predictability between the 2009 and 2021 Chronic Kidney Disease Epidemiology Collaboration Equations in a Korean Chronic Kidney Disease Cohort: The KoreaN Cohort Study for Outcome in Patients With Chronic Kidney Disease. Kidney Res Clin Pract 2023, 42, 700–711. [Google Scholar] [CrossRef] [PubMed]
- Yue, L.; Pan, B.; Shi, X.; Du, X. Comparison between the Beta-2 Microglobulin-Based Equation and the CKD-EPI Equation for Estimating GFR in CKD Patients in China: ES-CKD Study. Kidney Dis 2020, 6, 204–214. [Google Scholar] [CrossRef] [PubMed]
- Betzler, B.K.; Sultana, R.; He, F.; Tham, Y.C.; Lim, C.C.; Wang, Y.X.; Nangia, V.; Tai, E.S.; Rim, T.H.; Bikbov, M.M.; et al. Impact of Chronic Kidney Disease Epidemiology Collaboration (CKD-EPI) GFR Estimating Equations on CKD Prevalence and Classification Among Asians. Front Med (Lausanne) 2022, 9. [Google Scholar] [CrossRef]
Figure 1.
Correlation plot between eGFRcr (y-axis) and eGFRcr-cys (x-axis) in 45 patients with moderate (CKD stage 3) and severe (CKD stage 4) kidney dysfunction.
Figure 1.
Correlation plot between eGFRcr (y-axis) and eGFRcr-cys (x-axis) in 45 patients with moderate (CKD stage 3) and severe (CKD stage 4) kidney dysfunction.
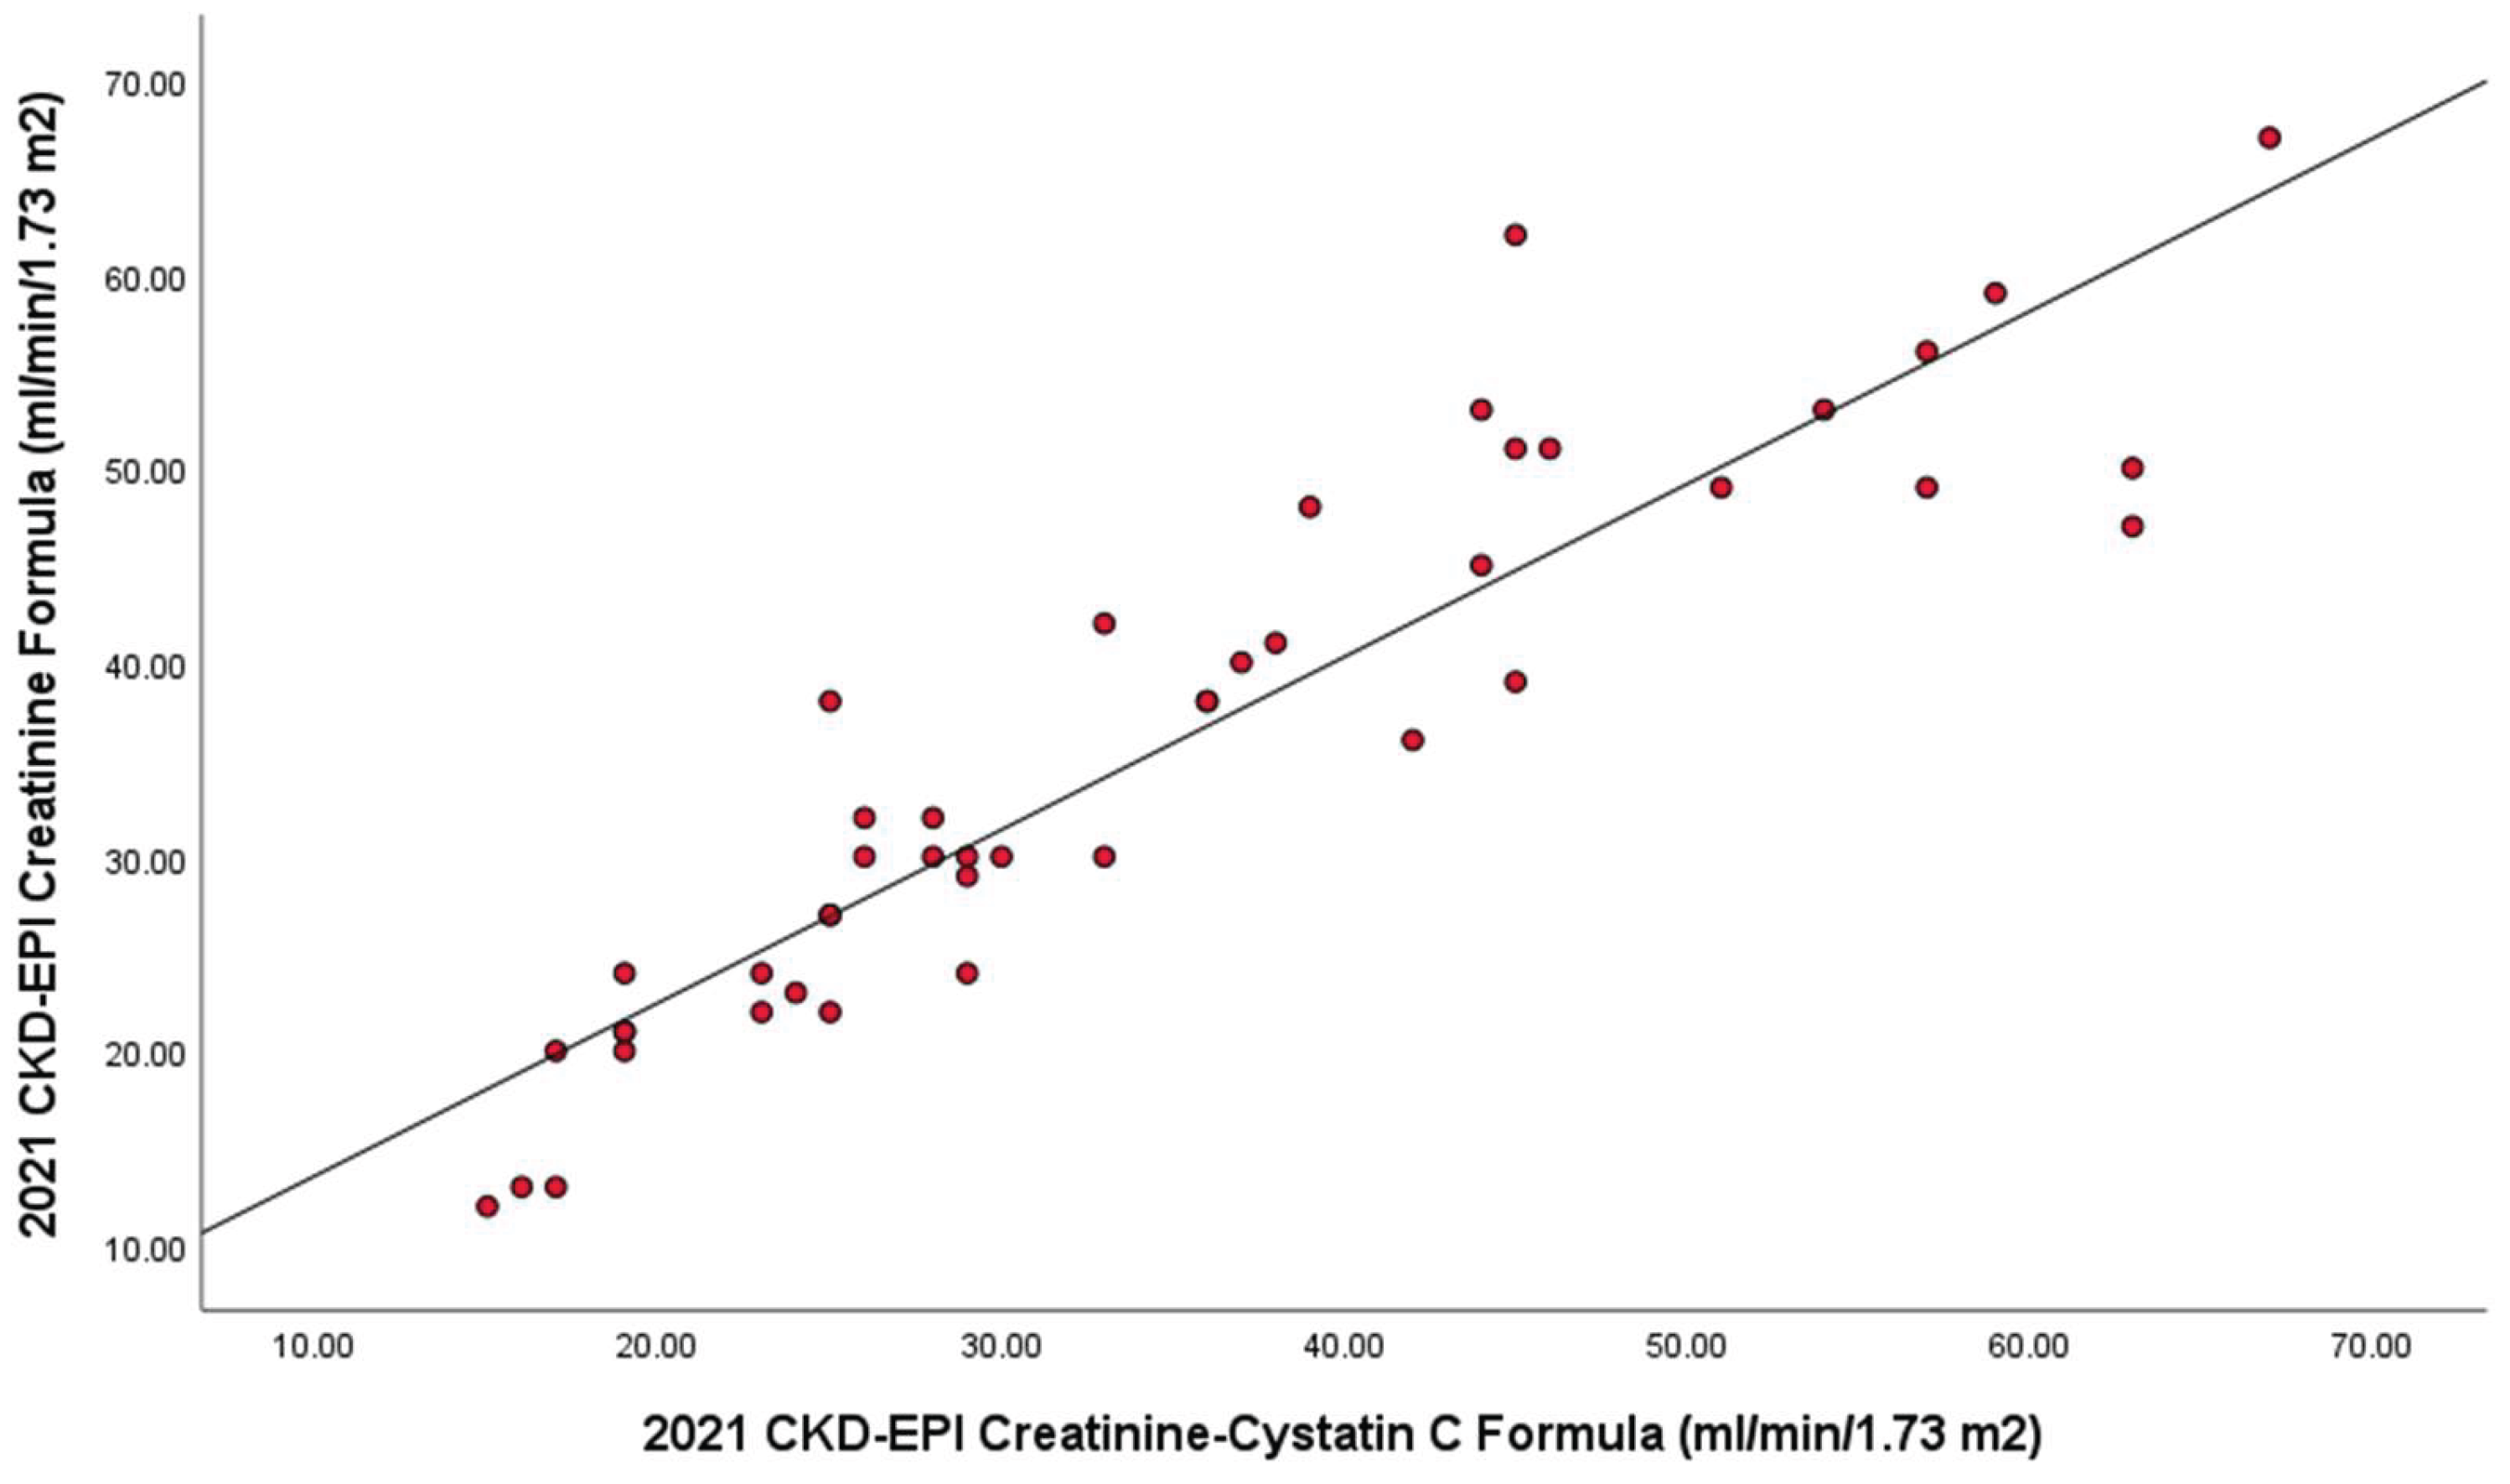
Figure 2.
A. Comparison of ROC curve plots for diagnostic accuracy of serum creatinine, serum cystatin C and serum β2M in discriminating between patients with moderate to severe GFR (≥30 mL/min per 1.73 m2) using the 2021 CKD-EPI Creatinine Formula (eGFRcr).
Figure 2.
A. Comparison of ROC curve plots for diagnostic accuracy of serum creatinine, serum cystatin C and serum β2M in discriminating between patients with moderate to severe GFR (≥30 mL/min per 1.73 m2) using the 2021 CKD-EPI Creatinine Formula (eGFRcr).
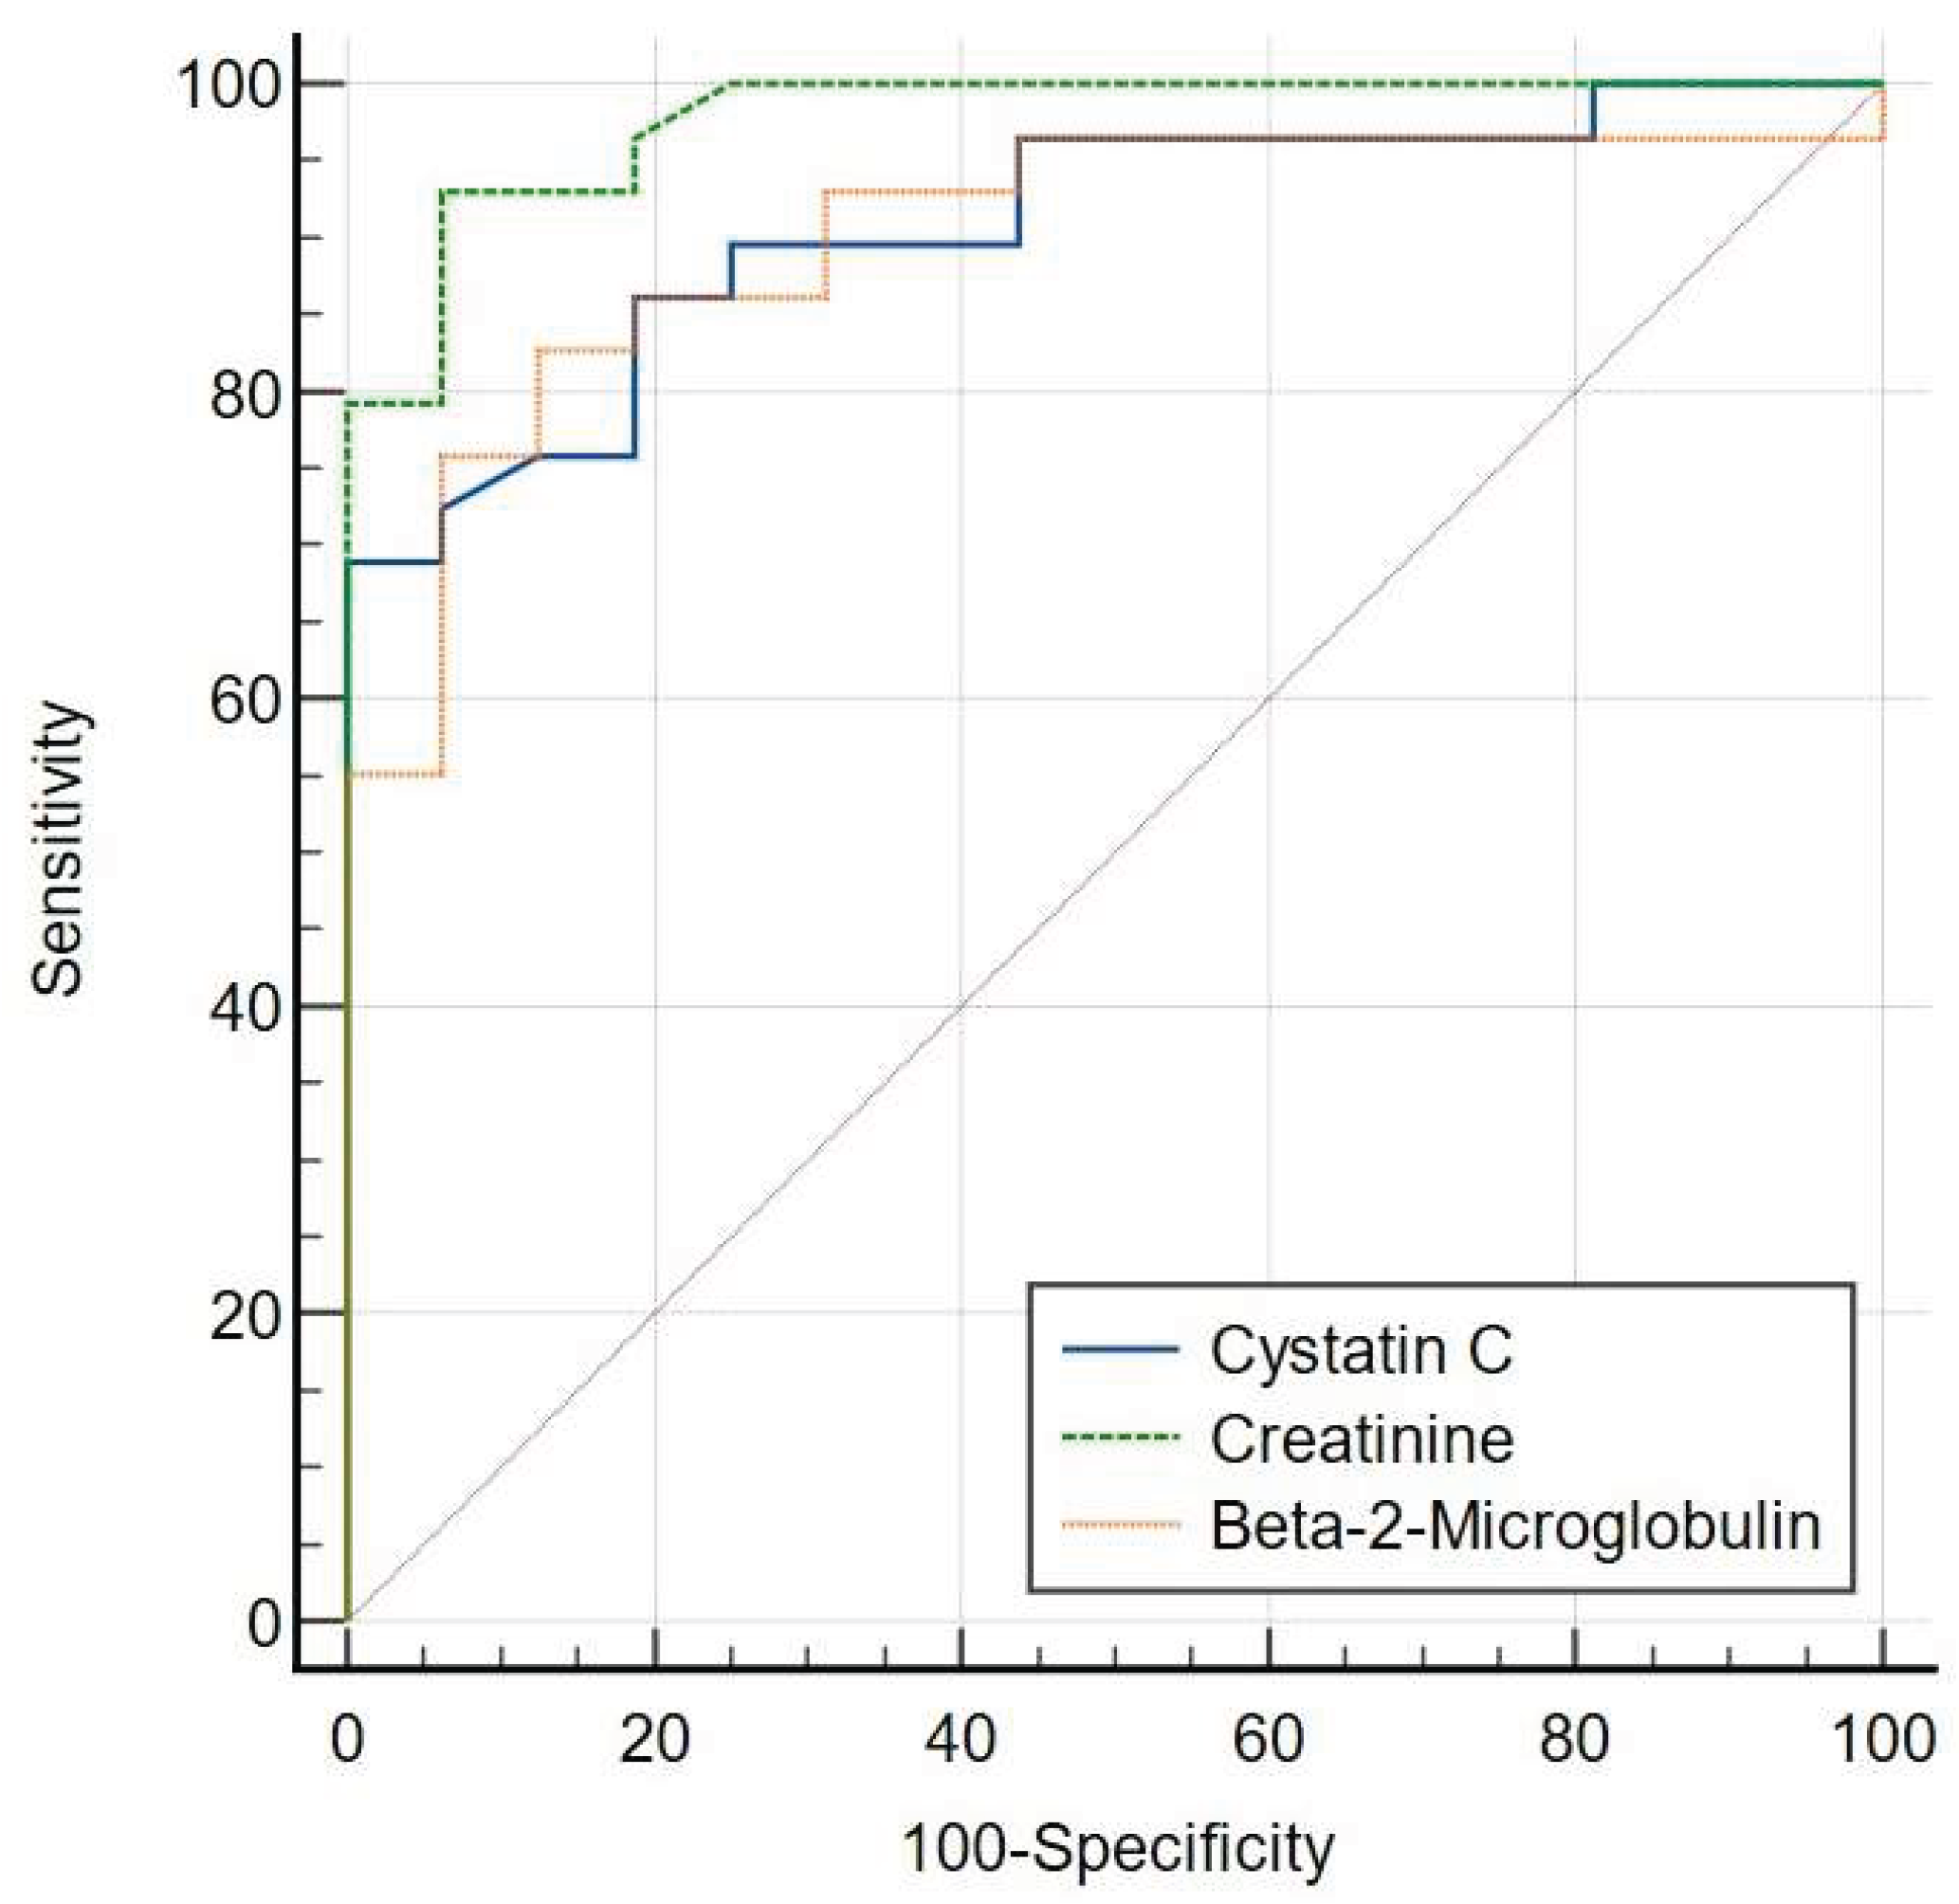
Figure 2.
B. Comparison of ROC curve plots for diagnostic accuracy of serum creatinine, serum cystatin C and serum β2M in discriminating between patients with moderate to severe GFR (≥30 mL/min per 1.73 m2) using the 2021 CKD-EPI Creatinine-Cystatin C Formula (eGFRcr-cys).
Figure 2.
B. Comparison of ROC curve plots for diagnostic accuracy of serum creatinine, serum cystatin C and serum β2M in discriminating between patients with moderate to severe GFR (≥30 mL/min per 1.73 m2) using the 2021 CKD-EPI Creatinine-Cystatin C Formula (eGFRcr-cys).
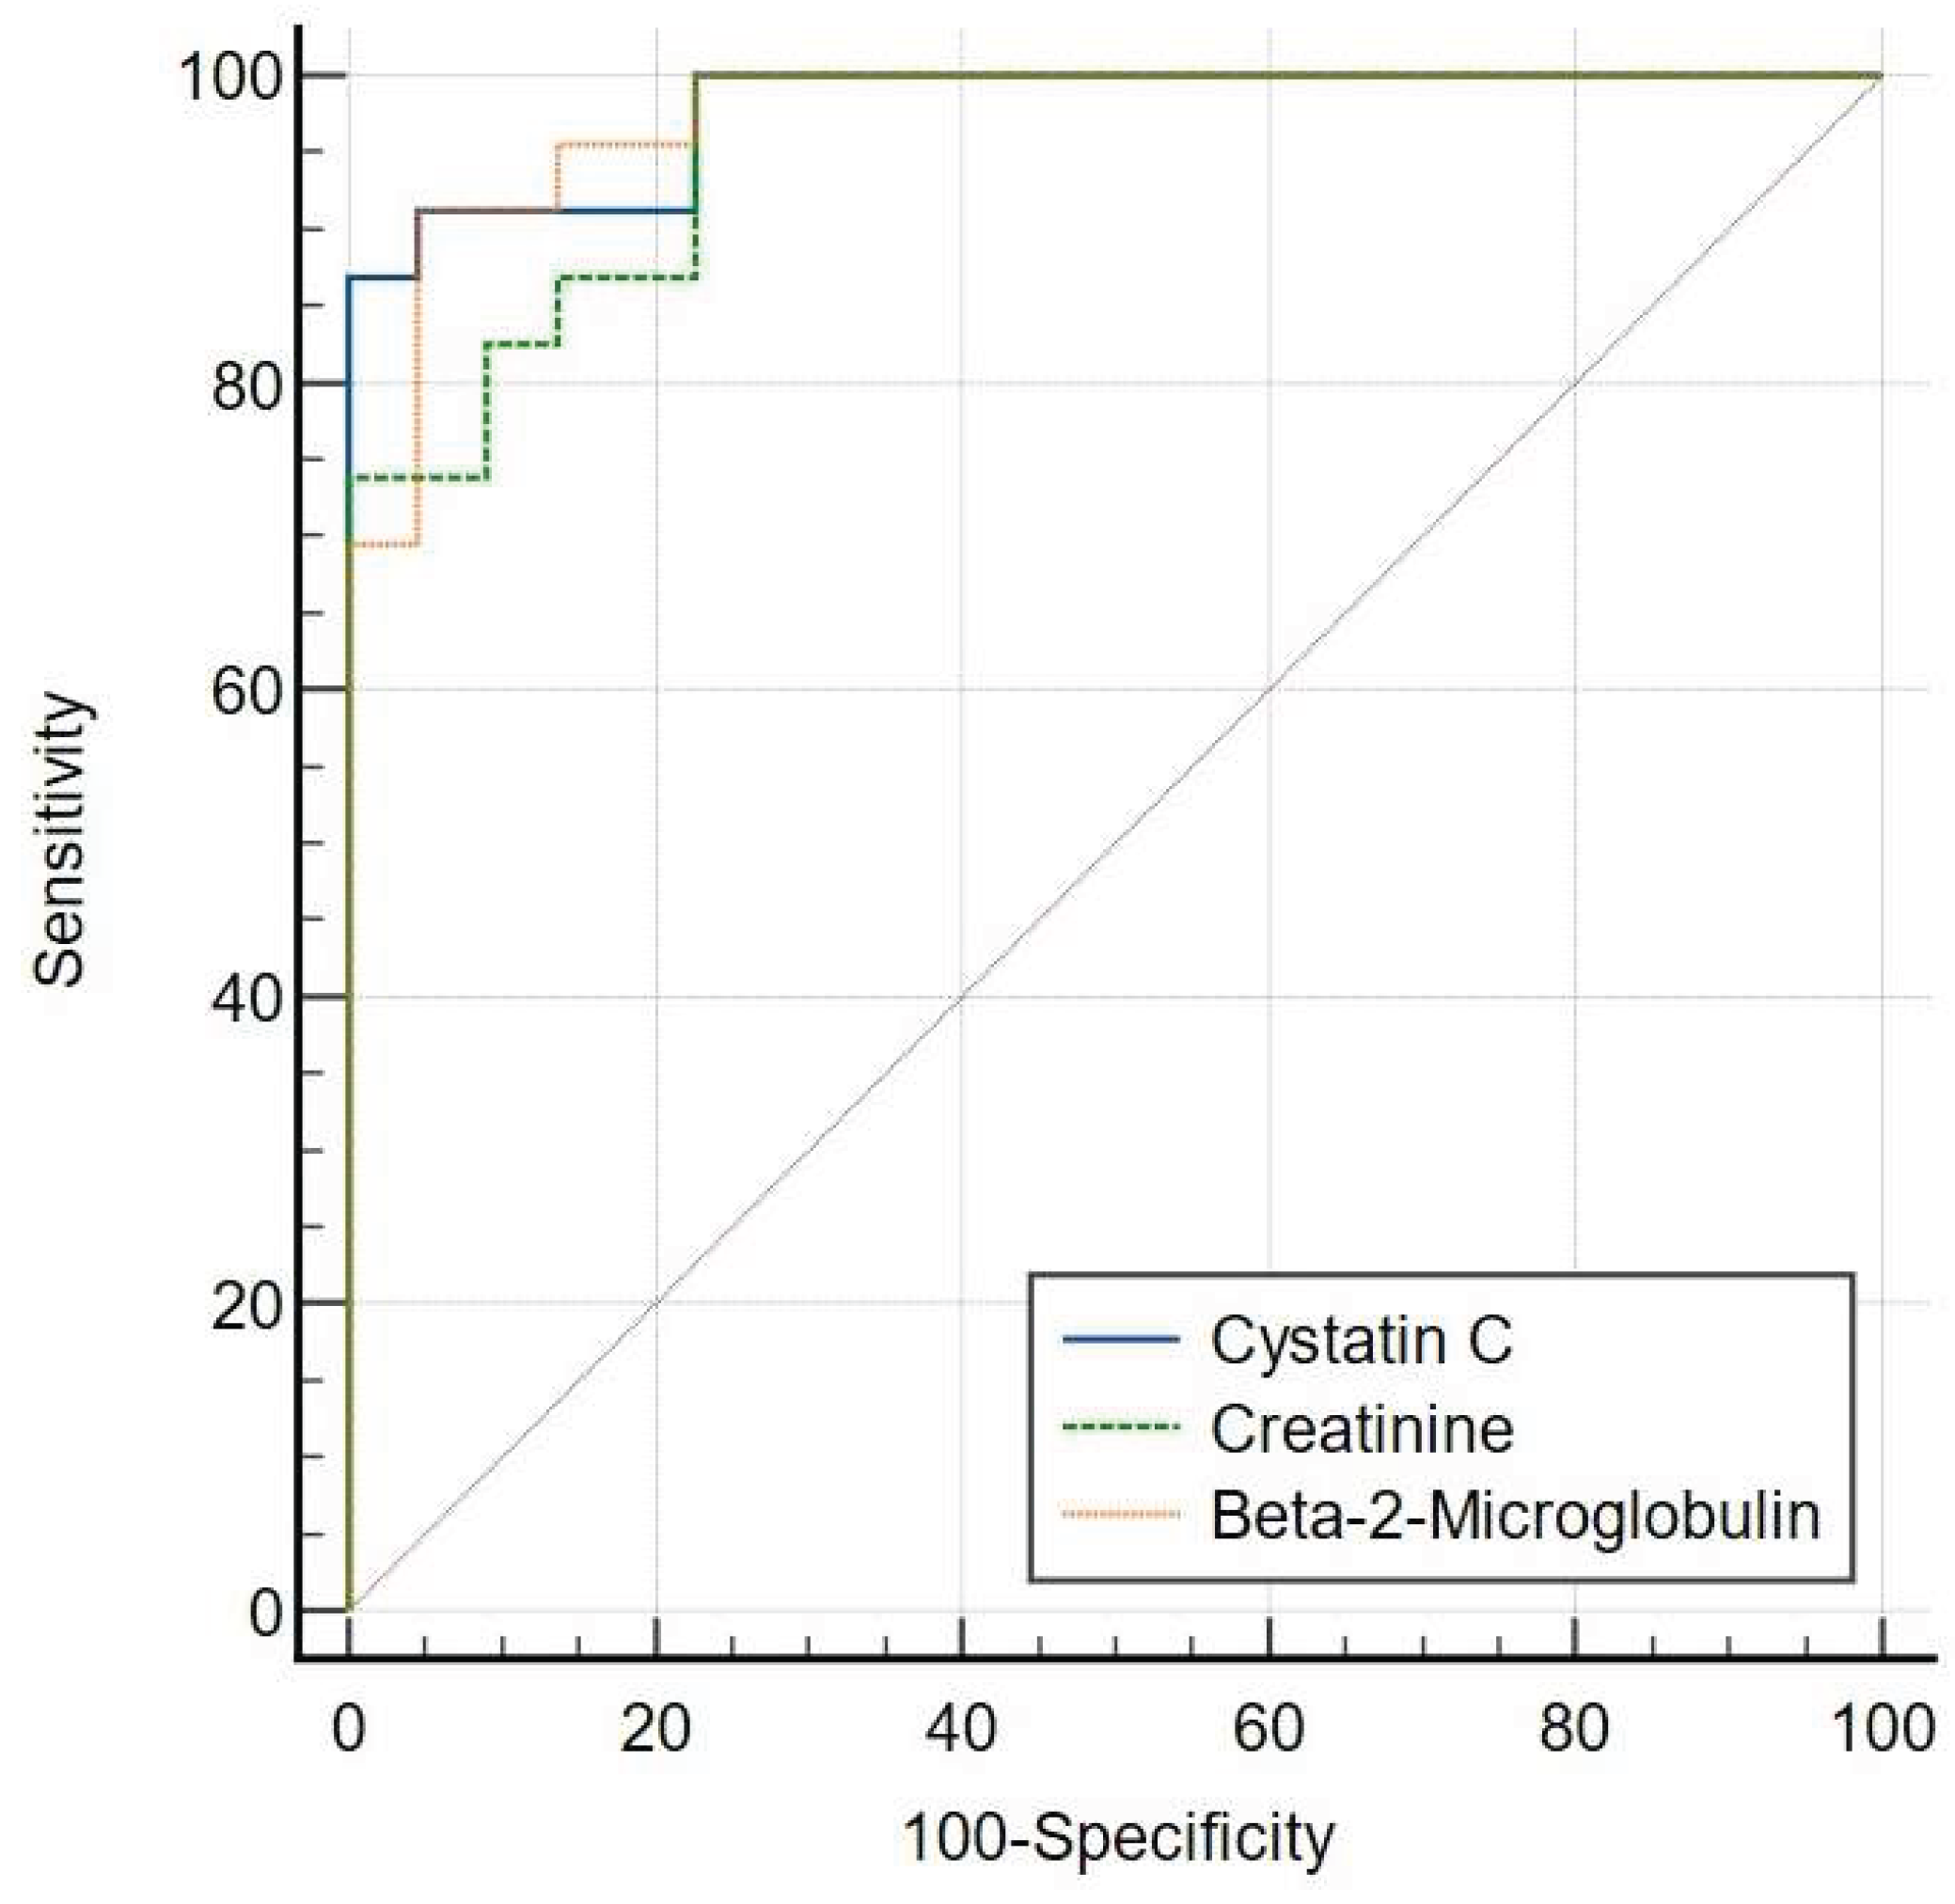

Table 1.
A. Linear regression analysis between serum creatinine, cystatin C and β2M with GFR estimated from serum creatinine values (eGFRcr) using the 2021 CKD-EPI Creatinine Formula.
Table 1.
A. Linear regression analysis between serum creatinine, cystatin C and β2M with GFR estimated from serum creatinine values (eGFRcr) using the 2021 CKD-EPI Creatinine Formula.
| GFR marker | r | R2 | Linear Equation |
|---|---|---|---|
| Serum creatinine | 0.906 | 0.821 | y = (1.48 x 10⁻³) + (1.21 x 10⁻⁴)x |
| Serum cystatin C | 0.775 | 0.601 | y = (0.2 x 10⁻³) + (9.5 x 10⁻³)x |
| Serum β2M | 0.836 | 0.699 | y = 0.02 + (6.38 x 10⁻³)x |
Table 1.
B. Linear regression analysis between serum creatinine, cystatin C and β2M with GFR estimated from serum creatinine-cystatin C values (eGFRcr-cys) using the 2021 CKD-EPI Creatinine-Cystatin C Formula.
Table 1.
B. Linear regression analysis between serum creatinine, cystatin C and β2M with GFR estimated from serum creatinine-cystatin C values (eGFRcr-cys) using the 2021 CKD-EPI Creatinine-Cystatin C Formula.
| GFR marker | r | R2 | Linear Equation |
|---|---|---|---|
| Serum creatinine | 0.806 | 0.651 | y = (2.15 x 10⁻³) + (1.05 x 10⁻⁴)x |
| Serum cystatin C | 0.960 | 0.922 | y = 0.13 + (0.01)x |
| Serum β2M | 0.944 | 0.892 | y = (7.8 x 10⁻³) + 7.01 x (10-3)x |
Table 2.
A. Sensitivity, specificity, PPV, NPV, and Youden Index values from ROC curve analysis for serum creatinine, serum cystatin C and serum β2M in discriminating between patients with moderate to severe GFR (≥30 mL/min per 1.73 m2) using the 2021 CKD-EPI Creatinine Formula (eGFRcr).
Table 2.
A. Sensitivity, specificity, PPV, NPV, and Youden Index values from ROC curve analysis for serum creatinine, serum cystatin C and serum β2M in discriminating between patients with moderate to severe GFR (≥30 mL/min per 1.73 m2) using the 2021 CKD-EPI Creatinine Formula (eGFRcr).
| GFR marker | Sensitivity (%) |
Specificity (%) |
PPV (%) |
NPV (%) |
Youden Index |
|---|---|---|---|---|---|
| Serum creatinine | 93.10 | 93.75 | 94.80 | 91.30 | 0.87 |
| Serum cystatin C | 68.97 | 100.00 | 100.00 | 78.60 | 0.69 |
| Serum β2M | 82.76 | 87.50 | 85.20 | 85.10 | 0.70 |
Table 2.
B. Sensitivity, specificity, PPV, NPV, and Youden Index values from ROC curve analysis for serum creatinine, serum cystatin C and serum β2M in discriminating between patients with moderate to severe GFR (≥30 mL/min per 1.73 m2) using the 2021 CKD-EPI Creatinine-Cystatin C Formula (eGFRcr-cys).
| GFR marker | Sensitivity (%) |
Specificity (%) |
PPV (%) |
NPV (%) |
Youden Index |
|---|---|---|---|---|---|
| Serum creatinine | 100.00 | 77.27 | 80.60 | 100.00 | 0.77 |
| Serum cystatin C | 86.96 | 100.00 | 100.00 | 84.00 | 0.87 |
| Serum β2M | 91.30 | 95.45 | 95.20 | 91.70 | 0.87 |
Disclaimer/Publisher’s Note: The statements, opinions and data contained in all publications are solely those of the individual author(s) and contributor(s) and not of MDPI and/or the editor(s). MDPI and/or the editor(s) disclaim responsibility for any injury to people or property resulting from any ideas, methods, instructions or products referred to in the content. |
© 2025 by the authors. Licensee MDPI, Basel, Switzerland. This article is an open access article distributed under the terms and conditions of the Creative Commons Attribution (CC BY) license (http://creativecommons.org/licenses/by/4.0/).
Copyright: This open access article is published under a Creative Commons CC BY 4.0 license, which permit the free download, distribution, and reuse, provided that the author and preprint are cited in any reuse.


