
Submitted:
05 December 2024
Posted:
05 December 2024
You are already at the latest version
Abstract
The transport of freshly post-harvested fruit to the collection points is mainly done in trailers over uneven terrain, which generates impacts and vibrations that negatively affect the quality of the fruit. Although some solutions to mitigate these effects have been proposed in previous studies, none of them are applied directly to the source of the problem, i.e., the transport boxes. In this context, quasi-zero-stiffness (QZS) isolators combined with additive manufacturing techniques open the possibility of exploring vibration mitigation-oriented metamaterials thanks to their associated non-linear characteristics. In this work, ABS sheets with different internal geometries were manufactured and compared as possible bottoms of transport boxes. The design variables analyzed for these geometries included the number of ribs, their thickness and their angle of inclination. In these specimens, their behavior to impact-type forces and their experimental dynamic behavior were studied using an electromagnetic shaker against a sinusoidal signal and against the uniaxial vibration recorded at the base of a trailer in a real rural route. The results showed that the specimens with a rib angle of 30º and a thickness of 0.4 mm showed the best impact performance and a higher amplification of vibration transmissibility in steady state. In the presence of the signal recorded on the route, transmissibility reduction percentages between 13% and 19% were obtained in the principal acceleration impact.
Keywords:
QZS
; fruit storage
; transport
; vibration
; acceleration impact
1. Introduction
Post-harvest fruit in the field, it is transported to industry in different types of vehicles, generally using boxes. Transportation on different routes in the field generates vibrations and impacts that are transmitted through the chassis of the vehicle to the fruit [1,2], causing a negative impact on the quality of the fruits as well as fruit bruising. Consequently, there is a decrease in firmness [3], changes in coloration [4] and deterioration of the cell wall integrity [5], which directly affects the profitability of the harvest [6]. Although it is difficult to accurately estimate losses, some studies suggest that between 10% and 30% of fruit quality is lost during transport [7].
Most of the existing research focuses on the effects of transporting fruit by road, but no studies have been found that analyze the effects of prior transport from the point of harvest to the point of collection or truck loading in the field. These routes, although short, run over particularly uneven and heterogeneous terrain that is affected by adverse conditions such as rocks, potholes and gullies, and are mainly carried out by tractors with trailers or other similar vehicles, so the effect of vibrations is greater and more difficult to characterize than road transport due to the greater degree of uncertainty of the forcing agents. Some authors propose effective solutions in machinery such as pneumatic solution systems [8] or anti-vibration platforms on trailers [9]. However, adaptations applied to machines that are used not only for fruit picking but also for other purposes are not easy to implement in practice. Therefore, this work focuses on the possible use of anti-vibration sheets placed on the bottom of fruit boxes as a low-cost option and as an alternative to adaptations in the machinery.
In the literature, there are different authors that study the effect of packaging on fruit transport. Different materials have been analyzed, such as polystyrene in boxes [10] or corrugated cardboard containers [11]. Traditional baskets have also been compared to plastic boxes [12] or studies with full fruit pallets [13]. In addition, some authors have investigated the use of edible coatings to extend the shelf life of fruits [14]. Most of the research focuses on the comparison of commercial packing materials, without exploring improvements in the materials used for the boxes in which the fruit are placed. In this regard, there is a significant research gap in the development of specific coatings for transport boxes that can effectively mitigate vibration, as it addressed in this paper [7].
Quasi-zero-stiffness (QZS) models are a promising alternative in the design of vibration isolation devices [15]. The dynamic stiffness, defined as the derivative of the restoring force with respect to the displacement, can be intentionally designed to be very small or even zero in the vicinity of the static equilibrium point. On the other hand, the static stiffness, understood as the ratio between the restoring force at the static equilibrium position and the displacement from the initial position to the static equilibrium position, can be designed to be very large. The combination of the nonlinear character of low dynamic stiffness and high static stiffness typical of QZS models can greatly reduce the natural frequency of the system while maintaining a high load capacity, thus extending the frequency band of vibration isolation to low frequency regions. In this context, metamaterials, whose properties depend on their structure rather than their composition [16], exhibit nonlinearities with vibration mitigating qualities [17]. The use of cylindrical designs to reduce low frequency [18], reticular structures to mitigate vibrational signals [19] or the use of three-dimensional solids with negative Gaussian curvatures, known as 'Schwarzites' [20] have been reported. Porous materials, manufactured by 3D printing, have also been shown to be useful for acoustic isolation [21], and the use of recycled materials for the construction of QZS isolators is feasible [22]. The design of QZS with metamaterials is achieved by connecting elements of negative stiffness (NS) and positive stiffness (PS) [23-25], although the design with variable positive stiffness elements, bending through fixed joints and buckling of the structures is also possible [26].
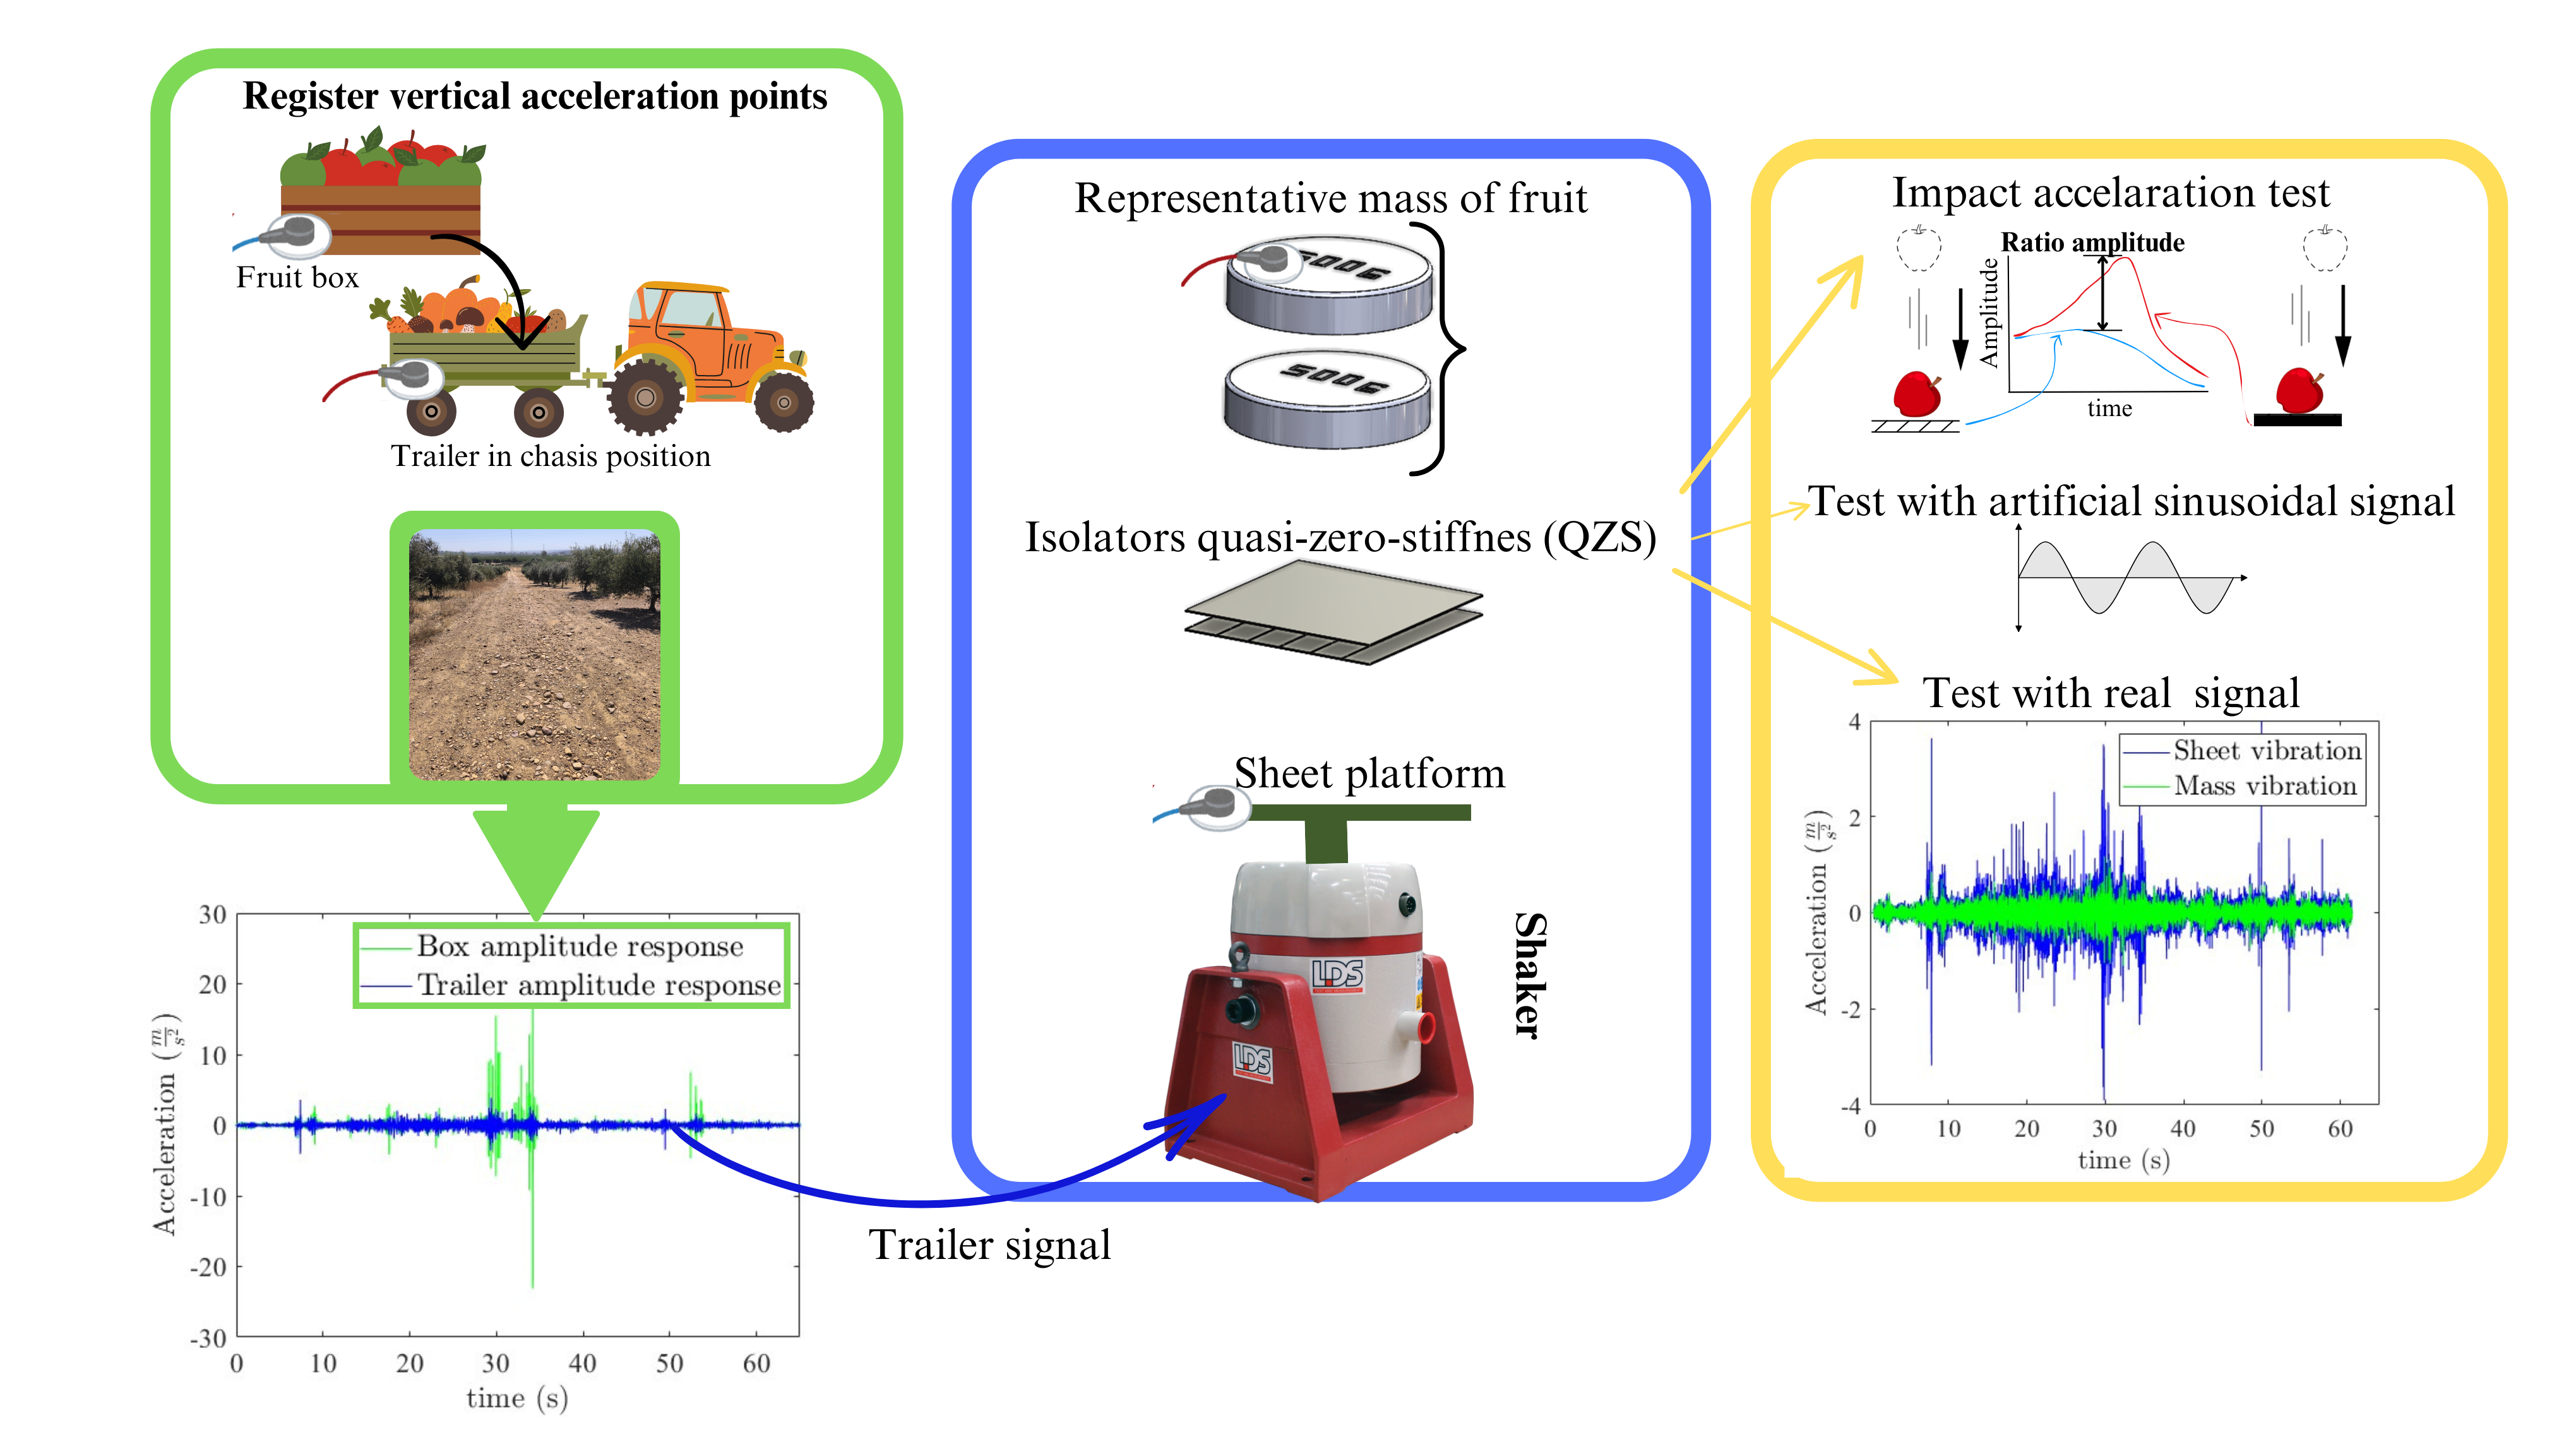
The main objective of this work is to investigate the behavior of isolator sheets manufactured by 3D printing, evaluating their ability to reduce the impacts and vibrations that occur in transportation along irregular and heterogeneous routes before their possible application as coatings on the bottom of fruit boxes. To this end, the vibrations present in trailers loaded with fruit were characterized and laboratory tests were carried out to analyze the effectiveness of the sheets in mitigating these vibrations. The innovation of this study lies in the development of simple, reusable and low-cost anti-vibration coatings for use in the transport of fruit in boxes. Not only can these sheets provide useful tools for packaging engineers, but they also represent an economical and accessible solution compared to other vibration damping devices for field transit vibration. It is also a more environmentally friendly option as it allows the use of material that is more likely to be reused than cardboard or fruit-by-fruit packaging [27].
The document follows the following sequence starting with the “prototype specimen design” explaining the different design parameters to be studied. This is followed by the fruit transport and “vibration recording” tests and the laboratory tests of “impact test”, “analysis with sinusoidal signal” and “recorded transient signal”. The results obtained show the dynamic behavior of the specimens under each of the established study situations.
2. Materials and Methods
2.1. Design of Isolator Test Specimens Manufactured with 3D Printing
A 100 x 100 x 10 mm specimen model was designed with top and bottom layers of 0.8 mm thickness, with properties of a QZS isolator. Several authors have proposed the use of bending models with fixed points that have the characteristic of a high stiffness zone26. The use of inclined elements is conceptually useful to achieve the bending phenomenon. In addition, the use of multi-segment profiles allows to stiffen the profile and to obtain a high stiffness zone [28-30]. However, it is not only possible to stiffen the model with the profile, since the increased thickness of the designed profile makes it possible to stiffen any structure in a simple way [31]. The design of these specimens was approached with a simple profile of an oblique beam that could be stiffened by adjusting the width of the rib to the entire plate. In this way it is possible to create isolator sandwich panels without the need for complex structures. These test specimens simulate a surface that can be placed on box bottoms or as part of the fruit box structure itself. The ribs of these specimens were parameterized in angle of inclination (A), spacing or linear pattern (P) in terms of the number of ribs per 100 linear mm and thickness (T) (Figure 1). Thus, specimen A45-P6-T0.4 corresponds to a rib configuration with a 45º inclination, 6 ribs per 100 mm and 0.4 mm thickness. On the other hand, to simulate the behavior of a commercial plastic box without any damping sheet, a control specimen with the same dimensions, but completely solid, was also manufactured. (Control in Figure 1).
Each of the designed specimens was manufactured using a 3D printer (Ultimaker 3) equipped with a 0.4 mm print head. The material used was ABS (Smart Material), selected for its good mechanical properties, such as tensile strength and impact resistance [32], as well as its ability to withstand high temperatures [33]. The specimens were printed in a vertical position and devices were used to maintain constant heat during the process to avoid warping. The printhead was cleaned after the fabrication of each specimen. The printing conditions selected in the software (Ultimaker Cura 5.0) were an extruder and plate temperature of 245º and 90º, respectively with a printing speed of 60 mm/s and a layer height of 0.2 mm per layer
2.2. Accelerations Produced in Trailers, Boxes and Fruit in the Field
In order to characterize the vibrations that arise during the transport of fruit in the field, a tractor was driven along a 180 m stretch selected on an agricultural farm because of its unfavorable paving conditions characterized by stones, potholes, high compaction and dry state (Figure 2). A tractor was used with a single-axle trailer (without damping) with box dimensions of 2.5 x 1.5 x 0.5 m and a trailer load capacity of 1000 kg. The tractor maintained a constant speed of 10 km/h throughout.
The trailer was loaded with Golden variety apples of a unit mass of 0.2 ± 0.03 kg placed in 0.33 x 0.45 x 0.2 m plastic boxes. With this arrangement, accelerometers were installed to record the accelerations produced at the base of the trailer, at the base of the boxes and on the fruit (Figure 3). On the one hand, a uniaxial accelerometer (PCB 356A32, Depew, New York, USA) was placed at the base of the trailer and another at the bottom of a fruit box located in the center of the trailer, all aligned with the axis of the trailer. On the other hand, 3 triaxial MEMS wireless accelerometers (Gulf Coast Data Concepts LLC, X200-4, Waveland, MS) were placed inside three artificial apples fabricated by 3D printing in PLA material with dimensions and mass similar to the rest of the apples inside the boxes (Figure 3). The accelerations were recorded on a multichannel dynamic analyzer (OROS 36 Mobi-Pack, Meylan, France).
To ensure the consistency of the results, three independent tests were performed under the same conditions. The measurement path comprised 65 seconds of recording, with starting and ending locations previously established for a rigorous control of the evaluated section.
Several parameters of the recorded signals were evaluated, such as Power Spectrum density (PSD) to analyze the distribution of shocks in the frequency domain, spectral coherence to determine the relationship between the frequency peaks and the phase of the spectrum to evaluate the phase shift between the different frequencies.
2.3. Test Specimen Impact Test
The vibration amplitude ratio was evaluated in order to characterize the impact damping capacity of the different specimens (Specimen in Figure 4) proposed in comparison with the control sheet. For this purpose, a device designed to drop the fruit vertically from a fixed position set at a height of 20 cm was used as a representative measure of the position from which fruit is usually dropped into a box (Figure 4).
An artificial apple 0.075 x 0.075 x 0.075 m made of PLA was manufactured and used to obtain greater reproducibility in the tests without damage. The artificial apple was designed with an inner hole (following the design shown in (Figure 3) for the placement of a wireless triaxial accelerometer (Gulf Coast Data Concept), so that the mass of the assembly was 0.18 kg. In the lower part of the device where the impacts are received, the specimens were placed in order to measure the peak acceleration generated on impact and to compare the different specimens with each other. The peak accelerations recorded corresponded to the X-axis (Figure 4) and were obtained from the mean value of 30 repetitions, following Jiménez-Jiménez et al. (2013) [34] in a similar impact study on olives.
2.4. Dynamic Response Test Against a Continuous Signal
Each of the fabricated specimens was anchored on the base of the 100 x 100 x 8 mm metal vibrating structure of an electromagnetic shaker (LDS V406, Nærum, Denmark) to generate a forced vibration in the vertical axis (Figure 5). A preload with a mass of 1 kg was added on each specimen to simulate the weight of the fruit on the surface under study. This weight was estimated by assuming that 15 experimental specimens are required to cover the surface of a standard box that usually holds about 15 kg approximately. Two uniaxial accelerometers (PCB 352C33, Depew, New York, USA) were placed in this device, one on the rigid base of the shaker base and one on the mass placed on the test specimens. In this way, the first accelerometer would simulate the behavior of the structure of a trailer where the boxes are placed, and the second would simulate the behavior of the fruit on a box covered with the different tested specimens.
Both the shaker and the accelerometers were connected to a 16-channel dynamic analyzer (OROS 36 Mobi-Pack, Meylan, France) controlled by NVGate v.8 software (Meylan, France). Two types of continuous signals were generated: 1) artificial sinusoidal signal and 2) signal recorded in transit in the farm (explained hereafter). The output of the equipment was connected to a signal amplifier (LDS PA100E, Nærum, Denmark).
2.4.1. Artificial Sinusoidal Signal
A sinusoidal signal with a frequency of 4 Hz was generated, since it was the predominant one in the recordings obtained during the field tests. The amplitude applied to the shaker was made in sweeps of 2.8, 5.6 and 8.5V since the shaker limit was 10 V. A total of 3 repetitions were performed for each specimen, evaluating the vibration during a period of 4 seconds in steady state [35]. The root mean square acceleration (ARMS) in the time domain during vibration time, and the acceleration transmissibility (ATRANS) (%), as percentage, between the ARMS of the different sample points measured in test laboratory were evaluated for each specimen.
2.4.2. Twin Traffic Signal in the Field
The signal recorded at the base of the trailer in the preliminary field test was reproduced as shaker output. Three repetitions were carried out with each specimen and the signals recorded in the laboratory were analyzed. From these signals, the three highest acceleration peaks were selected and evaluated to determine the amplitude of vibration ratio between the peak observed at the base of the shaker and at the mass that would reflect the damping between the trailer base and the piece of fruit in transit in the field. The analysis of these functions was performed using Matlab software (MathWorks, Natick, Massachusetts).
2.5. Statistical Analysis
Parametric studies were carried out for the statistical analysis of data since all the study variables have shown normality and homogeneity in their variances. The software used for the statistical analysis was IBM SPSS Statistics 25 (IBM Corporation; SPSS Statistics 25, New York, USA).
3. Results
The different signal recordings in the trailer and boxes showed high repeatability. One of the signals in each location was selected and it is shown in (Figure 6 ‘up’). It is observed that the time response is characterized by being composed of a large number of peak accelerations amplified in the signal recorded in the box.
Regarding the time signals recorded in the artificial apples (Figure 6 ‘down’) with triaxial accelerometers, acceleration peaks are observed in accordance with those occurring at the same time in the trailer and boxes (Figure 6 ‘up’) but with much higher magnitudes (over 5 times in most of the frequency peaks). It is noteworthy that the same temporal dynamics is also observed in the accelerations produced in the y and z axes possible due to collisions between the fruits of the box and rotations.
Figure 7 shows the frequency response of the signals recorded at the surface of the trailer and at the bottom of the fruit box, which report peaks at frequencies between 3.3 and 4 Hz with the highest amplitudes in the box signal. Spectral coherence results between the main frequency peaks between the two signals show values of 0.982 coherence at 3.3 Hz, 0.986 coherence at 3.5 Hz and 0.984 coherence at 4 Hz. The phase shift of the spectrum shows -4.90º at 3.3 Hz, -1.76º at 3.5 Hz and -9.86º at 4 Hz, i.e., minimum and negative phase shifts are found between the trailer and the box signals.
Figure 8 shows results of the vibration amplitude ratio obtained in the impact test on the specimens, taking as reference the control sheet, which reported peak acceleration values (M = 619.17, SD = 31.62 ms-2). Specimen A30-P4-T0.4, showed a higher ratio with respect to the others (M = 331.46, SD = 23.58 ms-2), presenting significant differences with all the others (ANOVA, p < 0.05; post-hoc pairwise Duncan's t-test with Holm correction, p > 0.05). A30-P6-T0.4 (M = 244.91, SD = 19.81 ms-2) and A45-P4-T0.4 (M = 137.78, SD = 10.72 ms-2) also presented significant differences with the others. A30-P4-T0.8 (M = 64.03, SD = 21.41 ms-2), A45-P6-T0.4 (M = 32.53, SD = 13.01 ms-2) and A45-P4-T0.8 (M = 13.96, SD = 9.73 ms-2) specimens offered the lowest amplitude ratios. Moreover, they did not report significant differences between them, although they did report significant differences with the others.
Table 1 shows the values of the root mean square acceleration at the base of the shaker, as well as the transmissibility between the base and the mass placed on the specimens, recorded in laboratory tests using a sinusoidal signal at frequency 4 Hz with variable voltage amplitude or gain. Significant differences in ARMS and ATRANS were found between each proposed specimen and establishing these comparisons between equal voltage. No significant difference was obtained between trials with the different specimens for the same gain in the ARMS base (ANOVA, p < 0.05, post-hoc pairwise Student’s t-test with Holm correction, p < 0.05). Regarding ATRANS base-mass, specimens A30-P6-T0.4 and A30-P4-T0.4 were significantly different from all the others; A45-P4-T0.8 and A30-P4-T0.8 were significantly different from the others except with A45-P6-T0.4; A30-P4-T0.8 was significantly different from the others except with A45-P6-T0.4 and A45-P4-T0.4 (ANOVA, p < 0.05, post-hoc pairwise Student’s t-test with Holm correction, p < 0.05). It can be observed how vibration amplification occurred in mass in almost all cases with transmissibility values higher than 100% in all specimens, reaching values of up to 127% in specimen A30-P4-T0.4 with a voltage amplitude of 8.5V.
Figure 9 shows plots of ATRANS base-mass versus the different gains per specimen in the sinusoidal signal test, as well as the different trend lines of each one. The control specimen shows practically a line of zero slope between the different gains, while from A45-P4-T0.8 to A45-P4-T0.4 a linear trend is shown which increases its slope. Specimens A30-P6-T0.4 and A30-P4-T0.4 show polynomial trends.
Figure 10 shows the actual signals reproduced at the base of the shaker and in the mass respectively for each of the specimens when applying the twin signal of the field transit. The 3 peaks later analyzed in detail in Table 2 can be clearly observed, as well as their reductions in magnitude in all cases tested. The signals reported the different peak accelerations found during the 65 seconds characterized by a large number of impacts which have been reproduced with the shaker for each of the specimens under study.
Table 2 shows the ARMS and the ATRANS base-mass of the 3 maximum peaks selected in the study. In Peak 1, the control plate showed significant differences with all the others (ANOVA, p < 0.05, post-hoc pairwise Student's t-test with Holm correction, p < 0.05), having the highest ATRANS 57.40%, base-mass than the rest of the specimens. The A45-P4-T0.8 configuration showed no significant differences with A45-P6-T0.4 and A30-P4-T0.8. The configuration A30-P4-T0.8 showed significant differences with all others except A45-P4-T0.4 and A45-P4-T0.8. The lowest ATRANS values of around 19% were found in A30-P6-T0.4 and A30-P4-T0.4, which showed significant differences with all others except themselves. In Peak 2, significant differences are shown for all specimens with all of them (ANOVA, p < 0.05, post-hoc pairwise Student's t-test with Holm correction, p < 0.05). In this case again lower values of ATRANS base-mass were found for A30-P6-T0.4 and A30-P4-T0.4. Finally, in Peak 3, the control specimen showed significant differences with all the others, offering the highest ATRANS, in this case 83.70%, as in Peak 1 and Peak 2 (ANOVA, p < 0.05, post-hoc pairwise Student's t-test with Holm correction, p < 0.05). The A45-P4-T0.8 configuration showed significant differences with all others except A30-P4-T0.8. The A45-P6-T0.4 configuration showed significant differences with all except A45-P4-T0.4. The lowest values of ATRANS base-mass in Peak 3 were in A30-P6-T0.4 and A30-P4-T0.4 specimens, where these configurations showed no significant difference between them, but with all the others.
4. Discussion
Several authors have used QZS models for vibration isolation using metamaterials. However, QZS isolators can not only be achieved with metamaterial design as they can also be implemented using [36], X-shaped structures [37], tilted and curved beams [31], as well as oblique spring configurations38. Several and varied applications can be addressed with these isolators, such as those aimed at comfort in vehicle seats, the elimination of vibrations in bridges and pipelines, or their use in incubators for babies15.
In order to propose a dynamic model of a sheet that minimizes the vibrations experienced by the fruit in the field transport process, it is necessary to use a model that characterizes the vibrations of the base, either the box or the floor of the trailer, together with an element that has the characteristics of mass, stiffness and damping. Thus defined, this type of model is established as a simple one degree of freedom model (SDOF) [31]. Other authors propose a multi-stage system (MDOF); however, the rate of transmissibility reduction may be increased [39].
There are several factors that affect the vibration recorded in transport such as speed, asphalt conditions, type of brakes, suspension, etc. These factors modify the amplitude and frequency of the recorded signal [2], as reported in the actual reproduced signals shown in (Figure 8). Several authors use PSD for in-vehicle analysis [40], as well as to understand the energy exposure to which the fruit is exposed [7]. The vibration frequency ranges reported in the literature with values of 2-4 Hz for trucks, 2-10 Hz for semi-trailer [41] or for long distance trailers of 0.1-5 Hz [13] comprised the values obtained in this study (3-4 Hz in Figure 7). Vibrations and impacts from the truck bed, combined with improper and insufficient use of packaging, can significantly reduce the quality attributes of fresh products [42]. Coherence is useful to verify the correlation between the trailer and fruit box signals [43] and in this study, the highest frequencies (3.5-4 Hz) showed spectral coherences greater than 97% between the base of the trailer and the box and minimally negative cross-spectral phases. This phase shift suggests that one signal is delayed relative to the other due to the distance kept between the two sensors or differences between materials [44].
When talking about the transmissibility between the base of the electromagnetic shaker and the mass that simulates the fruit, values higher than 100% were reported when working with a 4 Hz sinusoidal forced signal, while with the twin transit signals in the field, values well below 100% were reported, even reaching 13.27%, that is, a significant reduction of the vibration in the fruit. The dynamic behavior of the model to a sinusoidal signal as the amplitude is increased showed a behavior similar to that established for a pure harmonic model, as previously reported by others authors [45]. Figure 9 shows the transmissivity as the signal gain increases, establishing different trend lines for each of the proposed specimens. The trend lines A30-P4-T0.4 and A30-P6-T0.4 show that it is possible to maximize these functions until their optimum amplitude range is found, allowing the choice of one sheet or another depending on the application required. The behavior of the control specimen is similar to the mass block and its trend before transmissibility presents values below 100%, hence its trend line with a small negative slope. It turns out that solid mass architecture also poses dissipation of mechanical excitations [20]. However, they may have the disadvantage of propagating waves throughout the entire part [46].
The study of the vibration amplitude ratio was useful to evaluate the damping characteristics of the specimens versus the control plate. In this context, other authors have used fruit impact systems to evaluate the ratio of impact energy to fruit damage34, corroborating that the longer the vibration exposure time, the more exponentially increased the damage [47]. The use of an artificial vibration obtained from a real signal was very useful to check the real performance of the different isolators proposed. When reproducing the real traffic signal in the field, small typical deviations between repetitions appeared, being this a characteristic of reproducing the signal with an open loop typical of the equipment used in this study that could be minimized with the use of closed loop systems [48]. However, the peak accelerations show very small standard deviations in the different repetitions Table 2.
The vibration reported in the agricultural study site is characterized mainly by impacts, since irregularities and stones are the elements with the greatest influence in the generation of these vibrations [49]. The three studied peak accelerations or impacts showed a reduction of acceleration similar to the results obtained in the vibration amplitude ratio, being A30-P4-T0.4 and A30-P6-T0.4 the ones with the lowest transmissibility percentages, and therefore with the highest damping capacities. The results reported in this study allowed a large reduction in peak accelerations, registering transmissibility values of up to 13%. It can be observed that these percentages are different in the same specimen, and this may be due to the nature of the acceleration peak as it is affected by the amount of pressure exerted, the time employed and the material [50], but it may also be associated with the nonlinearities characteristic of this type of isolators [15].
5. Conclusions
The behavior of different QZS vibration isolation specimens which were manufactured by 3D printing as base plates or sheets of boxes in order to mitigate vibration in the transport of fruit was analyzed. The internal structure of these specimens has been characterized with respect to angle, separation and thickness of their internal rib. The dynamic response of these specimens has been studied under impacts and using signals that reproduce the vertical accelerations that occur in transit in the field, characterized by a large number of peak accelerations.
The behavior of the specimens to sinusoidal signals showed higher transmissibility between the excitation base and the mass on specimens A30-P4-T0.4 and A30-P6-T0.4 indicating the adaptability of these sheets to a higher vibration amplitude. With the signal that simulates traffic in the farm ATRANS impact values from 19% to 13% were obtained for specimens with 30º rib angles. The vibration amplitude ratio test again shows lower damping levels in the 45º angle configuration, thickness 0.8 mm for 4 patterns, increasing nine times when the thickness is modified to 0.4 mm and twenty-five times when the angle is also modified to 30º, this being the best configuration to dissipate the impacts. All the results show that these test specimens offer the best performance, being a slightly better option A30-P4-T0.4. Therefore, the manufactured sheets present a technical feasibility for the purpose of this work and could be used due to their low cost, low maintenance, easy accessibility and reusability compared to other vibration mitigating devices.
Future lines of research should focus on the design of commercial boxes for fruit transport with the use of the developed isolator sheets and with main emphasis on the analysis of the degree of real affectation of the fruit produced in the field versus the usual systems used for storage or transport.
Author Contributions
For research articles with several authors, a short paragraph specifying their individual contributions must be provided. The following statements should be used “Conceptualization, RRSG.; methodology, RRSG; formal analysis, PSC; investigation, PSC.; resources, RRSG; data curation, PSC; writing—original draft preparation, PSC and RRSG.; writing—review and editing, CAP. All authors have read and agreed to the published version of the manuscript.
Funding
This research received no external funding.
Institutional Review Board Statement
Not applicable.
Data Availability Statement
Not applicable.
Acknowledgments
Not applicable.
Conflicts of Interest
The authors declare no conflicts of interest.
References
- Jung, H. M et al., Effect of vibration stress on quality of packaged grapes during transportation. Engineering in Agriculture, Environment and Food. 2018, 11, 79–83. [CrossRef]
- Lu, F., Ishikawa, Y., Kitazawa, H., & Satake, T. Effect of vehicle speed on shock and vibration levels in truck transport. Packaging Technology and Science. 2018, 23, 101–109. [CrossRef]
- Xu, F., Liu, S., Liu, Y., & Wang, S. Effect of mechanical vibration on postharvest quality and volatile compounds of blueberry fruit. Food Chemistry. 2021, 349. [CrossRef]
- Walkowiak-Tomczak, D. , Idaszewska, N., Łysiak, G. P., & Bieńczak, K. The effect of mechanical vibration during transport under model conditions on the shelf-life, quality and physico-chemical parameters of four apple cultivars. Agronomy. 2021, 11. [CrossRef]
- Mahanti, N. K et al., Emerging non-destructive imaging techniques for fruit damage detection: Image processing and analysis. In Trends in Food Science and Technology. 2022, 120, 418–438. Elsevier Ltd. [CrossRef]
- Ali, A., Xia et al., Economic and environmental consequences of postharvest loss across food supply Chain in the developing countries. Journal of Cleaner Production. 2021, 323. [CrossRef]
- Al-Dairi, M., Pathare, P. B., Al-Yahyai, R., & Opara, U. L. Mechanical damage of fresh produce in postharvest transportation: Current status and future prospects. In Trends in Food Science and Technology. 2022, 124, 195–207. Elsevier Ltd. [CrossRef]
- Soleimani, B., & Ahmadi, E. Evaluation and analysis of vibration during fruit transport as a function of road conditions, suspension system and travel speeds. Engineering in Agriculture, Environment and Food. 2015, 8, 26–32. [CrossRef]
- Wang, Y et al., Research on damping performance of orchard fruit three-stage damping trailer based on adams. INMATEH - Agricultural Engineering. 2023, 71, 583–598. [CrossRef]
- Wasala, W. M. C. B., Dharmasena, D. A. N., Dissanayake, T. M. R., & Thilakarathne, B. M. K. S. Vibration Simulation Testing of Banana Bulk Transport Packaging Systems. In Tropical Agricultural Research. 2015, 26.
- Fernando, I., Fei, J., Stanley, R., & Rouillard, V. Evaluating packaging performance for bananas under simulated vibration. Food Packaging and Shelf Life. 2020, 23. [CrossRef]
- Peter Aba, I., Mohammed Gana, Y., Ogbonnaya, C., & O, M. O. Simulated transport damage study on fresh tomato (Lycopersicon esculentum) fruits. 2012, 14. http://www.cigrjournal.org.
- Fernando, I. , Fei, J., & Stanley, R. Measurement and analysis of vibration and mechanical damage to bananas during long-distance interstate transport by multi-trailer road trains. Postharvest Biology and Technology. 2019, 158. [CrossRef]
- Dhital, R et al., Integrity of edible nano-coatings and its effects on quality of strawberries subjected to simulated in-transit vibrations. LWT. 2017, 80, 257–264. [CrossRef]
- Liu, C et al., Quasi-zero-stiffness vibration isolation: Designs, improvements and applications. In Engineering Structures. 2024, 301. Elsevier Ltd. [CrossRef]
- Al Rifaie, M. , Abdulhadi, H., & Mian, A. Advances in mechanical metamaterials for vibration isolation: A review. In Advances in Mechanical Engineering. 2022, 14. [CrossRef]
- Augello, R. , & Carrera, E. Nonlinear dynamics and band gap evolution of thin-walled metamaterial-like structures. Journal of Sound and Vibration. 2024, 578. [CrossRef]
- Zolfagharian, A et al., 3D-Printed Programmable Mechanical Metamaterials for Vibration Isolation and Buckling Control. Sustainability (Switzerland). 2022, 14. [CrossRef]
- Singh, G et al., Effect of unit cell shape and structure volume fraction on the mechanical and vibration properties of 3D printed lattice structures. Journal of Thermoplastic Composite Materials. 2023, 37, 1841–1858. [CrossRef]
- Herkal, S et al., 3D printed metamaterials for damping enhancement and vibration isolation: Schwarzites. Mechanical Systems and Signal Processing. 2023, 185. [CrossRef]
- Boulvert et al., Perfect, broadband, and sub-wavelength absorption with asymmetric absorbers: Realization for duct acoustics with 3D printed porous resonators. Journal of Sound and Vibration. 2022, 523. [CrossRef]
- Astrauskas, T., Grubliauskas, R., & Januševičius, T. Optimization of sound-absorbing and insulating structures with 3D printed recycled plastic and tyre rubber using the TOPSIS approach. JVC/Journal of Vibration and Control. 2024, 30, 1772–1782. [CrossRef]
- Cai, C et al., Design and numerical validation of quasi-zero-stiffness metamaterials for very low-frequency band gaps. Composite Structures 2020, 236. [CrossRef]
- Cai, C. , Zhou, J., Wang, K., Xu, D., & Wen, G. Metamaterial plate with compliant quasi-zero-stiffness resonators for ultra-low-frequency band gap. Journal of Sound and Vibration. 2022, 540. [CrossRef]
- Dalela, S et al., Nonlinear static and dynamic response of a metastructure exhibiting quasi-zero-stiffness characteristics for vibration control: an experimental validation. Scientific Reports. 2024, 14. [CrossRef]
- Hamzehei, R. , Bodaghi, M., & Wu, N. Mastering the art of designing mechanical metamaterials with quasi-zero stiffness for passive vibration isolation: a review. In Smart Materials and Structures. 2024, 33. Institute of Physics. [CrossRef]
- Abejón, R.; et al. , When plastic packaging should be preferred: Life cycle analysis of packages for fruit and vegetable distribution in the Spanish peninsular market. Resources, Conservation and Recycling. 2020, 155. [CrossRef]
- Hamzehei, R. , Zolfagharian, A., Dariushi, S., & Bodaghi, M. 3D-printed bio-inspired zero Poisson’s ratio graded metamaterials with high energy absorption performance. Smart Materials and Structures. 2022, 31. [CrossRef]
- Hamzehei, R. et al., Parrot Beak-Inspired Metamaterials with Friction and Interlocking Mechanisms 3D/4D Printed in Micro and Macro Scales for Supreme Energy Absorption/Dissipation. Advanced Engineering Materials. 2023, 25. [CrossRef]
- Kim, H. , Tawfick, S. H., & King, W. P. Modeling and Design of Zero-Stiffness Elastomer Springs Using Machine Learning. Advanced Intelligent Systems. 2022, 4. [CrossRef]
- Xiao, L., Sun, X., Cheng, L., & Yu, X. A 3D-printed quasi-zero-stiffness isolator for low-frequency vibration isolation: Modelling and experiments. Journal of Sound and Vibration. 2024, 577. [CrossRef]
- Alvarez C., K. L., Lagos C., R. F., & Aizpun, M. Investigating the influence of infill percentage on the mechanical properties of fused deposition modelled ABS parts. Ingenieria e Investigacion. 2016, 36, 110–116. [CrossRef]
- Dizon, J. R. C. , Espera, A. H., Chen, Q., & Advincula, R. C. Mechanical characterization of 3D-printed polymers. In Additive Manufacturing. 2018, 20, 44–67. Elsevier B.V. [CrossRef]
- Jiménez-Jiménez, F et al., Table olive cultivar susceptibility to impact bruising. Postharvest Biology and Technology. 2013, 86, 100–106. [CrossRef]
- Wu et al., Design of semi-active dry friction dampers for steady-state vibration: sensitivity analysis and experimental studies. Journal of Sound and Vibration. 2019, 459. [CrossRef]
- Zheng et al., Analytical study of a quasi-zero stiffness coupling using a torsion magnetic spring with negative stiffness. Mechanical Systems and Signal Processing. 2018, 100, 135–151. [CrossRef]
- Xiong, Y. , Li, F., & Wang, Y. A nonlinear quasi-zero-stiffness vibration isolation system with additional X-shaped structure: Theory and experiment. Mechanical Systems and Signal Processing. 2022, 177. [CrossRef]
- Gatti, G. An adjustable device to adaptively realise diverse nonlinear force-displacement characteristics. Mechanical Systems and Signal Processing. 2022, 180. [CrossRef]
- Zheng, Y. , Shangguan, W. Bin, Yin, Z., & Liu, X. A. Design and modeling of a quasi-zero stiffness isolator for different loads. Mechanical Systems and Signal Processing. 2023, 188. [CrossRef]
- Xing, Y., & Li, Q. M. Evaluation of the mechanical shock testing standards for electric vehicle batteries. International Journal of Impact Engineering. 2024, 194. [CrossRef]
- Zhou, R et al., Reduction in Hami melon (Cucumis melo var. saccharinus) softening caused by transport vibration by using hot water and shellac coating. Postharvest Biology and Technology. 2015, 110, 214–223. [CrossRef]
- Li, Z., & Thomas, C. Quantitative evaluation of mechanical damage to fresh fruits. In Trends in Food Science and Technology. 2014, 35, 138–150. [CrossRef]
- Wang, D et al., A simple and fast guideline for generating enhanced/squared envelope spectra from spectral coherence for bearing fault diagnosis. Mechanical Systems and Signal Processing. 2019, 122, 754–768. [CrossRef]
- Zhang, P., Wen, H., Liu, X., & Niu, L. A new time-delay estimation: phase difference-reassigned transform. International Journal of Dynamics and Control. 2024. [CrossRef]
- Wei, Y et al., Targeted energy transfer of a parallel nonlinear energy sink. Applied Mathematics and Mechanics. 2019, 40, 621–630. [CrossRef]
- Elmadih, W. , Syam, W. P., Maskery, I., Chronopoulos, D., & Leach, R. Multidimensional phononic bandgaps in three-dimensional lattices for additive manufacturing. Materials. 2019, 12. [CrossRef]
- Fernando, I et al., Developing an accelerated vibration simulation test for packaged bananas. Postharvest Biology and Technology. 2021, 173. [CrossRef]
- Yu, M et al., A self-sensing soft pneumatic actuator with closed-Loop control for haptic feedback wearable devices. Materials and Design. 2023, 223. [CrossRef]
- Paternoster, A., Vanlanduit, S., Springael, J., & Braet, J. Vibration and shock analysis of specific events during truck and train transport of food products. Food Packaging and Shelf Life. 2018, 15, 95–104. [CrossRef]
- Ibrahim, A., Ramini, A., & Towfighian, S. Experimental and theoretical investigation of an impact vibration harvester with triboelectric transduction. Journal of Sound and Vibration. 2018, 416, 111–124. [CrossRef]
Figure 1.
Design patterns established on test specimens.
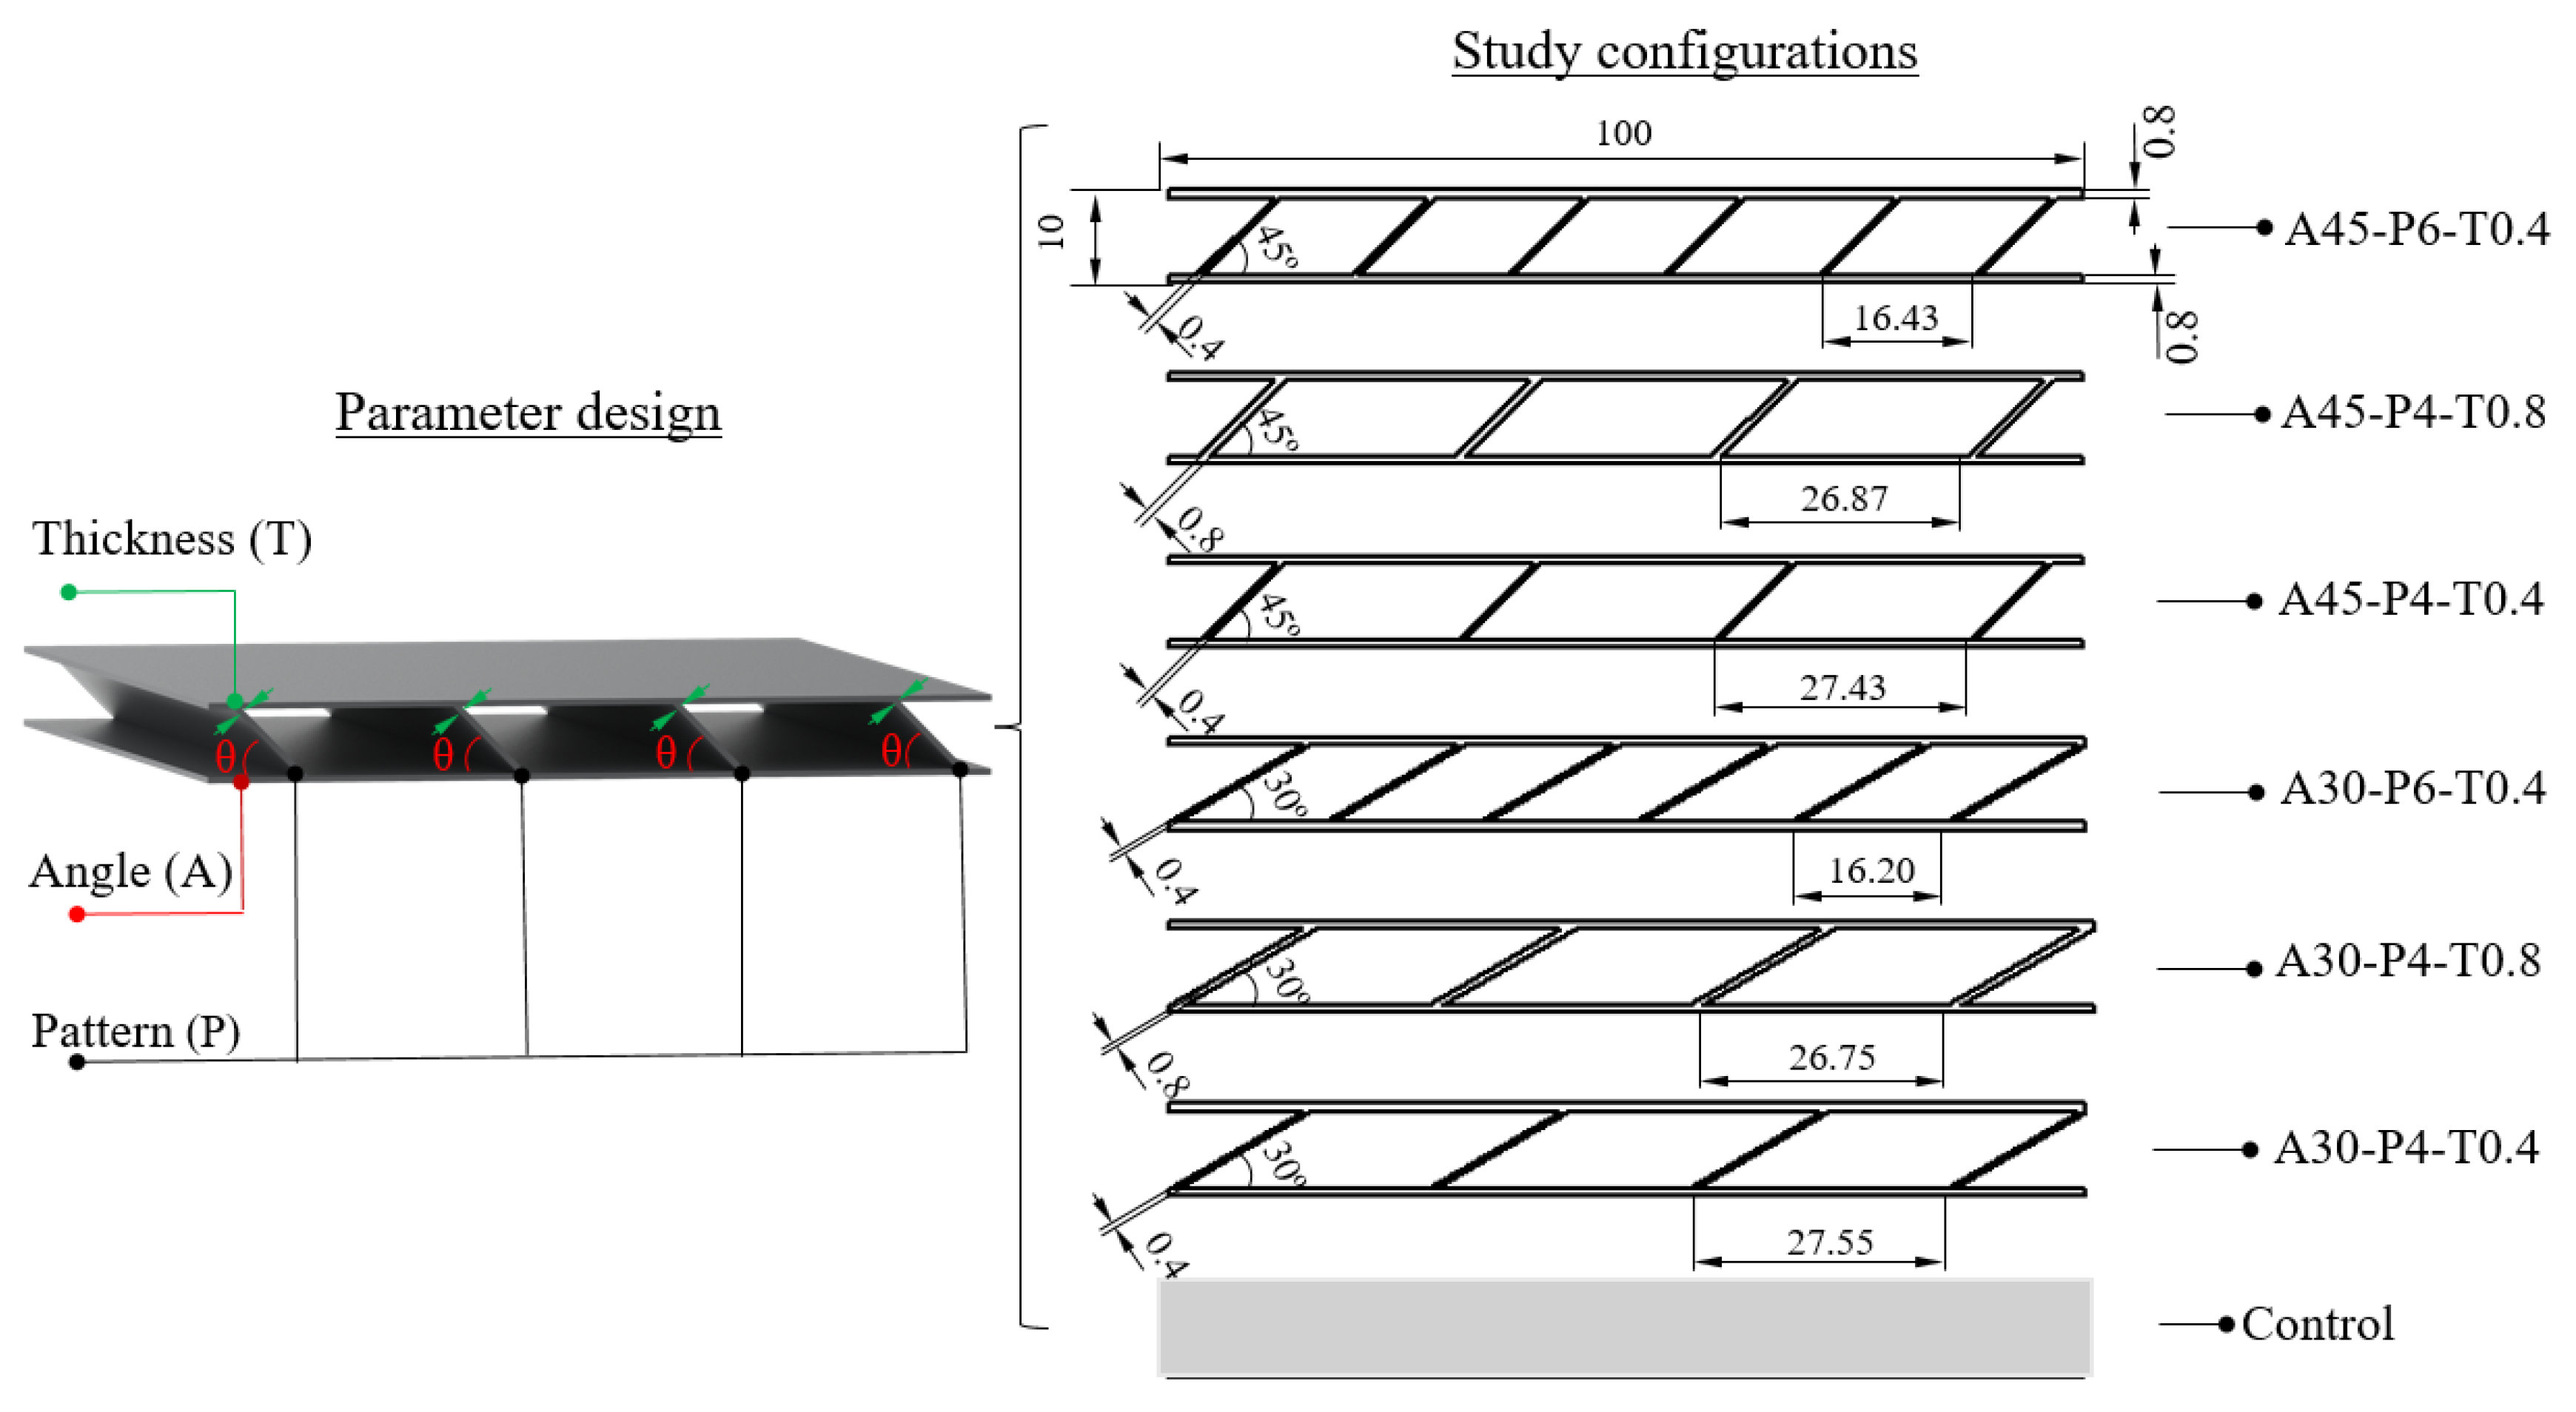
Figure 2.
Section of rural route selected to record vibrations in transit to the collection point.
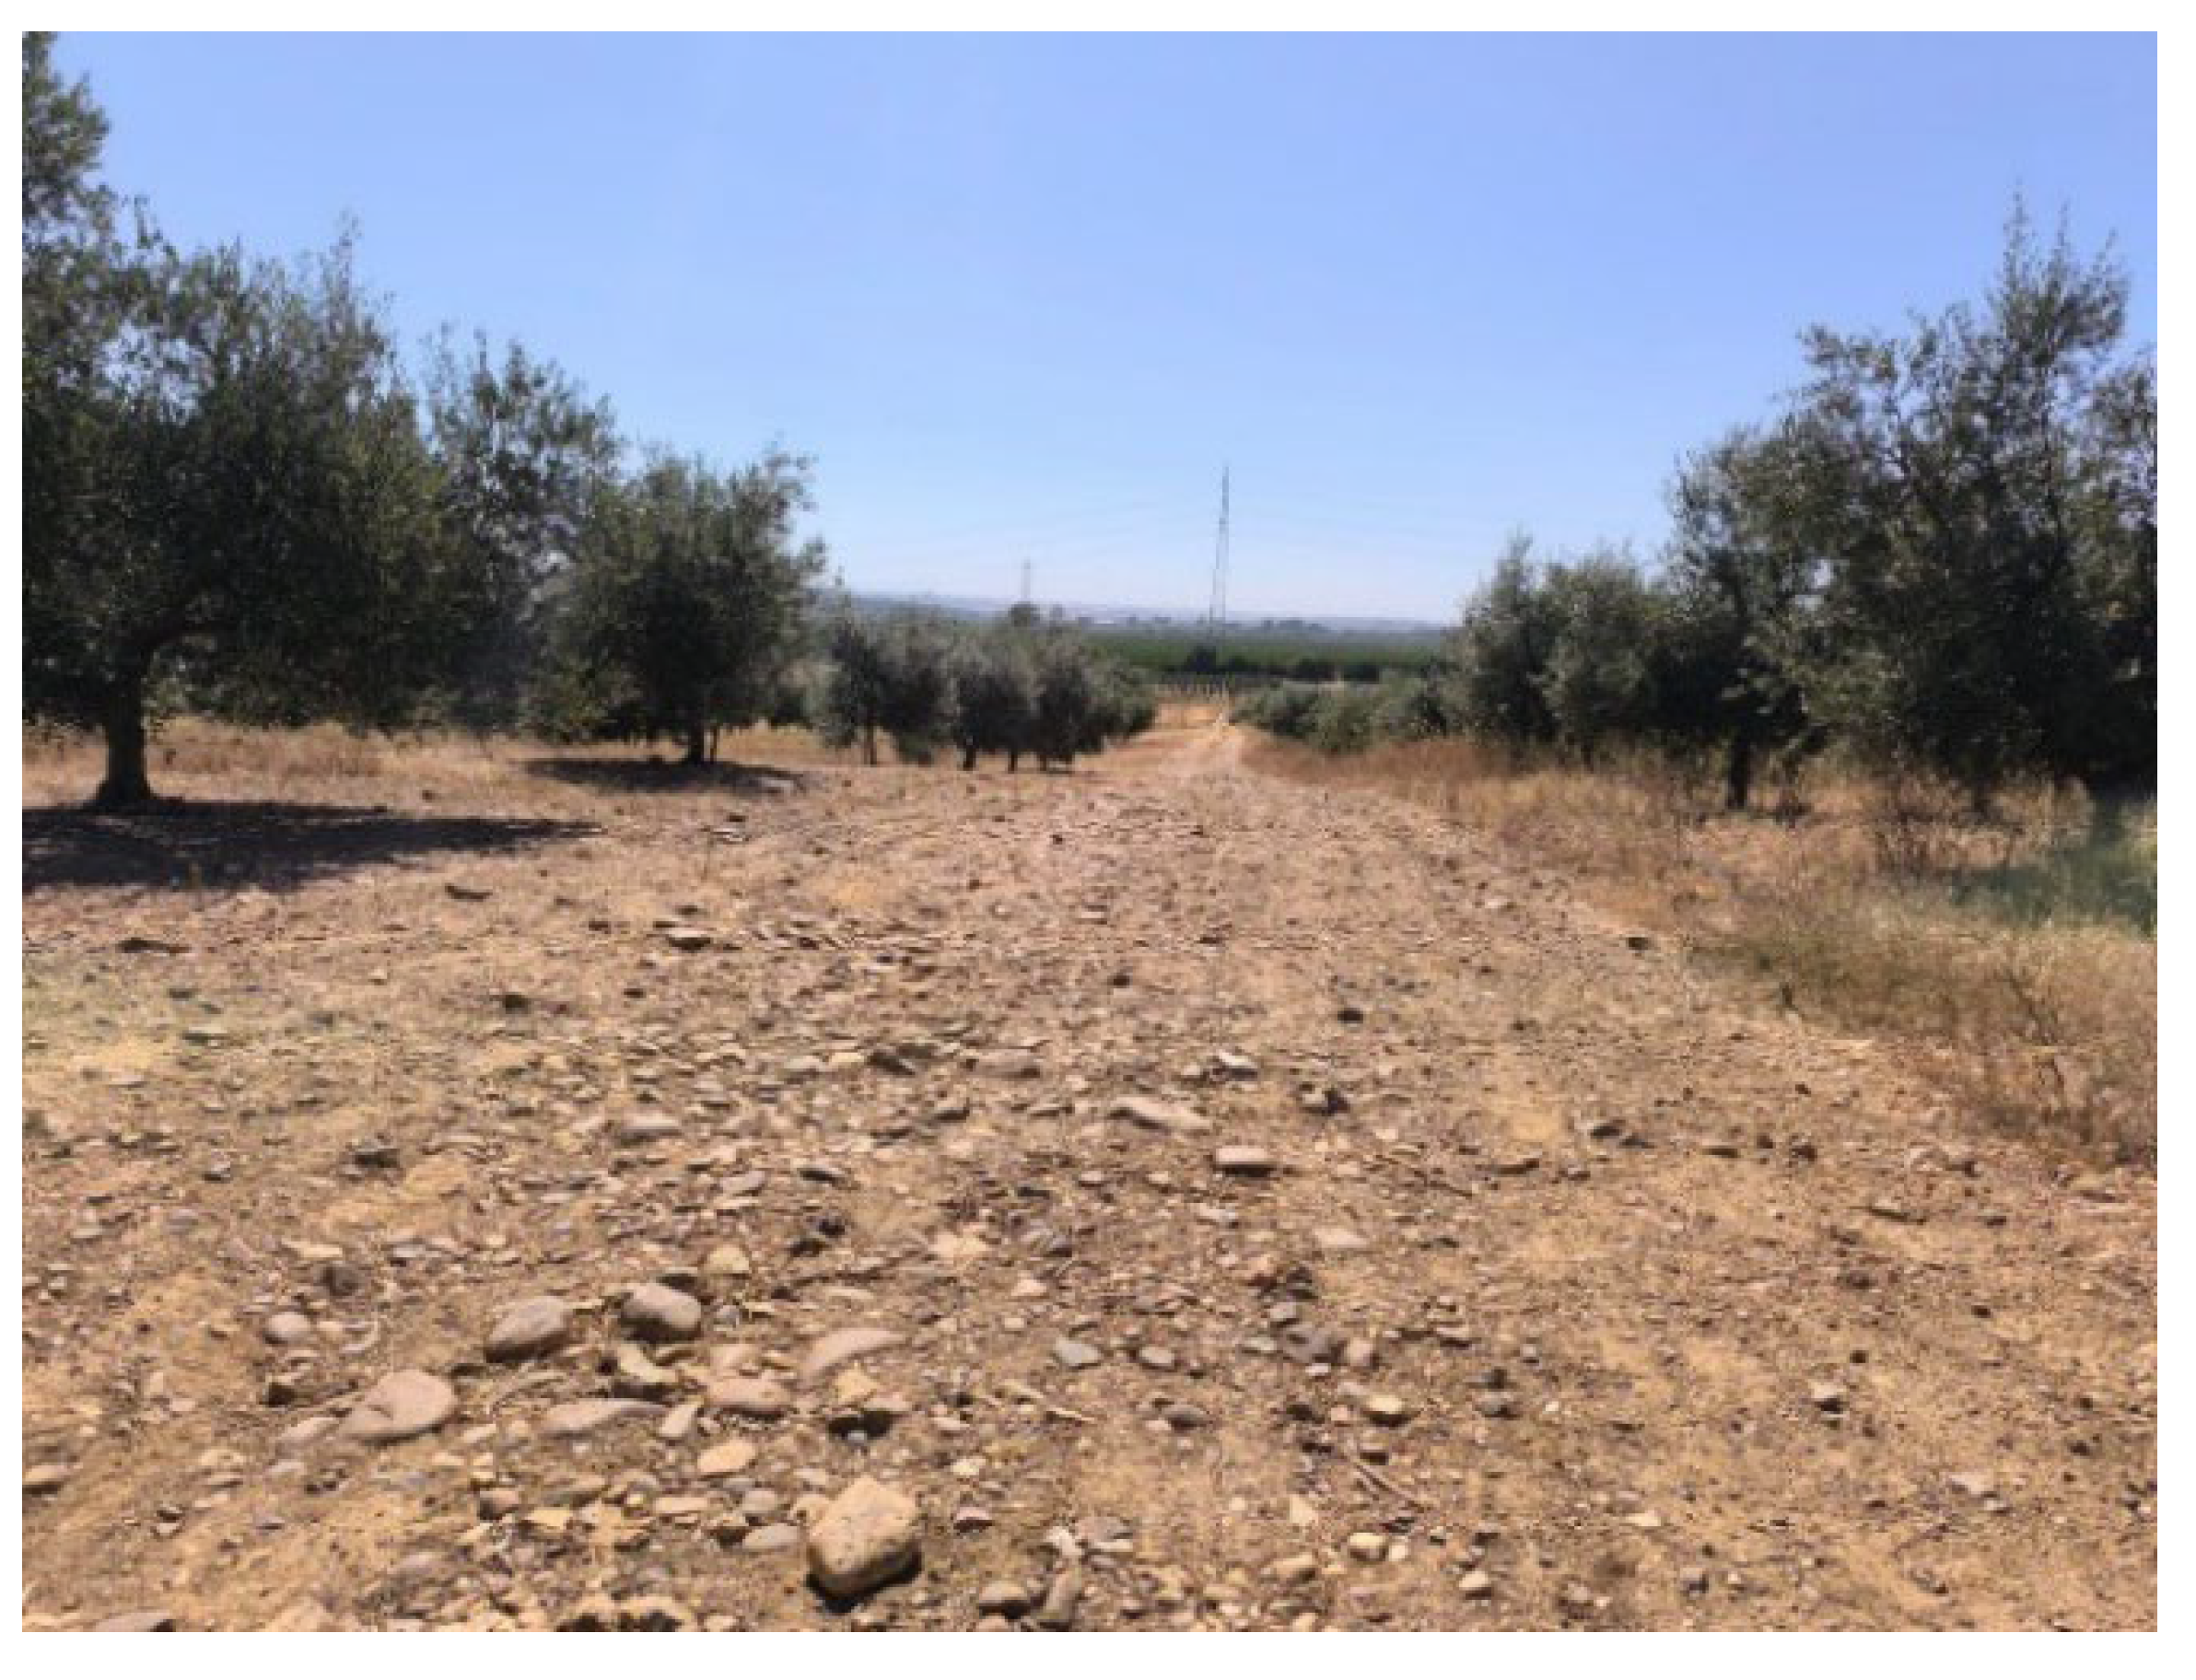
Figure 3.
Location of sensors on the trailer, boxes and fruits.
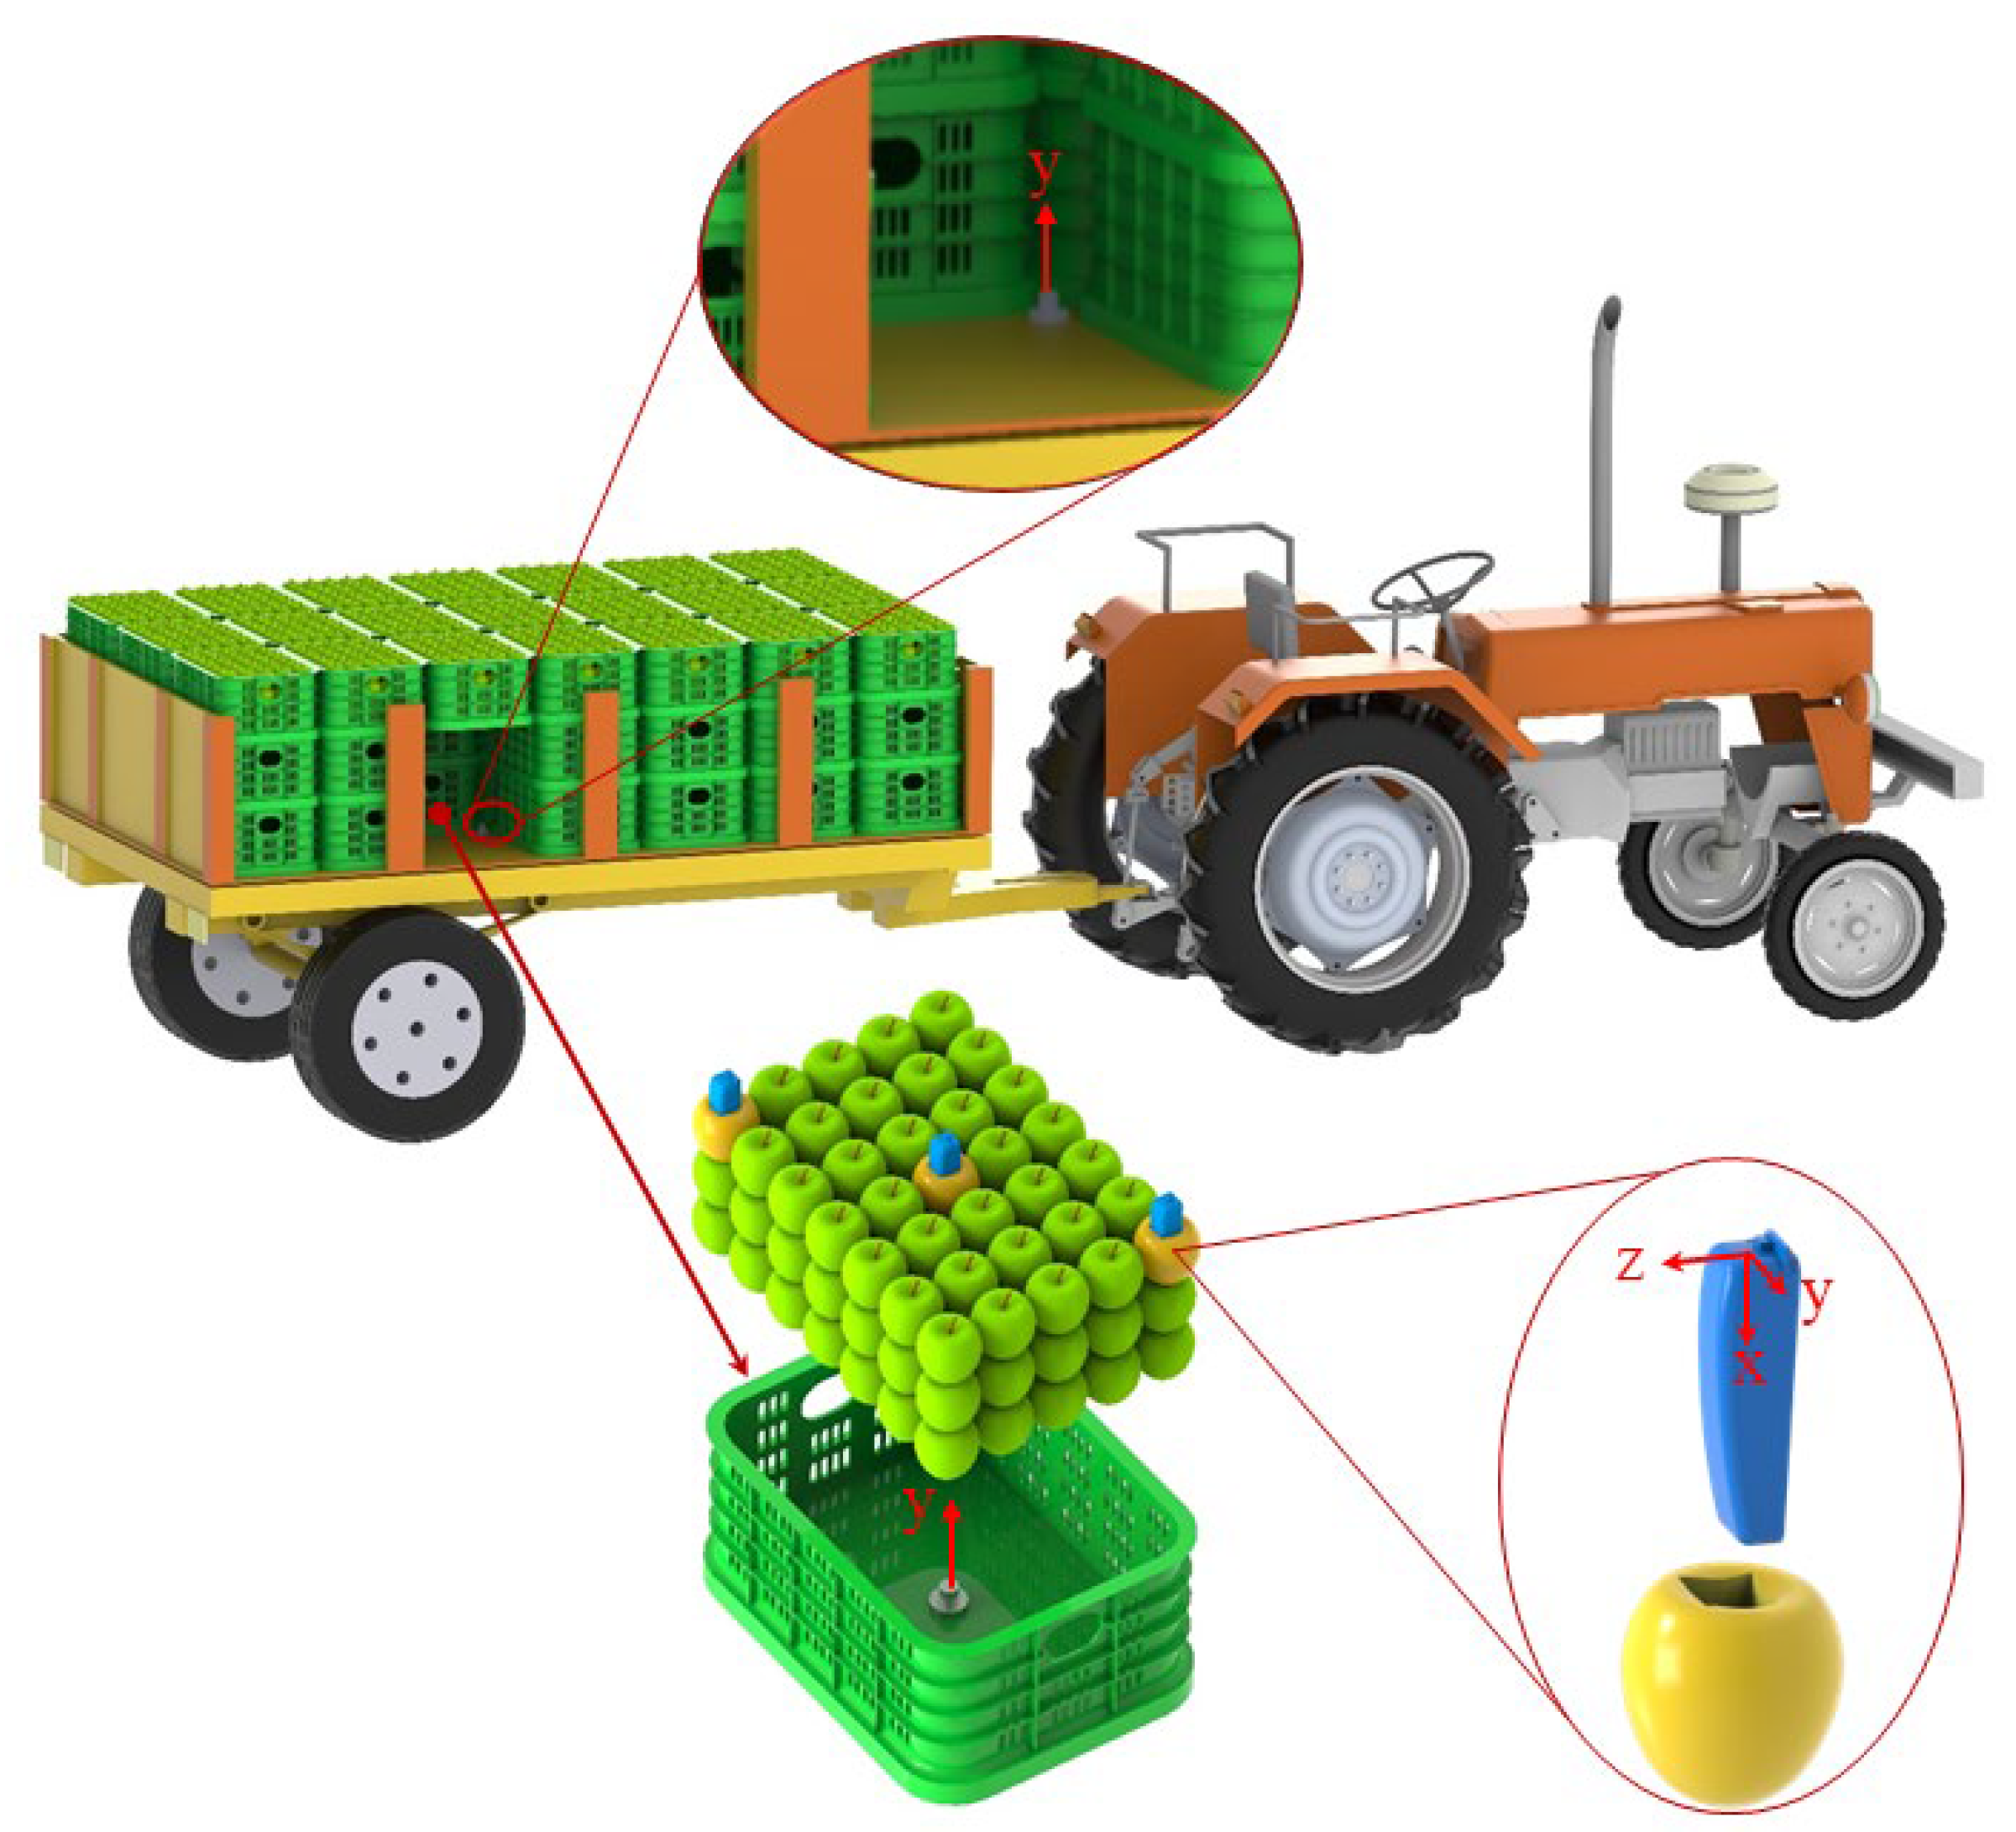
Figure 4.
Vibration amplitude ratio characterization impact test.
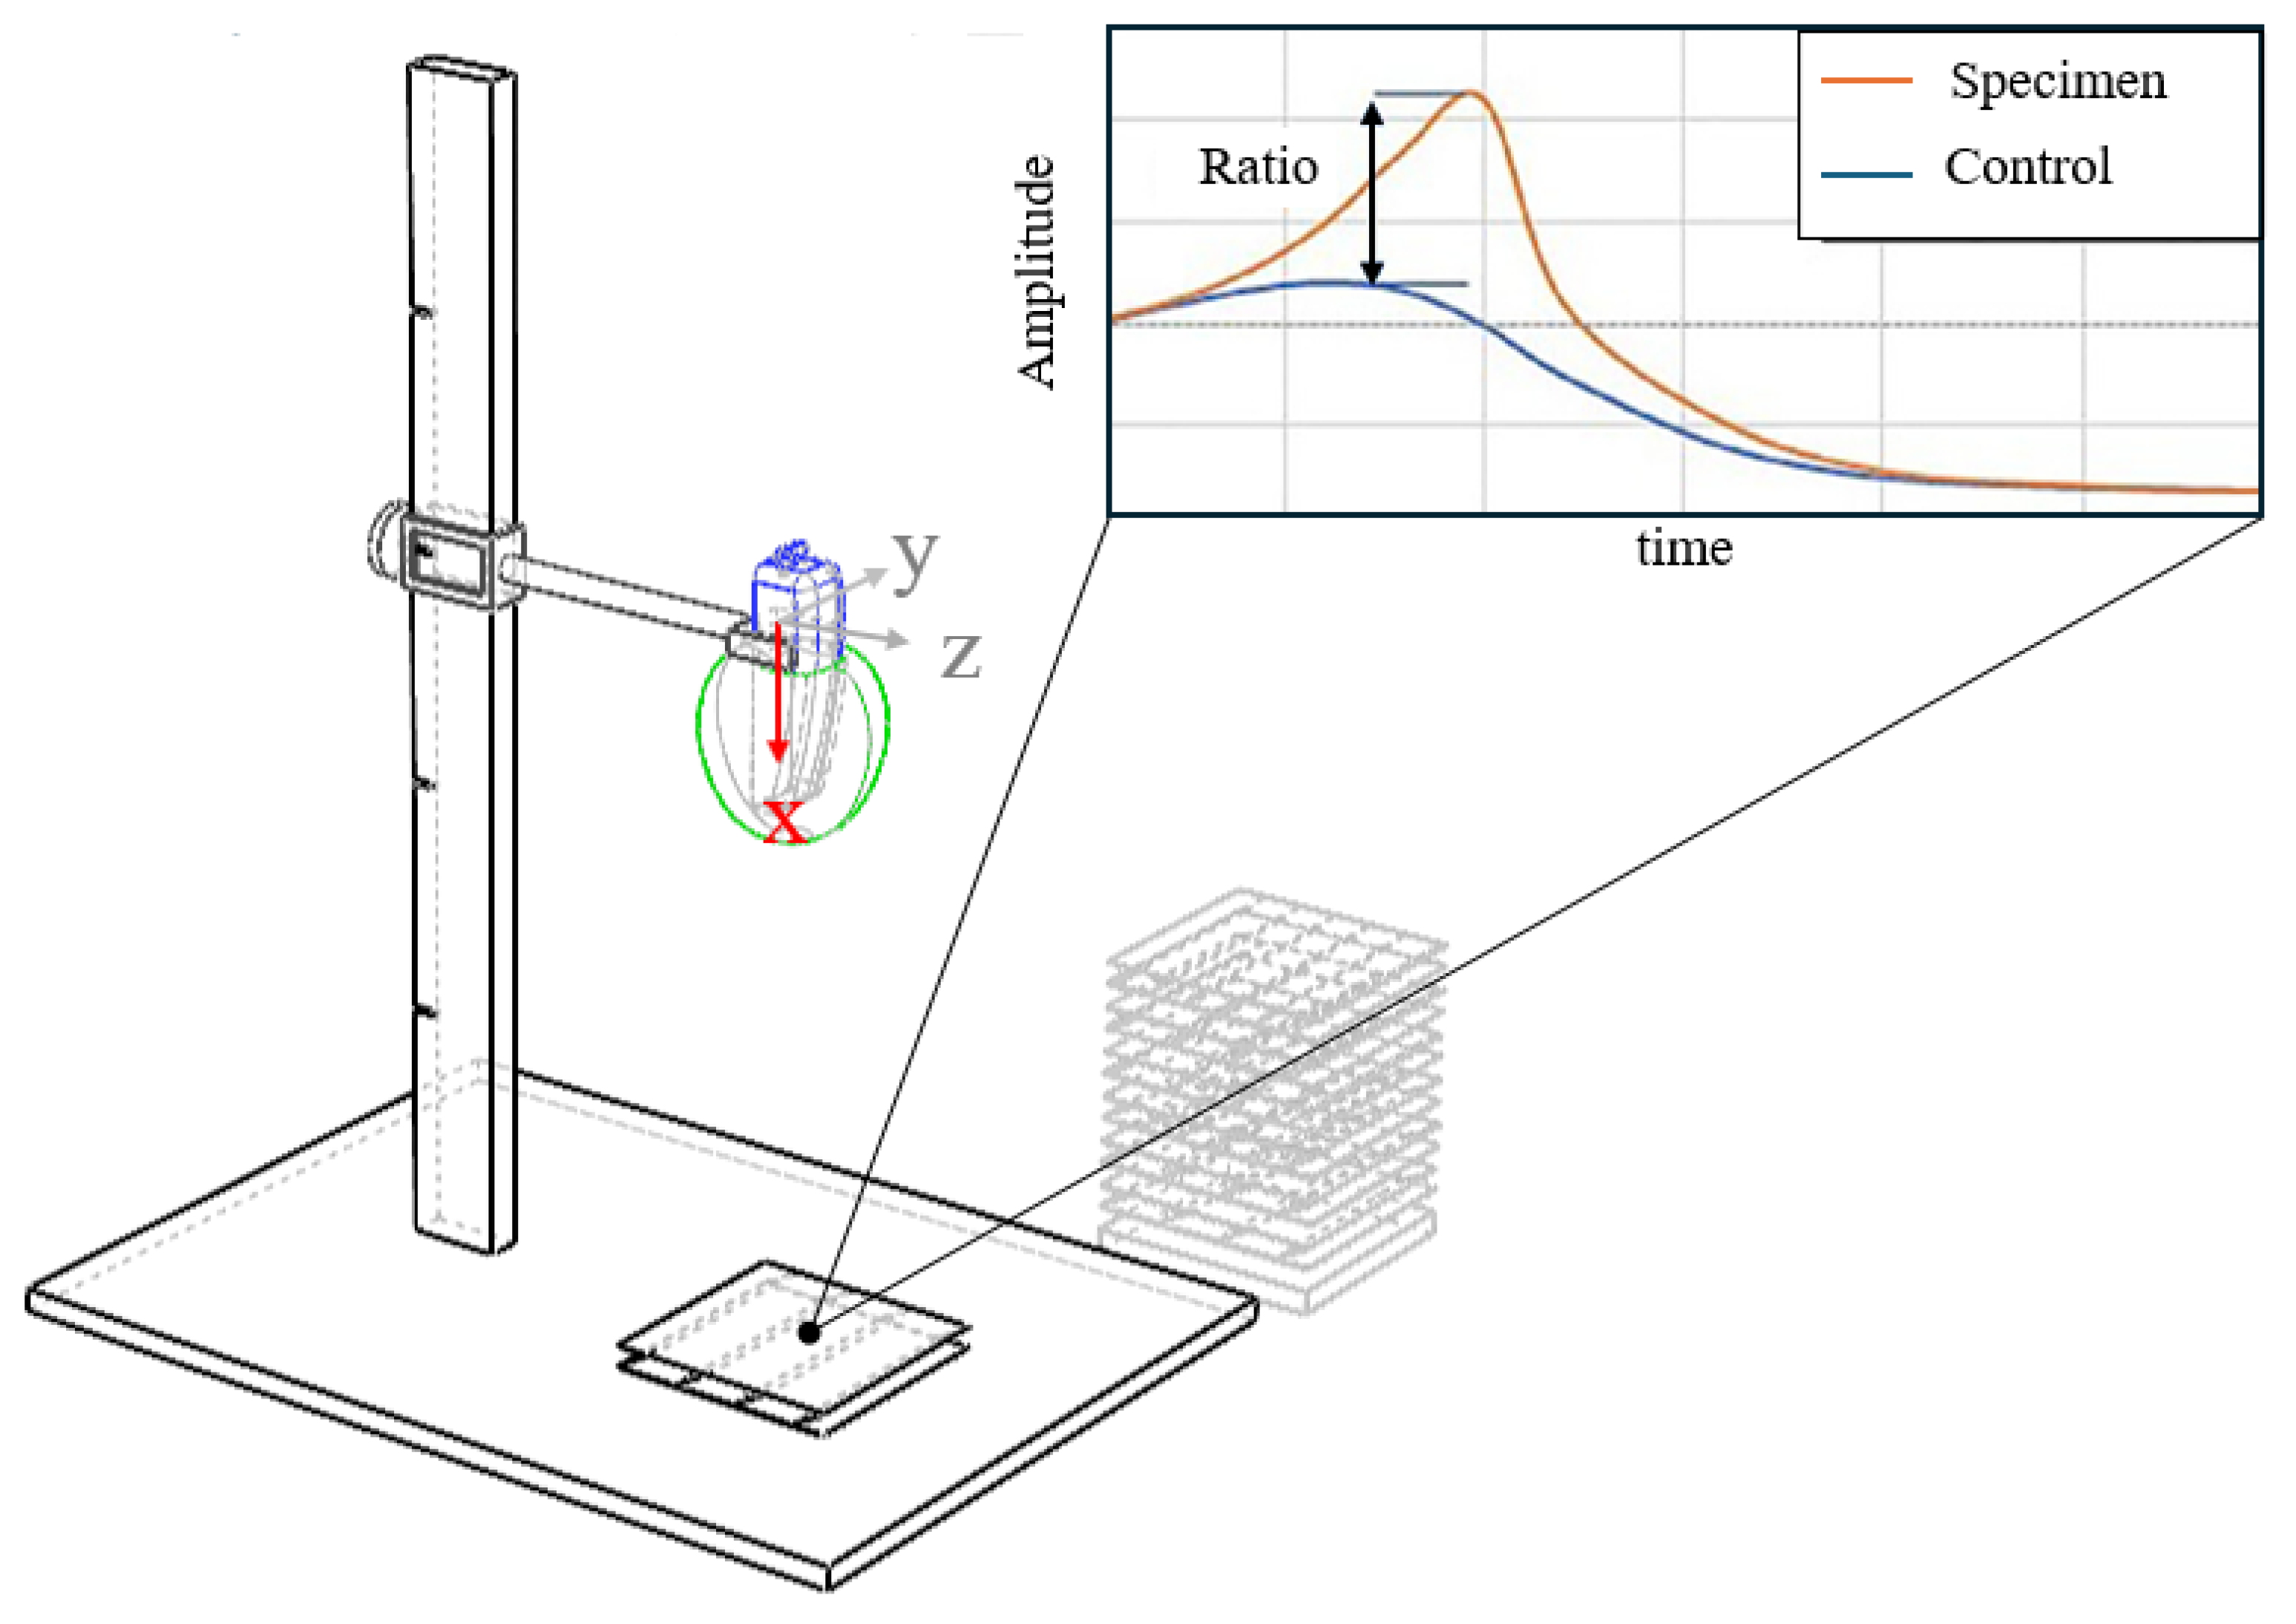
Figure 5.
Laboratory test with the different equipment used (left) and positions of the uniaxial accelerometers (right).
Figure 5.
Laboratory test with the different equipment used (left) and positions of the uniaxial accelerometers (right).

Figure 6.
Temporal response recorded on uniaxial accelerometers in trailer floor and box bottom (up) and signal recorded on a MEMS triaxial accelerometer inserted in an artificial fruit (down).
Figure 6.
Temporal response recorded on uniaxial accelerometers in trailer floor and box bottom (up) and signal recorded on a MEMS triaxial accelerometer inserted in an artificial fruit (down).
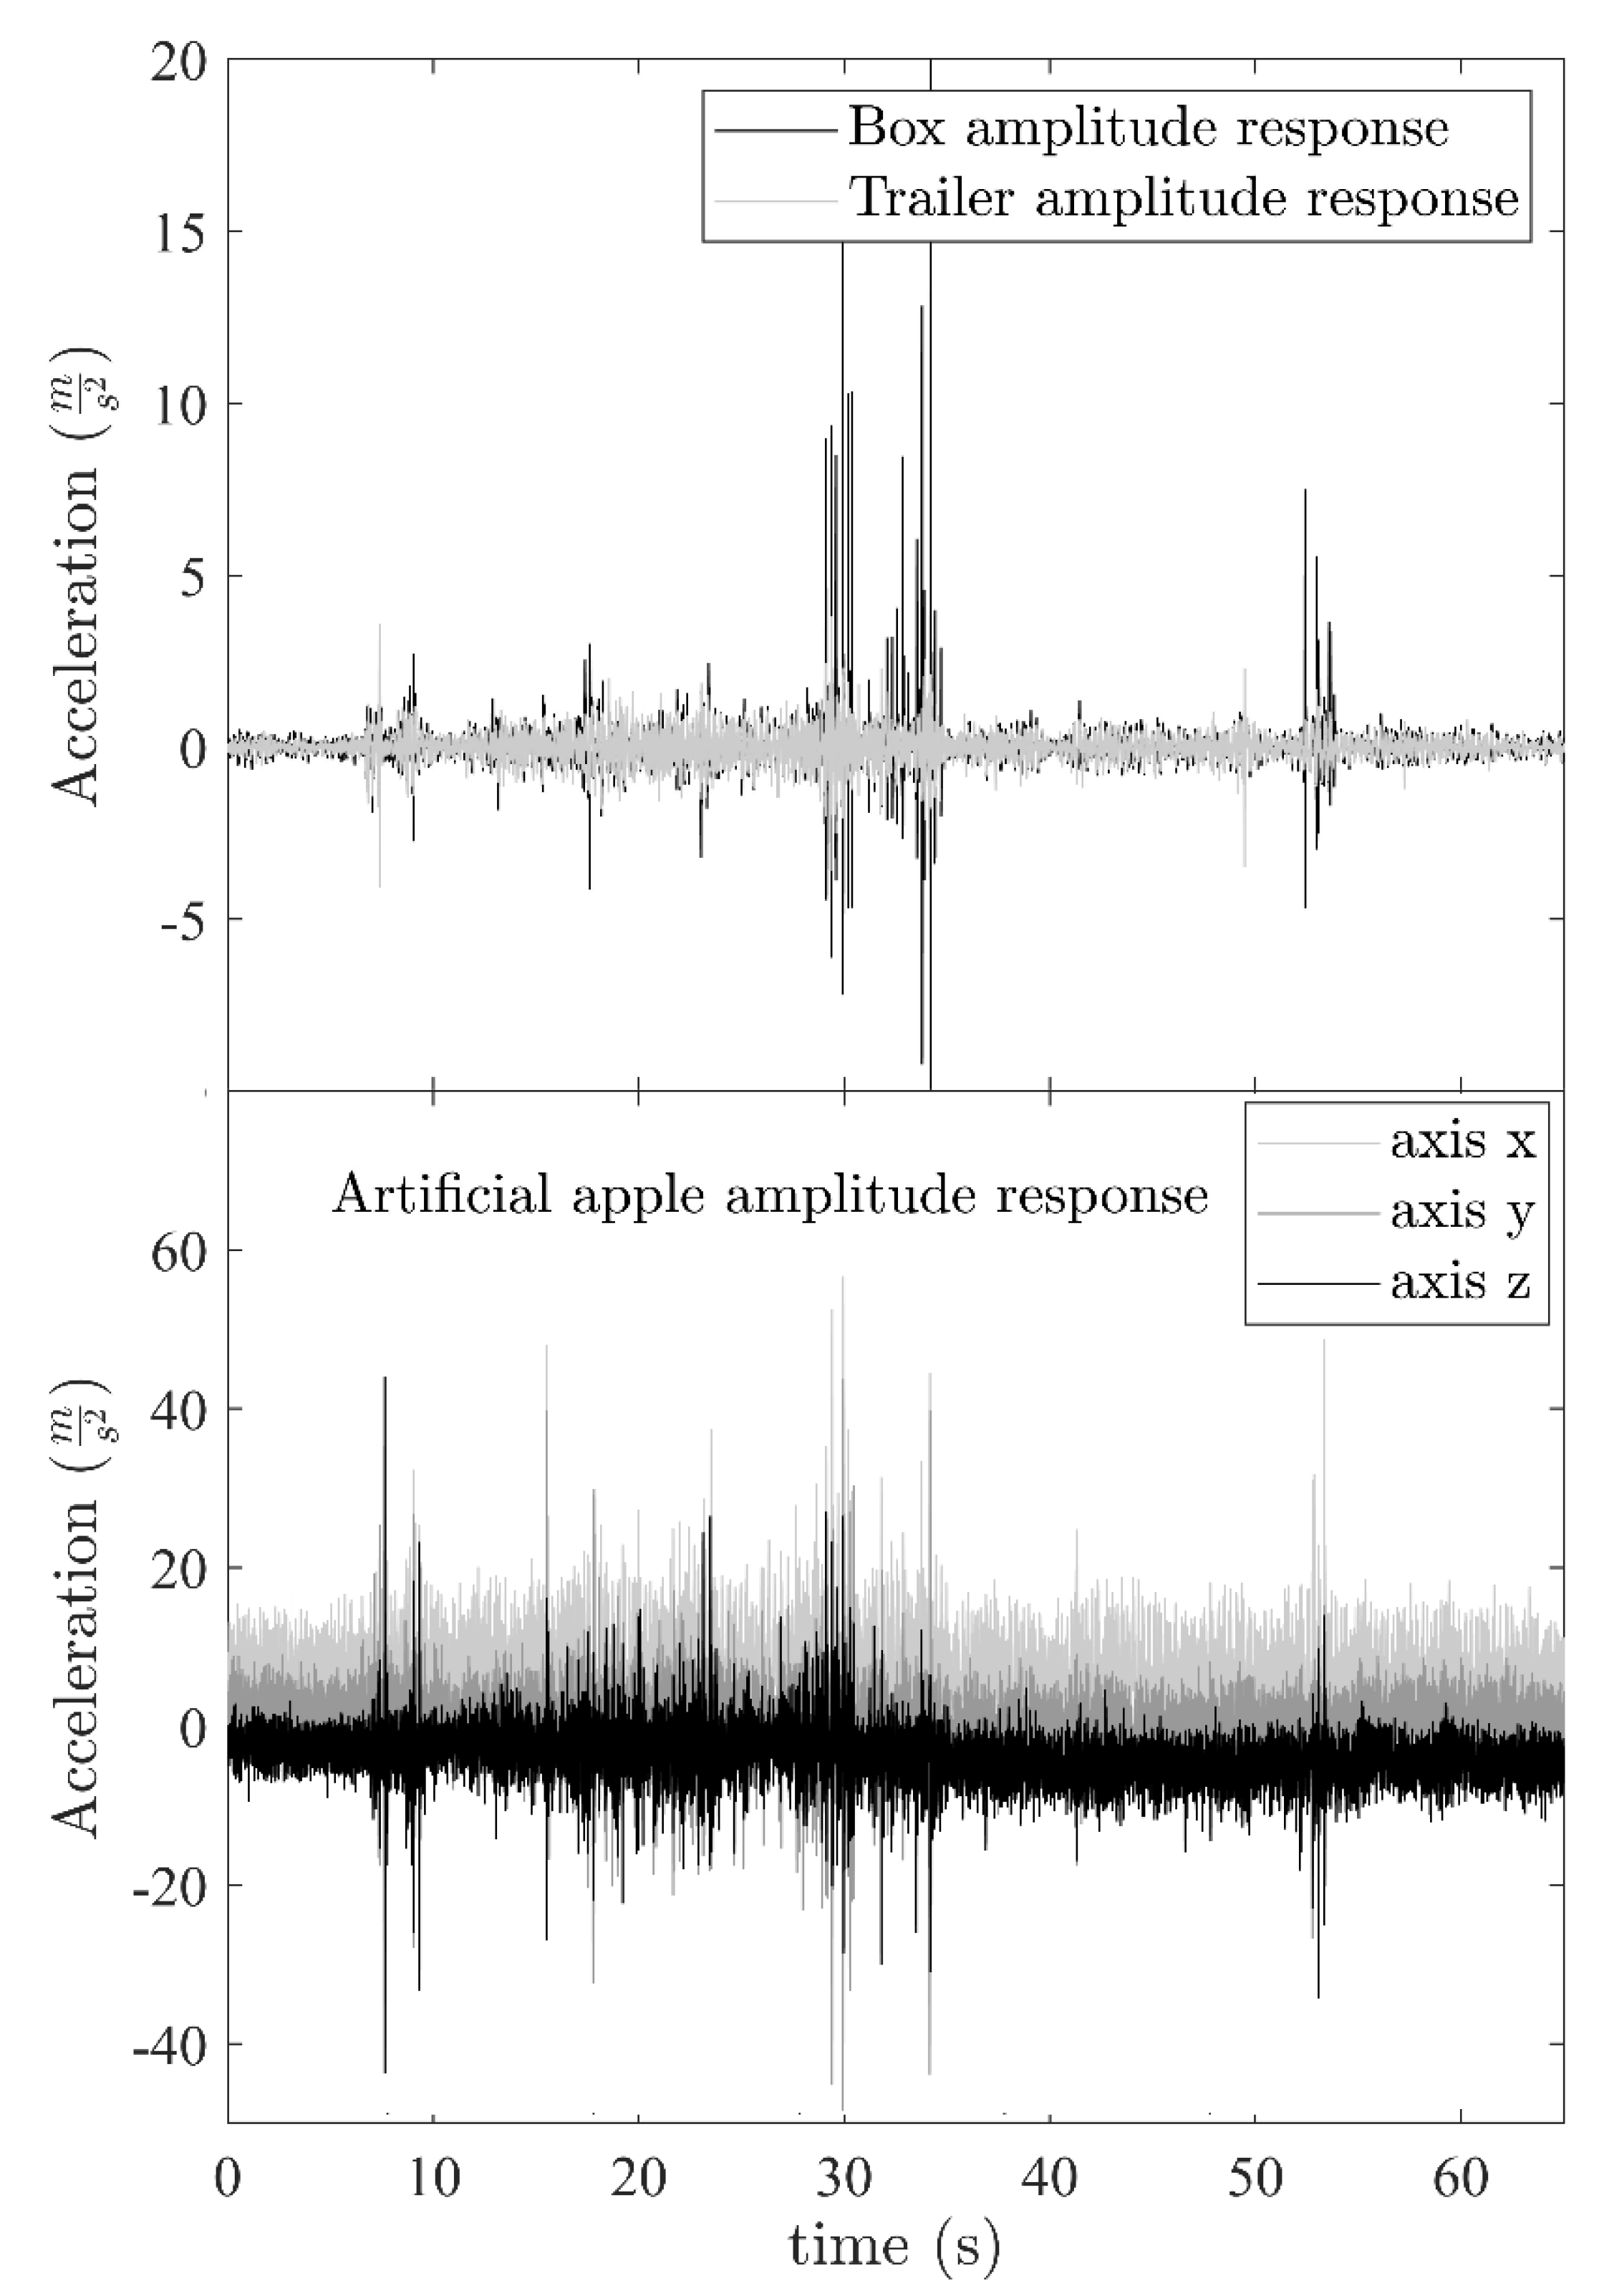
Figure 7.
Frequency response recorded on the trailer floor and inside the fruit box, along with the coherence and spectral offset of both signals.
Figure 7.
Frequency response recorded on the trailer floor and inside the fruit box, along with the coherence and spectral offset of both signals.
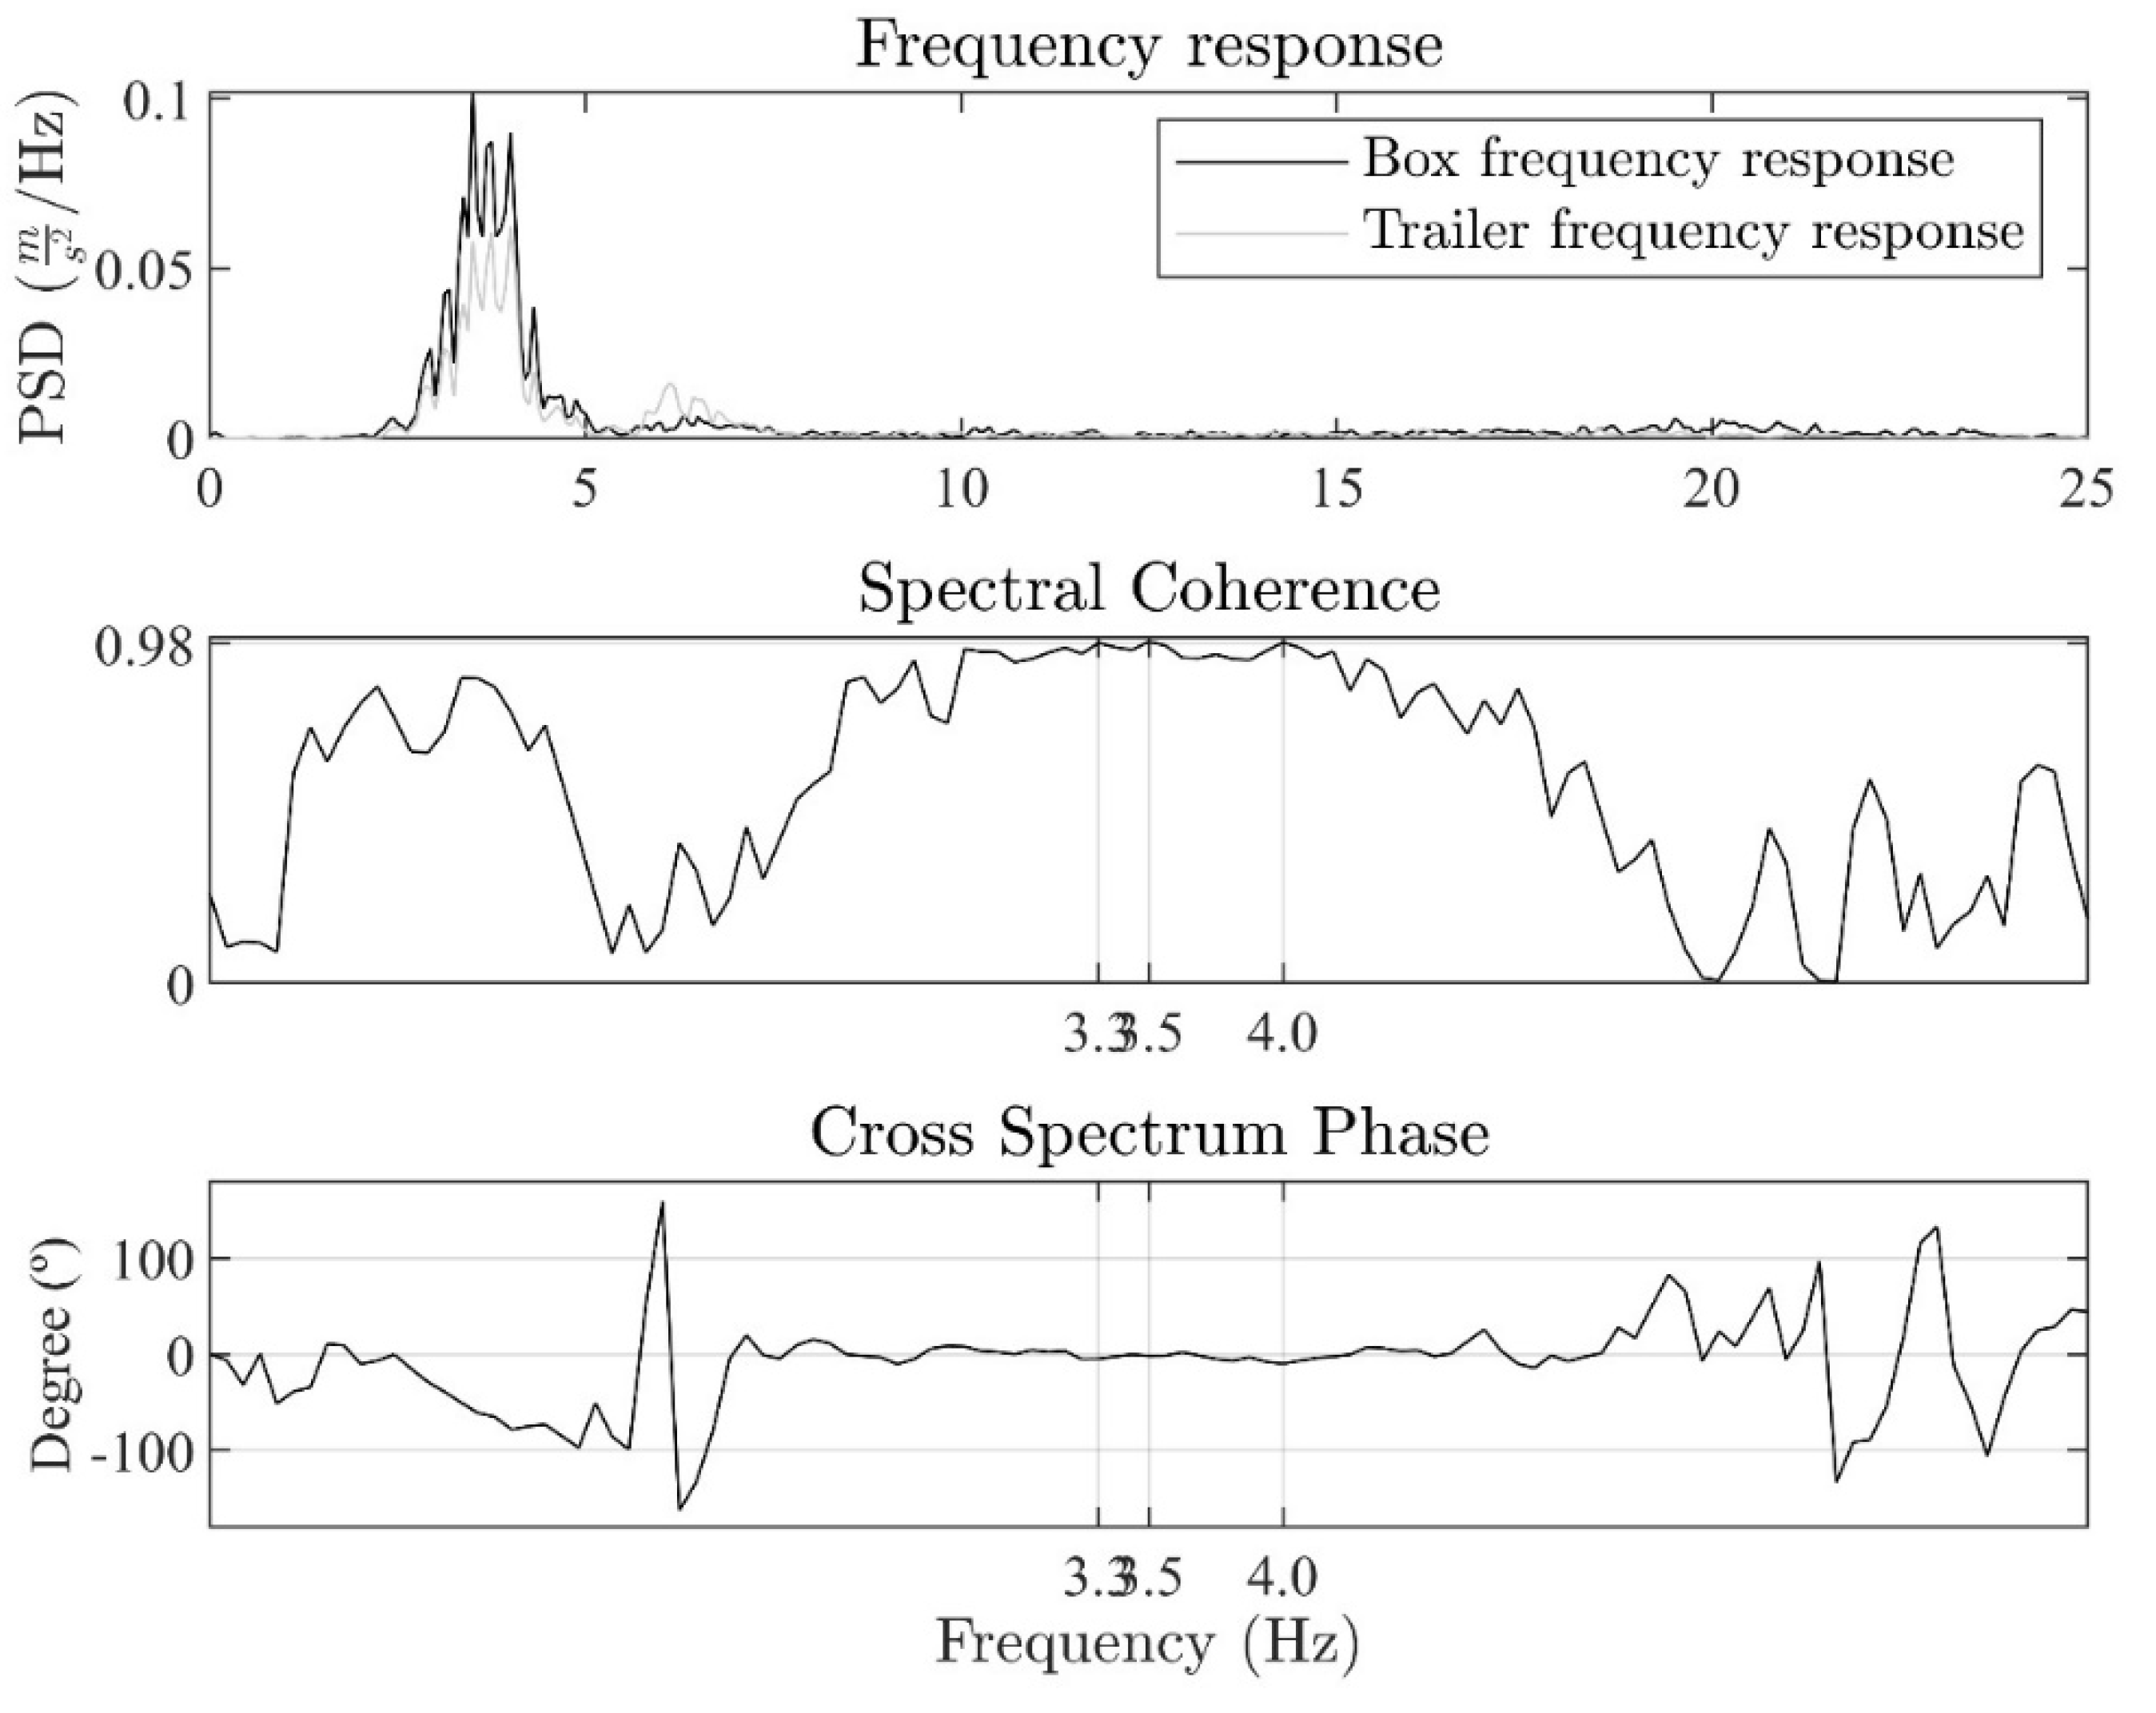
Figure 8.
Vibration amplitude ratio of the different specimens with respect to the control specimen. Differences between letters show significant differences (ANOVA, p < 0.05; post-hoc pairwise Duncan´s t-test with Holm correction, p > 0.05).
Figure 8.
Vibration amplitude ratio of the different specimens with respect to the control specimen. Differences between letters show significant differences (ANOVA, p < 0.05; post-hoc pairwise Duncan´s t-test with Holm correction, p > 0.05).
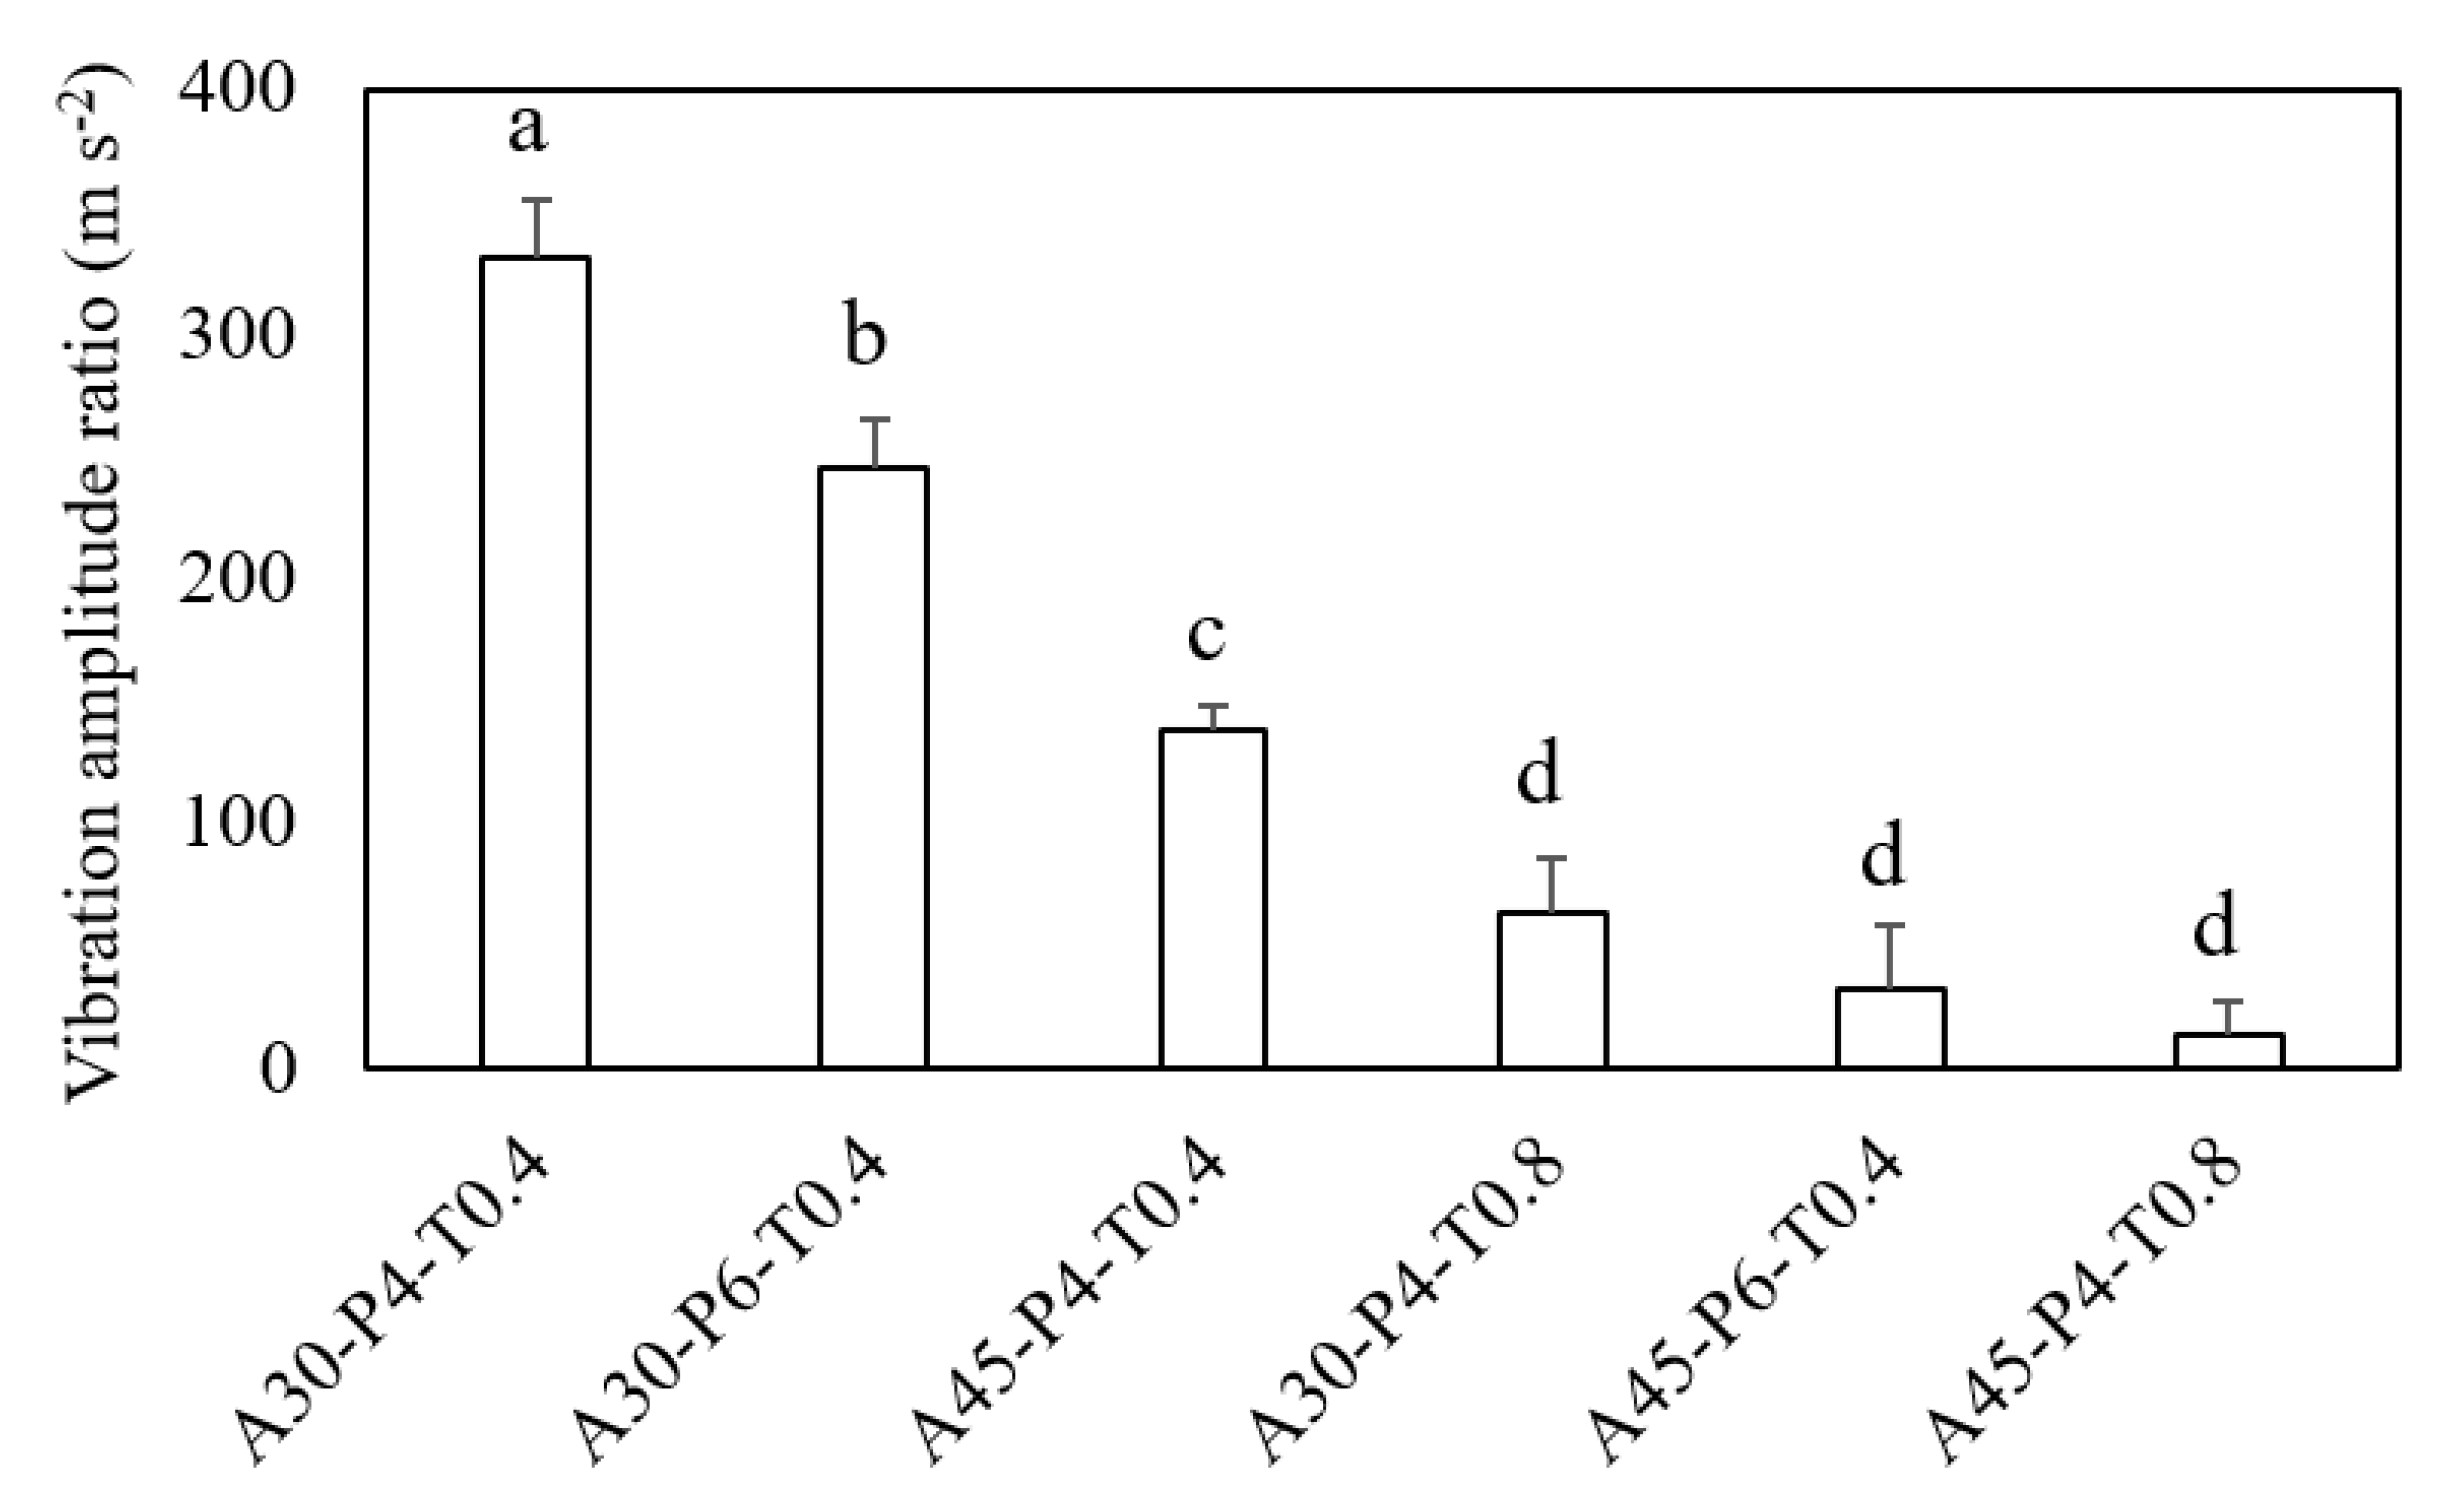
Figure 9.
Plots of ATRANS base-mass vs. sinusoidal test voltage for each of the specimens.
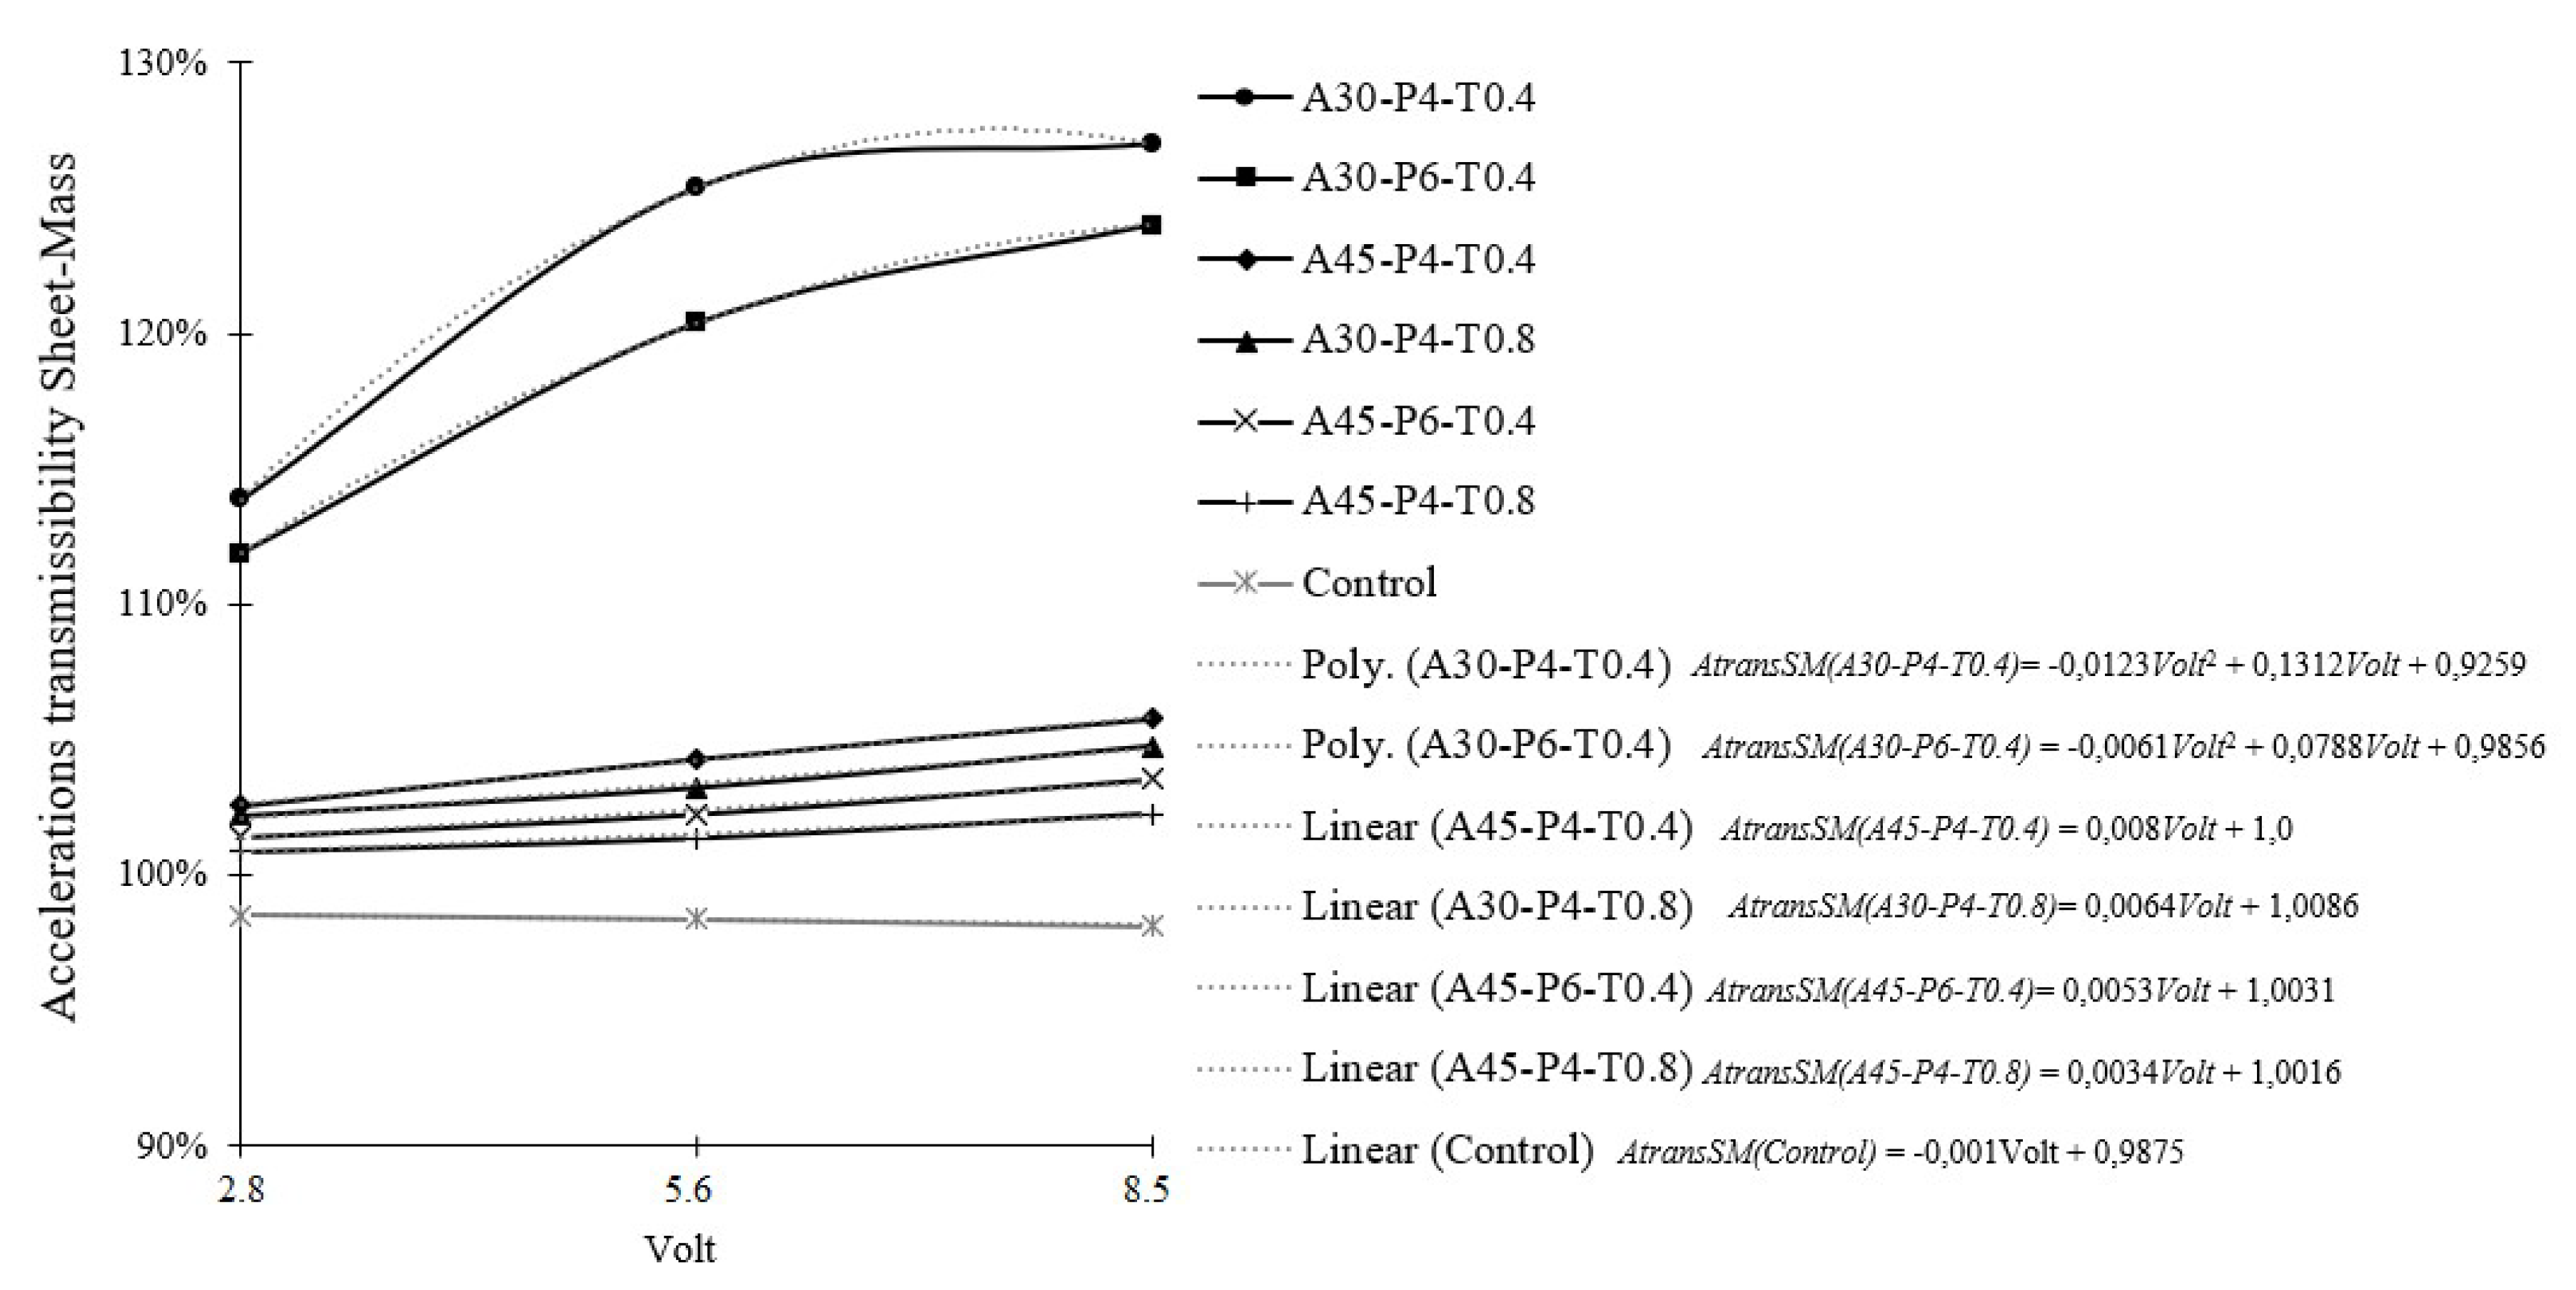
Figure 10.
Acceleration versus time plots of the real signal reproduced in the laboratory for each of the specimens.
Figure 10.
Acceleration versus time plots of the real signal reproduced in the laboratory for each of the specimens.
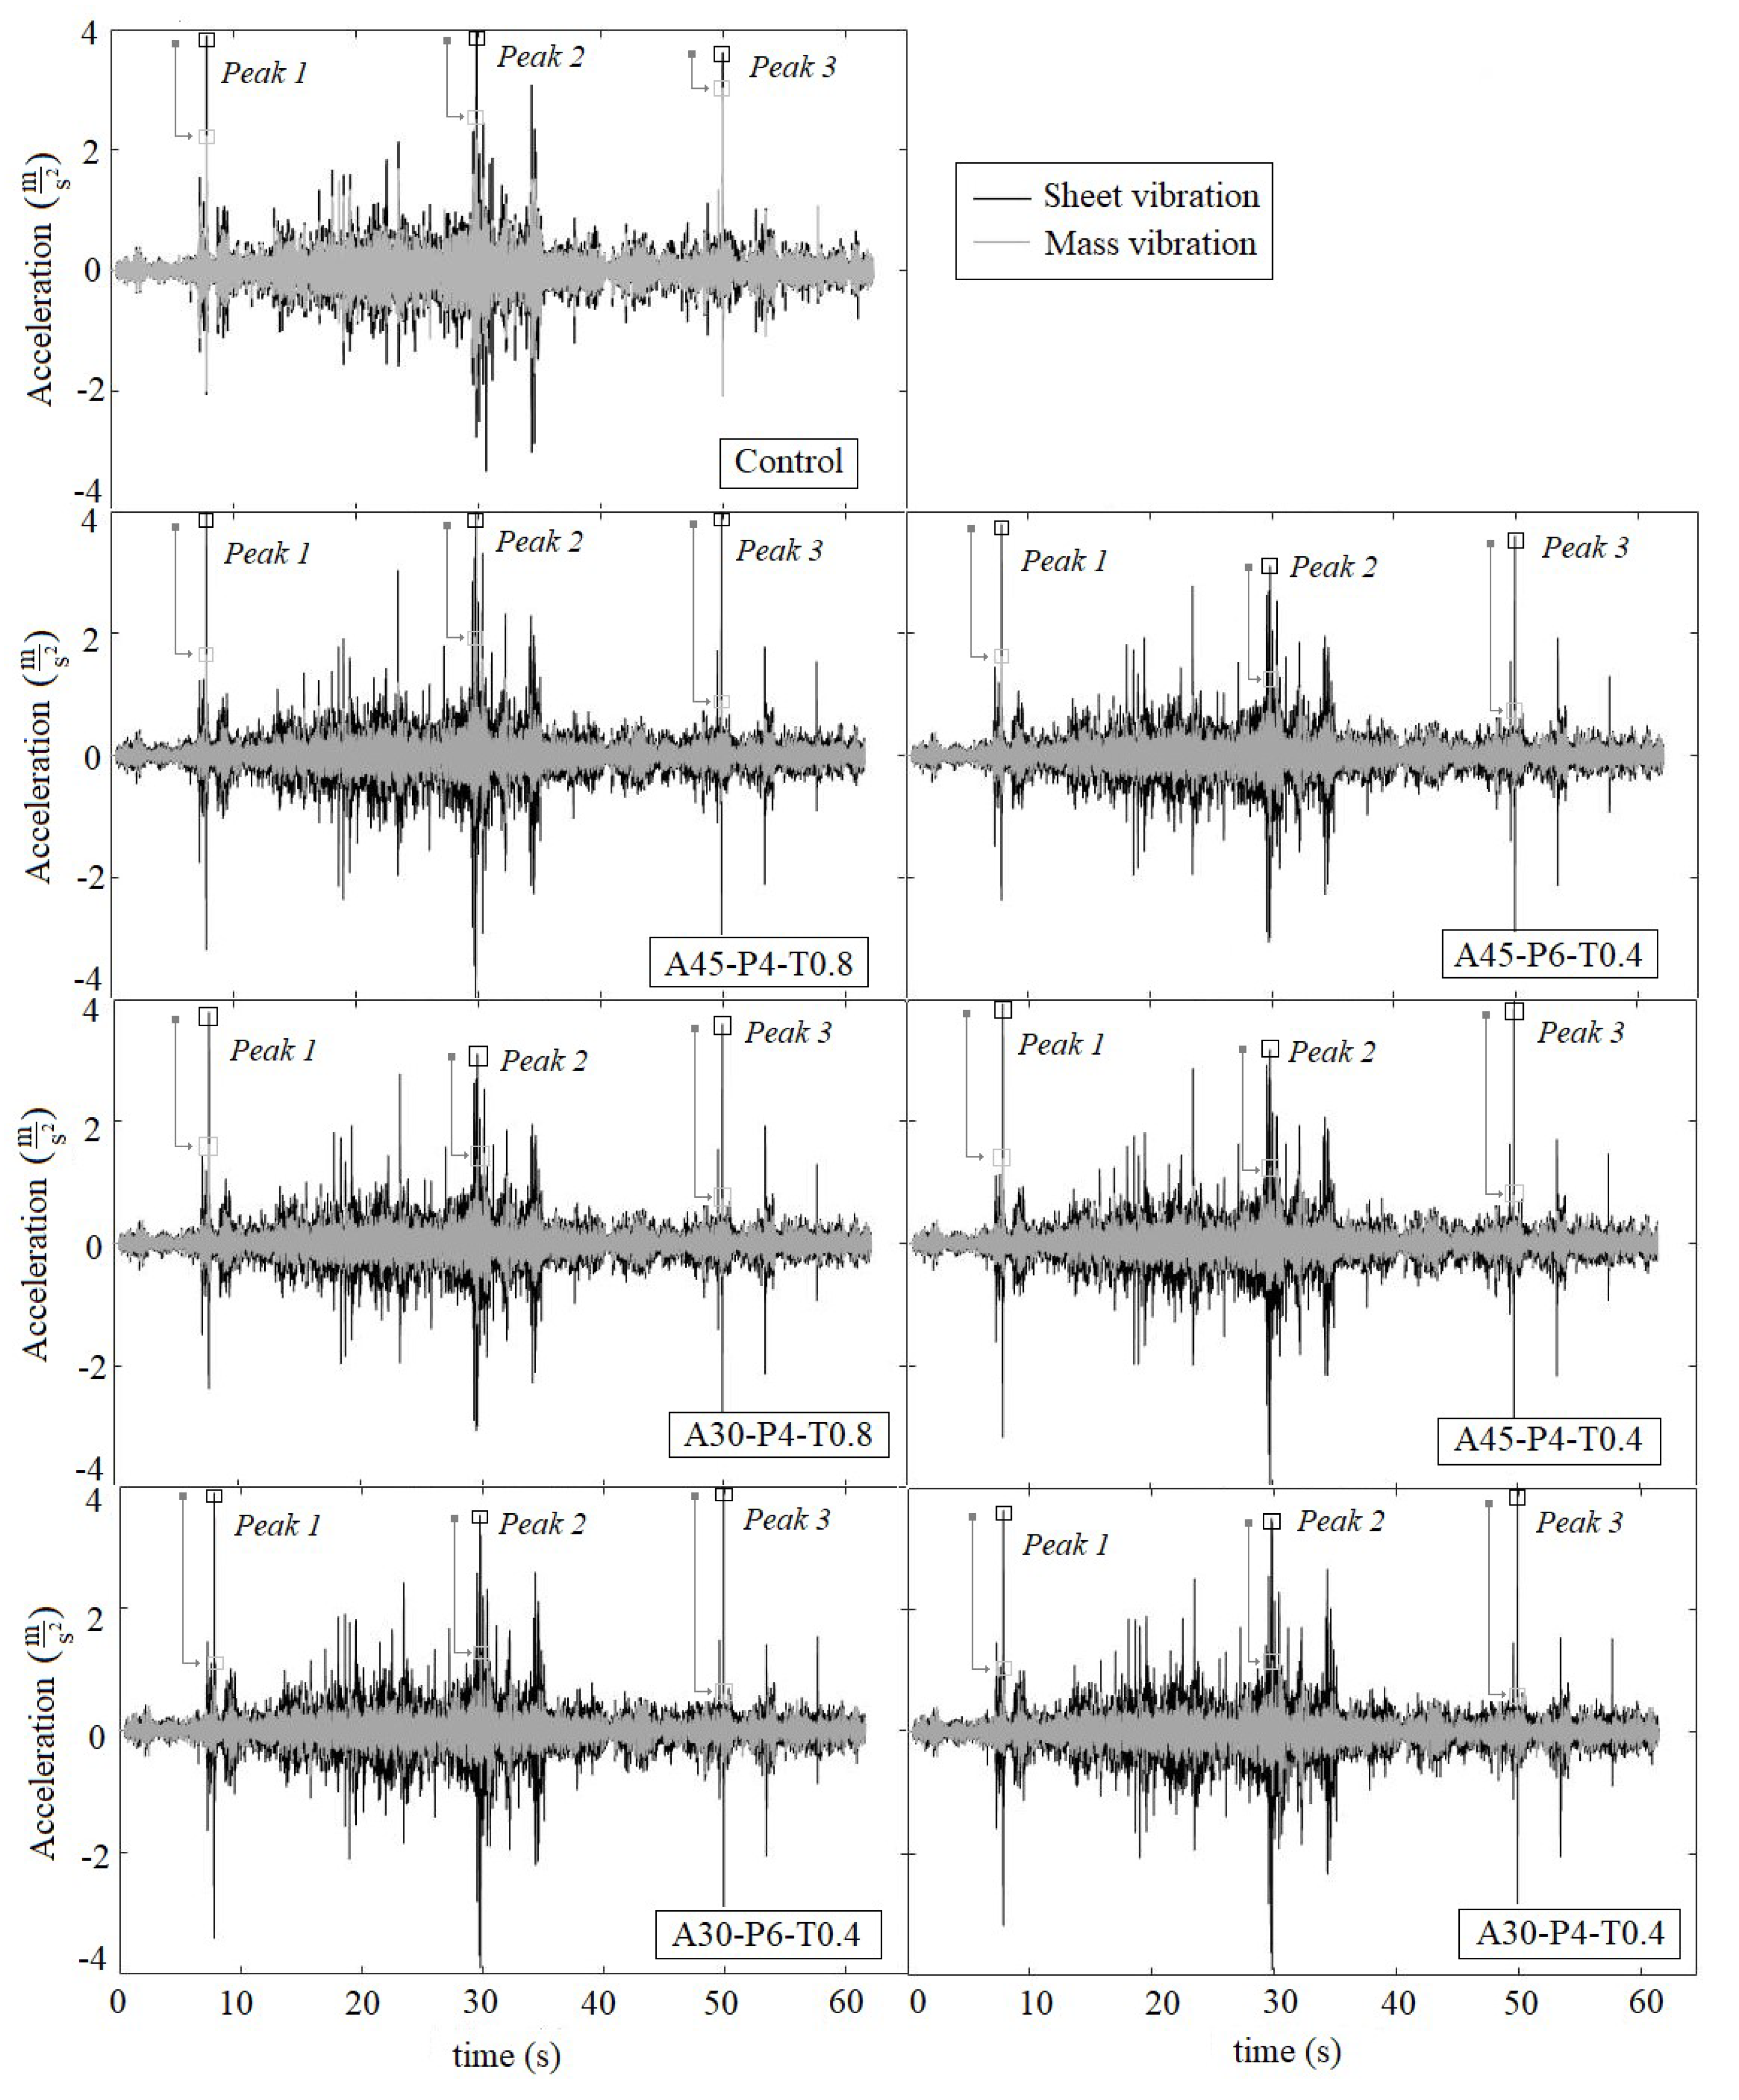

Table 1.
This is a table. Tables should be placed in the main text near to the first time they are cited.
Table 1.
This is a table. Tables should be placed in the main text near to the first time they are cited.
| Gain (V) | ARMS base (ms-2) | ATRANS base-mass (%) | |
|---|---|---|---|
| Control | 2.8 | 0.228(0.022) a | 98.54(0.010) a |
| 5.6 | 0.481(0.002) a | 98.38(0.050) a | |
| 8.5 | 0.697(0.009) a | 98.13(0.030) a | |
| A45-P4-T0.8 | 2.8 | 0.243(0.001) a | 100.90(0.110) b |
| 5.6 | 0.508(0.001) a | 101.38(0.001) b | |
| 8.5 | 0.711(0.003) a | 102.25(0.010) b | |
| A45-P6-T0.4 | 2.8 | 0.253(0.004) a | 101.44(0.060) bc |
| 5.6 | 0.505(0.002) a | 102.27(0.130) bc | |
| 8.5 | 0.717(0.009) a | 103.55(0.250) bc | |
| A30-P4-T0.8 | 2.8 | 0.243(0.002) a | 102.22(0.030) cd |
| 5.6 | 0.493(0.009) a | 103.24(0.220) cd | |
| 8.5 | 0.691(0.002) a | 104.78(0.020) cd | |
| A45-P4-T0.4 | 2.8 | 0.255(0.008) a | 102.56(0.050) d |
| 5.6 | 0.500(0.001) a | 104.30(0.140) d | |
| 8.5 | 0.701(0.004) a | 105.78(0.070) d | |
| A30-P6-T0.4 | 2.8 | 0.251(0.006) a | 111.90(0.280) e |
| 5.6 | 0.490(0.001) a | 120.39(0.30) e | |
| 8.5 | 0.676(0.002) a | 124.02(0.003) e | |
| A30-P4-T0.4 | 2.8 | 0.239(0.007) a | 113.91(0.430) f |
| 5.6 | 0.494(0.003) a | 125.38(0.040) f | |
| 8.5 | 0.696(0.007) a | 126.99(0.030) f |
* Differences between letters in the same column and gain indicate significant differences (ANOVA, p < 0.05, post-hoc pairwise Student’s t-test with Holm correction). Cursive and bold letters between the different gains indicate significant differences.
Table 2.
Vibration parameters obtained according to real signal on peak 1, peak2 and peak 3.
| Peak 1 | Peak 2 | Peak 3 | ||||
| ARMS (ms-2) | ATRANS base-masa (%) * | ARMS (ms-2) | ATRANS base-masa (%) * | ARMS (ms-2) | ATRANS base-masa (%) * | |
| Control | 3.897(0.187) | 57.40(1.210) a | 3.949(0.058) | 63.69(0.630) a | 3.619(0.024) | 83.70(0.160) a |
| A45-P4-T0.8 | 4.167(0.033) | 41.47(2.77) b | 4.179(0.057) | 47.40(0.330) b | 4.01(0.056) | 22.96(0.590) b |
| A45-P6-T0.4 | 3.791(0.001) | 43.08(0.130) bc | 3.119(0.016) | 44.41(0.160) c | 3.598(0.000) | 20.38(0.030) c |
| A30-P4-T0.8 | 3.922(0.031) | 37.00(0.33) cd | 3.484(0.003) | 42.45(0.080) d | 4.031(0.002) | 22.34(0.360) b |
| A45-P4-T0.4 | 3.903(0.036) | 35.93(0.490) d | 3.07(0.042) | 40.78(0.380) e | 3.867(0.010) | 20.62(0.030) c |
| A30-P6-T0.4 | 3.868(0.041) | 19.13(0.090) e | 3.529(0.002) | 34.67(0.140) f | 4.099(0.015) | 14.36(0.600) d |
| A30-P4-T0.4 | 3.709(0.028) | 19.68(0.140) e | 3.523(0.012) | 33.36(0.140) g | 4.071(0.001) | 13.27(0.020) d |
* Differences between letters in the same column indicate significant differences (ANOVA, p < 0.05, post-hoc pairwise Student’s t-test with Holm correction).
Disclaimer/Publisher’s Note: The statements, opinions and data contained in all publications are solely those of the individual author(s) and contributor(s) and not of MDPI and/or the editor(s). MDPI and/or the editor(s) disclaim responsibility for any injury to people or property resulting from any ideas, methods, instructions or products referred to in the content. |
© 2024 by the authors. Licensee MDPI, Basel, Switzerland. This article is an open access article distributed under the terms and conditions of the Creative Commons Attribution (CC BY) license (http://creativecommons.org/licenses/by/4.0/).
Copyright: This open access article is published under a Creative Commons CC BY 4.0 license, which permit the free download, distribution, and reuse, provided that the author and preprint are cited in any reuse.


