
Submitted:
04 December 2024
Posted:
05 December 2024
You are already at the latest version
Abstract
The growing interest in sustainable materials has shifted focus toward the use of natural fibers in composite structures as potential substitutes for synthetic fibers. In this study, the bending properties of conventional sandwich structures are compared with alternative designs that incorporate natural fibers and 3D-printed sandwich cores. The mechanical properties of sandwich structures composed of glass fiber with a traditional core and flax fiber with both conventional and 3D-printed cores were evaluated through 3-point bending tests (EN 310) and density profile analysis. Results indicate that the 3D-printed core structure achieved an average modulus of elasticity of 2271 MPa and a bending strength of 30.9 MPa, alongside a lower density profile than conventional materials. However, natural fibers may reduce the saturation quality of foam cores compared to glass fibers. These findings confirm that 3D-printed cores present a competitive alternative for applications requiring precisely engineered structures, with particular promise in sustainable material development.
Keywords:
glass fiber
; flax fiber
; 3D printed core
; polyvinylchloride foam
; balsa wood
; density profile
; bending strength
1. Introduction
The swift progression of technological advancements, combined with an escalating societal emphasis on sustainable living, is increasingly shaping industry practices. This paradigm shift is equally evident within the domain of composite materials in engineering and construction. Whereas the past decade was characterized by the utilization of lightweight carbon fiber composite structures, projections for the forthcoming decade indicate a significant movement towards the recycling of composite materials and the development of products derived from sustainable or bio-based resources [1]. The global market value of the composite materials sector is estimated to range between $90 and $123 trillion, contingent upon the data source. Projected growth for this sector is anticipated to reach an annual rate of 8.2% over the period from 2022 to 2027 [2]. Alternative sources offer a more conservative estimate, projecting sector growth at 7.2%. Nonetheless, experts concur that recyclable composite materials and bio-based alternatives are poised to play a pivotal role in replacing traditional composite and non-composite materials in the years to come [3,4].
1.1. Economic Indicators of the Sector
Data indicate that from 2000 to 2023, production of all types of reinforcement composite materials has increased. Glass fiber remains the dominant material, comprising 77% of total fiber production in 2023, followed by carbon fiber at 18%. Other fibers, including aramid, account for 2%, while natural fibers represent 4% of total fiber production in 2023 [5]. For the purpose of comparison, it is significant to observe that the total volume of fiber production reached 12 million tons in 2021, subsequently rising to 13 million tons by 2023 [6].
Composite materials are predominantly utilized across key industry sectors, including aerospace, mobility, construction, wind energy, and maritime industries. Scholarly estimates project the Compound Annual Growth Rate (CAGR) from 2023 to 2028 to be highest in the aerospace sector at 7%, followed by the energy, transportation, and consumer goods sectors at 5%, and the construction sector at 2%. Within the field of structural materials, composite materials exhibit considerable growth potential. Although their current production volume remains lower than that of traditional materials, this disparity highlights significant untapped potential that could be leveraged through ongoing technological advancements [4,6].
1.2. Fibers
As previously indicated, it is noteworthy that glass fiber remains the most commonly produced type of fiber [7]. Glass fibers provide an optimal balance between mechanical properties and cost-effectiveness. The modulus of elasticity for glass fibers ranges from 72 GPa to 85 GPa, with specific values dependent on the type of glass fiber and the manufacturing process employed [8]. Despite their advantageous properties, the production process of glass fibers presents notable challenges. The manufacturing process involves several critical stages, each contributing to the overall complexity of production. First, the batching stage involves combining base ingredients, primarily forms of silica, including sand, limestone, stone ash, and borax. This mixture is then subjected to melting, where it is transferred to a natural gas-fired furnace and heated to approximately 1400 °C, resulting in a molten state.
Following this, the fibrillation stage occurs, in which the molten glass is forced through superfine nozzles to create glass filaments. These filaments are exceptionally thin, often measured in microns. The fibers are then coated with a chemical solution in the coating stage. Known as "sizing," this coating protects the fibers from damage, enables easier handling, and ensures compatibility with resin systems used in subsequent processing stages. Finally, in the drying and packaging stage, the fibers are dried, gathered, and wound into packages, making them ready for shipment to customers.
This multi-step process, particularly the high-temperature melting and precise fibrillation stages, underscores the complexity and energy-intensive nature of glass fiber production, which remains a key limitation despite the material’s favorable balance between mechanical properties and cost [9,10]. The complexity of fiber production contributes substantially to the high energy consumption and CO₂ emissions associated with glass fiber manufacturing. These factors, both critical in assessing environmental impact, represent significant disadvantages of glass fibers, particularly when compared to their natural fiber counterparts [11,12].
1.3. Resins
In the domain of matrices used in composite materials, the focus is primarily directed towards two categories of resins: thermoplastic and thermoset. Thermoplastic resins are widely applied in the aerospace and automotive sectors, with prominent representatives including Polypropylene (PP), Polyamide (PA), and Polyethylene (PE). These materials offer numerous advantages, such as high resistance, lightweight properties, affordability, and ease of handling. However, thermoplastics also have notable limitations, including a relatively low melting point and limited resistance to organic and polar solvents. Additionally, they are prone to permanent deformation and structural failure when subjected to continuous stress, such as cyclic loading or masticatory forces [13].
Thermoset resins are among the most extensively utilized systems in industries such as marine, construction, wind energy, aerospace, and consumer goods, including sports equipment. Key representatives of this category include polyesters, vinyl esters, epoxies, and phenolics. Similar to thermoplastics, thermosets are selected across these sectors based on their advantageous mechanical, physical, and technological properties [14].
Polyester and vinyl ester systems are commonly selected for applications where lower mechanical properties, high production volumes, or cost-efficiency are primary considerations. Conversely, phenolic and epoxy resin systems offer superior mechanical properties but are associated with higher acquisition costs. For these high-performance systems, fibers with enhanced mechanical characteristics, such as carbon or aramid, are often utilized [15]. The most commonly used types for manufacturing epoxy systems are alkaline polycondensation products of epichlorohydrin and bisphenol A. The molecular ratios of these individual components directly affect the molecular weight, thereby influencing the performance properties of the resulting epoxy systems [16].
The chemical reaction between the resin and hardener forms chemical bonds among individual molecules, resulting in a spatial network of bonds—referred to as epoxy bonds—formed through various mechanisms, such as the polymerization of epoxy groups, polyaddition of compounds with active hydrogen, or polycondensation of hydroxyl groups. In recent years, the term 'bio-based epoxy resins' has gained traction, referring to epoxy resins that incorporate bio-based components (e.g., natural waste materials) or are entirely derived from recycled feedstock. This shift is largely driven by the aim to reduce the environmental impact of resin production. Common sources for these bio-based resins include vegetable oils, lignin from wood products, tannins, and rosins. Additional components may include saccharides, terpenes, cardanols, and syringaresinol, the latter being a naturally occurring, non-endocrine-disrupting bisphenol found in Magnolia trees [17]. The primary objective of these materials is to partially replace petrochemical-based components. Currently, most commercially available bio-based epoxy resins incorporate bio-based content within the range of 25–50% [16].
The literature suggests that, in developing these resins, it is essential to balance the proportion of bio-based components with the desired mechanical and technological properties of the final product [18].
1.4. Natural Fibers
Natural fibers, much like bio-based resins, are attracting increasing interest within the professional community. Research indicates that natural fibers can, to some extent, compete with conventional glass fibers [11,19]. A notable advantage of these materials is their reduced environmental impact; their natural origin contributes to a lower carbon footprint in composite products through more sustainable sourcing and processing practices. Flax fibers, in particular, offer additional advantages, including the potential for cultivation across various regions of Europe [20]. However, natural fibers also present challenges, such as a wider dispersion of mechanical properties and higher moisture absorption. The modulus of elasticity for the most widely used flax fiber currently stands at 52.47 ± 8.57 GPa [10,21]. Common natural fibers include flax, cotton, hemp, jute, sisal, coir, and bamboo, with basalt fiber also emerging as a noteworthy alternative [22,23]. Numerous studies have demonstrated the potential of natural fibers in bio-composite structures, especially with regard to compliance with fire safety standards such as EN 45545 [24]. Additionally, several investigations explore the use of natural fibers like flax or basalt in bio-based sandwich constructions, substituting recycled PET foams for conventional PVC as a more sustainable alternative [25].
1.5. Core Materials
Core materials are widely used in composite applications across various industries, including marine, aerospace, and construction. Their primary application is in structures subjected to high mechanical stress, where durability and strength are paramount. A broad range of core material types allows for optimization tailored to specific structural requirements [26,27]. For instance, honeycomb cores are available in cellulose-based materials, suitable for moderate stress applications, as well as in polymer-based honeycombs for structures that demand higher strength and durability. Prominent among core materials in this sector are cellular foams, which are frequently used in composites reinforced with glass fibers and thermosetting resins [28].
In recent years, cellular foam composites have expanded into the energy sector, notably in wind turbine blade manufacturing, and are also widely used in the marine industry, forming the primary hull structures of recreational watercraft. Key types of cellular foam materials include PVC, PET, and PUR. These foams are manufactured through a controlled foaming process, where Polyvinyl Chloride (PVC) and Polyurea are combined with a foaming agent. The resulting product is typically shaped into slabs or blocks of constant thickness, ready for further processing. Heat forming is often required to produce consistent thickness and density, and these foams can be shaped using CNC machining or manual methods. For high-volume applications, injection molding can be used to produce foam cores, which serve as prefabricated parts for composite manufacturing [29]. A notable advantage of cellular foam materials is the extensive range of available thicknesses, formats, and densities. The density of the foam directly influences both its mechanical properties and the technological processes involved in its application. Specifically, lower density and higher porosity foams are prone to increased resin absorption, which can impact both structural integrity and processing requirements [30].
1.6. Balsa Core
The pursuit of environmentally responsible composite production has led to exploration of basswood as a potential substitute for synthetic foam materials. Balsa (Ochroma pyramidale), a tropical tree species primarily native to South America, emerges as a promising alternative due to its low density (50–350 kg/m³) and rapid growth rate [31,32]. The substantial variation in density can be attributed to the specific climatic conditions of the growth region. In the foreseeable future, demand for balsa as a core material in sandwich constructions is expected to increase. Balsa cores are predominantly supplied in the form of board material, produced through a process in which individual balsa prisms are bonded together—typically using PVA glue—to form blocks, which are then cut perpendicular to the grain. Due to the natural variability in wood density, balsa boards are generally classified into three density categories: 80–120 kg/m³, 120–180 kg/m³, and 180 kg/m³ and above. However, a significant drawback of these materials is the inconsistency in density even within classified groups. Consequently, a single prism of lower density can potentially determine the maximum mechanical properties of the slab, thus impacting the material's uniformity and predictability in performance [33].
1.7. Additive Manufacturing – 3D Printing
The 3D printing technologies have advanced significantly in recent years. This progress is evident not only in small devices for home use but also in professional industrial systems, which have become increasingly accessible and offer a broader range of applications [34,35]. Alongside hardware development, the variety and sophistication of printing materials have expanded considerably.
Additionally, advancements are reflected in the scaling of 3D printing equipment, with contemporary 3D centers now featuring complex setups, such as robotic arms for both printing and surface finishing [36]. A major challenge within additive manufacturing remains the integration of cellular foams with 3D printing technologies. This study delves into the intricacies and innovations involved in producing foam materials through additive manufacturing processes [37]. In the field of composite manufacturing, 3D printing, or additive manufacturing, is widely used for model making, rapid prototyping, and mold production for final products, with Fused Deposition Modeling (FDM) being the most prevalent technique [38]. Recent research has also explored the use of 3D-printed structures as sacrificial absorbers or as adaptive mechanical components, which, in combination with thin-walled laminates, can function as dynamic systems—for example, adjustable wings [39,40].
The primary contribution of this study is a comparative analysis of the mechanical properties of sandwich structures, demonstrating that 3D-printed core structures can serve as viable alternatives to conventional materials. 3D printing technology shows considerable potential in applications requiring precise, condition-specific structural designs. When paired with parametric modeling, 3D printing enables innovative approaches to the design of shell structures that were previously unachievable. This flexibility and versatility in manufacturing sandwich structure cores allow for a reverse-engineering approach, where load models are developed based on input data, leading to optimized structural solutions in terms of core dimensions and configurations.
2. Materials and Methods
2.1. Materials
Four groups with different fiber reinforcements and core materials were produced, with each group containing 10 samples. For mechanical testing, sample dimensions were standardized at 50 x 290 x 12 mm, while density profile measurements utilized samples measuring 50 x 50 x 12 mm (Figure 1).
The GF group was constructed using two outer layers of Aeroglass 200 g/m² twill fabric (Havel Composites, Czech Republic) from each side with a PVC foam core of 110 kg/m³ density (3A Composites, Switzerland).
The FF group was similarly produced with the same PVC foam core as the GF group but reinforced with two layers of flax fiber (FLAXDRY-BL200 200 g/m² twill fabric; EcoTechnilin, France).
For the F3D group, the core material consisted of a 3D-printed structure using foaming Polylactic Acid (PolyLight 1.0 LW-PLA; 3D LabPrint, Czech Republic) [41]. The FB group utilized an end-grain balsa core with a density of 150 kg/m³ (Easy Composites Ltd, United Kingdom). Table 1 outlines the grouping and material composition of sandwich structures for clarity in abbreviation usage.
All samples were infused with IB2 Epoxy Infusion Bio resin (Easy Composites Ltd, United Kingdom). The 3D-printed core (with an intended thickness of 10 mm) and the balsa core (measured at 9.5 mm) displayed thicknesses close to the target thicknesses of 10 mm and 12 mm for the samples. However, the PVC foam exhibited slightly higher average thickness values (measured at 10.5 mm), which impacted the final sample thickness during manufacturing, yielding an average of 12 mm. Some samples within this group were measured with thicknesses closer to 12.5 mm.
The test samples were produced using vacuum infusion technology. Samples were fabricated on 6 mm tempered glass, which was pre-cleaned with Sea-Line cleaner and degreaser. The glass surface was subsequently waxed with Oskar's M700/C (Oskar’s GmbH, Germany), and eight layers of release agent were applied according to the technical data sheet instructions. Two layers of 200 g/m² twill fabric were placed on the outer surfaces, sandwiching the dry core between them. A 105 g/m² peel-ply fabric was applied to the visible side of each sample, and each sample was then hermetically sealed with vacuum film. Vacuum was applied using an EC4 Compact Composites Vacuum Pump, supplemented with a VR20 vacuum controller and VF1 air filtration system. After vacuuming the dry samples, a full seal test was conducted by closing the valves for 1 hour and measuring any vacuum drop in the system. All samples were infused under full vacuum, with PVC tubing (6 mm internal cross-section) used to distribute the resin evenly.
2.2. Methods
Each sample was weighed and measured across all three dimensions (X, Y, and Z) to calculate bulk density. The density profile of each sample was determined using the IMAL DPX300 LTE X-ray density profile analyzer (Imal-pal Group, San Damaso, Italy). Measurements were conducted on five individual samples from each group, with data from each sample plotted on a linear graph. The calculated density values for each sample are presented in Table 1.
Bending characteristics were evaluated using the TIRA Test 2850 machine (TIRA GmbH, Schalkau, Germany) in compliance with EN 310 (1995) standards. The modulus of elasticity in bending and the bending strength were determined by applying a central load to each specimen, which was supported at two distinct points.
Figure 2(a) illustrates the bending test of a sample made with flax fiber composite and a 3D-printed core structure, while Figure 2(b) shows the density profile measurement procedure using the IMAL DPX300 LTE densitometer.
The calculations for the modulus of elasticity, denoted as Em, and the bending strength, represented as fm, were conducted utilizing the subsequent equations 1 and 2.
Where: l1 is the distance between the centers of the supports [mm], b represents the width of tested pieces [mm], t is the thickness of the test samples [mm], F2 – F1 is the load increment within the linear portion of the load-deflection curve [N]. F1 might be approximately 10% and F2 might be approximately 40% of the maximal load. a2 – a1 is the increment of deflection at the mid-length of the specimen [m]. Fmax is the maximal load [N].
The output data were visualized as graphs. Measured values were analyzed in MS Excel to determine the mean (x̄), minimum, maximum, and standard deviation (SD) for each group. Statistical differences between groups were assessed using analysis of variance (ANOVA) and Tukey Honest Significant Difference (HSD) tests at a significance level α=0.05. All statistical analyses were performed using Statistica software (ver. 13, TIBCO, USA).
3. Results
3.1. Density Profile
The density of the produced samples was calculated and is summarized in Table 2. Group GF exhibited an average density of 417 kg/m³. Group FF showed a density approximately 3% higher than Group GF, representing the highest value overall. Group F3D had an average density of 424 kg/m³, while Group FB recorded the lowest average density at 405 kg/m³.
The data reveal the density profile of the clusters as measured by the IMAL DPX300 LTE density profile analyzer (Figure 3). The density profile for each group is derived from the mean measurements of all test bodies within the respective group. In each profile, the smooth side of the test specimens, which contacted the separated surface during production, is consistently denoted by a value of 0 on the X-axis, while the maximum X-axis value corresponds to the side where solid infusion occurred.
The plotted curves indicate a notable discrepancy between the theoretical bulk mass calculations for each group and the empirically measured density profiles. Across all groups, a characteristic distribution is evident, with high density observed in the outer layers and markedly lower density in the core regions of the sandwich material.
The GF group demonstrates the most distinct pattern, with its density profile showing a consistent linear decrease and subsequent increase at comparable values along the X-axis. In this group, the PVC foam core density is approximately 900 kg/m³, while the measured density of the raw Airex foam is 110 kg/m³. The density of the raw core is influenced by the presence of the PP grid and groove patterns, which facilitate foam absorption, potentially increasing the core density by up to 818%. A similar effect is observed in the FF group samples, though the foam absorbed a reduced amount of resin, resulting in a core density increase of only 690% relative to the raw material.
This substantial increase in core density is attributed not only to resin absorption but also to the presence of channels within the core that enhance resin distribution during the manufacturing process. According to the technical data sheet, the density of the epoxy resin matrix used is 1100 kg/m³.
The experimental results indicate that the foam core achieves the highest density among all tested groups. Specifically, the density profile remains stable, with the outer layers—reinforced by glass fibers—exhibiting the highest density, while the middle section of the structure displays the lowest density. Notably, the foam core itself shows a higher density compared to the cores of other groups.
The FF group exhibits a comparable density profile, with the outer layers displaying the highest density and the core presenting the lowest. However, both the core and outer layers in the FF group exhibit lower densities than those observed in the GF group. Data analysis suggests that the foam core density is influenced by resin absorption at the fiber/foam interface. Flax fibers demonstrate higher matrix absorption, which may lead to resin uptake from the sandwich core during the production process.
The F3D group shows a typical density profile for sandwich structures, albeit with greater variability in density values within the transition region between the reinforcement layers and the 3D-printed core. The lowest density measured across all groups occurs within the deeper sections of the structure, approximately in the thickness range of 4 to 9 mm, suggesting deeper matrix penetration in this inter-transition region. This variability in the density profile of the 3D-printed core may be attributed to differences in the geometry of the infill material across samples.
The FB group demonstrates a similar density profile but lacks the density variability observed at the fiber-core interface, indicating that balsa does not possess the same absorption properties as foam materials, and the resin does not infiltrate the material’s pores. This difference may be influenced by the surface characteristics of the core materials; foam cores, with their inherently more porous surfaces, likely facilitate greater resin absorption compared to the smoother, less porous surface of balsa cores.
3.2. Modulus of Elasticity
The measured data presented in Table 3 substantiate that glass fibers exhibit substantially higher values of modulus of elasticity. Specifically, the GF group recorded an average modulus of elasticity of 5085 MPa, with individual measurements ranging from 4915 MPa to 5410 MPa. In contrast, the FF group demonstrated an average modulus of elasticity that was 47% lower than that of the GF group, corroborating current research [42,43] indicating that glass fiber composites generally achieve superior mechanical properties compared to any alternatives such as natural fibers or any hybrid options. The F3D group exhibited an average modulus of elasticity of 2269 MPa, reflecting a modest reduction in performance of only 6.6% relative to the FF group, which also utilized flax fiber. Meanwhile, the FB group achieved an average modulus of elasticity of 2445 MPa, marking it as the highest among groups containing flax fiber and the second highest across all tested groups
The modulus of elasticity associated with the core materials indicates that the three tested core types yield comparable values when paired with the same fiber reinforcement (Figure 4). Specifically, the balsa core demonstrated an average modulus of 2445 MPa, closely followed by the PVC core with an average of 2429 MPa (FF Group), and the 3D-printed core with an average of 2269 MPa. Notably, the PVC core exhibited enhanced performance when combined with the GF group, which incorporates glass fiber reinforcement. This pairing significantly strengthens the mechanical properties of the PVC core, providing increased rigidity and strength due to the reinforcing effect of the glass fibers.
In the GF group, distinct differences in modulus of elasticity were observed based on the orientation of the foam handling and infusion grooves (Figure 5). Specifically, specimens tested with the grooves oriented upwards exhibited a 3.9% higher average modulus of elasticity (5185 MPa) compared to specimens with grooves oriented downwards (4985 MPa). This trend is reflected in the variation range for the upward orientation, with the maximum recorded value reaching 5410 MPa and the minimum at 4915 MPa.
In contrast, the highest observed modulus in the downward-oriented samples was 5028 MPa. These variations may be attributed to the resin distribution within the grooves; when the grooves are oriented upwards, the resin is subjected to compressive stress, potentially creating favorable loading conditions that enhance the structural performance.
Using Tukey's HSD test, it was determined that the modulus of elasticity results for the GF group differ statistically significantly from all other groups (p=0.000138 and p=0.000180 for the upwards and downwards orientations, respectively). No statistically significant differences were observed among the other groups.
An intriguing observation emerges in the comparison between the GF and FF groups. In the FF group, specimens with grooves oriented upwards exhibited lower modulus of elasticity values, averaging 2287 MPa. In contrast, specimens tested with downward-oriented grooves achieved values that were 11.1% higher, with an average of 2572 MPa. These results imply that the absence of resin within the grooves of the FF group, likely due to increased absorption by the flax reinforcement, resulted in air gaps that did not contribute to compressive strength enhancement as observed in the GF group.
For the F3D and FB groups, the orientation of specimens during testing appeared to have negligible influence on the measured values, with the F3D group, in particular, displaying exceptional consistency in its results.
The variation ranges for all groups overlap, supporting the conclusion that the mechanical properties across these groups are highly comparable. Furthermore, examining these values alongside the density profiles of each group yields additional insights. Despite showing the lowest average modulus of elasticity, the 3D-printed core group also possesses one of the highest density profiles among the tested samples and based on density profile lowest density of core material. The PVC foam core groups demonstrate intermediate modulus values, achieving the highest density profile when used with flax fiber reinforcement.
The modulus of elasticity for the 3D-printed core was specifically measured along the primary direction of the filler to capture the structure's lowest possible modulus values. In contrast, the other groups, due to the intrinsic nature of their materials, exhibit uniform properties across the X and Y axes.
3.3. Bending Strength
The GF group, with a bending strength of 43.88 MPa (Table 4), is only 14% higher than the FF group and 42% higher than the FB group (30.83 MPa). Interestingly, in certain cases, samples from the FF group, which recorded the lowest values in modulus of elasticity, achieved comparatively higher bending strength (Figure 6).
The F3D group exhibits the smallest variation in its measured bending strength data, aligning with previous findings on the modulus of elasticity for this group and indicating a high degree of consistency in its mechanical properties. The maximum recorded bending strength for the F3D group is 34.62 MPa. Although this value does not reach the performance levels observed in the GF group—where the lowest bending strength recorded is 34.52 MPa—it remains within the lower range of the values measured for the FF group, underscoring the moderate performance of the F3D configuration.
An analysis of the bending strength data across all groups reveals that flax fibers attain their highest values when combined with a PVC foam core, reaching 38.41 MPa. This is followed by the F3D group, where flax fibers are paired with a 3D-printed core, resulting in an average bending strength of 31.46 MPa. Meanwhile, the combination of flax with a balsa core yields an average bending strength of 30.83 MPa, which is only 0.57% lower than the F3D group. These findings highlight the influence of core material on the structural performance of flax fiber composites, with PVC foam providing the highest reinforcement effect, while the 3D-printed core and balsa core configurations show competitive yet slightly lower bending strength.
As anticipated, the highest bending strength (Figure 7) was observed in the GF group when samples were oriented with the grooves facing upward during testing, a trend consistent across both orientations within the group. A similar trend was noted in the FF group, although its bending strength values were 18.5% lower at 42.22 MPa compared to the GF group. In contrast, similar to the modulus of elasticity results, the orientation of the samples during mechanical testing did not have a significant impact on the bending strength measurements for the F3D and FB groups.
The F3D group exhibits a 25.3% reduction in performance compared to the FF group when samples are oriented with grooves facing upwards. However, with a downward orientation, the reduction in the F3D group’s values is only 8.8%, and, in comparison to the GF group, the decrease is 12.4%. This discrepancy may be attributed to the F3D group’s homogeneous and consistent cross-sectional shape, which lacks the resin infusion channels present in other core configurations.
The FB group, with a balsa core, exhibited performance values 31% lower than the GF group and 21% lower than the FF group, yet remained within the acceptable variation range. The F3D group displayed mechanical properties comparable to the FB group, with overlapping ranges observed with the FF group. Additionally, the F3D group showed significantly smaller variance in performance compared to the other groups, indicating greater consistency. The results of Tukey's HSD test showed p-values exceeding the significance level (p>0.05) for all groups except GP upwards, indicating that the observed differences between the tested samples are statistically insignificant. These findings suggest very similar strength values across the groups, with the exception of GP, which exhibits significantly higher strength.
4. Conclusion
Recent studies indicate that conventional sandwich materials can be substituted with either natural materials or those produced through additive manufacturing. Samples from four groups were tested for selected mechanical properties and density profiles.
- Density profile measurements revealed that the 3D-printed core had the lowest density, while still yielding comparable performance in selected mechanical tests. The density of Group F3D, incorporating flax fiber reinforcement, was intermediate among the flax-reinforced groups.
- Mechanical testing demonstrated that a 3D-printed core composed of lightweight thermoplastic material can rival traditional cellular foam and balsa wood cores. It was also observed that the 3D-printed material exhibits more homogeneous properties compared to cellular foam or balsa wood.
- The modulus of elasticity of samples with 3D-printed cores averaged 2269 MPa, with statistical analysis showing overlapping values with groups using conventional core materials.
- Although the group with a 3D-printed core exhibited slightly lower measured values, further optimization of the internal filling structure could enhance performance, achieving comparable results to foam materials.
- The results also indicate that flax fiber reinforcement reduces impregnation efficiency in foam materials, influencing selected mechanical properties.
- Glass fibers were confirmed to exhibit superior mechanical properties compared to flax fibers, including higher tensile strength and greater stiffness.
Author Contributions
Conceptualization, V.B.; methodology, V.B. and M.B.; validation, V.B., T.H. and K.K.; investigation, V.B. and M.J.; resources, M.B.; data curation, V.B., M.B. and M.J.; writing—original draft preparation, V.B.; writing—review and editing, V.B., M.B. and Z.P.; visualization, V.B. and M.B.; supervision, M.B. and R.Č.; project administration, M.B. and Z.P.; funding acquisition, Z.P. All authors have read and agreed to the published version of the manuscript.
Funding
This research was supported by the Technological Agency of Czech Republic, project No. FW03010422, and the Grant Agency of the Czech Technical University in Prague, project No. SGS23/149/OHK1/3T/11.
Data Availability Statement
All results are published in the article.
Conflicts of Interest
The authors declare no conflicts of interest.
References
- AL-Oqla, F.M.; Hayajneh, M.T.; Nawafleh, N. Advanced Synthetic and Biobased Composite Materials in Sustainable Applications: A Comprehensive Review. Emergent Mater 2023, 6, 809–826. [Google Scholar] [CrossRef]
- GlobeNewswire, Inc. Composites Market Size, Share &Trends Analysis By Product, By Resin, By Manufacturing, By End Use And Segment Forecasts, 2020- 2027 2020.
- Grand View Research, Inc. Composites Market Analysis and Segment Forecasts to 2030; 2023.
- Bullen, G.N.; Grant, C.; Hiken, A.; Day, D.; Champa, D. Economics of Composites.
- Estin; Co. Overview of the Global Composites Market 2019-2024. JEC Group 2020.
- Lucintel Bio-Composites Market Report: Trends, Forecast and Competitive Analysis. Report and market 2020.
- Brejcha, V.; Kobetičová, K.; Pommer, V.; Koňáková, D.; Böhm, M. Analysis of Porosity and Abrasion Resistance of Composite Material Based on Flax Fiber and Bio-Epoxy Resin with Corundum Additive. In Proceedings of the International Conference of Computational Methods in Sciences and Engineering ICCMSE 2022; AIP Publishing, March 14 2024; Vol. 3030, p. 070004.
- Shirinbayan, M.; Abbasnezhad, N.; Nikooharf, M.H.; Benfriha, K.; Kallel, A.; Jendli, Z.; Fitoussi, J. Manufacturing Process Effect on the Mechanical Properties of Glass Fiber/Polypropylene Composite Under High Strain Rate Loading: Woven (W-GF-PP) and Compressed GF50-PP. Applied Composite Materials 2023, 30, 1717–1736. [CrossRef]
- Rajak, D.K.; Wagh, P.H.; Linul, E. Manufacturing Technologies of Carbon/Glass Fiber-Reinforced Polymer Composites and Their Properties: A Review. Polymers (Basel) 2021, 13. [CrossRef]
- Goudenhooft, C.; Siniscalco, D.; Arnould, O.; Bourmaud, A.; Sire, O.; Gorshkova, T.; Baley, C. Investigation of the Mechanical Properties of Flax Cell Walls during Plant Development: The Relation between Performance and Cell Wall Structure. Fibers 2018, 6. [CrossRef]
- Rahman, M.M.; Maniruzzaman, M.; Yeasmin, M.S. A State-of-the-Art Review Focusing on the Significant Techniques for Naturally Available Fibers as Reinforcement in Sustainable Bio-Composites: Extraction, Processing, Purification, Modification, as Well as Characterization Study. Results in Engineering 2023, 20. [CrossRef]
- Böhm, M.; Brejcha, V.; Jerman, M.; Cerný, R. Bending Characteristics of Fiber-Reinforced Composite with Plywood Balsa Core. In Proceedings of the AIP Conference Proceedings; American Institute of Physics Inc., December 10 2019; Vol. 2186.
- Scelsi, L.; Hodzic, A.; Soutis, C.; Hayes, S.A.; Rajendran, S.; AlMa’adeed, M.A.; Kahraman, R. A Review on Composite Materials Based on Recycled Thermoplastics and Glass Fibres. Plastics, Rubber and Composites 2011, 40. [CrossRef]
- Tiimob, B.J.; Rangari, V.K.; Jeelani, S. Effect of Reinforcement of Sustainable β-CaSiO3 Nanoparticles in Bio-Based Epoxy Resin System. J Appl Polym Sci 2014, 131. [CrossRef]
- Kandelbauer Ã, A.; Tondi, G.; Zaske ÃÃ, O.C.; Goodman ÃÃ, S.H. Handbook of Thermoset Plastics: 6 Unsaturated Polyesters and Vinyl Esters Unsaturated Polyesters; 2013. [CrossRef]
- Krzywiński, K.; Sadowski, Ł.; Stefaniuk, D.; Obrosov, A.; Weiß, S. Engineering and Manufacturing Technology of Green Epoxy Resin Coatings Modified with Recycled Fine Aggregates. International Journal of Precision Engineering and Manufacturing - Green Technology 2022, 9, 253–271. [CrossRef]
- Partanen, A.; Carus, M. Biocomposites, Find the Real Alternative to Plastic – An Examination of Biocomposites in the Market. Reinforced Plastics 2019, 63, 317–321. [Google Scholar] [CrossRef]
- Stanzione, J.; La Scala, J. Sustainable Polymers and Polymer Science: Dedicated to the Life and Work of Richard P. Wool. J Appl Polym Sci 2016, 133. [CrossRef]
- Sangregorio, A.; Guigo, N.; van der Waal, J.C.; Sbirrazzuoli, N. All ‘Green’ Composites Comprising Flax Fibres and Humins’ Resins. Compos Sci Technol 2019, 171, 70–77. [CrossRef]
- Kobetičová, K.; Nábělková, J.; Brejcha, V.; Böhm, M.; Jerman, M.; Brich, J.; Černý, R. Ecotoxicity of Caffeine as a Bio-Protective Component of Flax-Fiber-Reinforced Epoxy-Composite Building Material. Polymers (Basel) 2023, 15. [CrossRef]
- Yan, L.; Chouw, N.; Jayaraman, K. Flax Fibre and Its Composites - A Review. Compos B Eng 2014, 56, 296–317. [Google Scholar] [CrossRef]
- Gindl-Altmutter, W.; Keckes, J.; Plackner, J.; Liebner, F.; Englund, K.; Laborie, M.P. All-Cellulose Composites Prepared from Flax and Lyocell Fibres Compared to Epoxy-Matrix Composites. Compos Sci Technol 2012, 72, 1304–1309. [Google Scholar] [CrossRef]
- Sai, P.; Kumar, S.; Viswanath Allamraju, K. ScienceDirect A Review Of Natural Fiber Composites [Jute, Sisal, Kenaf]; 2019.
- Holmes, M. Biocomposites Take Natural Step Forward: Applications for Biocomposites and the Use of Natural Fiber Reinforcements Are Increasing. Reinforced Plastics Looks at a Number of Examples. Reinforced Plastics 2019, 63, 194–201. [Google Scholar] [CrossRef]
- Pawlik, M.; Gunputh, U.; Odiyi, D.; Odofin, S.; Le, H.; Wood, P.; Maligno, A.; Lu, Y. Mechanical Properties of Eco-Friendly, Lightweight Flax and Hybrid Basalt/Flax Foam Core Sandwich Panels. Materials 2024, 17. [CrossRef]
- Alphonse, M.; Bupesh Raja, V.K.; Gopala Krishna, V.; Kiran, R.S.U.; Subbaiah, B.V.; Chandra, L.V.R. Mechanical Behavior of Sandwich Structures with Varying Core Material - A Review. In Proceedings of the Materials Today: Proceedings; Elsevier Ltd, January 1 2021; Vol. 44, pp. 3751–3759. [CrossRef]
- Yan, J.; Wang, G.; Li, Q.; Zhang, L.; Yan, J.D.; Chen, C.; Fang, Z. A Comparative Study on Damage Mechanism of Sandwich Structures with Different Core Materials under Lightning Strikes. Energies (Basel) 2017, 10. [CrossRef]
- Imielińska, K.; Guillaumat, L.; Wojtyra, R.; Castaings, M. Effects of Manufacturing and Face/Core Bonding on Impact Damage in Glass/Polyester-PVC Foam Core Sandwich Panels. Compos B Eng 2008, 39, 1034–1041. [Google Scholar] [CrossRef]
- Kausar, A.; Ahmad, I.; Rakha, S.A.; Eisa, M.H.; Diallo, A. State-Of-The-Art of Sandwich Composite Structures: Manufacturing—to—High Performance Applications. Journal of Composites Science 2023, 7. [CrossRef]
- Jang, J.-W.; Jeong, S.; Oh, D.; Cho, J.-H.; Noh, J. Test and Evaluation Procedure of Foam Core Materials for Composite Ships. Journal of the Korean Society of Marine Environment and Safety 2020, 26, 286–296. [Google Scholar] [CrossRef]
- Pertiwi, Y.A.B.; Ishiguri, F.; Aiso, H.; Ohshima, J.; Yokota, S. Wood Properties of 7-Year-Old Balsa (Ochroma Pyramidale) Planted in East Java. International Wood Products Journal 2017, 8. [Google Scholar] [CrossRef]
- Easterling, K.E.; Harrysson, R.; Gibson, L.J.; Ashby, M.F. On the mechanics of balsa and other woods. In Proceedings of the Proceedings of The Royal Society of London, Series A: Mathematical and Physical Sciences; 1982; Vol. 383.
- Kotlarewski, N.J.; Belleville, B.; Gusamo, B.K.; Ozarska, B. Mechanical Properties of Papua New Guinea Balsa Wood. European Journal of Wood and Wood Products 2016, 74. [Google Scholar] [CrossRef]
- Jagadeesh, P.; Puttegowda, M.; Rangappa, S.M.; Alexey, K.; Gorbatyuk, S.; Khan, A.; Doddamani, M.; Siengchin, S. A Comprehensive Review on 3D Printing Advancements in Polymer Composites: Technologies, Materials, and Applications. International Journal of Advanced Manufacturing Technology 2022, 121, 127–169. [Google Scholar] [CrossRef]
- Delgado Camacho, D.; Clayton, P.; O’Brien, W.J.; Seepersad, C.; Juenger, M.; Ferron, R.; Salamone, S. Applications of Additive Manufacturing in the Construction Industry – A Forward-Looking Review. Autom Constr 2018, 89, 110–119. [Google Scholar] [CrossRef]
- Wimpenny, D.I.; Pandey, P.M.; Jyothish Kumar, L. Advances in 3D Printing & Additive Manufacturing Technologies; Springer Singapore, 2016; ISBN 9789811008122.
- Ansari, A.I.; Sheikh, N.A. A Review on Different Approaches for Foam Fabrication. Journal of The Institution of Engineers (India): Series C 2023, 104, 1219–1245. [Google Scholar] [CrossRef]
- Zheng, X.; Williams, C.; Spadaccini, C.M.; Shea, K. Perspectives on Multi-Material Additive Manufacturing. J Mater Res 2021, 36, 3549–3557. [Google Scholar] [CrossRef]
- Bryll, K.; Piesowicz, E.; Szymański, P.; Slaczka, W.; Pijanowski, M. Polymer Composite Manufacturing by FDM 3D Printing Technology. In Proceedings of the MATEC Web of Conferences; EDP Sciences, November 26 2018; Vol. 237.
- Lumpe, T.S.; Shea, K. Computational Design of 3D-Printed Active Lattice Structures for Reversible Shape Morphing. J Mater Res 2021, 36, 3642–3655. [Google Scholar] [CrossRef]
- 3D LabPrint Technical Data Sheet and Specification of PolyLight 1.0 Available online: https://3dlabprint.com/faq/prusaslicer/ (accessed on 18 October 2024).
- Ashraf, W.; Ishak, M.R.; Zuhri, M.Y.M.; Yidris, N.; Ya’acob, A.M. Effect on Mechanical Properties by Partial Replacement of the Glass with Alkali-Treated Flax Fiber in Composite Facesheet of Sandwich Structure. Journal of Materials Research and Technology 2021, 13, 89–98. [Google Scholar] [CrossRef]
- Sadeghian, P.; Hristozov, D.; Wroblewski, L. Experimental and Analytical Behavior of Sandwich Composite Beams: Comparison of Natural and Synthetic Materials. Journal of Sandwich Structures & Materials 2018, 20, 287–307. [Google Scholar] [CrossRef]
Figure 1.
Samples cross section of groups (a) GF Group, (b) FF Group, (c) F3D Group and (d) FB Group.
Figure 1.
Samples cross section of groups (a) GF Group, (b) FF Group, (c) F3D Group and (d) FB Group.
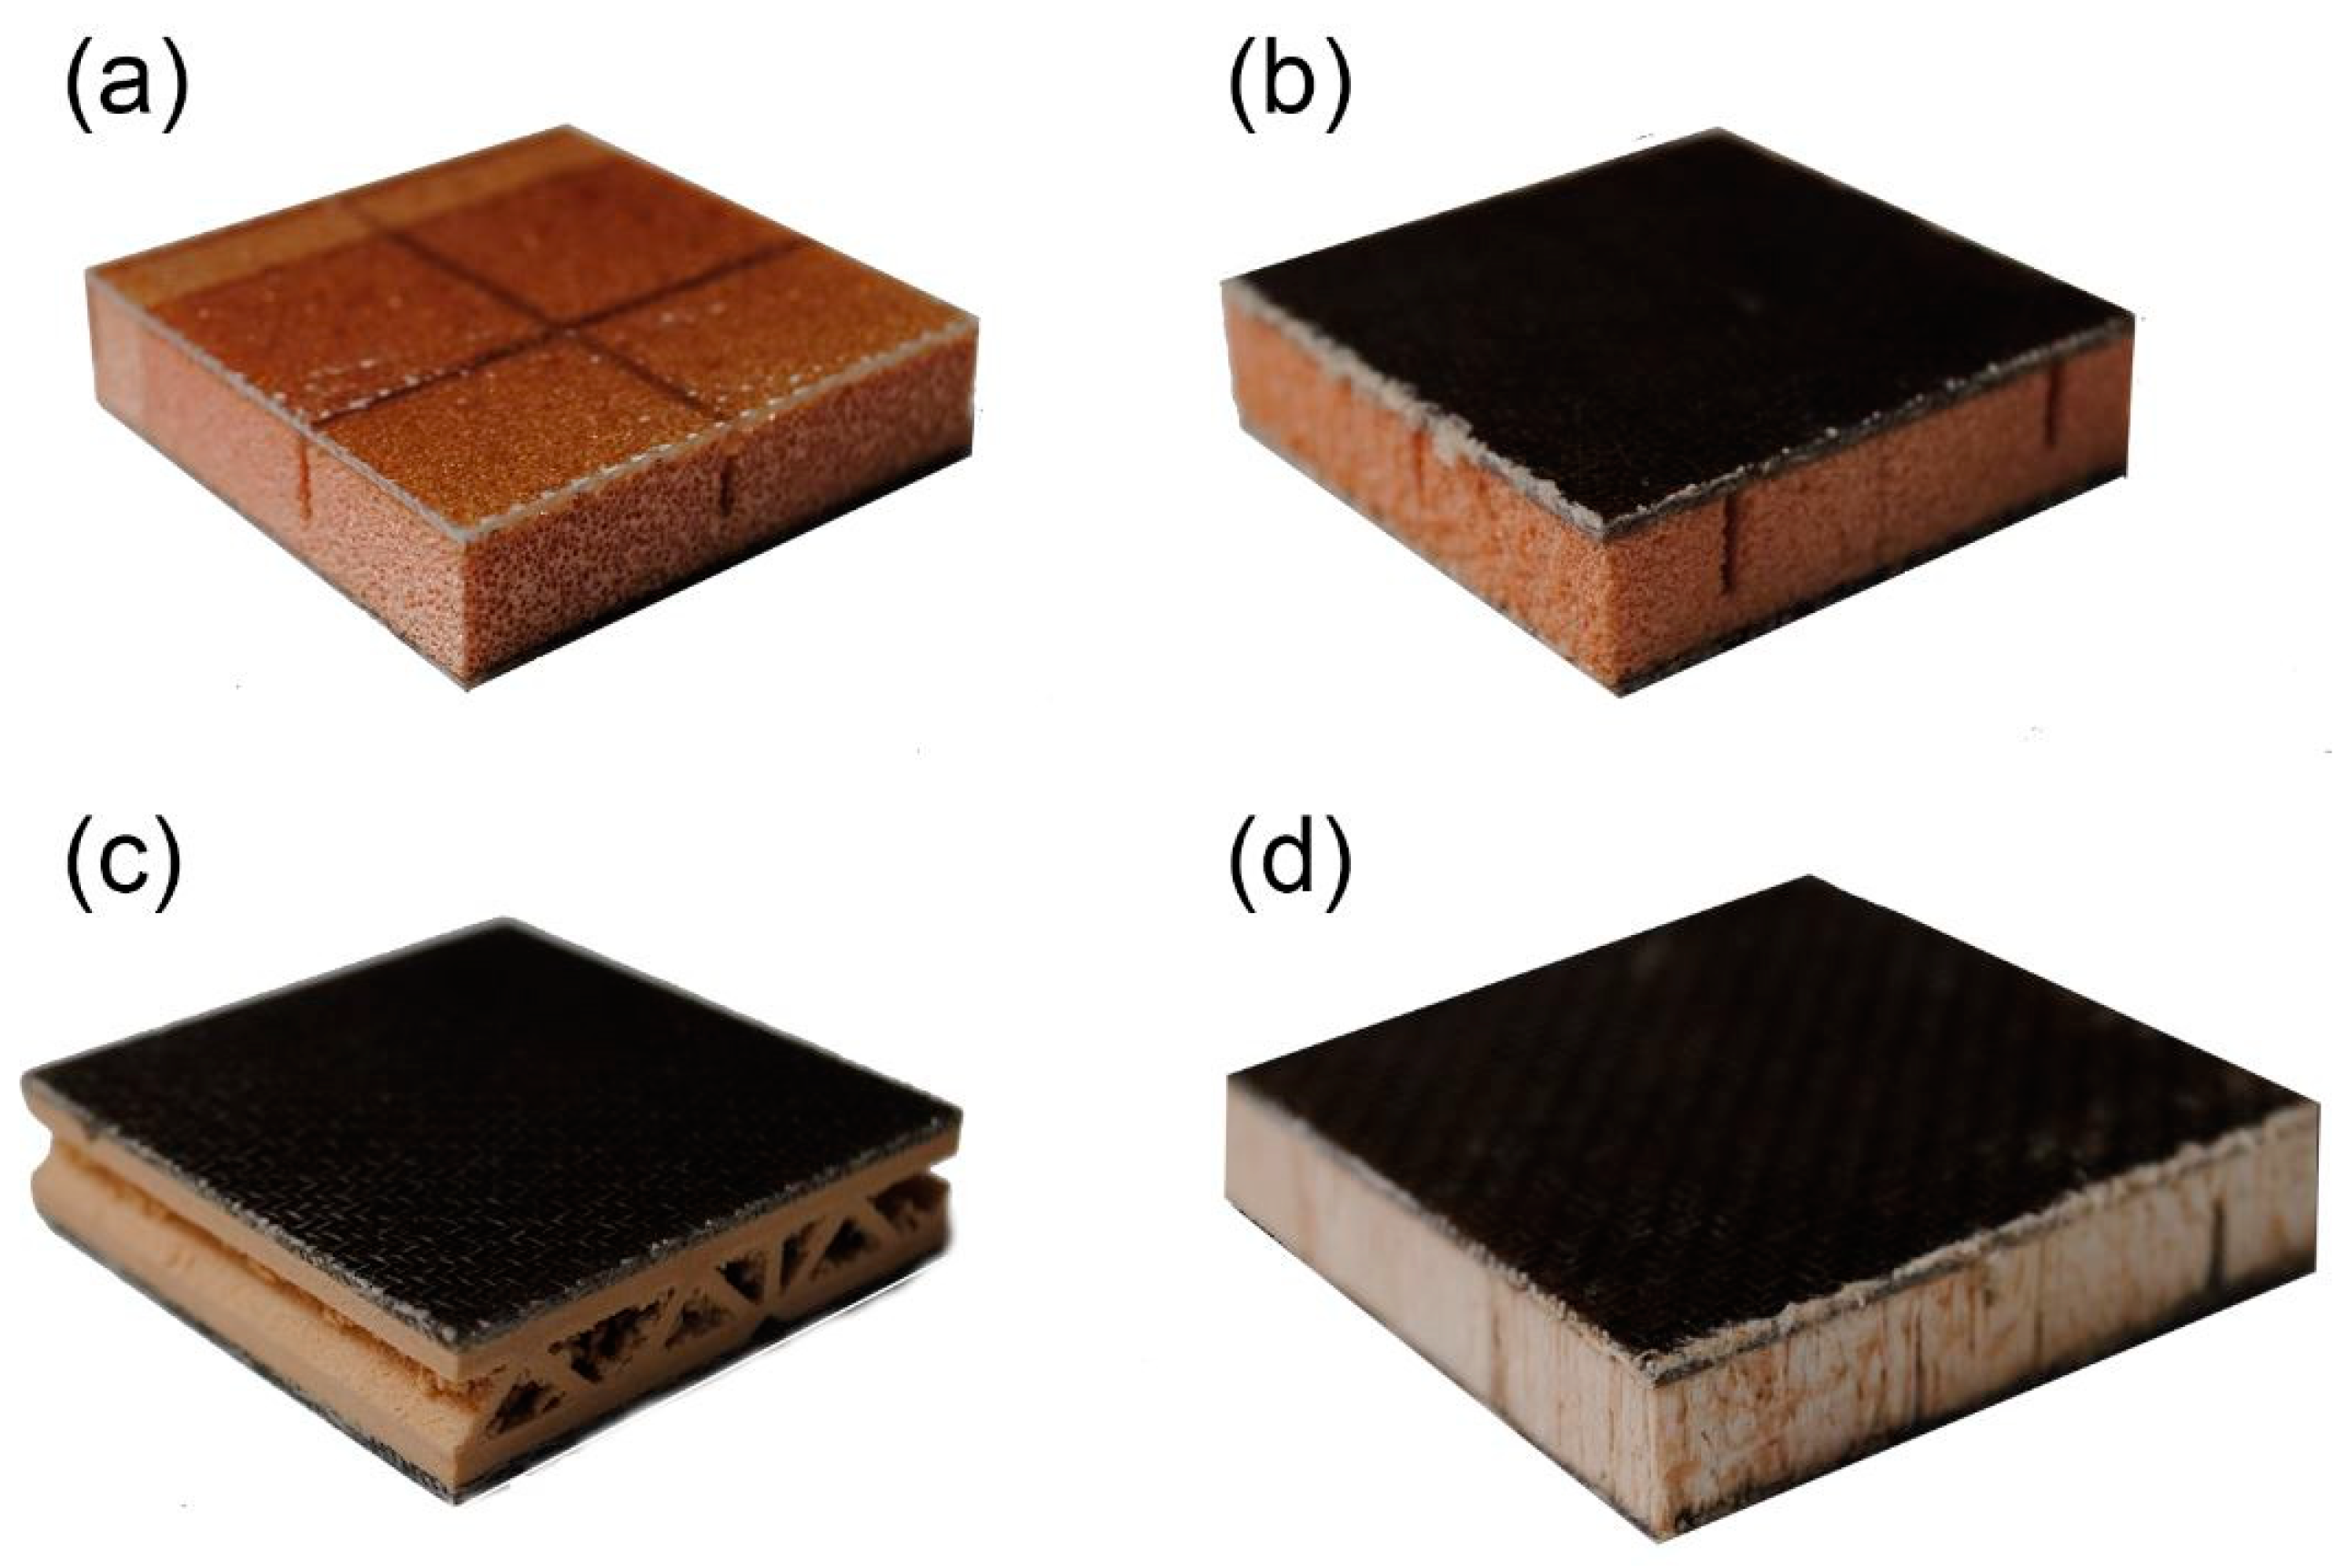
Figure 2.
(a) Bending test on TIRA test 2850; (b) measurement procedure by IMAL DPX300 LTE.
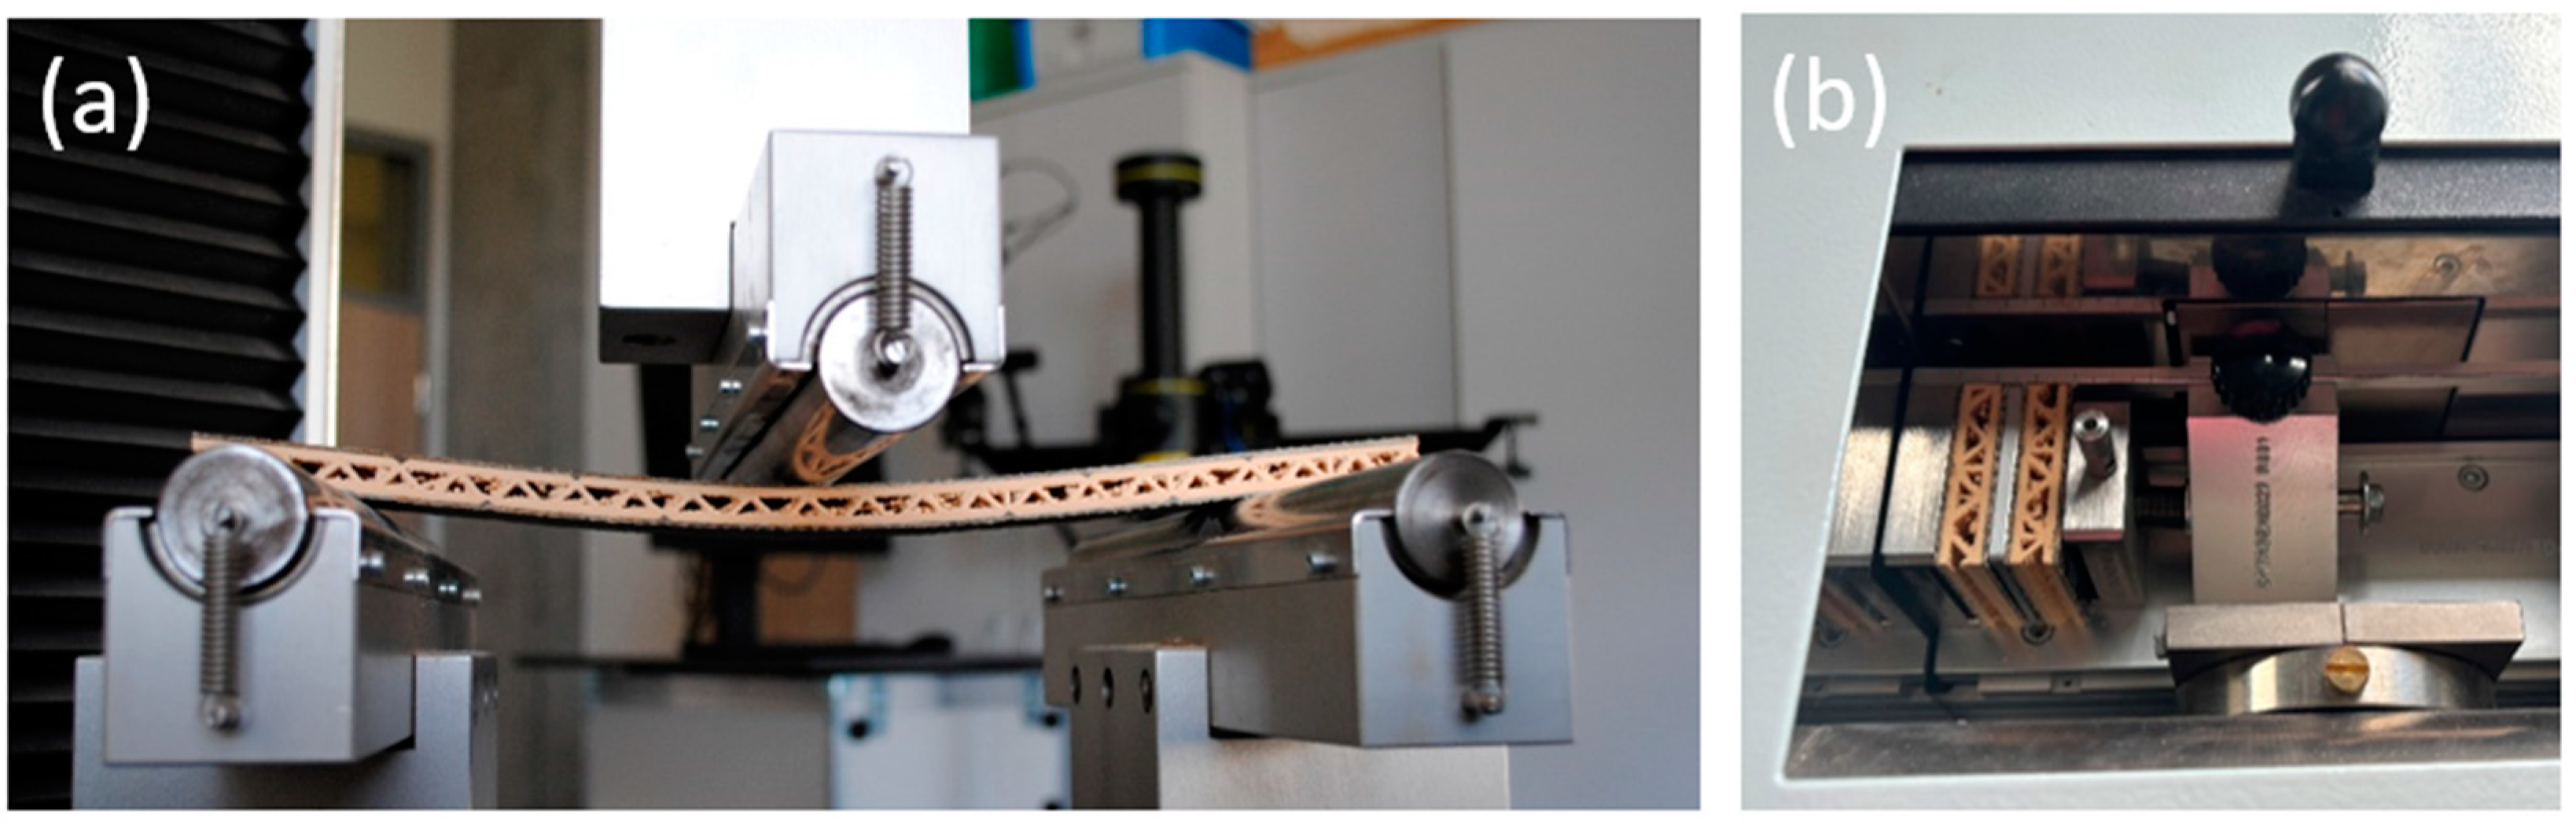
Figure 3.
Representation of the results of density profile measurements of groups using the iMAL DPX300LTE density profile analyzer.
Figure 3.
Representation of the results of density profile measurements of groups using the iMAL DPX300LTE density profile analyzer.
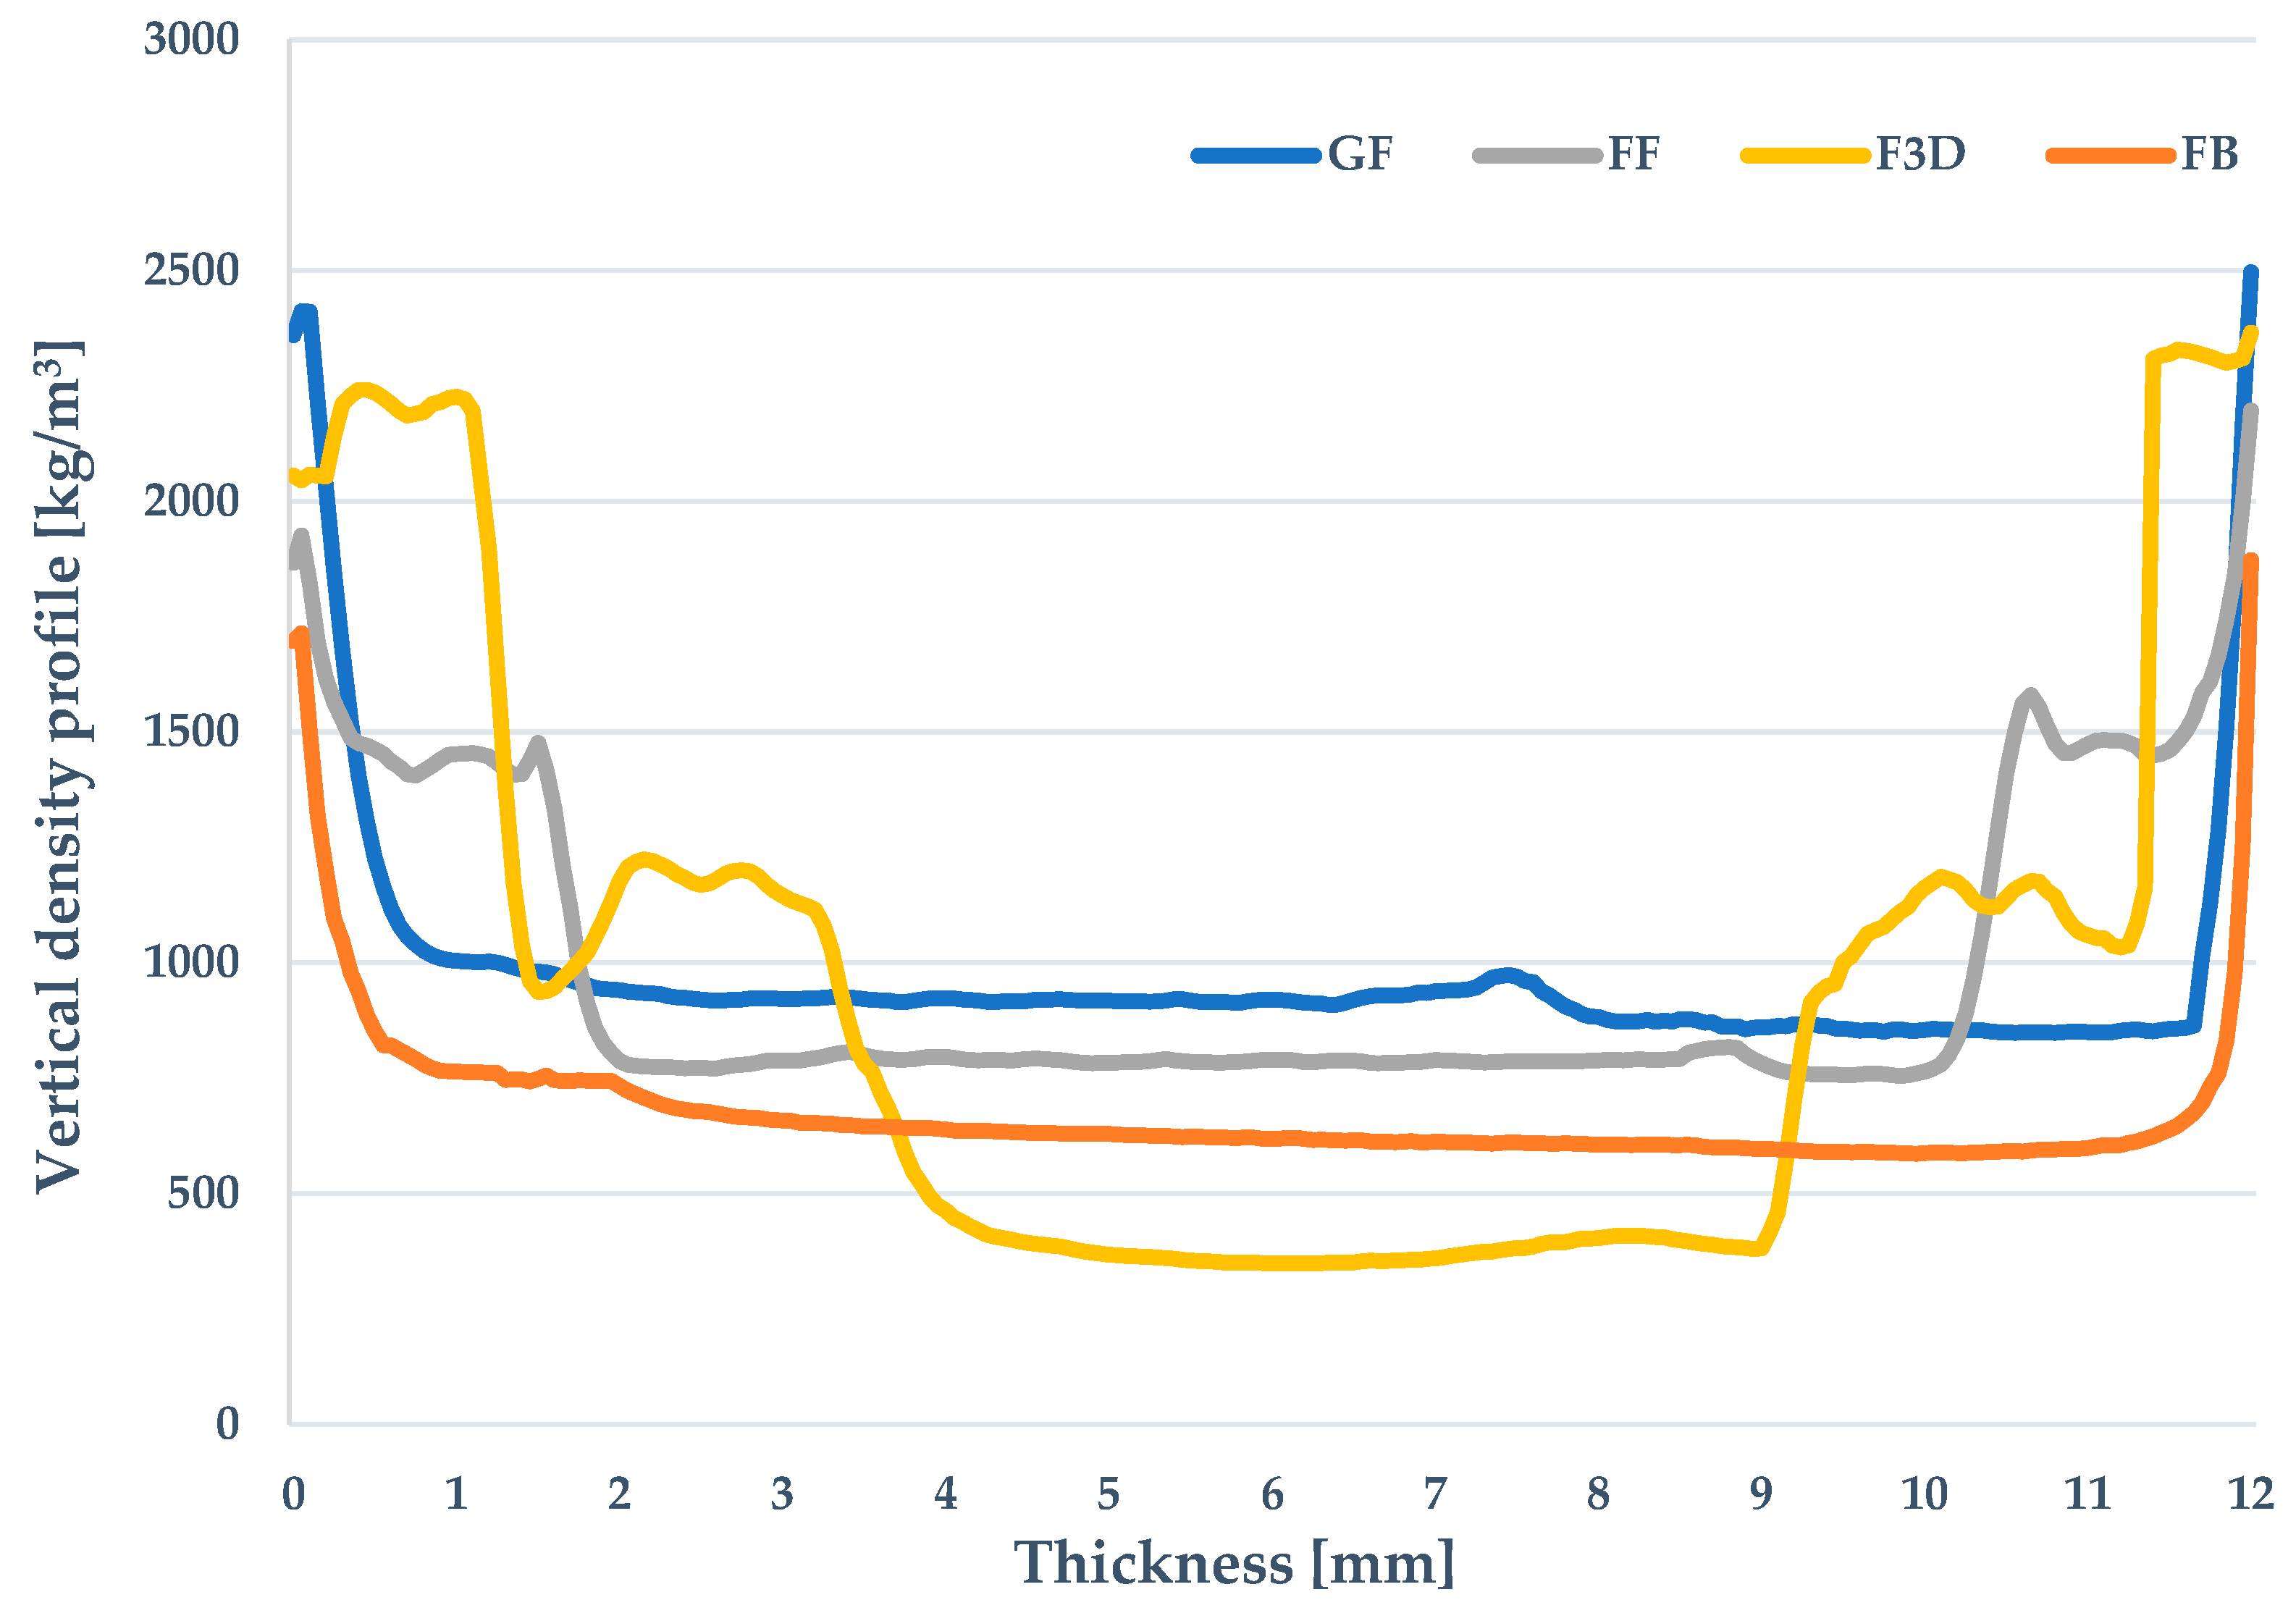
Figure 4.
Modulus of elasticity related to the core material, categorized by fiber. The graph displays the mean value, with boxes representing the lower and upper quartiles, and vertical bars indicating the non-outlier range.
Figure 4.
Modulus of elasticity related to the core material, categorized by fiber. The graph displays the mean value, with boxes representing the lower and upper quartiles, and vertical bars indicating the non-outlier range.
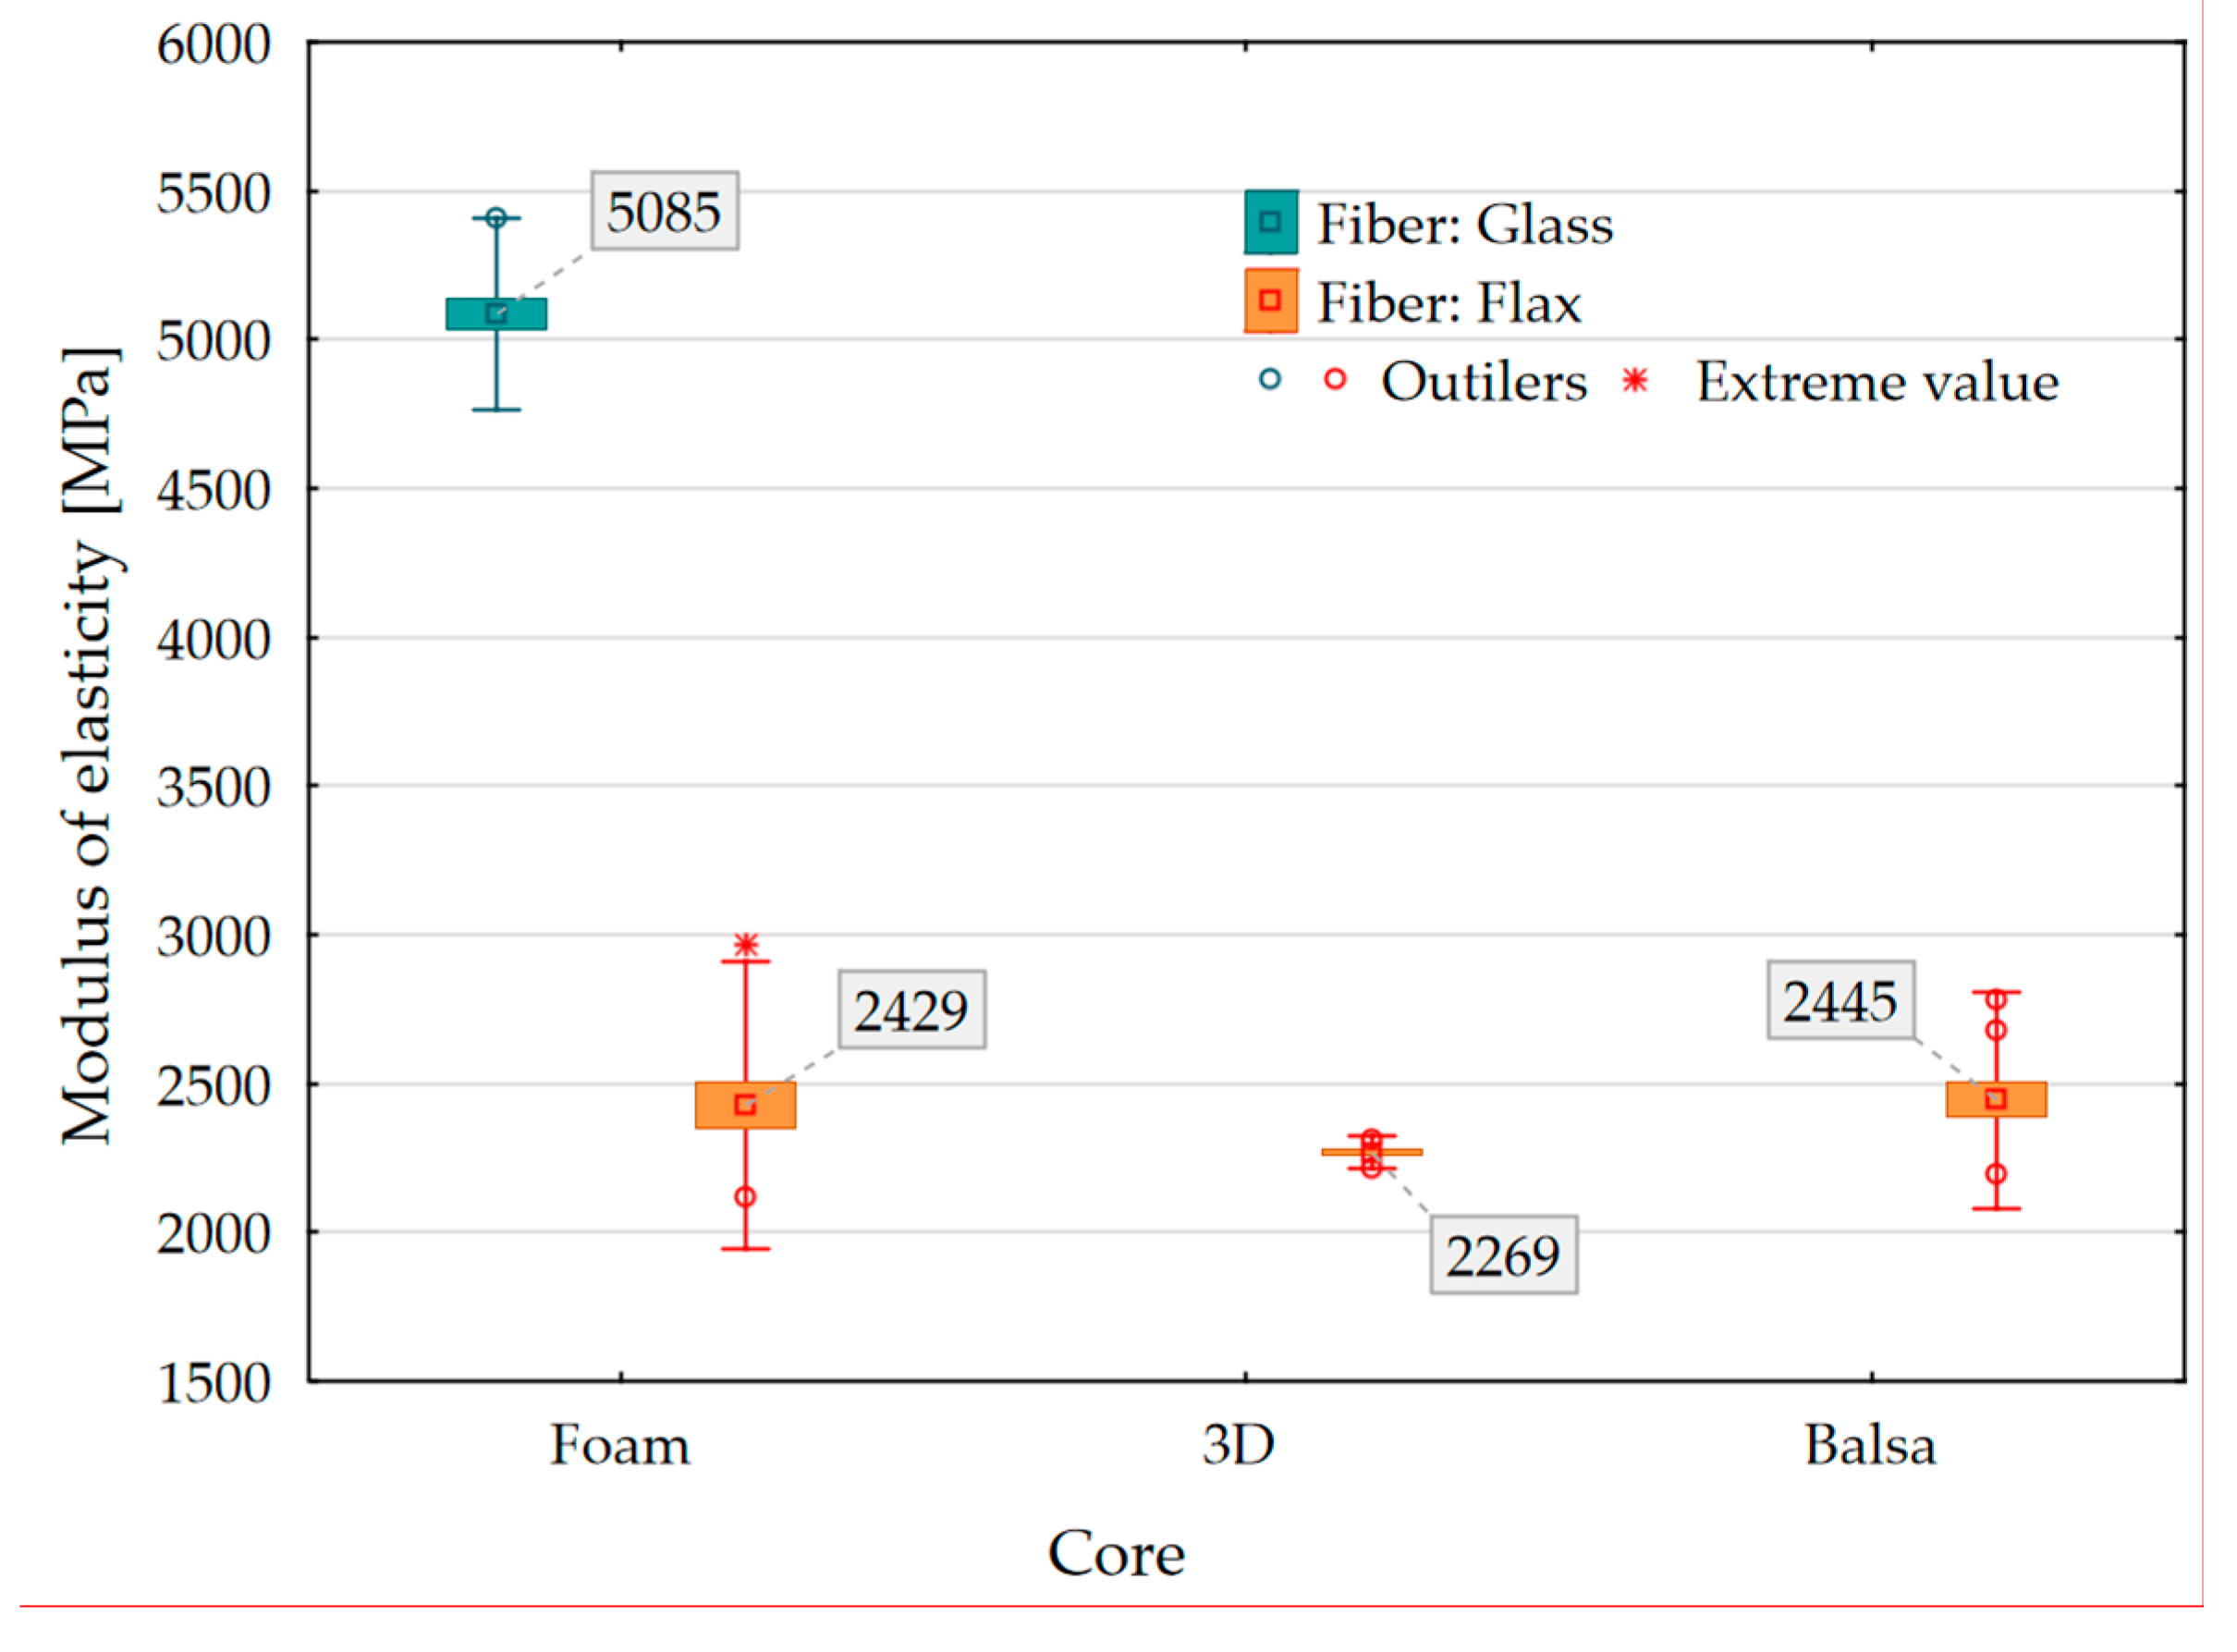
Figure 5.
Modulus of elasticity, categorized by orientation of samples during the test.
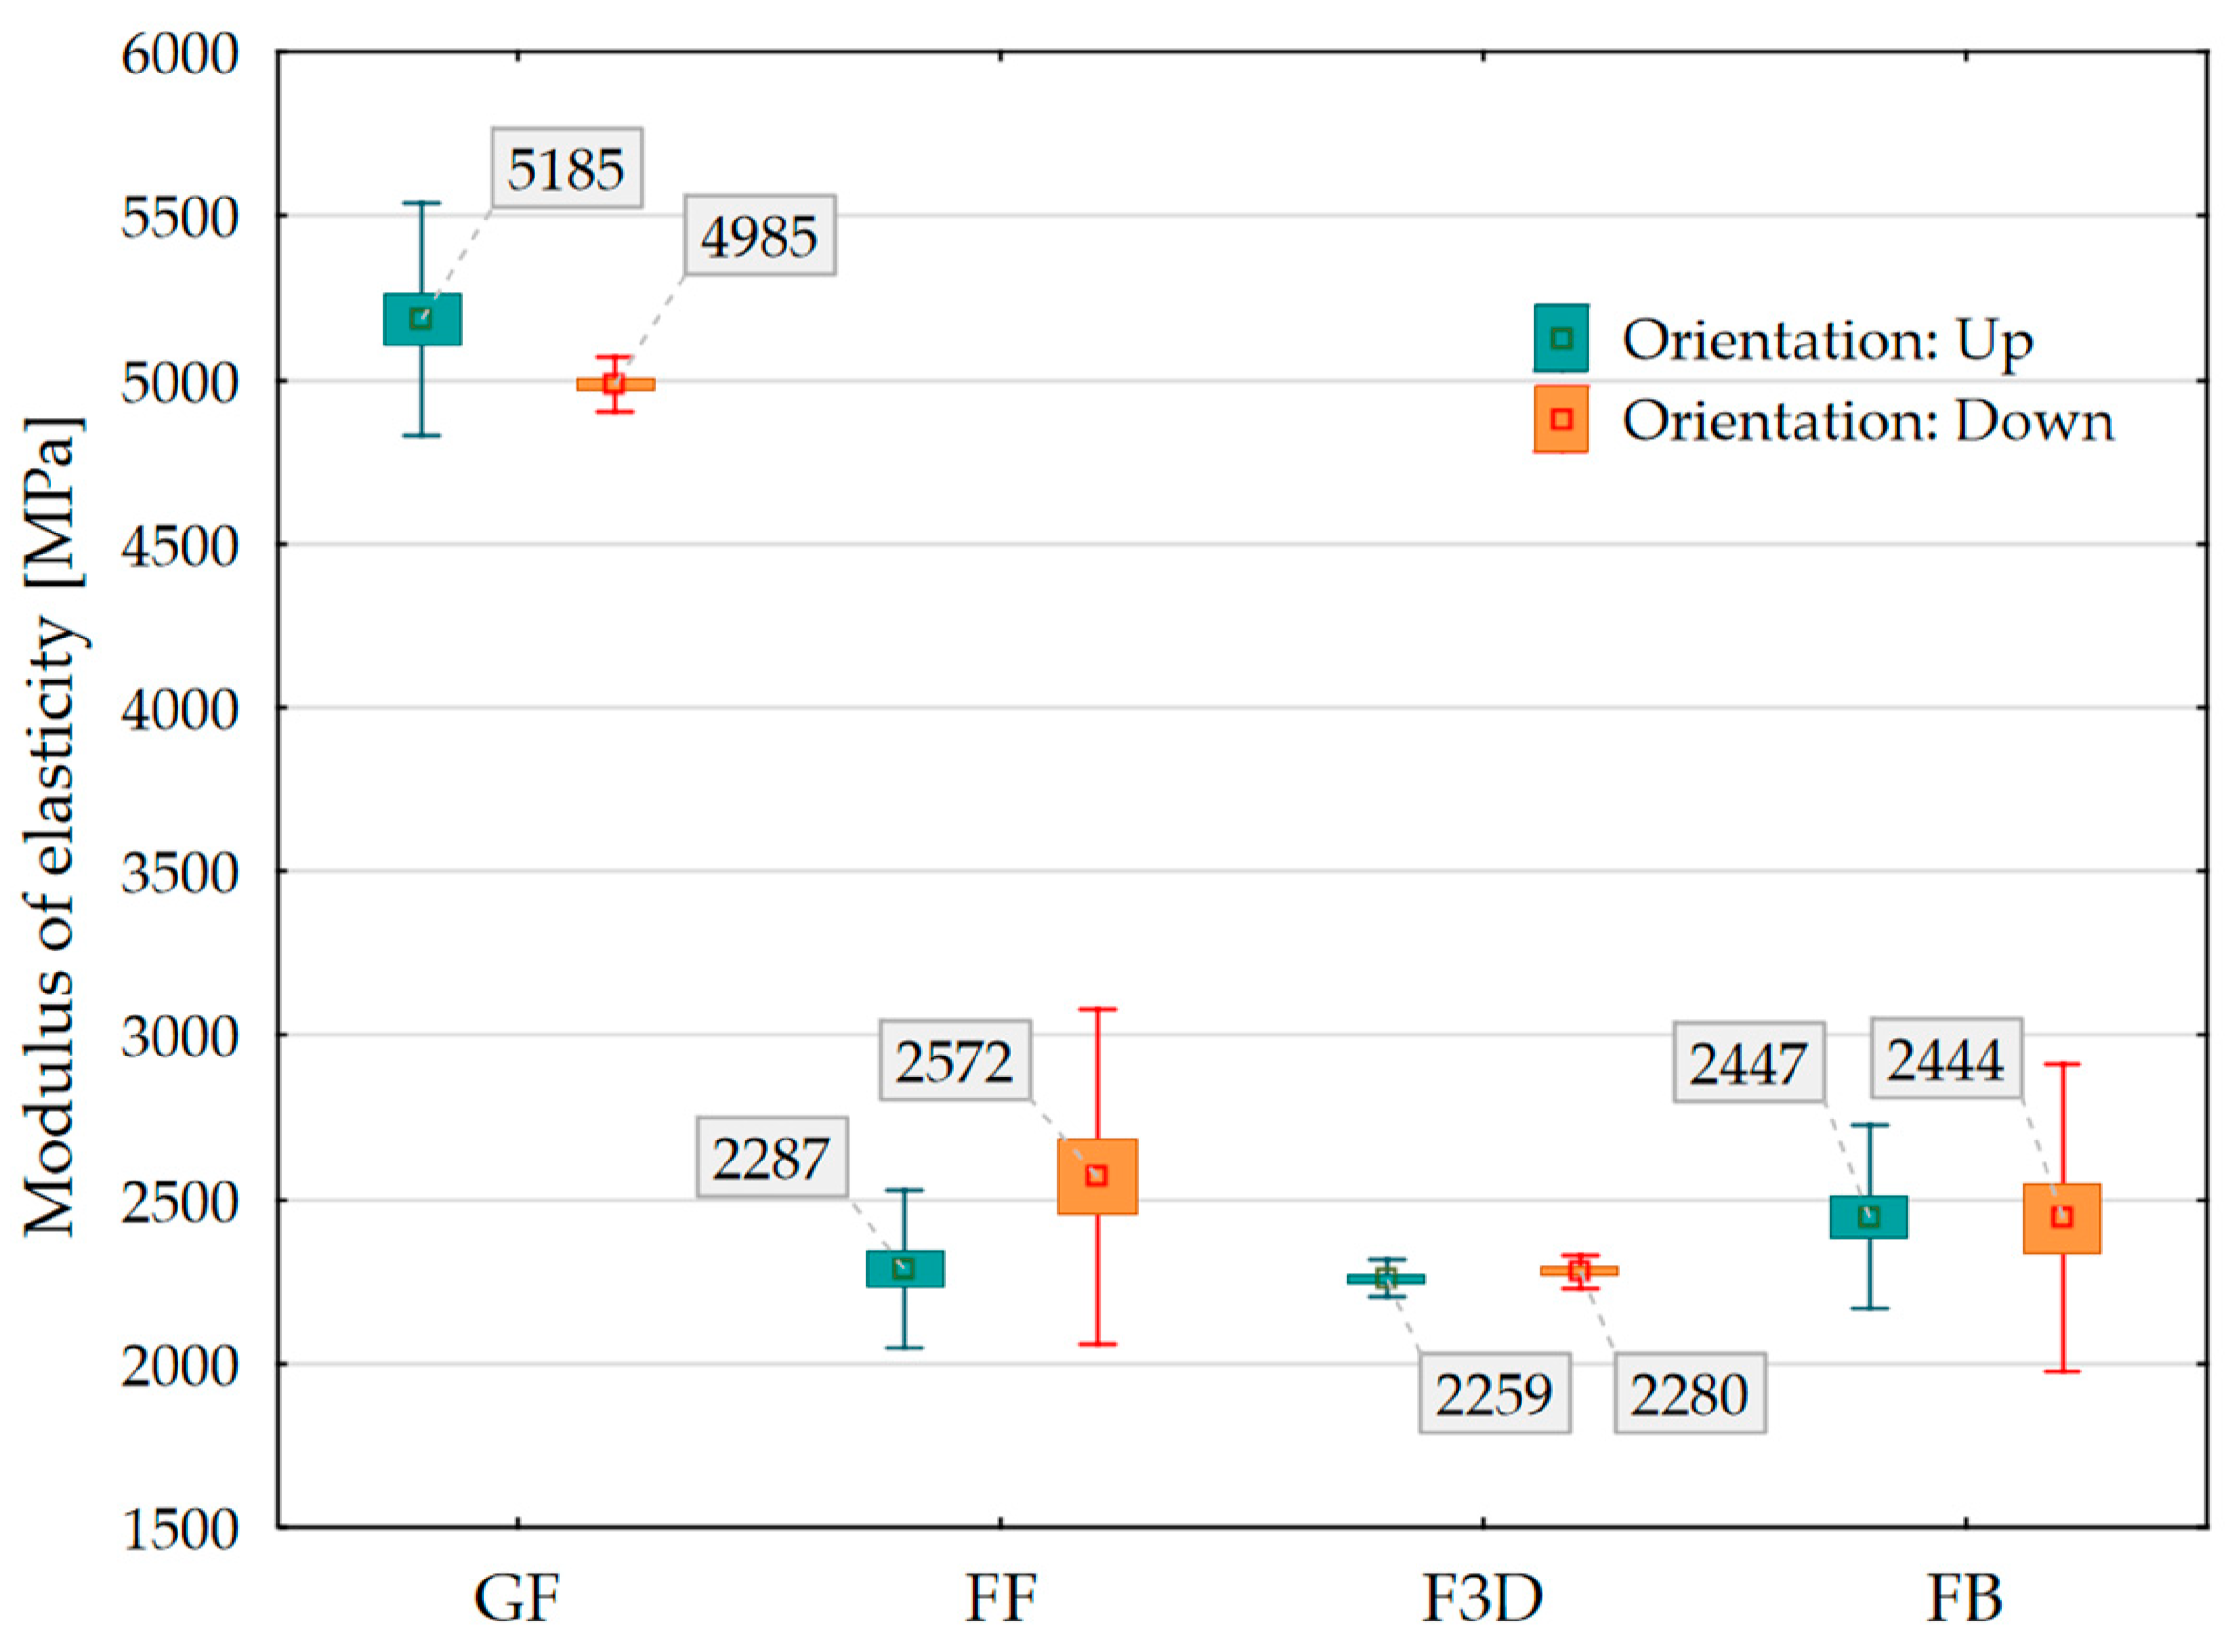
Figure 6.
Bending strength of samples categorized by core.
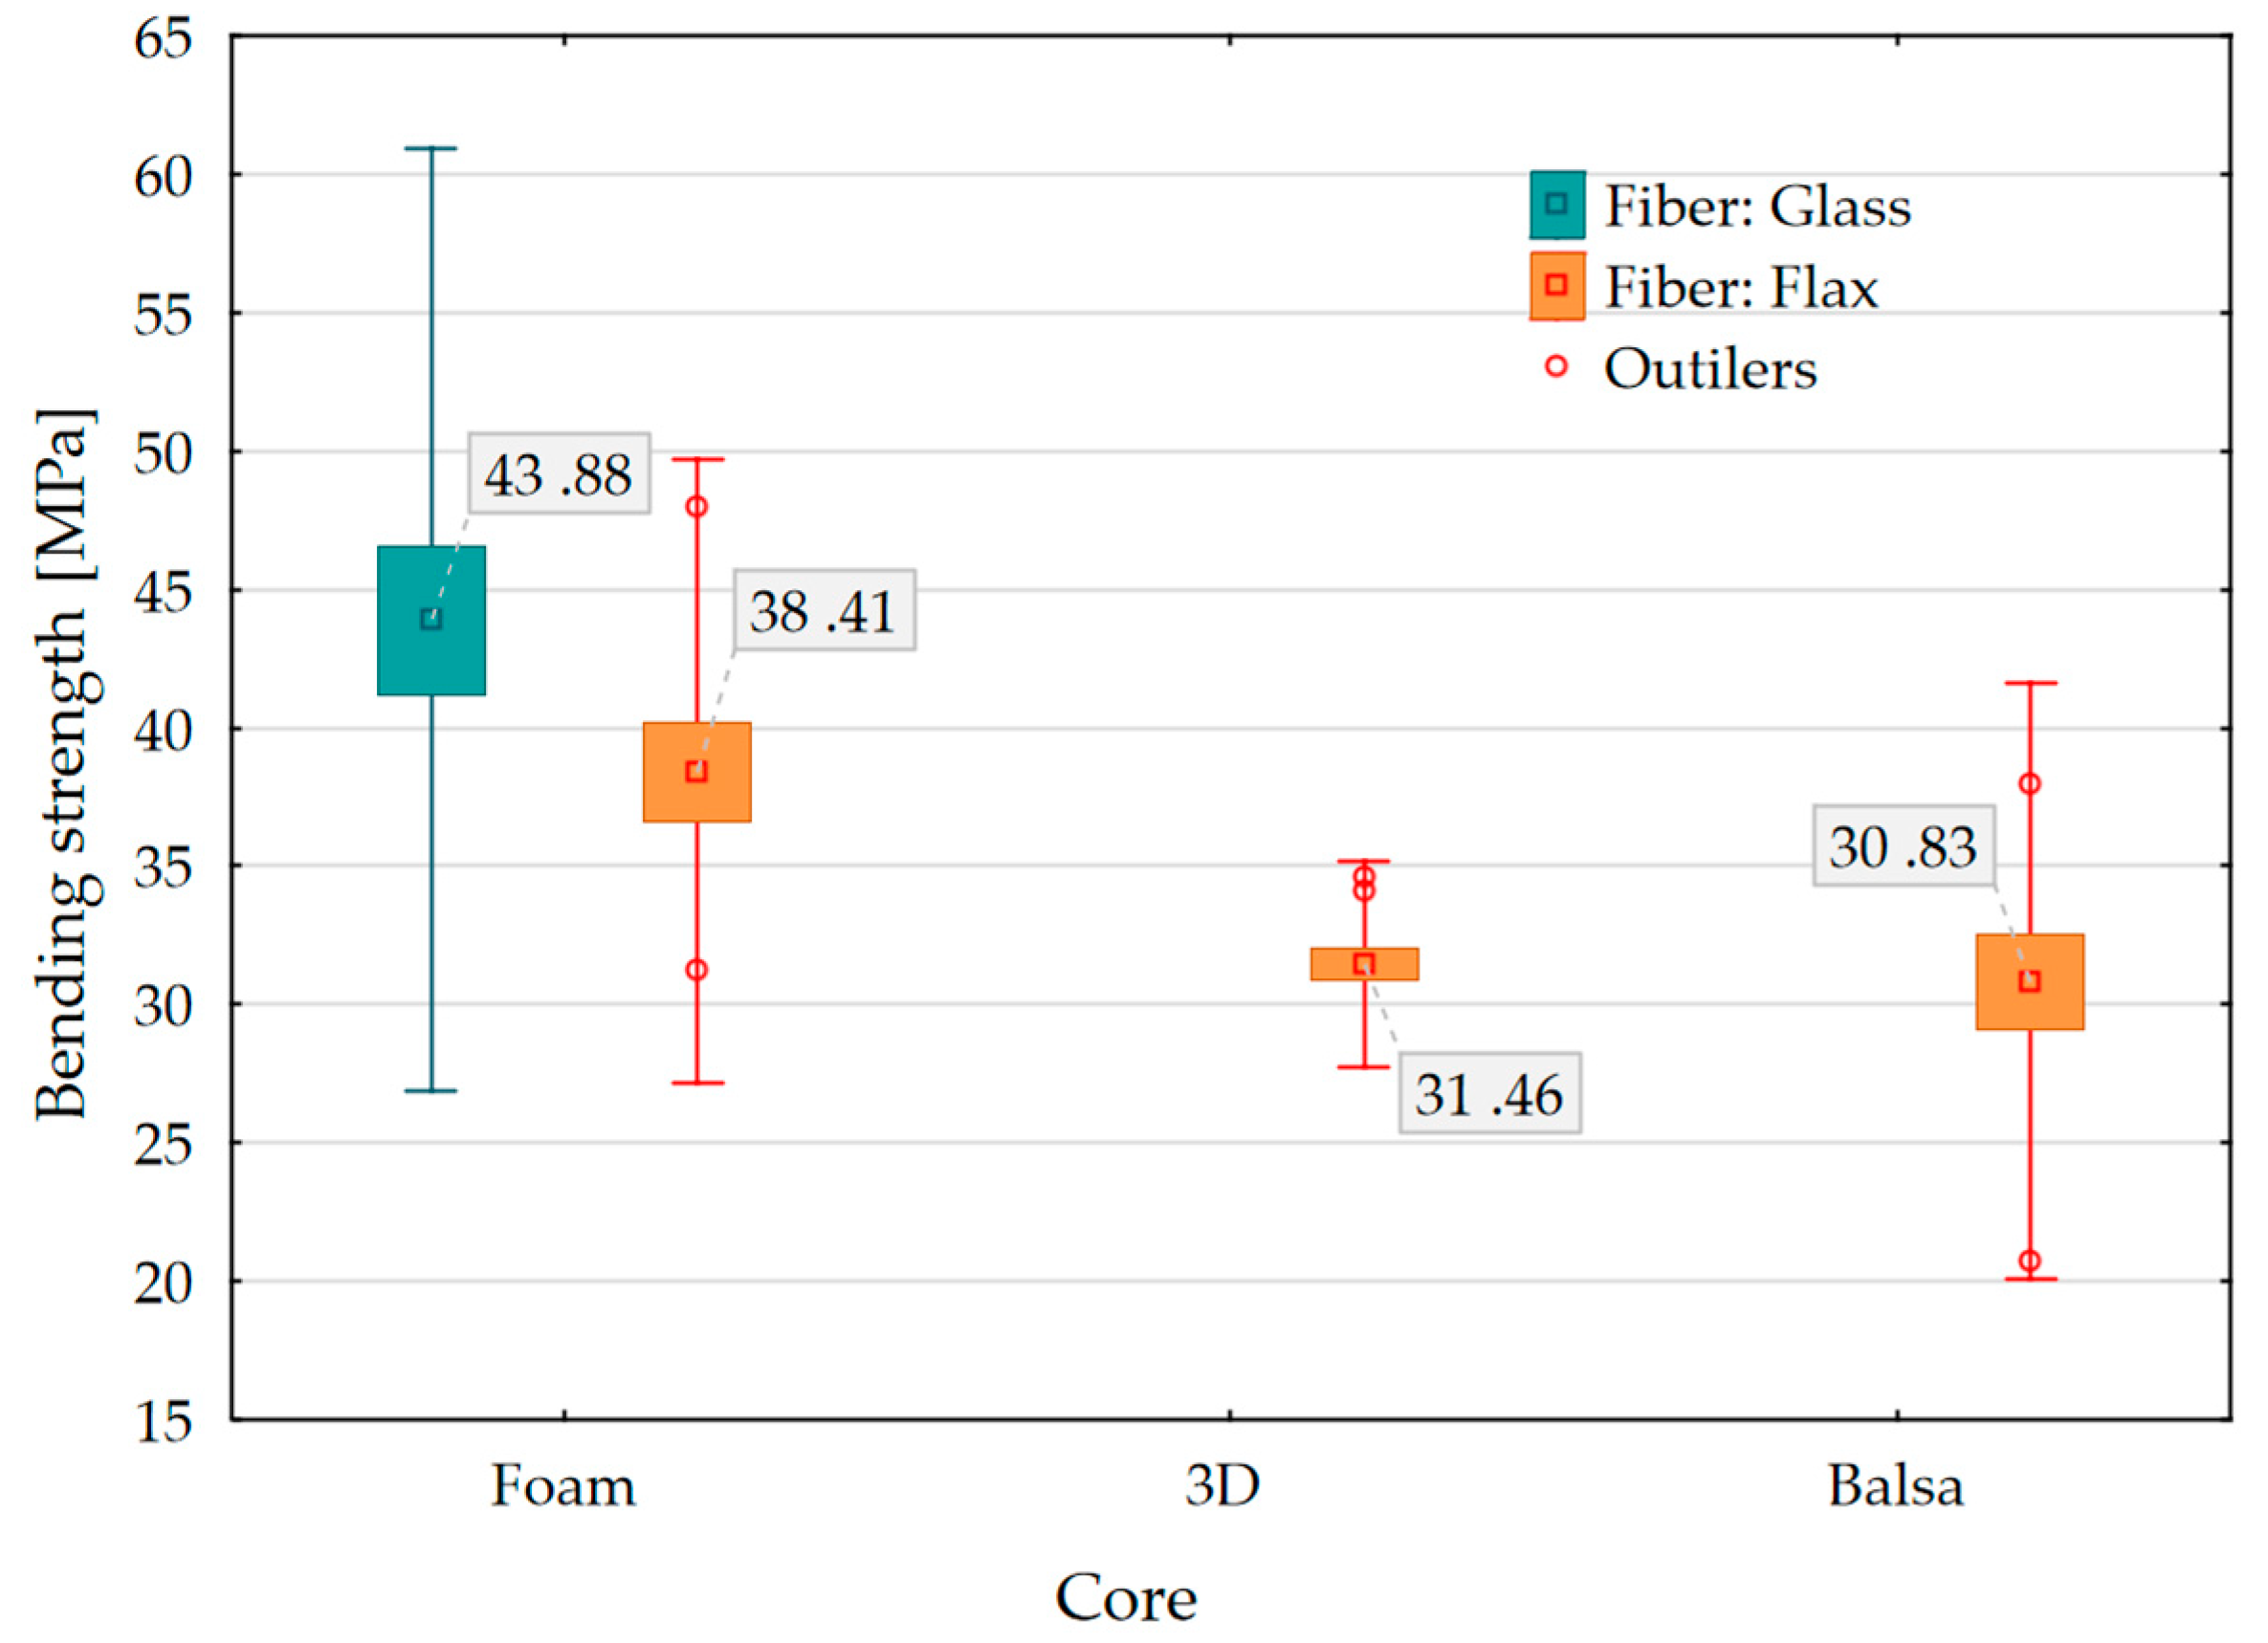
Figure 7.
Bending strength of measured groups, categorized by orientation of samples during the test.
Figure 7.
Bending strength of measured groups, categorized by orientation of samples during the test.
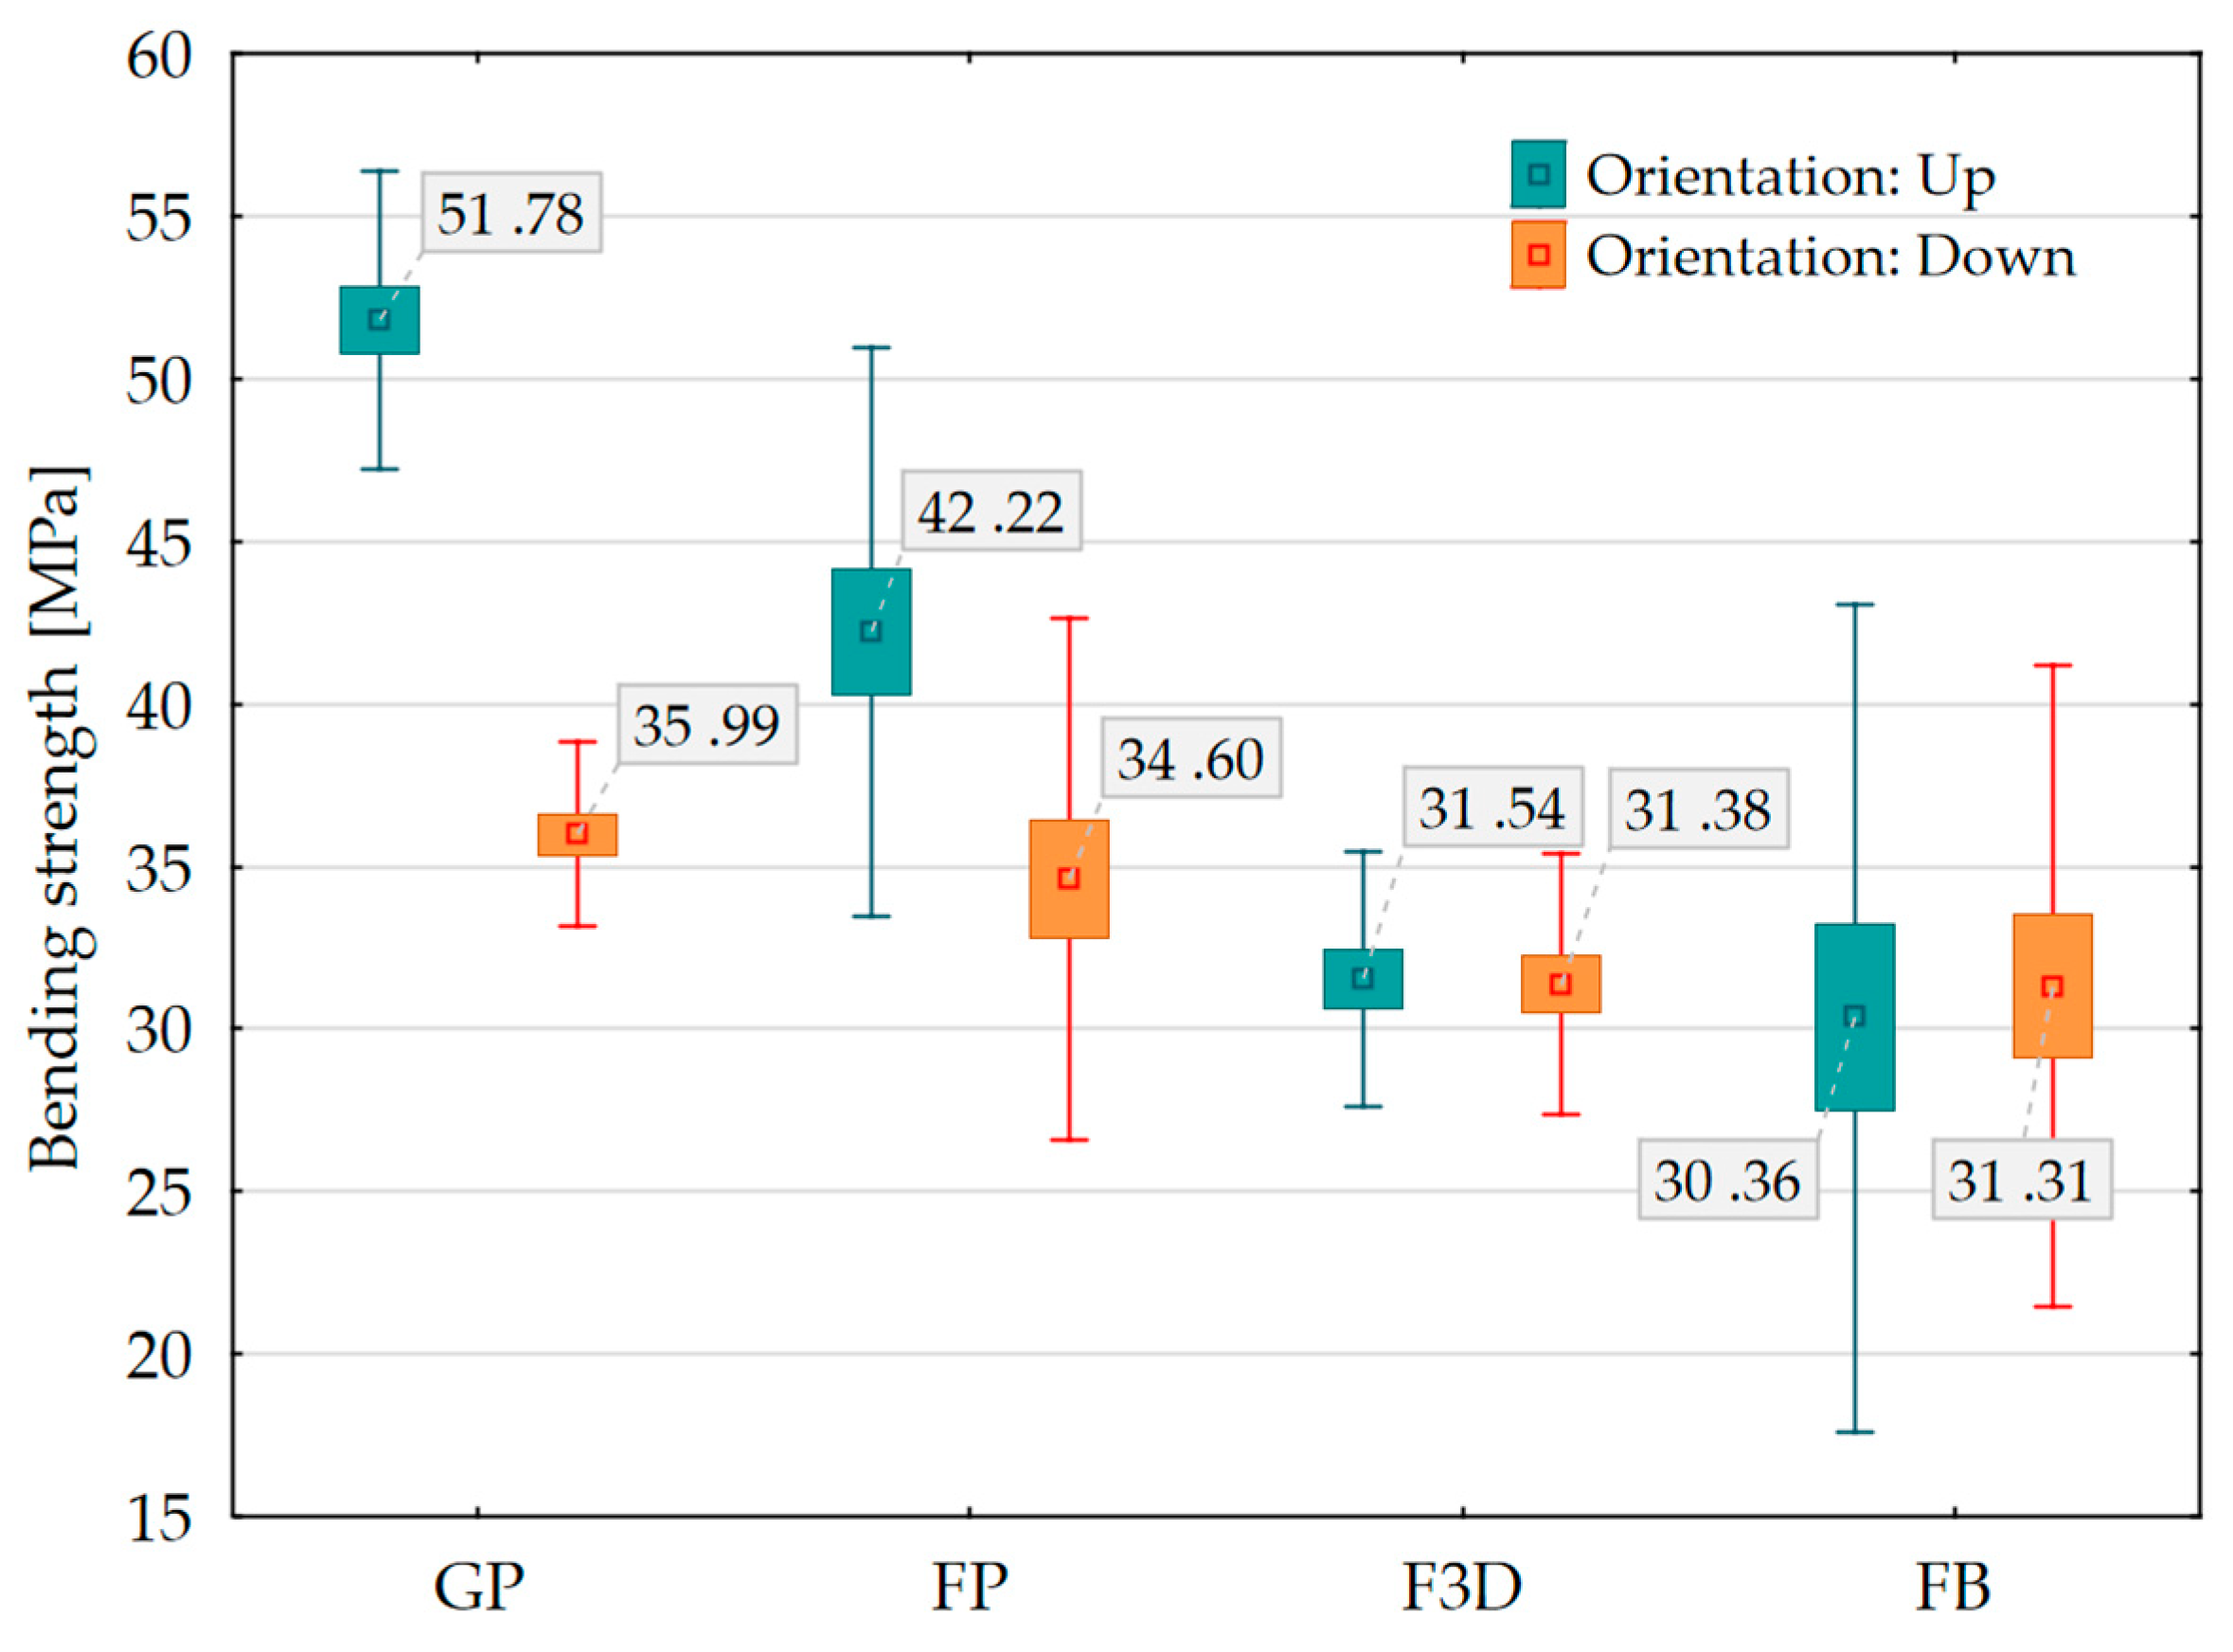

Table 1.
Composition of sandwich structure groups.
| Group | Fiber | Core |
|---|---|---|
| GF | Aeroglass 200 g/m2 twill | PVC core foam |
| FF | FLAXDRY-BL200 200 g/m² | PVC core foam |
| F3D | FLAXDRY-BL200 200 g/m² | PolyLight 1.0 LW-PLA |
| FB | FLAXDRY-BL200 200 g/m² | End-grain balsa core |
Table 2.
Density parameters for sample groups.
| Group/Sample | x̄ [kg/m3] |
Min [kg/m3] |
Max [kg/m3] |
SD [kg/m3] |
|---|---|---|---|---|
| GF | 416.564 | 399.96 | 437.22 | 15.77 |
| FF | 432.21 | 416.88 | 447.56 | 12.83 |
| F3D | 424.46 | 396.73 | 440.76 | 17.63 |
| FB | 405.41 | 384.93 | 431.86 | 18.29 |
Table 3.
Measured data of modulus of elasticity, regardless of samples orientation.
| Group | x̄ [MPa] |
Min [MPa] |
Max [MPa] |
SD [MPa] |
|---|---|---|---|---|
| GF | 5085 | 4915 | 5410 | 175.31 |
| FF | 2430 | 2121 | 2971 | 254.24 |
| F3D | 2269 | 2217 | 2311 | 29.93 |
| FB | 2445 | 2197 | 2783 | 193.40 |
Table 4.
Measured data of bending strength related to groups, regardless of samples orientation.
| Group | x̄ [MPa] |
Min [MPa] |
Max [MPa] |
SD [MPa] |
|---|---|---|---|---|
| GF | 43.88 | 34.52 | 54.40 | 8.67 |
| FF | 38.41 | 31.24 | 48.01 | 5.63 |
| F3D | 31.45 | 29.17 | 34.62 | 2.01 |
| FB | 30.83 | 20.72 | 37.04 | 5.68 |
Disclaimer/Publisher’s Note: The statements, opinions and data contained in all publications are solely those of the individual author(s) and contributor(s) and not of MDPI and/or the editor(s). MDPI and/or the editor(s) disclaim responsibility for any injury to people or property resulting from any ideas, methods, instructions or products referred to in the content. |
© 2024 by the authors. Licensee MDPI, Basel, Switzerland. This article is an open access article distributed under the terms and conditions of the Creative Commons Attribution (CC BY) license (http://creativecommons.org/licenses/by/4.0/).
Copyright: This open access article is published under a Creative Commons CC BY 4.0 license, which permit the free download, distribution, and reuse, provided that the author and preprint are cited in any reuse.


