
Submitted:
04 December 2024
Posted:
05 December 2024
You are already at the latest version
Abstract
In recent years, secondary schools and university departments related to geography teach various topics using Geographic Information Systems (GIS). Especially, WebGIS, available online without installing additional software, is a recognized powerful educational tool for educators and students. On the other hand, research on how students perceive and utilize digital maps to understand geographical objects and investigate the complexity of such learning is insufficient. Therefore, we initiated a study to clarify these research questions by implementing Disaster Risk Reduction (DRR) education using a digital hazard map developed with WebGIS technology, focusing on young people in Japan, including secondary school and university students. The results indicate that DRR education using a simple digital map is helpful for a wide range of students regardless of age. Still, some perceive difficulty in learning using a digital hazard map. Map representation strongly affects students’ interpretation of vulnerable areas. The maps’ layers and functions are better to add gradually corresponding to students’ ability and familiarity with GIS in the initial stage of geography education using maps to prevent students’ negative impressions caused by complex issues and technical problems.
Keywords:
geography education
; DRR education
; WebGIS
; young people
1. Introduction
Various digital maps incorporating Geographic Information Systems (GIS) technology have been published worldwide. These products are applied to implement geography education for young people, including junior high school students, senior high school students, and university undergraduates (e.g., [1,2,3,4]). Geography became compulsory in Japanese senior high schools in 2022, where GIS and paper map utilization skills are considered fundamental topics [5]. Japanese geography researchers and educators have led the practice in various geography classrooms using digital maps [6]. Digital maps with abundant spatial layers help interpret geographical objects for learners [7]. GIS in education allows students to analyze geographical data from different perspectives, positively impacting their attitudes [8]. Jo et al. [9] noted that their educational activities using WebGIS significantly enhanced students’ spatial thinking skills.
WebGIS is an effective tool for understanding geographical features compared to printed maps, especially for young people [7]. While the educational potentials of WebGIS are also acknowledged among Japanese educators, research evaluating how students recognize geographic information on digital maps is insufficient. Additionally, even if young people use WebGIS for geography learning, some face challenges in understanding geographic features. Until recently, many students had not experienced geography classes using WebGIS due to the limited availability of internet connections and PCs in regular classrooms at Japanese junior and senior high schools. However, the internet environment has improved recently, enabling various subjects to incorporate online learning materials. In geography classrooms using WebGIS, educators must choose appropriate data layers, visualization methods, WebGIS functions, and devices (platforms) for students’ geography learning. To achieve a more enriched geography education, it is crucial to address the following two questions:
- Is using a digital map in geography education difficult for students?
- How do students interpret geographical features on a digital map?
Therefore, we initiated a study to clarify two research questions by implementing Disaster Risk Reduction (DRR) education using a digital hazard map developed with WebGIS technology, focusing on junior and senior high school and university students’ geography learning. We conducted educational classes and workshops where students utilized a simple interface digital map. Furthermore, we asked them questions regarding disaster risks in targeting areas and the utilization of digital maps. This paper reports the methodology employed in the educational events, the developing process of the digital map, the evaluation methods for assessing how students utilize and interpret a digital map, and the implementation results. To propose the effective utilization of the digital map in geography education, we further discuss its advantages and challenges.
2. Methods
2.1. Outline of the DRR Classes
Natural disasters have significant impacts on society. Young people, who will lead future communities, are expected not only to evacuate safely during hazardous events but also to use maps to assess risks from an overhead perspective. DRR education in schools is essential to enhance students’ awareness of the vulnerability of residential areas; its teaching has been focused on worldwide [10]. DRR education in Japan has been conducted and updated in elementary to secondary schools across various subjects, including geography. The current senior high school geography national curriculum emphasizes teaching various geospatial topics using topographic and hazard maps [11]. DRR education for young people in Japan has been gaining more attention due to the recent disaster damage caused by floods, eruptions, earthquakes, and tsunamis. To prevent severe human injuries, the government has distributed paper and online hazard maps to the citizens. Reading such maps, which illustrate dangerous levels and DRR facilities, citizens can easily understand the location of evacuation shelters and interpret disaster risks in their residential area. Therefore, young people must learn how to read a digital hazard map to interpret such disaster risks.
We conducted three types of DRR education events from 2020 to 2022: Cases A, B, and C (Table 1). In total, 144 participants joined our events. Case A was conducted in 2021 and 2022 in a “Geography” university lecture. This subject was prepared as part of a teacher fostering course aimed at participants in this class obtaining a junior high school teacher license for social study. The majority were second-grade students from outside the geography department. The class was held twice, with a total of 39 students participating.
Case B was part of a one-day workshop where students experienced GIS and related technology such as Unmanned Aerial System (UAS) and Virtual Reality (VR). Junior and senior high school students who saw an online advertisement applied to the workshop. This educational event was held in 2020, 2021, and 2022. The DRR classes were conducted eight times: seven times onsite and once online. The online class was held due to the COVID-19 situation. Each onsite class had about seven participants, while the online class had 18 participants. In total, 68 participants attended the DRR lessons.
Case C was a workshop targeting only high school students who live in Ibaraki Prefecture, Japan. We conducted Case C classes twice in 2022, where each lesson resulted in about 20 participants. In total, 37 participants attended the lessons. This workshop’s program resembled that of Case B.
2.2. Development of Digital Hazard Map Using WebGIS Technology
WebGIS provides users with geographic visualization and analytical functions accessible through a web browser [10,12]. The use of WebGIS in education is particularly advantageous compared to the use of Desktop GIS, which demands time, commitment, and energy for educators [13]. Many countries have been developing and providing digital maps using WebGIS technology. However, some of these maps, implementing too many spatial layers and functions, often pose challenges for most of the public [14]. Therefore, in this research, we developed an original simple digital hazard map with WebGIS libraries named ArcGIS Maps SDK for JavaScript (https://developers.arcgis.com/javascript/latest/), which is a product for creating digital maps and spatial analysis applications for web publishing by ESRI (Environmental Systems Research Institute, Inc., USA).
Our developed map shows flood risks in the 23 special wards of Tokyo (Figure 1). The wards include potentially dangerous areas below sea level produced by excessive groundwater pumping. Our map helps students understand hazard risks in the target area by browsing multiple pieces of information. The digital map was implemented in only three functions: displaying and switching layers, measuring objects, and searching location addresses. The map incorporated six types of raster tiles: a background basic map showing place names, roads, and buildings, a topographic map, a hill-shade map, a recent aerial photo, a previous aerial photo in the late 1940s, and a flood prediction area. The World Topographic Map ESRI provided was used as a background basic map. Other raster tiles have been distributed by the Ministry of Land, Infrastructure, Transport and Tourism (MLIT) on the web. The polygon data showing areas below the sea level were created by clipping cells of a Digital Elevation Model (DEM). Only polygons exceeding 2000 m² each were included for better map visibility. This dataset and the point data of evacuation shelters published by the MILT were converted to Keyhole Markup Language (KML) files and implemented into the digital map. The evacuation shelter data were embedded with information regarding facility names, addresses, and the maximum number of persons to stay. Additionally, we added the outlines of the 23 special wards of Tokyo to indicate the learning area in the class.
Users can access the map online using laptops, tablets, and smartphones. During the practices, almost all Case-A students used smartphones because the classes were conducted in a regular classroom without PCs for students to use. On the other hand, Case-B students who attended the onsite events used laptops provided by the event organizers. Case-C students used Desktop PCs in the university’s PC room. When an online class was conducted in Case B, each student operated any available device. In all practical exercises, each student could use an individual device.
2.3. Procedure of the Practices
In our practices, the number of students, their grades, and lecture times differed, but the lesson procedure was the same (Table 2). The learning objectives for students of the classes included understanding the value of WebGIS in DRR learning. Case A was conducted with one educator only, while the other cases were led by one educator and one or two assistants.
The classes consist of four parts: 1) lecturing on concepts of flood and geomorphological condition of the 23 special wards of Tokyo, 2) introducing how to use our digital map, 3) student DRR learning using the digital map through the exercise tasks, and 4) explaining correct answers of the tasks and how to interpret disaster risks on the digital map after conducting a questionnaire survey and collecting students’ assignments.
In the first part, we lectured basic knowledge of flood and terrain characteristics of the 23 Special Wards of Tokyo, focusing on the eastern area with lands below sea level. We also educated about past flood damages, such as the disaster caused by the Kathleen Typhoon in September 1947. In Case A, we had time to explain other disasters, such as earthquakes and tsunamis. In the second part, we introduced how to use the digital map while displaying map operation menus on a screen. Students learned the meaning of each function and layer on the map. We also asked students to take notes. In the third part, the students operated the digital map at their own pace to take five exercises and one assignment. The students could ask the educator, an assistant, or their peers if they encountered any questions or technical issues during the learning.
The five exercises were related to the functions and layers explained in the second part. The students challenged each exercise while moving screen viewpoints, searching addresses, measuring distance, and displaying layers on the digital map. After completing the five exercises, students who had time took an extra assignment to select some high-risk locations. The students wrote each location’s name and the reason for pointing out flood risk on the online form. Only students in Case A had to report the result of this assignment because the lesson was conducted as part of the university curriculum. It was not compulsory in the other cases. Additionally, we asked students two questions: 1) impressions of the difficulty in the DRR learning using the digital map, and 2) the usability of the map. The students evaluated the items from one to five stages, and a value close to five indicates that their impressions were more positive. We explained the purpose of these questionnaires at the beginning of the lecture and informed students that their responses would be used in the study. Both surveys were conducted only after obtaining students’ consent to participate.
After collecting the results of the questionnaires and assignments from the students, we moved to the fourth part. To enhance the student’s learning experiences and achieve the educational objectives of the class, we provided explanations of the correct answers for the five exercises. Additionally, we demonstrated how to interpret hazard risks using the digital map and geographical knowledge while displaying the map operating screen.
3. Results
The questionnaire answers were collected from 144 students: 105 junior and senior high school students and 39 university students. Assessing the levels of difficulty in DRR learning using the digital map, five students responded with “Very difficult,” 56 students “Difficult,” 56 students “Neither,” 22 students “Easy,” and five students “Very easy” (Figure 2). We used the Whitney U test to determine whether statistically significant differences in the impressions exist between junior and senior high school students and university students. The students’ responses regarding difficulty showed no statistically significant difference in the result of the Mann-Whitney U-test (p > 0.05); similar trends were observed between university students and other students (Figure 3, Table 3).
In the question regarding the level of usability of the digital map, three students responded with “Very low,” 11 students found it “Low,” 40 students considered it “Neither,” 48 students perceived it as “High,” and 42 students found it “Very high” (Figure 4). There was a statistically significant difference in the result of the Mann-Whitney U-test (p < 0.05). University students tended to form a more negative impression of using the digital map than junior and senior high school students (Table 3, Figure 5).
In the practices, we collected assignments from 81 students, including 36 university and 45 junior and senior high school students. They described the location names or facility names of high-risk areas in the 23 special wards of Tokyo, up to three locations, and reasons for the selection. To identify where students evaluated disaster risks, an assignment required writing the district names, such as “Senju 5, Adachi Ward,” or the nearest facility, such as the Rokugoudote station. If students did not provide detailed district names, we estimated place locations based on the written reasons. When this was challenging, we used typical locations in the area. In the research, some students may have found it complex to identify disaster risks using a local district name, given that floods and their damages often extend beyond district boundaries. However, the written location names still provide general information about students’ thinking.
The students pointed out 185 high-risk places, and their locations were identified and mapped using the names of written places or facilities. To understand the relationship between the high-risk area detected by students and other layers such as shelters and flood prediction areas, we also created a 500 m square grid fishnet. The points were allocated within 117 grids (Figure 6).
Figure 6 shows that many students focused on both sides of the Ara River from the mouth to upstream. Many assessed hazard risks in the areas below sea level with high inundation from 3.0 to 5.0 m or 5.0 to 10.0 m. The areas below sea level intersect 64 of the 117 grids (54.7%).
From students’ descriptions of reasons for site selection, we can estimate the types of information they used. When interpreting disaster risks on the digital map, students often used the layer of flood prediction information and the layer showing areas below sea level. Other than these, the following five types of information were occasionally used: 1) current land use, 2) comparisons of current and past land use, 3) the number of shelters or their locations, 4) shelter capacity, and 5) distance to shelters or rivers. Students’ comments regarding the implemented layers on the map, including overlapping responses, can be summarized as follows. There were 54 descriptions regarding the current land use, such as the density of houses, indicating that the students used the base map, topographic map, and current aerial photos. The 34 descriptions of land use change were from the current and past aerial photos. For example, one student indicated the transition from agricultural to residential land use. There were 44 descriptions of the number of shelters or their locations, often pointing out their limited distribution, and 13 described the capacity of shelters. There were 10 descriptions of which distance measurement tool was used. Besides, only one mentioned the use of the hill-shade map.
4. Discussion
The trend of difficulty in the results is similar for university and high-school students, suggesting that DRR learning using a simple digital map is valuable for students regardless of age. On the other hand, approximately 40% of the students reported challenges in understanding disaster risks on the map, although about 90% found no difficulty in using the digital map. These results indicate that while WebGIS is a valuable tool for geography education, its professional use and the interpretation of geographical features require students to develop more advanced skills.
Digital natives frequently see digital maps daily [15]. In our cases, most students could observe geospatial information related to hazard risks while operating our simple digital map without encountering technical issues with map utilization. Xiang and Liu [3] pointed out that a digital map with a complex interface poses frustration for some students. Geography education using WebGIS is valuable for young people; however, some educators have a negative impression of using electronic teaching materials in the classroom [10]. Our results suggest that a simple digital map can be easily used in geography education with minimal technological difficulties, allowing educators to focus on teaching geospatial thinking.
Our developed digital map is implemented with two types of layers: 1) at-a-glance information layers, such as inundation prediction areas, areas below sea level, and distribution of shelters, and 2) associative information layers (indirect information for flood), such as different periods of aerial photographs and hill-shade maps. Many students can observe and understand hazard risks easily using at-a-glance information. However, it was challenging for them to interpret risks using indirect information about floods, even though they had received a quick lesson before attempting the map-related exercises. Therefore, providing clear guidance between the observing and interpreting stages may be beneficial before engaging in map-related exercises. Handling multiple layers and functions can be challenging for students unfamiliar with GIS. Numerous students did not utilize the hill-shade layer and measurement tool during the assignment. Utilization of these layers and functions may need imagination skills for hazard risks from various aspects using geographical knowledge. For instance, by utilizing the hill-shade layer and the inundation prediction areas layer, students could identify low-risk areas based on subtle topographic differences and better understand high-risk areas. To apply the initial step in DRR education using digital hazard maps, students and educators should prioritize familiarity with GIS to understand students’ stumbling points. At this stage, it may be essential to simplify technical issues related to digital maps by utilizing simple function maps and refraining from introducing complex geographical topics to students. Gradually adding more layers and functions may enhance the understanding of GIS and geography concepts, aligning with the situation as students become more familiar with GIS. The results show that even our simple map, which included only six layers and a few functions, introduced complexity to some students’ learning. Therefore, it is essential for educators to carefully select the minimum number of layers on the digital map that align with the core learning topics for each geography class.
The high-risk areas identified by students were distributed in deep flood-predicted areas and areas below sea level. Additionally, the students considered vulnerabilities in areas lacking evacuation shelters or high-density residential buildings. The process by which students decide the areas’ vulnerability is unclear. However, the colors and density of the features may have strongly influenced the students’ interpretation. On the other hand, even slight differences among each threshold value setting in cartographic representation may lead students to underestimate disaster risks. Therefore, educators should clearly explain GIS concepts before using maps.
Only 81 out of 144 students submitted assignments. A possible reason is the time constraints in the classes, particularly in Cases B and C. Besides, the complexity of geospatial thinking may have posed learning difficulties for some students. This study did not specifically identify which geospatial thinking ability was problematic for students, as this comprises a combination of multiple skills [16]. To enhance geography education using maps, this issue needs to be investigated in more detail in future research.
The assessments of difficulty and the usability of the map varied among individuals, as shown by studies such as Xiang and Liu [3] and Song et al. [4]. To minimize learning disparities, it is essential to support students immediately when they encounter complexity. In higher education regarding GIS software for geospatial analysis, various support using teaching methods, educational materials, and learning platforms were considered (e.g., [17-19]). To support students’ learning using WebGIS, it will be essential to identify the traits of students prone to learning difficulties and ascertain which layers and functions contribute to negative impressions.
Using digital maps can enhance participants’ learning satisfaction compared to traditional paper maps [20] and enable DRR education with abundant geospatial information [7]. Our study found that junior and senior high school students who used PCs tended to rate the map usability more positively than almost all university students who used smartphones. This result suggests display size may influence the operation of the digital map. Therefore, it is preferable to conduct geography education using digital maps in a PC room rather than a regular classroom.
5. Conclusions
This research conducted DRR education events to evaluate the students’ impression of class using WebGIS implemented with multiple layers and functions for DRR learning and to examine how young people interpret hazard risks using the digital map. The students could explore flood risks while operating the digital map, even though some found the learning process complex. From this study, we derive three main conclusions:
- 1.
- Complexly for learning
DRR education using a simple digital map is helpful for junior high school students and above, regardless of age. However, it is necessary to follow up with students unfamiliar with geography learning using digital maps. Accumulating and sharing students’ stumbling points during learning and their characteristics is essential for enhancing geography education.
- 2.
- Map representation and students’ interpretation
The layers that can quickly understand hazard risks at a glance, such as flood prediction areas, are effective for students’ geographical perception. On the other hand, some students find it challenging to consider disaster scenarios using indirect information for floods, such as different periods of aerial photographs. Therefore, educators should provide clear guidance during the observation and interpretation stages for hazard risks when introducing teaching using hazard maps. At the beginning of geography classes with digital maps, educators should focus on helping students become familiar with basic GIS operations and interpret geographical features through multiple layers, spending at least 20 to 30 minutes.
- 3.
- Map utilization situation and design
It is necessary to consider the utilization situation of a digital map and its design. Using a monitor larger than a smartphone display is better when using a digital map. The maps’ layers and functions are better added gradually, corresponding to students’ ability and familiarity with using GIS in the initial stage of geography education. This approach helps prevent students’ negative impressions caused by complex issues and technical problems regarding the use of digital maps.
Future work should enhance students’ educational outcomes by improving teaching procedures and understanding why students struggle with learning. This research had a limitation in accurately detecting where students identified disaster risks on the map in detail and understanding how they used different types of layers and perceived geographical features. To address this issue, we will survey how students understand disaster risks on the digital map at each learning step, such as observing and interpreting geographical features. Additionally, we will identify the factors contributing to differences in individual learning outcomes to enhance geography education.
Author Contributions
Conceptualization, Hiroyuki Yamauchi, Jiali Song, Takashi Oguchi, Takuro Ogura, and Kotaro Iizuka; methodology, Hiroyuki Yamauchi, Jiali Song, Takashi Oguchi, and Takuro Ogura; software, Hiroyuki Yamauchi; formal analysis, Hiroyuki Yamauchi, Takashi Oguchi, and Kotaro Iizuka; investigation, Hiroyuki Yamauchi, Takashi Oguchi, and Kotaro Iizuka; writing—original draft, Hiroyuki Yamauchi; writing—review & editing, Jiali Song, Takashi Oguchi, Takuro Ogura, and Kotaro Iizuka, Funding acquisition, Takashi Oguchi. All authors have read and agreed to the published version of the manuscript.
Data Availability Statement
The survey data are not publicly available due to privacy.
Conflicts of Interest
Not applicable.
References
- Hsu, H.P.; Tsai, B.W.; Chen, J. Teaching topographic map skills and geomorphology concepts with Google Earth in a one-computer classroom. Journal of Geography 2018, 117, 29–39. [Google Scholar] [CrossRef]
- Egiebor, E.E.; Foster, E.J. Students’ perceptions of their engagement using GIS-Story Maps. Journal of Geography 2019, 118, 51–65. [Google Scholar] [CrossRef]
- Xiang, X.; Liu, Y. Exploring and enhancing spatial thinking skills: Learning differences of university students within a web-based GIS mapping environment. British Journal of Educational Technology 2019, 50, 1865–1881. [Google Scholar] [CrossRef]
- Song, J.; Yamauchi, H.; Oguchi, T.; Ogura, T.; Wang, J. Effects of web geographic information system (GIS) technology and curriculum approaches on education for disaster risk reduction. Natural Hazards and Earth System Science 2023, 23, 3617–3634. [Google Scholar] [CrossRef]
- Ministry of Education Culture Sports Science and Technology. High school curriculum guidance (Announced in 2018), Available online:. Available online: https://www.mext.go.jp/content/20230120-mxt_kyoiku02-100002604_03.pdf (accessed on 21 June 2024).
- Ito, T. GIS and Geography education in Japan. In Geography Education in Japan.; Ida, Y., Yuda, M., Shimura, T., Ike, S., Ohnishi, K., Oshima, H., Eds.; Springer Japan: Tokyo, Japan, 2015; 152-162.
- Song, J.; Yamauchi, H.; Oguchi, T.; Ogura, T. Application of web hazard maps to high school education for disaster risk reduction. International Journal of Disaster Risk Reduction 2022, 72, 102866. [Google Scholar] [CrossRef]
- West, B.A. Student Attitudes and the Impact of GIS on Thinking Skills and Motivation. Journal of Geography 2003, 102, 267–274. [Google Scholar] [CrossRef]
- Jo, I.; Hong, J.E.; Verma, K. Facilitating spatial thinking in world geography using Web-based GIS. Journal of Geography in Higher Education 2016, 40, 442–459. [Google Scholar] [CrossRef]
- Li, J.; Xia, H.; Qin, Y.; Fu, P.; Guo, X.; Li, R.; Zhao, X. Web GIS for Sustainable Education: Towards Natural Disaster Education for High School Students. Sustainability 2022, 14, 2694. [Google Scholar] [CrossRef]
- Ishizuka, K. Institutional Issues in Disaster Prevention and Geography Education in Elementary and Secondary Education in Japan. In Geography Education in Japan.; Ida, Y., Yuda, M., Shimura, T., Ike, S., Ohnishi, K., Oshima, H., Eds.; Springer Japan: Tokyo, Japan, 2015; 121-134.
- Baker, T.R. WebGIS in education. In Geospatial technologies and geography education in a changing world: Geospatial practices and lessons learned. Solari, O.M., Demirci, A., Schee, J., Eds.; Springer: Berlin, Germany, 2015. [Google Scholar]
- Baker, T.R. Internet-based GIS mapping in support of K-12 education. The Professional Geographer 2005, 57, 44–50. [Google Scholar] [CrossRef]
- Hagemeier-Klose, M.; Wagner, K. 2009. Evaluation of flood hazard maps in print and web mapping services as information tools in flood risk communication. Natural Hazards and Earth System Sciences 2009, 9, 563–574. [Google Scholar] [CrossRef]
- Harvey, F.; Kotting, J. Teaching mapping for digital natives: New pedagogical ideas for undergraduate cartography education. Cartography and Geographic Information Science 2011, 38, 269–277. [Google Scholar] [CrossRef]
- Ishikawa, T. Geospatial thinking and spatial ability: An empirical examination of knowledge and reasoning in geographical science. The Professional Geographer 2013, 65, 636–646. [Google Scholar] [CrossRef]
- Argles, T. Teaching practical science online using GIS: a cautionary tale of coping strategies. Journal of Geography in Higher Education 2017, 41, 341–352. [Google Scholar] [CrossRef]
- Pendyala, V.S.S.N.G.K.; Vijayan, D. 2018. Developing Training Programs in Remote Sensing and Geospatial Applications. ISPRS Annals of the Photogrammetry, Remote Sensing and Spatial Information Sciences 2018, IV-5. [CrossRef]
- Žoncová, M.; Vojteková, J.; Tirpáková, A. Distance learning of Geographic Information Systems using Google Classroom: students’ assessment and perception. The Professional Geographer 2023, 75, 763–775. [Google Scholar] [CrossRef]
- Sari, K.P.; Komalasari, R.; Kanegae, H. Disaster learning through a map-based mobile application: an evaluation of its readability and user satisfaction. IOP Conf. Series: Earth and Environmental Science 2020, 592, 012004. 0120. [CrossRef]
Figure 1.
Interface of the developed digital map.
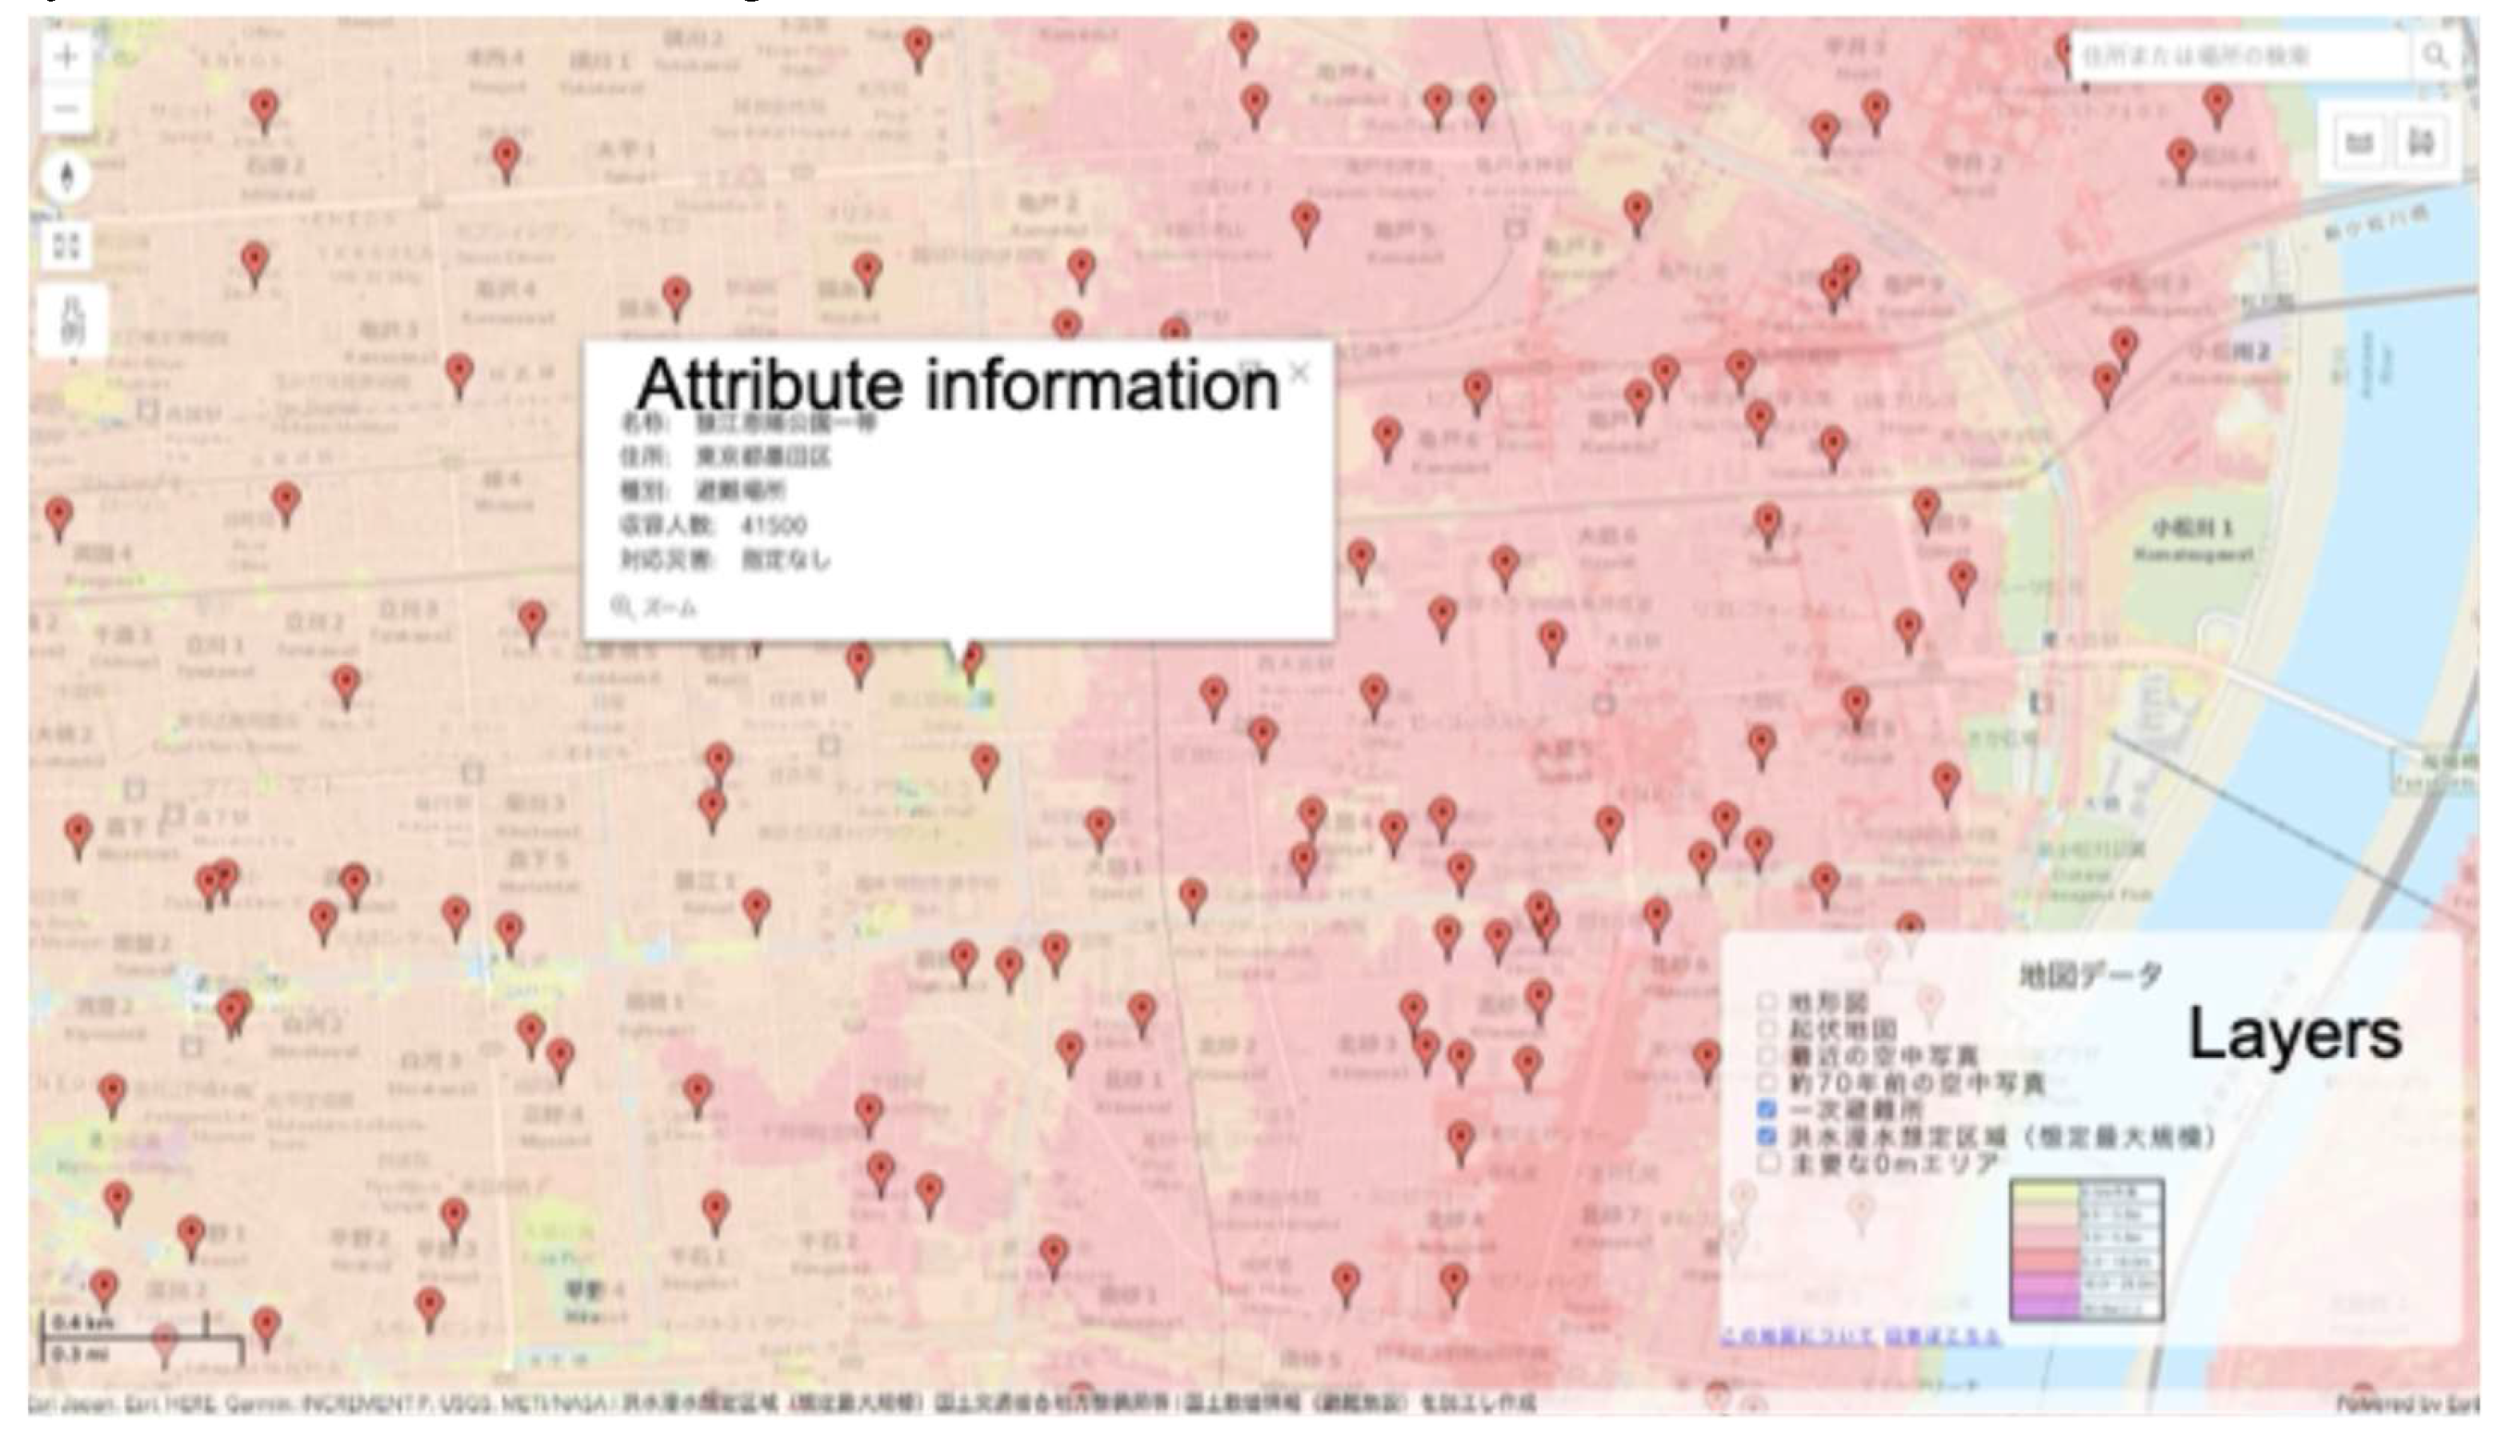
Figure 2.
Difficulty of the DRR learning using the digital map.
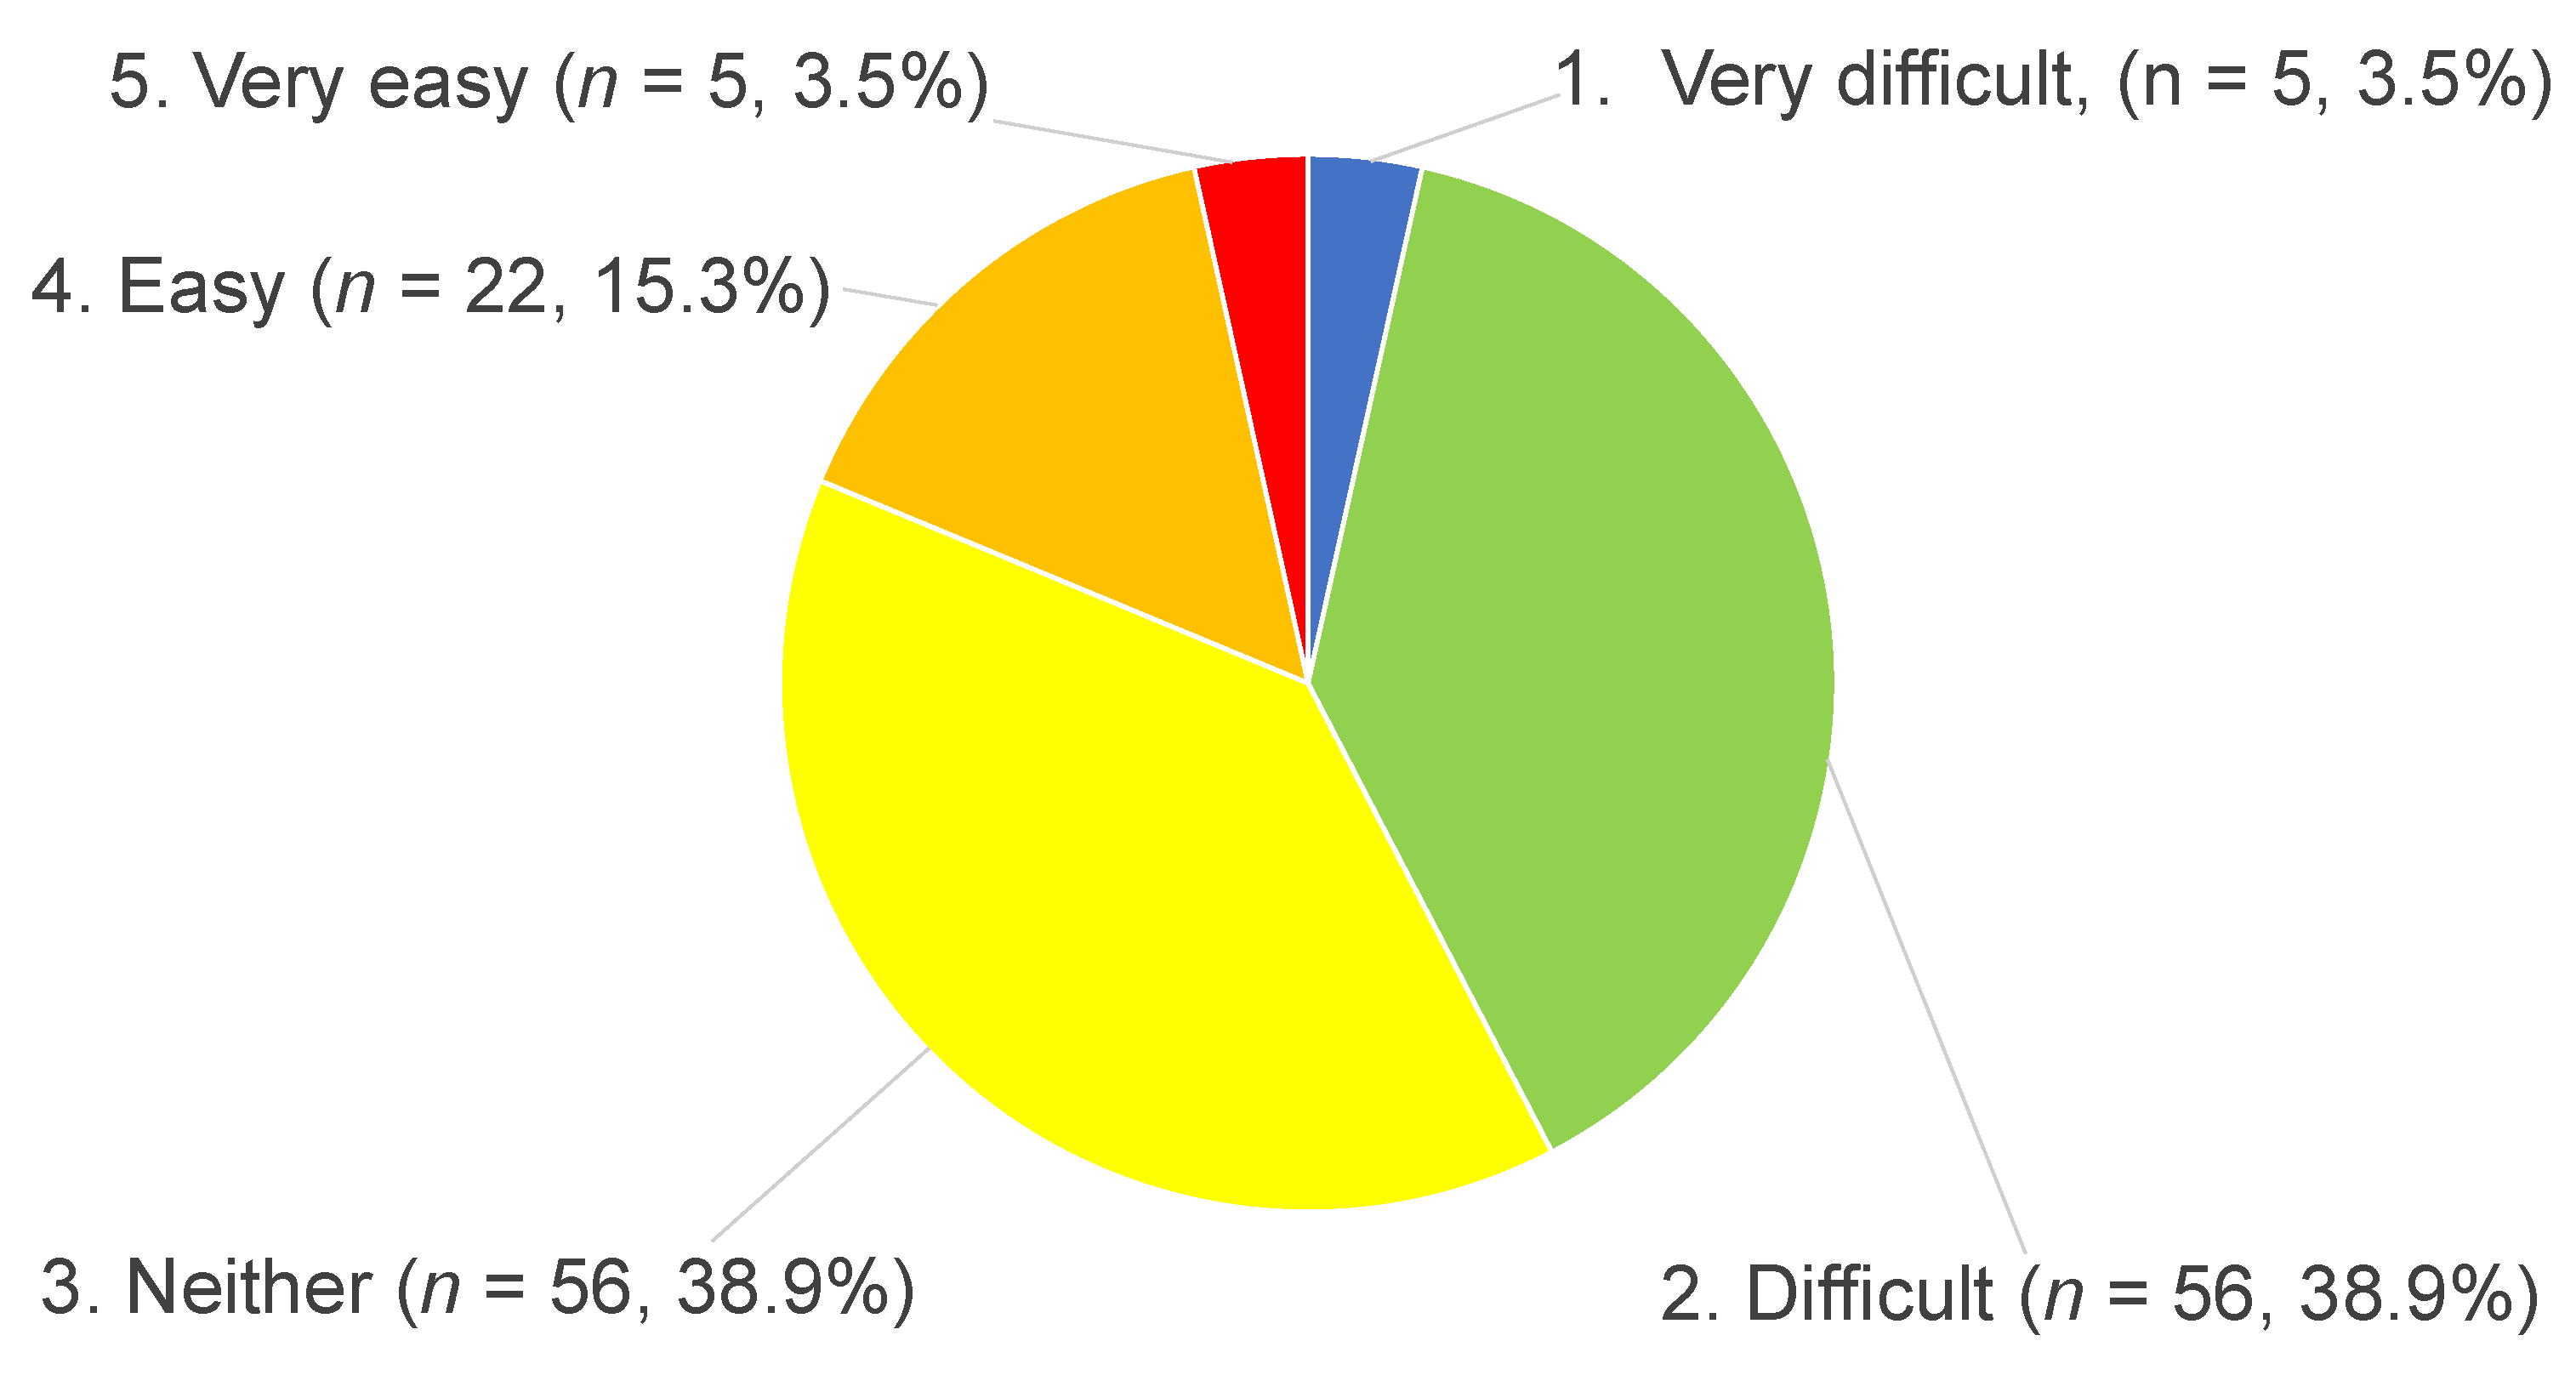
Figure 3.
Comparison of answers about map operation difficulty between high-school and university students.
Figure 3.
Comparison of answers about map operation difficulty between high-school and university students.
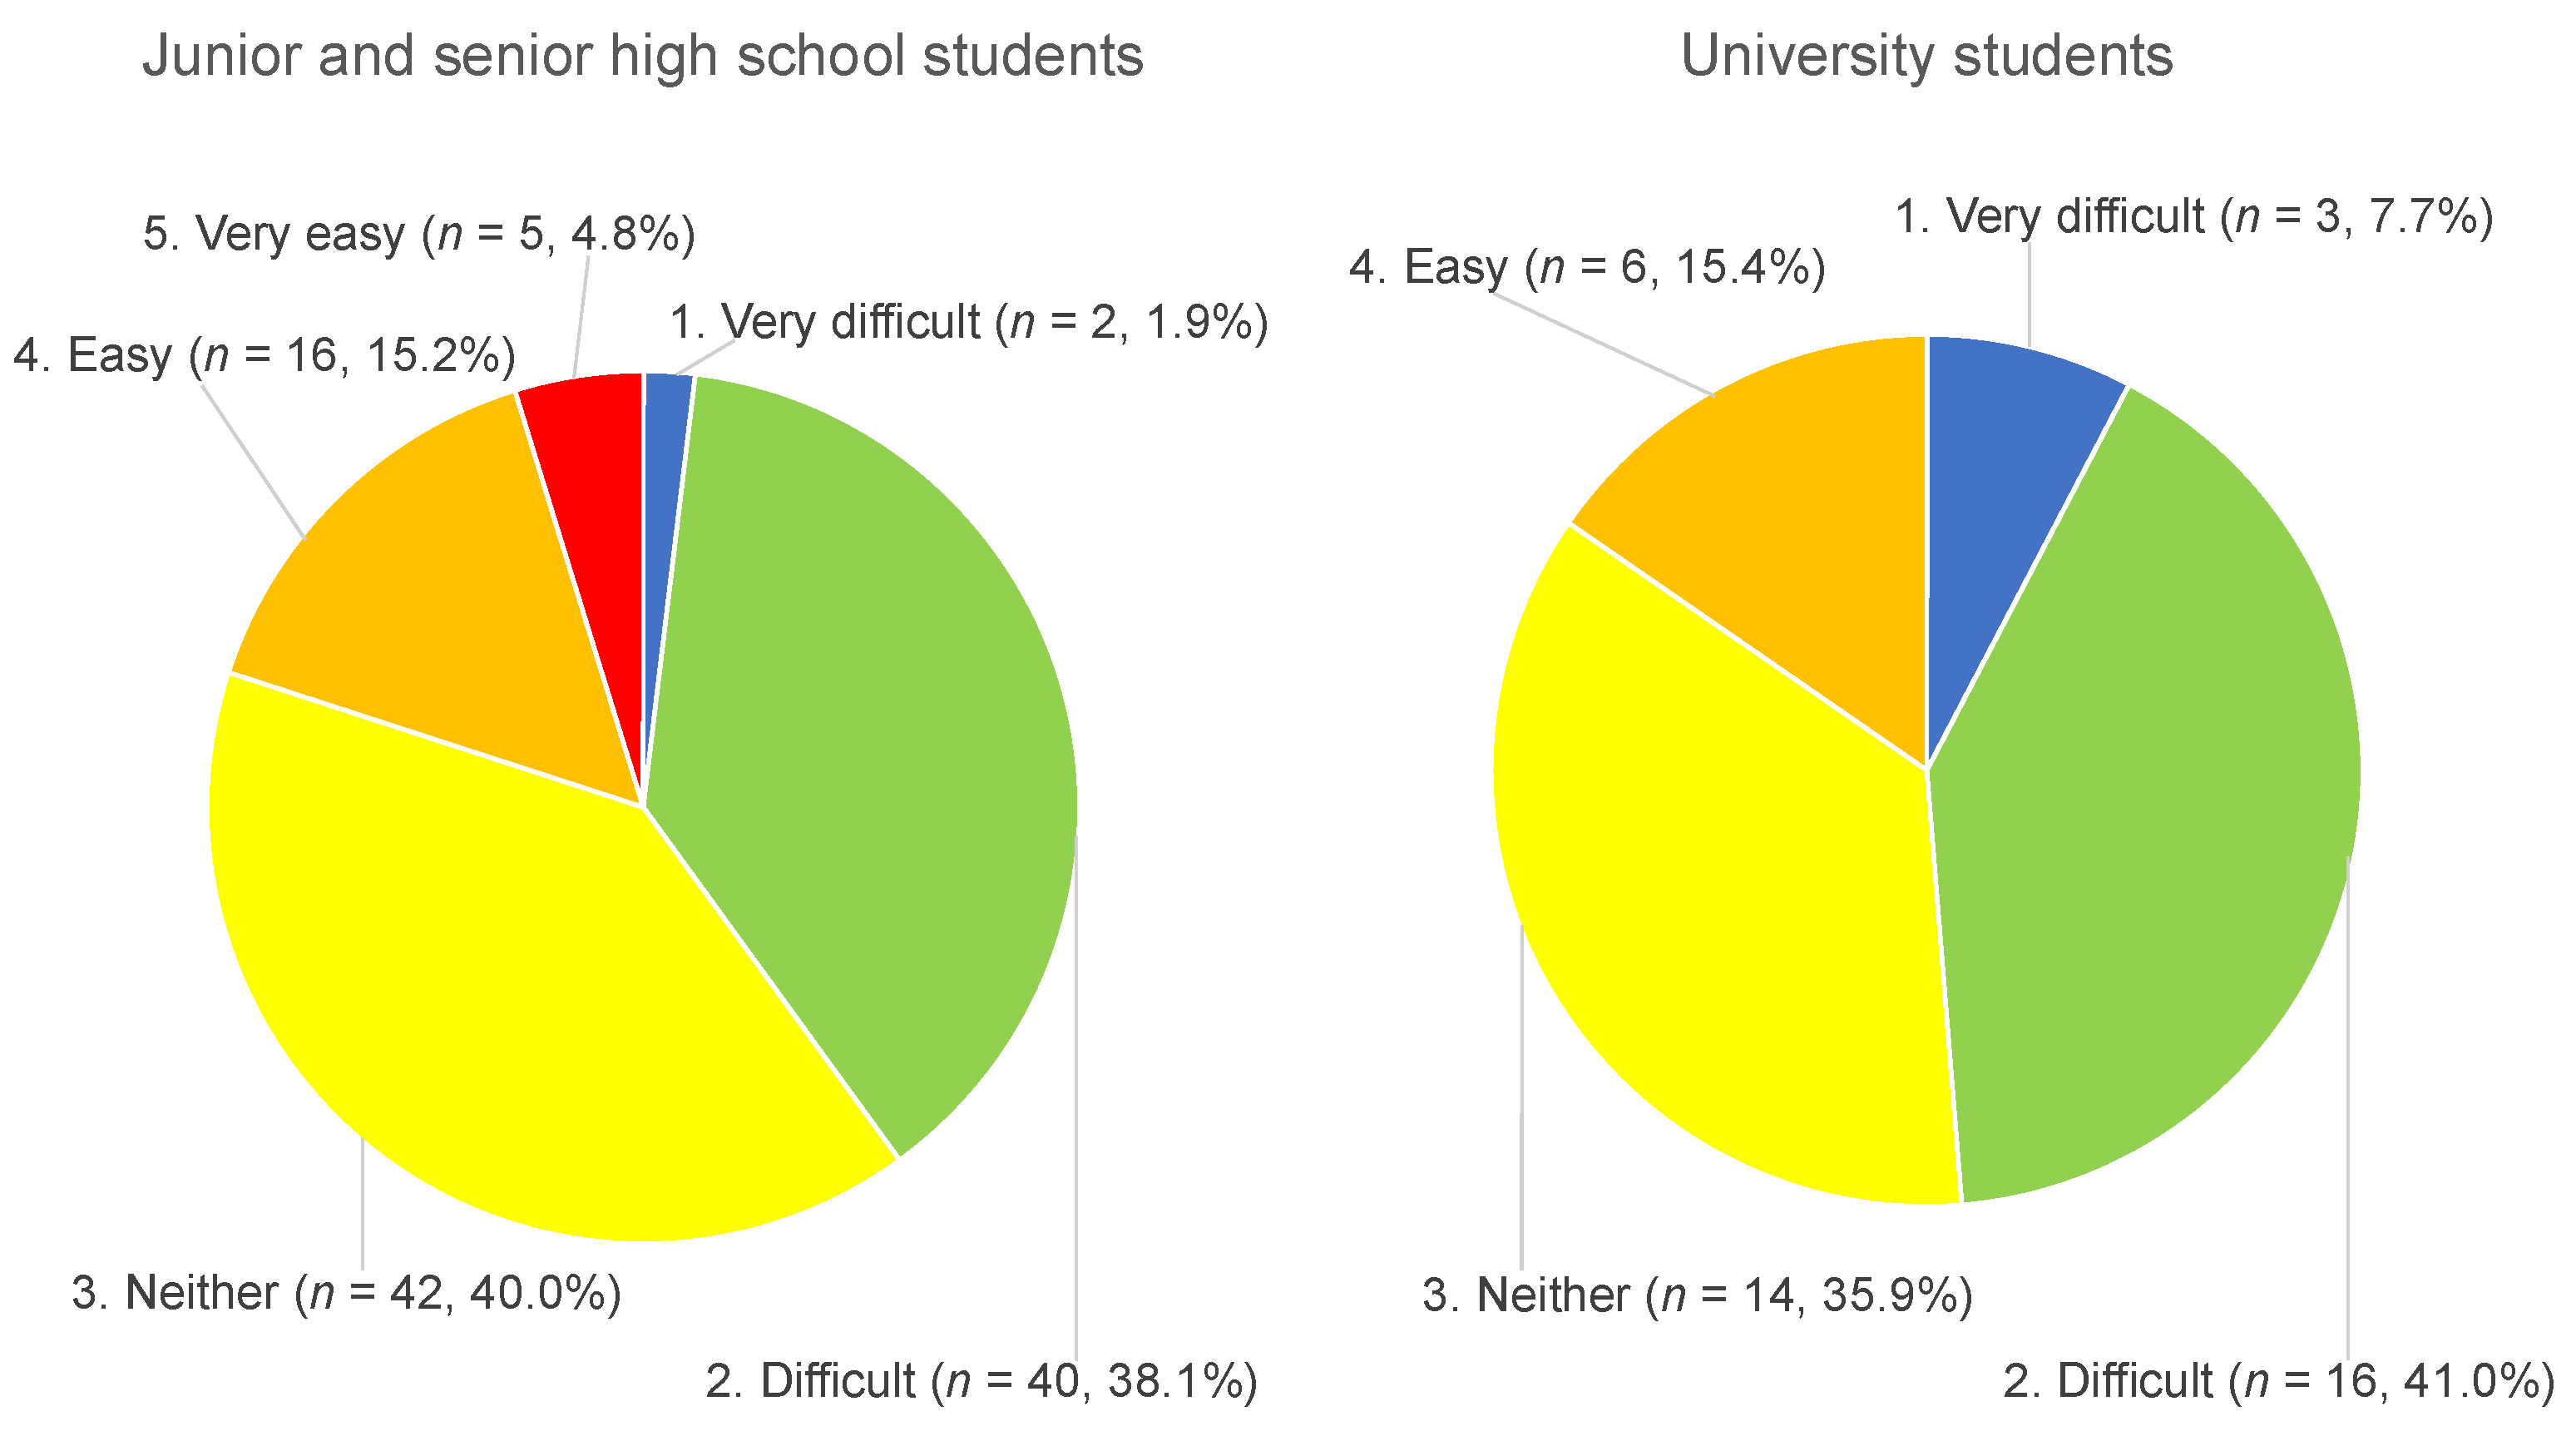
Figure 4.
Usability of the digital map.
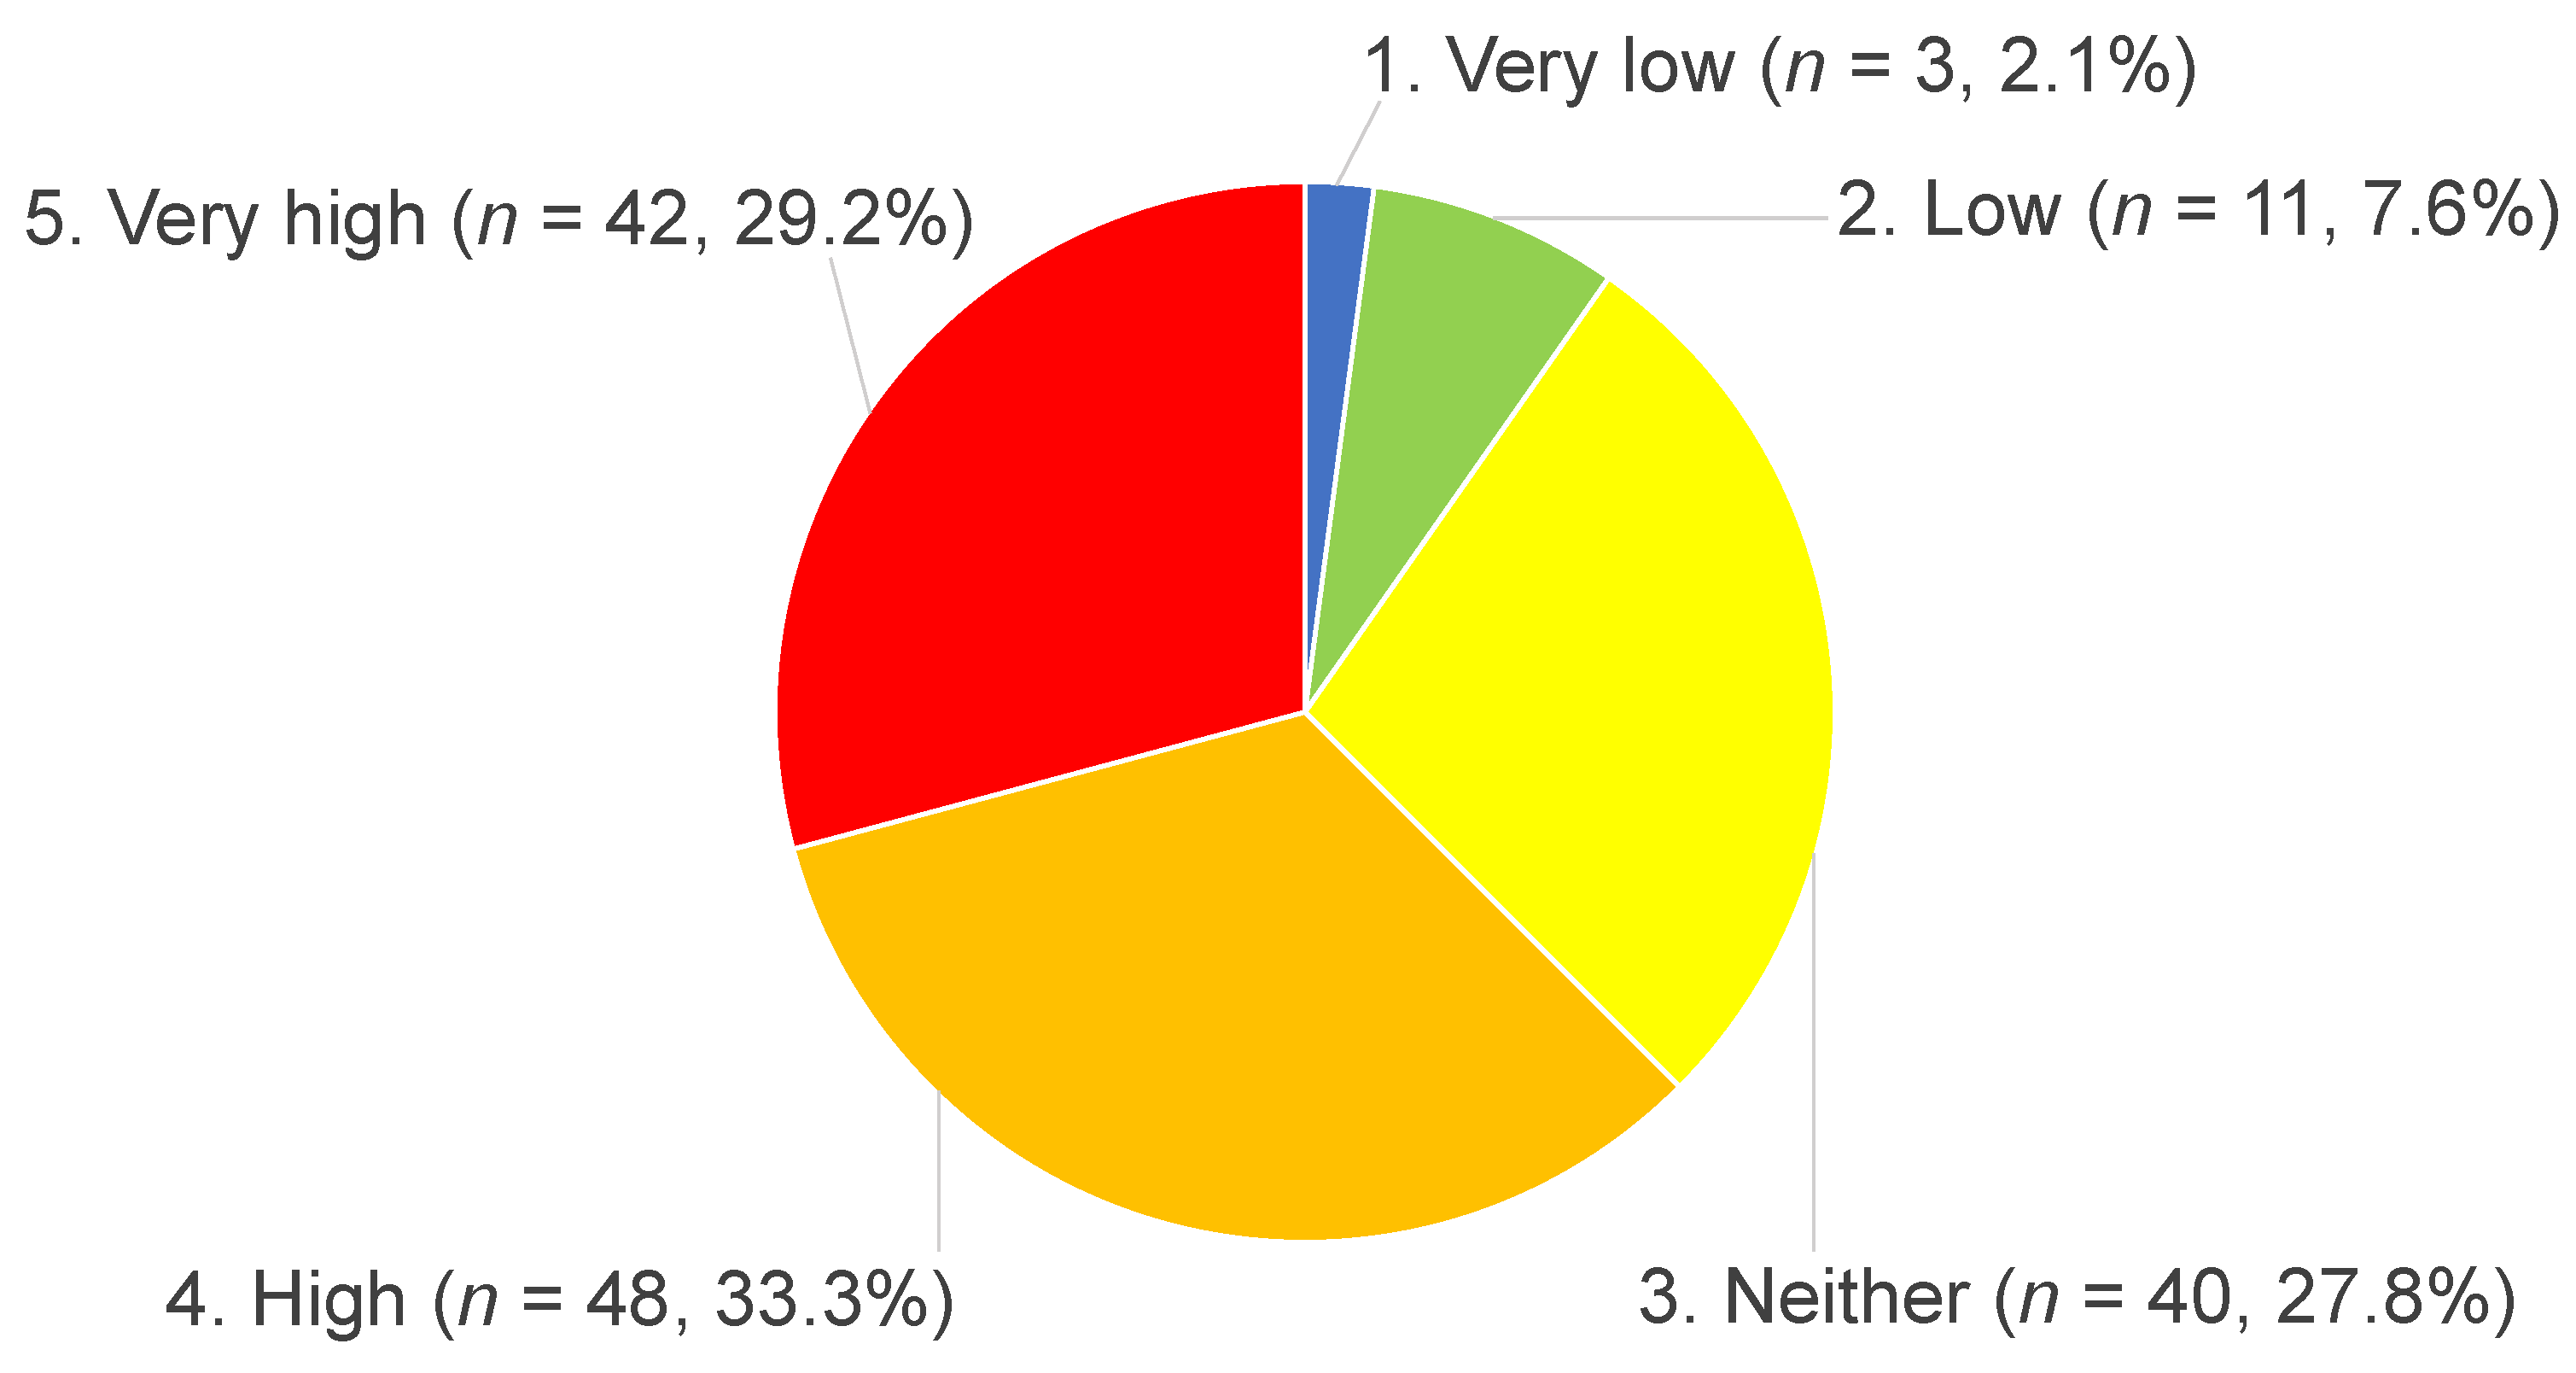
Figure 5.
Comparison of answers about the usability of the digital map between high-school and university students.
Figure 5.
Comparison of answers about the usability of the digital map between high-school and university students.
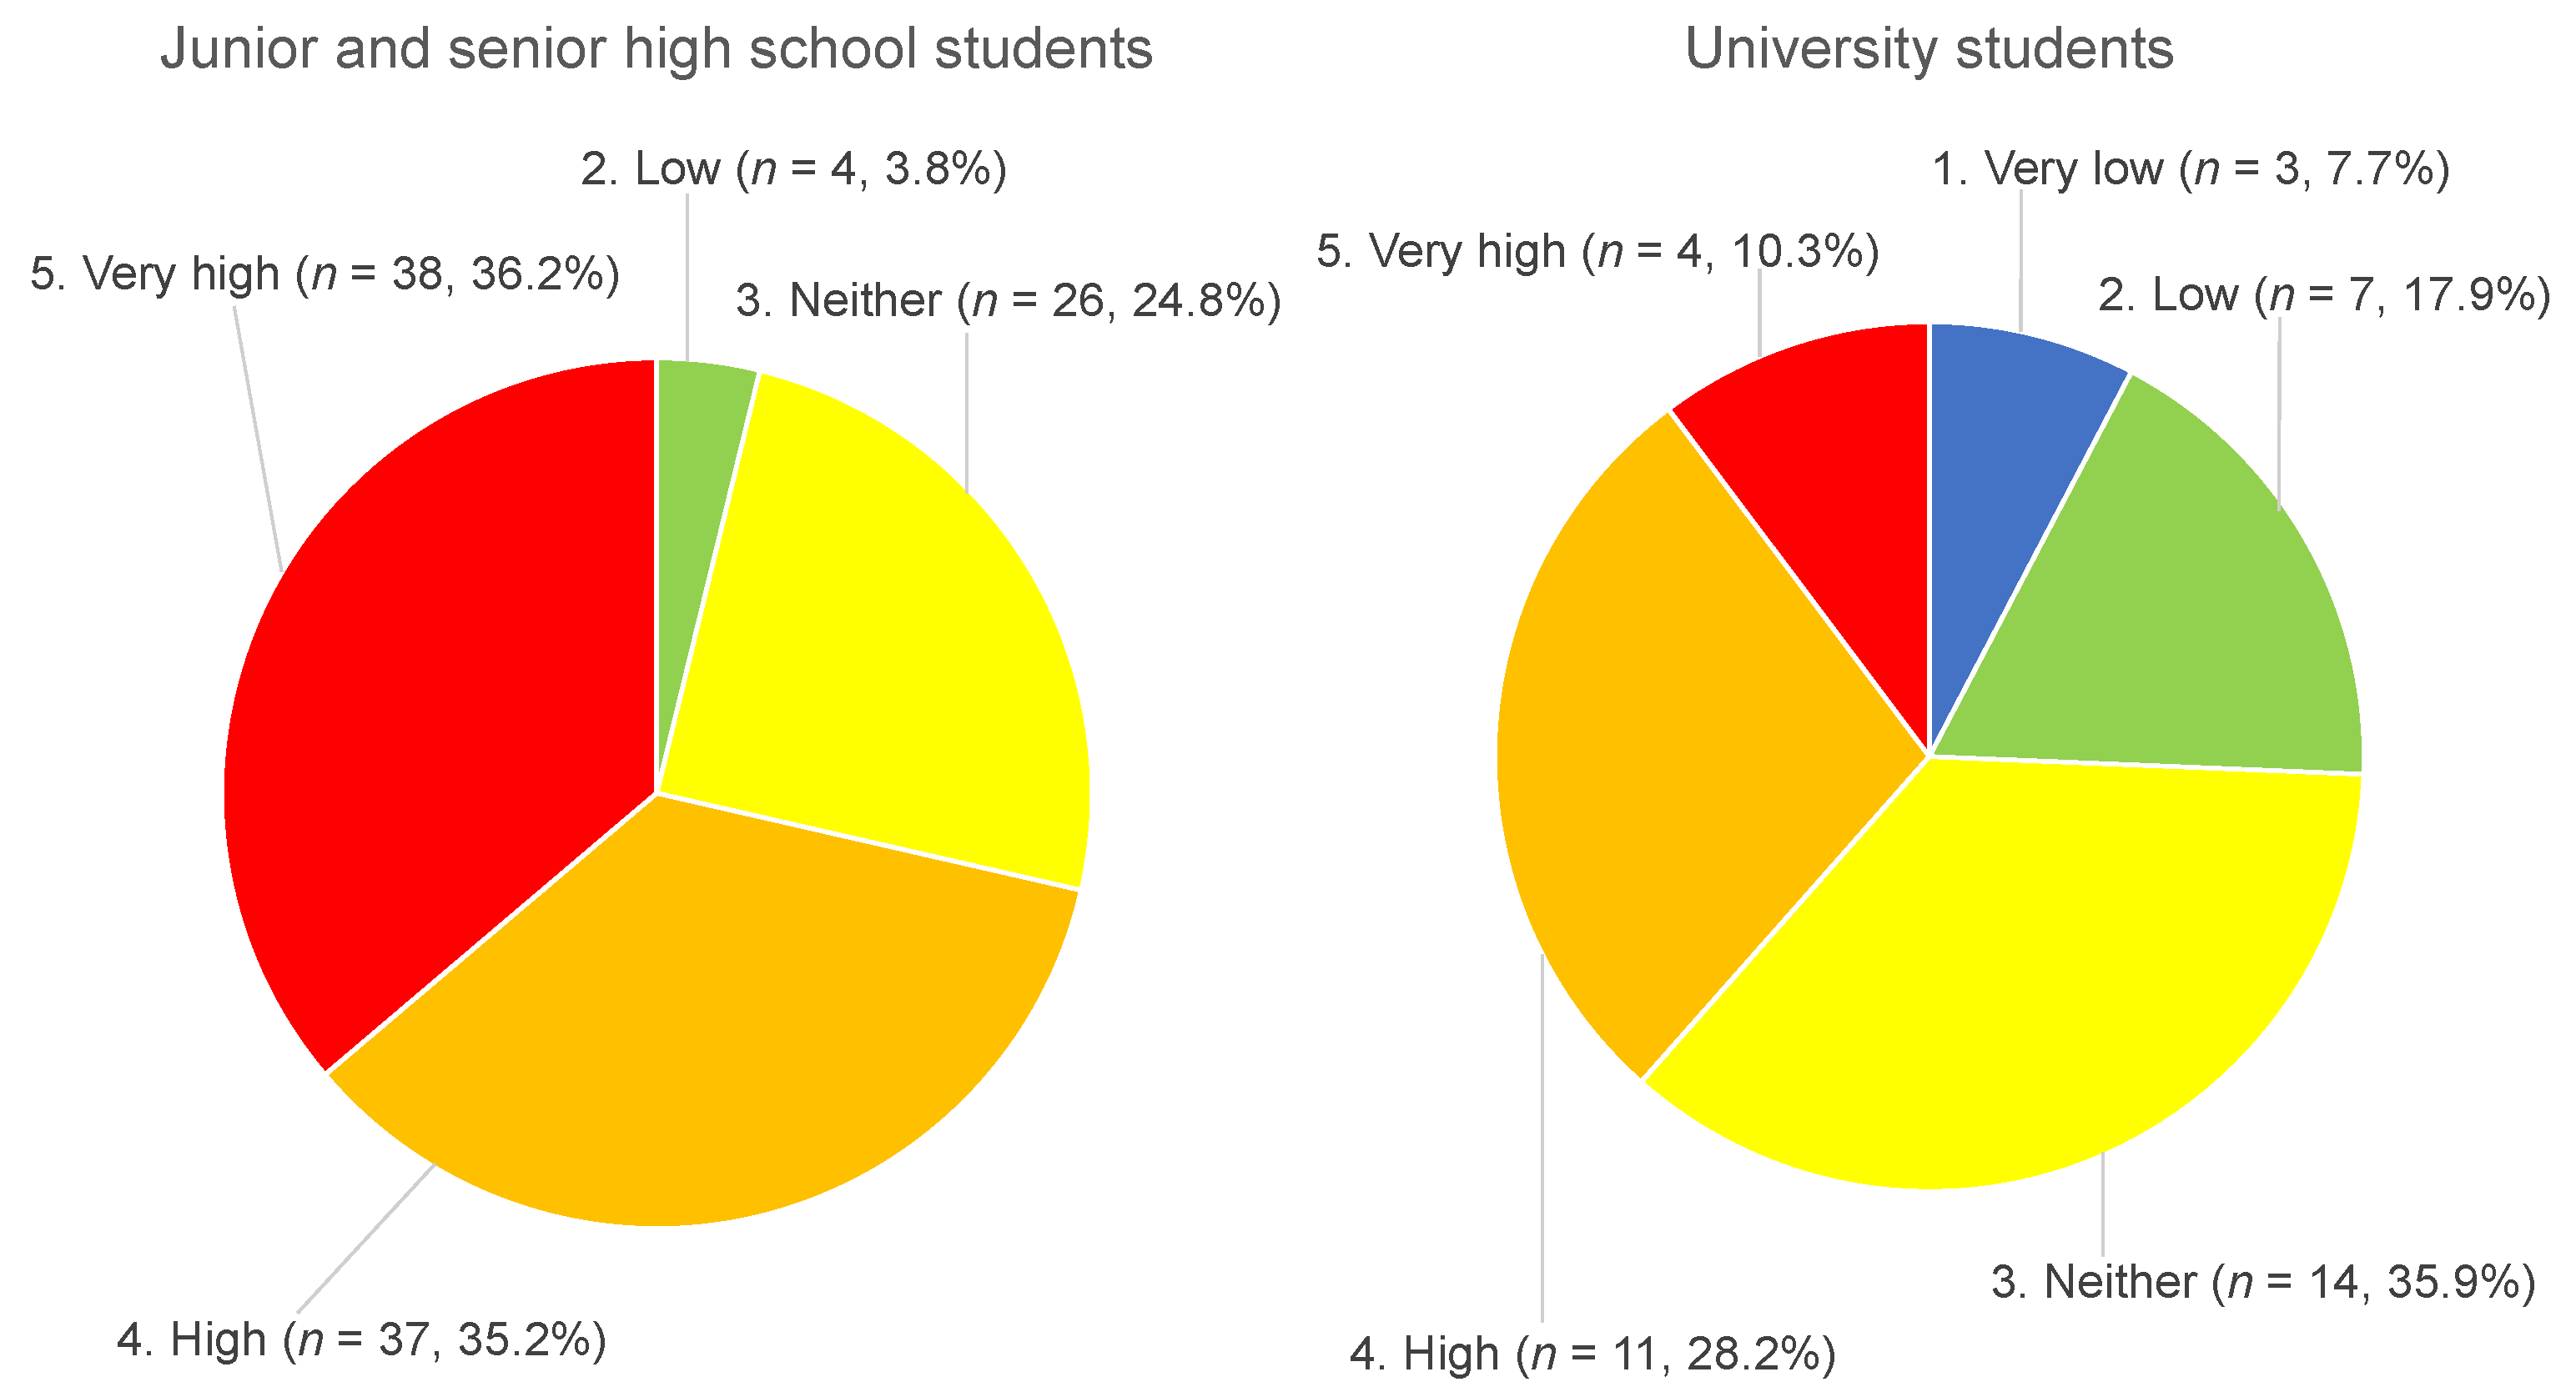
Figure 6.
High-risk areas identified by students. The background map was created using the GSI Maps provided by the Geospatial Information Authority of Japan (GSI).
Figure 6.
High-risk areas identified by students. The background map was created using the GSI Maps provided by the Geospatial Information Authority of Japan (GSI).
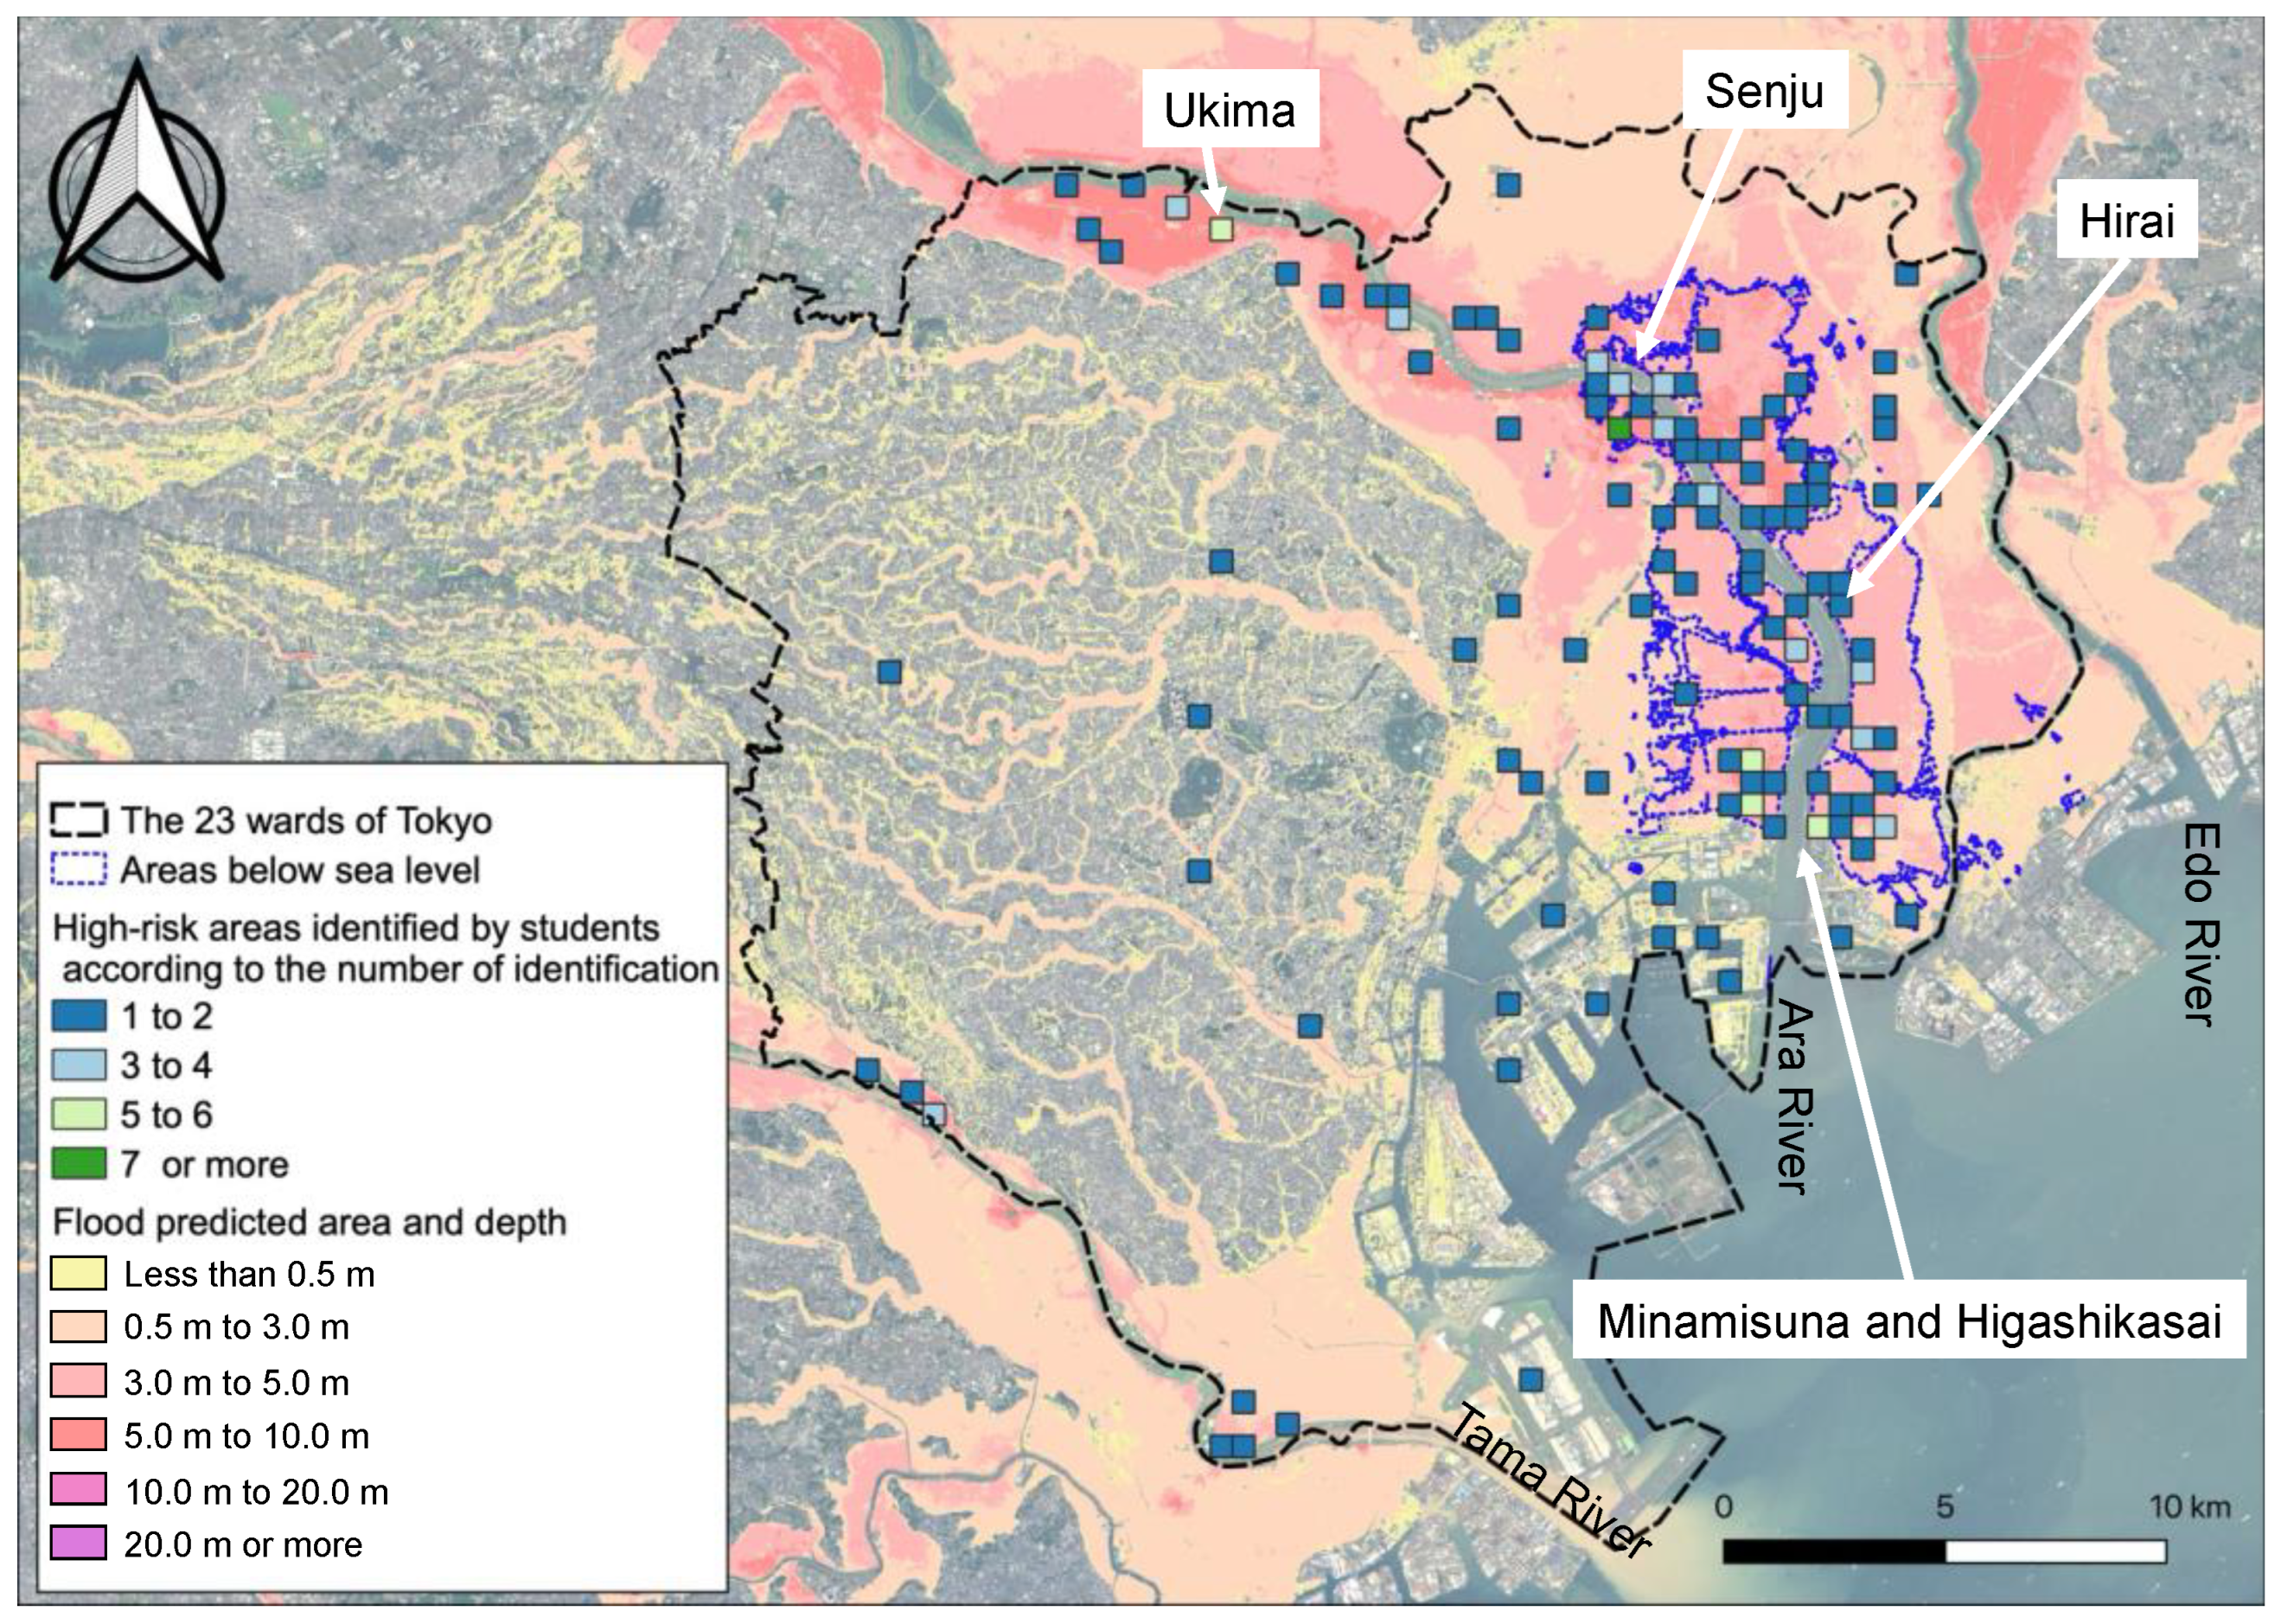

Table 1.
Summary of the classes.
| Cases | Participants (n = 144) |
Number of practices | Class duration |
|---|---|---|---|
| Case A (University students) |
39 | 2 | 90 minutes |
| Case B (Junior and senior high school students) |
68 | 8 | 60 minutes |
| Case C (High school students) |
37 | 2 | 60 minutes |
Table 2.
Lesson procedure of the 60 minutes class.
| Section | Explanation |
|---|---|
| First part (10 min) |
Explaining the concepts of disasters, the geomorphological conditions of the 23 special wards of Tokyo, and the history of past floods in Tokyo. |
| Second part (10 min) |
Introducing each geographical information implemented in the digital map and how to interpret hazard risks. At this stage, students take memos without operating the digital map.
|
| Third part (30 min) |
The students practice digital map operations by themselves through five exercises. Case-A students and other students who have extra time challenge an additional assignment. At the end of this part, students submit the assignment results via an online form and answer a questionnaire survey.
|
| Fourth part (10 min) |
Providing explanations of the correct answers for the five exercises. |
Table 3.
Mann-Whitney U test results regarding the difference between high-school and university students. The difference is statistically significant for a p-value < 0.05.
Table 3.
Mann-Whitney U test results regarding the difference between high-school and university students. The difference is statistically significant for a p-value < 0.05.
| Factor | Statistic | p |
|---|---|---|
| Difficulty | 2306.000 | 0.216 |
| Usability | 2965.500 | < 0.001 |
Disclaimer/Publisher’s Note: The statements, opinions and data contained in all publications are solely those of the individual author(s) and contributor(s) and not of MDPI and/or the editor(s). MDPI and/or the editor(s) disclaim responsibility for any injury to people or property resulting from any ideas, methods, instructions or products referred to in the content. |
© 2024 by the authors. Licensee MDPI, Basel, Switzerland. This article is an open access article distributed under the terms and conditions of the Creative Commons Attribution (CC BY) license (http://creativecommons.org/licenses/by/4.0/).
Copyright: This open access article is published under a Creative Commons CC BY 4.0 license, which permit the free download, distribution, and reuse, provided that the author and preprint are cited in any reuse.


