
Submitted:
27 November 2024
Posted:
04 December 2024
You are already at the latest version
Abstract
: Background/Objectives: The paper investigates digital leadership in primary education, focusing on the digital competencies and views of teachers' leadership in West Greece. Its main purpose is to research how different styles of leadership affect teachers' satisfaction and the adoption of digital practices and to find out the gaps in digital skills among educators; Methods: A quantitative research design was adopted, whereby a structured survey was administered to 105 primary school teachers. Multiple statistical analyses were carried out to explore the relationships between leadership styles, demographic factors, and digital competencies with a special focus on transformational leadership; Results: These results show that transformational leadership significantly influences teachers' satisfaction and the adoption of digital leadership practices, which indicates its critical role in fostering digital transformation within schools. There is a considerable gap in teachers' digital competencies, which implies a real need for the development of specific skills in this respect. Concerning the demographic variables, neither gender nor age had any significant relation with the leadership styles, while postgraduate education showed a positive association with more advanced leadership practices; Conclusions: This could be considered a very important leadership role of school directors in driving digital transformation and an argument for professional development programs in bridging the digital skills gap among teachers. This research, therefore, provides a call for expanded studies to offer more holistic insights on effective digital leadership in education, in support of high-performance digital education ecosystems.
Keywords:
digital leadership
; digital Skills
; leadership
; transformational leadership
; digital transformation
; primary education
; teachers’ digital skills
; school directors
; educational leadership
; professional development
1. Introduction
Over the last several years, the rapid development of ICT has played a substantial and important role in the development of new policies and has had a major impact on the way knowledge is accessed. In the age of the internet and the digital revolution, information is power and the way in which it is searched, analyzed, stored, disseminated and generally used and exploited is a powerful tool in the hands of those who know and can "process" it and give it meaning and value [1,2]. As a result, a new form of leadership has emerged, e-digital leadership, which promotes innovation and change using technology. The systematic use of an organization’s technological applications and achievements and digital data enables the leader to influence attitudes, thoughts, behaviors and emotions towards a common goal [3,4,5].
Despite the ongoing digital revolution, to date the term digital leadership has not been fully clarified, but it is now clear that analyzing it is not enough to describe digital administration, i.e. the electronic, or digital, processing of administrative procedures or actions [6,7,8,9]. Digital leadership deploys, manages and applies an organization’s technology and digital data to improve its performance and achieve its business goals. It is about leveraging the digital data of a business-organization and about leveraging digital market trends. It aims at leadership, innovation and change, taking advantage of the possibilities and opportunities offered by ICT and the internet and of course the use and exploitation of new ways in which administrative and organizational processes can be carried out to make an organization’s performance more effective (European e-Competence Framework 3.0, 2014) [3,10,11,12,13]. The digital revolution has resulted in a change in the organizational patterns of companies and organizations, the creation of more work teams, the boom and growth of teleworking and therefore distributed leadership, which relies on new communication tools that leaders must coordinate and manage [14]. All leadership tasks and activities are performed through electronic channels, building relationships beyond the narrow functional-geographical boundaries of a company or organization [15,16,17,18,19]. As a result, the landscape in the field of business and organizational management is changing radically, so that even schools as a living organization and school systems around the world must adapt to respond to the great and relentless technological and digital changes that the new ICT and internet reality demands [20]. Teaching and learning processes, as well as school organization and leadership, are changing and adapting to the new digital reality [21,22].
Background and Rationale
In the last decade, the use of digital tools in and by educational institutions has become a popular topic, and digital leadership has strongly gained ground. Enhanced student learning and heightened work flexibility and mobility are typical reasons for integrating digital tools into the educational domain. Introducing digital tools into a learning environment is based on a strong theoretical background and is important for contemporary educational processes in response to diverse learners' personalized demands [3]. Despite such developments, a school setting that was not attractive for students should be reshaped, adopting technologies that promote learning. In addition, schools, and especially teachers, have encountered challenges with respect to deploying technologies; they are responsible for upscaling digital literacy, also to avoid facilitating 'digital contradictions.' Although many schools have started to implement and diffuse digital resources in classes and overall school practices, an essential divide exists in schools. Schools exhibit both digitally influenced and non-digitally influenced practices, and that digitally influenced schools have more resources than non-digitally influenced schools [23,24,25]. The literature does not provide the factors that enable decisions for digital transitions, and it also offers inadequate knowledge and limited measurements concerning digital leadership in schools. Despite an evident and strong need for digital leadership, a gap exists in conceptual understandings of digital leadership in the school education context [26,27,28].
A synthesis of this background shows that schools are shifting to more organic and student-centered learning processes. Social practice theory, praxeology, and sociometrical approaches, such as distributed leadership in context, could be applied to examine the shift in leadership styles. These studies support the present work as a critical framework for understanding digital leadership and managing change [29]. Thus far, however, studies are devoid of digital leadership and the involvement of digital tools for decision-making. This study is non-compensatory in this context, and due to the limitations of the data from the elementary education context, we do not take an exclusive stand. The early adopter approach in this routine study, however, does attempt to point the educator discourse toward the leadership of digital innovation [30,31].
2. Literature Review
Digital technology use has become an integral part of our daily lives and is continuing to grow. The increase has also impacted the role that administrators have in educational institutions. New technologies are changing the ways schools operate, teachers teach, and administrators lead. While there is still no common theoretical framework widely accepted to illustrate the digitally connected world, educational systems are becoming unified with ubiquitous digital systems. The use of digital technologies provides a window into a growing world of information that is governed by data – rarely sparse and increasingly unstructured [32,33,34]. Changes in technology impact education and have implications for how students perform. Consequently, changes to the construct of interest in conjunction with new methods of measurement contribute to the recent popularity of Big Data Science [35,36,37,38,39].
The term digital leadership is associated with digital technologies and suggests a new mechanism. For the purpose of this study, the driving mechanism of digital leadership is the supporting big data technologies. A quick skim through the literature highlights theories, ideas, and thoughts of digital leadership that are grounded in today’s technology. However, this comes at a cost - the literature is rich in theories but largely devoid of any discussion related to the practical implications of digital leadership [40]. Despite the lack of published work on a wide variety of theoretical constructs of digital leadership, data mining techniques are slowly transforming the educational landscape. Data mining, educational data mining, and/or learning analytics are collectively a set of statistical and machine learning methods, algorithms, models, tools, software, and programming languages. Support for these data mining techniques has yielded great success. Those who use them creatively have consigned anecdotes to the realm of literature and have shown great promise negating the endowment effect that negatively impacts the traditional classroom [41,42]. However, by analyzing and transforming digital data, a growing number of student and educational practitioner-friendly software packages have made big data less jargon and more easily available to the practitioner. Given these circumstances, this study moves in a different direction than previous work on digital leadership. It specifically examines data for a given teacher’s school class and analyzes the teacher as a digital practitioner prior to transitioning to a big data set [43,44,45].
Leadership has been evolving over the last decades, moving toward decentralization and diffused processes due to accelerations in social, economic, political, and technological change. So-called “new leadership” theories highlight the importance of processes aimed at involving and empowering people and communities to develop capacities that value the knowledge and expertise of the group [46]. In this context, the development of digital leadership in schools has been recognized as a key component in several educational approaches, as it represents a behavior based on a combination of skills and characteristics linked to individuals aiming to promote a shared vision about digital technology [47]. Digital leadership is often referred to in the education literature, and more specifically in the field of K-12, as the cognitive, behavioral, and dispositional attributes of a leader that promote the effective use of digital technologies and the attainment of educational goals and targets [48,49,50,51,52].
To this aim, individuals will be able to model an understanding of how to develop their own digital capabilities, like vision and the will and ability to act in new and creative contexts with a continuous eagerness to learn, plus a willingness to collaborate, to question the status quo, having the courage to try alternatives, engaging in self-care and self-awareness, and engaging in reflection and self-evaluation. A digital leader must reflect and promote a vision of digital fluency up to a spirit of innovation, probably more extreme in perspectives, because they care above average about cultural and societal evolution. Practicing by initially blending analog and digital technological elements and expectations will afford the tool-based and sector-based experience required for a digital leader [44,46,47,48]. Moreover, it is still argued in educational settings that digital leadership should represent an innovative type of leadership behavior compared to traditional leadership theories shaped in a pre-digital era [49]. The leader is influenced by the environment, and this type of environment can foster a digital leader state of mind [53,54,55,56,57].
2.1. Digital Transformation of School Administration
In most national educational systems, digitization has entered the school administration area. Through the collection and analysis of data related to primary education providers, educational systems can be aware of improvement points and performance measures and derive appropriate strategies [58]. Educational organizations can take advantage of benefits such as cost-effective and personalized real-time services, data-driven analytics using big data platforms, and robust cybersecurity systems. Modern organizations, no matter their field of operation, now have access to powerful tools that use big data and analytics techniques to create knowledge, unlock executive and managerial skills, and make decisions to accelerate growth [59,60,61]. Adopting digital solutions, sometimes called connecting different public services under the same digital umbrella fulfills a wide concept, simplifying and facilitating the citizen's journey through the public sphere [62,63,64,65,66]. The application of digital tools is of benefit in terms of governance. Through a government's supportive framework, the decision-making process speeds up. One subcategory in this context, i.e., e-education, is also relevant. By adopting different digital tools, schools can transform processes and methodologies. Common terms are e-administration and e-procurement. When the classroom environment is integrated and permanently connected to the digital world outside the school gates, e-classroom tools become relevant. That is, when the connect and present concept is available for the students, their educational journey becomes possible [67,68]. The focus shifts from receiving knowledge to being involved in the learning journey. Handling personal devices in primary schools involves controversy. The pupils' – and their parents' – acculturation to the various devices in general use in a digital society is no minor detail, yet the issue between supporting the applications that pupils wish to use to become part of a society that has already adopted them and the concern with deregulated use exists [69,70,71,72,73].
In Greece, in all public sector services, and certainly in educational institutions, most, if not all, work is done electronically. The communication of school units with each other, but also with the respective educational directorates, the processing of all electronic correspondence, the dissemination of experiences and results, but also more practical issues concerning the operation of the school, such as the data, the position, the seniority, the leaves of the teachers, but also grades, absences, personal data, the timetable of the students, are now, for several years, registered and processed through a single information system that aims to provide computerized support for school units and the administrative structures of education in Greece, myschool (myschool.sch.gr). Through the portal www.gov.gr, in the context of e-government, dozens of educational "acts" such as certificates, applications, registrations, transfers, electronic registers, etc. are fulfilled electronically [74,75,76,77,78].
In addition, the Panhellenic School Network (PSN), the national network and internet service provider (ISP) of the Ministry of Education, the network that connects all school and administrative units of primary and secondary education, ensures the digital presence of all school units. It provides and promotes advanced services for the administrative organization and support of the educational process, such as e-mail, teleconferencing, hosting of websites and blogs, geospatial imaging of school units, electronic inventory of technological equipment, school library management system, modern and asynchronous tele-education platforms, multimedia services, etc. (www.sch.gr). Especially in recent years, on the Covid-19 pandemic and the protection measures, the need for the digital transition of school units, both at the pedagogical and administrative level, has become more imperative for the smooth promotion of the educational process. Nowadays, the classroom has become an e-classroom, the blackboard became a shared screen, all educational meetings became videoconferences, webinars and modern and asynchronous tele-education platforms the new, now consolidated, reality.
Already since July 2019, a new public administration unit, the Ministry of Digital Governance, has been established, which has as its mission "the continuous promotion of the digital and administrative transformation of the country and its adaptation to the rapidly changing international environment, through the formulation of the framework, rules and operating conditions, with the aim of optimizing the operation of the state..." (Ministry of Digital Governance). In 2020, it issued the Digital Transformation Paper 2020-2025 which outlines the planning and guidelines that will implement the digital transformation of the Greek society and economy (digitalstrategy.gov.gr). The objectives of digital transformation, among others, are the development of digital skills of all Greeks, the strengthening and support of digital innovation and the integration of modern technologies in all sectors. In the field of education, in cooperation with the Ministry of Education and Religious Affairs, the aim is to "strengthen the digital experience at every level of education, including the administration of education, the educational process and services to citizens" (digitalstrategy.gov.gr). All the above-mentioned services simplify procedures, eliminate the bureaucratic structure of the administration, facilitate the administrative work, digitize the services and contribute to the upgrading of the administrative and pedagogical work of the school. In contrast, of course, we are talking about a huge amount of digital data and information that not everyone can and should have access to. This raises serious issues of access, management, encryption and security of personal and sensitive data (which are not within the scope of this paper).
2.2. The Role of the School Director as a Digital Leader
The role of the School Director as a visionary leader in technology and digital innovation holds immense significance in today's rapidly evolving educational landscape. In an era where technological advancements are reshaping the way we teach and learn, the School Director plays a pivotal role in driving the integration of technology into the fabric of education. As a leader, the School Director must possess a deep understanding of emerging technologies and their potential to transform learning experiences. They need to be aware of the latest trends, tools, and platforms, making informed decisions about their implementation in the school ecosystem. Their visionary approach is crucial for harnessing the power of technology in optimizing teaching methodologies, enhancing student engagement, and fostering a future-ready mindset among the school community [16,46,79].
The School Director's digital leadership extends beyond just incorporating technology into classrooms. It encompasses cultivating a culture of innovation that embraces digital literacy, critical thinking, and creativity among both students and staff. They must nurture a supportive environment that encourages experimentation, risk-taking, and collaborative problem-solving. Furthermore, the School Director should collaborate with stakeholders at all levels to develop a comprehensive technology plan that aligns with the school's vision and goals [80,81]. This involves engaging teachers in professional development opportunities that empower them to effectively utilize digital tools and resources. The Director must provide ongoing support and training, ensuring that educators have the knowledge and skills to leverage technology in impactful ways [25,44,82,83,84,85].
Moreover, the School Director as a leader in technology and digital innovation must advocate for equitable access to technology resources. They need to address the digital divide, ensuring that every student has equal opportunities to benefit from technology-enhanced learning experiences [86,87]. This may involve securing funding, forging partnerships with technology companies, and exploring creative solutions to bridge the gap. In conclusion, the role of the School Director as a leader in technology and digital innovation is multidimensional and far-reaching [88,89,90,91,92,93]. They must possess a holistic understanding of technology integration, spearhead a culture of innovation, collaborate with stakeholders, empower educators, and champion digital equity [94]. By embracing their leadership role, School Directors can transform education, equipping students with the necessary skills and competencies to thrive in the digital age [95,96,97,98].
2.3. Digital Leader Characteristics
A digital leader is one who combines strategies, techniques and forms of leadership centered on technology and its use, aiming at innovation and change, to facilitate learning and improve the efficiency of an organization [99]. Researchers in studies [94,95,96,97,98,99] argue that if a school principal promotes technology and innovation successfully, then he or she is more effective. Based on what we said above about the digital transformation of the school unit, leaders - principals must be aware of all the challenges they will have to face, have a clear vision for the development of their school and emphasize their human resources (Lainas, 2004). Starting from the identification of colleagues who will be able to contribute substantially to this transformation and motivating and training them to become truly helpful, to having the strength and fortitude to overcome their own expectations of themselves and transform from 'conventional' to 'digital' leaders [8,22].
The digital leader must therefore have a set of knowledge and skills that allow him/her to develop innovative ICT-related standards at all stages and levels of an organization in planning, organizing, managing and controlling both administrative and pedagogical work [. It is the one who must first face positively the use of new technologies and be able to use effectively the digital ICT tools in both administration and teaching [100]. According to studies like [8,22], the digital leader must:
- ▪
- To define and promote the digital vision and the technological goals of the school unit.
- ▪
- To stimulate technological change in schools.
- ▪
- Use ICT and the internet themselves and take advantage of the opportunities they offer.
- ▪
- To provide resources for the school's technological infrastructure and its continuous improvement and upgrading, based on the needs of students and teachers.
- ▪
- Strengthen policies to promote innovation and develop professionally in the field of technology and its integration in pedagogical work.
- ▪
- To raise awareness of the uses of ICT and their importance to the educational workforce and to provide professional and technological development opportunities for teachers as well.
Moreover, it is important that there is systematic monitoring of ICT developments, as technological training should be renewed and updated frequently. In addition, a key characteristic of the digital leader is to promote teamwork, interaction and communication among all members of the school. The digital world requires collaboration, experimentation and variety in thoughts and actions, as well as a continuous commitment of all members towards this direction, therefore continuous training through trainings, motivation and freedom of access for teachers to the school's technological infrastructure contribute to the acquisition of educational and technological skills for all. The e-leader must practically guide and reinforce the required change in the entrenched school culture, commit to the change and monitor its progress and development. In other words, he or she needs to have both strategic and business and digital knowledge (www.eskills-lead.eu). Principals who are comfortable with ICT more readily promote its integration into both the educational process and administration [101].
Since 2001, the International Society for Technology in Education (ISTE), a global organization active in technology education curricula that aims to improve learning, support teaching, and guide technology professionals (NETS for teachers, 2008), has published the National Educational Technology Standards for Administrators (NETS-A). In addition, it issued the ISTE standards for coaches, teachers, computer educators, and students, all of which are essential for the effective use and utilization of technology in schools to support learning and enhance school performance. In 2009 the NETS-A was updated to consider the entry of new technologies into the workplace and the need for managers to be able to create learning environments aligned with the evolution of technology. It therefore includes five (5) standards that represent skills that school leaders-managers should have in an ever-changing technological environment. According to these, technology leaders:
- ▪
- provide a technology-focused vision for all members of the educational unit
- ▪
- create and maintain a digital learning culture
- ▪
- promote an environment in which technology is used, and digital resources are exploited
- ▪
- manage their schools with effective use of technology; and
- ▪
- model and understand social, ethical and legal issues related to digital technologies [102].
In addition to expertise, a digital leader must have the ability to manage the increasing complexity of ICT use, to cope with constant changes, to recognize and exploit digital trends and opportunities, to have an open mind, to take initiatives and risks, to be modernizing and not afraid to follow new trends. He also needs to have empathy, be supportive, communicative, promote a positive climate of cooperation and solidarity with the aim of a more people-centered leadership that will lead to greater satisfaction, empowerment, and commitment of human resources (Manders, 2008). Leadership, in this way, can extend to more than one person and take place through the collegiality, inclusivity, interaction and co-performance of members who are jointly aiming for the digital vision of their school. This may refer, in addition to the transformational type of leadership of course, to the distributed leadership style. After all, researchers in the literature [103] argue that all leaders choose which leadership style to follow from the same set' of leadership practices, but what really differs is not the leadership style per se, but the way one practices it [104].
Utilizing human resources according to their potential, involving everyone in the digital transformation of the school unit, training them to upgrade and develop their knowledge and skills, both pedagogical and administrative, involving everyone and creating long-term "value" for all in the digital upgrading of the school, often makes it difficult to distinguish between formal and informal leaders. The collective action and reciprocal nature of leadership is often more important than the title of leader and reflects the practice of distributed leadership [105].
2.4. Digital Skills
The rapid technological development, the innovations of the modern era and the appropriation of social media, AI-Artificial Intelligence, robotics, the STEAM (Science, Technology, Engineering, Arts, Mathematics) model, the IoT (Internet of Things), have shaped a new social, business, and educational reality. Employees, like apprentices, of the modern era are called upon to meet new challenges and acquire skills that will make them more "modern", productive, efficient, and ready to cope with rapid digital changes. The effort to continuously renew and upgrade the skills of professionals and workers, lifelong learning, is key to the future sustainability of any modern economy at all levels (Digital Skills and Jobs Platform, 2023). Digital literacy is essential for working, learning and active participation in society. It refers to the use of the range of digital technologies and achievements to inform, communicate and solve problems in all aspects of life in an appropriate way. This also implies a safe, ethical, and responsible consciousness in the use of technology, as well as respect for digital ethics and human rights [106]. That is, digital literacy must be consistent with digital citizenship, the rules of conduct that govern the responsible and correct use of digital technologies. The European Commission's Digital Skills and Job Coalition (DSJC) has identified the need for digital skills development in four (4) groups:
- ▪
- Digital skills for all: fostering digital skills for all citizens to become digitally competent and active in today's social reality.
- ▪
- Digital skills for the workforce: cultivating digital skills in workers, both active and potential, to enable them to contribute to the development of the digital economy.
- ▪
- Digital skills for ICT professionals: cultivating digital skills for new technology professionals in all sectors of industry; and
- ▪
- Digital Skills in Education: cultivating digital skills in a lifelong learning perspective for both students and teachers (European Commission, 06/2022).
Since 2015, the European Commission has been measuring citizens' digital skills with the Digital Skills Indicator (DSI). According to Eurostat's DSI, in Greece, in 2020 the population with digital skills was only 52% of adults, with the European average being 61%.
In general, our performance is low compared to the rest of Europe (25th out of 27 countries) in terms of the DSI. In 2017, Greece, Croatia and Italy were the lowest performing countries in the DSI in terms of broadband infrastructure deployment and quality. Similarly in 2018, Greece, together with Romania and Italy, have the weakest performance in the Digital Economy and Society Index (DESI). Denmark, Finland and Estonia, on the other hand, have the highest performance in the use of digital technologies, especially in their public sector and public administration (Digital Skills and Jobs Platform, 2023). This makes it imperative that Greeks participate in training programs to acquire digital skills (Ministry of Digital Governance, 2023). The new DSI 2.0 introduced in 2022 measures citizens' online activities in the last quarter in five specific areas:
- ▪
- information literacy and data literacy
- ▪
- communication and cooperation
- ▪
- digital content creation
- ▪
- security and
- ▪
- problem solving
and is used to monitor the European Union's target of reaching at least 80% of the EU population with at least basic digital skills by 2030 (European Commission, 07/2022).
As highlighted in the European Union Digital Education Action Plan (2021-2027), the development of digital competences by teachers is among the key areas for action for a high-performance digital education ecosystem (Digital Skills and Jobs Platform, 2023). Training in such a modern digital reality is a key and very important pillar for the development and evolution of learners and trainers. It requires the involvement of all stakeholders - teachers, learners, parents, employers - so that everyone can become digitally 'competent' and contribute accordingly (Digital Skills and Jobs Platform, 2023). More specifically, in terms of education, educational institutions, and in this case schools, should not function as closed communities, but as part of the wider environment in which they must adapt and perform. Moreover, as mentioned above, they need to adopt changes and innovations in both their structure and operation to cope with the new digital reality [. A decisive role in this is played by the school principal who must follow the changes and become a digital leader who, along with the digital characteristics that we have mentioned above, needs to cultivate some digital skills.
For over a decade, the European Commission has been at the forefront of monitoring the evolving demand and supply of e-skills. Thus, it promotes user competences required for the effective application of ICT systems and devices, the use of common software tools, as well as specialized tools supporting organizational and business functions and, more generally, the "digital literacy" of individuals, i.e. the skills needed to use ICTs confidently and critically for work, leisure, learning and communication. It also promotes e-business skills needed to exploit and use the opportunities provided by ICTs, and particularly the Internet, for new ways of conducting business, administrative and organizational processes (Publications Office of the European Union, 2013). This means greater investment in high-tech leadership skills where people are at the center. The European Agenda for High-Tech Leadership Skills, through dozens of experts who contributed to its development, proposes six (6) strategic areas where Europe can seize the challenges and opportunities for digital-ready technology leaders in industry, education, and training (European Commission, 2017). Europe's six (6) strategic priorities for digital leadership skills are Cloud Computing, Big Data Analytics, Social Media, Internet of Things, IT Legacy Systems and Mobile. The ability of a country to strengthen efforts to continuously renew and upgrade the skills of its workforce is the most important factor in ensuring its future presence and competitiveness. In education, investment in digital teaching and learning resources, as well as the complementary development of digital competences by teachers, are among the key areas for action for a high-performance digital education ecosystem, as highlighted in the EU Digital Skills and Jobs Platform 2021-2027 (Digital Skills and Jobs Platform, 2023).
More specifically, based on the above and according to the study [8], a list of digital skills that a digital leader in education should have to be able to guide the members of the school community towards the digital era and its needs, but also to make the most of the opportunities and possibilities offered by ICT is the following:
- ▪
- Big Data
- ▪
- cloud computing
- ▪
- ERP systems
- ▪
- social media
- ▪
- Mobile Apps & Web Development
- ▪
- digital architecture
- ▪
- security skills
- ▪
- complex business systems
2.5. Aim of the Research
The purpose of this research is to investigate the leadership style that principals apply or would apply if they were in a managerial position, as well as the degree to which they display digital leadership skills. More specifically, it examines which leadership style is the one that most of them follow or would follow, what is the relationship with leadership outcomes and, in addition, which digital skills they believe digital leaders of school units should have and which ones they believe they possess. The individual questions that are posed for answering through this research are:
[RQ1] Which leadership style do/would primary school teachers apply if they are/were principals?
[RQ2] Does the leadership style differ according to certain characteristics such as gender, age, level of study, school organization, etc.?
[RQ3] To what extent are digital skills recognized among teachers at the primary level?
[RQ4] Are digital skills related to any characteristics of teachers, such as age, gender, etc.?
[RQ5] Is "having" digital skills associated with a particular type of leadership?
3. Materials and Methods
Research Sample
The sample of the survey consists of 105 teachers, permanent, substitute and hourly paid teachers, teachers, principals, as well as teachers of specialties of primary schools in the region of Western Greece. The responses were collected during the last two months of 2022.
Data Collection
The method followed for data collection was the completion of a questionnaire, which was designed through the Google Forms application and distributed to teachers' friends for completion, as well as sent by e-mail to all primary schools in the region of Western Greece and completed electronically. The questionnaire is widely used in the research field as a data collection tool due to the ease of sharing and collecting the results.
In this case, a questionnaire was used with closed-ended questions consisting of three parts. The first part included questions related to the demographic characteristics of the teachers such as gender, age, level of education, work relationship with the school, years of service, specialization, etc.
The second part consists of the study [14] Multifactor Leadership Questionnaire (MLQ) (Form-5x), a weighted and widely recognized and used data collection instrument proposed by Bass in 1985 (and since then revised several times) to measure leadership style. The MLQ measures the dimensions of the three leadership styles, transformational, transactional and passive-avoidant, and additionally measures three key dimensions a) teachers' extra effort, b) their satisfaction with the leadership of the school unit, and c) the effectiveness of the leader, which have to do with Leadership Outcome.
More specifically, the MLQ includes forty-five (45) closed-ended questions of which thirty-six (36) address the nine (9) dimensions of the three leadership styles, with four (4) questions for each dimension, and the remaining nine (9) questions measure the leadership outcome. Specifically, the questionnaire measures transformational leadership based on five factors: i) idealized influence, based on the leader's characteristics; ii) idealized influence, based on the leader's behavior; iii) inspirational motivation; iv) activation of mental abilities; and v) leader's individualized concern for others. It measures the dimension of transactional leadership based on the dimensions: i) performance-based reward and ii) active management by exception and finally passive leadership with the factors: i) passive management by exception and ii) laissez-faire leadership.
Finally, the third part of the questionnaire consists of a total of seven (7) closed-ended questions, which were also used in the similar research by Antonopoulou et al. (2021) and are related to digital leadership and the digital skills that teachers believe they possess as well as those that they believe a school leader should have. The questions are rated on a five-point Likert scale, ranging from "not at all" (1) to "almost always" (5).
Statistical Processing
The responses collected from the completed electronic questionnaires were checked for accuracy and completeness, coded, and entered a database of the statistical software SPSS. Each row of the database contains the total number of responses of a respondent, while each column contains the total number of responses to a question. The questions asked by the sample members are variables that can be classified into categorical (demographic characteristics, digital attributes) and ordinal (leadership style, leadership outcome, number of digital attributes). Frequency - percentage tables, percentage bar charts and pie charts were used for descriptive statistical analysis of the categorical variables.
For the descriptive statistical analysis of the ordinal variables, the statistical measures of minimum value, maximum value, mean value, standard deviation as well as the bar charts of means were used. Correspondingly, for the inferential statistical analysis, the non-parametric Mann-Whitney (for comparing the means of two independent samples), Kruskal-Wallis (for comparing the means of three or more independent samples) and Wilkoxon Signed Ranks Test (for comparing the means of two related samples) were used. To investigate the possible correlations between different leadership styles (ordinal variables), Spearman's rho correlation coefficient was used. Further, the possible dependence between ordinal variables was investigated through simple linear regression. The reliability of the different scales of questions was measured using Cronbach's Alpha reliability index, where values above 0.7 are considered satisfactory. Finally, a significance level of α=0.05 was used for hypothesis testing of all statistical tests, correlations, and linear regressions.
4. Results
Most survey participants are female (81.0%), while about 1/5 are male (19.0%). Most respondents are in the age categories of 41-50 (37.1%) and 51-60 (32.4%), have only a bachelor's degree (61.0%), and are tenured teachers (82.9%). 39.0% of the sample members have more than 20 years of experience and the majority (69.5%) teach in 6-12/elementary schools. Finally, 75.2% of the sample consists of teachers and only 10.5% are or have been principals in the past (Table 1).
4.1. General Picture of Leadership Styles
Using the Multivariate Leadership Questionnaire (MLQ), the sample members were asked to indicate the extent to which they exhibit certain behaviors, on a scale from 1 (Not at all) to 5 (Almost always) by answering 43 questions in order to explore their profile in relation to the leadership style they adopt as managers or would adopt if they were to take up a managerial position. Digital leadership was measured in a similar way, using the 5 relevant questions. For each sample member, the average of the responses given for each leadership style is calculated and an individual mean score ranging from 1 - 5 is obtained. The higher the score recorded, the more the respondent adopts that leadership style. Cronbach's Alpha indicates that the reliability of all the question scales is very satisfactory since its values range from 0.776 (in the case of Transactional Leadership) to 0.947 (in the case of Leadership Outcome). Particularly in the case of Digital Leadership, Cronbach's Alpha is 0.895. This value of the index allows us to consider that the 5 questions exploring this leadership style belong to the same conceptual framework and can be represented by a new variable, as an average of these 5 questions (Table 2).
From the results, we find that the sample members adopt (or would adopt) to a very high degree the Transformational leadership (M.T.=4.10) and the Transactional leadership (M.T.=3.68), with relatively less intensity. The difference in the degree of adoption of these 2 leadership styles is statistically significant (p<0.05). We also observe that respondents avoid adopting Passive - Avoidant leadership (M.T. 1.69). In fact, this style is (or would be) adopted to a statistically significantly lesser degree than both Transformational and Transactional leadership (p<0.05) (Table 3).
4.2. Leadership Styles by Demographic Characteristics
In order to determine whether demographic characteristics have a statistically significant effect on the leadership style adopted (or would be adopted), the Mann-Whitney and Kruskal-Wallis non-parametric statistical tests were used.
First, we find that the gender of the respondents does not affect the extent to which they adopt (or would adopt) each leadership style. Any differences presented are not statistically significant (p>0.05) (Table 4).
Similarly, age categories do not seem to have a statistically significant effect on leadership styles (p>0.05) (Table 5).
In terms of level of study, it seems that respondents with a postgraduate degree adopt (or would adopt) more Transformational and Transactional leadership and less Passive leadership, compared to their colleagues with only a degree. However, the differences presented are not statistically significant (p>0.05) (Table 6).
In contrast, work relationships appear to have a statistically significant effect on leadership styles. Permanent teachers adopt (or would adopt) Transactional (M.T.=3.75) and Passive leadership (M.T.=1.73) to a greater extent than their Substitute-Temporary colleagues (M.T.=3.36 and M.T.=1.45 respectively). Years of service do not seem to have a statistically significant effect on the leadership style adopted (although in this sample, digital leadership seems to be more prominent among teachers with fewer years of service) (Table 7).
The same is not the case, however, with the organic nature of the school in which the research participants teach (Table 8).
The higher the organicity of the school, the more Transformational Leadership is (or would be) adopted (p<0.05) (Table 9).
Finally, the present or former status of the manager as well as the respondents' specialty do not seem to influence the adopted leadership style, leadership outcome or digital leadership (p>0.05) (Table 10).
However, it should be mentioned that in this sample, past or present managers demonstrate less Digital Leadership, while those holding the IT specialty demonstrate higher levels of Digital Leadership, compared to their other colleagues (the differences are however not statistically significant, with p>0.05) (Table 11).
4.3. Relationship of Leadership Outcomes to Leadership Styles
Spearman's non-parametric correlation coefficient rho is used to investigate the possible relationship of different leadership styles with leadership outcomes.
Leadership outcome shows a large positive and statistically significant correlation with transformational leadership (R=0.661) at the α=0.01 level. This implies that a high degree of adoption of this leadership style coexists with effectiveness and satisfaction with leadership performance. Similarly, leadership outcome also shows a high positive and statistically significant correlation with transactional leadership (R=0.385) at α=0.01 level. In contrast, a negative and statistically significant correlation is shown between Leadership Outcome and Passive - Avoidant leadership (R=-0.286). Therefore, the high degree of adoption of this style coexists with low levels of leadership effectiveness and satisfaction with leadership. If statistically significant correlations appear, there is a basis for the application of simple linear regression to determine whether there is a specific dependence of leadership outcome on each leadership style separately. The following regressions use leadership outcome as the dependent variable and each leadership style separately as the independent variable. The related table shows the key parameters β, R2 and p-value (Table 12).
We find that transformational leadership has a positive (β=0.970) and statistically significant influence (p=0.000<0.05) on leadership outcomes, i.e., the more this leadership style is adopted, the greater the effectiveness and satisfaction of employees. Moreover, this independent variable explains a large proportion of the variability in leadership outcome (R2=0.586). Leadership outcome is also positively (β=0.597) and statistically significantly influenced by transactional leadership (p=0.000<0.05). Therefore, employee effectiveness and satisfaction are also fueled by the adoption of this leadership style. This independent variable explains 25.5% of the variability in leadership outcome (R2=0.255). Passive - Avoidant leadership does not appear to have a statistically significant influence on leadership outcomes (Table 13).
4.4. Relationship Between Digital Leadership and Leadership Styles
Spearman's non-parametric correlation coefficient rho is used to investigate the possible relationship between different leadership styles and digital leadership.
Digital leadership shows a high positive and statistically significant correlation with transformational leadership (R=0.347) at the α=0.01 level. This means that the high degree of adoption of this leadership style coexists with the high degree of adoption of digital leadership. Similarly, Digital Leadership also shows a fairly large positive and statistically significant correlation with Leadership Outcome (R=0.261) at the α=0.01 level. Therefore, the high degree of adoption of this style coexists with high levels of leadership effectiveness and satisfaction (Table 14).
Since statistically significant correlations appear, there is a basis for the application of simple linear regression in order to determine whether there is a specific dependence of Digital Leadership on each leadership style separately. The following regressions use Digital Leadership as the dependent variable and each leadership style separately as the independent variable. The related table shows the key parameters β, R2 and p-value.
From the results, transformational leadership has a positive (β=0.717) and statistically significant (p=0.000<0.05) effect on Digital Leadership, i.e., the more this leadership style is adopted, the more Digital Leadership is practiced. Moreover, this independent variable explains a fairly large proportion of the variability of Digital Leadership (R2=0.271). Digital leadership is positively (β=0.343) and statistically significantly influenced by transactional leadership (p=0.006<0.05). Therefore, the ability to exploit and utilize new digital capabilities is also fueled by the adoption of this leadership style. This independent variable explains 7.1% of the variability of Digital leadership (R2=0.071). Regarding Passive leadership, it does not seem to have a statistically significant influence on the degree of Digital leadership (Table 15).
4.5. Necessary Digital Properties
The teachers who participated in the survey were asked to indicate the digital qualities that the principal of the future should possess. Participants were able to indicate one or more options.
The digital properties Web Development and Tools, Social Media and Cloud Computing are those with the highest response rates (64.8%, 62.9% and 60.0% respectively). However, most respondents also consider Security Skills (59.0%) and Widespread Mobile App (57.1%) important. Digital Architectures (10.5%), ERP Systems (24.8%) and Complex Business Systems (27.6%) are the least stated necessary digital qualities (Table 16).
In terms of the digital attributes possessed by the respondents themselves, the highest percentages appear in Social Media (81.9%), Mobile App (62.9%) and Cloud Computing (41.9%). Digital Architectures (6.7%), ERP Systems (3.8%) and Complex Business Systems (2.9%) are the digital attributes possessed least by the survey participants (Figure 1).
In order to compare the digital attributes stated as necessary for the Future Director and the digital attributes possessed by the respondents, the following comparative bar chart is provided (Figure 2):
We note that social media and mobile apps are the only digital attributes that are overlapped by those who possess them, compared to those who reported them as essential. Also, for the 4 most reported (as necessary) digital properties, they appear to be held by significantly smaller percentages of respondents (excluding social media). Alternatively, the number of digital attributes that survey participants reported possessing was examined.
On average, respondents reported about 3 of the 9 attributes recorded. There were participants who reported only 1 but also participants who reported 7 out of 9. To investigate whether demographic characteristics have a statistically significant effect on the number of digital properties held, non-parametric Mann-Whitney statistical tests were used (Table 17).
The results show that "Specialty" is the only demographic characteristic that influences the number of digital properties possessed by respondents. Specifically, those holding the specialty of "Computer Science" have reported a statistically significantly higher number of digital attributes held (M.T.=5.17), compared to the other specialties. However, although the differences are not statistically significant, male participants, younger participants, those holding a Master's or Postgraduate degree, principals and those serving in larger schools appear to possess more digital properties than their other colleagues. In addition, the relationship between different leadership styles and the number of digital attributes possessed by respondents was explored (Table 18).
It appears that the number of digital attributes possessed by respondents is positively and statistically significantly related to levels of Digital Leadership (R=0.325). Finally, the variable of number of digital attributes was recoded as a qualitative variable to obtain the percentages of participants possessing a few or many attributes (Table 19).
Most respondents (72.4%) said they have a small number of digital properties (1-3) (Table 20).
Respondents with a high number of digital attributes show higher levels of digital leadership (M.T.=4.32) than those with a low number (M.T.=3.77). This difference is statistically significant (p=0.001 < 0.05) (Table 21).
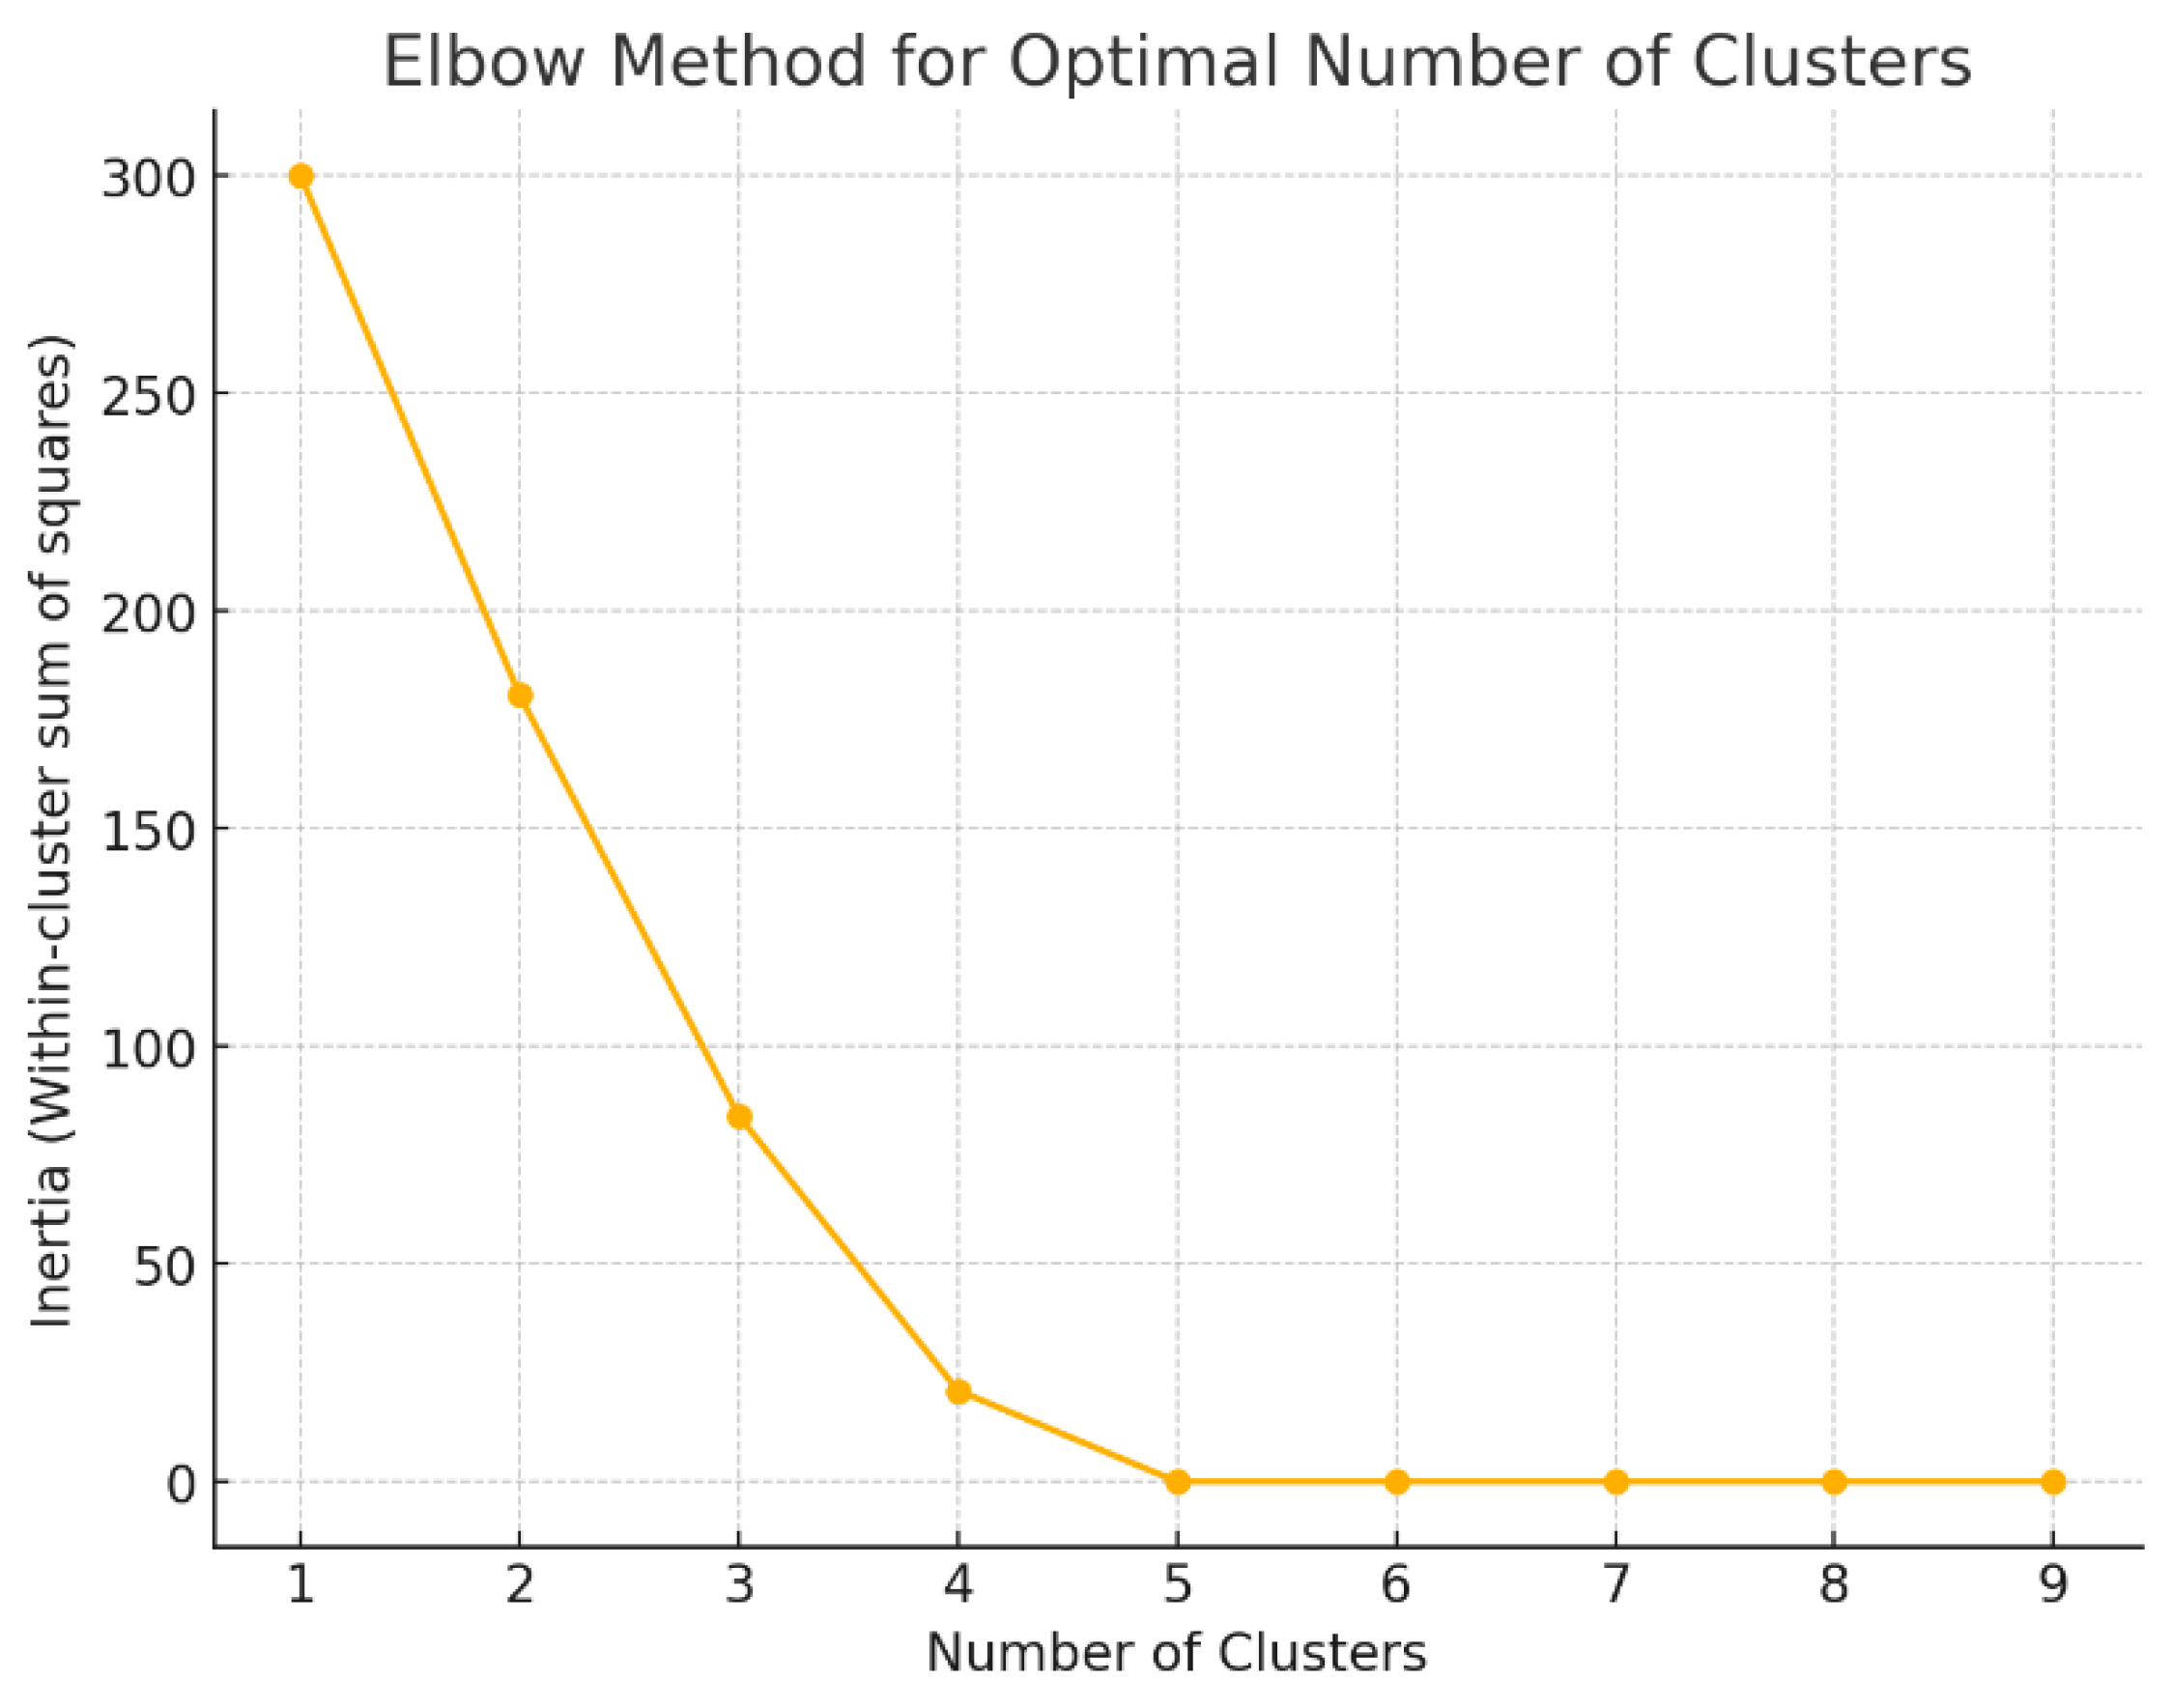
Behavioral Data Mining Analysis
In this study, a behavioral data mining approach was applied to categorize leadership styles among primary school teachers in Western Greece. The objective was to identify distinct clusters of leadership behaviors and explore trends that could inform targeted development programs. Using K-means clustering, three clusters were identified based on teachers’ engagement in supportive actions, critical review, and non-intervention practices. To determine the optimal number of clusters, we applied the Elbow Method. This method involves calculating the within-cluster sum of squares (inertia) across a range of cluster counts and identifying the “elbow point” where adding more clusters yields diminishing returns. As shown in the visualization below, the curve flattens significantly after three clusters, indicating that three clusters sufficiently capture the major behavioral variations without unnecessary complexity. Consequently, three clusters were selected for final analysis.
Summary Table of Leadership Clusters
Figure 3.
Elbow Method of Optimal Numbers of Clusters.
Cluster 2, the smallest group, representing only 4% of the sample, demonstrates a highly engaged leadership style with balanced behaviors across support, critical review, and non-intervention. This flexible and adaptable approach suggests a willingness to engage actively while allowing autonomy within the team. Cluster 2 members are typically aged 51-60 and have 11-20 years of experience, showing that moderate experience paired with adaptability can lead to a balanced leadership style. This group may be particularly well-suited for mentorship roles, sharing their proactive and flexible approach with peers (Table 22).
Further exploration of demographic trends reveals that age and experience significantly influence leadership styles. Clusters 1 and 2, composed of older, more experienced teachers, are generally more engaged and supportive, with Cluster 2 showing additional adaptability. Conversely, Cluster 0, which includes younger teachers with moderate experience, exhibits more passive leadership behaviors. This suggests that seasoned educators may gravitate toward more supportive and adaptive leadership, while less experienced teachers may benefit from targeted skill-building in proactive engagement and critical thinking.
Educational background remains largely uniform across clusters, with most teachers holding Bachelor’s degrees. This uniformity implies that variations in leadership style are likely influenced more by professional experience and personal development than by academic qualifications. Since all clusters share a similar educational background, professional development efforts should prioritize skill-building in leadership behaviors rather than focusing on academic advancement. School size also plays a role, as most teachers across all clusters work in medium-sized schools with 6-12 classes. This setting fosters close interactions among staff, contributing to the strong supportive behaviors seen in Clusters 1 and 2. However, the supportive tendencies in these settings may also limit engagement in critical review, especially if routines are well-established and change is infrequent. Leadership development initiatives in these environments could focus on enhancing adaptability and change management skills, ensuring that supportive behaviors are complemented by periodic critical evaluation.
The trends in critical review and non-intervention further highlight areas for development. Cluster 0 and Cluster 1 both display low engagement in critical review behaviors, suggesting that they may avoid challenging established practices in favor of stability. Cluster 2, however, balances support with critical review and autonomy, reflecting a more flexible, growth-oriented leadership style. This trend indicates that fostering critical review and adaptability in Clusters 0 and 1 could lead to a more balanced leadership culture.
Considering these findings, targeted professional development programs are recommended. Cluster 0 leaders could benefit from mentorship by Cluster 2 members, focusing on increasing engagement and supportive behaviors through small, measurable goals and regular feedback. Cluster 1 leaders may benefit from workshops on critical thinking, situational leadership, and adaptability, allowing them to expand their supportive approach with a strategic perspective. For Cluster 2, mentorship and advanced leadership projects would enable them to share their flexible style with peers and apply their skills in broader organizational contexts. This behavioral data mining analysis provides valuable insights into the diverse leadership styles among primary school teachers. While supportive behaviors are prevalent across the sample, there is room to cultivate adaptability and critical review, particularly in Clusters 0 and 1. By implementing targeted training and mentorship, schools can develop a more engaged, adaptable, and proactive leadership team, ultimately enriching the educational environment.
5. Discussion
The present study attempted to investigate the leadership style that teachers at primary schools in the region of Western Greece apply or would apply, if they were principals, as well as what is their opinion and their relationship with the digital skills that a digital school leader should possess. Regarding the demographic characteristics of the sample, most respondents are female teachers (81%), and most respondents are older than 40 years old. 82.9% are permanent teachers, 39% have more than 20 years of experience and most of them teach in 6-12/primary schools in the region of Western Greece. Finally, the largest percentage of the sample, as expected, are teachers, 61% have only a bachelor's degree and no further education or postgraduate studies, while only 10.5% of them have passed through a managerial position. Based on the results of the research, the research questions that were posed from the beginning are answered. More specifically:
[RQ1]:
Which leadership style do/would primary school teachers apply if they are/were principals?
In terms of leadership styles, the one that is adopted or would be adopted to a very high degree is the transformational leadership style with an Average Value of 4.10, as well as the digital leadership style with an Average Value of 3.92, followed by the transactional leadership style with an Average Value of 3.68. Also, as one would expect, the passive-avoidant leadership style shows a significantly lower Mean Value of 1.69 (Table 2).
[RQ2]:
Does leadership style differ according to some characteristics such as gender, age, level of study, school organicity, etc.?
Examining the leadership styles adopted in relation to the demographic characteristics of the sample, one comes to the following conclusions: characteristics such as gender, age and years of service do not influence the leadership style that the respondent teachers adopt or would adopt, although digital leadership seems to occur more among teachers with fewer years of service (Table 8). Those teachers who, in addition to their basic degree, have attended a postgraduate or postgraduate program seem to adopt or would adopt more transformational, digital or transactional leadership with a fairly large difference compared to passive leadership as shown in Table 6. Although the differences between transformational, digital and transactional styles are not statistically significant. Permanent teachers largely adopt transactional leadership while the percentages of passive leadership in this case are also statistically significant (Table 7). Transformational leadership on the other hand seems to be adopted more in large organizational schools. Principal status and teacher specialization do not seem to influence the leadership style followed, nor the leadership outcome. This finding is not consistent with research in higher education, where those who had been in an administrative or leadership position for more than 9 years appeared significantly less satisfied with leadership outcomes. Only regarding IT teachers, as expected given their specialism, do higher levels of adoption of digital leadership appear (Table 11).
The results of the corresponding survey in higher education were similar in terms of characteristics such as gender, age, and experience. It also appeared in this survey that the older the age of the respondents the lower the rates of digital leadership, but in general in both surveys the higher the satisfaction of teachers the more they adopt digital leadership.
Moreover, in the present study, it is worth noting that there is a large, positive, and statistically significant correlation between the adoption of the transformational leadership style and leadership outcomes (Table 12), which means that the more the transformational leadership style is adopted, the more satisfied teachers are (Table 13) regardless of the grade level they work in. Moreover, as mentioned in the literature review, transformational leadership inspires and energizes the leader's followers, proposes a vision, creates a desire for greater effort and increases efficiency and therefore team satisfaction. It also positively influences leadership outcomes and the transactional leadership style, in stark contrast of course to the passive leadership style which, as it increases, decreases teacher satisfaction and effectiveness.
[RQ3]:
To what extent are digital skills recognised among primary school teachers?
Regarding the digital skills of the school leader, the teachers surveyed said that the ones they consider most necessary are Web Development and Tools with 64.8%, Social Media 62.9% and Cloud Computing with 60%. When asked which digital skills they possess, the responses with the highest percentages were Social Media at 81.9%, Mobile App 62.9% and Cloud Computing at 41.9%. The skills of ERP Systems, Digital Architectures and Complex Business Systems are in the bottom three positions in both tables. Social Media and Web Development and Tools were in the top three positions in the higher education survey, as well as Digital Architectures and Complex Business Systems were in the same bottom three positions as they are in this survey. Comparing the required and available digital skills (Figure 3.5.7.), if we exclude Social Media and Mobile App, in the remaining seven (7) digital skills teachers' knowledge falls short of what they claim a principal should have. Overall, the average number of skills that respondents said they possess is 3 out of 9, with 72.4% stating that they possess 1 to 3 digital skills and only 29% stating that they possess 4 to 7 digital skills. Therefore, most teachers have low digital skills, a finding like the previous survey. The key finding, however, is that teachers with a high number of digital skills have higher rates of digital leadership, whereas in the previous study there was no statistically significant relationship between the number of digital skills of teachers and a leadership style.
[RQ4]:
Are digital skills related to some characteristics of teachers such as gender, age, etc.?
A first reading of the survey results (Table 19) shows that more digital skills are possessed by men (3.25) compared to women (2.60), relatively younger, those with post-graduate or post-graduate education compared to those with only a basic degree, those who work in large schools and those who have served as principals. But all these differences are small and statistically insignificant. The only characteristic that seems to have a strong and statistically significant impact on the number of digital skills is the teachers' specialization, specifically IT teachers. This result can perhaps be matched with the finding of the higher education survey, where teachers who belonged to the staff of a Technological Educational Institution showed a higher number of digital skills than university teachers.
[RQ5]:
: Is "having" digital skills associated with a particular type of leadership?
From the findings of the survey, as well as the previous similar one, it appears that the number of digital skills possessed by the respondents is positively and significantly related to the percentage in which they practice the digital leadership style. That is, the more digital skills teachers report, the more they can adopt digital leadership [107,108,109,110,111,112]. In summary, the transformational model of leadership is the one that emerges as the most adopted or potentially adopted among teachers of primary education in the region of Western Greece, if they were in a managerial position, especially in large schools. This implies that there is now a perceived need for a leader who is modern, visionary, with open horizons, who approaches leadership to act as an agent of change and innovation, who sets goals, inspires, and can lead the change of the organizational culture of an educational organization, as well as the voluntary tendency for improvement and progress of its employees [113,114,115,116,117]. It is now clear that the school, as a living organization, needs to change to be able to keep up with progress and respond to change at all levels.
As a corollary, the more transformational leadership is adopted, the greater teachers' satisfaction with the outcome of leadership seems to be and the more digital leadership rates increase [118,119,120,121,122]. Digital leadership, as presented, encompasses all the expertise, skills, and attitudes that a leader needs to have to use ICT appropriately and effectively at all levels of a school, administrative and learning. It is necessary to be aware of the challenges he/she will have to face, to have the power to motivate his/her followers, but also to lead them in their personal and professional upgrading and progress [123,124,125,126,127]. The digital transformation that is sought to be achieved in all areas of modern life requires continuous personal development to keep up with the times. Investing in digital teaching and learning resources and, in addition, cultivating digital skills on the part of teachers are key pillars of the digital transition of any educational organization. However, despite the rapid increase in technological innovation, as shown by the survey, digital leadership rates in primary schools in the region of Western Greece are still at low levels, indicating that we are still at an early stage [128,129,130,131]. Although teachers recognize the growing need for and importance of developing digital skills, the rate of their existence is still low. On the other hand, those with a high number of digital skills show higher rates of digital leadership, especially IT teachers whose subject area is directly affected by new technologies [132,133,134]. From all the above, there is a need to train and specialize teachers in digital skills in all areas where they can have an impact on education. Lack of training, fear and entrenched school culture are a barrier to improving the efficiency and effectiveness of an educational institution. Therefore, educational leaders must recognize and take advantage of opportunities for progress and change and lead in this direction [135,136,137].
Limitations
The research focused on the wider region of Western Greece and specifically on the public primary schools of the prefecture. However, the sample that participated in the survey was only 105 teachers of various specialties, a small number compared to the number of teachers and specialties in the entire prefecture. Thus, based on the relatively small number of participants, one cannot generalize about the findings of the study. However, clear results emerged in relation to the leadership styles adopted in education, as well as the level of digital readiness that teachers possess. However, it would be advisable to extend the study to a larger sample of the county or even to other counties in Greece, with a possible comparison in the results between them.
6. Conclusions
In conclusion, this research points out the critical role of transformational and digital leadership in enhancing the learning environment, especially in primary schools in Western Greece. The research brings out a large gap between the perceived need for digital leadership and the current digital competence of teachers, which turns out to be a huge barrier toward effective digital transformation. While adopting transformational leadership, the lack of digital competence among teachers calls for focusing professional development programs to close this gap. It presents also a positive relationship between transformational and digital leadership; hence, developing these aspects of leadership will have crucial consequences in improving outcomes of leadership and furthering the digitization of schools. These results show the need for continuing and specialized training to professionalize teachers in their digital competencies, based on which educational institutions can negotiate and succeed in this new digital era. This would call for further research with an increased and diverse sample size to develop better insights into these dynamics and formulate more effective policies and programs for the development of leaders and the integration of technology into education.
Author Contributions
Conceptualization, H.A. and P.M.; methodology, H.A.; software, C.H.; validation, H.A., I.G. and C.H.; formal analysis, C.H.; investigation, P.M.; resources, P.M. and I.G.; data curation, C.H.; writing-original draft preparation, H.A. and P.M.; writing-review and editing, I.G. and C.H.; visualization, H.A. and C.H.; supervision, H.A.; project administration, H.A.; funding acquisition, I.G. All authors have read and agreed to the published version of the manuscript.
Funding
The publication fees of this manuscript have been financed by the Research Council of the University of Patras, Greece.
Informed Consent Statement
Informed consent was obtained from all subjects involved in the study.
Data Availability Statement
The data presented in this study are available on request from the corresponding author.
Conflicts of Interest
The authors declare no conflicts of interest.
References
- Weber, E., Büttgen, M., & Bartsch, S. (2022). How to take employees on the digital transformation journey: An experimental study on complementary leadership behaviors in managing organizational change. Journal of Business Research. [HTML] . [CrossRef]
- Khaw, T. Y., Teoh, A. P., Khalid, S. N. A., & Letchmunan, S. (2022). The impact of digital leadership on sustainable performance: A systematic literature review. Journal of Management Development, 41(9/10), 514-534. [CrossRef]
- Jameson, J., Rumyantseva, N., Cai, M., Markowski, M., Essex, R., & McNay, I. (2022). A systematic review and framework for digital leadership research maturity in higher education. Computers and Education Open, 3, 100115.
- Antonopoulou, H., Halkiopoulos, C., Barlou, O., & Beligiannis, G. (2019). Transition from Educational Leadership to e-Leadership: a Data Analysis Report from TEI of Western Greece. International Journal of Learning, Teaching and Educational Research, 18(9), 238-255. [CrossRef]
- Li, L., Novillo-Ortiz, D., Azzopardi-Muscat, N., & Kostkova, P. (2021). Digital data sources and their impact on people's health: A systematic review of systematic reviews. Frontiers in Public Health, 9, 645260. [CrossRef]
- Bankins, S., Ocampo, A. C., Marrone, M., Restubog, S. L. D., & Woo, S. E. (2024). A multilevel review of artificial intelligence in organizations: Implications for organizational behavior research and practice. Journal of Organizational Behavior, 45(2), 159-182. [CrossRef]
- Saad Alessa, G. (2021). The dimensions of transformational leadership and its organizational effects in public universities in Saudi Arabia: A systematic review. Frontiers in Psychology. [CrossRef]
- Antonopoulou, H., Halkiopoulos, C., Barlou, O., & Beligiannis, G. N. (2021). Associations between traditional and digital leadership in academic environment: During the COVID-19 pandemic. Emerging Science Journal, 5(4), 405-428 . [CrossRef]
- Wart, M. V., Roman, A., Wang, X., & Liu, C. (2017). Operationalizing the definition of e-leadership: identifying the elements of e-leadership. International Institute of Administrative Sciences, 85(1), doi.org/10.1177/0020852316681446.
- Peng, B. (2022). Digital leadership: State governance in the era of digital technology. Cultures of Science. [CrossRef]
- Gierlich-Joas, M., Hess, T., & Neuburger, R. (2020). More self-organization, more control—or even both? Inverse transparency as a digital leadership concept. Business Research. [CrossRef]
- Ruel, H., Rowlands, H., & Njoku, E. (2021). Digital business strategizing: The role of leadership and organizational learning. Competitiveness Review: An International Business Journal, 31(1), 145-161. [CrossRef]
- Wang, T., Lin, X., & Sheng, F. (2022). Digital leadership and exploratory innovation: From the dual perspectives of strategic orientation and organizational culture. Frontiers in Psychology. [CrossRef]
- Avolio, B., Bass, B., & Jung, D. (1999). re-examining the components of transformational and transactional leadership using the Multifactor Leadership. journal of occupational and organizational psychology, 72(4), 441-462. doi.org/10.1348/096317999166789.
- Vergne, J. P. (2020). Decentralized vs. distributed organization: Blockchain, machine learning and the future of the digital platform. Organization Theory. [CrossRef]
- Karakose, T., Kocabas, I., Yirci, R., Papadakis, S., Ozdemir, T. Y., & Demirkol, M. (2022). The development and evolution of digital leadership: A bibliometric mapping approach-based study. Sustainability, 14(23), 16171. [CrossRef]
- Achrol, R. S., & Kotler, P. (2022). Distributed marketing networks: The fourth industrial revolution. Journal of Business Research. [CrossRef]
- Cunha, M. N., Chuchu, T., & Maziriri, E. (2020). Threats, challenges, and opportunities for open universities and massive online open courses in the digital revolution. International Journal of Emerging Technologies in Learning (iJET), 15(12), 191-204. [CrossRef]
- Dumulescu, D., & Muţiu, A. I. (2021). Academic leadership in the time of COVID-19: Experiences and perspectives. Frontiers in Psychology. [CrossRef]
- Zhao, Y. (2012). World Class Learners. Educating Creative and Entrepreneurial Students. Retrieved from: https://books.google.gr/books?hl=en&lr=&id=S3pZDwAAQBAJ&oi=fnd&pg=PP1&ots=76kCbMSlhZ&sig=FZg2LypUkqauxYT163k6TiBZ2BE&redir_esc=y#v=onepage&q&f=false.
- Nóvoa, A., & Alvim, Y. (2020). Nothing is new, but everything has changed: A viewpoint on the future school. Prospects. [CrossRef]
- Antonopoulou, H., Halkiopoulos, C., Barlou, O., & Beligiannis, G. N. (2021). Transformational leadership and digital skills in higher education institutes: during the COVID-19 pandemic. Emerging Science Journal, 5(1), 1-15. [CrossRef]
- Laufer, M., Leiser, A., Deacon, B., Perrin de Brichambaut, P., Fecher, B., Kobsda, C., & Hesse, F. (2021). Digital higher education: A divider or bridge builder? Leadership perspectives on edtech in a COVID-19 reality. International Journal of Educational Technology in Higher Education, 18, 1-17. [CrossRef]
- Alenezi, M. (2023). Digital learning and digital institution in higher education. Education Sciences. [CrossRef]
- McCarthy, A. M., Maor, D., McConney, A., & Cavanaugh, C. (2023). Digital transformation in education: Critical components for leaders of system change. Social Sciences & Humanities Open, 8(1), 100479. [CrossRef]
- Berkovich, I., & Hassan, T. (2024). Principals' digital instructional leadership during the pandemic: Impact on teachers' intrinsic motivation and students' learning. Educational Management Administration & Leadership, 52(4), 934-954. [CrossRef]
- Rodríguez-Abitia, G., & Bribiesca-Correa, G. (2021). Assessing digital transformation in universities. Future Internet. [CrossRef]
- Behie, S. W., Pasman, H. J., Khan, F. I., Shell, K., Alarfaj, A., El-Kady, A. H., & Hernandez, M. (2023). Leadership 4.0: The changing landscape of industry management in the smart digital era. Process Safety and Environmental Protection, 172, 317-328 . [CrossRef]
- Dunbar, K., & Yadav, A. (2022). Shifting to student-centered learning: Influences of teaching a summer service learning program. Teaching and Teacher Education. [CrossRef]
- Soubra, L., Al-Ghouti, M. A., Abu-Dieyeh, M., & Crovella, S. (2022). Impacts on student learning and skills and implementation challenges of two student-centered learning methods applied in online education. Sustainability. [CrossRef]
- El Morabit, S., & Manegre, M. (2024). Comparing student-centered learning in a video-based app to the grammar-translation method in an EFL class. Computer Assisted Language Learning. [CrossRef]
- Haleem, A., Javaid, M., Qadri, M. A., & Suman, R. (2022). Understanding the role of digital technologies in education: A review. Sustainable Operations and Computers, 3, 275-285. [CrossRef]
- Iivari, N., Sharma, S., & Ventä-Olkkonen, L. (2020). Digital transformation of everyday life—How COVID-19 pandemic transformed the basic education of the young generation and why information management research should care?. International Journal of Information Management, 55, 102183. [CrossRef]
- Martins Van Jaarsveld, G. (2020). The effects of COVID-19 among the elderly population: A case for closing the digital divide. Frontiers in Psychiatry. [CrossRef]
- Javaid, M., Haleem, A., Rab, S., Singh, R. P., & Suman, R. (2021). Sensors for daily life: A review. Sensors International. [CrossRef]
- Levin, I., & Mamlok, D. (2021). Culture and society in the digital age. Information. [CrossRef]
- Reddy, P., Sharma, B., & Chaudhary, K. (2020). Digital literacy: A review of literature. International Journal of Technoethics (IJT), 11(2), 65-94. [CrossRef]
- Sailer, M., Murböck, J., & Fischer, F. (2021). Digital learning in schools: What does it take beyond digital technology? Teaching and Teacher Education. [CrossRef]
- Szymkowiak, A., Melović, B., Dabić, M., Jeganathan, K., & Kundi, G. S. (2021). Information technology and Gen Z: The role of teachers, the internet, and technology in the education of young people. Technology in Society, 65, 101565 . [CrossRef]
- Theodorakopoulos, L., Theodoropoulou, A., & Halkiopoulos, C. (2024). Enhancing Decentralized Decision-Making with Big Data and Blockchain Technology: A Comprehensive Review. Applied Sciences, 14(16), 7007. [CrossRef]
- Stamatiou, Y. C., Halkiopoulos, C., Giannoulis, A., & Antonopoulou, H. (2022). Utilizing a Restricted Access e-Learning Platform for Reform, Equity, and Self-development in Correctional Facilities. Emerging Science Journal, 6, 241–252. [CrossRef]
- Bakalis, A., Halkiopoulos, C., & Antonopoulou, H. (2024). The Digital Transformation of Tourism. Case Study of Greek Tourism. Springer Proceedings in Business and Economics, 121–157. [CrossRef]
- Chatterjee, S., Chaudhuri, R., Vrontis, D., & Giovando, G. (2023). Digital workplace and organization performance: Moderating role of digital leadership capability. Journal of Innovation & Knowledge, 8(1), 100334. [CrossRef]
- Benitez, J., Arenas, A., Castillo, A., & Esteves, J. (2022). Impact of digital leadership capability on innovation performance: The role of platform digitization capability. Information & Management. [CrossRef]
- Porfírio, J. A., Carrilho, T., Felício, J. A., & Jardim, J. (2021). Leadership characteristics and digital transformation. Journal of Business Research. [CrossRef]
- Navaridas-Nalda, F., Clavel-San Emeterio, M., Fernández-Ortiz, R., & Arias-Oliva, M. (2020). The strategic influence of school principal leadership in the digital transformation of schools. Computers in Human Behavior, 112, 106481. [CrossRef]
- Karakose, T., Polat, H., & Papadakis, S. (2021). Examining teachers' perspectives on school principals' digital leadership roles and technology capabilities during the COVID-19 pandemic. Sustainability. [CrossRef]
- Hamzah, N. H., Nasir, M. K. M., & Wahab, J. A. (2021). The Effects of Principals' Digital Leadership on Teachers' Digital Teaching during the COVID-19 Pandemic in Malaysia. Journal of Education and E-Learning Research, 8(2), 216-221. [CrossRef]
- AlAjmi, M. K. (2022). The impact of digital leadership on teachers' technology integration during the COVID-19 pandemic in Kuwait. International Journal of Educational Research. [CrossRef]
- de Araujo, L. M., Priadana, S., Paramarta, V., & Sunarsi, D. (2021). Digital leadership in business organizations. International Journal of Educational Administration, Management, and Leadership, 45-56. [CrossRef]
- Eberl, J. K., & Drews, P. (2021). Digital Leadership—Mountain or molehill? A literature review. Innovation through Information Systems: Volume III: A Collection of Latest Research on Management Issues, 223-237. [CrossRef]
- Sortwell, A., Trimble, K., Ferraz, R., Geelan, D., Hine, G., Ramirez-Campillo, R., Carter-Thuillier, B., Gkintoni, E., Xuan, Q. (2024). A Systematic Review of Meta-Analyses on the Impact of Formative Assessment on K-12 Students’ Learning: Toward Sustainable Quality Education. Sustainability, 16, 7826. [CrossRef]
- Gkintoni, E., Halkiopoulos, C., Antonopoulou, H. (2022). Neuroleadership an Asset in Educational Settings: An Overview. Emerging Science Journal. Emerging Science Journal, 6(4), 893–904. [CrossRef]
- Erhan, T., Uzunbacak, H. H., & Aydin, E. (2022). From conventional to digital leadership: Exploring digitalization of leadership and innovative work behavior. Management Research Review. [CrossRef]
- Schmidt, J. T., & Tang, M. (2020). Digitalization in education: Challenges, trends and transformative potential. Führen und managen in der digitalen transformation: Trends, best practices und herausforderungen, 287-312. [CrossRef]
- Gapsalamov, A., Bochkareva, T., Vasilev, V., Akhmetshin, E., & Anisimova, T. (2020). Comparative analysis of education quality and the level of competitiveness of leader countries under digitalization conditions. Journal of Social Studies Education Research, 11(2), 133-150.
- Høydal, S., & Haldar, M. (2022). A tale of the digital future: Analyzing the digitalization of the Norwegian education system. Critical Policy Studies. [CrossRef]
- Zancajo, A., Verger, A., & Bolea, P. (2022). Digitalization and beyond: The effects of Covid-19 on post-pandemic educational policy and delivery in Europe. Policy and Society. [CrossRef]
- Ronzhina, N., Kondyurina, I., Voronina, A., Igishev, K., & Loginova, N. (2021). Digitalization of modern education: Problems and solutions. International Journal of Emerging Technologies in Learning (iJET), 16(4), 122-135. [CrossRef]
- Theodorakopoulos, L., Karanikola, Z., Katsonis, N., & Papadopoulos, D. (2018). The Use of New Information and Communication Technologies In The Learning Process: A Case Study of Secondary Education In The Prefecture of Aitoloakarnania. SSRN Electronic Journal. [CrossRef]
- Vasilev, V. L., Gapsalamov, A. R., Akhmetshin, E. M., Bochkareva, T. N., Yumashev, A. V., & Anisimova, T. I. (2020). Digitalization peculiarities of organizations: A case study. Entrepreneurship and Sustainability Issues, 7(4), 3173. [CrossRef]
- Halkiopoulos, C., & Gkintoni, E. (2024). Leveraging AI in E-Learning: Personalized Learning and Adaptive Assessment through Cognitive Neuropsychology—A Systematic Analysis. Electronics, 13(18), 3762. [CrossRef]
- Cone, L., Brøgger, K., Berghmans, M., Decuypere, M., Förschler, A., Grimaldi, E., ... & Vanermen, L. (2022). Pandemic acceleration: COVID-19 and the emergency digitalization of European education. European Educational Research Journal, 21(5), 845-868. [CrossRef]
- Antonopoulou, H., Theodorakopoulos, L., Halkiopoulos, C., & Mamalougkou, V. (2023). Utilizing Machine Learning to Reassess the Predictability of Bank Stocks. Emerging Science Journal, 7(3), 724–732. [CrossRef]
- Bormann, I., Brøgger, K., Pol, M., & Lazarová, B. (2021). COVID-19 and its effects: On the risk of social inequality through digitalization and the loss of trust in three European education systems. European Educational Research Journal, 20(5), 610-635. [CrossRef]
- Gousteris, S., Stamatiou, Y. C., Halkiopoulos, C., Antonopoulou, H., & Kostopoulos, N. (2023). Secure Distributed Cloud Storage based on Blockchain Technology and Smart Contracts. Emerging Science Journal, 7(2), 469–479. [CrossRef]
- Kickbusch, I., Piselli, D., Agrawal, A., Balicer, R., Banner, O., Adelhardt, M., ... & Wong, B. L. H. (2021). The Lancet and Financial Times Commission on governing health futures 2030: Growing up in a digital world. The Lancet, 398(10312), 1727-1776. [CrossRef]
- Gasser, U., Ienca, M., Scheibner, J., Sleigh, J., & Vayena, E. (2020). Digital tools against COVID-19: Taxonomy, ethical challenges, and navigation aid. The Lancet Digital Health, 2(8), e425-e434. [CrossRef]
- Nochta, T., Wan, L., Schooling, J. M., & Parlikad, A. K. (2021). A socio-technical perspective on urban analytics: The case of city-scale digital twins. Journal of Urban Technology, 28(1-2), 263-287. [CrossRef]
- Malodia, S., Dhir, A., Mishra, M., & Bhatti, Z. A. (2021). Future of e-Government: An integrated conceptual framework. Technological Forecasting and Social Change, 173, 121102. [CrossRef]
- Zhang, J., & Chen, Z. (2024). Exploring human resource management digital transformation in the digital age. Journal of the Knowledge Economy. [CrossRef]
- Li, L., Collins, A. M., Cheshmehzangi, A., & Chan, F. K. S. (2020). Identifying enablers and barriers to the implementation of the Green Infrastructure for urban flood management: A comparative analysis of the UK and China. Urban Forestry & Urban Greening, 54, 126770. [CrossRef]
- Luan, H., Geczy, P., Lai, H., Gobert, J., Yang, S. J., Ogata, H., ... & Tsai, C. C. (2020). Challenges and future directions of big data and artificial intelligence in education. Frontiers in Psychology, 11, 580820. [CrossRef]
- Theodorakopoulos, L., & Theodoropoulou, A. (2024). Leveraging Big Data Analytics for Understanding Consumer Behavior in Digital Marketing: A Systematic Review. Human Behavior and Emerging Technologies, 2024(1). Portico. [CrossRef]
- Kuziemski, M., & Misuraca, G. (2020). AI governance in the public sector: Three tales from the frontiers of automated decision-making in democratic settings. Telecommunications Policy. [CrossRef]
- Pope, R., Zenonos, A., Bryant, W., Spiridou, A., Key, D., Patel, S., ... & Sebire, N. J. (2024). Real-world learnings for digital health industry-NHS collaboration: Life sciences vision in action. Future Healthcare Journal, 11(3), 100168. [CrossRef]
- Theodorakopoulos, L., Theodoropoulou, A., & Stamatiou, Y. (2024). A State-of-the-Art Review in Big Data Management Engineering: Real-Life Case Studies, Challenges, and Future Research Directions. Eng, 5(3), 1266–1297. [CrossRef]
- Dexter, S., & Richardson, J. W. (2020). What does technology integration research tell us about the leadership of technology? Journal of Research on Technology in Education, 52(1), 17-36. [CrossRef]
- Gomez, F. C., Trespalacios, J., Hsu, Y. C., & Yang, D. (2022). Exploring teachers' technology integration self-efficacy through the 2017 ISTE Standards. TechTrends. [CrossRef]
- Almusawi, H. A., Durugbo, C. M., & Bugawa, A. M. (2021). Innovation in physical education: Teachers' perspectives on readiness for wearable technology integration. Computers & Education. [CrossRef]
- Pan, W., Xie, T., Wang, Z., & Ma, L. (2022). Digital economy: An innovation driver for total factor productivity. Journal of Business Research. [CrossRef]
- Richardson, J. W., Bathon, J., & McLeod, S. (2021). Leadership for deeper learning: Facilitating school innovation and transformation. [CrossRef]
- Fuad, D. R. S. M., Musa, K., & Hashim, Z. (2022). Innovation culture in education: A systematic review of the literature. Management in Education. [CrossRef]
- Torres, L. L. (2022). School organizational culture and leadership: Theoretical trends and new analytical proposals. Education Sciences. [CrossRef]
- Agasisti, T., Frattini, F., & Soncin, M. (2020). Digital innovation in times of emergency: Reactions from a school of management in Italy. Sustainability. [CrossRef]
- Leithwood, K. (2021). A review of evidence about equitable school leadership. Education Sciences. [CrossRef]
- Theodorakopoulos, L., Theodoropoulou, A., & Stamatiou, Y. (2024). A State-of-the-Art Review in Big Data Management Engineering: Real-Life Case Studies, Challenges, and Future Research Directions. Eng, 5(3), 1266–1297. [CrossRef]
- Halkiopoulos, C., Antonopoulou, H., Gkintoni, E., & Aroutzidis, A. (2022). Neuromarketing as an Indicator of Cognitive Consumer Behavior in Decision-Making Process of Tourism destination—An Overview. Springer Proceedings in Business and Economics, 679–697. [CrossRef]
- Masonbrink, A. R., & Hurley, E. (2020). Advocating for children during the COVID-19 school closures. Pediatrics. [CrossRef]
- Nevill, T., Savage, G. C., & Forsey, M. (2023). It's a diagnosis for the rich: Disability, advocacy and the micro-practices of social reproduction. British Journal of Sociology of Education, 44(2), 239-258. [CrossRef]
- Antonopoulou, H., Theodorakopoulos, L., Halkiopoulos, C., & Mamalougkou, V. (2023). Utilizing Machine Learning to Reassess the Predictability of Bank Stocks. Emerging Science Journal, 7(3), 724–732. [CrossRef]
- Martinez, J. A., & Broemmel, A. D. (2021). Pencils down: Educators respond to the uncertainty amidst COVID-19 school closures. International Studies in Educational Administration, 49(1), 109-132.
- Gallegos-Rejas, V. M., Thomas, E. E., Kelly, J. T., & Smith, A. C. (2023). A multi-stakeholder approach is needed to reduce the digital divide and encourage equitable access to telehealth. Journal of Telemedicine and Telecare, 29(1), 73-78. [CrossRef]
- Gandolfi, E., Ferdig, R. E., & Kratcoski, A. (2021). A new educational normal: An intersectionality-led exploration of education, learning technologies, and diversity during COVID-19. Technology in Society. [CrossRef]
- Varma, A., Dawkins, C., & Chaudhuri, K. (2023). Artificial intelligence and people management: A critical assessment through the ethical lens. Human Resource Management Review, 33(1), 100923. [CrossRef]
- Halkiopoulos, C., Antonopoulou, H., Gkintoni, E., Aroutzidis, A. (2021). Neuromarketing as an Indicator of Cognitive Consumer Behavior in Decision Making Process of Tourism Destination. In: Katsoni, V., Şerban, A.C. (eds) Transcending Borders in Tourism Through Innovation and Cultural Heritage. Springer Proceedings in Business and Economics. Springer, Cham. [CrossRef]
- Alkureishi, M. A., Choo, Z. Y., Rahman, A., Ho, K., Benning-Shorb, J., Lenti, G., ... & Lee, W. W. (2021). Digitally disconnected: Qualitative study of patient perspectives on the digital divide and potential solutions. JMIR Human Factors, 8(4), e33364. [CrossRef]
- Faturoti, B. (). Online learning during COVID-19 and beyond: A human-rights-based approach to internet access in Africa. International Review of Law.
- Bass, B., & Avolio, B. (1994) Improving organizational effectiveness through transformational leadership. Thousand Oaks, CA: Sage.
- Gkintoni, E., Vantaraki, F., Skoulidi, C., Anastassopoulos, P., & Vantarakis, A. (2024). Promoting Physical and Mental Health among Children and Adolescents via Gamification—A Conceptual Systematic Review. Behavioral Sciences, 14(2), 102. [CrossRef]
- Baylor, A., & Ritchie, D. (2002).What factors facilitate teacher skill, teacher morale, and perceived student learning in technology-using classrooms? Education, 39(4), 395-414. doi.org/10.1016/S0360-1315(02)00075-1.
- Richardson, J. W., Bathon, J., Flora, K., & Lewis, W. (2012). NETS-A Scholarship: A Review of Published Literature. Journal of Research on Technology in Education 45(2), 131-151. doi.org/10.1080/15391523.2012.10782600.
- Leithwood, K., Jantzi, D., & Steinbach, R. (1999) Changing leadership for changing times Buckingham: Open University Press.
- Hallinger, P. (2005). Instructional Leadership and the School Principal: A Passing Fancy that Refuses to Fade Away. Leadership and Policy in Schools, 4(3), 221-239. [CrossRef]
- Spillane, J. P., Halverson, R., & Diamond, J. B. (2001). investigating school leadership practice: a distributed perspective. educational researcher, 30(3), 23-28.
- Akcil, U., Aksal, F. A., Mukhametzyanova, F., & Gazi, Z. A. (2017). An Examination of Open and Technology Leadership in Managerial Practices of Education System. EURASIA Journal of Mathematics Science and Technology Education, 13(1), 119-131. [CrossRef]
- Andersson, A., Hatakka, M., Grönlund, A., & Wiklund, M. (2014). Reclaiming the Students - Coping with Social media in 1:1 Schools. learning, media and technology 39(1), 37-52. doi.org/10.1080/17439884.2012.756518.
- Anderson, R. E., & Dexter, S. L. (2000). School Technology Leadership: incidence and impact. center for research on information technology and organizations. u.c. Irvine. Retrieved from: http://escholarship.org/uc/item/76s142fc.
- Avolio, B. J., Kahai, S., & Dodge, G. E. (2001). e-leadership: Implications for theory, research, and practice. leadership quarterly, 11(4), 615-668. doi.org/10.1016/S1048-9843(00)00062-X.
- Bass, B. M. (1985) Leadership and performance beyond expectations, New York: The Free Press.
- Bass, B. M., & Riggio, R. E. (2005). transformational leadership. doi.org/10.4324/9781410617095.
- Bennis, W., & Nanus, B. (1985) Leaders: The strategies for taking charge, New York: Harper & Row. Retrieved from: http://coachjacksonspages.com/44.pdf.
- Bosch, O., Nguyen, N., & Sun, D. (2013). addressing the Critical Need for 'New Ways of Thinking' in Managing Complex Issues in a Socially Responsible Way. business systems review, 2(2), 48-70. special issue - selected papers of the 1st Business Systems Laboratory International Symposium. [CrossRef]
- Boyd, D. (2015). social media: a phenomenon to be analysed. social media + society, 1(1). [CrossRef]
- Burns, J. M. (1978) Leadership, New York: Harper & Row Publishers.
- Bush, T., & Glover, D. (2003). Nottingham: National College for School Leadership.
- Day, D. (2000). Leadership development:: A review in context The Leadership Quarterly, 11(4), 581-613. [CrossRef]
- Faizi, R., El Afia, A., & Chiheb, R. (2013). exploring the potential benefits of using social media in education. international journal of engineering pedagogy, 3(4). http://dx.doi.org/10.3991/ijep.v3i4.2836.
- Fischer, C., Pardos, Z., Baker, R. S., Williams, J. J., Smyth, P., Yu, R., ... Warschauer, M. (2020). mining big data in education: affordances and challenges. Review of research in education, 44, 130-160. [CrossRef]
- Fouad, M. M., Oweis, N. E., Gaber, T., Ahmed, M., & Snasel, V. (2015). data mining and fusion techniques for WSNs as a source of Big Data. Procedia Computer Science, 65, 778-786. doi.org/10.1016/j.procs.2015.09.023.
- Frambach, R., & Schillewaert, N. 2002. organizational innovation adoption. a multi-level framework of determinants and opportunities for future research. Journal of business research, 55, 163-176. doi.org/10.1016/S0148-2963(00)00152-1.
- Fry, L. W. (2005). Introduction to The Leadership Quarterly special issue: Toward a paradigm of spiritual leadership. The Leadership Quarterly, 16(5), 619-622. [CrossRef]
- Gonzalez-Martínez, J., Bote-Lorenzo, M., Gomez-Sanchez, E., & Cano-Parra, R. (2014). cloud computing and education: a state-of-the-art survey.Computers & Education, 80, 132-151. doi.org/10.1016/j.compedu.2014.08.017.
- Greenhow, C., & Lewin, C. (2016). Social media and education: reconceptualizing the boundaries of formal and informal learning. learning, media and technology, 41(1), 6-30. doi.org/10.1080/17439884.2015.1064954.
- Guba, E. G., & Getzels, J. W. (1957). Social behavior and the administrative process. the school review, 65(4), 423-441. Retrieved from: https://www.academia.edu/24606702/Getzels_Guba.
- Hallinger, P. (2003). Leading Educational Change: reflections on the practice of instructional and transformational leadership. Cambridge Journal of Education, 33(3), 329-352 . dx.doi.org/10.1080/0305764032000122005.
- Haseski, H. İ. (2020). Cyber security skills of pre-service teachers as a factor in computer-assisted education. International Journal of Research in Education and Science, 6(3), 484-500. http://dx.doi.org/10.46328/ijres.v1i1.1006.
- Heck, R. H., & Hallinger, P. (1999) Conceptual models, methodology, and methods for studying school leadership. K. Seashore-Louis (Eds.), The 2nd handbook of research in educational administration, (141-162) San Francisco: McCutchan.
- Hsu, Y.-C., & Ching, Y. -H. (2013). Mobile App Design for Teaching and Learning: Educators' Experiences in an Online Graduate Course. The International Review of Research in Open and Distributed Learning, 14(4), 117-139. [CrossRef]
- Leithwood, K. (1994). Leadership for school restructuring. educational administration quarterly, 30, 498-518. Retrieved from: https://files.eric.ed.gov/fulltext/ED367061.pdf.
- Leithwood, K., Harris, A., & Hopkins, D. (2008) Seven Strong Claims about Successful School Leadership. Management, 28(1), 27-42. doi.org/10.1080/13632430701800060.
- Ritchie, D. C. (1996) The administrative role in the integration of technology. NASSP Bulletin, 80(582), 42-52.
- Yadav, K. (2014).Role of Cloud Computing in Education.International Journal of Innovative Research in Computer and Communication Engineering, 2(2). Retrieved from: www.semanticscholar.org/paper/Role-of-Cloud-Computing-in-Education-Yadav/382c1810af1568f563a794191adc94f466e8f710.
- Zimmerman, J. (2004) Leading Organizational Change Is Like Climbing a Mountain. The Educational Forum, 68, 234 -242.
- Zupanzic, T., Verbeke, J., Achten, H., Herneoja, A., Osterlund, T., & Piia, M. (2016). digital Leadership Complexity, Simplicity. eCAADe and Oulu School of Architecture, University of Oulu, 1, 63-68. Retrieved from: https://lirias.kuleuven.be/1685390?limo=0.
- Cakir, R. (2012). Technology Integration and Technology Leadership in Schools as Learning Organizations.Turkish Online Journal of Educational Technology - TOJET, 11(4), 273-282. Retrieved from: https://eric.ed.gov/?id=EJ989277.
- Izham, M., Juraime, F., & Norhaini-Mansor, A. (2016). Malaysian principals' technology leadership practices and curriculum management. creative education, 7(7), 922-930. [CrossRef]
Figure 1.
Digital qualities possessed by respondents.
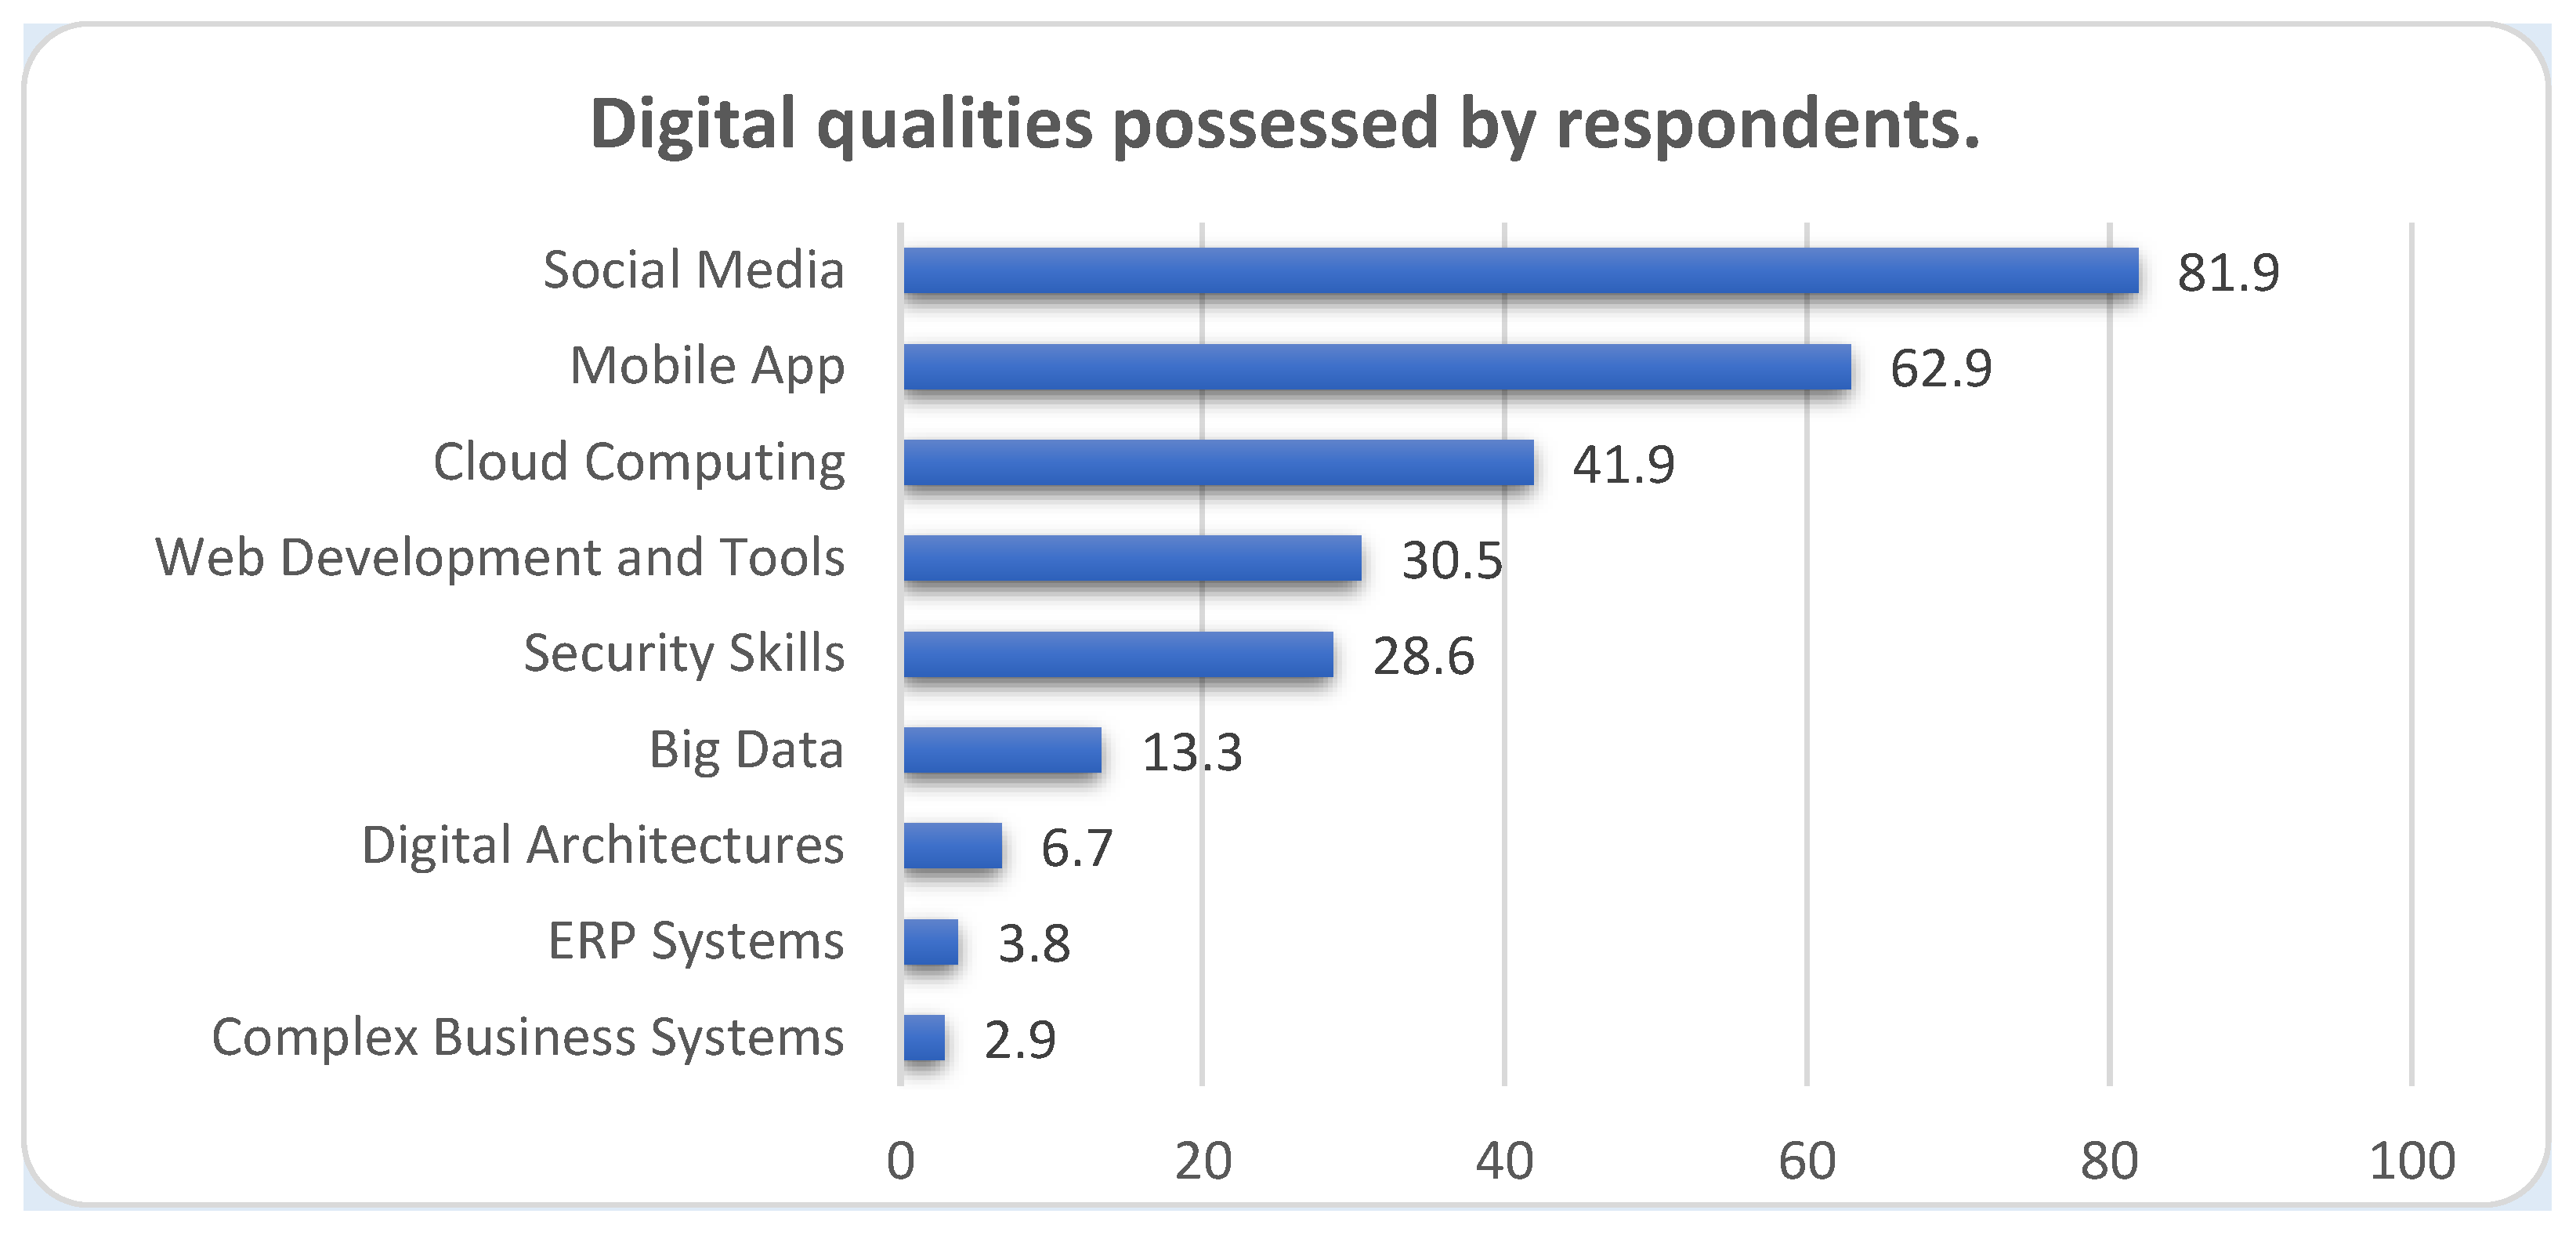
Figure 2.
Digital properties (Required - Available).
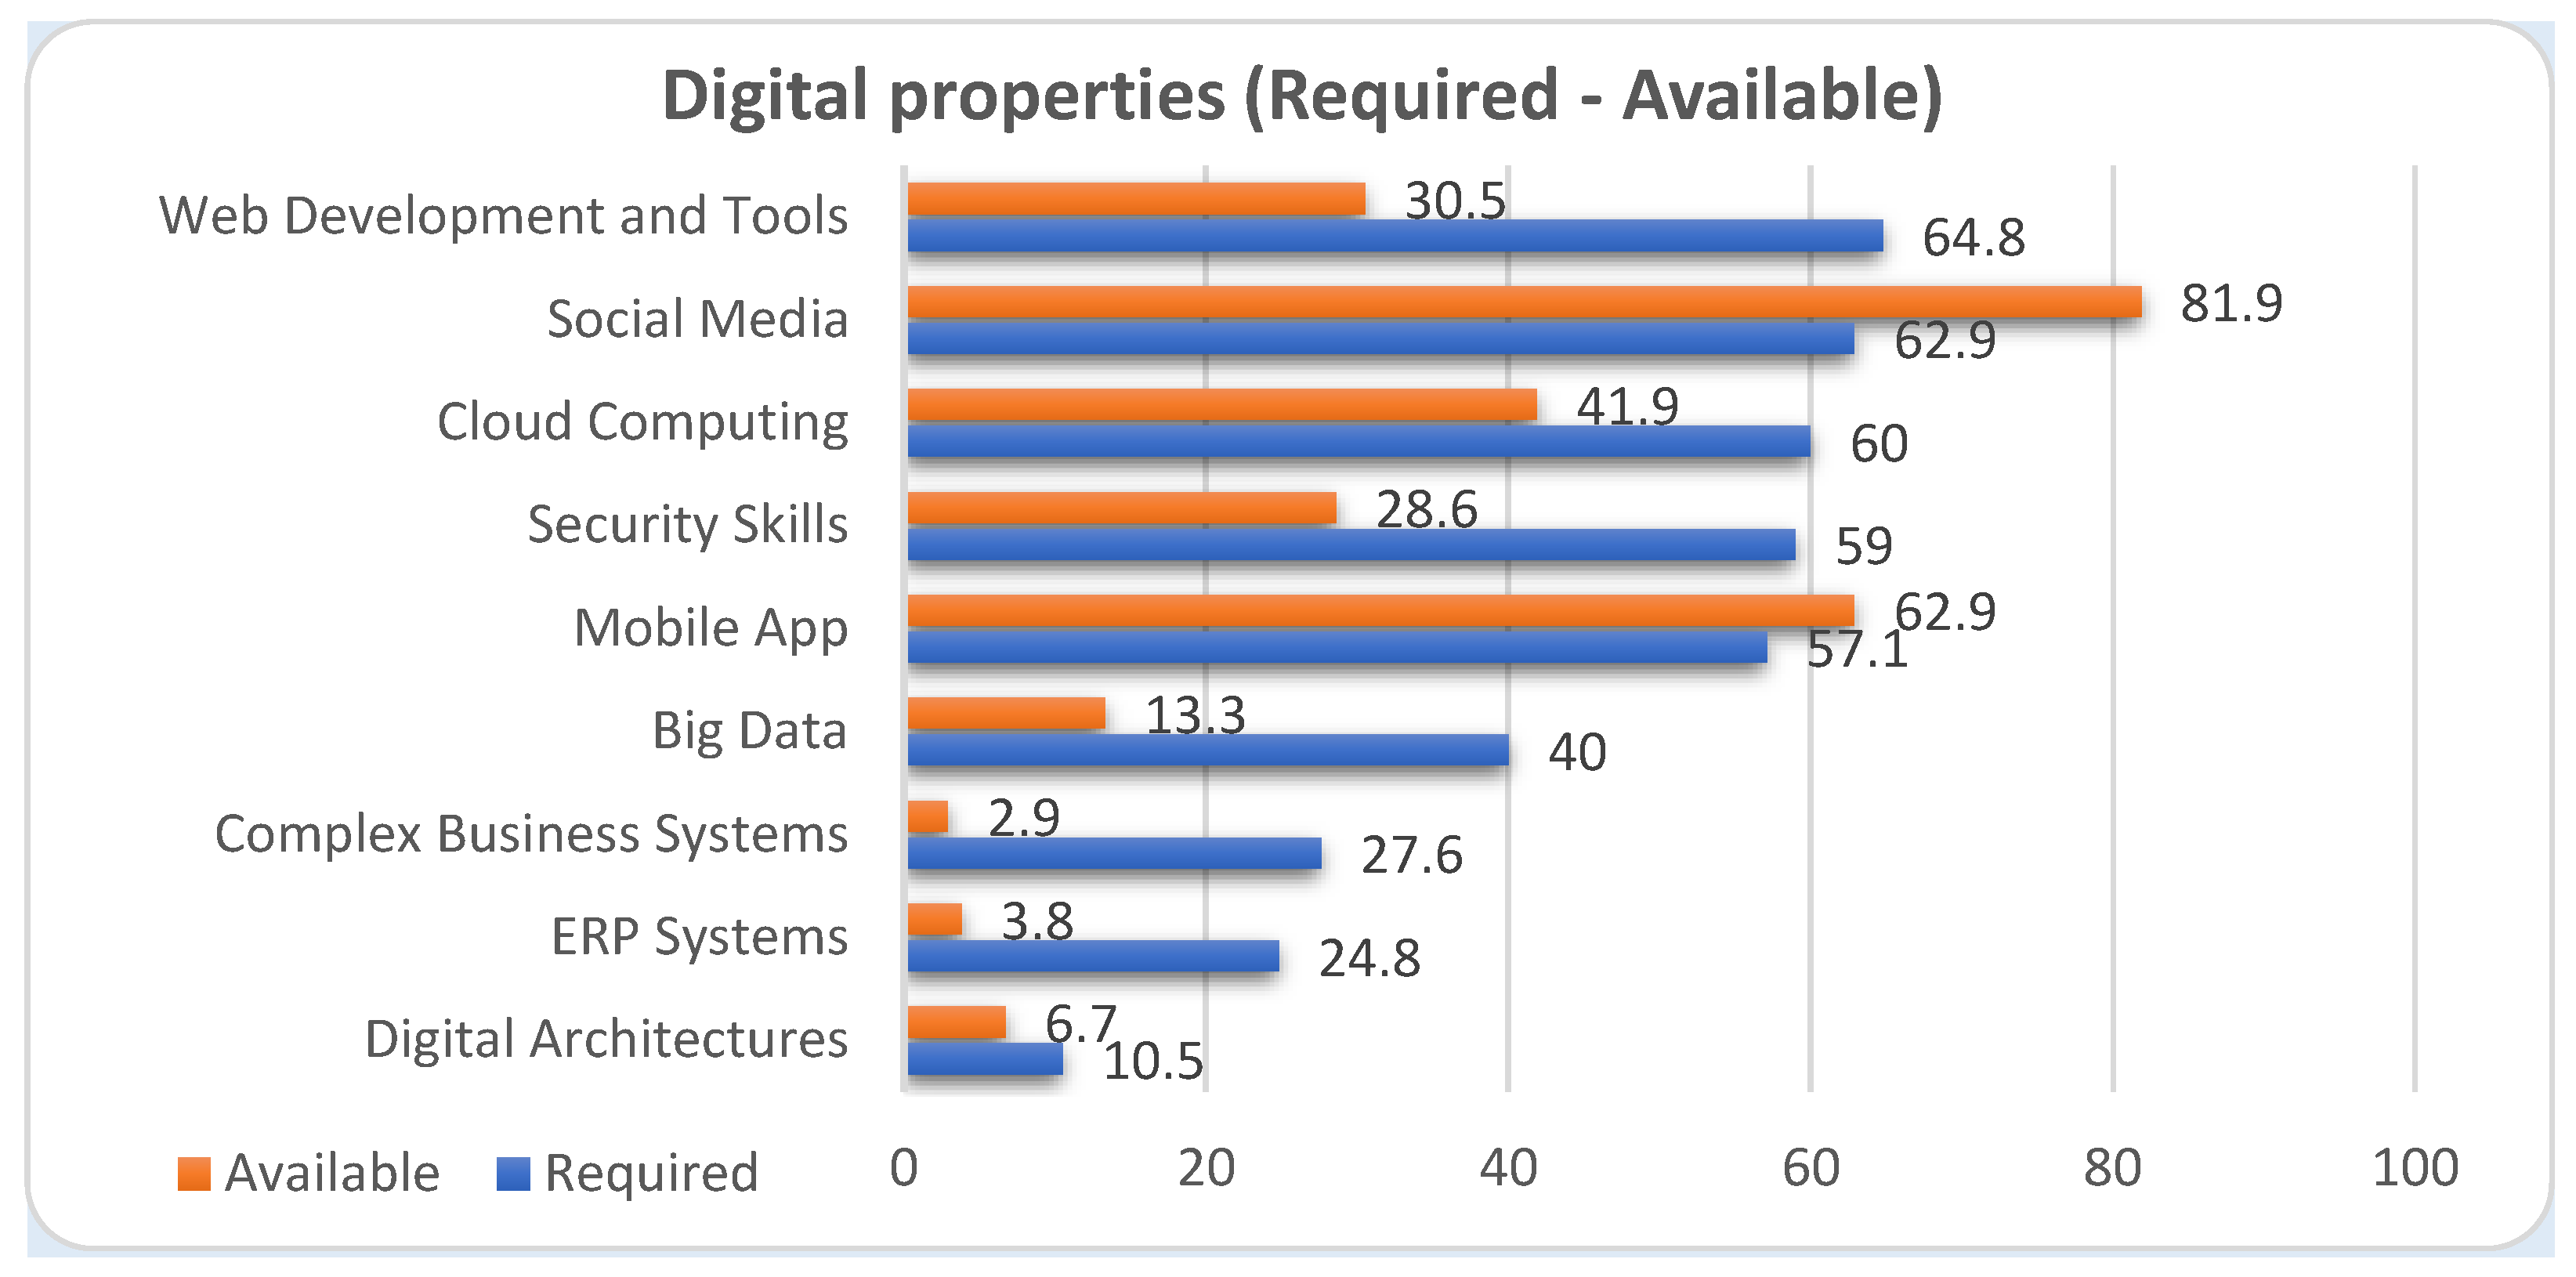

Table 1.
Demographic characteristics of the sample (N=105).
| FAQ (N) |
QUANTUM (%) |
||
|---|---|---|---|
| GENDER | Male | 20 | 19,0 |
| Woman | 85 | 81,0 | |
| AGE | <30 | 8 | 7,6 |
| 31-40 | 24 | 22,9 | |
| 41-50 | 39 | 37,1 | |
| 51-60 | 34 | 32,4 | |
| LEVEL OF STUDIES | Degree | 64 | 61,0 |
| Retraining | 7 | 6,7 | |
| Postgraduate | 34 | 32,4 | |
| WORK RELATIONSHIP WITH THE SCHOOL | Permanent | 87 | 82,9 |
| Deputy | 15 | 14,3 | |
| Hourly employee | 3 | 2,9 | |
| YEARS OF SERVICE IN PRIMARY EDUCATION | 1-5 | 13 | 12,4 |
| 6-10 | 11 | 10,5 | |
| 11-20 | 40 | 38,1 | |
| >20 | 41 | 39,0 | |
| ORGANISATION OF THE SCHOOL TO WHICH YOU ARE ASSIGNED | <4/institution | 1 | 1,0 |
| 4-6/institution | 5 | 4,8 | |
| 6-12/institution | 73 | 69,5 | |
| >12/institution | 26 | 24,8 | |
| SPECIALITY | Teachers | 79 | 75,2 |
| Specialities | 20 | 19,2 | |
| Information Technology | 6 | 5,7 | |
| HAVE YOU BEEN OR ARE YOU A DIRECTOR? | Yes | 11 | 10,5 |
| No | 94 | 89,5 | |
Table 2.
Description of the variables under consideration.
| Ν | Min | Max | M.T. | T.A. | Cronbach's alpha | |
|---|---|---|---|---|---|---|
| Transformational leadership | 105 | 1,16 | 5,00 | 4,10 | 0,58 | 0,916 |
| Transactional leadership | 105 | 1,25 | 5,00 | 3,68 | 0,62 | 0,776 |
| Passive - Avoidant leadership | 105 | 1,00 | 4,88 | 1,69 | 0,59 | 0,791 |
| Leadership outcome | 105 | 1,00 | 5,00 | 4,12 | 0,74 | 0,947 |
| Digital leadership | 105 | 1,00 | 5,00 | 3,92 | 0,80 | 0,895 |
Table 3.
Exploring differences between leadership styles.
| M.T. | Standard deviation | Test | P-value | |
|---|---|---|---|---|
| Transformational leadership | 4,10 | 0,58 | Wilkoxon Signed Ranks Test | 0,000** |
| Transactional leadership | 3,68 | 0,62 | ||
| Transformational leadership | 4,10 | 0,58 | Wilkoxon Signed Ranks Test | 0,000** |
| Passive - Avoidant leadership | 1,69 | 0,59 | ||
| Transactional leadership | 3,68 | 0,62 | Wilkoxon Signed Ranks Test | 0,000** |
| Passive - Avoidant leadership | 1,69 | 0,59 |
** The correlation is statistically significant at the 0.01 level.
Table 4.
Leadership style - Gender.
| Leadership Style | GENDER | M.T. | T.A. | Test | P-value |
|---|---|---|---|---|---|
| Transformative | Male | 4,19 | 0,41 | Mann-Whitney | 0,527 |
| Woman | 4,08 | 0,62 | |||
| Transactional | Male | 3,58 | 0,57 | Mann-Whitney | 0,578 |
| Woman | 3,70 | 0,64 | |||
| Passive | Male | 1,61 | 0,44 | Mann-Whitney | 0,700 |
| Woman | 1,70 | 0,62 | |||
| Leadership outcome | Male | 4,30 | 0,56 | Mann-Whitney | 0,256 |
| Woman | 4,08 | 0,77 | |||
| Digital leadership | Male | 3,89 | 0,80 | Mann-Whitney | 0,825 |
| Woman | 3,93 | 0,81 |
Table 5.
Leadership style - Age.
| Leadership Style | AGE | M.T. | T.A. | Test | P-value |
|---|---|---|---|---|---|
| Transformative | <40 | 4,03 | 0,66 | Kruskal-Wallis | 0,587 |
| 41-50 | 4,12 | 0,41 | |||
| 51-60 | 4,15 | 0,68 | |||
| Transactional | <40 | 3,53 | 0,64 | Kruskal-Wallis | 0,315 |
| 41-50 | 3,71 | 0,51 | |||
| 51-60 | 3,79 | 0,71 | |||
| Passive | <40 | 1,54 | 0,49 | Kruskal-Wallis | 0,179 |
| 41-50 | 1,74 | 0,51 | |||
| 51-60 | 1,76 | 0,73 | |||
| Leadership outcome | <40 | 4,11 | 0,74 | Kruskal-Wallis | 0,538 |
| 41-50 | 4,10 | 0,63 | |||
| 51-60 | 4,16 | 0,86 | |||
| Digital leadership | <40 | 3,96 | 0,76 | Kruskal-Wallis | 0,931 |
| 41-50 | 3,94 | 0,75 | |||
| 51-60 | 3,87 | 0,91 |
Table 6.
Leadership style - Level of education.
| Leadership Style | LEVEL OF STUDIES | M.T. | T.A. | Test | P-value |
|---|---|---|---|---|---|
| Transformative | Degree | 4,03 | 0,68 | Mann-Whitney | 0,147 |
| Postgraduate Education - Postgraduate | 4,22 | 0,36 | |||
| Transactional | Degree | 3,64 | 0,74 | Mann-Whitney | 0,268 |
| Postgraduate Education - Postgraduate | 3,75 | 0,38 | |||
| Passive | Degree | 1,72 | 0,65 | Mann-Whitney | 0,621 |
| Postgraduate Education - Postgraduate | 1,63 | 0,48 | |||
| Leadership outcome | Degree | 4,07 | 0,82 | Mann-Whitney | 0,282 |
| Postgraduate Education - Postgraduate | 4,21 | 0,60 | |||
| Digital leadership | Degree | 3,90 | 0,87 | Mann-Whitney | 0,968 |
| Postgraduate Education - Postgraduate | 3,96 | 0,70 |
Table 7.
Leadership style - Work relationship.
| Leadership Style | EMPLOYMENT | M.T. | T.A. | Test | P-value |
|---|---|---|---|---|---|
| Transformative | Permanent | 4,15 | 0,54 | Mann-Whitney | 0,130 |
| Vice-Chairman of the Committee. | 3,88 | 0,74 | |||
| Transactional | Permanent | 3,75 | 0,60 | Mann-Whitney | 0,015* |
| Vice-Chairman of the Committee. | 3,36 | 0,67 | |||
| Passive | Permanent | 1,73 | 0,62 | Mann-Whitney | 0,048* |
| Vice-Chairman of the Committee. | 1,45 | 0,36 | |||
| Leadership outcome | Permanent | 4,11 | 0,72 | Mann-Whitney | 0,505 |
| Vice-Chairman of the Committee. | 4,17 | 0,86 | |||
| Digital leadership | Permanent | 3,89 | 0,80 | Mann-Whitney | 0,263 |
| Vice-Chairman of the Committee. | 4,08 | 0,83 |
Table 8.
Leadership style - Years of service in primary education.
| Leadership Style | YEARS OF SERVICE | M.T. | T.A. | Test | P-value |
|---|---|---|---|---|---|
| Transformative | 1-5 | 3,88 | 0,84 | Kruskal-Wallis | 0,417 |
| 6-10 | 3,99 | 0,36 | |||
| 11-20 | 4,17 | 0,45 | |||
| >20 | 4,14 | 0,65 | |||
| Transactional | 1-5 | 3,35 | 0,77 | Kruskal-Wallis | 0,070 |
| 6-10 | 3,40 | 0,55 | |||
| 11-20 | 3,73 | 0,46 | |||
| >20 | 3,81 | 0,69 | |||
| Passive | 1-5 | 1,41 | 0,33 | Kruskal-Wallis | 0,181 |
| 6-10 | 1,61 | 0,54 | |||
| 11-20 | 1,66 | 0,49 | |||
| >20 | 1,82 | 0,72 | |||
| Leadership outcome | 1-5 | 4,19 | 0,99 | Kruskal-Wallis | 0,410 |
| 6-10 | 3,98 | 0,41 | |||
| 11-20 | 4,15 | 0,54 | |||
| >20 | 4,12 | 0,88 | |||
| Digital leadership | 1-5 | 4,02 | 0,91 | Kruskal-Wallis | 0,303 |
| 6-10 | 4,27 | 0,65 | |||
| 11-20 | 3,89 | 0,65 | |||
| >20 | 3,84 | 0,93 |
Table 9.
Leadership style - Organizability.
| Leadership Style | ORGANIZATION | M.T. | T.A. | Test | P-value |
|---|---|---|---|---|---|
| Transformative | <6/institution | 3,54 | 1,14 | Kruskal-Wallis | 0,031* |
| 6-12/institution | 4,08 | 0,53 | |||
| >12/institution | 4,31 | 0,47 | |||
| Transactional | <6/institution | 3,19 | 0,83 | Kruskal-Wallis | 0,217 |
| 6-12/institution | 3,72 | 0,60 | |||
| >12/institution | 3,69 | 0,61 | |||
| Passive | <6/institution | 1,35 | 0,29 | Kruskal-Wallis | 0,068 |
| 6-12/institution | 1,73 | 0,50 | |||
| >12/institution | 1,65 | 0,82 | |||
| Leadership outcome | <6/institution | 3,65 | 1,28 | Kruskal-Wallis | 0,066 |
| 6-12/institution | 4,07 | 0,72 | |||
| >12/institution | 4,38 | 0,58 | |||
| Digital leadership | <6/institution | 3,83 | 1,29 | Kruskal-Wallis | 0,387 |
| 6-12/institution | 3,86 | 0,82 | |||
| >12/institution | 4,12 | 0,59 |
Table 10.
Leadership style - Have you been or are you a manager?
| Leadership Style | DIRECTOR | M.T. | T.A. | Test | P-value |
|---|---|---|---|---|---|
| Transformative | Yes | 4,08 | 1,03 | Mann-Whitney | 0,226 |
| No | 4,11 | 0,52 | |||
| Transactional | Yes | 3,58 | 0,88 | Mann-Whitney | 0,929 |
| No | 3,69 | 0,59 | |||
| Passive | Yes | 1,50 | 0,39 | Mann-Whitney | 0,331 |
| No | 1,71 | 0,61 | |||
| Leadership outcome | Yes | 4,10 | 1,11 | Mann-Whitney | 0,436 |
| No | 4,13 | 0,69 | |||
| Digital leadership | Yes | 3,75 | 1,19 | Mann-Whitney | 0,925 |
| No | 3,94 | 0,75 |
Table 11.
Leadership style - Specialty.
| Leadership Style | SPECIALITY | M.T. | T.A. | Test | P-value |
|---|---|---|---|---|---|
| Transformative | Teachers | 4,10 | 0,63 | Kruskal-Wallis | 0,612 |
| Specialities | 4,14 | 0,44 | |||
| Information Technology | 3,99 | 0,41 | |||
| Transactional | Teachers | 3,70 | 0,64 | Kruskal-Wallis | 0,494 |
| Specialities | 3,66 | 0,55 | |||
| Information Technology | 3,50 | 0,67 | |||
| Passive | Teachers | 1,67 | 0,50 | Kruskal-Wallis | 0,528 |
| Specialities | 1,81 | 0,87 | |||
| Information Technology | 1,50 | 0,60 | |||
| Leadership outcome | Teachers | 4,16 | 0,76 | Kruskal-Wallis | 0,615 |
| Specialities | 4,00 | 0,68 | |||
| Information Technology | 4,08 | 0,74 | |||
| Digital leadership | Teachers | 3,84 | 0,84 | Kruskal-Wallis | 0,166 |
| Specialities | 4,16 | 0,65 | |||
| Information Technology | 4,27 | 0,52 |
Table 12.
Correlation of Leadership Outcome with Leadership Styles.
| Transformational leadership | Transactional leadership | Passive - Avoidant leadership | |
|---|---|---|---|
| R1 | R1 | R1 | |
| Leadership outcome | 0,661** | 0,385** | -0,286** |
1 Spearman's correlation coefficient rho. ** The correlation is statistically significant at the 0.01 level.
Table 13.
Dependence of Leadership Outcome on Leadership Styles.
| Dependent Variable | Simple Linear Regression parameters | Transformational leadership | Transactional leadership | Passive - Avoidant leadership |
|---|---|---|---|---|
| Leadership outcome | Coefficient b | 0,970 | 0,597 | -0,177 |
| p-value | 0,000** | 0,000** | 0,151 | |
| R2 | 0,586 | 0,255 | 0,020 |
** The influence is statistically significant at the 0.01 level.
Table 14.
Correlation of Digital Leadership with leadership styles.
| Transformational leadership | Transactional leadership | Passive - Avoidant leadership | Leadership outcome | |
|---|---|---|---|---|
| R1 | R1 | R1 | ||
| Digital leadership | 0,347** | 0,095 | -0,173 | 0,261** |
1 Spearman's correlation coefficient rho. ** The correlation is statistically significant at the 0.01 level.
Table 15.
Dependence of Digital Leadership on leadership styles.
| Dependent Variable | Simple Linear Regression parameters | Transformational leadership | Transactional leadership | Passive - Avoidant leadership |
|---|---|---|---|---|
| Digital leadership | Coefficient b | 0,717 | 0,343 | -0,091 |
| p-value | 0,000** | 0,006** | 0,498 | |
| R2 | 0,271 | 0,071 | 0,004 |
** The influence is statistically significant at the 0.01 level.
Table 16.
Digital qualities that the manager of the future must possess.
| FAQ (N) |
QUANTUM (%) |
||
|---|---|---|---|
| Digital properties | Web Development and Tools | 68 | 64,8 |
| social media | 66 | 62,9 | |
| cloud computing | 63 | 60,0 | |
| security skills | 62 | 59,0 | |
| mobile app | 60 | 57,1 | |
| Big Data | 42 | 40,0 | |
| complex business systems | 29 | 27,6 | |
| ERP systems | 26 | 24,8 | |
| Digital Architectures | 11 | 10,5 |
Table 17.
Number of digital properties possessed by respondents.
| Ν | Min | Max | M.T. | T.A. | |
|---|---|---|---|---|---|
| Number of digital properties | 105 | 1 | 7 | 2,72 | 1,50 |
Table 18.
Number of digital properties by demographic attribute.
| Number of digital properties | Standard deviation | Test | P-value | ||
|---|---|---|---|---|---|
| GENDER | Male | 3,25 | 1,80 | Mann-Whitney | 0,141 |
| Woman | 2,60 | 1,39 | |||
| AGE | <40 | 2,94 | 1,61 | Kruskal-Wallis | 0,510 |
| 41-50 | 2,79 | 1,64 | |||
| 51-60 | 2,44 | 1,19 | |||
| LEVEL OF STUDIES | Degree | 2,50 | 1,36 | Mann-Whitney | 0,654 |
| Postgraduate Education - Postgraduate | 3,07 | 1,65 | |||
| EMPLOYMENT | Permanent | 2,74 | 1,54 | Mann-Whitney | 0,931 |
| Vice-Chairman of the Committee. | 2,67 | 1,33 | |||
| YEARS OF SERVICE | 1-5 | 2,69 | 1,32 | Kruskal-Wallis | 0,088 |
| 6-10 | 3,64 | 1,96 | |||
| 11-20 | 2,93 | 1,54 | |||
| >20 | 2,29 | 1,25 | |||
| ORGANIZATION | <6/institution | 1,83 | 0,98 | Kruskal-Wallis | 0,300 |
| 6-12/institution | 2,75 | 1,50 | |||
| >12/institution | 2,85 | 1,57 | |||
| DIRECTOR | Yes | 3,45 | 1,57 | Mann-Whitney | 0,079 |
| No | 2,64 | 1,47 | |||
| SPECIALITY | Teachers | 2,51 | 1,39 | Kruskal-Wallis | 0,005** |
| Specialities | 2,85 | 1,14 | |||
| Information Technology | 5,17 | 1,94 | |||
** The correlation is statistically significant at the 0.01 level.
Table 19.
Correlation of number of digital attributes with leadership styles.
| Transformational leadership | Transactional leadership | Passive - Avoidant leadership | Leadership outcome | Digital leadership | |
|---|---|---|---|---|---|
| R1 | R1 | R1 | R1 | R1 | |
| Number of digital properties | 0,137 | 0,046 | -0,117 | 0,130 | 0,325** |
1 Pearson correlation coefficient. * The correlation is statistically significant at the 0.05 level.
Table 20.
Number of digital properties possessed by respondents.
| FAQ (N) |
QUANTUM (%) |
||
|---|---|---|---|
| Number of digital properties | Low (1-3) | 76 | 72,4 |
| High (4-7) | 29 | 27,6 | |
Table 21.
Levels of digital leadership by number of digital properties.
| Levels of Digital Leadership | Standard deviation | Test | P-value | ||
|---|---|---|---|---|---|
| Number of digital properties | Low (1-3) | 3,77 | 0,84 | Mann-Whitney | 0,001** |
| High (4-7) | 4,32 | 0,51 | |||
** The correlation is statistically significant at the 0.01 level.
Table 22.
Table of Clusters.
| Cluster | Dataset (%) | Support for Staff (Mean) | Critical Review (Mean) | Non-Intervention (Mean) | Common Age Range | Common Years of Service | Common Specialty |
| Cluster 0 (Passive) | 53% | 0.0 | 0.15 | 0.0 | 41-50 | 11-20 | ΠΕ70 |
| Cluster 1 (Supportive & Hands-on) | 43% | 1.0 | 0.35 | 0.0 | 51-60 | >20 | ΠΕ70 |
| Cluster 2 (Flexible & Adaptable) | 4% | 1.0 | 1.0 | 1.0 | 51-60 | 11-20 | ΠΕ70 |
Disclaimer/Publisher’s Note: The statements, opinions and data contained in all publications are solely those of the individual author(s) and contributor(s) and not of MDPI and/or the editor(s). MDPI and/or the editor(s) disclaim responsibility for any injury to people or property resulting from any ideas, methods, instructions or products referred to in the content. |
© 2024 by the authors. Licensee MDPI, Basel, Switzerland. This article is an open access article distributed under the terms and conditions of the Creative Commons Attribution (CC BY) license (http://creativecommons.org/licenses/by/4.0/).
Copyright: This open access article is published under a Creative Commons CC BY 4.0 license, which permit the free download, distribution, and reuse, provided that the author and preprint are cited in any reuse.


