1. Introduction
The construction industry is a cornerstone of the global economy, playing a vital role in economic stability and growth. It also contributes approximately to 13% of the global economy [
1]. Considering the role of the construction industry in developing infrastructure and driving economic resilience, its output was valued at
$9.7 trillion in 2022 and is expected to grow to
$13.9 trillion by 2037 [
2]. This expansion highlights the role as a major force behind economic resilience, reflecting economic trends in both domestic and international economies. Moreover, it is not, just a financial driver, but the foundation of modern societal physical infrastructure [
3]. Over the years, the successful construction project has shifted considerably. Since the 1980s, other factors like stakeholder satisfaction, environmental impact, and social responsibility have become critical in judging a project success [
4]. As construction projects grow larger, they influence economies significantly by creating jobs, attracting investments, and supporting long-term development [
5].
However, the problem of rising construction costs poses a significant challenge to project success globally. Despite advancements in planning and project management, construction projects still frequently struggle to maintain budget control [
6,
7]. These cost overruns are a persistent issue in both developed and developing countries, leading to financial hardship, project delays, and perhaps even project failure [
8,
9]. Managing cost overruns requires an approach that goes beyond traditional cost estimation and budgeting practices. The complexity of construction projects introduces challenges such as fluctuating material prices, unexpected site conditions, and changes in project scope, all of which disrupt financial planning [
10]. Additionally, external factors like economic instability, resource shortages, and regulatory changes, particularly in developing regions, add further unpredictability to cost management [
9]. The involvement of multiple stakeholders with diverse interests further complicates decision-making, often leading to delays and conflicting priorities. These challenges made it crucial for project managers and stakeholders to use advanced tools that can identify risks early and allow for dynamic adjustments [
11].
Different studies highlight the growing prevalence of cost overruns in construction projects. For example, construction projects faced widespread cost overruns, with multiple reports highlighting significant challenges in 2022. SmartPM [
12] found that 98% of construction projects either exceeded their budgets or faced delays, with 9 out of 10 projects experiencing cost overruns, making it a recurring issue within the construction industry. A survey by Procore Technologies found that 75% of projects exceeded their planned budgets, with an average cost increase of 15% due to changes made mid-projects [
13]. With the growing scope and complexity of the construction industry, effective cost management practices are more essential than ever. Success in managing costs requires learning from past project data and incorporating advanced techniques into the planning and execution stages. By addressing these challenges during the early stages of project planning and execution, stakeholders can enhance the likelihood of project success, ensuring that projects are completed on time, within budget, and to the desired quality standards [
14,
15]. Therefore, the construction sector can more effectively address the challenges of cost overruns by learning from past experiences and adopting advanced cost management techniques, hereby contributing more effectively to the economic and social development of nations worldwide [
16,
17].
Cost overruns in the construction industry continue to hinder project success worldwide. Despite decades of research, Flyvbjerg et al. [
18,
19] and Aljohani et al. [
8] found that 85% of construction projects overrun their budgets [
20]. Alsuliman [
21] and Derakhshanalavijeh and Teixeira [
22] found contractor inexperience, material shortages, and poor project planning. However, little is known about how these factors affect project outcomes. This gap in the literature highlights the need for advanced analytical methods like Social Network Analysis (SNA) to study cost overrun factor structural relationships and dynamics [
23]. Recent research by Durdyev [
17] and Kamaruddeen et al. [
24] found regional differences in cost overrun drivers. Developing nations face political and economic instability, while developed nations face stakeholder misalignment and strict regulations [
25,
26]. Despite these regional insights, systematic, global comparative analyses that integrate these perspectives are lacking. Scientometric analyses like Yalcinkaya and Singh [
27] have identified cost overrun research trends and publication patterns but have not addressed cost factor relationships or project dynamics. This study fills these critical gaps by combining scientometric and SNA methods to identify and quantify interconnected cost overrun factors, which advances theory and practice.
Previous research on outdated analyses has challenged the industry’s ability to develop integrated cost-overrun strategies. Gunduz and Maki [
28] and Love et al. [
29] have highlighted design inefficiencies and contractual ambiguities but have not examined their interactions in a networked framework. This gap hampered cost management. This study uses SNA to map the interconnectedness of 66 factors and identify those with the highest degree of centrality, improving cost dynamics understanding and providing actionable insights for construction managers and policymakers to address these challenges holistically. Based on the research gaps, the study offers the research questions:
- 1)
How do interconnected factors such as planning and scheduling issues, project estimation inaccuracies, and design inefficiencies collectively influence cost overruns in construction projects?
- 2)
Which factors are most central in the network of cost overrun drivers, and how do these factors interact to amplify cost escalations?
- 3)
What practical strategies are derived from the identified key factors to improve cost management practices and mitigate overruns in the global construction industry?
2. Literature Review
2.1. Cost Overrun
The term “cost overrun” refers to as “cost escalation” or “budget overrun” [
30], is a key concept in construction literature. It is defined from various perspectives, highlighting its complexity and significant impact on construction projects. Shehu et al. [
31] define it as an increase in project costs that stakeholders did not anticipate. Flyvbjerg et al. [
19] describe it as the ratio between actual and estimated costs, while Flyvbjerg et al. [
18] further clarified that it refers to the amount by which actual costs exceed estimates, using consistent baseline measures. Love et al. [
29] explained it as the difference between actual completion costs and initial estimates or contract sums adjusted for cost escalation. Purba et al. [
32] define it as the gap between the final actual cost and the contract amount agreed upon at signing. Similarly, Derakhshanalavijeh and Teixeira [
22], and Odeck [
33] see it as the positive difference between actual and estimated costs, either in absolute terms or as a percentage. It is essential to understand these nuances as they affect how cost overruns are measured, reported, and ultimately managed within the industry. These differences in perception show that cost overruns are still a significant problem and frequently result in project failure because of their negative financial effects [
34].
2.2. Causes of the Cost Overrun
The causes often differ due to unique market conditions within each nation. Numerous studies have identified several key factors that contribute to budget escalations, including poor contract planning, ineffective supervision, and a lack of coordination among project teams [
35]. Additional factors such as schedule delays, frequent design changes, scope modifications, and ineffective project management practices have also been highlighted as important drivers of cost increases [
28]. Fluctuating material prices, inadequate financial planning, and poor-quality control are further contributors as demonstrated by [
36]. For example, Yousri et al. [
37] identified 35 risk factors, including funding problems, unrealistic cost estimates, and material shortages, all of which complicate cost management and lead to budget overruns. Other researches were conducted to explore factors affecting cost overruns, Abdelalim, A.M., et.al [
59,
60,
61,
62,
63,
64,
65,
66].
The drivers of cost overruns vary significantly across regions, depending on economic conditions and technical capacities. For example, Durdyev [
17] highlighted inaccurate cost estimation and financial constraints as frequent causes in many regions. Similarly, Pham et al. [
38] conducted an in-depth analysis of the causes of cost overruns in construction projects, identifying risks related to resource availability, party incompetence, transportation, and machinery costs as primary drivers. Kamaruddeen et al. [
24] emphasized that the majority of construction projects in Malaysia experience cost overruns between 5% and 10% of the total contract sum, with poor financial planning and project scope changes contributing significantly. In Nepal, Khanal and Ojha [
39] pointed out that time overruns were mainly caused by project delays due to contractor requests for postponement, while capital cost increases due to price escalation were the primary reasons for cost overruns. Shah [
25] found that poor planning and inefficient construction methods were significant contributors in Australia. While in Malaysia and Ghana, contractor inexperience, delayed payments, and underestimation of project costs were the main factors leading to cost escalations. Susanti [
40] also added that land acquisition delays, local objections, design changes, and rework were among the primary reasons for cost escalations. Rework was identified as the most significant factor from the contractors’ perspective.
In the Middle East, the construction sector faces additional challenges related to political, economic, and environmental factors. Daoud et al. [
26] identified poor project planning, lack of skilled labor, scope changes, and payment delays as the major factors contributing to cost overruns in mega construction projects in Egypt. Alsuliman [
21] identified awarding contracts to the lowest bidder and prolonged project delays as critical causes of cost escalations in Saudi Arabia. Bekr [
41] found that factors like security concerns, regulatory changes, and delayed payments were primary contributors to cost overruns in Iraq. In contrast, Al-Hazim et al. [
42] emphasized that difficult terrain and adverse weather conditions were major factors driving up project costs in Jordan.
The literature review outlines the factors driving cost overruns in global construction projects, with considerable variations stemming from market dynamics and project-specific conditions across different regions (see
Table 1). Despite extensive research on cost overrun causes, many studies fail to explore how these factors interconnect and influence cost estimates, resource availability and standalone time. For example, while inaccurate cost estimates and resource availability are frequently mentioned as standalone issues, their combined impact on project outcomes is less often analyzed. To bridge this gap, this study adopts Social Network Analysis (SNA) to examine the relationship between these factors. As highlighted by Abotaleb and El-adaway [
23] and Stojmenovic and Lindgaard [
43], SNA allows for a deeper exploration of how individual drivers interact and which exert the most influence on the other. Previous studies [
23,
43] have shown that SNA is effective in revealing structural dynamics of complex systems, which makes it an ideal too for this research. By applying SNA, this research addresses this gap, offering a network that reveals dominant cost drivers and their interactions. This approach provides the view of cost management challenges, contributing to both academic literature and industry practices.
3. Methodology
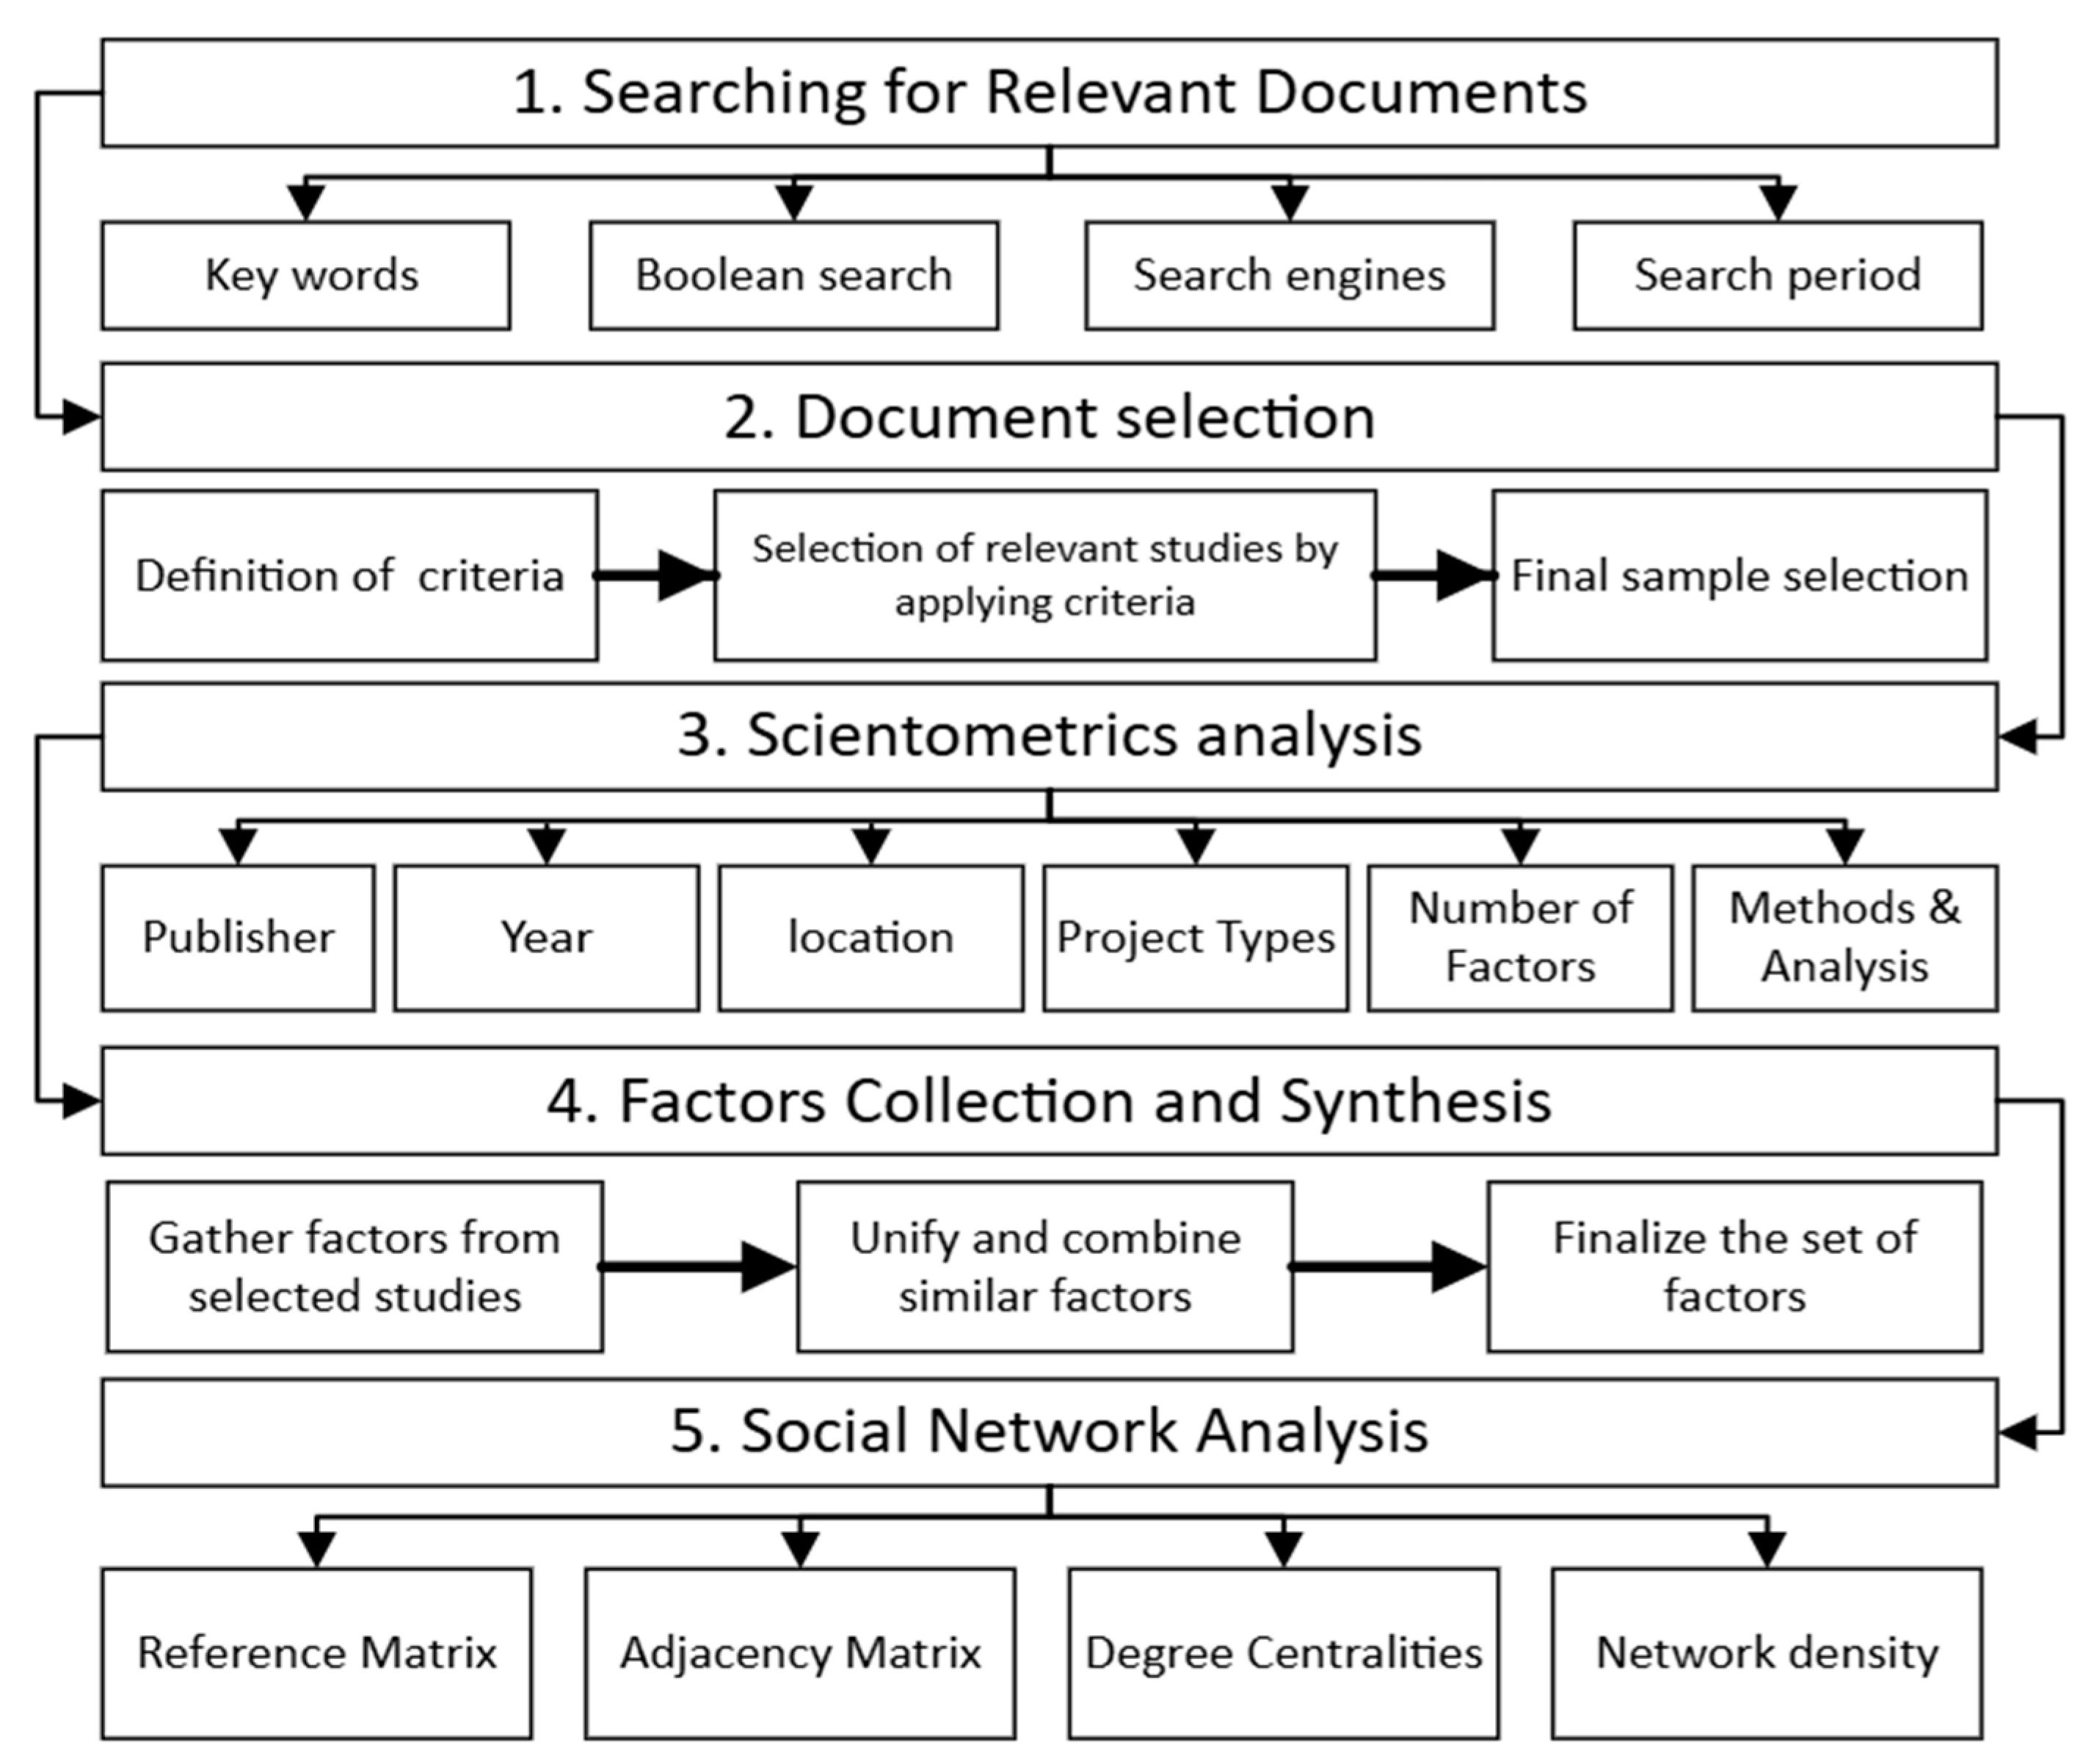
The research methodology of this study is designed to investigate the issue of cost overruns in construction projects. It comprises 5 interconnected stages, each contributing significantly to the overall analysis, as illustrated in
Figure 1. The first stage, “Searching for Relevant Documents,” involves a thorough data collection process, which is marked by an extensive review of the existing literature on cost overruns to identify the various causes of cost overruns. This thorough literature survey forms the foundation for the subsequent stages, ensuring a broad and in-depth understanding of the current knowledge in the field.
The methodology moves into “Document Selection,” stage, where the focus shifted towards filtering out irrelevant content and selecting the most prominent and vital studies. Initially, titles, keywords, and abstracts are meticulously reviewed to facilitate the preliminary selection of pertinent documents. At this stage, clearly defined inclusion and exclusion criteria are rigorously applied to refine the selection process, ensuring that only the documents most relevant to the study’s objectives are retained. This careful approach underscores the research commitment to maintaining academic rigor and relevance.
In this third stage, a scientometric analysis was conducted to build on the selection of papers identified in the previous step. Scientometric analysis is a quantitative approach used to uncover trends, patterns, and gaps in research which allows researchers to examine the distribution of studies across publishers, publication years, regions, project types, and measurement methods. This analysis was crucial in ensuring the structure and coherence of the selected studies by identifying key trends and patterns within the literature. Through this process, each research paper was fully analyzed, providing a clearer understanding of how these studies contribute to the overall research. This step provided deeper insight into the foundational works that form the core of this study, ensuring a strong and reliable academic basis for the subsequent analysis.
After the scientometric analysis, the relevant factors identified from the selected studies are collected and reviewed. Similar factors are gathered and unified into broader factors to ensure consistency in the research that ensured a structured list of factors, allowing for a clearer understanding of the impact of these factors on cost overruns in the construction industry. The result is a thorough list of factors that were analyzed in the next stage. The final stage, SNA involves a detailed examination of the factors contributing to cost overruns. SNA provides valuable insights into the recurrence and influence of factors contributing to cost overruns by identifying key nodes or factors within the network. The application of Degree Centrality (DC) that measures the nodes based on its connections, is particularly effective for quantifying and comparing the significance of these factors.
Through the five-stage methodology, the study aimed to provide a multi-layered analysis of the factors contributing to cost overruns in construction projects, adhering to the highest standards of academic inquiry and offering novel insights to the field.
4. Searching for Relevant Documents
The research process began with a systematic search to gather essential data on the causes of cost overruns in construction projects. This search was conducted using the Egyptian Knowledge Bank (EKB) as a search engine that provided access to extensive academic databases like Scopus and Web of Science. These two databases were chosen due to their broad coverage of indexed content and high academic credibility, making them ideal starting points for the literature review [
44] making them suitable starting points for our literature review. The search strategy involved a structured use of Boolean Operators (“AND” and “OR”) along with a carefully selected set of keywords. These keywords were developed during the early stages of the literature review and designed to cover both specific and broad terms related to the topic of cost overruns.
Primary keywords related to cost issues, including “cost overrun”, “cost escalation,” and “budget exceedance” were entered into the ‘title’ sections of both Web of Science and Scopus. The search was not limited to cost-related terms alone but also included broader keywords related to the construction industry, which were entered into the ‘topic’ section, including “construction project,” “construction management,” “construction industry,” and “construction sector”. To further refine the search and focus on identifying relevant factors driving cost overruns, additional keywords were included in the ‘topic’ section to target specific “factors,” “drivers,” and “causes” related to cost issues. The search was limited to publications between 2000 and 2024 and was restricted to English-language documents to maintain consistency in the analysis. In this step, no restrictions were placed on the type of document, allowing for the inclusion of journal articles, conference papers, and books to ensure the coverage remained extensive. The results of this query are presented in
Table 2 that outlines the number of papers identified at each stage of the search process.
Through this search strategy, a total of 405 publications relevant to “cost overrun”, “cost escalation,” and “budget exceedance” in construction projects were identified. These studies were drawn from an array of over 50 journals, including top-ranked and reputable journals such as the Journal of Construction Engineering and Management (JCEM), Engineering, Construction and Architectural Management (ECAM), International Journal of Project Management (IJPM), and Journal of Management in Engineering (JME). The selection of these high-quality sources provided the foundation for the subsequent stages of the research stated in the above-mentioned methodology, to align with the study’s objective [
44,
45].
5. Document Selection
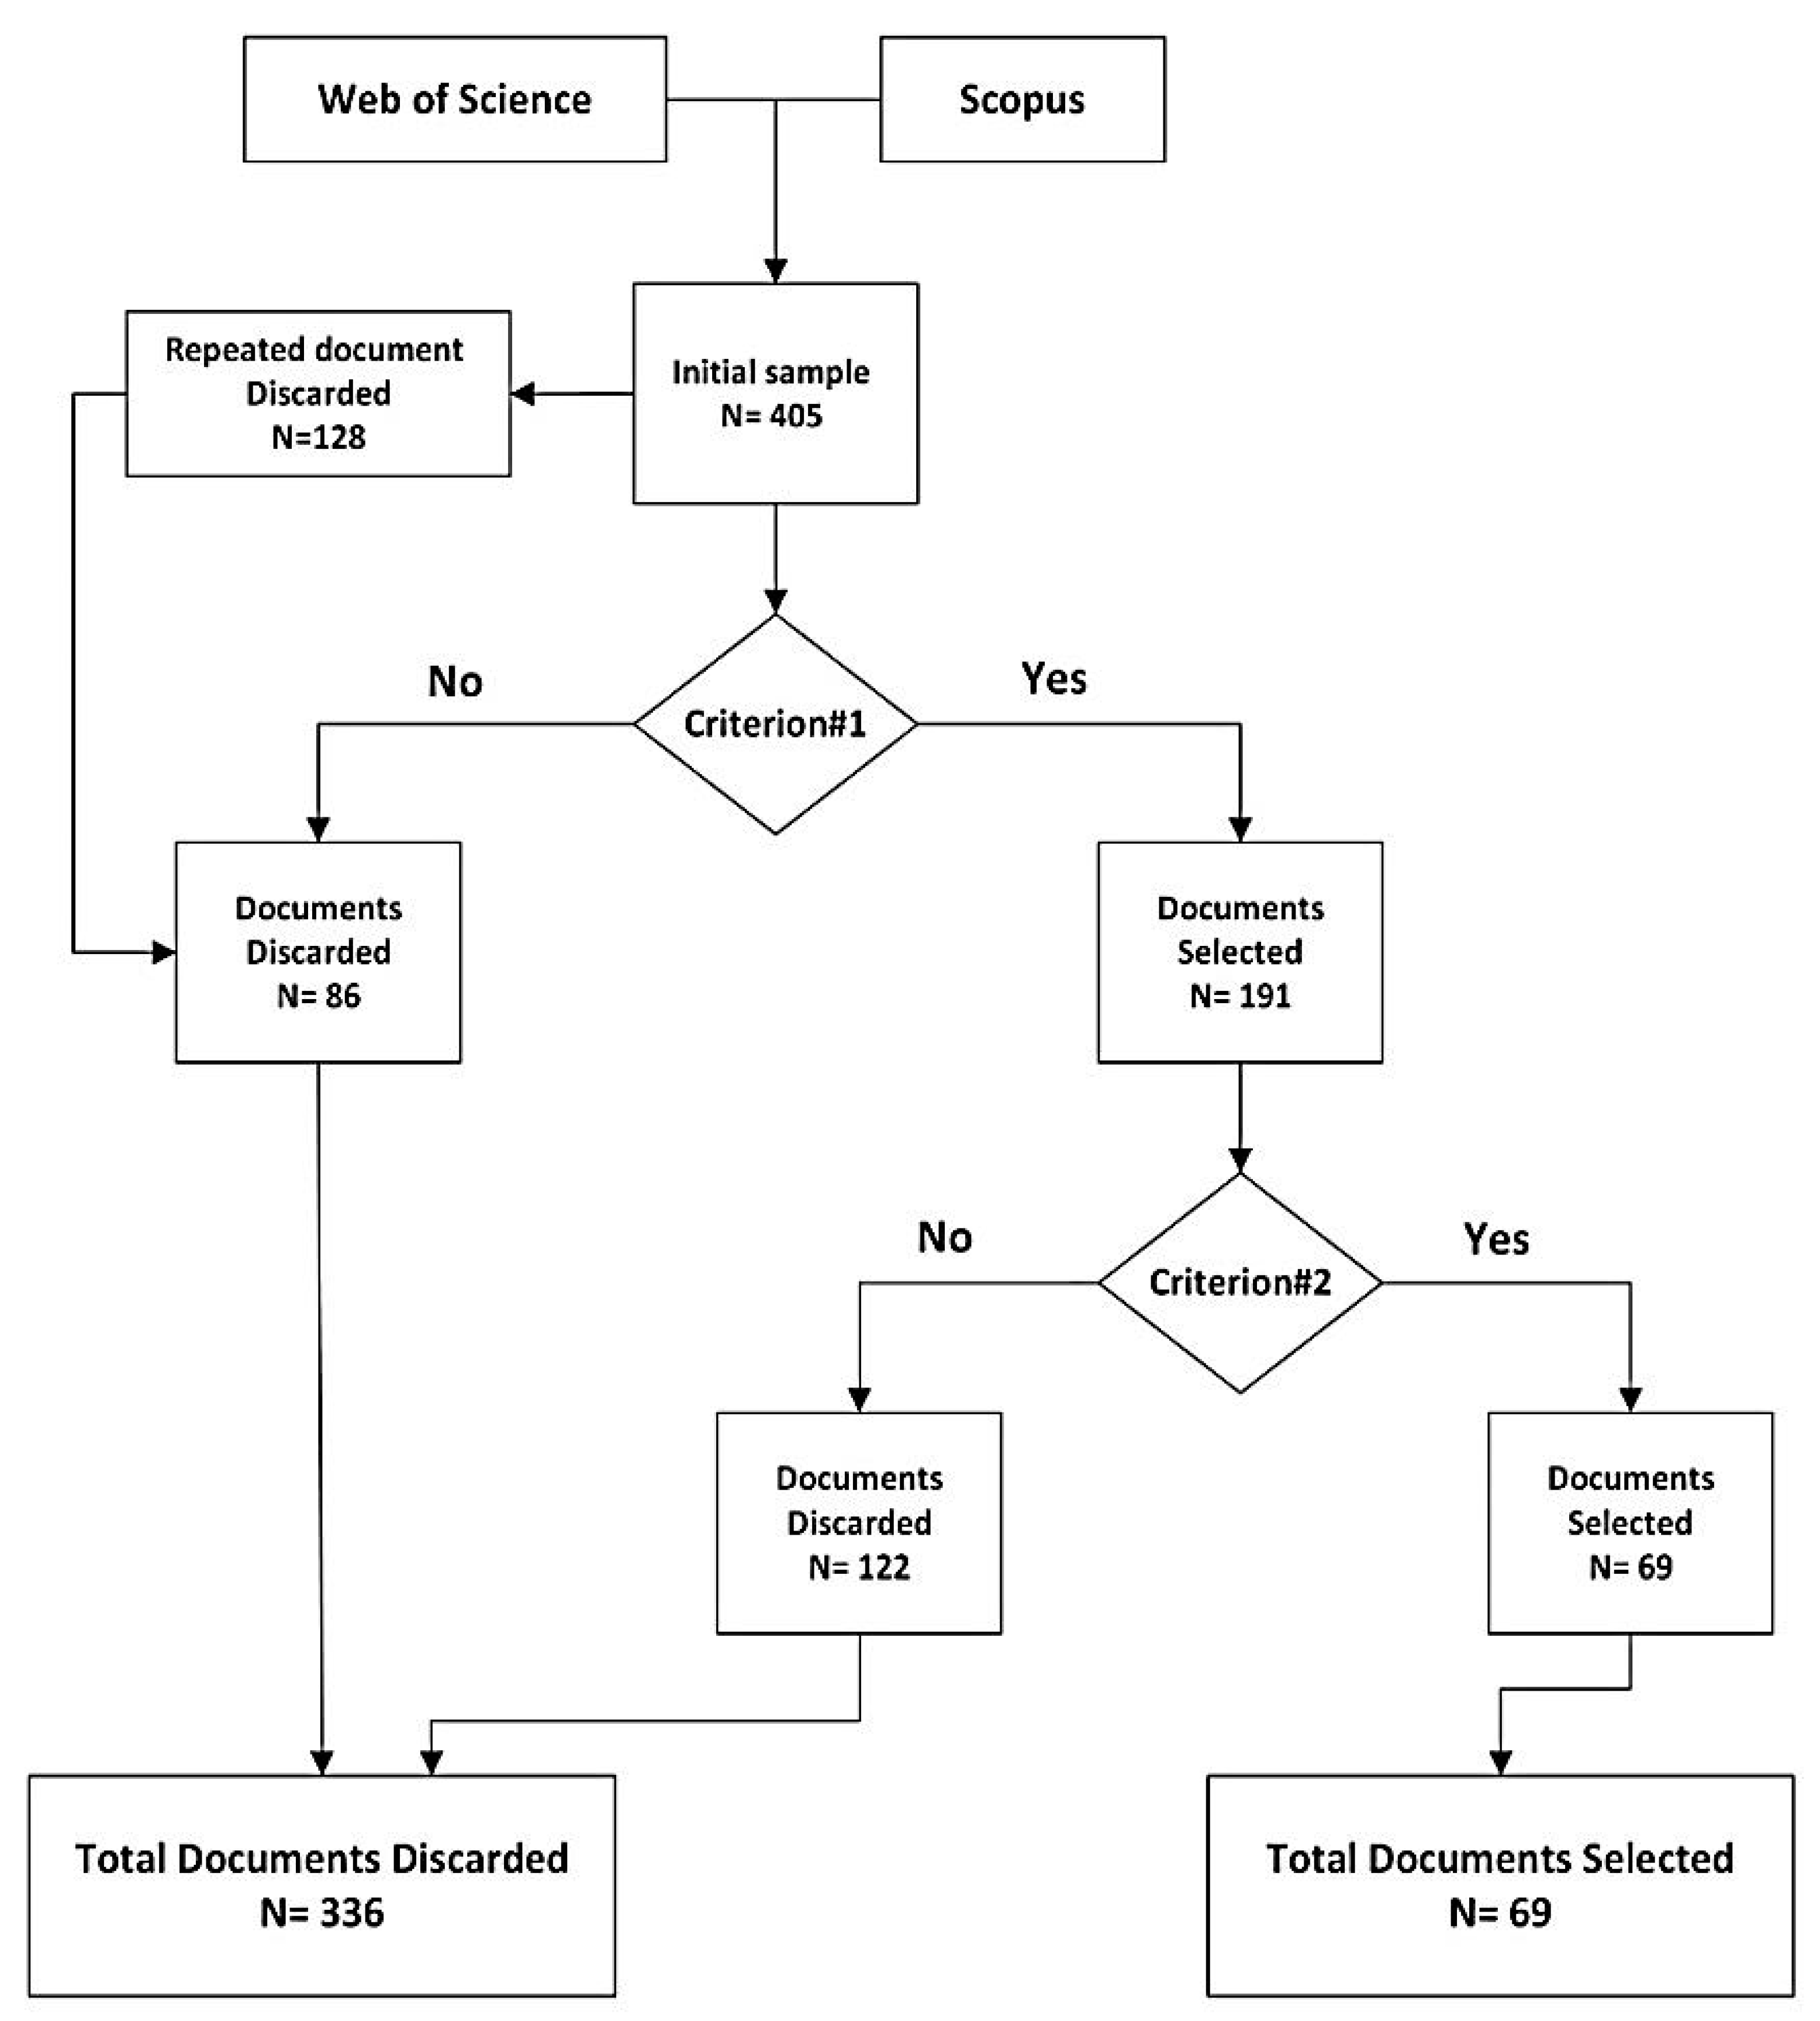
At this stage, the focus was on eliminating irrelevant content and retaining only the most pertinent and vital scholarly contributions from an initial pool of 405 documents. This selection process was guided by two key inclusion/exclusion criteria, both aligned with the research objectives, First, only peer-reviewed articles were selected to ensure the reliability and validity of the factors being discussed. Peer-reviewed articles were subject to a rigorous evaluation process, distinguishing them from conference papers or books, and providing a credible and thoroughly examined foundation for the study. Secondly, the study specifically focused on papers that employed a methodology to rank the factors affecting cost overruns, which was chosen to ensure that the selected studies not only identified the relevant factors but also assessed their relative importance, offering a prioritized and comprehensive understanding of the causes of cost overruns, as illustrated in
Figure 2.
The selection process began with a careful manual review to eliminate any duplicate entries, resulting in the removal of 128 duplicates. Next, the first criterion was applied, which led to the inclusion of 191 articles and the exclusion of 86 non-relevant documents. The application of the second criterion further refined the selection, reducing the pool to 69 documents that provided significant academic value, while excluding the remaining 122. This screening process was systematic, with each document being marked as “Yes” or “No” based on its alignment with the defined criteria. Only those documents that met both criteria and received “Yes” were considered suitable for inclusion, ensuring that the final selection closely aligned with the research objectives.
The final selection in this analysis spans the period from 2008 to 2024. Out of these, 47 were indexed in both Web of Science (WoS) and Scopus, while 14 were exclusive to WoS and 8 to Scopus.
6. Scientometric Analysis
Scientometric analysis, as outlined by Yalcinkaya and Singh [
27], offers a quantitative approach to examining the evolution of scientific research. It allows for the systematic evaluation of research impact and the identification of trends within scientific outputs. Originally introduced in 1969 as a method to analyze science as an information process [
46], this technique has developed into a cornerstone of the broader field of scientometrics that focuses on the quantitative analysis of scientific literature and technological progress [
47]. By examining elements such as publication trends, research methodologies, and other quantitative metrics, scientometric analysis provided a perspective on the growth and evolution of scientific fields, offering valuable insights into how knowledge is produced and disseminated [
48,
49]. In this study, a scientometric analysis was conducted using Excel, focusing on six key aspects of the selected literature relevant to construction management and cost overruns. These aspects include the publisher, publication year, geographical location, project types, number of factors identified in each study, and measurement methods & analysis tool, enabling a structured exploration of trends and patterns in the literature, without relying on citation analysis or complex visualization tools often associated with scientometric methods.
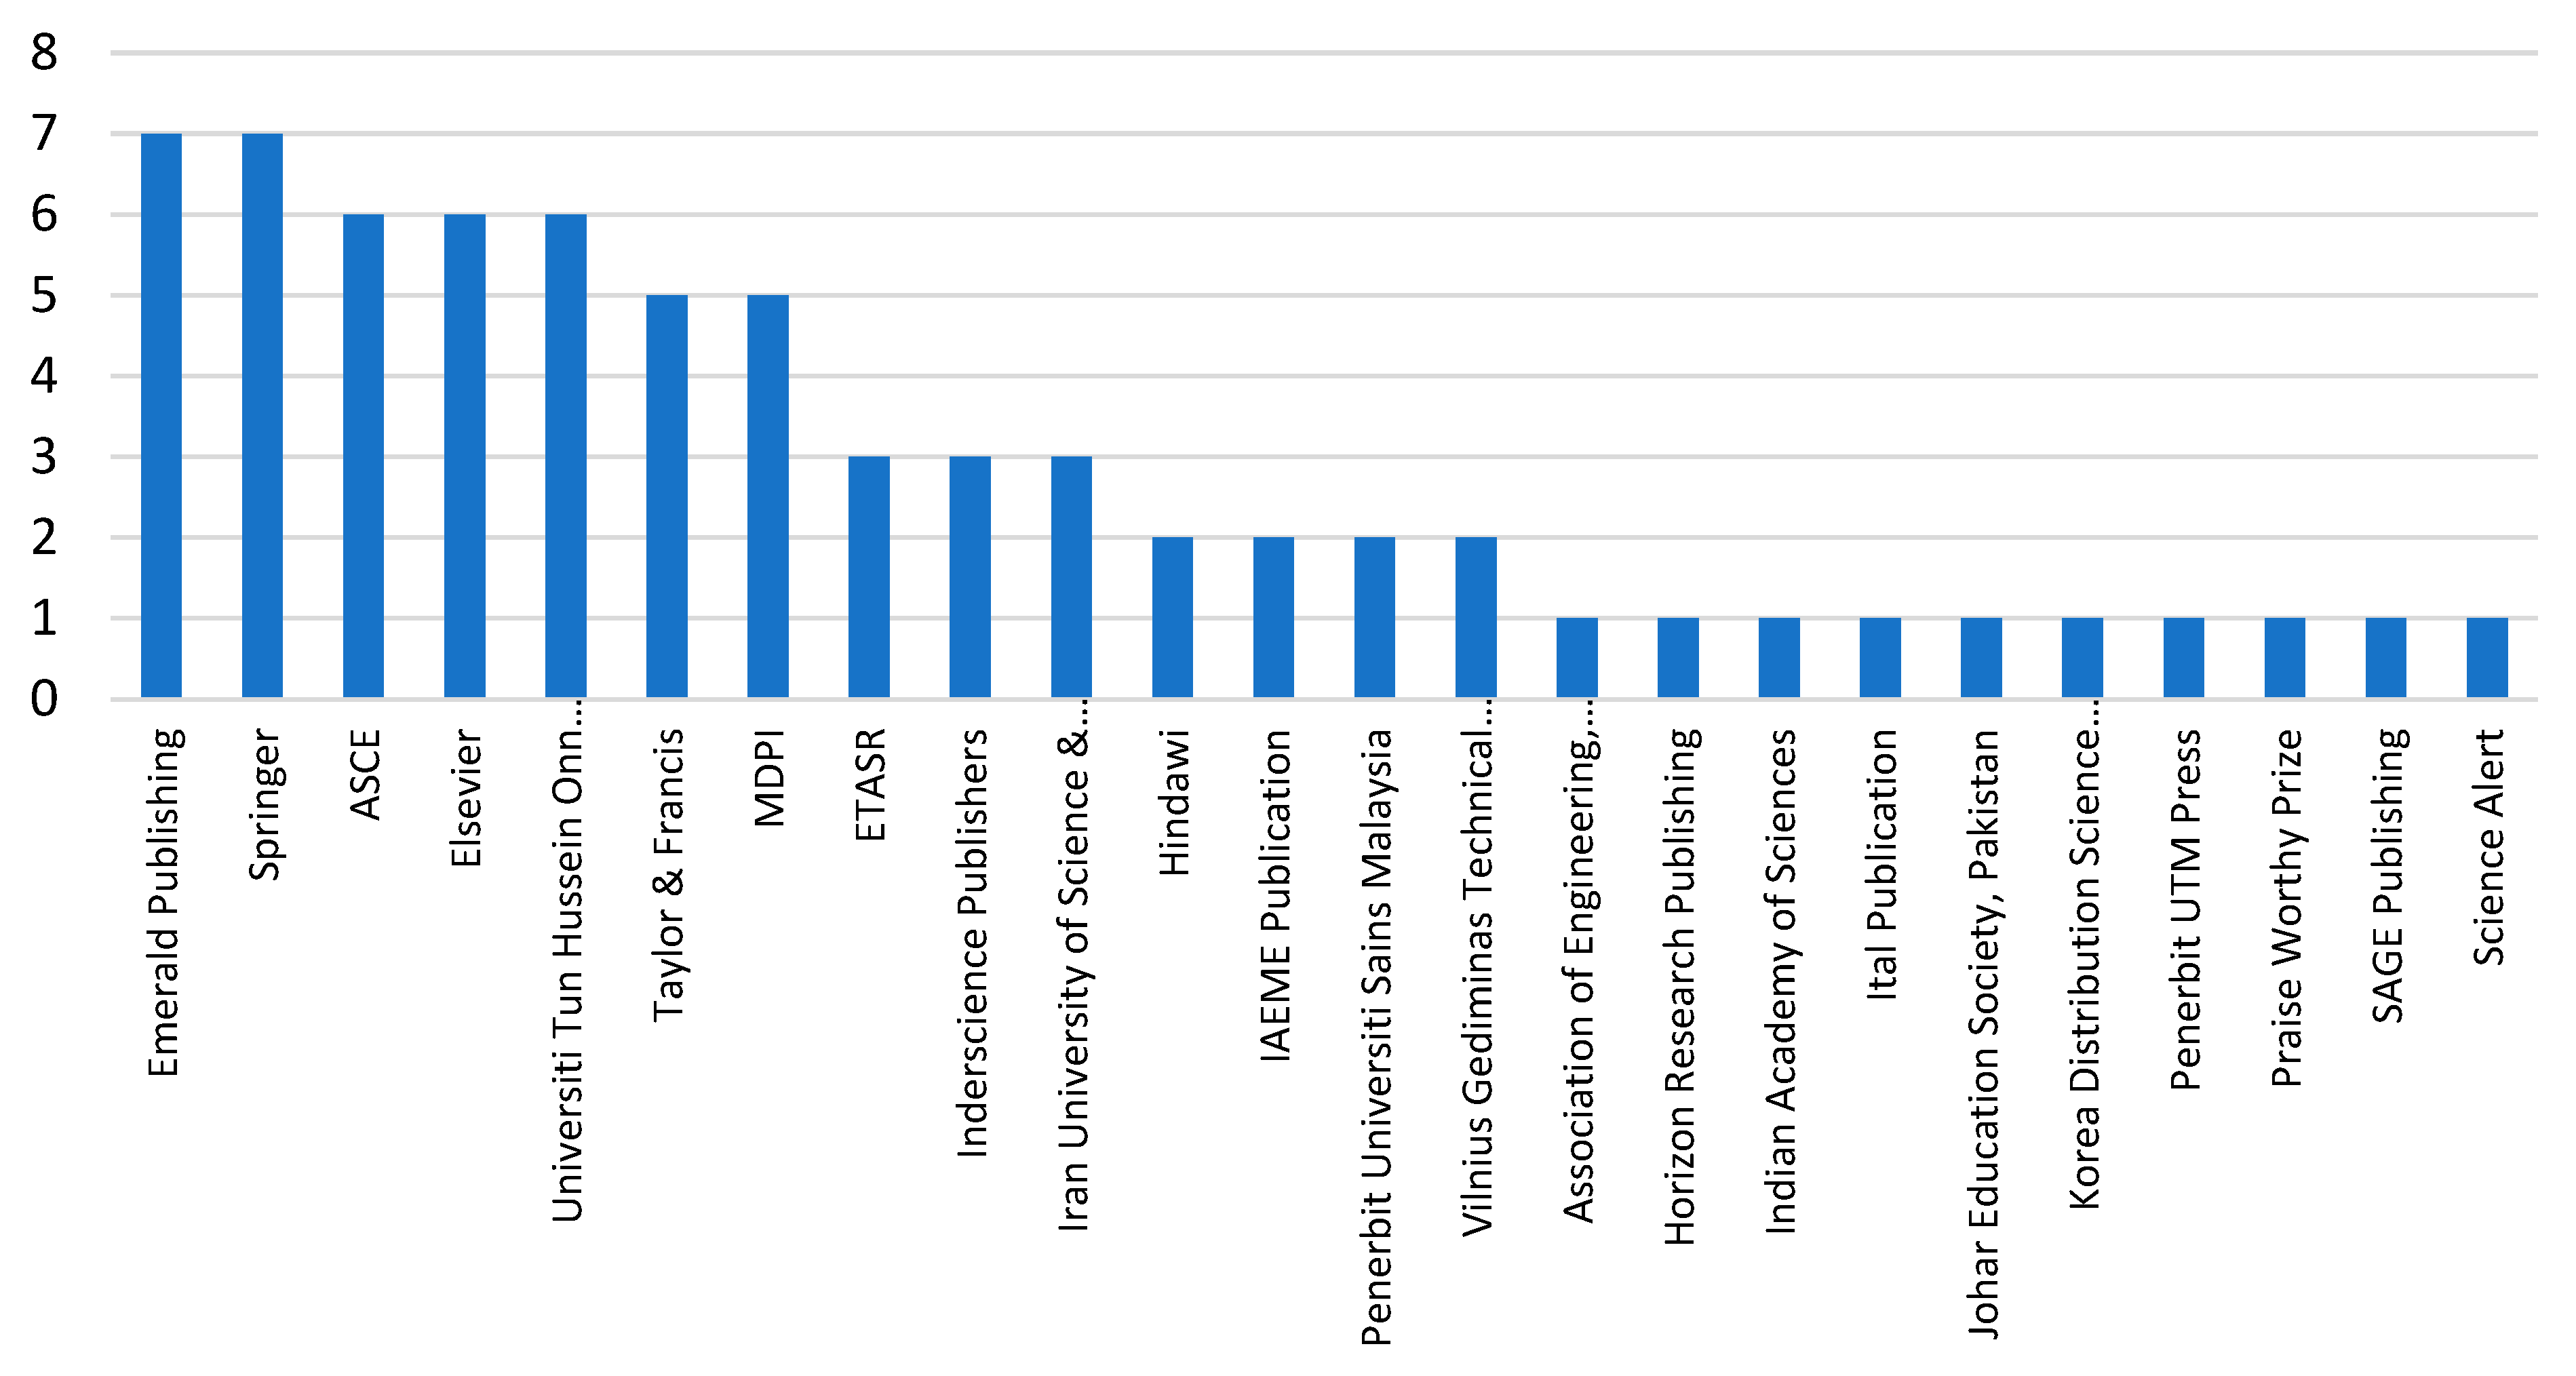
6.1. Distribution Across Academic Publisher
The initial phase of the scientometric analysis involved examining the distribution of studies across various academic publishers, providing a well-rounded view of the research on construction cost overruns. Notably, 7 studies were published by Emerald Publishing and Springer, while 6 studies were published by the American Society of Civil Engineers (ASCE), Elsevier, and Universiti Tun Hussein Onn Malaysia, showing the global interest in this topic. Taylor & Francis and MDPI have each published 5 studies. Furthermore, the remaining 27 studies were distributed across other publishers, as shown in
Figure 2. This diverse distribution across leading academic publishers reinforces the credibility and wide-reaching academic engagement with this research area.
Figure 3.
Publishers of Reviewed Studies.
Figure 3.
Publishers of Reviewed Studies.
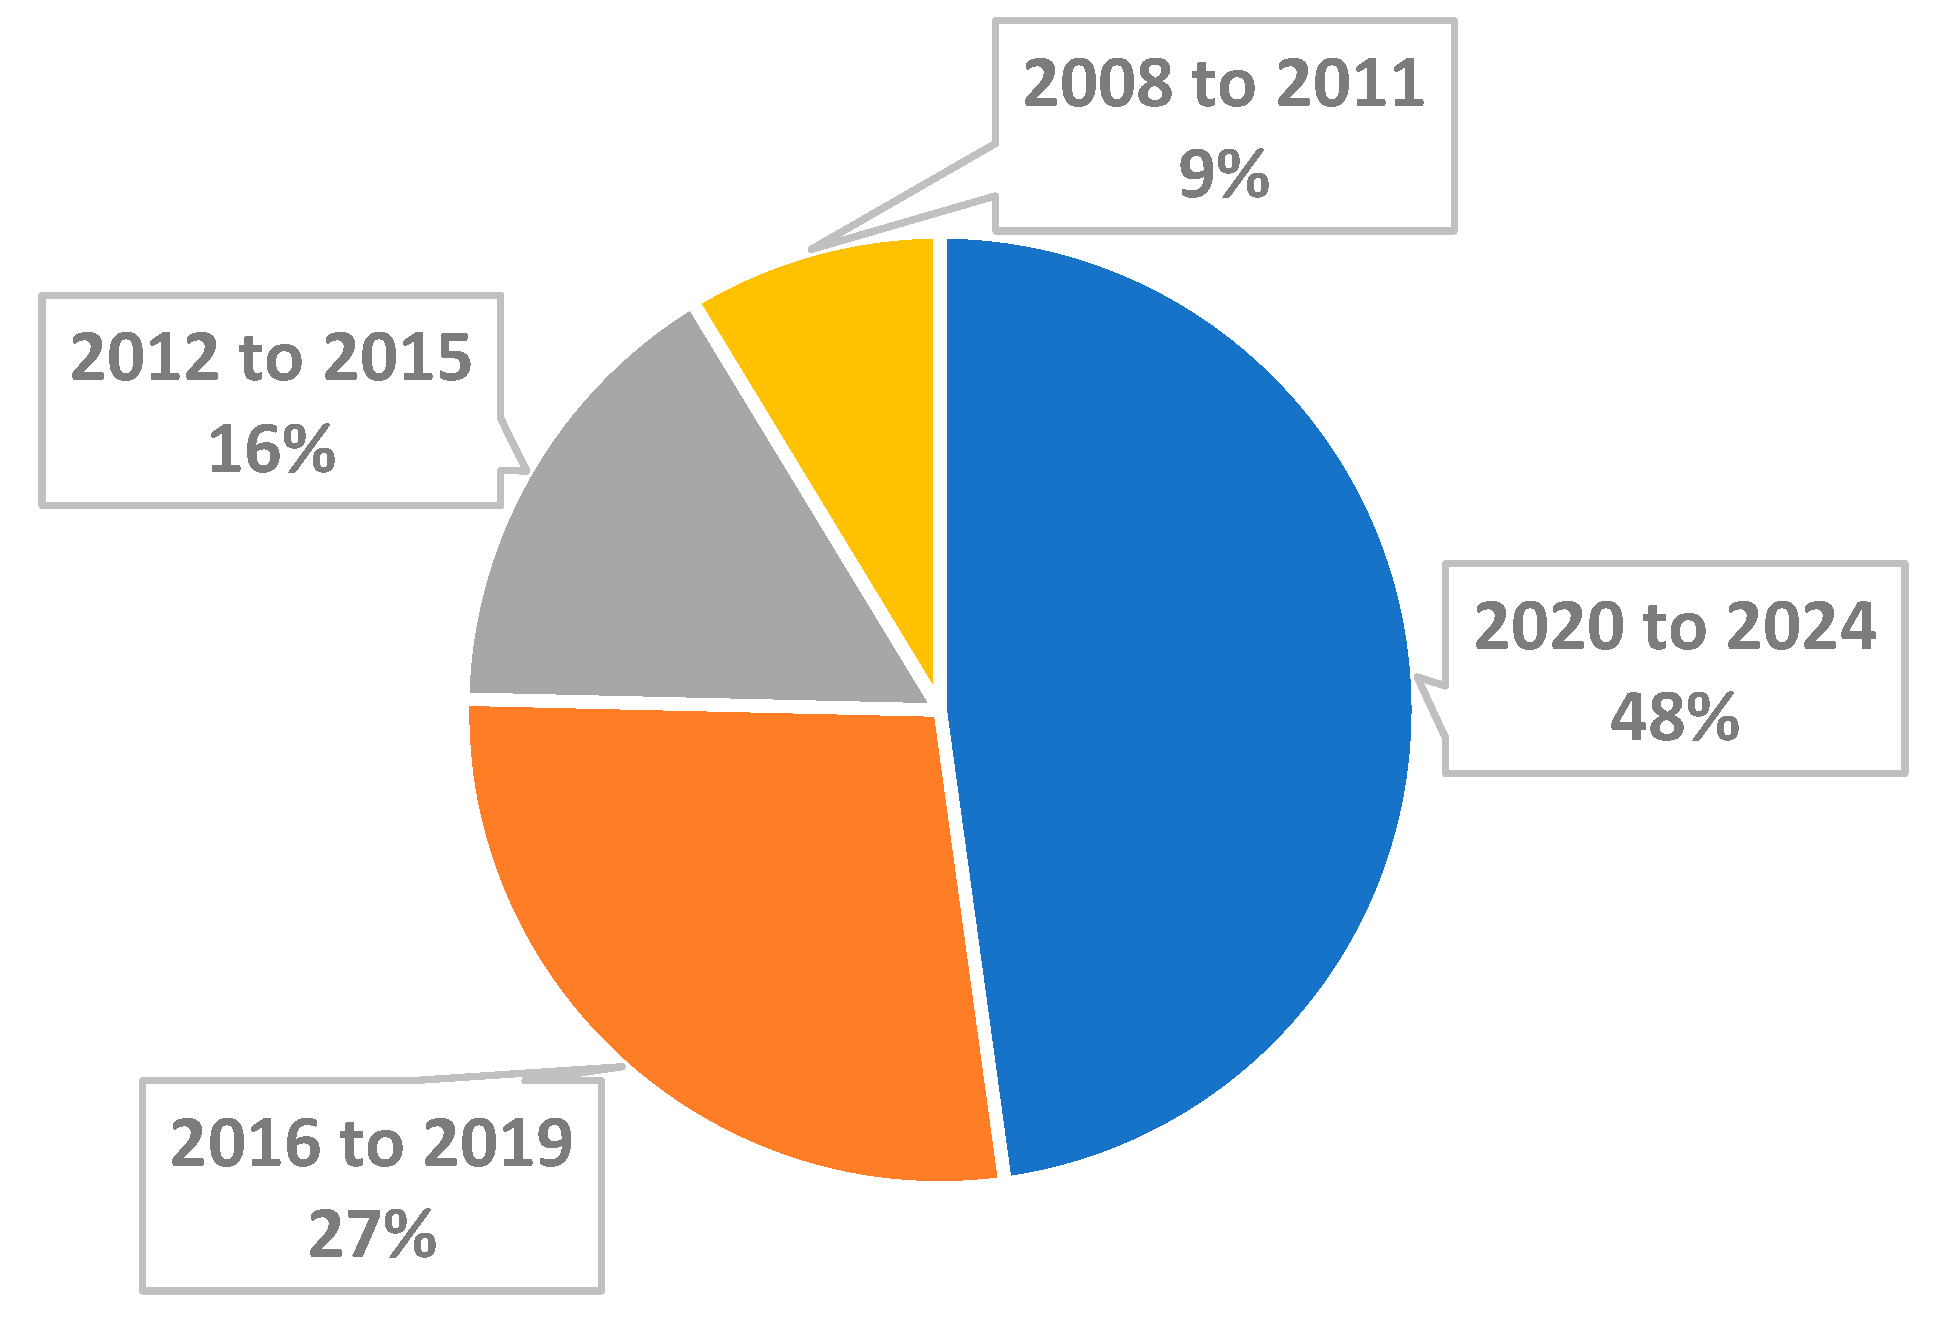
6.2. Publication Year
The dataset indicates a clear upward trend in research activity related to construction cost overruns in recent years. A significant 33 out of 69 studies (47.8%) were published between 2020 and 2024, reflecting an intensified academic focus on this issue. Additionally, 19 studies (27.5%) were published between 2016 and 2019, 11 studies (15.9%) between 2012 and 2015, and 6 studies (8.7%) between 2008 and 2011. The growing recognition of the importance of studying cost overruns in construction is highlighted below in
Figure 4.
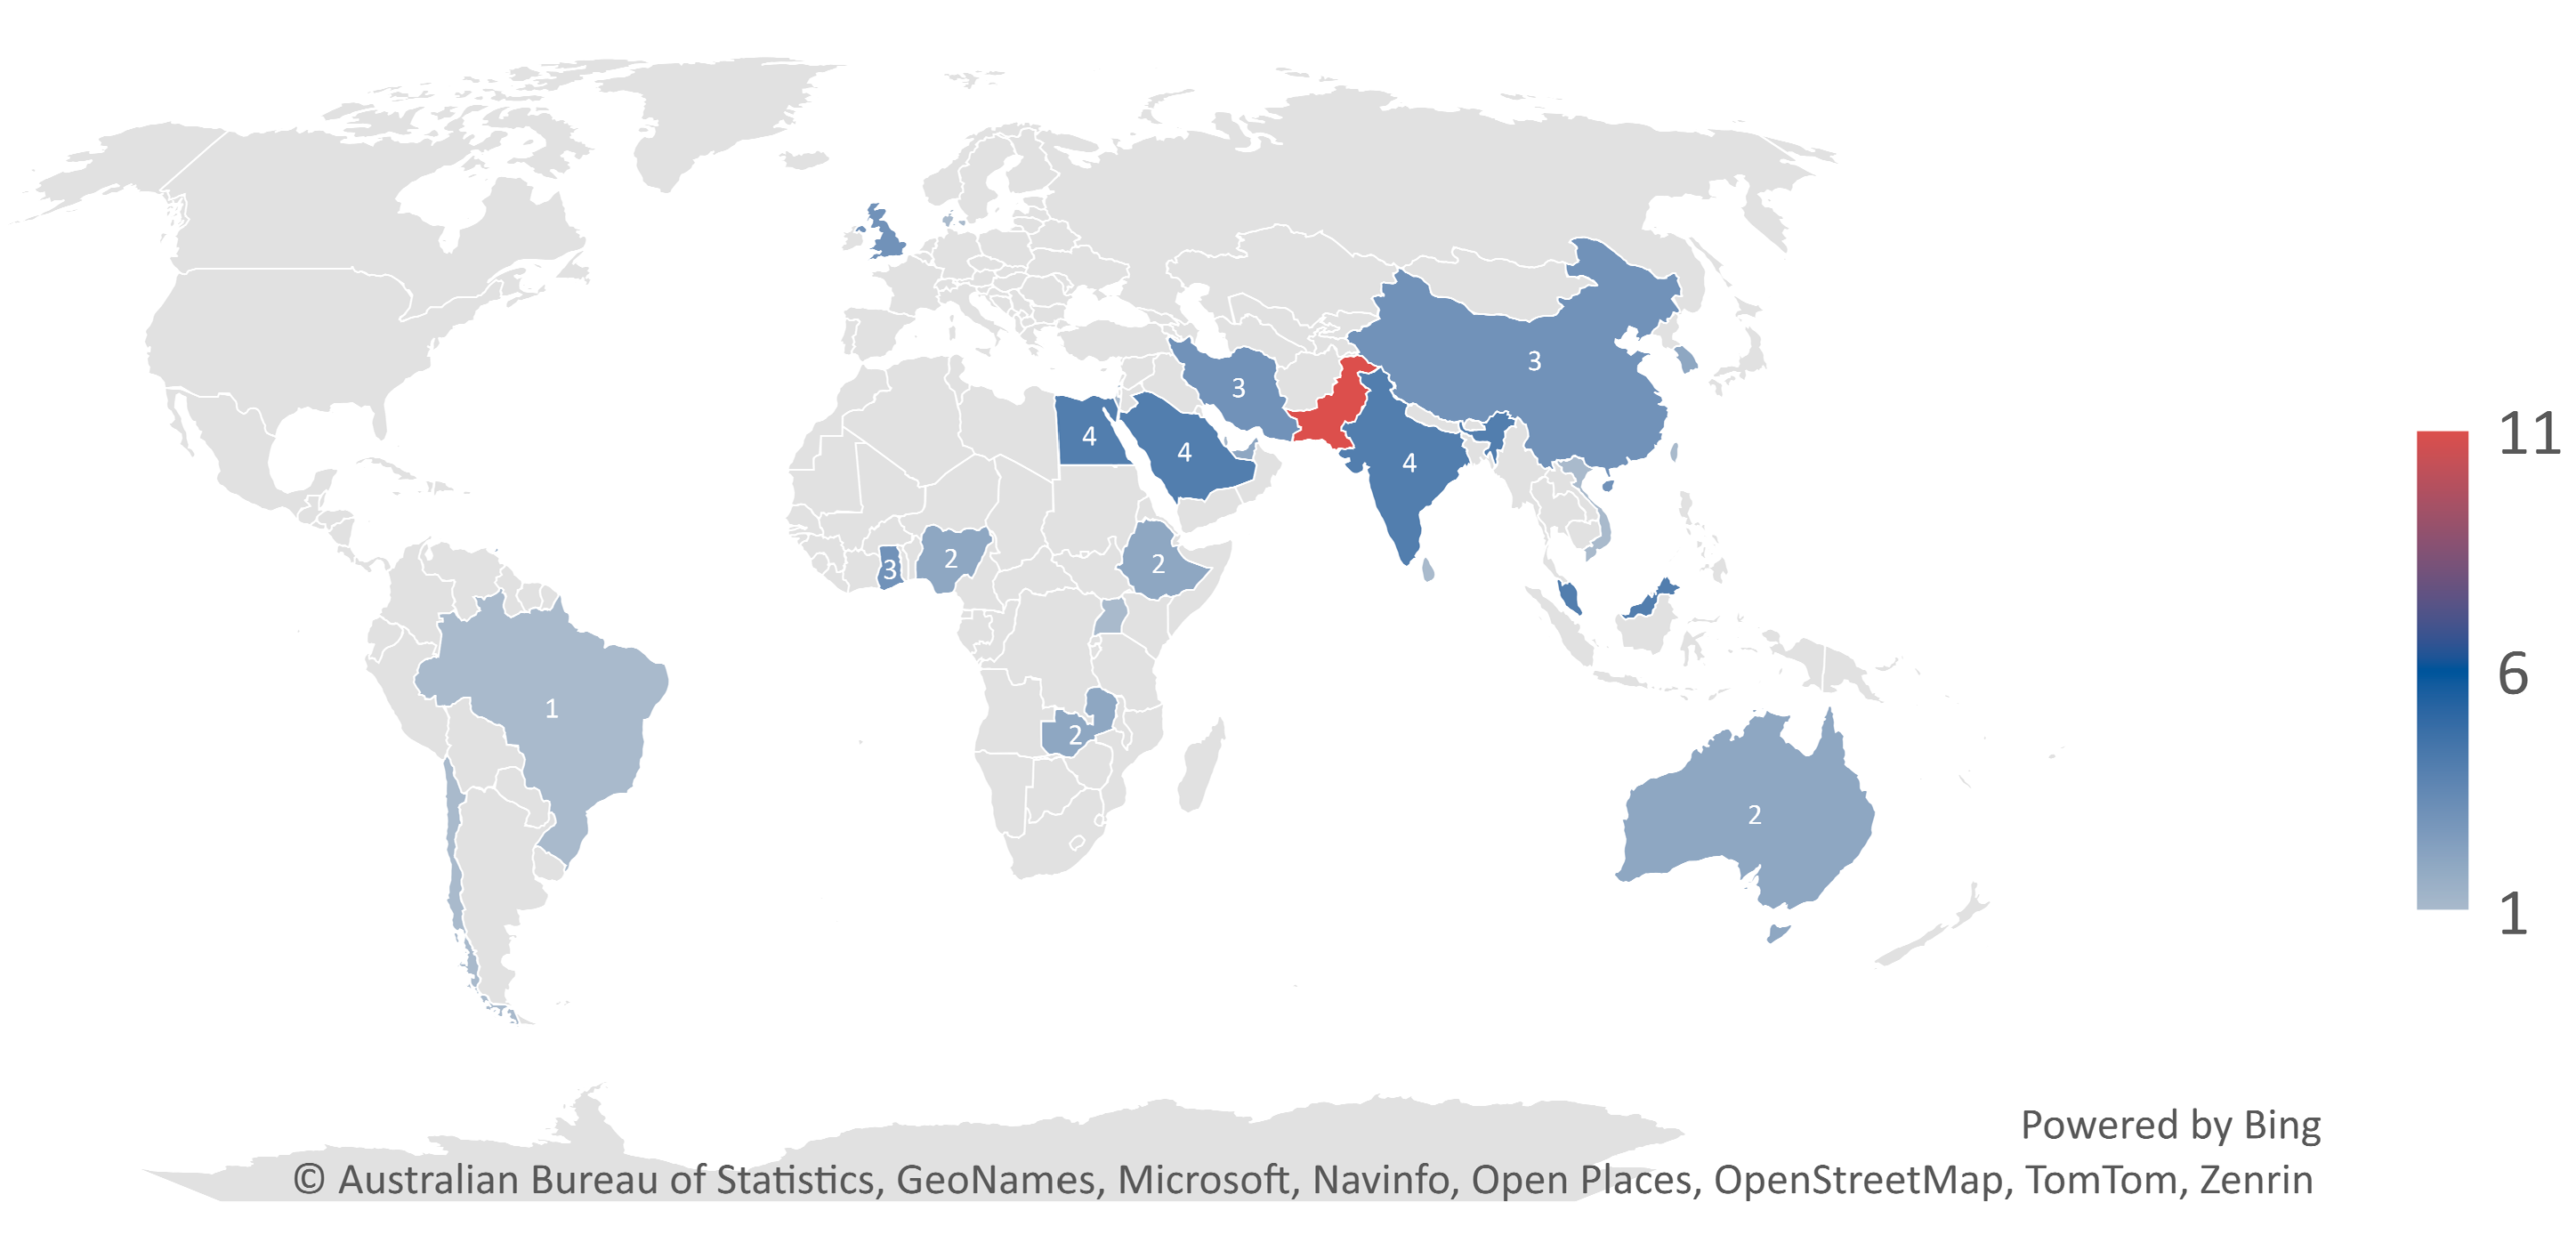
6.3. Geographical Location
Regarding the geographical distribution of the studies included in this analysis, it has been observed that they cover a wide range of continents as shown in
Figure 5, reflecting the global nature of cost overrun phenomena in the construction sector. The Asian continent led the list of regions with a total of 45 studies, with Pakistan contributing to 11 research papers, making it the most represented country in this category. Asia is followed by Africa with 14 studies, then Europe with 4 studies. North America, South America, and Australia each contributed 2 studies.
6.4. Project Types
The studies analyzed in this research cover a different range of construction project types, offering a comprehensive understanding of the cost overrun challenges in different sectors. Eighteen (18) studies focused on infrastructure projects, such as roads, bridges, highways, and railways, where the complexity and scale of work often lead to significant cost increases. Eleven (11) studies examined commercial construction, including office buildings, shopping centers, and hotels, which face unique pressures such as fluctuating market demand and tight delivery schedules. Institutional projects, such as schools, hospitals, and other public facilities, were the subject of five studies, highlighting the impact of regulatory compliance and high-quality requirements on budgets. Thirty (30) studies took a broader approach by investigating cost overruns across various types of construction projects, providing insights applicable to the industry as a whole. Additionally, 5 studies explored multiple project types within the same research, offering a cross-sectoral perspective on how cost overruns occur and the factors influencing them, categorizing the studies based on project types put into perspective the importance of adopting tailored cost management strategies based on each project needs.
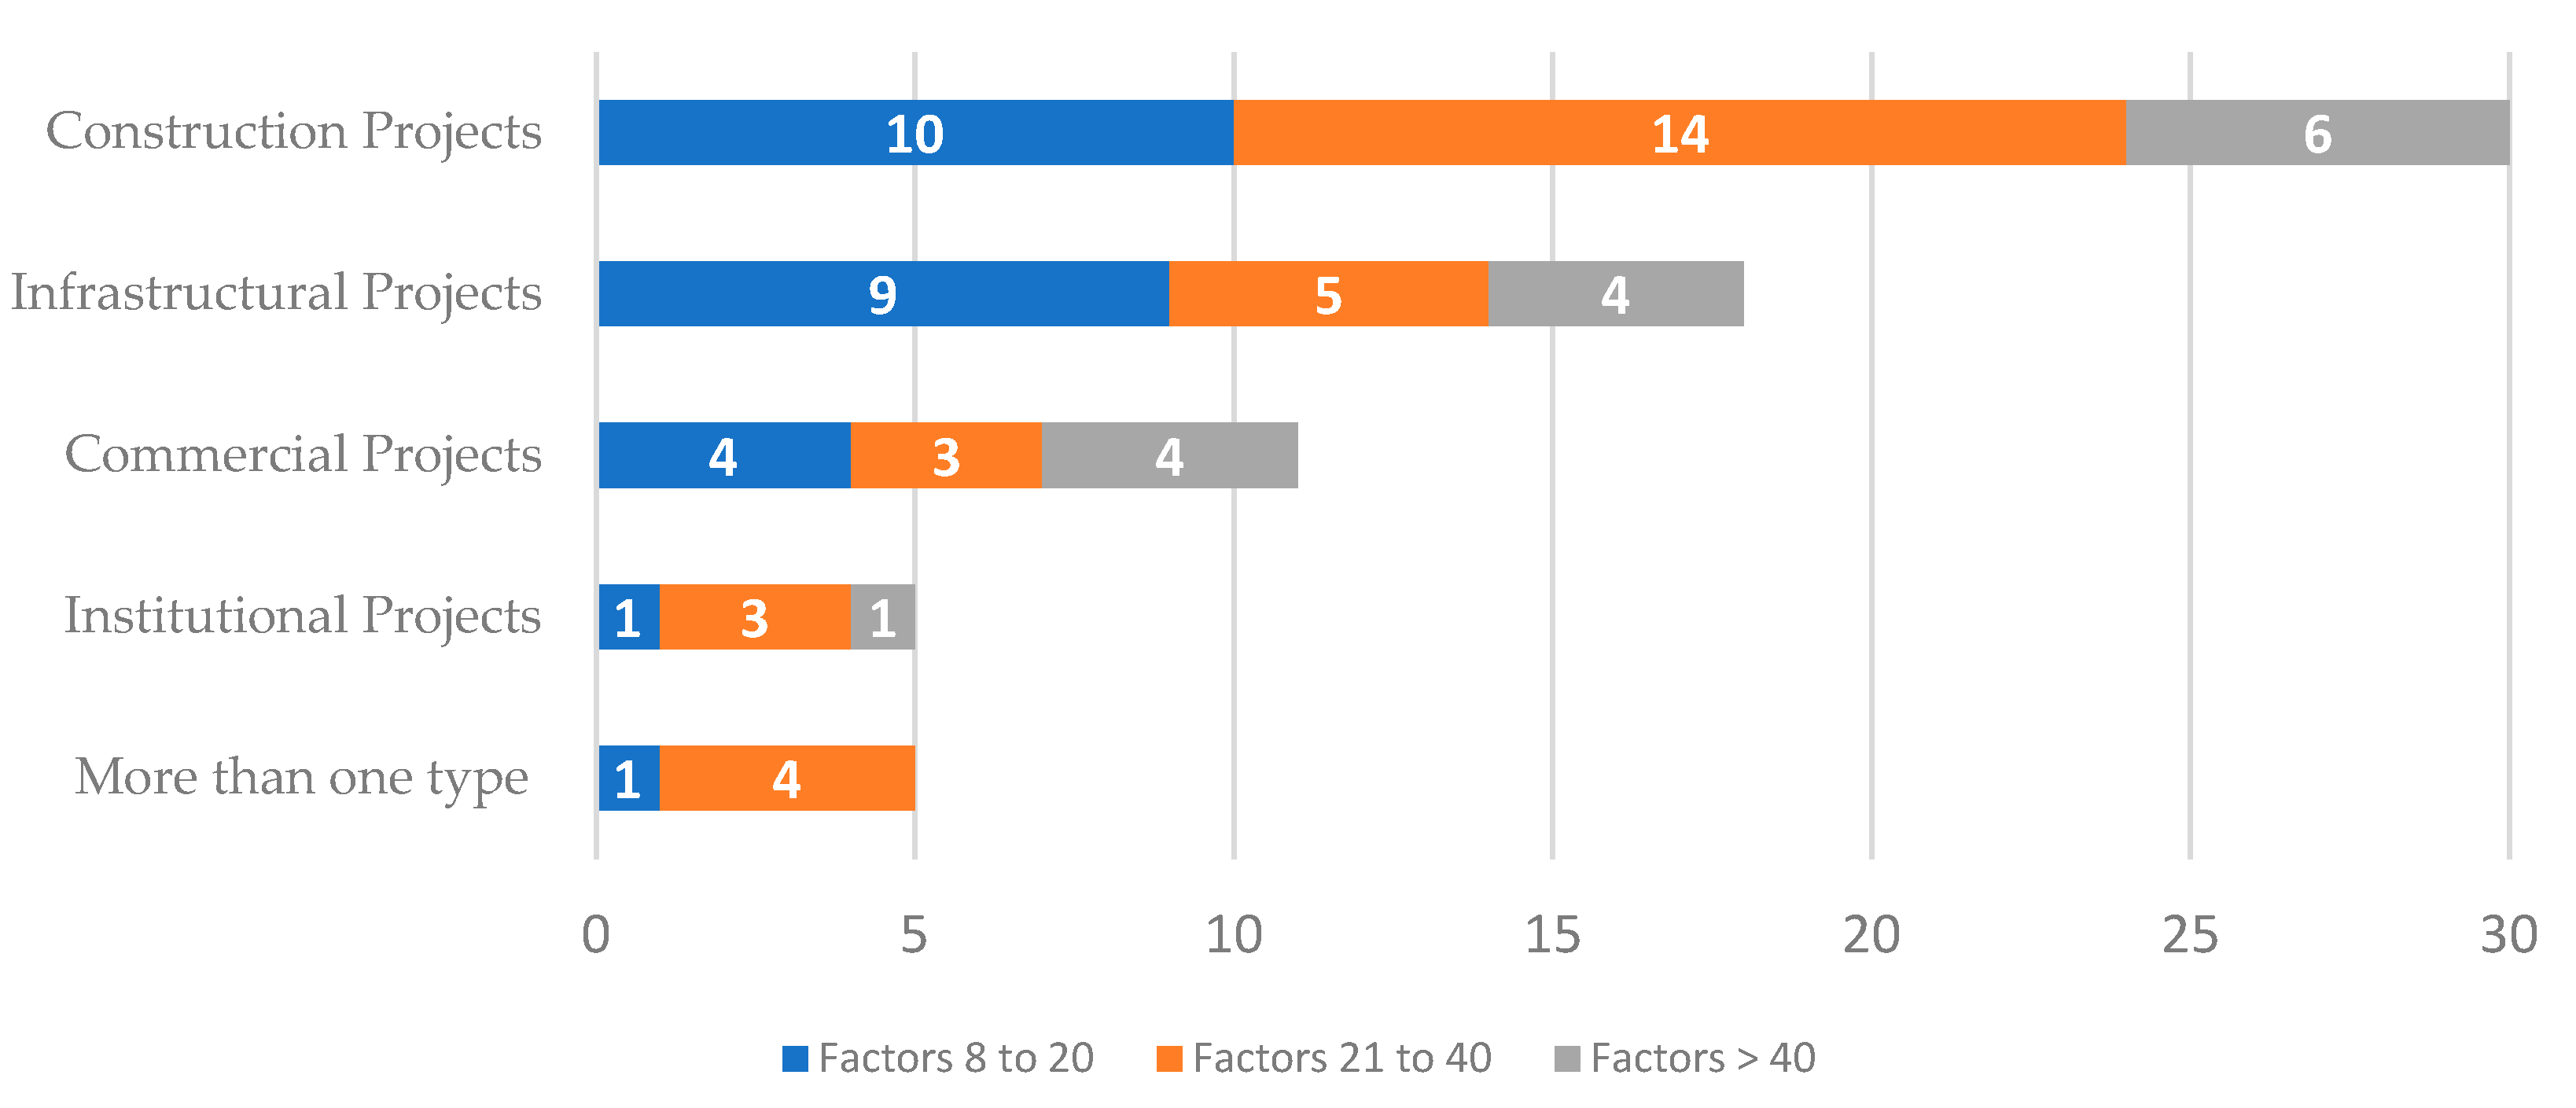
6.5. Number of Factor
The number of ranked cost overrun factors analyzed shows a diverse range of study scopes. Exactly 25 studies examined 8 to 20 factors, targeting key contributors to cost overruns. An additional 29 studies analyzed 21 to 40 factors, offering a broader analysis. The remaining studies investigated over 40 factors, reflected a comprehensive examination of cost overrun causes in construction projects. The variation in the number of factors examined across different project types is clearly illustrated in
Figure 6, highlighting the distribution of ranked factors across construction, infrastructural, commercial, and institutional projects.
6.6. Measurement Methods & Analysis Tool
Analyzing the studies reveals that most researchers relied on open- ended or closed questionnaires to collect responses for analysis and factor ranking. However, some studies employed interviews or utilized actual projects data for factor ranking. A range of analytical tools was employed, including the Relative Importance Index (RII) in 19 studies, mean-based methods in 12 studies, and various other techniques in the remaining studies. This diversity in data sources and analytical methods highlights the efforts made to understand the factors affecting cost overrun across different construction projects.
7. Factor Collection and Synthesis
This phase was a critical part of this research process, it involved a thorough examination of the selected articles to extract key information relevant to the research objectives. The first step in this stage was a detailed review of 69 chosen documents. During this review, the author used Adobe Reader to highlight and annotate the critical factors contributing to cost overruns. A key part of this process was identifying and standardizing the names of all factors found in the final set of documents. This standardization was necessary because the same factors were often referred to by different names across various studies, even though they represented the same concept. For example, the factor ‘frequent design changes’ appeared as ‘design changes’ and ‘change design’ in different documents. To ensure consistency, these were uniformly renamed as ‘frequent changes in design’.
In addition to standardizing the names of factors, the research also consolidated factors with closely related meanings into broader, new unified factors. For instance, various contract-related challenges, including “discrepancies in contract,” “ambiguous contract,” “unclear contract terms,” and “poor contract management,” were grouped under the overarching factor “Contractual Issues.” This approach was not unique to contractual matters but applied across all the factors identified in the study. By merging related concepts into more comprehensive factors, the analysis provided a more cohesive understanding of the numerous factors influencing cost overruns. This method ensured that even diverse factors were captured in a structured manner, allowing for a clearer and more organized presentation of the key drivers behind cost escalations in construction projects. The final list of standardized factors resulting from this process is presented in
Table 3.
8. Social Network Analysis
Social Network Analysis (SNA) is a method grounded in network theory that provides a detailed view of relationships within complex systems. It visualizes these relationships as a network of nodes (individual elements) and edges (connections between them). In this study, SNA was applied to examine the interactions among cost overrun factors identified from selected literature, offering a quantitative perspective on their interconnections. By applying the same in this paper, a valuable dimension is added to the analysis of cost overrun factors, particularly through the concept of centrality [
50]. Its superiority over traditional data analytics methods lies in its comprehensive evaluation of factors and their interrelationships within the network, evidenced by Darko et al. [
51] and Hosseini et al. [
52]. Furthermore, the integration of SNA with co-occurrence analysis, suggested by Choudhury and Uddin [
53] and Waltman et al. [
54], enhances the understanding of associations between various scientific factors, thereby enriching the research with both intuitive and cognitive reflections of the content. The calculated degree centralities, as seen in the studies of Yuan et al. [
55] and Darko et al. [
51], exemplify the capability of SNA in ranking and visualizing the importance of identified factors, offering a higher understanding of their impact in the realm of construction management.
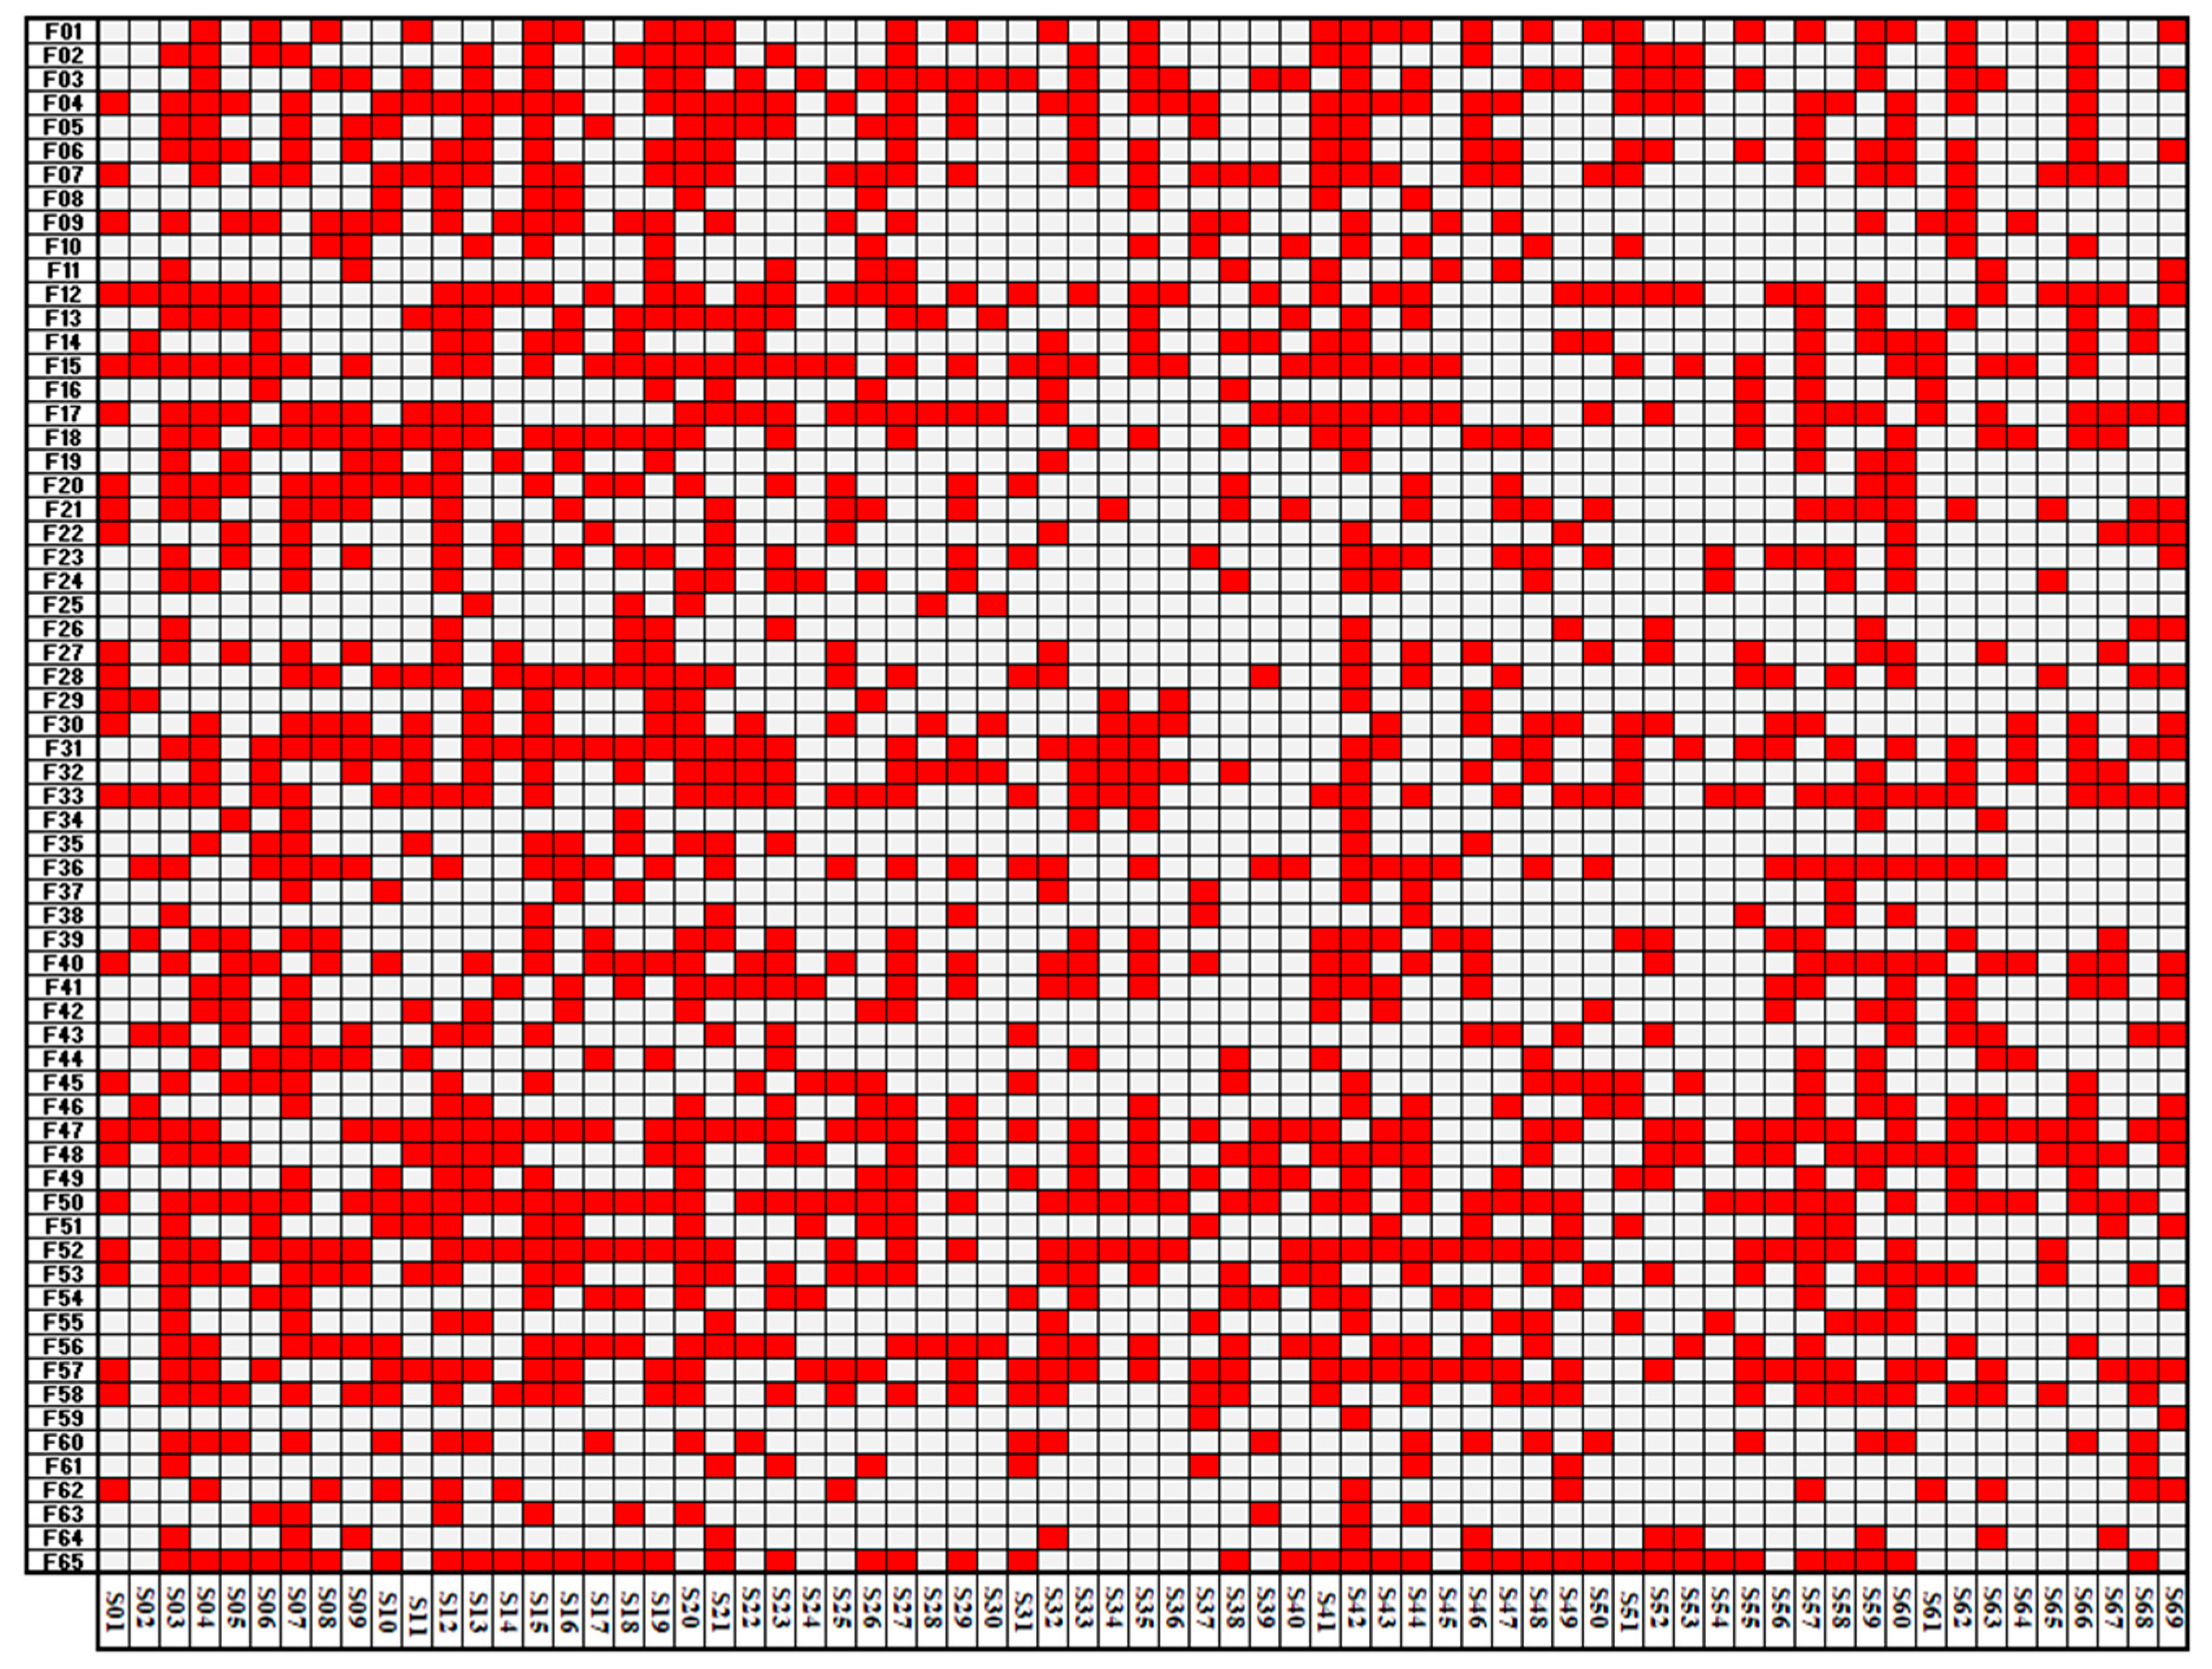
8.1. Developing Reference Matrix
In the first step of the Social Network Analysis (SNA) for this research, a Reference Matrix was created to map the relationships between the selected studies and the identified cost overrun factors. The 69 studies (denoted as S01 to S69) were mapped along the x-axis, while the 66 cost overrun factors (denoted as F01 to F66) were listed along the y-axis, creating a 66x69 matrix. This matrix served as the foundational dataset for the analysis, indicating which studies examined specific factors. The presence of a factor within a study is represented by a ‘1’, and its absence by a ‘0’. For example, as shown in
Table 3, the occurrence of factor F03 in studies S01 and S05 is marked with a ‘1’, while other entries for that factor are recorded as ‘0’.
Table 4.
Demonstrative example of a reference matrix.
Table 4.
Demonstrative example of a reference matrix.
| Factors/ Papers |
S01 |
S02 |
S03 |
S04 |
S05 |
| F1 |
1 |
0 |
0 |
0 |
0 |
| F2 |
1 |
0 |
0 |
0 |
0 |
| F3 |
1 |
0 |
0 |
0 |
1 |
Figure 7 provides a visual summary of the reference matrix, where the presence of a factor in a study is shown as a red cell. This visualization helped identify patterns in how factors were cited across the literature.
This systematic representation facilitates an understanding of the prominence of certain factors, and the Reference Matrix is crucial as it forms the basis for further analysis, helping to uncover the interconnections between factors and studies, and allowing for the identification of key patterns that will be explored in subsequent stages of the SNA process.
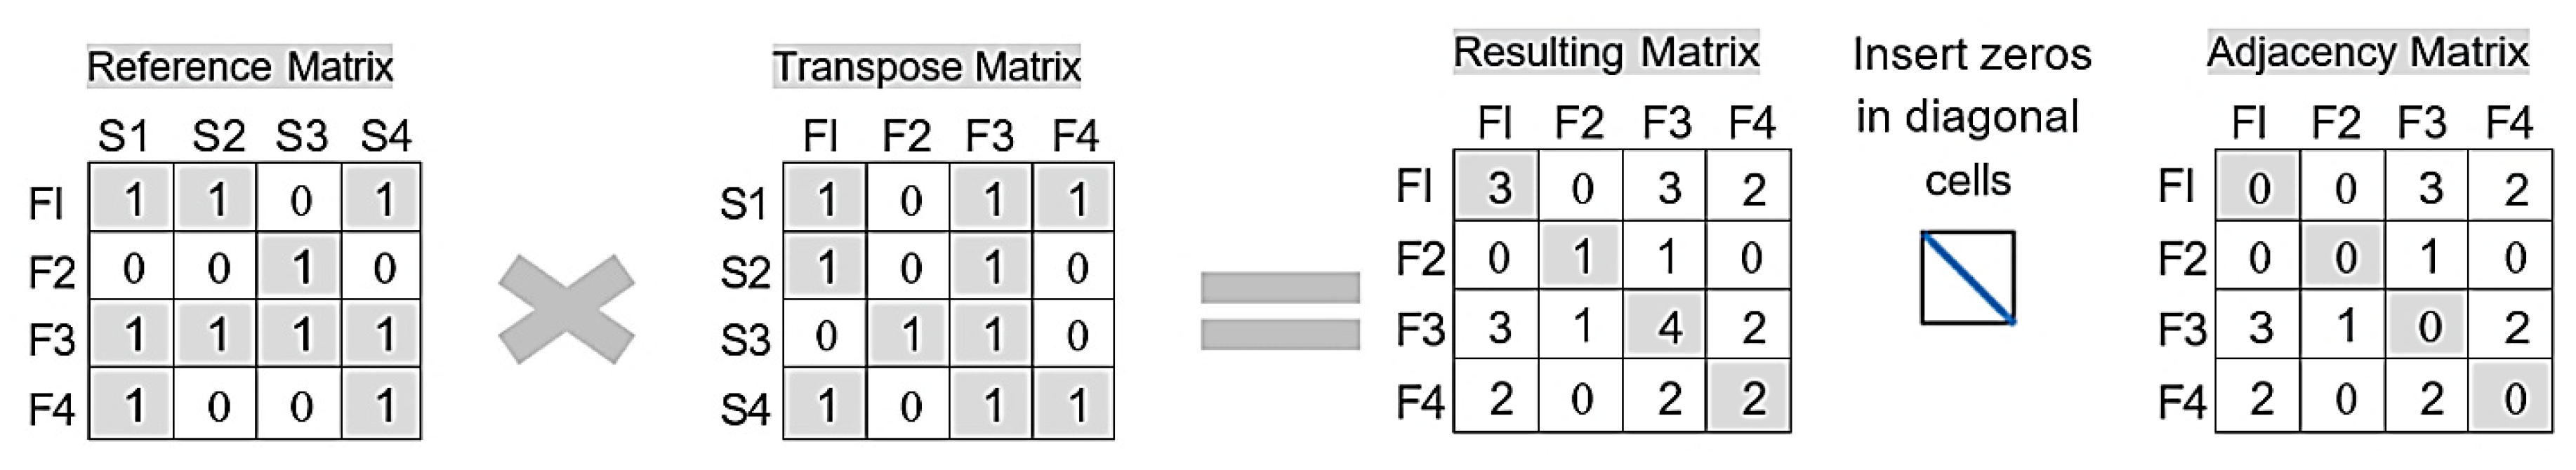
8.2. Constructing Social Network Adjacency Matrix
Adjacency matrix is a crucial step in the Social Network Analysis (SNA) process, representing the connections between various nodes. This matrix is developed by multiplying the reference matrix by its transpose, as shown in Equation (1), and setting the diagonal entries of the resulting matrix to zero to avoid self-connections.
In this context, denotes an n-by-n adjacency matrix, where n represents the total number of identified factors. refers to reference matrix, with m corresponding to the number of articles analyzed. represents the transpose matrix of the corresponding reference matrix, where i and j are the indices representing the rows and columns within the matrix, respectively.
To clarify this process,
Figure 8 presents a hypothetical example with values for demonstrative purposes only.
The resulting matrix highlights the co-occurrence of the 66 cost overrun factors within studies, indicating the degree to which factors are connected based on their joint presence in the literature.
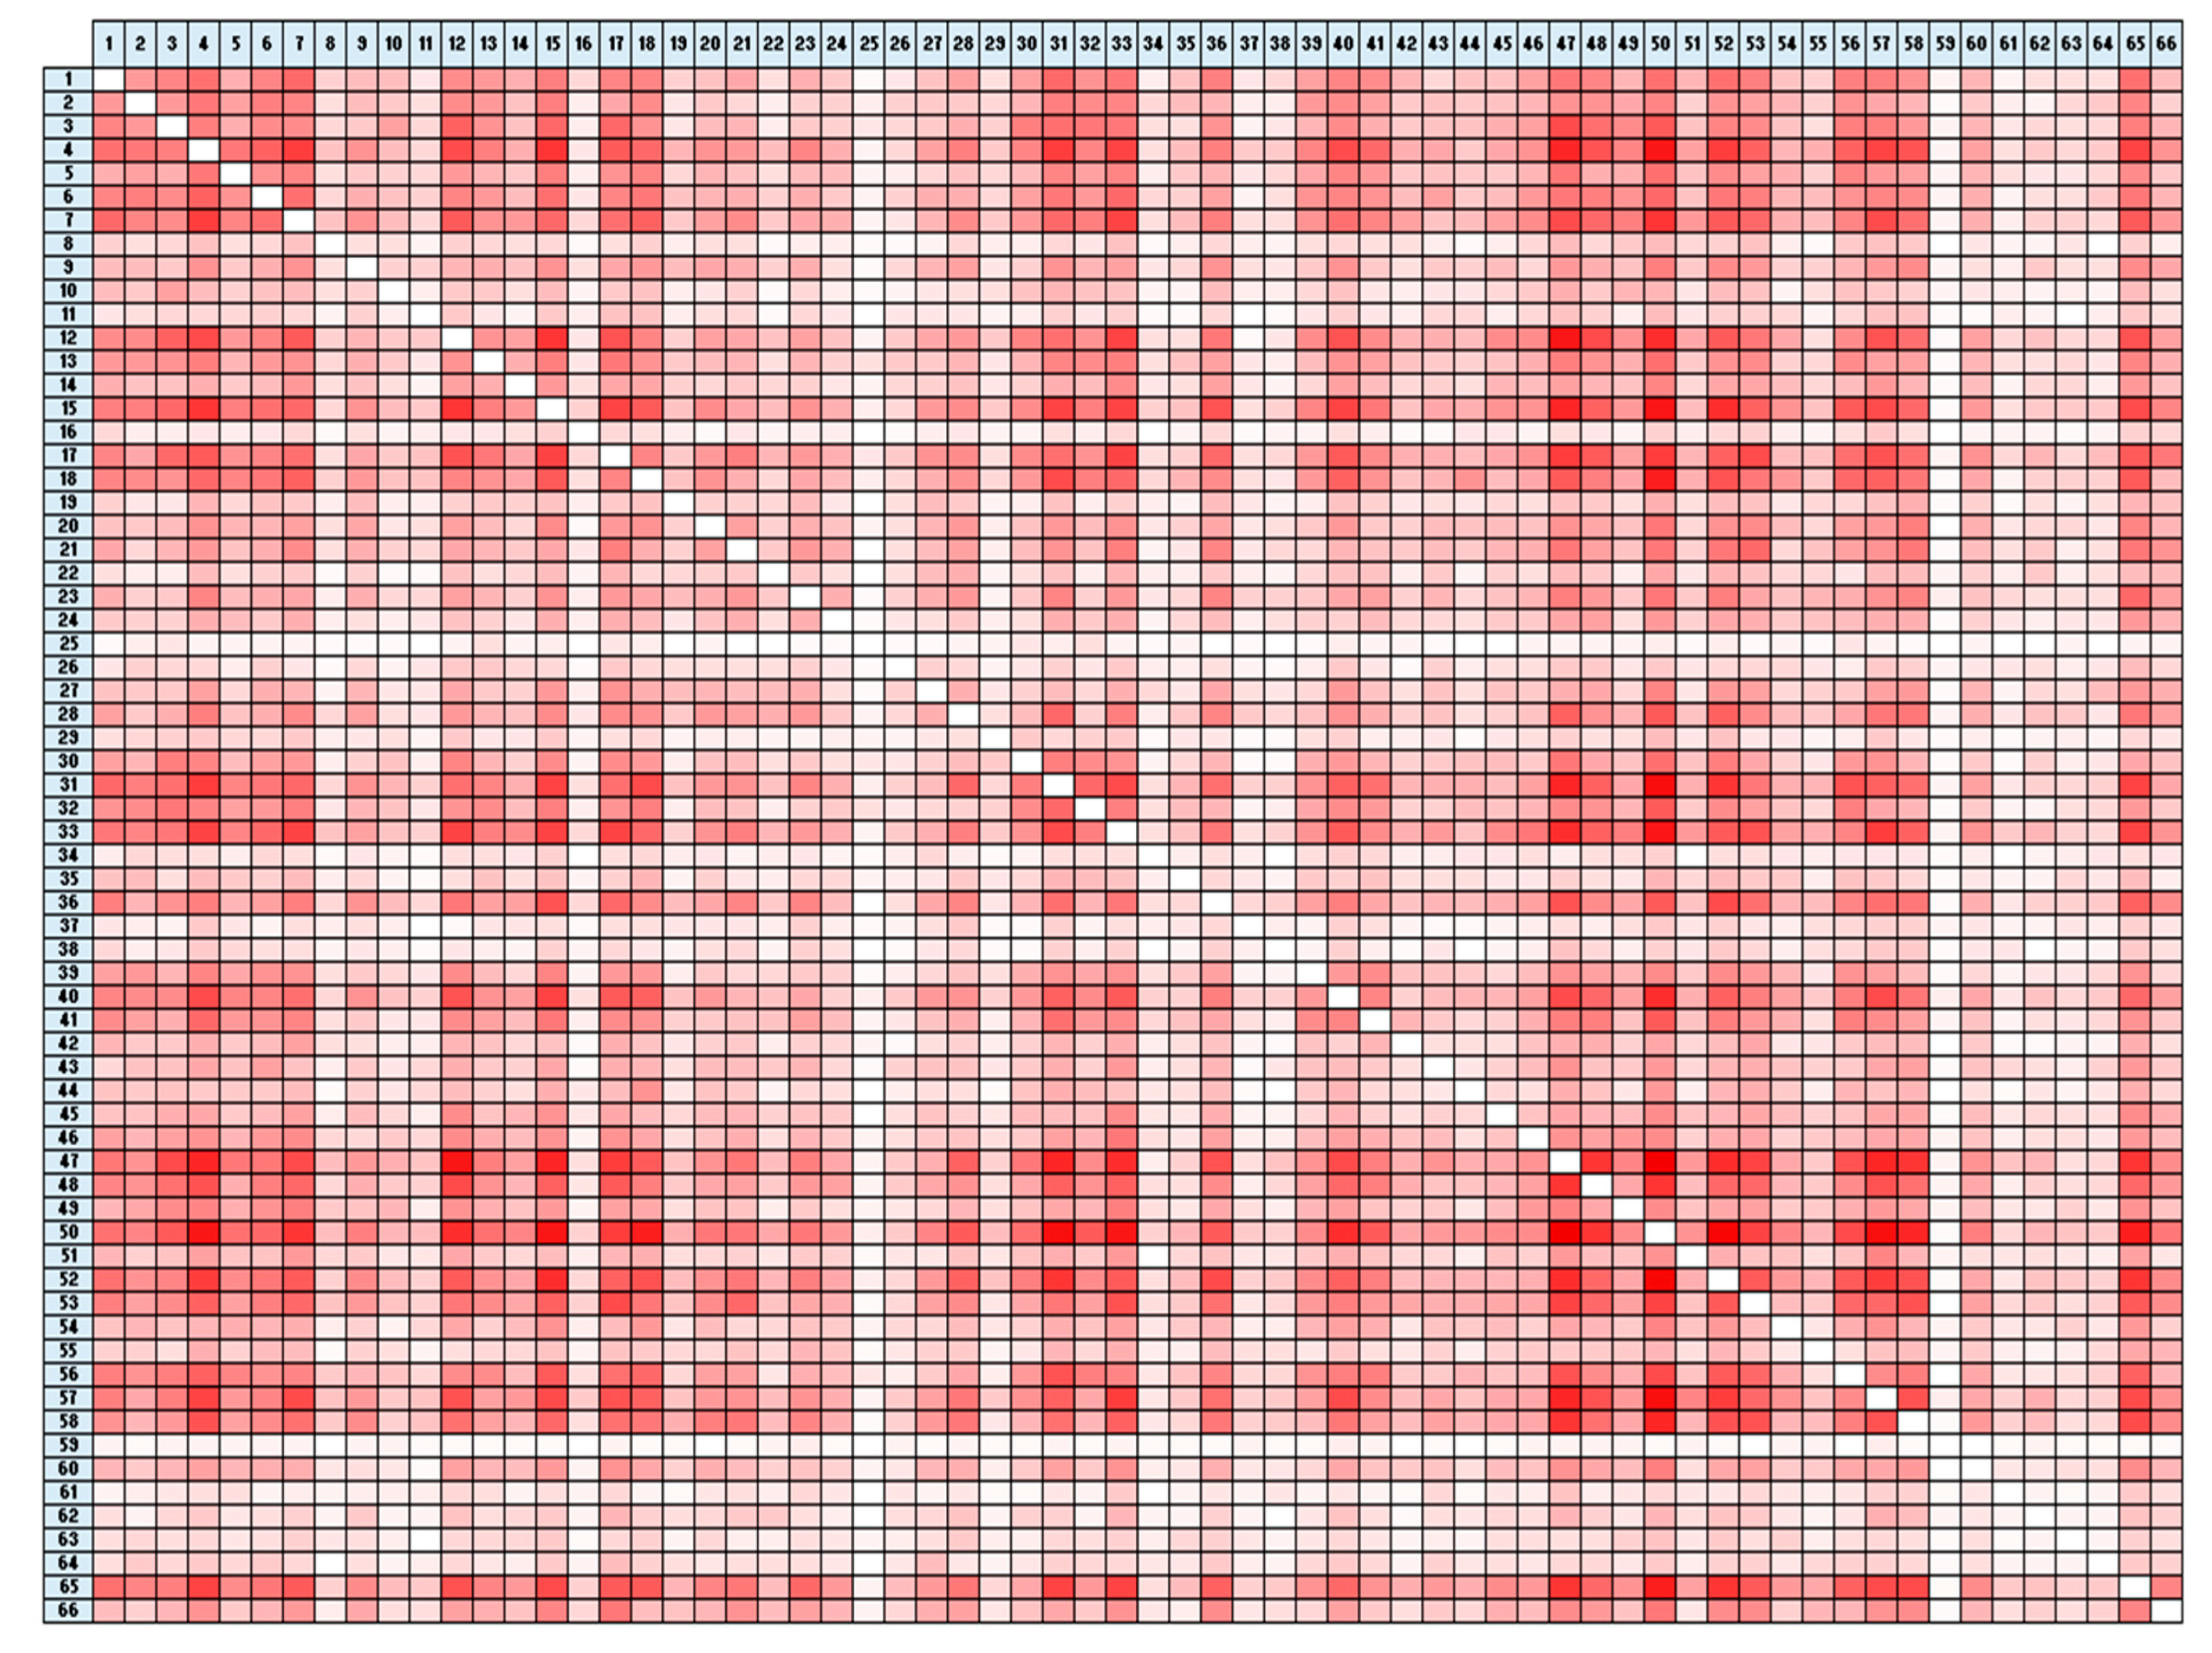
Figure 9 shows the actual adjacency matrix, which was developed to visually represent the interconnections among the various nodes. Each cell within the color-coded matrix mirrors the values found in the corresponding cell of the adjacency matrix. The rows and columns of the color-coded matrix correspond to the factors being analyzed, making it easier to assess the correlation strength between any pair of intersecting factors. The color scheme used in this matrix indicates the strength of the connections between factor pairs, with darker shades signifying stronger connections.
8.3. Degree Centrality
After constructing the adjacency matrix, Degree Centrality (DC) for each factor is calculated according to Equation (2), where
represents the Degree Centrality of factor i, and
indicates the value at the intersection of row i and column j in the adjacency matrix. Thus, the DC of a factor is determined by summing all the connections associated with that node in the matrix. To obtain the normalized DC for a specific factor iii within the network, the calculated DC of that factor is divided by the maximum DC value found in the network, as specified in Equation (3). Consequently, the normalized DC for any factor is confined within a range of 0 to 1.
In the context of this study, SocNetV—an open-source software tool for SNA and visualization—was used to analyze the cost overrun factors found in the investigated articles. This tool is useful for researchers because it allows them to explore relationships and interactions among various network typologies. The result of the applied SNA is visualized in
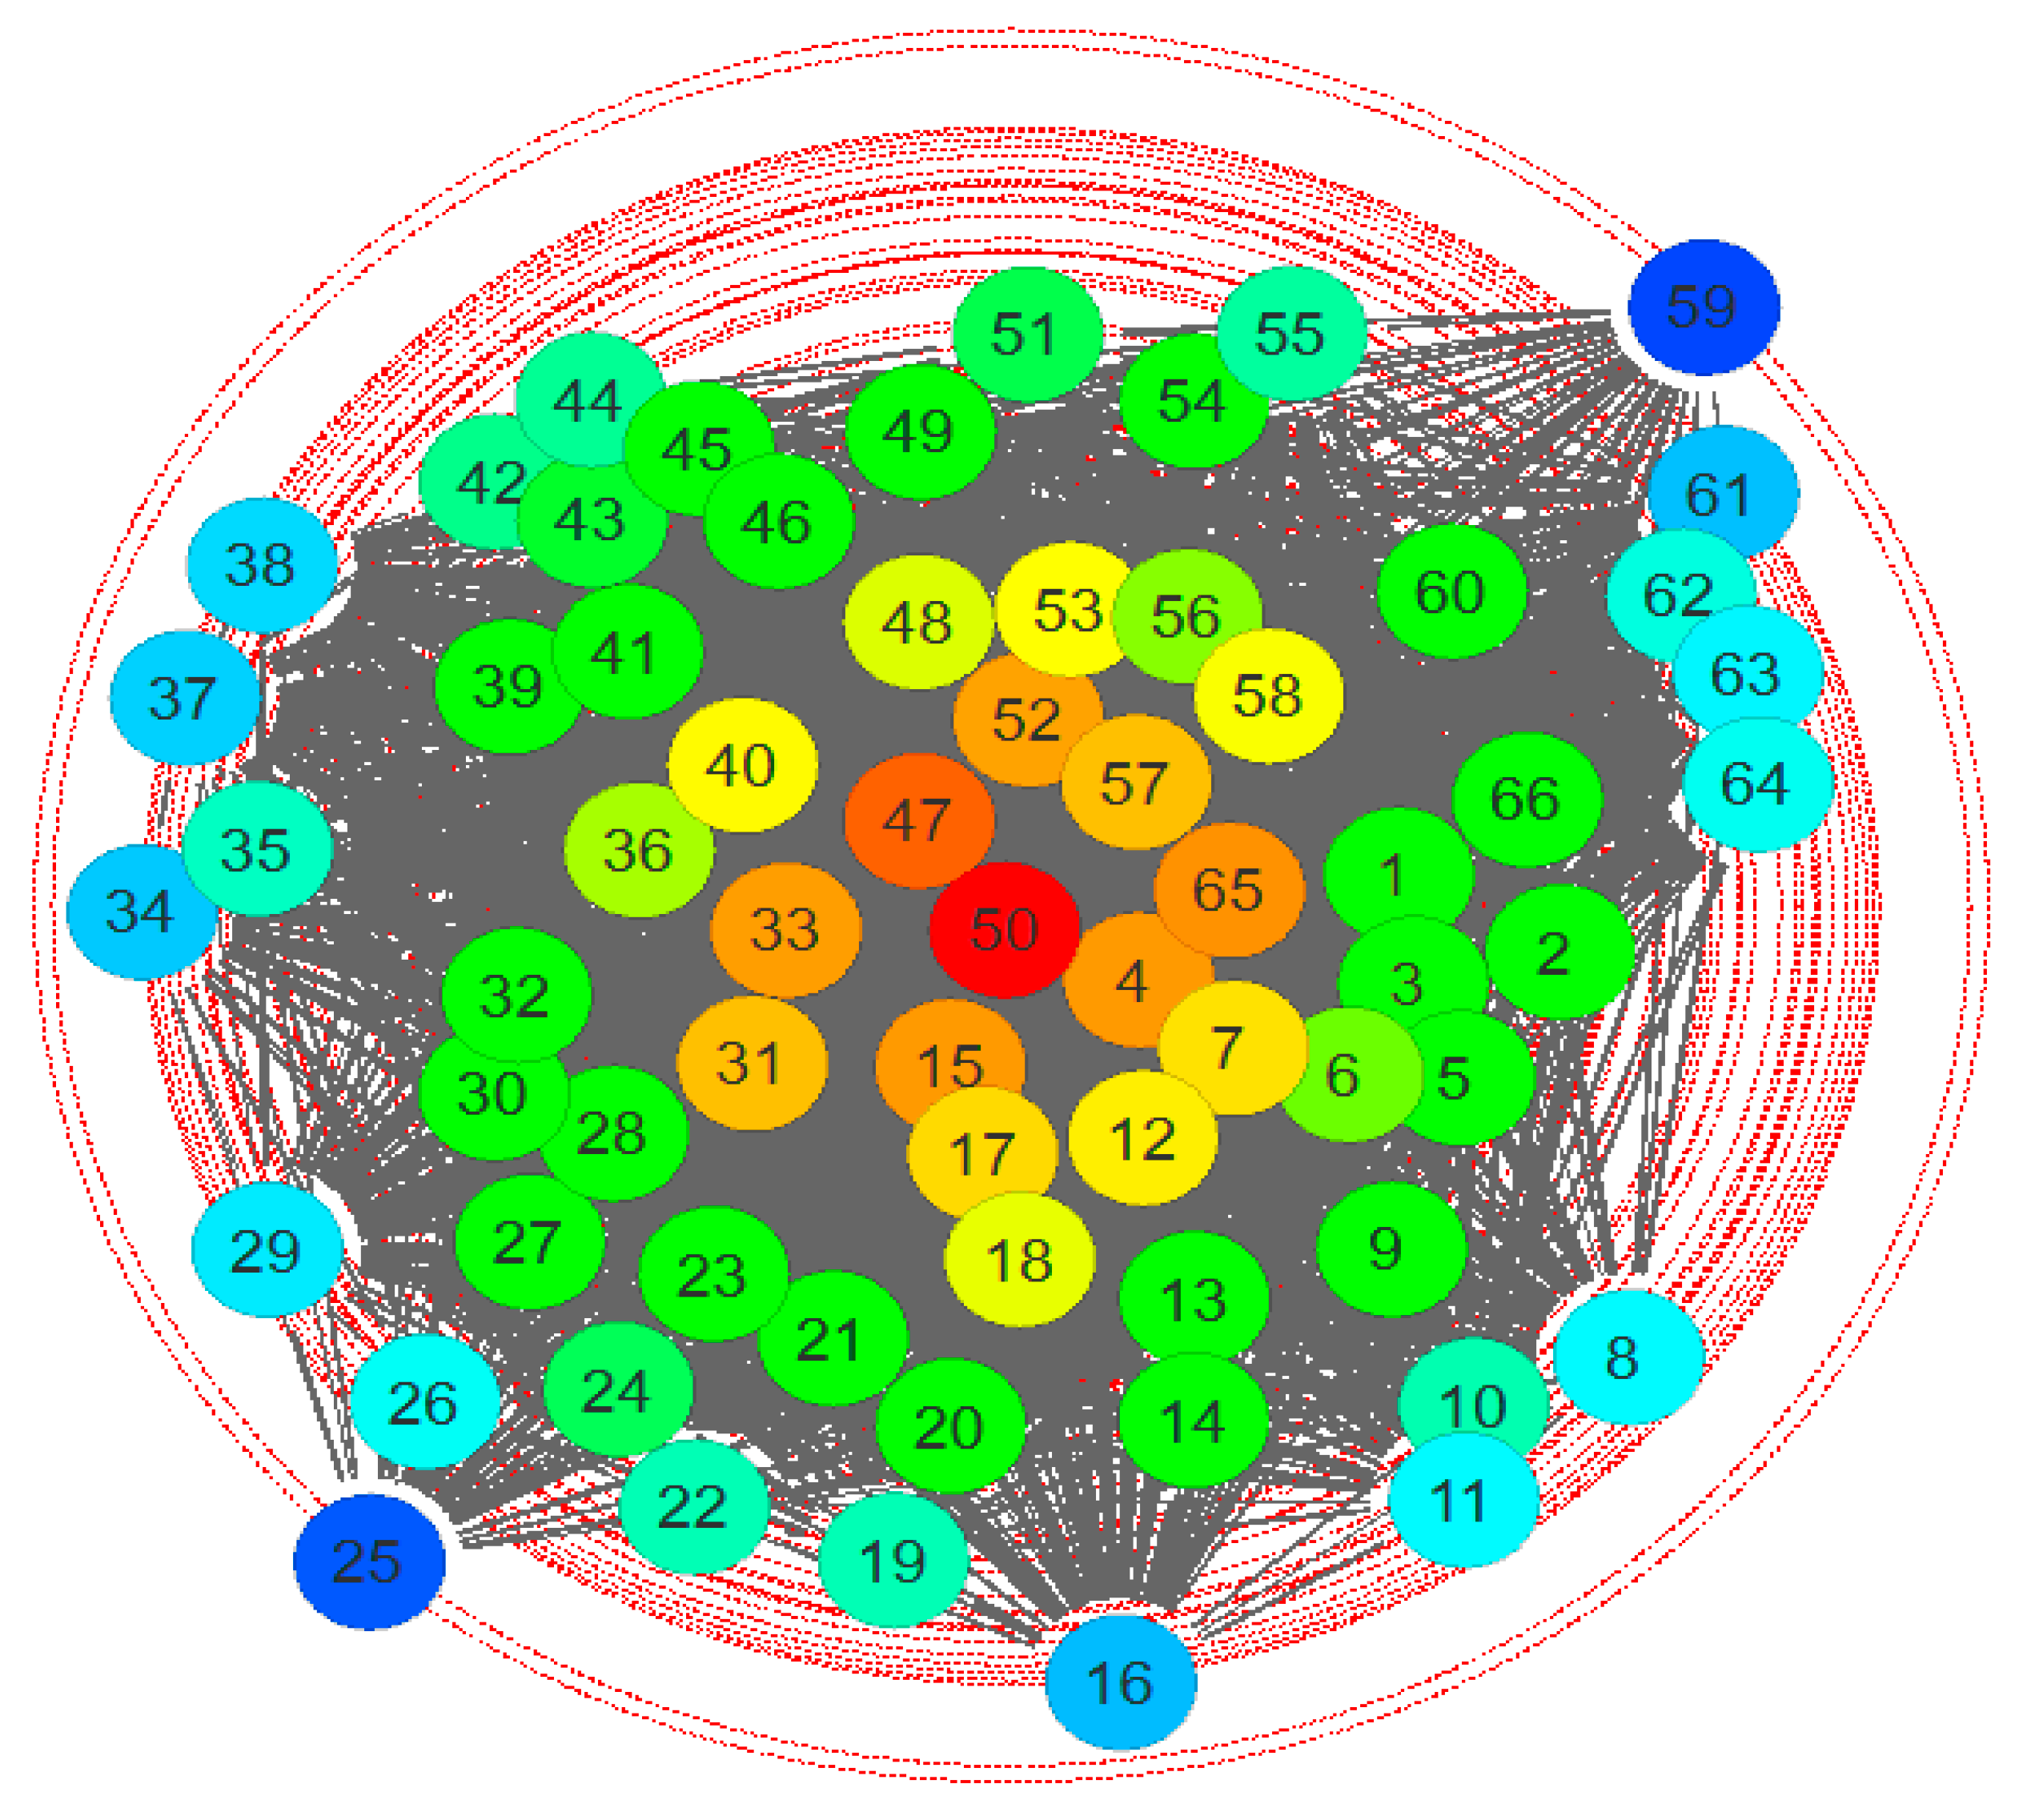
Figure 10, where the normalized DC for each factor is represented as a node in relation to its radial position. In this visualization, nodes closer to the center have higher normalized DC values, indicating greater importance, while those further from the center have lower values, as a node’s radial position is inversely proportional to its normalized DC.
The colors in the network diagram represent the range of degree centrality, transitioning from blue at the periphery to red near the center as shown in
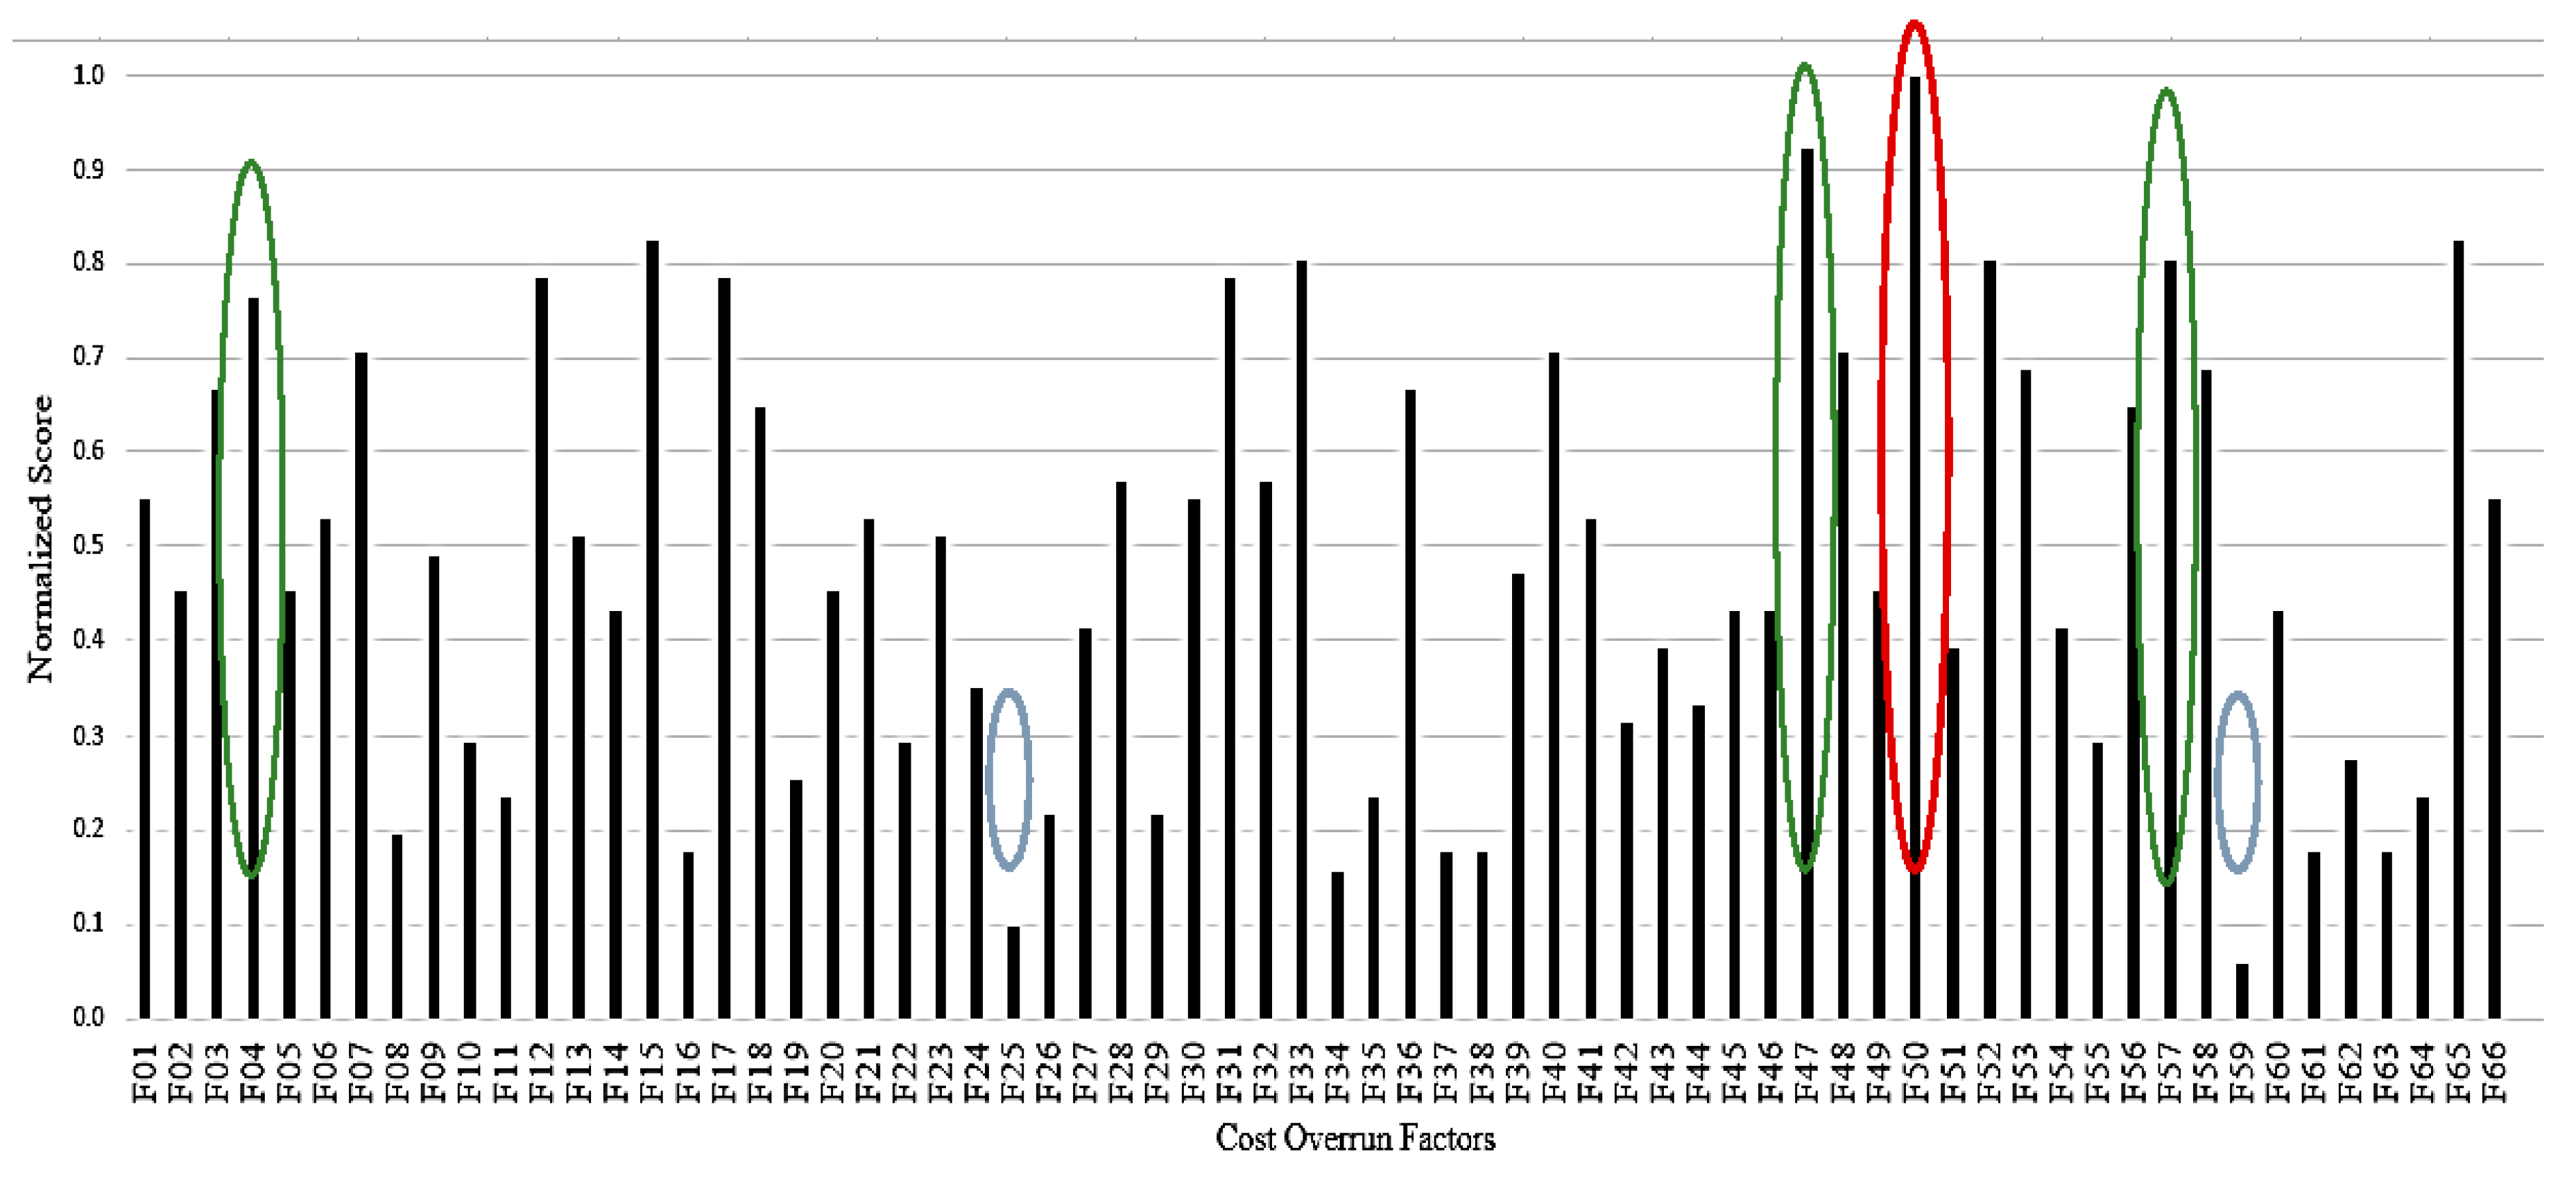
Figure 10. For instance, factor F50 (Planning and Scheduling Issues), located at the center of the network with the highest normalized DC as presented in
Figure 11, is highlighted in red, indicating its significant importance compared to other factors. Similarly, factors F47, F15, and F4 (Project Estimation Problems, Design Inefficiencies, and Labor Availability and Skills), which are also near the center with normalized DC values of 0.922, 0.824, and 0.804 respectively, are marked in orange, indicating their relatively high centrality. In contrast, factors such as F25 and F59 (Delay Payment by Contractor and Security), positioned at the periphery and indicated in blue, exhibit lower DC, reflecting their lesser importance within the network. These peripheral factors have fewer connections and reduced influence, while the central red and orange nodes represent the core of the network, where the most influential factors are concentrated.
8.4. Network Density in Social Network
Network density is a fundamental metric used to evaluate the cohesion and connectivity within a social network. It is defined as the ratio between the number of actual ties and the total possible ties among participants. As, Park et al. [
56] highlight, density is one of the most used indicators for assessing a network’s connectivity. Network density calculates the proportion of the possible ties that have been actualized between nodes, providing insight into the overall structure of the network [
57]. A high-density network signifies that a large proportion of possible connections have been realized, leading to stronger interaction and greater cohesion. Conversely, a low-density network indicates fewer connections, implying weaker interactions or more isolated nodes [
58]. The formula to calculate density is:
where Z refers to the network under investigation and n is the number of nodes in the network, which is 66.
Accordingly, we applied Equation (4) to the data in this study, yielding a network density of 0.986 as calculated in Equation (5). This high-density value indicates a strong interrelationship among the cost overrun factors identified from previous studies. Such a cohesive network suggests that many of the factors are closely linked, reflecting the interconnected nature of cost overrun causes in construction projects.
9. Results and Factor Interconnections
The analysis of cost overruns using Social Network Analysis (SNA) revealed a highly complex and interconnected web of factors. The network density was calculated to be 0.987, which indicates a strong level of connectivity among the factors and highlights the intricate relationships between factors that drive delays and budget increases in construction projects. This high density reflects the intertwined nature of these factors, which complicates the management of individual elements without impacting others. The interconnected nature of these factors means that weaknesses in one area can amplify inefficiencies throughout construction projects, creating compounding challenges.
The analysis identified seven factors with particularly high degree centrality scores, indicating their critical role in driving cost overruns. As identified by Abotaleb and El-adaway [
23], factors with a degree centrality above 0.8 are considered key decision-making parameters in system dynamics modeling for construction operations. These seven factors emerged as the most influential in the network, shaping project outcomes and significantly impacting cost efficiency. Below is a detailed exploration of these key factors and their interconnections.
9.1. Planning and Scheduling Issues (F50)
Planning and scheduling issues (F50) refer to the challenges in establishing and maintaining a well-structured project timeline that aligns resources, labor, and activities effectively. This factor holds the highest degree centrality in the network, indicating its central role in cost overruns across construction projects. High centrality means that deficiencies in planning and scheduling do not only delay project timelines but also amplify the effects of other factors, making F50 a critical aspect in effective cost management. F50 is notably interconnected with Labor Availability and Skills (F04), Design Inefficiencies (F15), and Scope Definition (F33), co-occurring thirty-three times in the network. Deficiencies in labor resources, design flaws, and ambiguities in scope add complexity to the schedule, escalating costs significantly. Additionally, F50’s connection to Contractor Experience (F40) and Design Changes (F12) factors that co-occur thirty times emphasizes the impact of frequent design adjustments and variable contractor expertise on project timelines. In addition, the relationship with Resource Planning & Allocation (F09), appearing 19 times, highlights the critical role of resource management in maintaining the project schedule. Therefore, these interdependencies make addressing planning and scheduling issues a priority for mitigating cost overruns.
9.2. Project Estimation Problems (F47)
This factor (F47) refers to issues related to calculating the overall required costs for a project during the tender phase, which can lead to significant budget discrepancies, often resulting in cost overruns. Holding a high degree centrality of 0.922, F47 is one of the most influential factors in the network, as these estimation inaccuracies not only directly impact budgeting but also significantly amplify the challenges posed by related factors. Notably, F47 is strongly associated with Material Availability (F01), Delay in Materials (F02), and Cost of Materials (F03), co-occurring twenty-six times, highlighting how inaccurate estimates can hinder material procurement and disrupt project timelines. Furthermore, F47 showed strong connections to Bidding Problems (F53) appearing twenty-seven times, illustrating how errors in early cost projections during bidding can lead to financial instability and pressures on contractors to manage within flawed budgets. In addition, F47 link to Mistakes / Deficiency in Bill of Quantities (BOQ) (F45) shows how estimation errors, if not addressed at the initial phases, can exacerbate project inefficiencies. Based on the above, addressing estimation problems early is crucial for avoiding cascading issues across other areas of the project.
9.3. Design Inefficiencies (F15)
Design inefficiencies (F15) refer to issues arising from flaws or gaps in the design phase that hinder project progress and often necessitate costly rework. These inefficiencies can result from a lack of alignment with project specifications, incomplete documentation, or inadequate collaboration during the design process. With a degree centrality of 0.824, F15 is a major factor contributing to cost overruns, as these inefficiencies not only increase costs directly but also amplify other project challenges. F15 is closely linked with Project Specifications and Feasibility (F58), where unclear or changing specifications complicate design execution, these factors co-occur frequently in the network, highlighting the high correlation between design clarity and project efficiency. Additionally, F15 frequently interacts with Lack of Communication (F18) and Coordination and Cooperation (F17), with these factors appearing together multiple times, illustrating how poor communication and limited cooperation exacerbate design issues, causing delays and additional expenses. Interestingly, while F15 and Delays in the Design Stage (F13) frequently co-occur, they do not always align, indicating that design inefficiencies may lead to issues beyond simple delays. Accordingly, strengthening collaboration and ensuring detailed, clear designs can reduce these compounded impacts on project budgets.
9.4. Adverse Weather Conditions (F65)
Adverse weather conditions (F65) refer to unexpected or severe weather events that disrupt construction activities, leading to delays and increased costs. Such conditions can affect site accessibility, damage equipment, and hold on-site activities, often resulting in unavoidable schedule extensions and budget adjustments. With a degree centrality of 0.824, F65 is a significant factor in the network, as its impact not only causes direct project delays but also amplifies the effects of other related factors. F65 is closely linked with Bad Execution Problems (F07) and Site Accessibility (F61), with these factors co-occurring twenty-four times, showing how weather disruptions can lead to execution delays and hinder material deliveries. Additionally, F65 is strongly associated with Equipment Suitability and Availability (F06), as adverse conditions frequently damage or render equipment inoperable, compounding project delays. The factor also has a notable connection to Force Majeure (F66), with these factors co-occurring eighteen times, highlighting the importance of contract clauses that address weather-related disruptions beyond project control.
9.5. Definition of Scope (F33)
Scope definition (F33) refers to the clear identification and agreement on the project’s boundaries, deliverables, and requirements. When the scope is not well-defined or continuously changes, it leads to misunderstandings, mismanagement, and often to significant cost overruns. With a degree centrality of 0.804, F33 is a critical factor in the network, as poor scope definition can lead to a range of project disruptions, particularly through the creation of additional work orders and incomplete documentation. F33 is closely linked with Additional Work Orders (F36), which co-occur thirty times, highlighting how unclear or evolving scope requirements force project teams to introduce new tasks mid-project, thus inflating costs. Similarly, F33 interacts with Deficient or Incomplete Documents (F14), co-occurring twenty-seven times, as unclear or incomplete project documentation contributes to scope misalignment and further increases project costs. Additionally, F33 is connected with Project Specifications and Feasibility (F58), where shifting or unclear specifications complicate the scope definition, making it harder to maintain project alignment.
9.6. Contractual Ambiguity and Issues (F52)
This factor (52) refers to unclear, ambiguous, or poorly defined contract terms, which often result in misunderstandings, disputes, and project delays, these ambiguities can include vague clauses, unclear responsibilities, or insufficient detail in contract terms, all of which contribute to misalignment between project stakeholders. With a degree centrality of 0.804, F52 is a significant factor within the network, as contract issues frequently lead to additional costs and hinder project progress. F52 is closely associated with Suspension and Termination (F37), with these factors co-occurring multiple times in the network, indicating that unclear contracts often lead to project work halts or terminations, causing substantial delays and financial penalties. Additionally, F52 is strongly linked to Claims and Disputes (F60), with these factors appearing together frequently, as contract ambiguities escalate into formal claims that disrupt project workflows and increase costs. Another notable connection is with Inflation (F23), highlighting how ambiguities in contracts regarding cost adjustments can create financial strain under inflationary pressures.
9.7. Unforeseeable Site Conditions (F57)
Unforeseeable site conditions (F57) refer to unexpected physical or environmental challenges encountered on-site that were not identified during the initial project assessments. Such conditions can include hidden sub-surface issues, unexpected soil conditions, or other environmental factors that complicate construction efforts and lead to cost overruns. With a degree centrality of 0.804, F57 is a notable factor in the network, as it not only directly impacts project timelines and costs but also amplifies the challenges posed by other interrelated factors. F57 is closely associated with Design Changes (F12), with these factors co-occurring twenty-eight times, reflecting how unforeseen conditions often necessitate modifications in the project design to address unexpected challenges, leading to additional costs and delays. Furthermore, F57 frequently interacts with Inadequate Risk Assessment (F10), which co-occurs twenty times, indicating that insufficient risk analysis during the planning phase leaves projects vulnerable to unforeseen site conditions that could have been mitigated with more thorough upfront assessments.
10. Conclusion
This paper has provided a detailed analysis of the multifaceted nature of cost overruns in the construction industry through a structured methodology that combined scientometric analysis, systematic literature review, and Social Network Analysis (SNA). By examining an initial pool of 405 articles and narrowing the focus to 69 high-quality studies, the research offers a well-rounded understanding of the factors driving cost escalations in construction projects. The use of scientometric analysis enabled the identification of critical trends and gaps in the existing research landscape, revealing how the discourse on cost overruns has evolved over time and across different regions and project types, it also established a solid foundation for highlighting the interconnected nature of cost overrun factors. The application of Social Network Analysis (SNA) added a novel dimension to this research. By mapping the relationships between 66 identified factors, the analysis highlighted how these variables influence each other within the broader network of project dynamics. The results revealed seven factors with significant centrality such as planning and scheduling issues, project estimation inaccuracies, and design inefficiencies that emerged as the most influential contributors to cost overruns.
By focusing on the seven most influential factors identified through the network analysis, the study not only contributes to the academic discourse on cost management but also provides actionable insights for construction project managers and policymakers who aim to reduce cost overruns by targeting high-centrality factors. Additionally, the results serve as a guide for construction industry professionals seeking to develop targeted strategies that address the root causes of budget overruns, thereby improving project performance and economic efficiency. Thus, this study bridges gaps in the literature by integrating scientometric and social network analyses, offering a structed view of cost overrun dynamics. Its implications extend beyond academic theory, providing real-world applications for practitioners who aim to enhance the success of construction projects. By mapping the interrelationships between key factors and identifying those with the most substantial impact, the research lays the groundwork for future studies to explore advanced cost management techniques that can address these challenges holistically. Future research can build on this approach by exploring predictive models and simulations that further refine our understanding of cost overruns.
Author Contributions
Conceptualization, Ahmed Mohammed Abdelalim and Mohammed Tantawy ; Data curation, Ahmed Mohammed Abdelalim, Maram Salem and Mohammed Tantawy ; Formal analysis, Ahmed Mohammed Abdelalim, Maram Salem and Mohammed Tantawy ; Funding acquisition, Ahmed Mohammed Abdelalim, Mohammed Salem and Manal Al-Adwani; Investigation, Ahmed Mohammed Abdelalim, Maram Salem and Mohammed Tantawy ; Methodology, Ahmed Mohammed Abdelalim, Maram Salem and Mohammed Tantawy ; Project administration, Ahmed Mohammed Abdelalim; Resources, Ahmed Mohammed Abdelalim, Mohammed Salem and Manal Al-Adwani; Software, Ahmed Mohammed Abdelalim, Maram Salem and Mohammed Tantawy ; Supervision, Ahmed Mohammed Abdelalim and Mohammed Tantawy ; Validation, Ahmed Mohammed Abdelalim, Maram Salem, Mohammed Salem, Manal Al-Adwani and Mohammed Tantawy ; Visualization, Ahmed Mohammed Abdelalim, Maram Salem, Mohammed Salem and Mohammed Tantawy ; Writing – original draft, Ahmed Mohammed Abdelalim, Maram Salem and Mohammed Tantawy ; Writing – review & editing, Ahmed Mohammed Abdelalim, Maram Salem, Mohammed Salem, Manal Al-Adwani and Mohammed Tantawy .
Institutional Review Board Statement
Not applicable.
Informed Consent Statement
Not applicable.
Data Availability Statement
Any data used during the study can be accessed when requested.
Conflicts of Interest
The authors declare no conflict of interest.
References
- J. Parada, M. Alurralde, P. Deloitte Spain Margarita Velasco, S. Manager Deloitte Spain Eduardo Oliver, and E. Senior Deloitte Spain, “GPoC 2022 Global Powers of Construction GPoC is an annual publication produced by Deloitte Spain and distributed free of charge,” 2023.
- Economic Consulting Team, “Global Construction Futures | Oxford Economics.” Accessed: Nov. 07, 2024. [Online]. Available: https://www.oxfordeconomics.com/resource/global-construction-futures/.
- M. El-Ahwal, S. S. El- Attar, and W. A. Abdel-Hafez, “Factors Leading to Cost Overrun Occurrence in Construction Projects,” Port-Said Engineering Research Journal, vol. 20, no. 1, pp. 71–77, Mar. 2016. [CrossRef]
- L. A. Ika and J. K. Pinto, “The ‘re-meaning’ of project success: Updating and recalibrating for a modern project management,” International Journal of Project Management, vol. 40, no. 7, pp. 835–848, Oct. 2022. [CrossRef]
- L. A. Asante and R. O. Mills, “Exploring the Socio-Economic Impact of COVID-19 Pandemic in Marketplaces in Urban Ghana,” Africa Spectrum, vol. 55, no. 2, pp. 170–181, Jul. 2020. [CrossRef]
- B. G. Hwang, M. Shan, L. Zhu, and W. C. Lim, “Cost control in megaprojects: efficacy, tools and techniques, key knowledge areas and project comparisons,” International Journal of Construction Management, vol. 20, no. 5, pp. 437–449, Sep. 2020. [CrossRef]
- G. Eke, J. Elgy, and G. Wedawatta, “Establishing a Link between Contractor Selection Strategy and Project Outcomes: Simulation Study,” J Constr Eng Manag, vol. 145, no. 10, Aug. 2019. [CrossRef]
- A. Aljohani, D. Ahiaga-Dagbui, and D. Moore, “Construction Projects Cost Overrun: What Does the Literature Tell Us?,” International Journal of Innovation, Management and Technology, pp. 137–143, 2017. [CrossRef]
- A. Moghayedi and A. Windapo, “Identification of the uncertain events impacting on construction time of South African highway projects | Journal of Construction Project Management and Innovation.” Accessed: Nov. 07, 2024. [Online]. Available: https://journals.co.za/doi/abs/10.10520/EJC-134376dbd9.
- A. Bin Seddeeq, S. Assaf, A. Abdallah, and M. A. Hassanain, “Time and cost overrun in the Saudi Arabian oil and gas construction industry,” Buildings, vol. 9, no. 2, Feb. 2019. [CrossRef]
- H. A. Owolabi, L. O. Oyedele, H. A. Alaka, S. O. Ajayi, O. O. Akinade, and M. Bilal, “Critical Success Factors for Ensuring Bankable Completion Risk in PFI/PPP Megaprojects,” Journal of Management in Engineering, vol. 36, no. 1, Sep. 2019. [CrossRef]
- SmartPM, “Construction Cost Overruns: An Industry in Crisis - SmartPM.” Accessed: Nov. 07, 2024. [Online]. Available: https://smartpm.com/blog/construction-cost-overruns/.
- ReNew Canada, “Most construction projects over budget and late: survey | ReNew Canada.” Accessed: Nov. 07, 2024. [Online]. Available: https://www.renewcanada.net/5000088747-2/.
- T. Huo et al., “Measurement and Dependence Analysis of Cost Overruns in Megatransport Infrastructure Projects: Case Study in Hong Kong,” J Constr Eng Manag, vol. 144, no. 3, Mar. 2018. [CrossRef]
- A. P. C. Chan and A. P. L. Chan, “Key performance indicators for measuring construction success,” Benchmarking, vol. 11, no. 2, pp. 203–221, 2004. [CrossRef]
- E. Plebankiewicz, “Model of predicting cost overrun in construction projects,” Sustainability (Switzerland), vol. 10, no. 12, Nov. 2018. [CrossRef]
- S. Durdyev, “Review of construction journals on causes of project cost overruns,” Engineering, Construction and Architectural Management, vol. 28, no. 4, pp. 1241–1260, 2020. [CrossRef]
- B. Flyvbjerg et al., “Five things you should know about cost overrun,” Transp Res Part A Policy Pract, vol. 118, pp. 174–190, Dec. 2018. [CrossRef]
- B. Flyvbjerg, M. K. S. Holm, and S. L. Buhl, “How common and how large are cost overruns in transport infrastructure projects?,” Transp Rev, vol. 23, no. 1, pp. 71–88, Jan. 2003. [CrossRef]
- Propeller Aero, “10 Construction Cost Overrun Statistics You Need to Hear.” Accessed: Nov. 07, 2024. [Online]. Available: https://www.propelleraero.com/blog/10-construction-project-cost-overrun-statistics-you-need-to-hear/.
- J. A. Alsuliman, “Causes of delay in Saudi public construction projects,” Alexandria Engineering Journal, vol. 58, no. 2, pp. 801–808, Jun. 2019. [CrossRef]
- R. Derakhshanalavijeh and J. M. C. Teixeira, “Cost overrun in construction projects in developing countries, Gas-Oil industry of Iran as a case study,” Journal of Civil Engineering and Management, vol. 23, no. 1, pp. 125–136, Jan. 2017. [CrossRef]
- I. S. Abotaleb and I. H. El-adaway, “Managing Construction Projects through Dynamic Modeling: Reviewing the Existing Body of Knowledge and Deriving Future Research Directions,” Journal of Management in Engineering, vol. 34, no. 6, p. 04018033, Nov. 2018. [CrossRef]
- A. M. Kamaruddeen, C. F. Sung, and W. Wahi, “A study on factors causing cost overrun of construction projects in Sarawak, Malaysia,” Civil Engineering and Architecture, vol. 8, no. 3, pp. 191–199, Jun. 2020. [CrossRef]
- R. K. Shah, “An Exploration of Causes for Delay and Cost Overruns In Construction Projects: Case Study of Australia, Malaysia & Ghana,” Journal of Advanced College of Engineering and Management, vol. 2, p. 41, Nov. 2016. [CrossRef]
- A. O. Daoud, M. El Hefnawy, and H. Wefki, “Investigation of critical factors affecting cost overruns and delays in Egyptian mega construction projects,” Alexandria Engineering Journal, vol. 83, pp. 326–334, Nov. 2023. [CrossRef]
- M. Yalcinkaya and V. Singh, “Patterns and trends in Building Information Modeling (BIM) research: A Latent Semantic Analysis,” Autom Constr, vol. 59, pp. 68–80, Nov. 2015. [CrossRef]
- M. Gunduz and O. L. Maki, “Assessing the risk perception of cost overrun through importance rating,” Technological and Economic Development of Economy, vol. 24, no. 5, pp. 1829–1844, Oct. 2018. [CrossRef]
- P. E. D. Love, D. D. Ahiaga-Dagbui, and Z. Irani, “Cost overruns in transportation infrastructure projects: Sowing the seeds for a probabilistic theory of causation,” Transp Res Part A Policy Pract, vol. 92, pp. 184–194, Oct. 2016. [CrossRef]
- Princess. Ngobeni, “Factors That Influence Project Cost Estimate Accuracy at an Engineering Broadcasting Company - ProQuest,” 2018. Accessed: Nov. 07, 2024. [Online]. Available: https://www.proquest.com/openview/27def1bf7484b081e6ff7af2914f01a3/1?pq-origsite=gscholar&cbl=2026366&diss=y.
- Z. Shehu, I. R. Endut, A. Akintoye, and G. D. Holt, “Cost overrun in the Malaysian construction industry projects: A deeper insight,” International Journal of Project Management, vol. 32, no. 8, pp. 1471–1480, Nov. 2014. [CrossRef]
- H. H. Purba, A. Purba, M. Enrica, and H. Hardi Purba, “Risks Leading to Cost Overrun in Construction Projects: A Systematic Literature Review,” Advance Researches in Civil Engineering, vol. 3, no. 1, pp. 43–60, 2021. [CrossRef]
- J. Odeck, “Cost overruns in road construction—what are their sizes and determinants?,” Transp Policy (Oxf), vol. 11, no. 1, pp. 43–53, Jan. 2004. [CrossRef]
- V. Shahhosseini, M. R. Afshar, and O. Amiri, “The root causes of construction project failure,” Scientia Iranica, vol. 25, no. 1, pp. 93–108, Jan. 2018. [CrossRef]
- R. O. Asiedu and C. Ameyaw, “A system dynamics approach to conceptualise causes of cost overrun of construction projects in developing countries,” International Journal of Building Pathology and Adaptation, vol. 39, no. 5, pp. 831–851, Nov. 2021. [CrossRef]
- A. Vivek and C. H. Hanumantha Rao, “Identification and analysing of risk factors affecting cost of construction projects,” Mater Today Proc, vol. 60, pp. 1696–1701, Jan. 2022. [CrossRef]
- E. Yousri, A. E. B. Sayed, M. A. M. Farag, and A. M. Abdelalim, “Risk Identification of Building Construction Projects in Egypt,” Buildings, vol. 13, no. 4, Apr. 2023. [CrossRef]
- H. Pham, T. Van Luu, S. Y. Kim, and D. T. Vien, “Assessing the Impact of Cost Overrun Causes in Transmission Lines Construction Projects,” KSCE Journal of Civil Engineering, vol. 24, no. 4, pp. 1029–1036, Apr. 2020. [CrossRef]
- B. P. Khanal and S. K. Ojha, “Cause of Time and Cost Overruns in the Construction Project in Nepal,” Advances in Science, Technology and Engineering Systems Journal, vol. 5, no. 4, pp. 192–195, Jul. 2020. [CrossRef]
- R. Susanti, “Cost overrun and time delay of construction project in Indonesia,” J Phys Conf Ser, vol. 1444, no. 1, p. 012050, Jan. 2020. [CrossRef]
- G. Bekr, “Causes of Delay in Public Construction Project in Iraq,” Jordon Journal of Civil Engineering, vol. Volume 9, No.2, 2016, Accessed: Nov. 08, 2024. [Online]. Available: https://platform.almanhal.com/Files/Articles/83746.
- N. Al-Hazim, Z. A. Salem, and H. Ahmad, “Delay and Cost Overrun in Infrastructure Projects in Jordan,” Procedia Eng, vol. 182, pp. 18–24, Jan. 2017. [CrossRef]
- M. Stojmenovic and G. Lindgaard, “Benefits and Limitations of the Social Network Analysis When Explaining Instances of Ineffective Communication in Two Chemical, Biological, Radiological, Nuclear, and Explosives Simulations,” pp. 327–334, Jan. 2014. [CrossRef]
- R. Osei-Kyei and A. P. C. Chan, “Review of studies on the Critical Success Factors for Public–Private Partnership (PPP) projects from 1990 to 2013,” International Journal of Project Management, vol. 33, no. 6, pp. 1335–1346, Aug. 2015. [CrossRef]
- Y. Ke, S. Wang, A. P. Chan, and E. Cheung, “Research Trend of Public-Private Partnership in Construction Journals,” J Constr Eng Manag, vol. 135, no. 10, pp. 1076–1086, Sep. 2009. [CrossRef]
- Y. Gu, “Global knowledge management research: A bibliometric analysis,” Scientometrics, vol. 61, no. 2, pp. 171–190, 2004. [CrossRef]
- B. L. Tanko, W. P. Zakka, and W. N. Heng, “BIM in the Malaysian construction industry: a scientometric review and case study,” Engineering, Construction and Architectural Management, vol. 31, no. 3, pp. 1165–1186, Mar. 2022. [CrossRef]
- D. Baccarini, “The concept of project complexity—a review,” International Journal of Project Management, vol. 14, no. 4, pp. 201–204, Aug. 1996. [CrossRef]
- H. Parsons-Hann and K. Liu, “MEASURING REQUIREMENTS COMPLEXITY TO INCREASE THE PROBABILITY OF PROJECT SUCCESS,” ICEIS 2005 - Proceedings of the 7th International Conference on Enterprise Information Systems, vol. 4, pp. 434–438, May 2005. [CrossRef]
- M. K. Ahuja, D. F. Galletta, and K. M. Carley, “Individual Centrality and Performance in Virtual R&D Groups: An Empirical Study,” Manage Sci, vol. 49, no. 1, pp. 21–38, Jan. 2003. [CrossRef]
- A. Darko, A. P. C. Chan, X. Huo, and D. G. Owusu-Manu, “A scientometric analysis and visualization of global green building research,” Build Environ, vol. 149, pp. 501–511, Feb. 2019. [CrossRef]
- M. R. Hosseini, M. Maghrebi, A. Akbarnezhad, I. Martek, and M. Arashpour, “Analysis of Citation Networks in Building Information Modeling Research,” J Constr Eng Manag, vol. 144, no. 8, p. 04018064, May 2018. [CrossRef]
- N. Choudhury and S. Uddin, “Time-aware link prediction to explore network effects on temporal knowledge evolution,” Scientometrics, vol. 108, no. 2, pp. 745–776, Aug. 2016. [CrossRef]
- L. Waltman, N. J. van Eck, and E. C. M. Noyons, “A unified approach to mapping and clustering of bibliometric networks,” J Informetr, vol. 4, no. 4, pp. 629–635, Oct. 2010. [CrossRef]
- J. Yuan, K. Chen, W. Li, C. Ji, Z. Wang, and M. J. Skibniewski, “Social network analysis for social risks of construction projects in high-density urban areas in China,” J Clean Prod, vol. 198, pp. 940–961, Oct. 2018. [CrossRef]
- H. Park, S. H. Han, E. M. Rojas, J. Son, and W. Jung, “Social Network Analysis of Collaborative Ventures for Overseas Construction Projects,” J Constr Eng Manag, vol. 137, no. 5, pp. 344–355, Oct. 2011. [CrossRef]
- K. Giuffre, “Cultural Production in Networks,” International Encyclopedia of the Social & Behavioral Sciences: Second Edition, pp. 466–470, Mar. 2015. [CrossRef]
- T. J. Van Woudenberg et al., “Identifying Influence Agents That Promote Physical Activity Through the Simulation of Social Network Interventions: Agent-Based Modeling Study,” J Med Internet Res, vol. 21, no. 8, Aug. 2019. [CrossRef]
- Abdelalim, A.M.; Al-Sabah, R.; Salem, M.; Said, S.O.; Tantawy, M.; Ezz Al-Regal, M.R. Variations and Claims in International Construction Projects in the MENA Region from the Last Decade. Buildings 2024, 14, 2496. [CrossRef]
- M. A. H. Hassanen; Abdelalim, A. M., “Risk Identification and Assessment of Mega Industrial Projects in Egypt. Int. J. Manag. Commer. Innov. (IJMCI) 2022, 10, 187-199. [CrossRef]
- M. A. H. Hassanen; Abdelalim, A. M., “A Proposed Approach for a Balanced Construction Contract for Mega Industrial Projects in Egypt”. Int. J. Manag. Commer. Innov. 2022, 10, 217-229. [CrossRef]
- Abdelalim, A.M.; Essawy, A.; Alnaser, A.A.; Shibeika, A.; Sherif, A. Digital Trio: Integration of BIM–EIR–IoT for Facilities Management of Mega Construction Projects. Sustainability 2024, 16, 6348. [CrossRef]
- S. M. Abd El-Hamid; S. Farag; Abdelalim, A. M., ‘Construction Contracts’ Pricing according to Contractual Provisions and Risk Allocation’. Int. J. Civ. Struct. Eng. Res. 2023, 11, 11-38. [CrossRef]
- M. S. B. A. Abd El-Karim; O. A. Mosa El Nawawy; Abdelalim, A. M. “Identification and assessment of risk factors affecting construction projects”. HBRC J. 2017, 13, 202–216. [CrossRef]
- Khedr, R. and Abdelalim, A.M. (2021a) ‘Predictors for the Success and Survival of Construction Firms in Egypt’, International Journal of Management, Commerce and Innovation, 9, pp. 192–201.
- Khedr, R. and Abdelalim, A.M. (2021b) ‘The Impact of Strategic Management on Projects Performance of Construction Firms in Egypt’, International Journal of Management, Commerce and Innovation, 9, pp. 202–211.
|
Disclaimer/Publisher’s Note: The statements, opinions and data contained in all publications are solely those of the individual author(s) and contributor(s) and not of MDPI and/or the editor(s). MDPI and/or the editor(s) disclaim responsibility for any injury to people or property resulting from any ideas, methods, instructions or products referred to in the content. |
© 2024 by the authors. Licensee MDPI, Basel, Switzerland. This article is an open access article distributed under the terms and conditions of the Creative Commons Attribution (CC BY) license (http://creativecommons.org/licenses/by/4.0/).