
Submitted:
02 December 2024
Posted:
04 December 2024
You are already at the latest version
Abstract
Age is a major risk factor for primary open-angle glaucoma (POAG), an ocular disease associated with elevated intraocular pressure (IOP) due to the restricted outflow of aqueous humor fluid from the anterior chamber. This restriction is caused by an induction of fibrogenic pathways that increase deposition of extracellular matrix (ECM) and alter the contractile properties of trabecular meshwork (TM) cells. Integrins, a family of heterodimeric cell surface receptors that bind ECM, play a key role in regulating fibrogenic pathways. In this study, we investigated whether age-related changes in integrin subunit expression and activity signifies an early event in initiating fibrotic-like changes in the TM. TM cells were isolated from young and old human donor eyes. Flow cytometry, RT-PCR, and immunofluorescent microscopy revealed a significant decrease in α5 integrin expression in TM cells from older individuals. This loss was accompanied by an increase in activated, but not total αvβ3 integrin in focal adhesions. TM cells from older donors expressed higher levels of αSMA mRNA, assembled αSMA-containing stress fibers, and contracted collagen gels significantly more than young TM cells. TM cells from old donors also assembled higher levels of insoluble fibronectin fibrils and contained higher levels of the EDB+ isoform of fibronectin in their ECM. shRNA knockdown of α5 integrin subunits showed that the increase in αvβ3 integrin activity was due to lower levels of α5 integrin expression. These studies suggest that age-related dysregulation of α5β1 and αvβ3 integrin signaling may represent an important early molecular event in inducing fibrogenic pathways associated with POAG.
Keywords:
trabecular meshwork
; integrins
; contractility
; aging
1. Introduction
Age is a major risk factor for the pathogenesis of primary open angle glaucoma (POAG), which is the most common form of glaucoma [1,2]. POAG is caused by a restriction in the movement of aqueous humor (AH) fluid through the layers of the trabecular meshwork (TM) into Schlemm’s canal (SC) [3,4]. The restricted outflow of AH causes an elevation in intraocular pressure (IOP), which over time irreversibly damages the optic nerve and causes blindness. Age-related changes in the composition of the extracellular matrix (ECM) and the biomechanical compliance of the TM are thought to contribute to the reduction of AH flow and elevated IOP [5,6,7]. Yet, the mechanisms that trigger these changes remain unclear.
Changes in the ECM are sensed by various mechanosensory receptors on the TM cell surface, including a family of receptors called integrins. Integrins are transmembrane heterodimeric proteins consisting of an α and β subunit. At least 12 different integrins have been identified by either RNA or protein analysis in the TM/SC outflow pathway. In the TM/SC, integrins are found along the trabecular beams, in the juxtacanalicular region (JCT), and in cells along the inner wall of SC [8,9,10]. Most of the integrins appear to be ubiquitously expressed throughout all the cells in the TM/SC. However, some integrins show restricted expression patterns. Most notably, α6β1 and α9β1 integrins are found predominantly on cells lining the inner wall of SC [11,12,13]. Whether the expression patterns of integrins in the TM/SC change as we age is unclear. One early study using tissues obtained from donors 2 to 65 yrs old suggested that the pattern of integrin expression did not change [14]. However, another study indicated that the expression of the α5 integrin subunit may be downregulated in the TM/SC of older human eyes [15], which is consistent with that observed in other adult tissues [16]. Neither of these studies determined the activity of integrins.
A unique feature of integrins is that their activity is tightly regulated and rapidly fluctuates between an active and inactive state within sub-seconds on the cell surface [17,18,19]. Thus, not every integrin is active on the cell surface at the same time. This enables integrins to rapidly change their activity in response to changes in their microenvironment. The activity of an integrin is dependent on its conformation. Numerous studies have shown that an unoccupied integrin on the cell surface is in a low affinity, bent conformation with the cytoplasmic tails of the α and β subunits bound together by a salt bridge [20]. In contrast, the active integrin assumes an upright conformation and the α and β cytoplasmic tails become separated, allowing binding of cytoplasmic proteins and high affinity interactions with ECM proteins [21].
The activity of integrins is controlled by specific cytoplasmic and membrane proteins and mechanical forces (stretch and shear stress) [22,23,24,25,26], making them likely to be activated when shear stress is elevated by high IOP [4]. Once activated, integrins trigger actin structures that control the contractile properties of cells and regulate the activity of signaling pathways associated with endothelial-mesenchymal transition (EndoMT), fibrosis, TGFβ signaling, and senescence [27].
Several studies have shown that activation of the αvβ3integrin contributes to the fibrogenic phenotype of the TM/SC [28]. Activation of αvβ3 integrin drives the formation of cross-linked actin networks (CLANs) [29,30,31], the deposition of both EDA+ isoforms of fibronectin into the ECM [32], and expression of TGFβ2 [33], which are associated with POAG and glucocorticoid-induced glaucoma [34,35,36,37,38]. αvβ3integrin also regulates the distribution of a cytoplasmic protein Hic-5, which induces fibrogenic activity in TM cells [39]. Finally, activation of αvβ3 integrin has been shown to affect IOP and outflow facility in organ cultured anterior segments of porcine eyes and C57BL/6J mice [10]. Together, these studies provide strong evidence that activating αvβ3integrin leads to profibrotic-like changes in the TM associated with an elevated IOP.
However, the molecular events that trigger activation of αvβ3integrin and induction of these fibrogenic pathways that ultimately lead to POAG are yet to be elucidated. In this study, we investigated the age-dependent expression of integrins and correlated these changes with integrin activity, cellular contractile properties, and assembly of fibronectin fibrils in human TM cells isolated from young and old normal donor eyes. This study shows that TM cells isolated from old donor eyes have lower levels of α5β1 integrin expression compared to TM cells isolated from younger donor eyes. This decrease in the expression of α5β1 integrin is accompanied by an increase in the activity of αvβ3 integrin. Older TM cells are also significantly more contractile, express higher levels of αSMA mRNA, assemble αSMA+ stress fibers, and form more focal adhesions containing activated αvβ3 integrin. Cultures of older TM cells also assemble more EDA+ and EDB+ isoforms of fibronectin into the ECM. These phenotypes are consistent with old TM cells initiating EndoMT and inducing fibrogenic pathways that may ultimately lead to development of fibrotic-like glaucomatous TM.
2. Materials and Methods
2.1. Cell Culture
Human TM cells were isolated from either corneal rims or whole globes of cadaver eyes as previously described [40,41] and in accordance with the tenets of the Declaration of Helsinki. Donor eyes and corneal rims were obtained from both the Lions Eye Bank of Wisconsin and Lions VisionGift, Portland, OR. Tissues from both males and females were used and all donors were Caucasian with no known history of ocular disease. The sex, age, and cause of death of specific donors is indicated in Table 1. All the TM cell strains upregulated myocilin in response to dexamethasone (Fig. S1) and were judged to be TM cells based upon criteria previously described [42]. The specific cell strains used for the experiments are indicated in the Figures. All cells were between passages 5-8. For most experiments, cells were grown in low glucose Dulbecco’s Modified Eagle’s Medium (DMEM Sigma-Aldrich) supplemented with 15% fetal bovine serum (FBS, Avantor-VWR), 2% L-glutamine (Sigma-Aldrich), 1% amphotericin B (Corning), 0.05% gentamycin (Sigma-Aldrich), and 1 ng/mL FGF-2 (Peprotech) as previously described [30,43]. Where noted in some experiments, cells were grown in medium glucose DMEM rather than low glucose DMEM.
2.2. RNA Isolation and RT-qPCR
Total RNA was isolated from TM cultures one week post-confluence using RNeasy Plus Mini Kit (Qiagen Inc, Germantown, MD), or TRIzol (Invitrogen), and reversed transcribed into cDNA using the High-capacity cDNA reverse transcription kit (Applied Biosystems, Waltham, MA) according to the manufacturer’s instructions. RT-qPCR was performed using an Applied Biosystems QuantStudio 6 Pro Real-Time PCR system and PowerUp SYBR green master mix (Thermo Fisher Scientific) as we described [44]. Primer-BLAST (https://www.ncbi.nlm.nih.gov/tools/primer-blast/) was used to design the primers that spanned an intron-exon junction whenever possible and were made by IDT (Coralville, IA). The primers used are shown in Table S2.
2.3. Flow Cytometry
Flow cytometry was performed as previously described [9,45]. Briefly, TM cells were lifted with Cell Dissociation Solution Non-enzymatic (Sigma-Aldrich) and labeled for 1 h at room temperature with 10µg/mL α2 (16B4), α4 (HP2/1), α5 (P1D6), α9 (Y9A2), β1 (12G10) and β3 (LM609) integrin antibodies (Table S3) in 1% BSA + PBS. Cells were then washed and labeled with an Alexa 647-conjugated rabbit anti-mouse IgG (Thermo Fisher Scientific) diluted 1/400 in 1% BSA + PBS for 45 min on ice. Labeled cells were washed, resuspended in 1% BSA + PBS, and then strained with a 40-70 µm strainer to remove clumps. Cells were analyzed with the Cytek® NL™-3000 flow cytometer and the SpectroFlo® program. FlowJo™ version 10.1 was used to analyze and graph the results. Unlabeled cells kept in 1% BSA + PBS were used as a control for autofluorescence.
2.4. Cell Spreading Assay
TM cells were plated onto coverslips precoated with 5µg/ml of human type I collagen (CC050; Millipore Sigma) at a density of 3x10⁴ cells/well and incubated for 3 h. Cells were fixed with 4% paraformaldehyde + PBS for 20 min, followed by a permeabilization step with 0.5% Triton X-100 + PBS for 2 min. The cells were blocked in 1% BSA + PBS for 30 min at room temperature and then labeled with the primary [BV3] and LIBS2 antibodies listed in Table S3 for 1 h at room temperature. The primary antibodies were diluted to 10µg/ml in 0.1% BSA + PBS. Cells were then washed with PBS and primary antibodies were detected with either Alexa 546-conguated goat anti-mouse or goat anti-rabbit IgG antibodies. Cells were also labeled with Alexa 488-conjugated phalloidin and Hoechst 33342 to detect actin filaments and nuclei, respectively. The coverslips were mounted onto slides using Shandon™ Immu-mount (ThermoFisher Scientific). Labeled cells were imaged using a Zeiss Imager.M2 fluorescence microscope together with Zen image acquisition software version 3.079.(ThermoFisher Scientific).
To detect α-SMA+ stress fibers, TM cells were plated at a density of 3x10⁴ cells/well on coverslips coated with 100ug/ml bovine type I collagen solution (5010; Advanced Biomatrix) for 3 h. Cells were fixed and permeabilized with ice-cold methanol for 15 min at -20⁰C. Cells were blocked in 1% BSA + PBS for 30 min at room temperature and then labeled with 2µg/ml α-SMA primary antibody (Table S3) for 1 h at room temperature. Cells were washed with PBS and labeled with Alexa 546-conguated goat anti-rabbit IgG antibody. Cells were also labeled with Hoechst 33342 to detect nuclei. Coverslips were mounted and imaged as described above.
2.5. Immunohistochemistry of Integrins in the Anterior Segment
Anterior segments were isolated, cut into wedges, fixed with 4% paraformaldehyde, and embedded in paraffin as previously described [46]. None of the donor tissues used for immunohistochemistry had a history of glaucoma. Sagittal tissue sections 5 µm thick were deparaffinized in xylenes and rehydrated through a series of 100–50% ethanol solutions followed by 95 °C antigen retrieval using R-Universal epitope recovery buffer (Electron Microscopy Sciences, Hatfield, PA). Sections were blocked with CAS-block histochemical reagent (Invitrogen) and labeled overnight at 4 °C with primary antibodies to integrins α5 (clone 10F6) or αvβ3 (clone [BV3]). Serial sections were also labeled with a negative control antibody against β-galactosidase (Table S3). Primary antibodies were detected using Alexa 546-conjugated goat anti-mouse IgG. Nuclei were labeled with Hoechst 33342. Sections were washed with PBS and mounted with a glass coverslip using Shandon™ Immu-mount (ThermoFisher Scientific). Labeled sections were imaged using a Zeiss Imager.M2 fluorescence microscope together with Zen image acquisition and processing software version 3.079. Z-stacks were obtained from each section, and each stack was then processed using deconvolution. An orthogonal projection of a subset of the images within each stack was generated to create a single image.
2.6. Collagen Contraction Assay
Collagen gels were prepared by mixing rat tail type I collagen (354249; Corning) with an equal volume of 100 mM HEPES/2× PBS on ice. DMEM was then added until the final concentration of collagen was 1.25 mg/ml. Collagen gels were poured into individual 35 cm plates and allowed to solidify at 37 °C for 40 min. 1.5 × 10⁶ cells were seeded on the gels in DMEM and were allowed to attach for 24 h. After 24 h, the gels were detached from the side of the dish with a pipette tip, and changes in the diameter of the gel were measured at 0, 0.5, 1, 2, 4, and 24 h. A control gel with no cells seeded was also measured to account for any diameter changes not caused by cell contraction.
2.7. shRNA Knockdown of α5 Integrin Expression
N25 cells were plated 50,000 cells/well into a 12-well plate. When the cells reached 70-80% confluency, cells were transduced with lentivirus containing shRNA against α5 integrin (MISSION® lentiviral particles clone ID TRCN0000029653 Sigma-Aldrich) at an MOI of 50. Twenty-four hours later, transduced cells were selected using 1.5mg/ml G418 sulfate (Corning, 61-234-RG). Transduced cells were maintained under selection for the duration of the experiments. Seventy-two hours after transduction, some surviving cells were harvested for RNA isolation and RT-qPCR analysis as described above. RT-qPCR was performed using primers against α5 integrin and HPRT1 for the housekeeping gene (Table S2). Other surviving cells were lysed after 6 days for western blot analysis as described below. N25 cells that were not transduced were used as a control for RNA and protein analysis. Cells used in the cell spreading assays were fixed with 2% paraformaldehyde + PBS for 20 min, followed by a permeabilization step with 0.1% Triton X-100 + PBS for 2 min and then processed as described above.
2.8. Western Blot Analysis
TM cells were lysed with 25mM HEPES, pH 7.4 buffer containing 150 mM NaCl, 1 mM EDTA, 1 mM NaF, 1% NP-40, 0.25% deoxycholate, HALT phosphatase inhibitor cocktail, and HALT protease inhibitor cocktail (Thermo Fisher Scientific, Inc.) as previously described [45]. Cell lysates were centrifuged at 10,000 x g for 10 min at 4oC and run on a 10%-SDS-PAGE gel. Proteins were transferred to a nitrocellulose membrane (Bio-Rad Laboratories). The membrane was blocked in 3% BSA/tris buffered saline (TBS) overnight at 4 °C and then incubated with the primary antibody in 1% BSA/TBS/0.1% Tween-20 for 1 h. Membranes were washed with TBS/0.1% Tween-20 and incubated for 1 h with a secondary antibody. Labeled bands were visualized and quantified using LI-COR Image Studio v. 5.0.21 software (Li-Cor Biosciences, Lincoln, NE, USA).
2.9. On-Cell Western (OCW)
OCWs were performed as previously described [47] with some modifications. TM cells were plated into 96-well plates at a density of 3.0 x 10⁴ cells/well in medium glucose DMEM + 10% FBS and maintained for 7 days prior to OCW analysis. Cell monolayers were either left intact or were extracted with hypotonic lysis buffer (20 mM HEPES, pH 7.4 + 1mM EDTA + 1X HALT protease inhibitors + 1.5% deoxycholate (DOC) for 5 min. Cell layers were then fixed with 4% paraformaldehyde + PBS for 20 min. Intact and extracted monolayers were then labeled with either mAb BC-1 (EDB+ fibronectin), mAb Ist-9 (EDA+fibronectin), or mAb Ist-4 (total fibronectin). Total protein levels in both intact and extracted cell monolayers were determined by labeling the wells with IRDye 680RD NHS ester (LI-COR). Fibronectin-labeled wells were blanked against negative control wells labeled with a monoclonal antibody against β-galactosidase and then normalized against the total protein content within each respective well. Bound primary antibody was detected with IRDye 800CW-conjugated goat-anti-mouse IgG (LI-COR). Quantification of the signals at 700 and 800 nm, respectively, was performed using a LI-COR Odyssey CLx infrared scanner running Image Studio version 5.0.21 software.
2.10. Data Analysis
Data are presented as mean ± SEM. Statistical comparisons were done using either a t-test, or a one-way ANOVA plus the post-hoc Tukey HSD test, with a p-value < 0.05 being considered statistically significant. Fold changes in gene expression were performed according to the ΔΔCt method. The RT-qPCR data was normalized using either gene succinate dehydrogenase complex subunit A (SDHA), or hypoxanthine phosphoribosyltransferase 1 (HPRT1) as reference genes.
3. Results
3.1. Loss of α5 Integrin Expression in Trabecular Meshwork Cells from Older Donor Eyes
While many studies have documented the fibrotic-like changes in the ECM in TM tissue derived from glaucoma patients [7,48], few studies have investigated differences in the expression profile of integrins between young and old human TM and how their expression would affect the ECM and contractile properties of aging TM cells. In this study, we examined the expression profile of α4, α5, α9, β1 and β3 integrin subunits in TM cells isolated from young and old donor eyes. These studies showed a striking difference in the expression profile of α5β1 integrins in young versus old TM cells. By flow cytometry, there is a decrease in α5 integrin expression on the cell surface in two of the older TM cell strains from donor eyes 74 and 77 yrs old (N74 and N77; Figure 1). In contrast, a third cell strain, from a 75-yr old donor eye (N75), had similar levels of α5 integrin as two young TM cell strains derived from donor eyes ages 17 and 27 (N17 and N27). Neither the β1 nor β3 integrin subunits showed an age-related difference in expression. We also didn’t see a difference in expression in either the α2, α4, or α9 integrin subunits in these young and old cell strains (Fig. S2). Since the α5 integrin subunit only pairs with the β1 integrin subunit, this suggests that the major fibronectin binding integrin α5β1 is downregulated in some, but not all, old TM cells.
To see if a decrease in α5 integrin expression was limited to cells isolated from a few donor eyes, we examined the mRNA levels of the α5 and β3 integrin subunits in TM cells isolated from 13 young and 8 old biological replicates (Table S1). As shown in Figure 2, TM cells isolated from older tissues showed statistically (p<0.05) lower levels of the mRNA for the α5 integrin subunit compared to young donor TM cell strains (Figure 2A). Surprisingly, the levels of the β3 and β1 integrin mRNAs were statistically (p<0.05) elevated in older TM cells (Figure 2B-C), even though the protein levels appeared similar among the young and old cells by flow cytometry (Figure 1). These studies also saw a statistically significant increase in α4 integrin mRNA levels in TM cells from older donor eyes (Fig.S2B). In contrast, the mRNA levels for the α2 and α9 integrin subunits did not appear to change (Fig. S2A, B and D). Thus, the mRNA expression levels of some integrins appear to vary greatly as we age, which can have large effects on the ability of TM cells to engage the ECM and/or transmit biomechanical signals.
We saw a similar trend when we compared α5 integrin labeling in the TM/SC of young versus old human eyes. As shown in Figure 3A, the TM/SC is located in the anterior segment of the eye. It consists of several fenestrated beams covered with TM cells, a region with TM cells embedded in a dense ECM (JCT), and a monolayer of cells that form the inner and outer wall of SC (Figure 3B). A typical section of the TM/SC is shown in Figure 3C. Immunolabeling studies on tissue from younger individuals showed α5 integrin expression throughout the TM, in the JCT, and in cells along SC (Figure 3D & 3F). In contrast, TM from an old anterior segment, which was the same tissue used to make the N74 cell strain, showed decreased expression of α5 integrin in the TM, particularly in the JCT region (Figure 3G & I). The downregulation of α5 integrin expression appeared to be specific for the TM since α5 integrin expression was still observed in the inner wall of SC in both young and old eye tissues. This decrease was not due to a loss in cell numbers as the number of nuclei were similar. As expected, we did not see any differences in β3 integrin labeling of young and old tissues (Fig. S3). Panels 3E and H were labeled with an anti-β-galactosidase antibody and used as a control for primary antibody labeling.
3.2. Trabecular Meshwork Cells from Older Donors Are More Contractile than Cells from Younger Donors
We next examined if the age-related decrease in α5 integrin expression affected the contractile properties of TM cells. For this, we used two α5-positive young TM cell (N17 and N27) and two old TM cell strains (N74 and N77) that lack α5 integrin (Figure 1) in a collagen gel contraction assay. These studies show that the α5-negative N74 and N77 TM cells were statistically more contractile than the α5-positive N17 and N27 TM cells. Within minutes of releasing the collagen gel from the plate, the old α5-negative cells contracted the gel by ~13% compared to the control gel, while the α5-positive young TM cells only contracted the gel by 3% (Figure 4A-B). By 24 h, we saw a 60% decrease in the diameter of the gel with the old cells compared to the control gels. In contrast, we saw a 35% decrease observed with young cells. Thus, α5-negative older cells were more contractile then α5-positive young cells.
To test the hypothesis that α5 integrin expression affected cell contractility, we compared the old cells (N74 and N77) that express lower levels of the α5 integrin subunit compared to the old N75 and all three young TM cell strains that were found to express higher levels of the α5 integrin subunit on their cell surface by flow cytometry (Figure 1, Table 1). Figures 4C and D show that N75 TM cells that express the α5 integrin are statistically less contractile than N74 and N77 cells that express low levels of the α5 integrin subunit. This provides further support for the hypothesis that the decreased α5 integrin expression is driving the enhanced contractility of older TM cells.
Next, we wanted to determine if the decreased expression of α5 integrin in older cells was accompanied by higher levels of αSMA. αSMA plays a pivotal role in cell contraction and is considered one of the markers of EndoMT associated with fibrosis and the pathogenesis of POAG [2,3]. Using immunofluorescence microscopy, we saw an increase in the localization of αSMA within stress fibers in α5-negative N77 TM cells compared to the α5-positive N27-2 TM cells (Figure 4E-F) in which αSMA was diffusely localized throughout the cells. This further suggests that older cells are more contractile than younger TM cells, which is consistent with the collagen gel contraction assay (Figure 4A). When we examined the larger population of TM cells, we also saw a statistically significant increase in the levels of αSMA mRNA in older cells (Figure 4G), further suggesting that an increase in αSMA expression may occur during aging as expression of the α5 integrin subunit decreases.
3.3. Old Trabecular Meshwork Cells Exhibit Differences in αvβ3 Integrin Activity Compared to Young Trabecular Meshwork Cells
Since integrins, in particular α5β1 and αvβ3, are found in focal adhesions (Figure 5A) and are thought to drive cell contraction and formation of stress fibers [17,28,49], we then looked to see if the expression of these integrins in focal adhesions varied in the young and old TM cells plated on collagen. For this, the young α5-positive N27-2 TM cells and the old α5-negative N77 TM cells were plated onto collagen-coated coverslips for 3h and levels of integrin localization in focal adhesions were determined by immunofluorescence microscopy. As shown in Figure 5B, both young and old TM cells plated on collagen for 3h had very robust focal adhesions that contained αvβ3 integrins. We did not detect any differences in the number of cells containing αvβ3 integrins in focal adhesions (Figure 5B and C). As expected, we did not see any labeling for α5β1 integrins in focal adhesions since α5β1 integrin does not bind collagen (data not shown). Nor did we see any labeling for α2β1 integrin in focal adhesions (data not shown). Together, these data support the idea that the contractile properties of the cells and stress fiber formation on collagen were being mediated by αvβ3 integrins, as previously shown [50].
We then looked to see if there was a difference in αvβ3 integrin activity that could account for the observed differences in cell contractility. Using the LIBS2 monoclonal antibody (mAb) that detects the active upright form (Figure 5A) of αvβ3 integrin [51], we found that the active form of αvβ3 integrin was more prevalent in focal adhesions in old N77 TM cells compared to young N27-2 cells (Figure 5B and D). Many of the focal adhesions in old cells appeared larger and reminiscent of supermature focal adhesions reported to occur in myofibroblasts [52]. This increase in active αvβ3 integrin levels in old TM cells was not due to an increase in total αvβ3 integrin protein levels since both young N27 and old N74 and N77 cells showed similar levels of the β3 integrin subunit by flow cytometry (Figure 1). Also, similar levels of αvβ3 integrin-labeled focal adhesions were detected using mAb [BV3], which detects total αvβ3 integrin. Thus, there appears to be an increase in the activity of αvβ3 integrin in old TM cells compared to younger cells concomitant with the loss of α5β1 integrin expression. Flow cytometry supports this idea and showed that ~40% of the old α5-negative TM cells contain activated αvβ3 integrins on their cell surface compared to ~20% of the α5-positive young TM cells (Fig. S4).
3.4. Decreased α5 Integrin Expression in Young Trabecular Meshwork Cells Results in Increased αvβ3 Integrin Activity
Next, we wanted to see if a decrease in α5 integrin mRNA levels would affect either β3 integrin expression or activity as suggested by the contractility and cell spreading assays. For this, we used a lenti-shRNA viral vector to knockdown the α5 integrin subunit in young TM cells. As shown in Figure 6, an MOI of 50 resulted in a 60% knockdown of the α5 integrin mRNA and a statistically significant 50% decrease in expression of the α5 integrin subunit by Western blot analysis. As expected, there was no effect on the protein level of the β3 integrin subunit (Figure 6D). Not surprisingly, we also did not see any differences in the level of total αvβ3 integrin expressed in focal adhesions in cells plated on collagen (Figure 6E). Thus, reduced α5 integrin levels did not appear to affect total β3 integrin levels, or assembly of αvβ3 integrin into focal adhesions (Figure 6F). Knockdown of the α5 integrin subunit did, however, affect the activity of the β3 integrin subunit. Cell spreading assays clearly showed that there was a statistically significant increase in the levels of activated αvβ3 integrin in focal adhesions of cells when α5 integrin was knocked down compared to control cells (Figure 6G).
3.5. Old Trabecular Meshwork Cells Exhibit Increased Assembly of Fibronectin Fibrils and Expression of the EDB Isoform of Fibronectin
Finally, we examined the effect of an age-related decrease in α5β1 integrin expression on the formation of fibronectin fibrils. The α5β1 integrin is the major integrin involved in the assembly of fibronectin fibrils [53], and a loss of α5β1 integrin would be expected to impair fibronectin fibril formation. To investigate the effects of integrin switching on fibronectin assembly, we used an on-cell western (OCW) technique to quantitate the levels of fibronectin fibrils in the matrix. Figure 7A shows that TM cells from the 3 old donors (N74, N75 and N77 yrs old) assembled a greater level of fibronectin fibrils compared to cultures of TM cells isolated from young α5-positive donor eyes (25-27 yrs old). The fibronectin matrices from old TM cells not only contained statistically higher levels of the EDA+ isoform of fibronectin in the insoluble matrix (Figure 7A), but the levels the EDB+ fibronectin isoform were also statistically (p<0.05) increased. The observed increase in the assembly of EDA+ and EDB+ fibronectin into fibrils was not specifically due to lower levels of α5 integrin expression since the old α5-positive N75 TM cell strain also showed higher levels of EDA+ and EDB+ fibronectin in the insoluble fibrils (Figure 7B). Interestingly, this age-dependent increase in fibronectin matrices was not due to an age-dependent increase in total fibronectin mRNA levels or the EDA+ isoform of fibronectin (Figure 7C). This suggests that the increase in fibronectin was probably at the translational level, not transcriptional level. In contrast, the increased expression of the EDB+ isoform of fibronectin in TM cells isolated from older donor eyes was due, at least in part, to higher levels of EDB+ fibronectin mRNA (Figure 7C), suggesting that it is upregulated at the transcriptional level during aging. Increases at the translational level for EDB+ fibronectin cannot be excluded, however.
4. Discussion
In this study, we showed that the expression profile of α5β1 and αvβ3 integrins in human TM cells and tissues changes with aging and this affects the contractile properties of TM cells. We also found that a decrease in the expression of α5 integrin subunit in old individuals appears to trigger an increase in the activity of αvβ3 integrin. This gain-of-function in αvβ3 integrin activity is associated with a statistically significant increase in the assembly of αSMA+ stress fibers, an increase in αSMA mRNA levels, the appearance of activated αvβ3 integrins in focal adhesions, and increased levels of the EDB+ isoform of fibronectin. This suggests that an age-related switch in integrin signaling alters the contractile properties of old TM cells and may be an early step in triggering the fibrogenic pathways associated with EndoMT in the aged TM/SC (Figure 8).
Interestingly, activation of αvβ3 integrin is believed to be a prerequisite for the formation of αSMA-containing stress fibers during the differentiation of myofibroblasts [52], which leads to the development of epithelial mesenchyme transition (EMT) and EndoMT [54,55]. Given that EndoMT is believed to contribute to the increased rigidity of the TM/SC tissue and alter the pressure-dependent contractile properties of the TM/SC pathway to control IOP [4], this suggests that a switch in activity from α5β1 to αvβ3 integrin likely contributes to the pathogenesis of the contractile-fibrotic phenotype that is characteristic of POAG.
In addition to causing an increase in αvβ3 integrin activity and contractility, an age-related decrease in α5-integrin could interfere with a TM cell’s ability to detect IOP-induced biomechanical changes to the ECM. Our previous study showed that α5β1 integrins are localized at the tips of filopodia in TM cells [56], while αvβ3 integrins are located at discrete areas along the filopodial shaft as well as the tip. Filopodia are highly dynamic, mechanosensing cellular structures that extend from the cell surface and form transient adhesions with the ECM as a way to probe a cells microenvironment. The localization of α5β1 integrin at these tips suggest that α5β1 integrin is needed to form these transient adhesions and promote filopodia elongation in TM cells. Hence, a loss of α5β1 integrin in the aged TM would reduce the capacity for cells to detect IOP-induced changes to the microenvironment.
What causes the decrease in α5 integrin expression in the TM is still unknown. In human retinal pigment epithelial (RPE) cells, as well as human and rabbit corneal epithelial cells, expression of the α5 integrin subunit and its promoter activity is downregulated as the cells become quiescent [57] due to an apparent alteration in the ratio of transcription factors that activate or repress α5 integrin expression [58,59]. This relationship between age-related diseases and expression of transcriptions factors is well established [60,61] and could represent an early step in the development of POAG.
Our studies further suggest that there is a certain level of inactive αvβ3 integrin existing on the TM cell surface and that a decrease in expression of α5β1 integrin may be contributing to the activation of those αvβ3 integrins. By flow cytometry and immunofluorescence microscopy, we could not detect any differences in the levels of total αvβ3 integrin expression on the cell surface or in focal adhesions between young and old TM cell strains. Yet, in older TM cells expressing lower levels less α5β1 integrin, there was a noticeable increase in the level of active αvβ3 integrins in focal adhesions (Figure 6G) and on the cell surface of older cells (Fig. S4). The cause for this increase is unknown. A unique function of integrins is that their expression and activity is tunable within subseconds in a spatiotemporal manner [62,63,64]. This occurs in response to biomechanical changes in their microenvironment and the expression of other integrins [17,65,66,67]. Hence, a change in α5 integrin expression could be triggering the increase in αvβ3 integrin activity.
A switch in integrin signaling caused by a change in the expression of another integrin is not unexpected and could trigger the increase in αvβ3 integrin activity in old TM cells [68]. Studies in K562 erythroleukemia cells showed that expression of αvβ3 integrin inhibited α5β1 integrin activity [69]. Studies in a β1-null GD25 mouse embryonic fibroblast line showed that the αvβ3 integrin took over the role of β1 integrins in mediating focal adhesion formation and re-expression of the β1 subunit reversed the effect [70]. More recently, this phenomenon has been observed to occur in cancer tissues [71] and to be associated with EMT in cancer cells, a transition similar to EndoMT [72]. Together, these studies show that crosstalk between integrin subunits regulates their expression and/or activity.
In the TM, a gain in αvβ3 integrin activity could contribute to the pathogenesis of the fibrotic phenotype characteristic of EndoMT associated with aging TM/SC tissues and POAG (2, 7, 48). An increase in αvβ3 integrin activity has been shown to drive expression of TGFβ2 in TM cells [33], promote the formation of CLANs [29,30], and enhance fibronectin fibrillogenesis [32], which are upregulated in POAG. αvβ3 integrin is also a receptor for connective tissue growth factor (CTGF) in TM cells [73], which is involved in up-regulating expression of ECM proteins in fibrosis [74]. αvβ3 integrin is also associated with senescence in human diploid fibroblasts [75] which is reported to occur in glaucomatous TM [76]. Thus, an increase in αvβ3integrin activity may enhance the susceptibility of people to develop glaucoma.
Although previous studies have noticed age-related changes in α5β1 integrin expression in quiescent cultures of RPE cells [57], and HT1080 human fibrosarcoma fibroblasts [77], to date only one other study has reported an age-related change in integrin expression in the TM [15]. Interestingly, α5β1 integrins also appeared to be absent in the RPE in vivo in tissue from older individuals (>50 yrs old), suggesting an age-related downregulation in the retina [78]. Further studies are needed to investigate whether additional ocular tissues show a similar age-related decrease in α5β1 integrin expression.
These studies also observed an increase in the formation of an insoluble fibronectin matrix in old TM cell strains. However, this did not appear to be due to a loss of the α5 integrin subunit since the old α5-positive N75 cell strain also showed these changes. Interestingly, we also saw increased expression of the EDB+ isoform of fibronectin in the matrix as well as EDA+fibronectin. The expression of EDB+ fibronectin is intriguing since it has been observed to occur in stiffer ECMs as a result of enhanced alternative splicing of fibronectin [79]. This suggests that the ECM made by old TM cells may be stiffer. In addition, since EDB+ fibronectin appears to be upregulated in TM cell cultures overexpressing a constitutively active αvβ3 integrin [32], and EDB+ fibronectin binds and activates the αvβ3 integrin [80], this suggests that activation of αvβ3 integrin and expression of EDB+ fibronectin may be connected. Whether activation of αvβ3 integrin is responsible for EDB+ fibronectin expression, or vice versa, remains to be determined.
In summary, these studies suggest that an age-related dysregulation of α5β1 and αvβ3 integrin signaling may represent a key early event in inducing the transition into an αSMA-producing, myofibroblast-like, contractile TM cell. Interestingly, this switch did not occur in all the old cell strains we examined. Future studies examining integrin profiles in glaucomatous tissues, and factors controlling the downregulation of α5β1 integrin expression in the TM, should enhance our understanding of why some older individuals are more susceptible to developing this phenotype and its role in POAG.
Supplementary Materials
The following supporting information can be downloaded at: www.mdpi.com/xxx/s1, Table S1: Donor Eyes used in this study. Table S2: Primers used for RT-qPCR. All sequences are given in the 5′ to 3′ direction. Table S3: Primary Antibodies used for Flow Cytometry or Immunofluorescence Analyses. Figure S1: Characterization of myocilin expression in the 3 old TM cell (N74, N75, N77) and three young cell (N27-2, N27, N25) strains. Figure S2: Levels of α2, α4, and α9 integrin subunits in young and old TM cells. Figure S3: Immunolabeling for αvβ3 integrin in anterior segments from young and old eyes. Figure S4: Dot plots of the percentage of N27-2 and N77 expressing α5β1, αvβ3 or activated αvβ3 integrins.
Author Contributions
Conceptualization, K.E.K. and D.M.P.; funding acquisition, K.E.K. and D.M.P., formal analysis, K.L.J., J.A.F., M.S.F. and N. S. S., methodology, K.L.J., J.A.F., M.S.F., Y.Y.S., K.E.K. and D.M.P. ; validation, K.L.J., J.A.F. and M.S.F.; investigation, K.L.J., J.A.F. M.S.F. and Y.Y.S.; resources, K.E.K. and D.M.P.; writing—original draft preparation, K.L.J., J.A.F., M.S.F., K.E.K. and D.M.P.; writing—review and editing, K.L.J., J.A.F., M.S.F., K.E.K. and D.M.P.; visualization, K.L.J., J.A.F., M.S.F. and K.E.K.; supervision, K.E.K. and D.M.P.; project administration, K.E.K. and D.M.P. All authors have read and agreed to the published version of the manuscript.
Funding
This work was funded in part by NIH/NEI grants R01EY017006 (DMP), R01EY032905 (DMP), P30 EY016665 (DMP), R01EY019643 (KEK), R01EY032590 (KEK), P30 010572 (KEK), and an unrestricted grant to the Casey Eye Institute from Research to Prevent Blindness, NY (KEK).
Institutional Review Board Statement
Not applicable. Studies did not involve human or animal subjects.
Informed Consent Statement
Not applicable. Studies did not involve human subjects.
Data Availability Statement
The data presented in this study are available on request from the corresponding author.
Acknowledgements
The authors thank the University of Wisconsin Translational Research Initiatives in Pathology laboratory (TRIP) for their assistance with histology studies, and the Lions Eye Bank of Wisconsin and Lions VisionGift, Portland, OR, which aided procurement of cadaver eyes.
Conflicts of Interest
None
References
- B. T. Gabelt, P. L. Kaufman, Changes in aqueous humor dynamics with age and glaucoma. Prog Retin Eye Res 24, 612-637 (2005). [CrossRef]
- B. Liu, S. McNally, J. I. Kilpatrick, S. P. Jarvis, C. J. O’Brien, Aging and ocular tissue stiffness in glaucoma. Survey of Opthalamol 63, 56-74 (2018).
- B. M. Braunger, R. Fuchshofer, E. R. Tamm, The aqueous humor outflow pathways in glaucoma: A unifying concept of disease mechanisms and causative treatment. Eur J Pharm Biopharm 95, Part B, 173-181 (2015). [CrossRef]
- M. Johnstone et al., Aqueous outflow regulation—21st century concepts. Prog Retin Eye Res 83 (2021). [CrossRef]
- T. S. Acott, M. J. Kelley, Extracellular matrix in the trabecular meshwork. Exp Eye Res 86, 543-561 (2008). [CrossRef]
- J. A. Vranka et al., Biomechanical rigidity and quantitative proteomics analysis of segmental regions of the trabecular meshwork at physiologic and elevated pressures. Invest. Ophthalmol. Vis. Sci. 59, 246-259 (2018). [CrossRef]
- K. E. Keller, D. M. Peters, Pathogenesis of glaucoma: Extracellular matrix dysfunction in the trabecular meshwork—A review. Clin Exp Ophthalmol 50, 163-182 (2022). [CrossRef]
- L. Zhou, I. Maruyama, L. Yuhong, E. L. Cheng, B. Y. J. T. Yue, Expression of integrin receptors in the human trabecular meshwork. Curr Eye Res 19, 395-402 (1999).
- D. Gagen, M. S. Filla, R. Clark, P. Liton, D. M. Peters, Activated αvβ3 integrin regulates αvβ5 integrin-mediated phagocytosis in trabecular meshwork cells. Invest Ophthalmol Vis Sci 54, 5000-5011 (2013).
- J. A. Faralli, M. S. Filla, D. M. Peters, Effect of αvβ3 integrin expression and activity on intraocular pressure (IOP). Invest Ophthalmol Vis Sci 60, 1776-1788 (2019). [CrossRef]
- S. S. VanderWyst, K. M. Perkumas, A. T. Read, D. R. Overby, W. D. Stamer, Structural basement membrane components and corresponding integrins in Schlemm’s canal endothelia. Mol. Vis. 17, 199-209 (2011).
- D.-Y. Park et al., Lymphatic regulator PROX1 determines Schlemm’s canal integrity and identity. J Clin Invest 124, 3960-3974 (2014).
- T. van Zyl et al., Cell atlas of aqueous humor outflow pathways in eyes of humans and four model species provides insight into glaucoma pathogenesis. Proc Natl Acad Sci USA 117, 10339-10349 (2020).
- L. L. Zhou, I. Maruyama, Y. H. Li, E. L. Cheng, B. Yue, Expression of integrin receptors in the human trabecular meshwork. Curr Eye Res 19, 395-402 (1999).
- K. Tervo, T. Paallysaho, I. Virtanen, T. Tervo, Integrins in human anterior chamber angle. Graefes Arch Clin Exp Ophthalmol 233, 291-295 (1995). [CrossRef]
- I. Virtanen et al., Integrins in human cells and tumors. Cell Diff Dev 32, 215-228 (1990).
- J. Z. Kechagia, J. Ivaska, P. Roca-Cusachs, Integrins as biomechanical sensors of the microenvironment. Nat Rev Mol Cell Biol 20, 457-473 (2019). [CrossRef]
- J. A. Faralli, M. S. Filla, D. M. Peters, Integrin crosstalk and its effect on the biological functions of the trabecular meshwork/Schlemm’s canal. Front Cell Dev Biol 10, 886702 (2022). [CrossRef]
- M. S. Filla, J. A. Faralli, J. L. Peotter, D. M. Peters, The role of integrins in glaucoma. Exp Eye Res 158, 124-136. (2017). [CrossRef]
- J. Takagi, T. A. Springer, Integrin activation and structural rearrangement. Immunol Rev 186, 141-163. (2002).
- J. Zhu, B. Boylan, B.-H. Luo, P. J. Newman, T. A. Springer, Tests of the extension and deadbolt models of integrin activation. J Biol Chem 282, 11914-11920 (2007).
- K. R. Legate, R. Fassler, Mechanisms that regulate adaptor binding to β-integrin cytoplasmic tails. J Cell Sci 122, 187-198. (2009).
- D. Bouvard, J. Pouwels, N. De Franceschi, J. Ivaska, Integrin inactivators: balancing cellular functions in vitro and in vivo. Nat 14 (2013).
- M. A. del Pozo et al., Phospho-caveolin-1 mediates integrin-regulated membrane domain internalization. Nat Cell Biol. 7, 901-908 (2005).
- E. Tzima, M. Angel del Pozo, S. J. Shattil, S. Chien, M. A. Schwartz, Activation of integrins in endothelial cells by fluid shear stress mediates Rho-dependent cytoskeletal alignment. EMBO J 20, 4639-4647 (2001).
- X. Sun, Y. Fu, M. Gu, Y. Zhu, Activation of integrin α5 mediated by flow requires its translocation to membrane lipid rafts in vascular endothelial cells. Proc Natl Acad Sci USA 113, 769-774 (2016).
- S. W. Moore, P. Roca-Cusachs, M. P. Sheetz, Stretchy proteins on stretchy substrates: the important elements of integrin-mediated rigidity sensing. Dev Cell 19, 194-206 (2010). [CrossRef]
- J. A. Faralli, M. S. Filla, D. M. Peters, Role of integrins in the development of fibrosis in the trabecular meshwork. Front Ophthalmol 3, 1274797 (2023). [CrossRef]
- M. Filla, M. K. Schwinn, N. Sheibani, P. L. Kaufman, D. M. Peters, Regulation of cross-linked actin network (CLAN) formation in human trabecular meshwork (HTM) cells by convergence of distinct β1 and β3 integrin pathways Invest Ophthamol Vis Sci 50, 5723-5731 (2009). [CrossRef]
- M. Filla, A. Woods, P. L. Kaufman, D. M. Peters, β1 and β3 integrins cooperate to induce syndecan-4-containing cross-linked actin networks in human trabecular meshwork cells. Invest Ophthalmol Vis Sci 47, 1956-1967 (2006). [CrossRef]
- M. S. Filla, M. K. Schwinn, A. K. Nosie, R. W. Clark, D. M. Peters, Dexamethasone-associated cross-linked actin network (CLAN) formation in human trabecular meshwork (HTM) cells involves β3 integrin signaling. Invest Ophthamol Vis Sci 52, 2952-2959. (2011).
- M. Filla et al., Activation of αvβ3 integrin alters fibronectin fibril formation in human trabecular meshwork cells in a ROCK-independent manner Invest Ophthalmol Vis Sci 60, 3897-3913 (2019). [CrossRef]
- M. S. Filla, K. A. Meyers, J. A. Faralli, D. M. Peters, Overexpression and activation of αvβ3 integrin differentially affects TGFβ2 signaling in human trabecular meshwork cells. Cells 10, 1923 (2021). [CrossRef]
- A. F. Clark et al., Glucocorticoid-induced formation of cross-linked actin networks in cultured human trabecular meshwork cells. Invest Ophthamol Vis Sci 35, 281-294 (1994).
- A. F. Clark, S. T. Miggans, K. Wilson, S. Browder, M. D. McCartney, Cytoskeletal changes in cultured human glaucoma trabecular meshwork cells. J Glauc 4, 183-188. (1995).
- R. Fuchshofer, E. R. Tamm, The role of TGF−β in the pathogenesis of primary open-angle glaucoma. Cell Tissue Res 347, 279-290 (2012). [CrossRef]
- A. L. Roberts et al., Fibronectin extra domain A (FN-EDA) elevates intraocular pressure through Toll-like receptor 4 signaling. Sci Rep 10, 9815 (2020). [CrossRef]
- T. A. Mavlyutov, J. J. Myrah, A. K. Chauhan, Y. Liu, C. M. McDowell, Fibronectin extra domain A (FN-EDA) causes glaucomatous trabecular meshwork, retina, and optic nerve damage in mice. Cell Biosci 12, 72 (2022). [CrossRef]
- P. Pattabiraman, P. Rao, Hic-5 regulates actin cytoskeletal reorganization and expression of fibrogenic markers and myocilin in trabecular meshwork cells. Invest Ophthamol Vis Sci 56, 5656-5669 (2015).
- J. R. Polansky, R. N. Weinreb, J. D. Baxter, J. Alvarado, Human trabecular cells. I. Establishment in tissue culture and growth characteristics. Invest Ophthamol Vis Sci 18, 1043-1049 (1979).
- J. R. Polansky, R. Weinreb, J. A. Alvarado, Studies on human trabecular cells propagated in vitro. Vis. Res. 21, 155-160 (1981).
- K. E. Keller et al., Consensus recommendations for trabecular meshwork cell isolation, characterization and culture. Exp Eye Res 171, 164-173 (2018). [CrossRef]
- M. S. Filla et al., In vitro localization of TIGR/MYOC in trabecular meshwork extracellular matrix and binding to fibronectin. Invest Ophthamol Vis Sci 43, 151-161 (2002).
- R. Clark et al., Comparative genomic and proteomic analysis of cytoskeletal changes in dexamethasone-treated trabecular meshwork cells. Mol. Cell Proteomics 12, 194-206 (2013). [CrossRef]
- J. A. Faralli, D. Gagen, M. S. Filla, T. N. Crotti, D. M. Peters, Dexamethasone increases αvβ3 integrin expression and affinity through a calcineurin/NFAT pathway. BBA- Mol Cell Res 1833, 3306-3313. (2013). [CrossRef]
- M. Filla, G. David, R. N. Weinreb, P. L. Kaufman, D. M. Peters, Distribution of syndecans 1-4 within the anterior segment of the human eye: expression of a variant syndecan-3 and matrix-associated syndecan-2. Exp Eye Res 79, 61-74 (2004).
- M. S. Filla, K. D. Dimeo, T. Tong, D. M. Peters, Disruption of fibronectin matrix affects type IV collagen, fibrillin and laminin deposition into extracellular matrix of human trabecular meshwork (HTM) cells. Exp Eye Res 165, 7-19 (2017). [CrossRef]
- O. Y. Tektas, E. Lutjen-Drecoll, Structural changes of the trabecular meshwork in different kinds of glaucoma. Exp Eye Res 88, 769-775 (2009).
- C. Lawson, D. D. Schlaepfer, Integrin adhesions Who’s on first? What’s on second? Cell Adh Migr 6, 302-306 (2012). [CrossRef]
- M. E. Cooke, T. Sakai, D. F. Mosher, Contraction of collagen matrices mediated by α2β1A and αvβ3. J Cell Sci 113, 2375-2383. (2000).
- X. Du et al., Long range propagation of conformational changes in integrin alpha IIb beta 3. J Biol Chem 268, 23087-23092 (1993).
- B. Hinz, The myofibroblast: paradigm for a mechanically active cell. J Biomech 43, 146-155 (2010). [CrossRef]
- P. Singh, C. Carraher, J. E. Schwarzbauer, Assembly of fibronectin extracellular matrix. Annu Rev Cell Dev Biol 26, 397-419 (2010).
- Hinz, G. Gabbiani, Fibrosis: recent advances in myofibroblast biology and new therapeutic perspectives. F1000 Biology Reports 2 (2010). [CrossRef]
- B. Hinz, C. A. McCulloch, N. M. Coelho, Mechanical regulation of myofibroblast phenoconversion and collagen contraction. Exp Cell Res 379, 119-128 (2019). [CrossRef]
- Y.-F. Yang, Y. Y. Sun, D. M. Peters, K. E. Keller, The effects of mechanical stretch on integrins and filopodial-associated proteins in normal and glaucomatous trabecular meshwork cells. Front Cell Dev Biol 10, 886706 (2022). [CrossRef]
- S. Proulx, S. L. Guérin, C. Salesse, Effect of quiescence on integrin α5β1 expression in human retinal pigment epithelium. Mol Vis 9, 473-481 (2003).
- M.-E. Gingras et al., Regulation of the integrin subunit alpha5 gene promoter by the transcription factors Sp1/Sp3 is influenced by the cell density in rabbit corneal epithelial cells. Invest Ophthalmol Vis Sci 44, 3742-3755 (2003). [CrossRef]
- M.-E. Gingras et al., Differential binding of the transcription factors Sp1, AP-1, and NFI to the promoter of the human alpha5 integrin gene dictates its transcriptional activity. Invest Ophthalmol Vis Sci 50, 57-67 (2009). [CrossRef]
- A. K. Roy et al., Impacts of transcriptional regulation on aging and senescence. Aging Res Rev 1, 367-380 (2002). [CrossRef]
- F. Fischer, G. Grigolon, C. Benner, M. Ristow, Evolutionarily conserved transcription factors as regulators of longevity and targets for geroprotection. Physiol Rev 102, 1449-1494 (2022).
- I. D. Campbell, M. J. Humphries, Integrin structure, activation and interactions. Cold Spring Harb Perpsect Biol 3 (2011). [CrossRef]
- T. D. Ross et al., Integrins in mechanotransduction. Curr Opin Cell Biol 25, 613-618. (2013). [CrossRef]
- A. Calderwood, Integrin Activation. J Cell Sci 117, 657-666. (2004).
- D. J. Li et al., Conformational equilibria and intrinsic affinities define integrin activation. EMBO J 36, 629-645 (2017).
- D. A. Calderwood, V. Tai, G. Di Paolo, P. De Camilli, M. H. Ginsberg, Competition for talin results in trans-dominant inhibition of integrin activation. J Biol Chem 279, 28889-28895 (2004).
- Z. Sun, S. S. Guo, R. Fassler, Integrin-mediated mechanotransduction. J Cell Biol 215, 445-456 (2016).
- A. M. Gonzalez, R. Bhattacharya, G. W. deHart, J. C. Jones, Transdominant regulation of integrin function: mechanisms of crosstalk. Cell Signal 22, 578-583 (2010).
- S. D. Blystone, I. L. Graham, F. P. Lindberg, E. J. Brown, Integrin alpha v beta 3 differentially regulates adhesive and phagocytic functions of the fibronectin receptor alpha 5 beta 1. J Cell Biol. 127, 1129-1137 (1994).
- S. F. Retta et al., Cross talk betweem β1 and αv integrins: β1 affects β3 mRNA stability. Mol Biol Cell 12, 3126-3138 (2001).
- I. Samarzija et al., Integrin Crosstalk Contributes to the Complexity of Signalling and Unpredictable Cancer Cell Fates. Cancers 12, 1910 (2020). [CrossRef]
- H. H. Truong et al., β1 integrin inhibition elicits a prometastatic switch through the TGFβ-miR-200-ZEB network in E-cadherin-positive triple-negative breast cancer. Sci Signal 7, ra15 (2014). [CrossRef]
- R. Hennig, S. Kuespert, A. Haunberger, A. Goepferich, R. Fuchshofer, Cyclic RGD peptides target human trabecular meshwork cells while ameliorating connective tissue growth factor-induced fibrosis. J. Drug Target 24, 952-959 (2016).
- B. Junglas, A. H. L. Yu, U. Welge-Lussen, E. Tamm, R. Fuchshofer, Connective tissue growth factor induces extracellular matrix deposition in human trabecular meshwork cells. Exp Eye Res 88, 1065-1075. (2009). [CrossRef]
- V. Rapisarda et al., Integrin Beta-3 regulates cellular senescence by activating the TGF-β pathway. Cell Reports 18, 2480-2493 (2017). [CrossRef]
- P. B. Liton et al., Cellular senescence in the glaucomatous pathway. Experimental Gerontology 40, 745-748 (2005).
- D. Wang et al., Release from quiescence stimulates the expression of integrin α5β1, which regulates DNA synthesis in human fibrosarcoma HT1080 cells J Cell Physiol 164, 499-508 (1995).
- R. B. Brem et al., Immunolocalization of integrins in the human retina. Invest Ophthalmol Vis Sci 35, 3466-3474 (1994).
- F. Bordeleau et al., Tissue stiffness regulates serine/arginine-rich protein-mediated splicing of the extra domain B-fibronectin isoform in tumors. Proc Natl Acad Sci USA 112, 8314-8319 (2015). [CrossRef]
- S. Kraft et al., Identification and characterization of a unique role for EDB fibronectin in phagocytosis. J Mol Med 94, 567-581 (2015). [CrossRef]
Figure 1.
An age-related loss of α5 integrin subunit is seen in 2 out of 3 old TM cell strains. Flow cytometry for α5, β3, and β1 integrin subunits was done on two young cell strains (N17, N27) and three old cell strains (N74, N75 and N77). Blue peaks are cells labeled with control IgG, while pink peaks are cells labeled with either P1D6 mAb (α5 integrin; top panels), LM609 mAb (β3 integrin subunit; middle panels), or 12G10 (β1 integrin; bottom panels). In contrast to young TM cells, α5 integrin labeling is not above background in two of the old TM cells (N74 and N77), indicating that α5 integrin levels on the cell surface are lower. The third old cell strain (N75) had similar levels of α5 integrin as the two young cell strains (N17 and N27). Both young and old TM cells express similar levels of the β3 and β1 integrin subunits (middle and bottom panels, respectively).
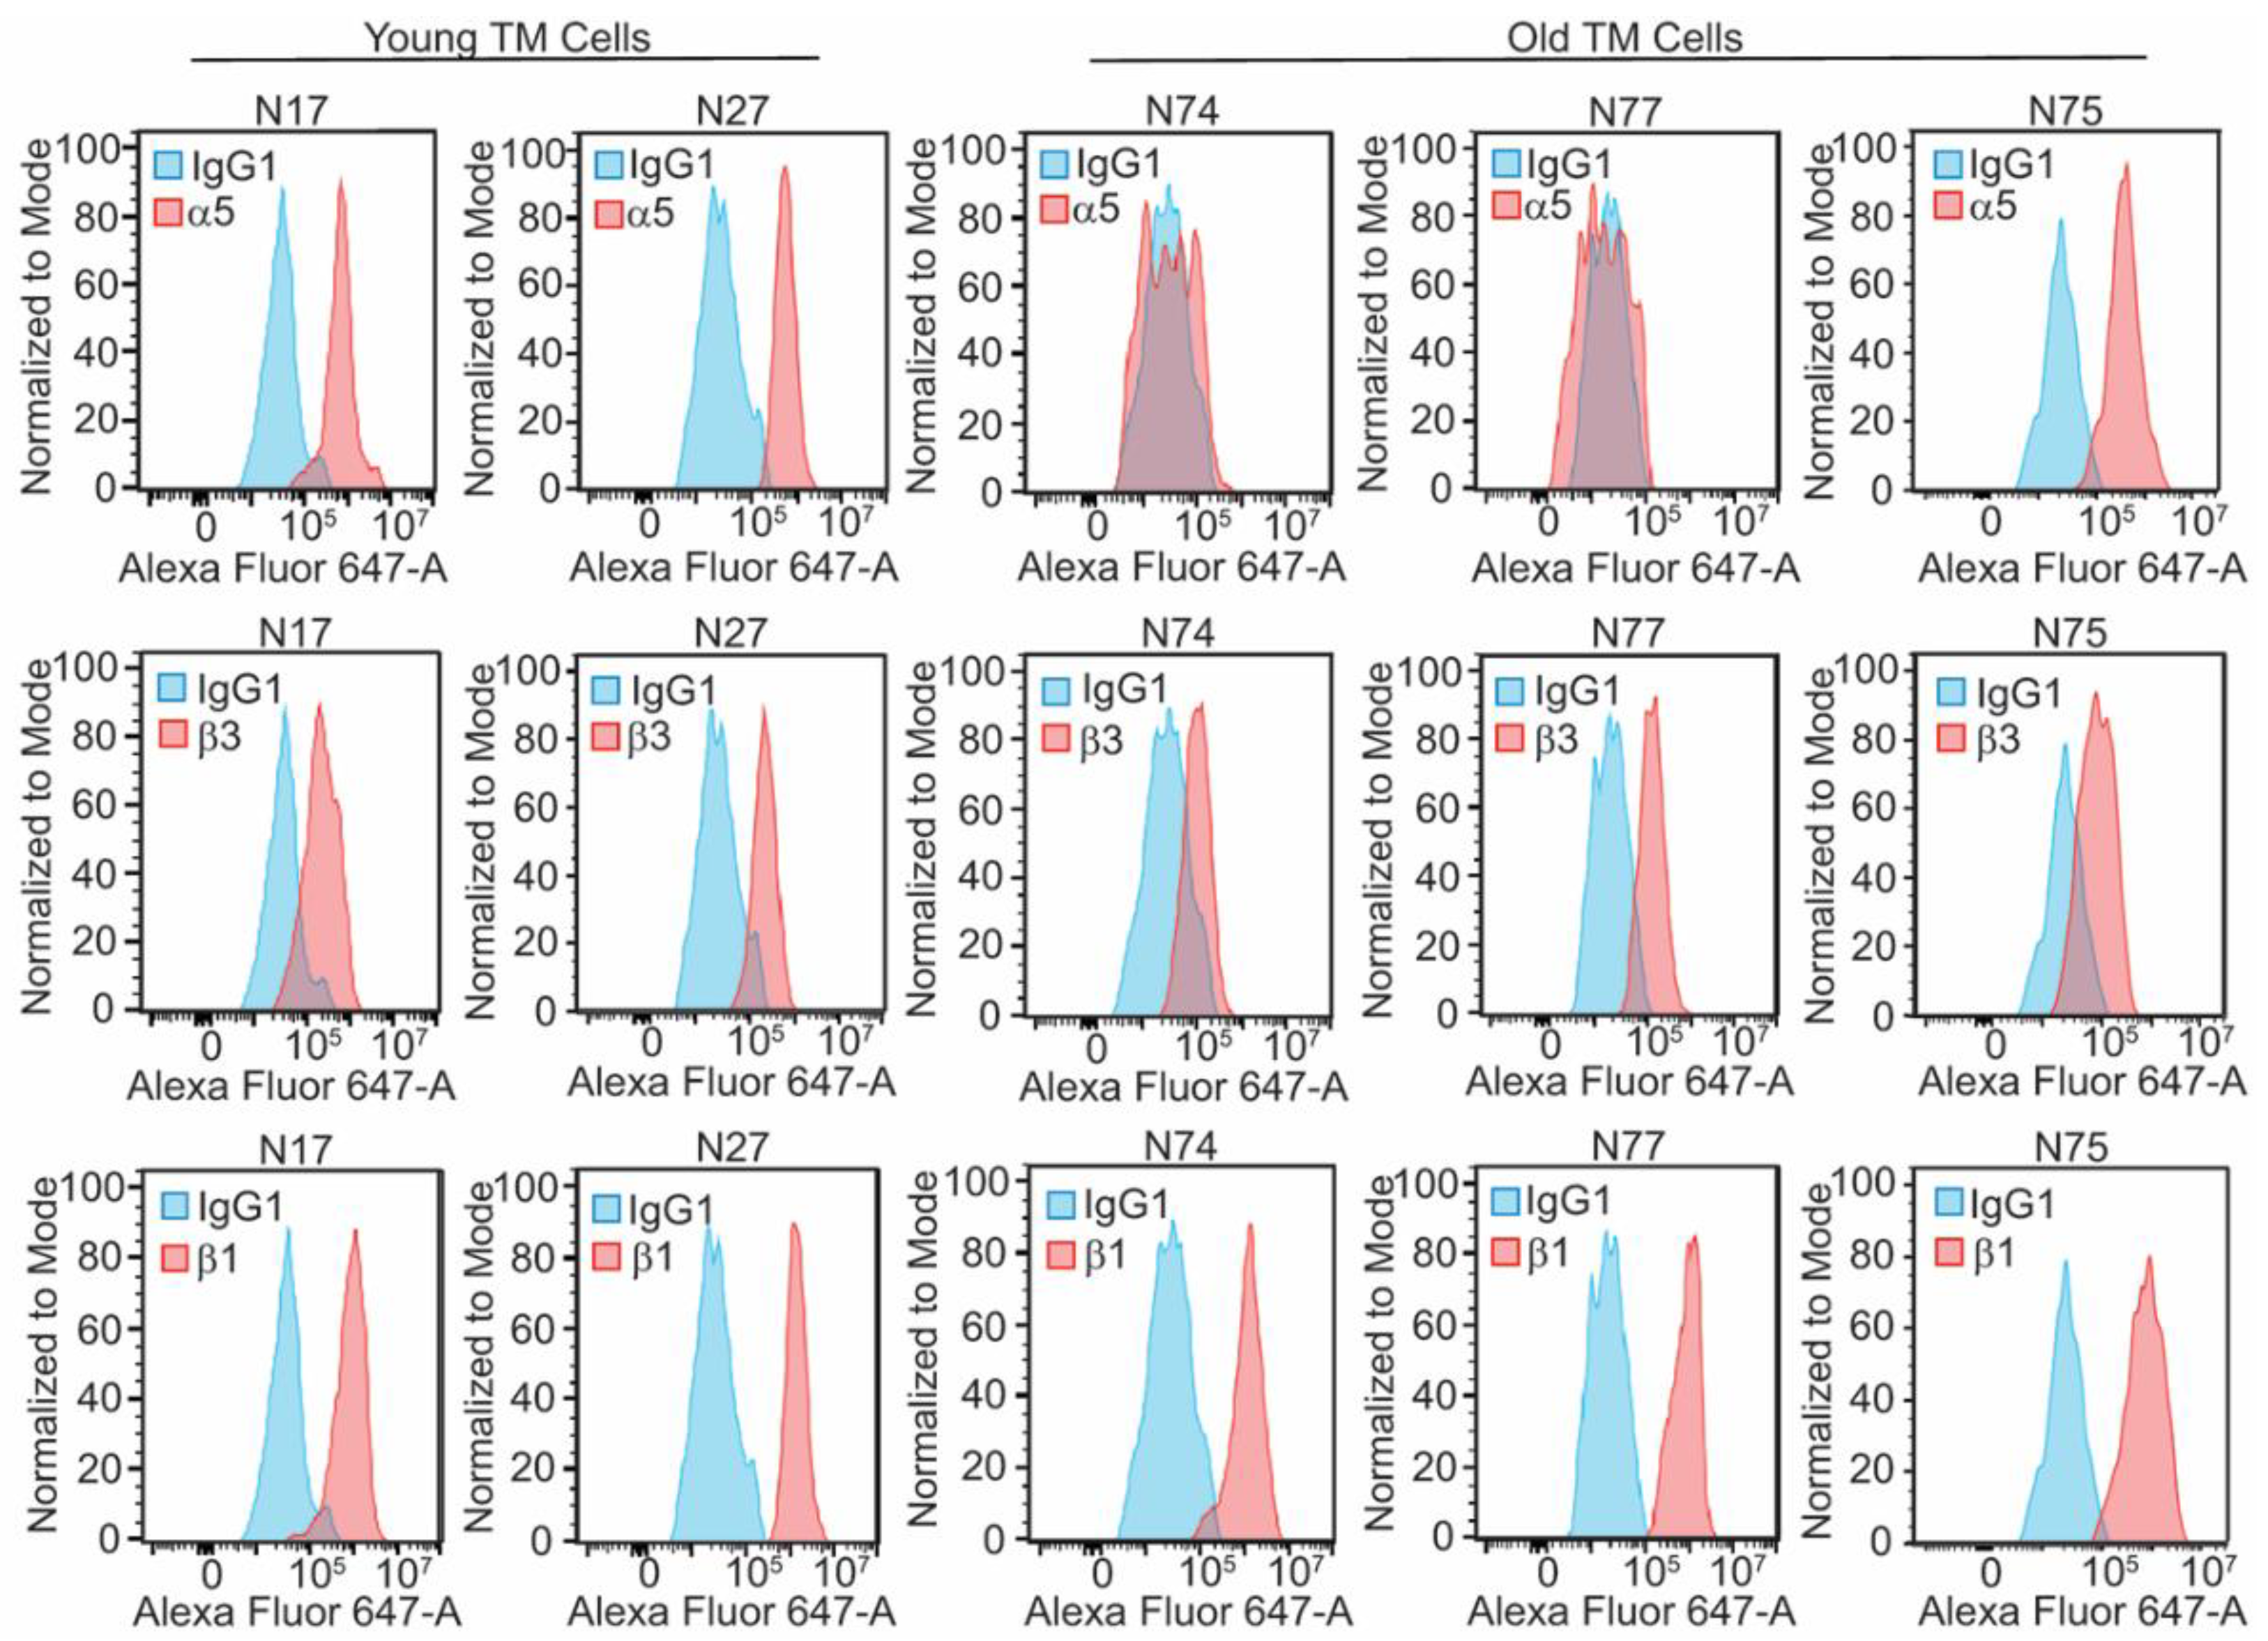
Figure 2.
RT-qPCR analysis of α5, β1, and β3 integrin mRNA levels. (A) mRNA levels for α5 integrin subunit are statistically higher in TM cells from young donor eyes (gray) compared to levels found in TM cells from old donor eyes (pink). (B, C) In contrast, levels of β3 and β1 integrin subunits mRNA are decreased in TM cells from young donor eyes compared to cells from old donor eyes. Changes are statistically significant (*p<0.05). N=13 biological replicates for young TM cells, N=8 for old cells.
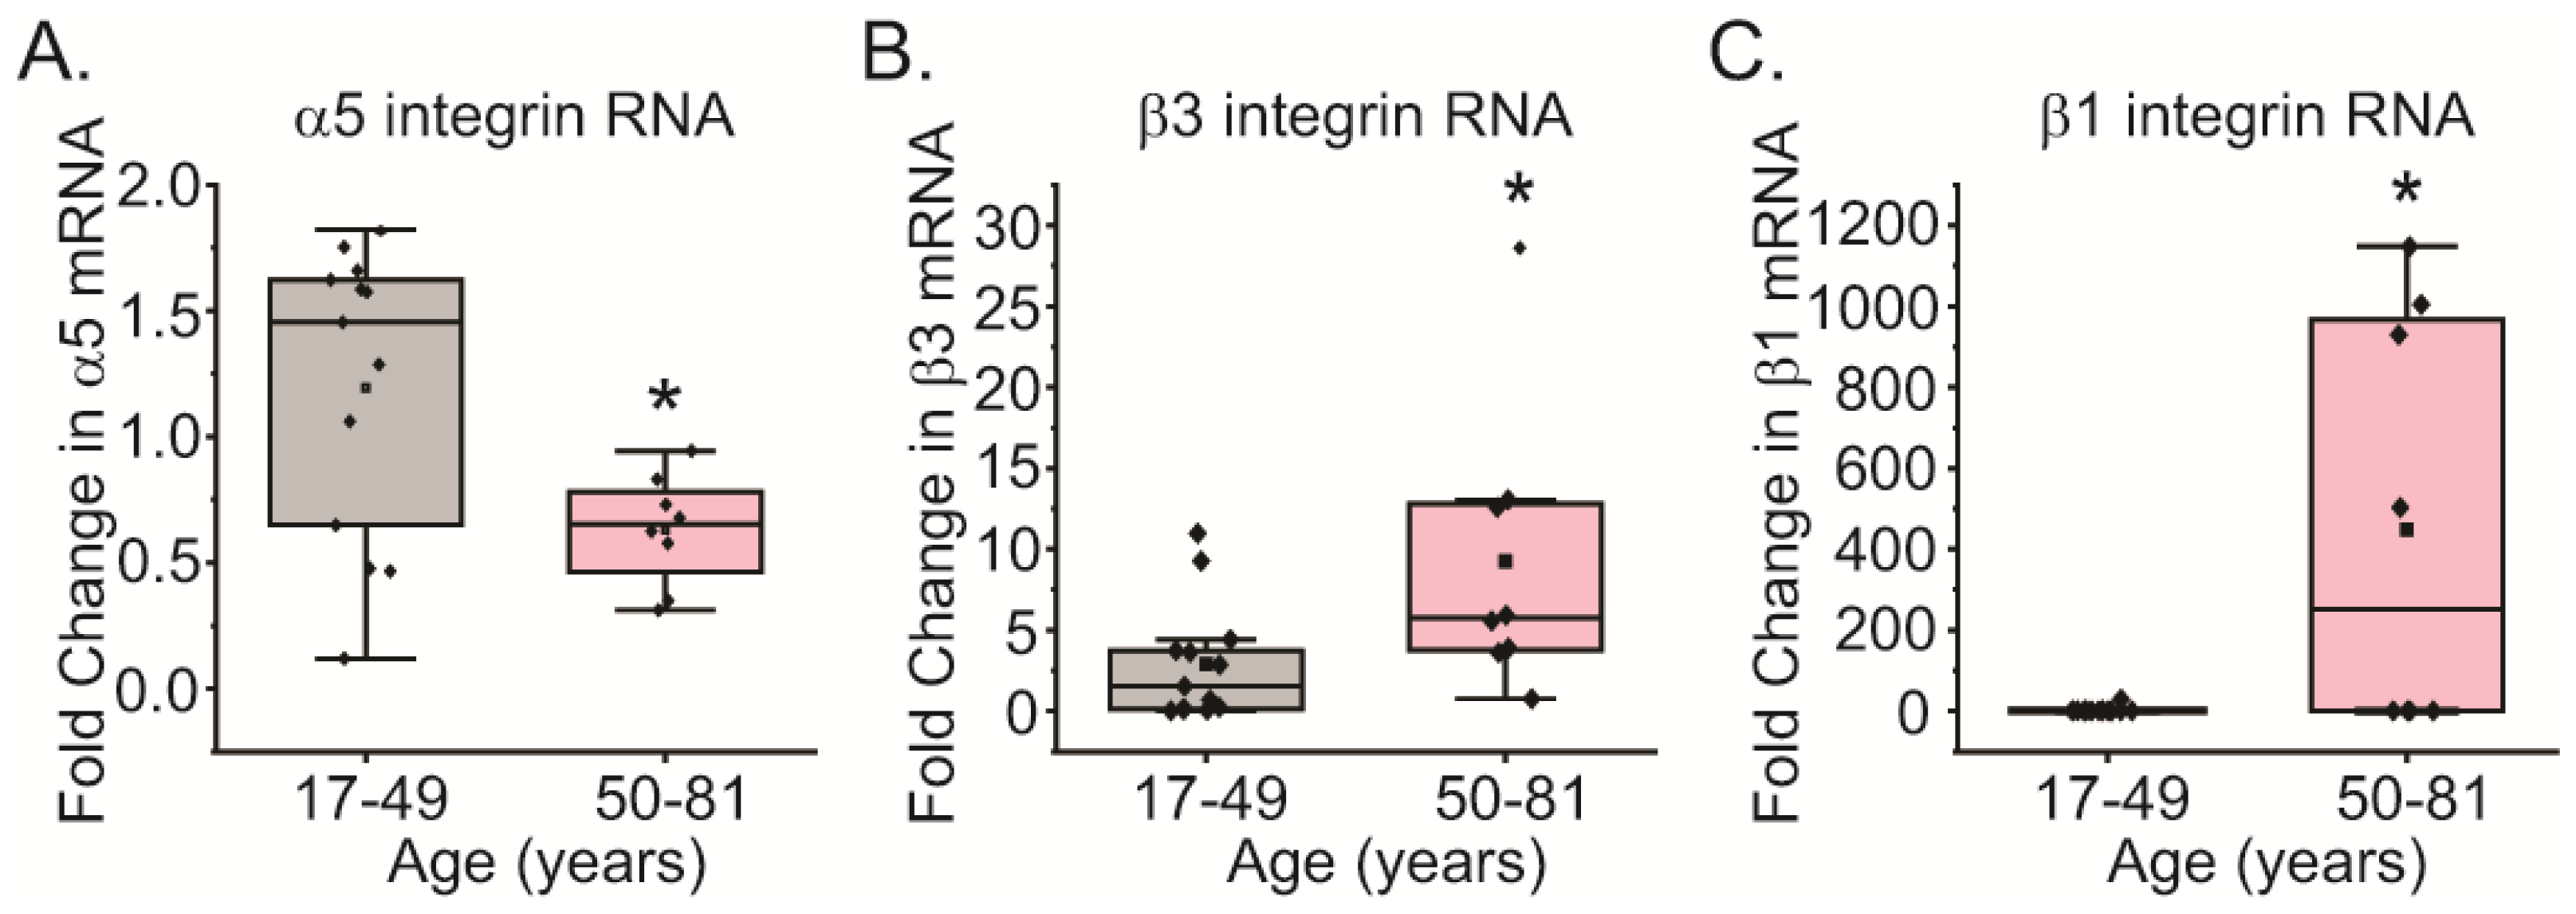
Figure 3.
Immunolabeling for α5 integrin in anterior segments from young and old eyes. (A) Location of the TM in the angle of the anterior segment. (B) Schematic of the TM showing that it consists of several layers of fenestrated beams covered by a monolayer of TM cells. This is followed by a region called the juxtacanalicular (JCT) region which is composed of individual cells embedded in an ECM. This is the region where most of the outflow resistance lies due to fibrotic changes that occur during POAG. Aqueous humor (AH, arrows) flows into the TM from the anterior chamber (AC) and exits through the inner wall (IW) of Schlemm’s canal (SC) to the distal vessels (DV). (C) An H&E-stained section showing the typical morphology of the TM in a section of the anterior segment from a 36-yr-old donor eye. Scale bar = 50 µm. (D-I) Sections of anterior segments from 21 yr old (D-F) and 74 yr old (G-I) donor eyes. Sections were labeled with mAb 10F6 against α5 integrin (D, F, G, I), or a control antibody against β-galactosidase (E, H). Asterisks in panels D and G show regions that are at higher magnification in panels F and I, respectively. α5 integrin labeling is ubiquitous within the TM beam cells and JCT in the 21-yr-old tissue, but is greatly reduced or scattered within the beam cells and JCT from the 74-yr-old tissue. Both young and old tissue samples show α5 integrin labeling along the SC indicating that the loss of α5 integrin is specific to TM cells. In both young and old tissue samples, the α5 integrin labeling is clearly above the background labeling. Arrows = TM beam cell labeling; arrowheads = SC endothelium labeling. AC = anterior chamber; JCT = juxtacanalicular tissue. Scale bar = 20 µm.
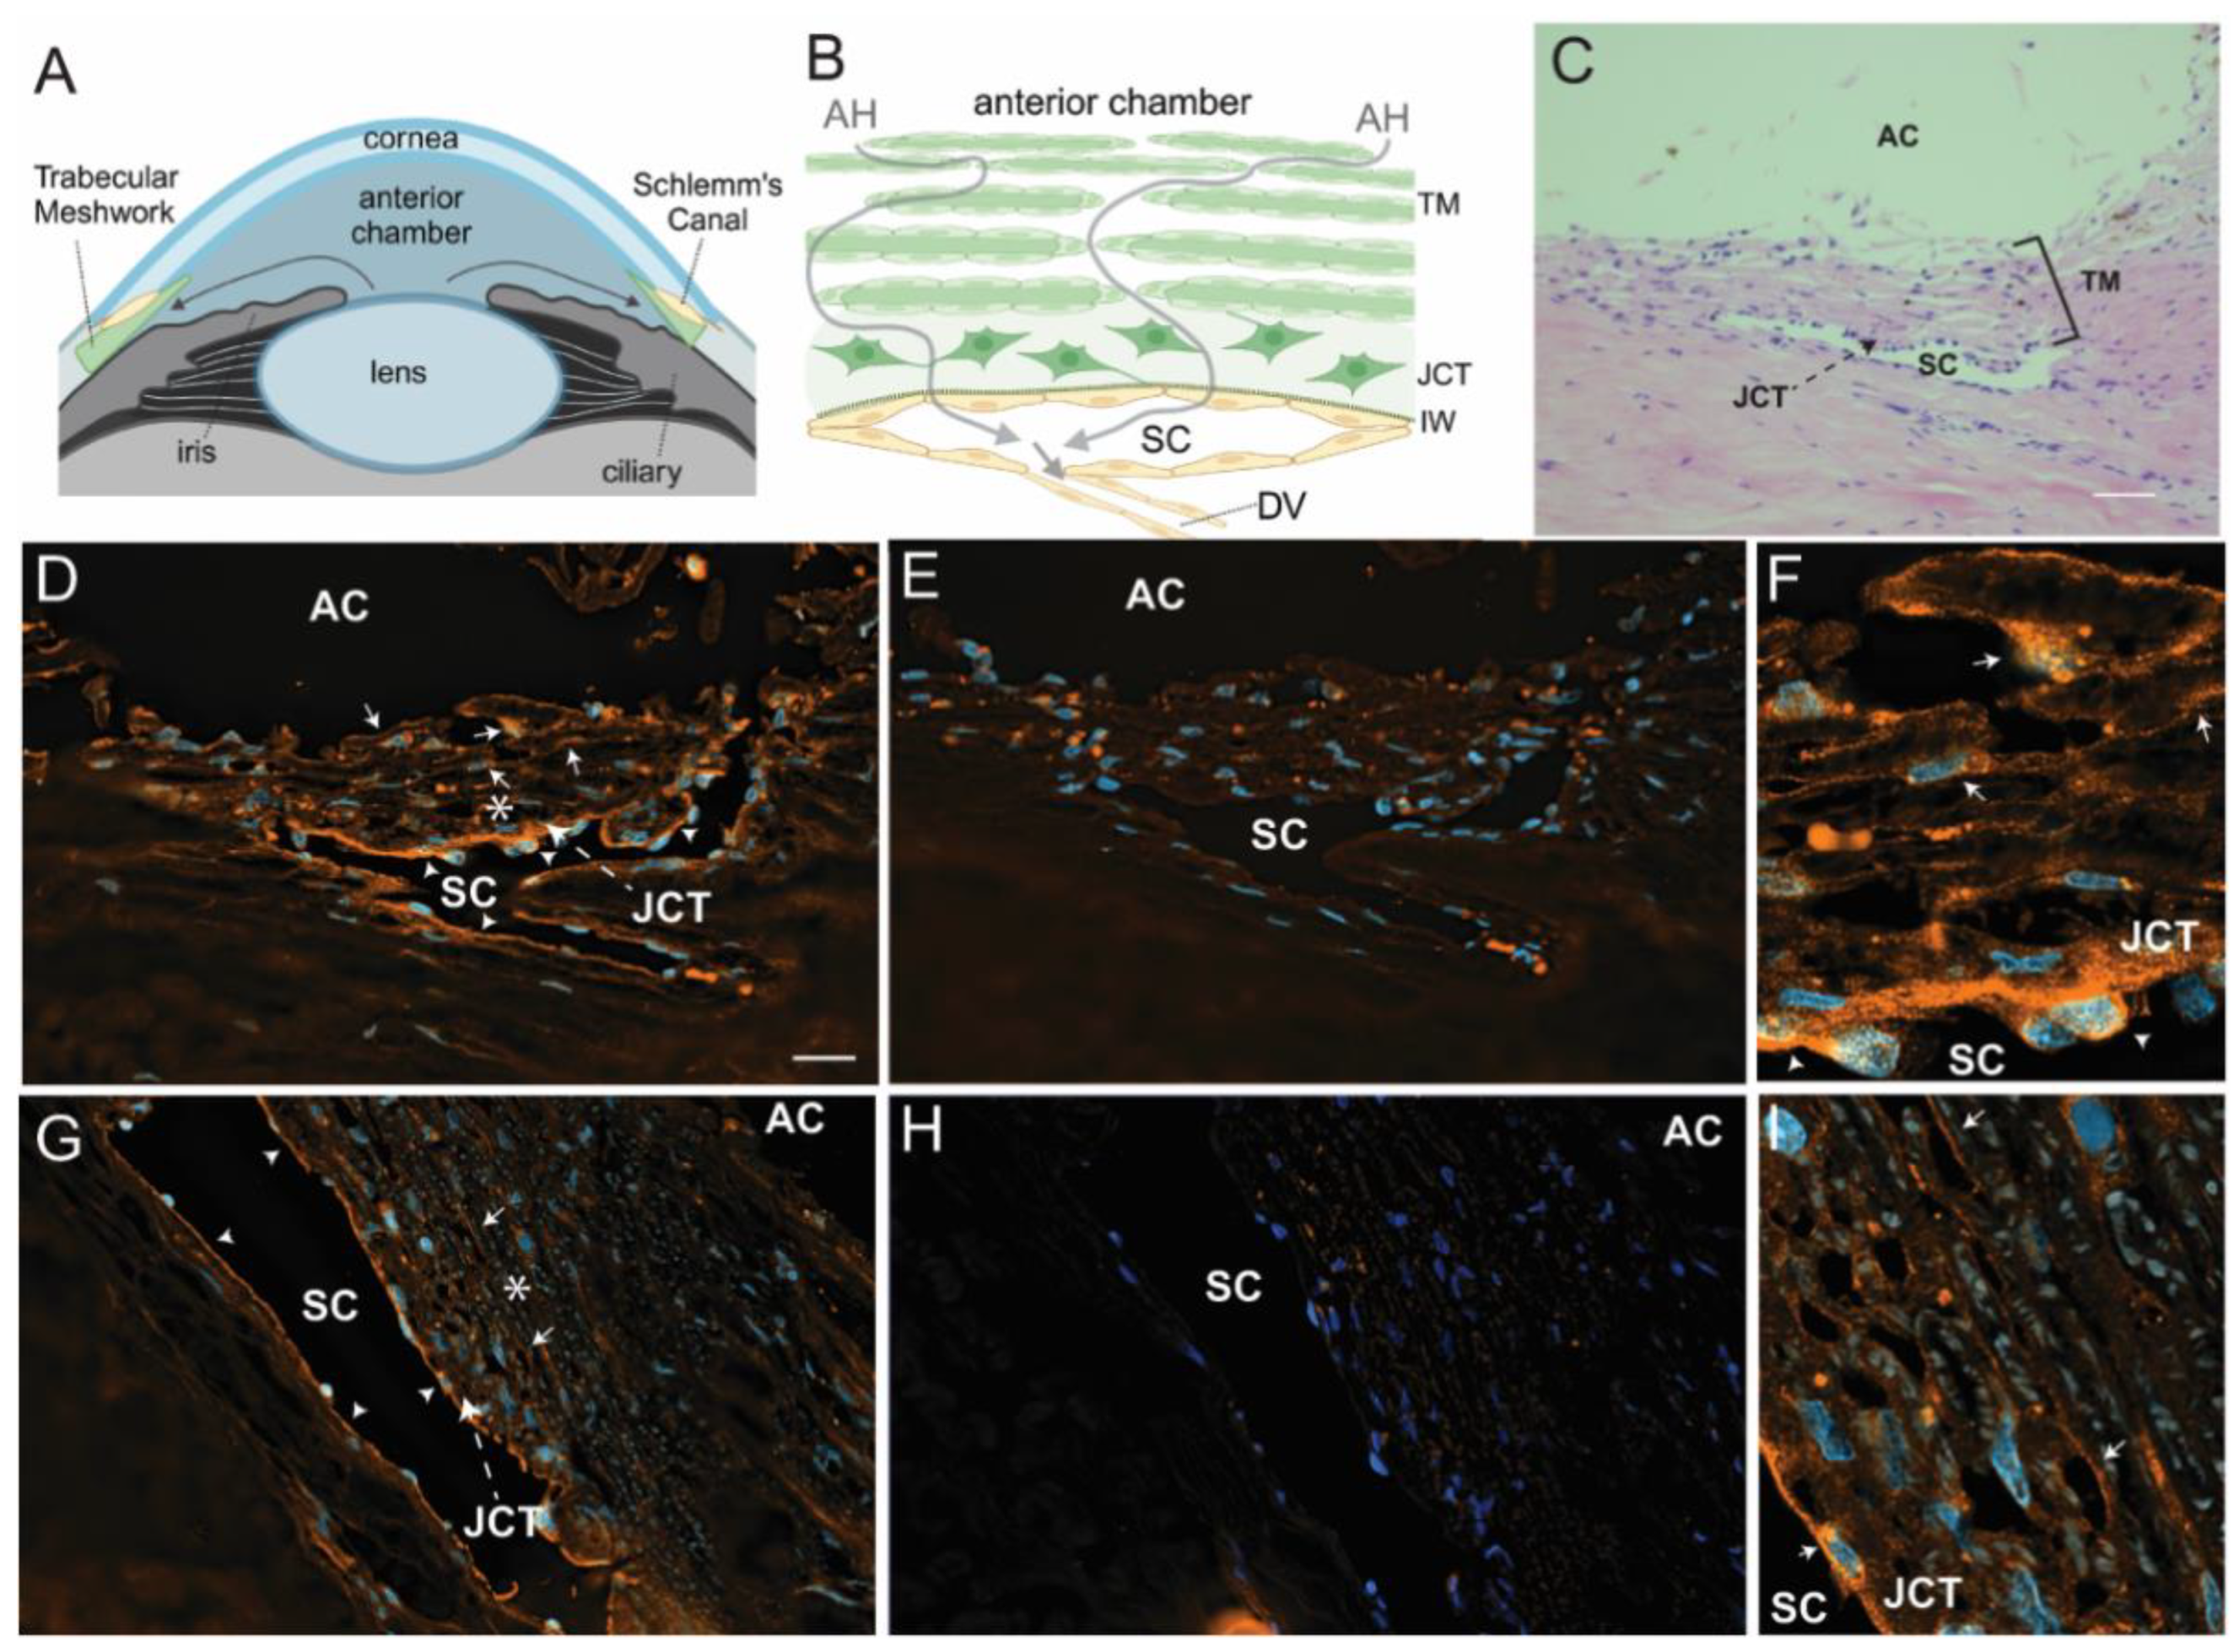
Figure 4.
Old TM cells are more contractile than young TM cells and express higher levels of αSMA. (A, B) Young and old TM cells were plated onto collagen gels (1.25 mg/ml) for 24 hrs. The gels were then rimmed to release them from each plate. Old cells were statistically more contractile than younger donor cells within minutes of releasing the gels. N=2 biological replicates/age grp. All experiments were done in triplicate and repeated 3 times. (C, D) By 4 h, old α5-negative TM cells are more contractile than old α5-positive TM cells. Collagen contractility assays were done as described above. All experiments were done in duplicate or triplicate. *p<0.05, **p<0.01, ***p<0.001. Bars= S.E.M, (E, F) Immunofluorescent microscopy images showing that αSMA+ stress fibers were not formed in N27-2 cells from a young donor (panel E) in contrast to the N77 cells from an old donor eye (panel F). Cells were plated onto collagen-coated coverslips for 24 h and labeled with anti-αSMA antibody, as described in material and methods. White arrows indicate the αSMA+ stress fibers. Scale bar = 50 µm. (G) RT-qPCR of αSMA mRNA levels in young (gray) and old (pink) TM cells show that mRNA levels for αSMA are upregulated in old cells compared to younger cells suggesting that old cells are more contractile. *p<0.05.
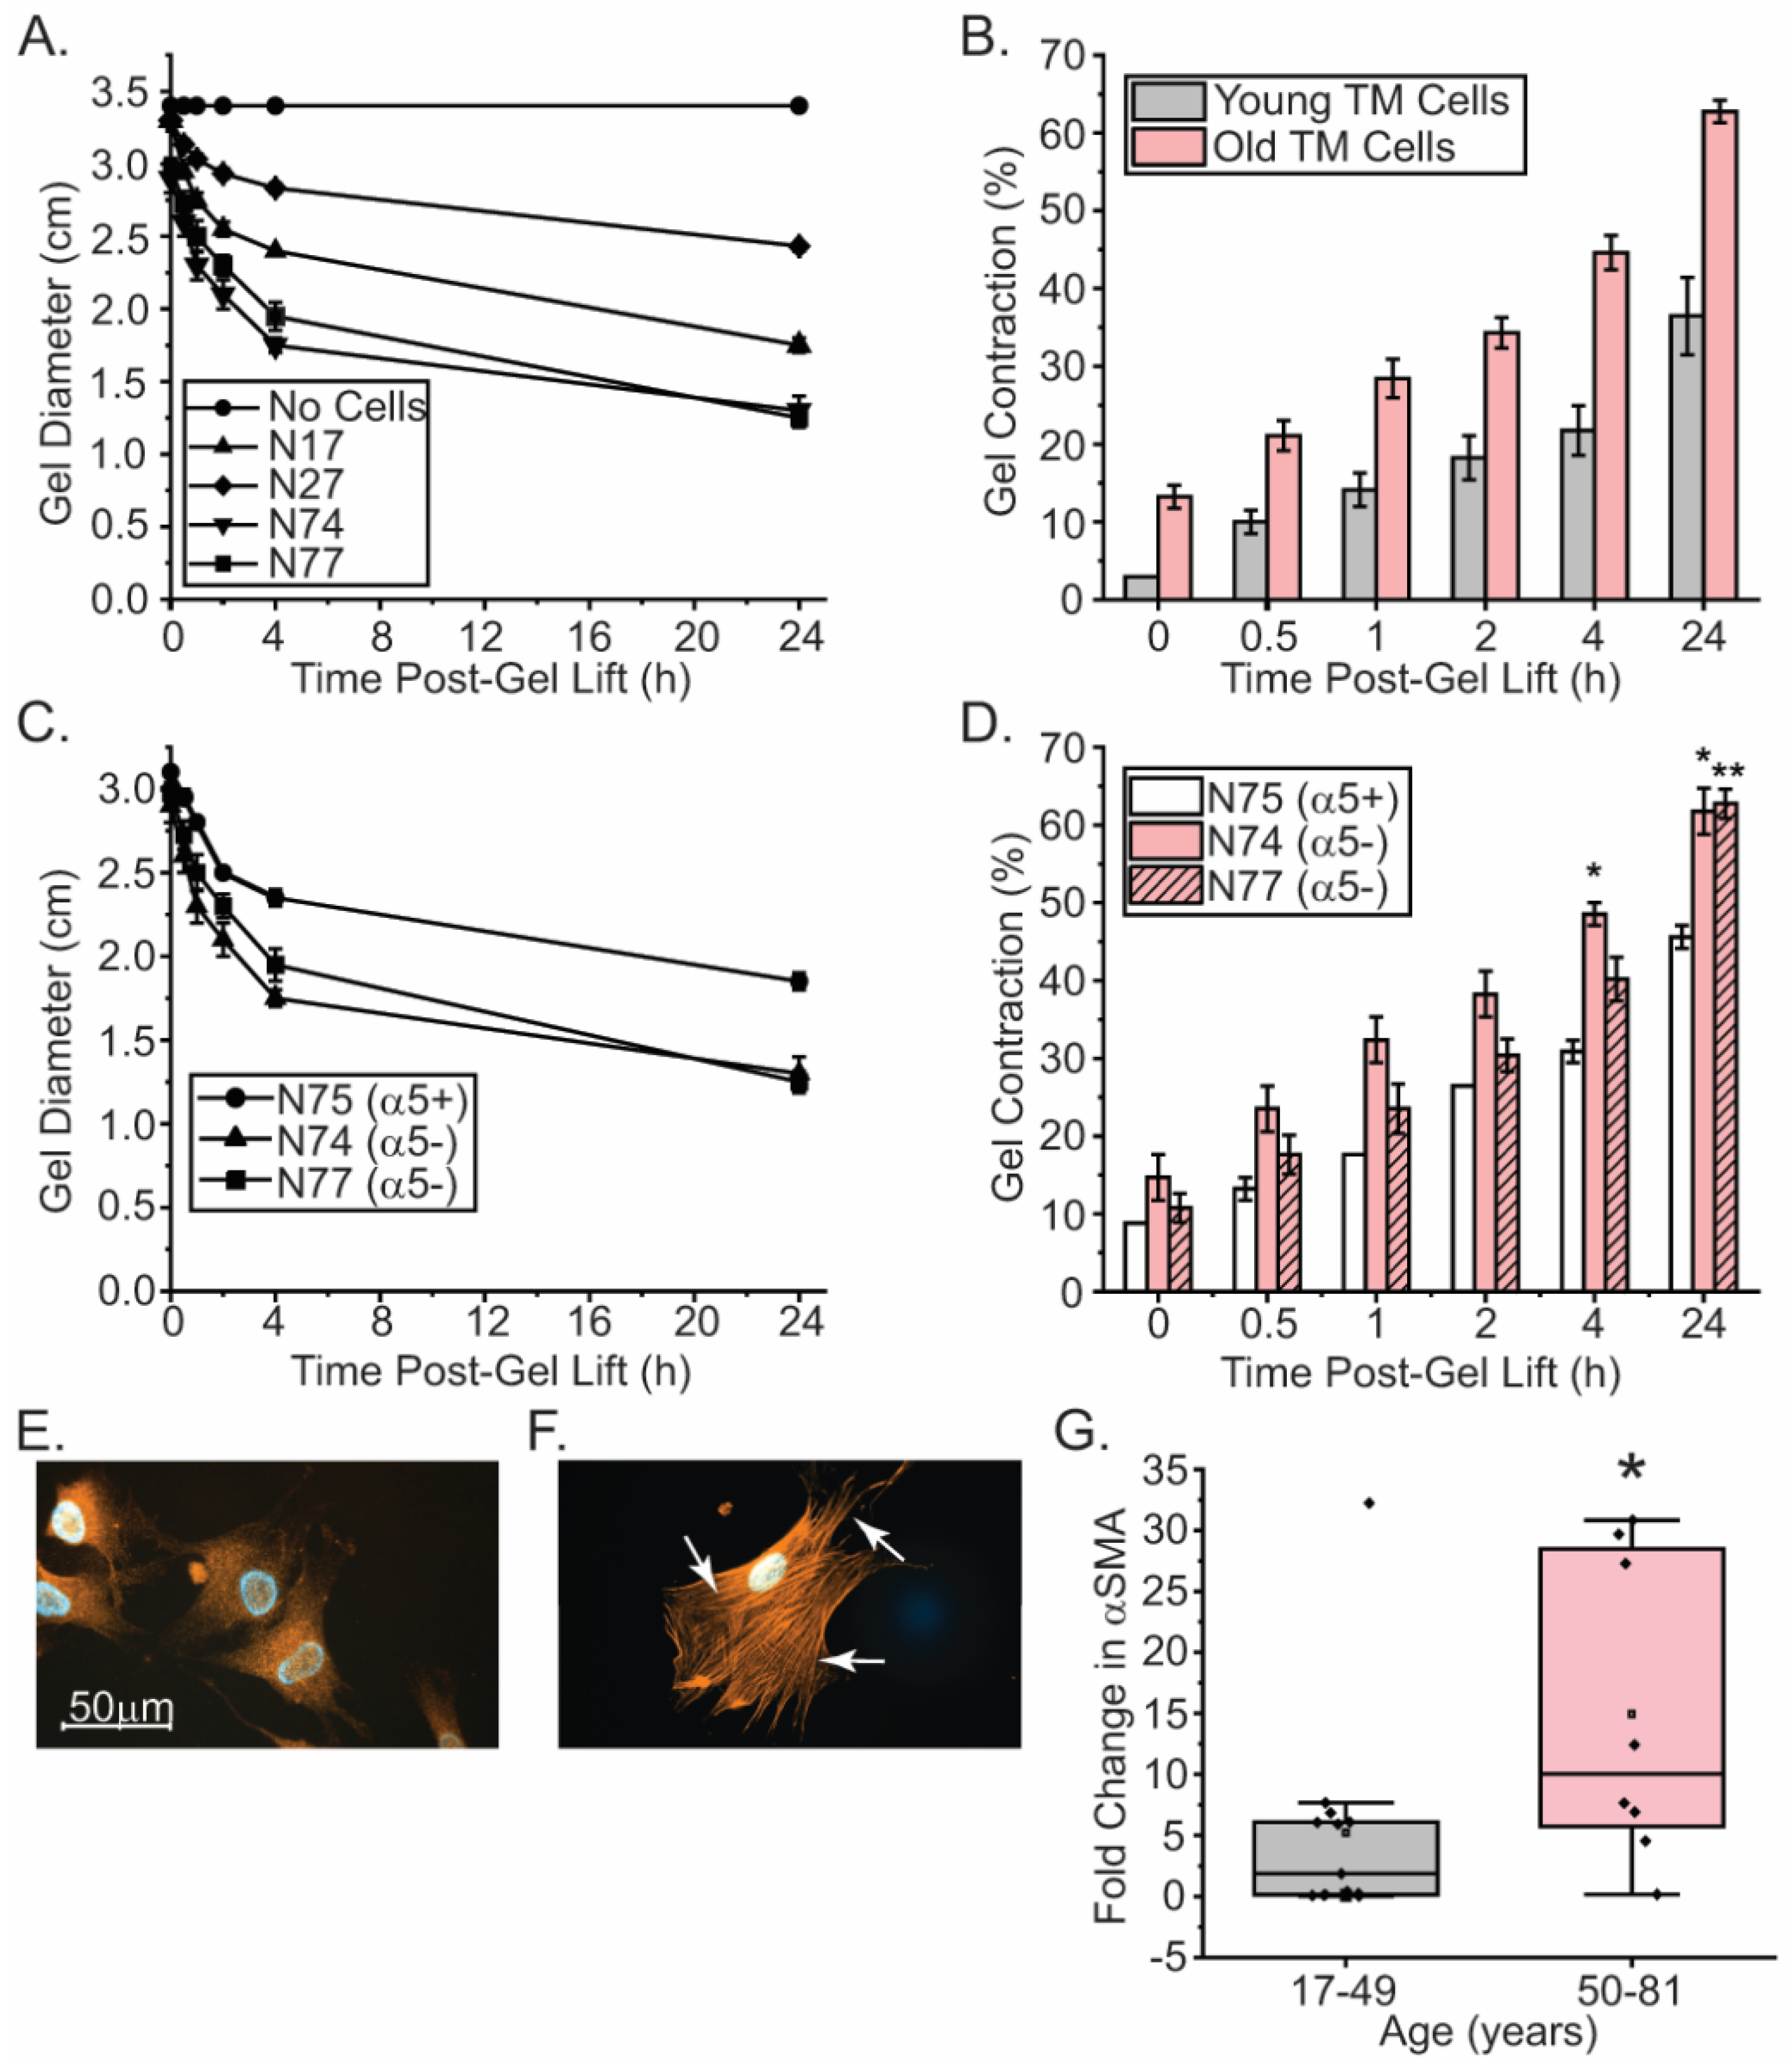
Figure 5.
Old TM cells have more focal adhesions with active αvβ3 integrin. (A) Schematic showing that integrins are heterodimeric transmembrane proteins consisting of an α and β subunits that interact with the ECM. They can exist in both an active and inactive state within the sites of contact with the ECM called focal adhesions. The active integrin has an upright conformation, can bind to ECM proteins and interact with cytoplasmic signaling molecules that trigger the assembly of actin stress filaments. (B) Young N27-2 and old N77 TM cells were labeled for total αvβ3 integrin levels (mAb [BV3]) and active αvβ3 integrin (mAb LIBS2). Both TM cell strains showed numerous focal adhesions (white arrows) containing αvβ3 integrin and some focal adhesions that were positive for active αvβ3 integrin. (C) Quantitation of number of young (gray) or old (pink) cells containing three or more focal adhesions did not show a statistical difference in the number of cells that contained αvβ3 integrin in focal adhesions. Number of N27-2 and N77 cells counted were 101 and 87, respectively. (D) In contrast, quantitation of the number of cells containing three or more focal adhesions that contained active αvβ3 integrin were statistically higher in old cells (pink) compared to young cells (gray). Number of N27-2 and N77 cells counted were 91 and 103, respectively. ***p<0.001.
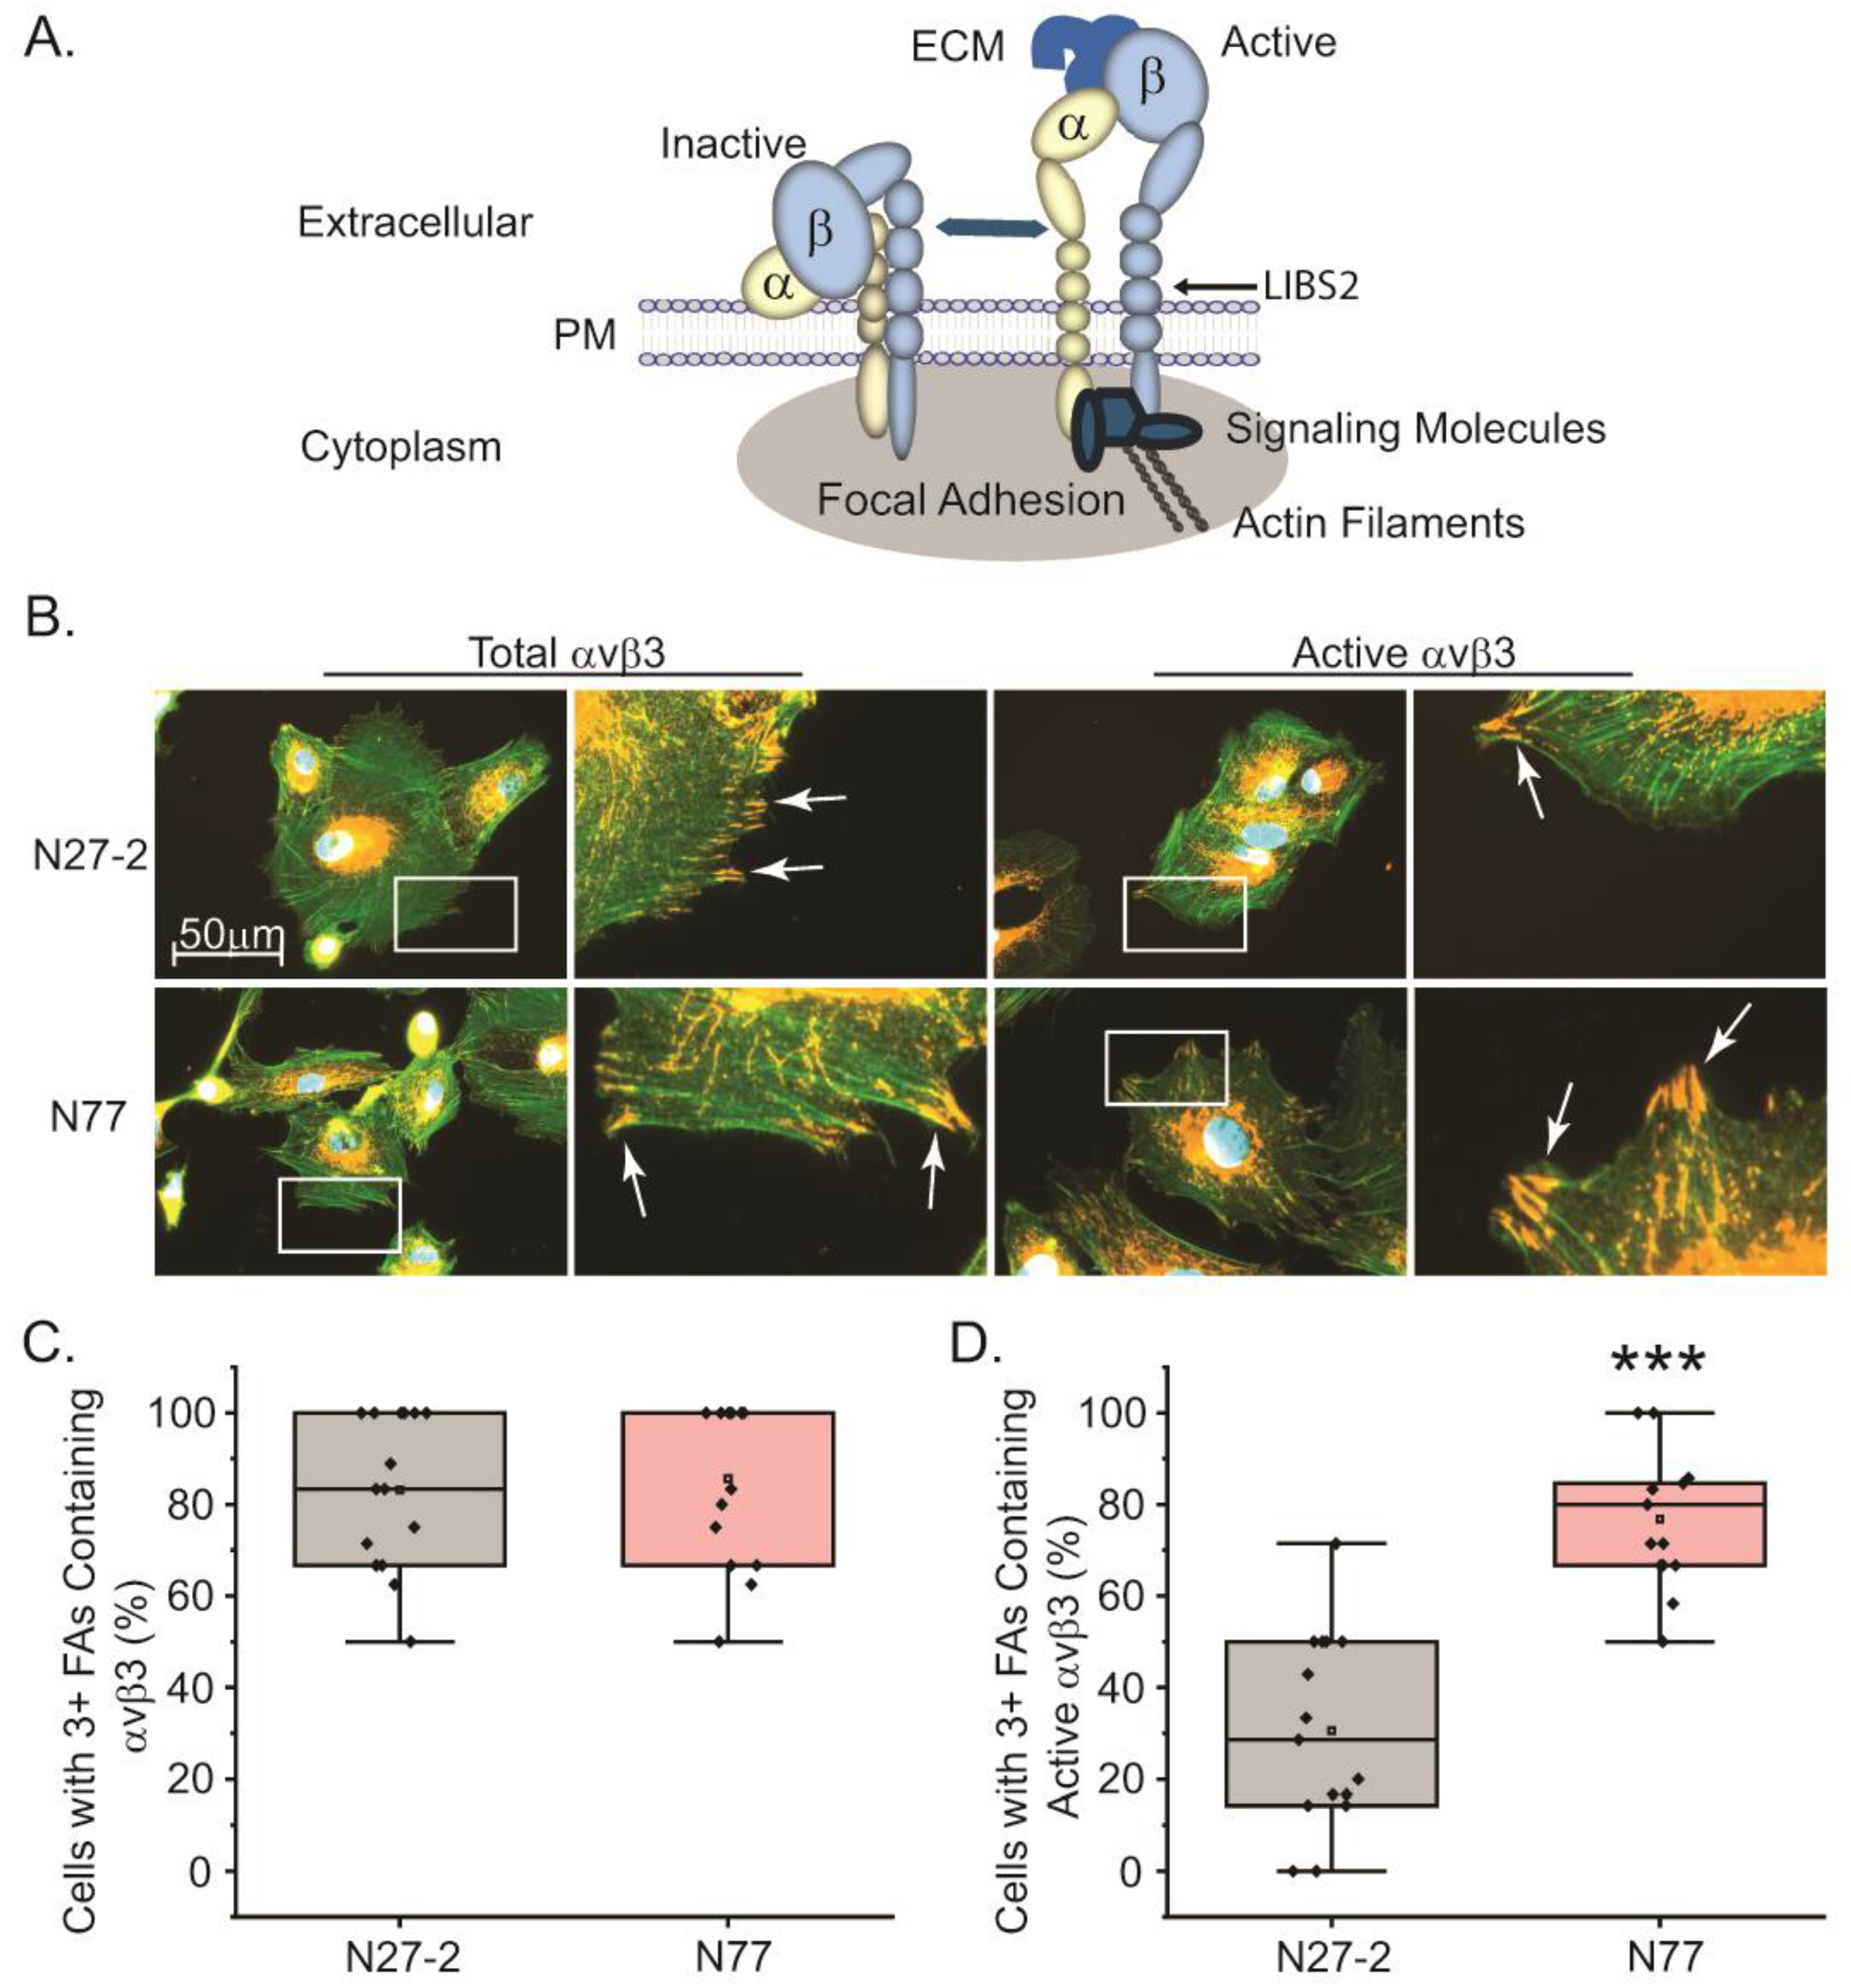
Figure 6.
Knockdown of α5 integrin subunit in young TM cells triggers an increase in β3 integrin activity. (A) N25 TM cells were transduced with a lenti-α5 shRNA viral vector (MOI 50). By RT-qPCR, there was a 60% reduction in α5 integrin mRNA compared to untransduced cells (B- C) Western blot analysis showed a 50% decrease in the α5 integrin subunit in transduced cells compared to untransduced cells. GAPDH was used as a loading control. (D) Western blot analysis showed that levels of the β3 integrin subunit were unchanged when α5 integrin was knocked down. (E) Immunofluorescence microscopy of transduced and untransduced N25 cells labeled for total levels of αvβ3 integrin (mAb [BV3]), or activated αvβ3 integrin (mAb LIBS2), in focal adhesions (arrows). Cells were stained with Alexa 488 phalloidin to detect actin filaments. Scale bar = 50 µm. (F) Untransduced and transduced N25 cells with 3 or more focal adhesions show similar levels of focal adhesions containing αvβ3 integrin. The number of cells counted per treatment group ranged between 99-114 cells. (G) The number of transduced N25 TM cells with 3 or more focal adhesions containing activated αvβ3 was statistically higher compared to control cells. The number of cells counted per treatment group ranged between 99-111. **p<0.01.
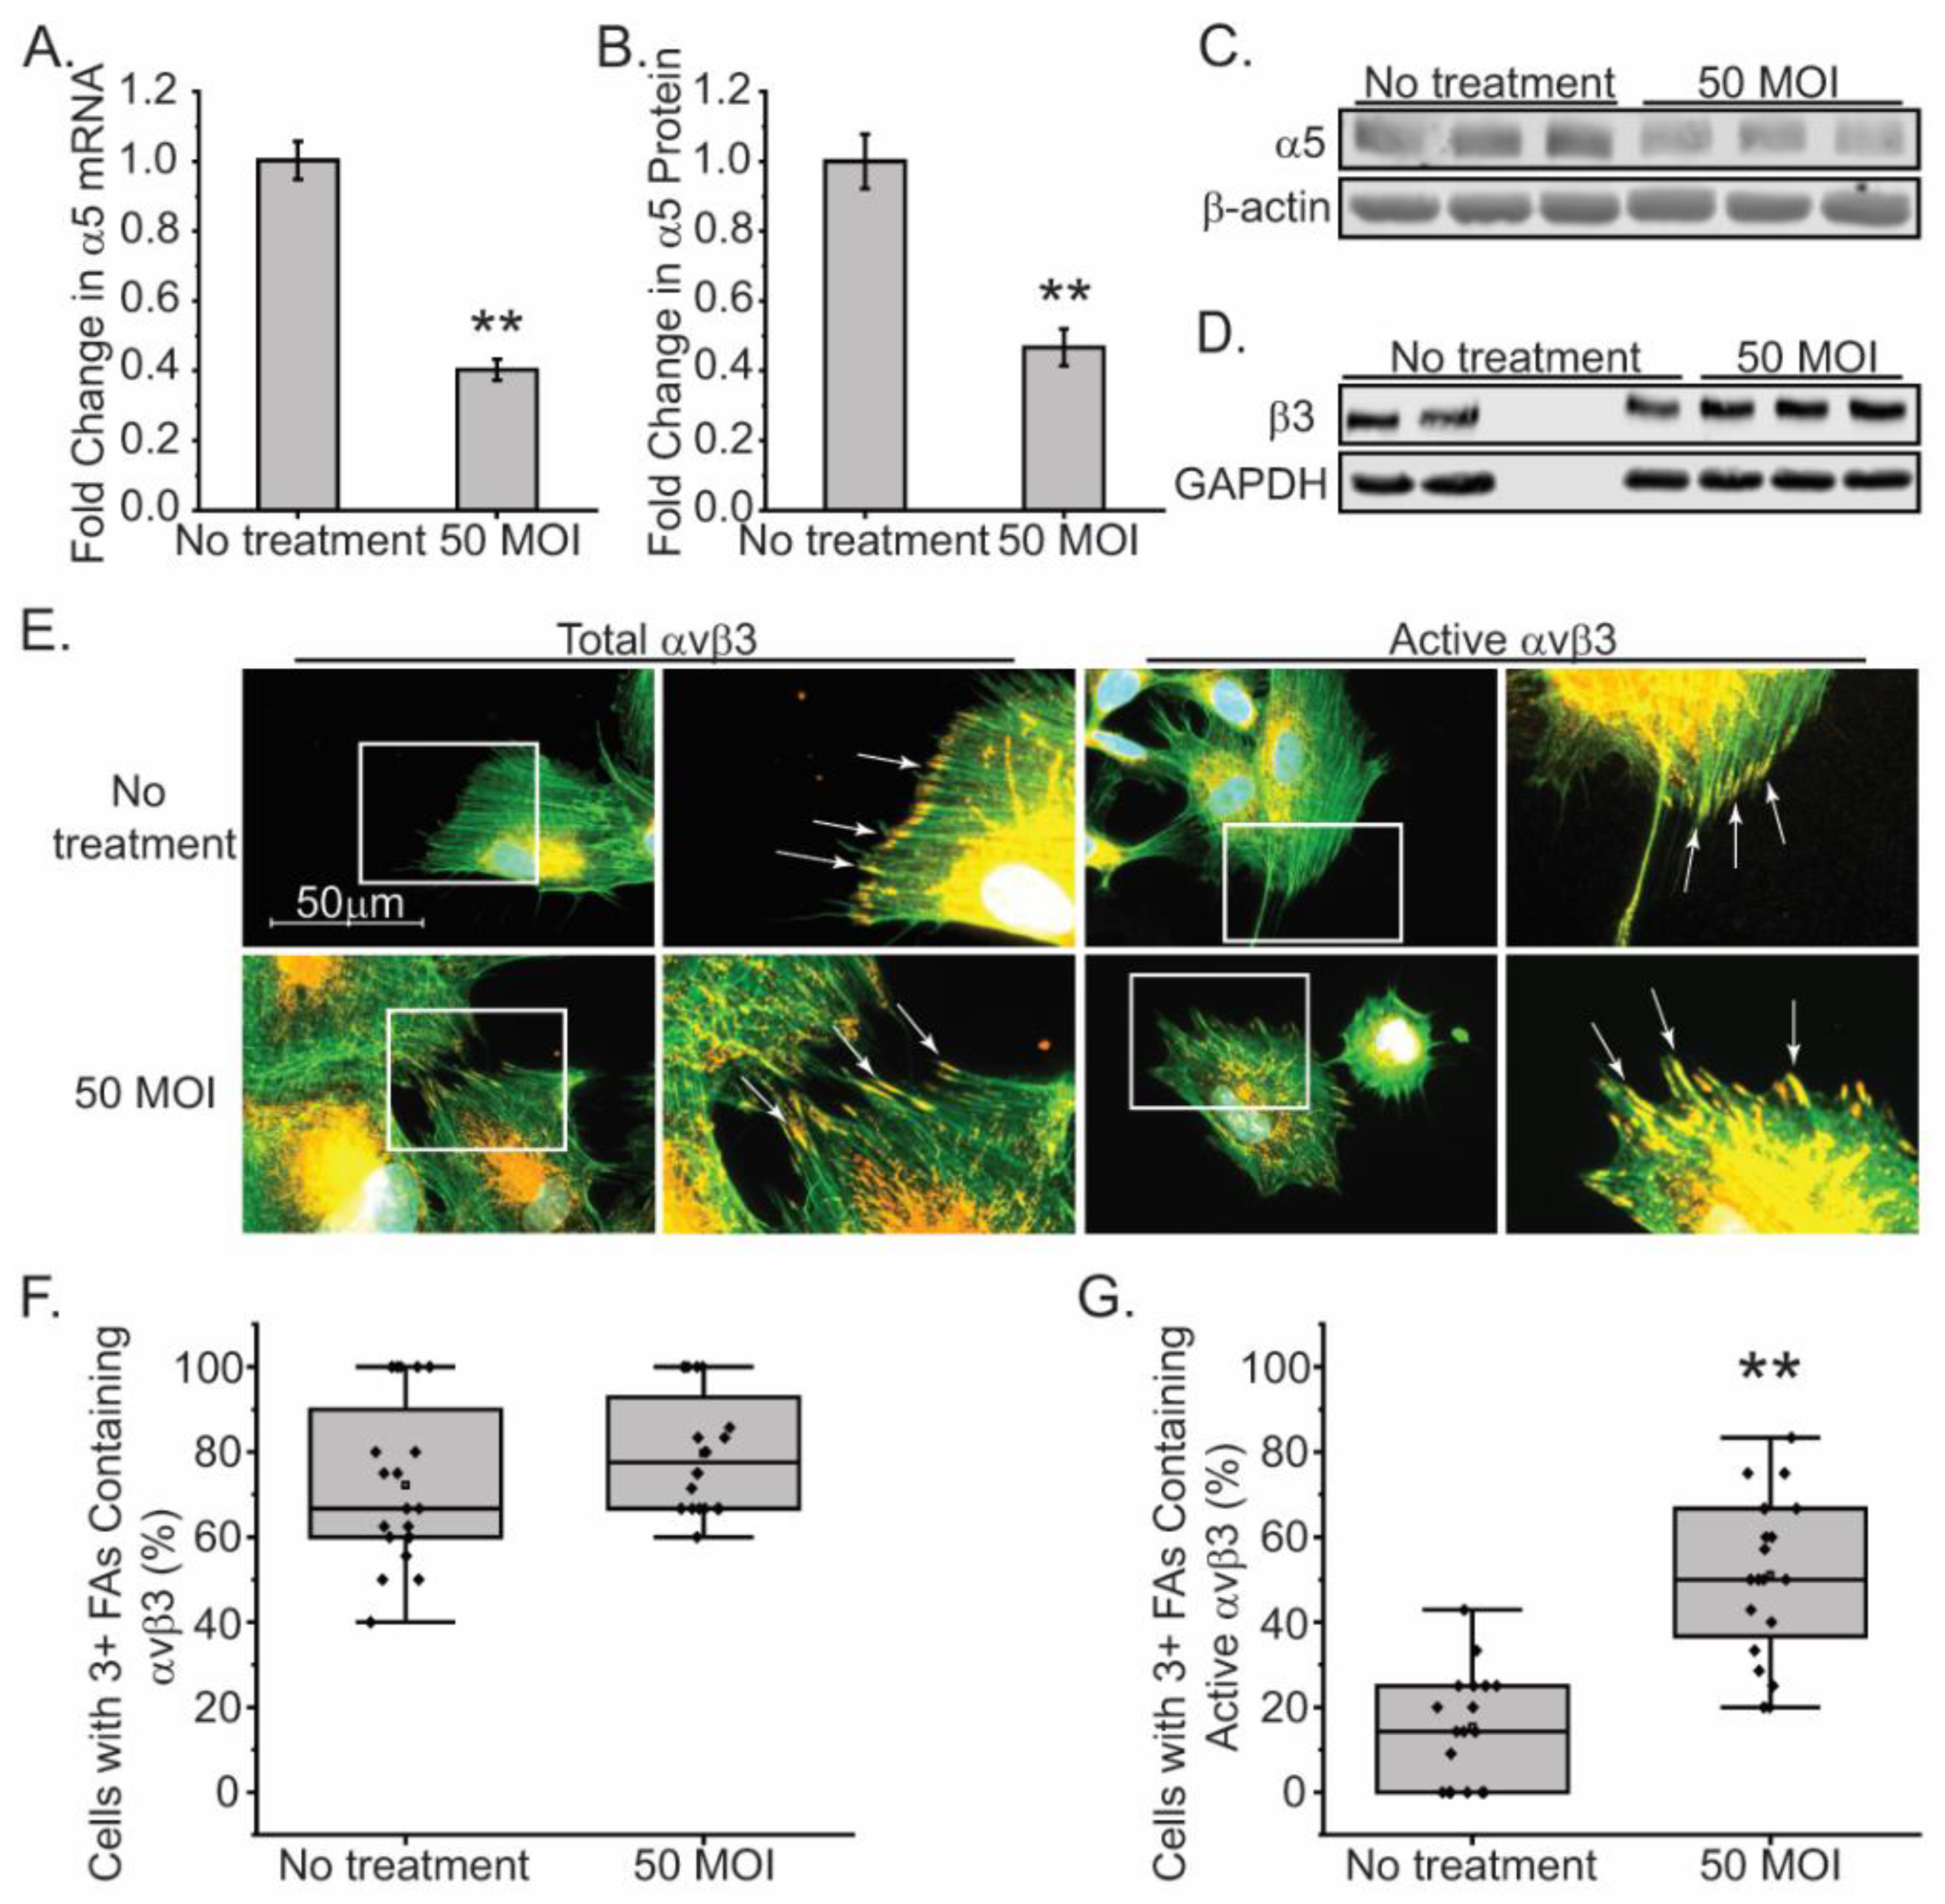
Figure 7.
Assembly of fibronectin fibrils and expression of EDB+ isoform of fibronectin (FN) is higher in old TM cells. Expression of fibronectin and its EDA+ and EDB+ isoforms were measured in 3 young cell lines (N17, N27-2, N25) and 3 old cell lines (N74, N75, and N77) using an OCW as described in material and methods. (A) EDA+, EDB+ and total FN was significantly higher in both soluble and insoluble fractions of cell layers from old cells compared to young cells. (B) Levels of EDA+ and total FN in both soluble and insoluble fractions were similar in all three old cell lines. EDB+FN, however, was found to be significantly higher in the insoluble matrix in one α5-negative cell line (N77) compared to the α5+positive N75 old cell line. *p<0.05. N=3 biological replicates/age grp. All experiments were done in triplicate and repeated in 4 independent experiments. (C) Quantitative PCR of EDA+, EDB+ and FN mRNA levels in old (pink) and young (gray) cells show that mRNA levels for EDB+FN were significantly increased in old cell lines. *p<0.05.
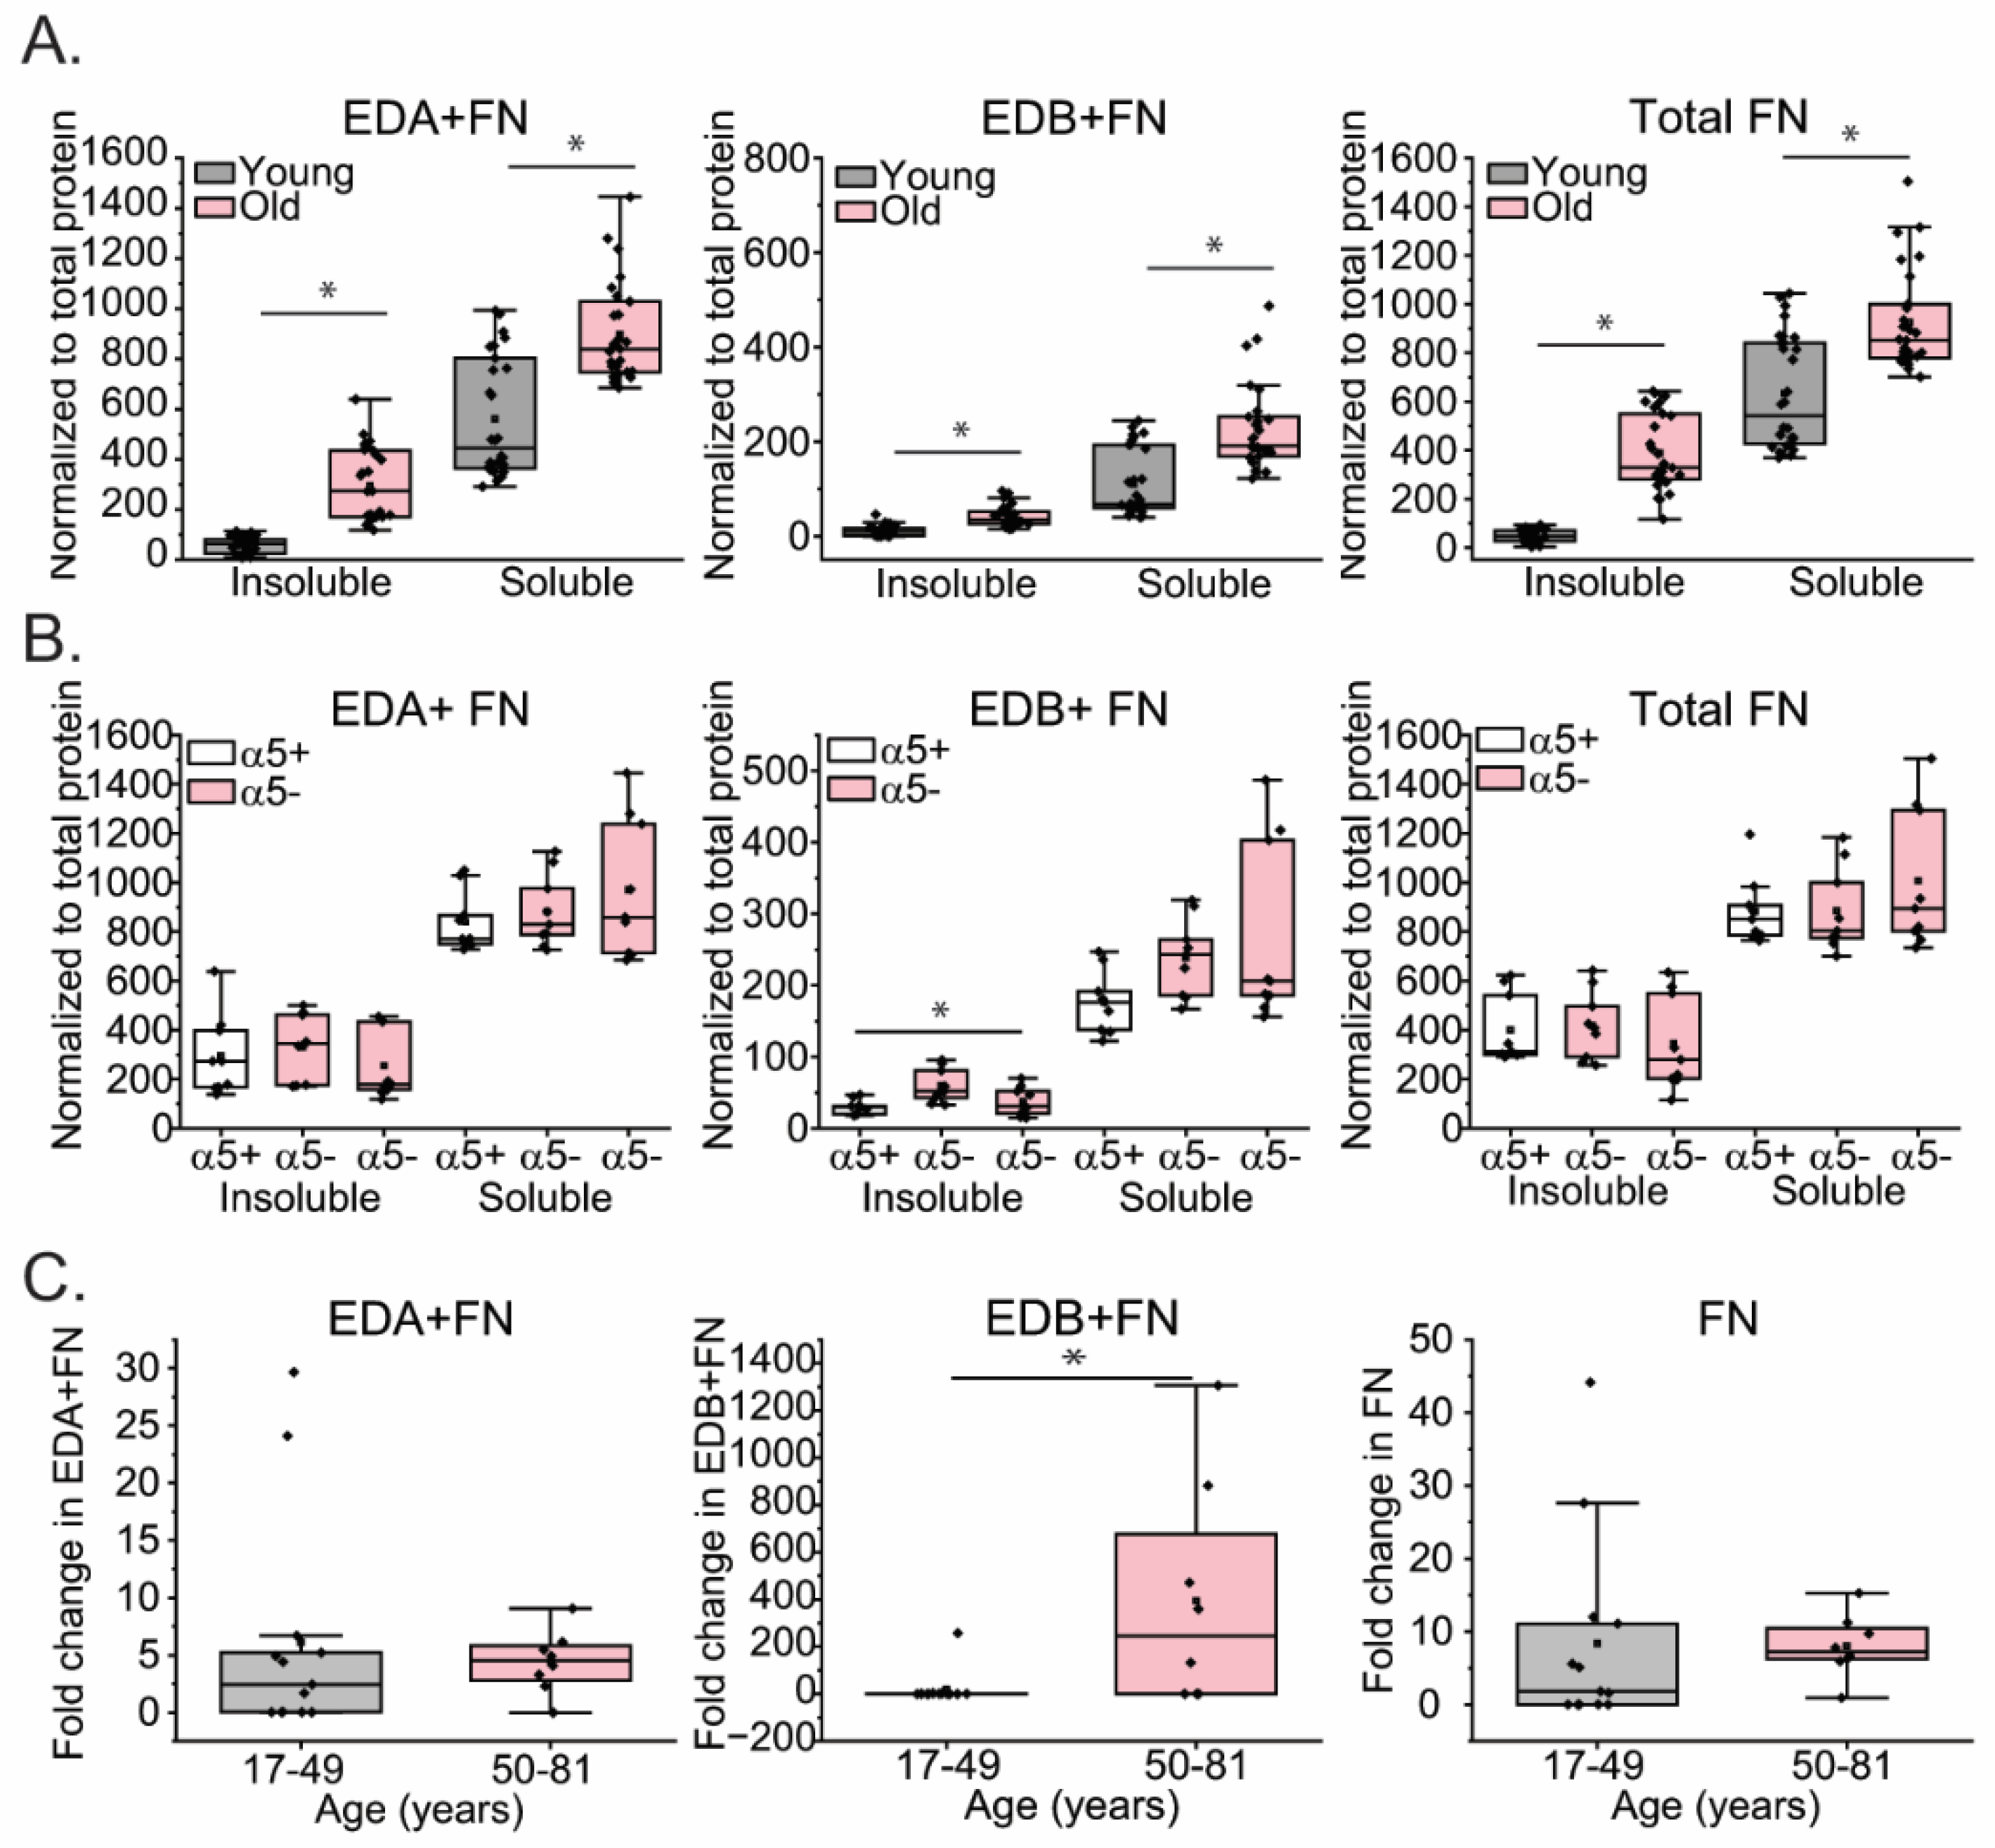
Figure 8.
Model of integrin switching in aging TM. Young TM cells initially express both α5β1 and αvβ3 integrins on their cell surface and lack actin filaments containing αSMA. αvβ3 integrins on these young cells appear to be a mixture of both active (upright conformation) and inactive (bent conformation) integrins. As the TM cells age, there is a loss of α5β1 integrins, increased activation of αvβ3 integrin on the cell surface, and an enhancement in the contractile activities of the cells. This increased contractile activity appears to be driven by the activated αvβ3 integrin that causes initiation of mechanotransduction and an increase in αSMA+ stress fibers.
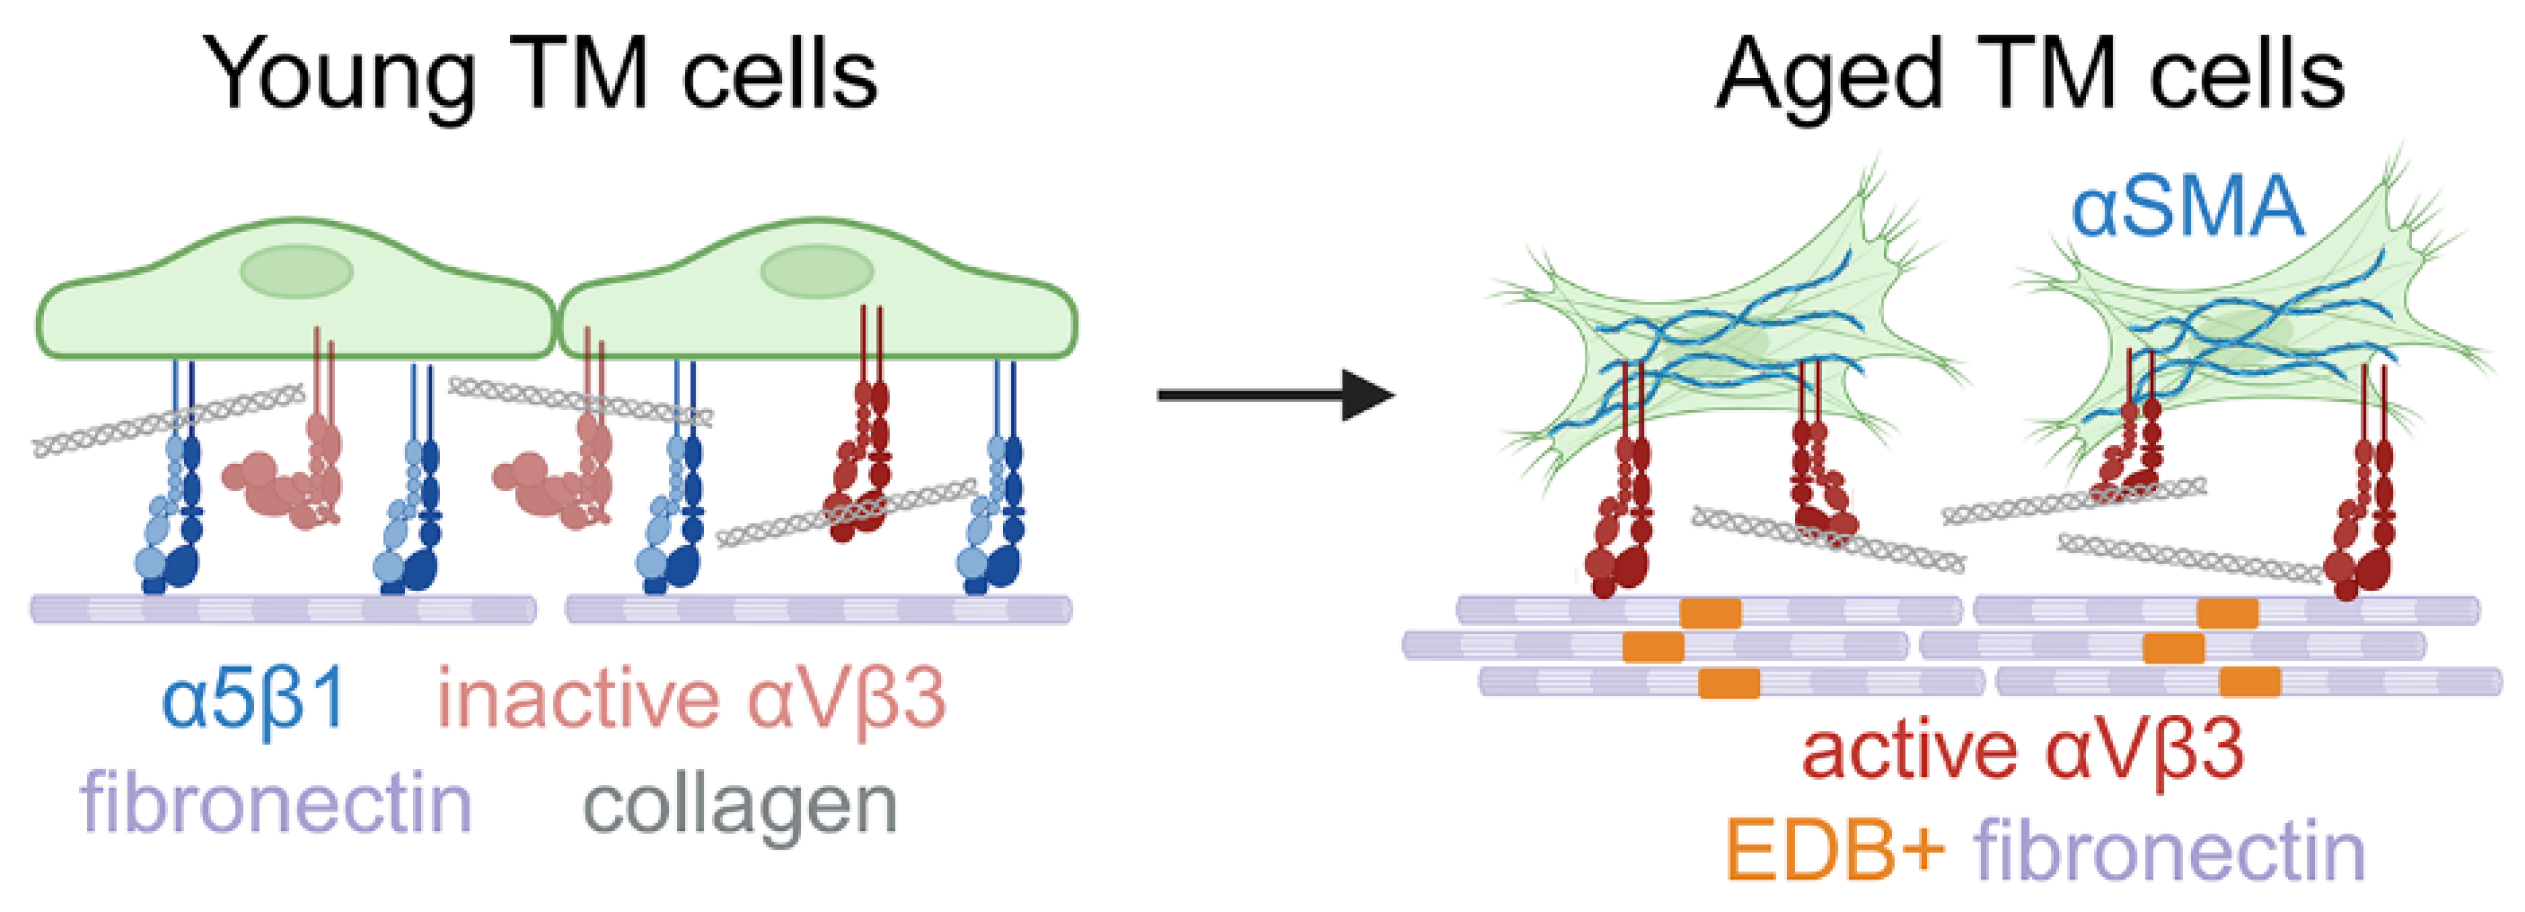

Table 1.
Cells Strains used. * Presence of α5 integrin subunit determined by FACS.
| Donor Age | Nomenclature Used in Paper | Sex | α5 integrin * | |
|---|---|---|---|---|
| N25TM-8 | 25 | N25 | M | positive |
| N27TM-6 | 27 | N27 | F | positive |
| N27TM-8 | 27 | N27-2 | F | positive |
| 2021-1493 | 74 | N74 | F | negative |
| 2021-1328 | 75 | N75 | M | positive |
| 2022-0140 | 77 | N77 | F | negative |
Disclaimer/Publisher’s Note: The statements, opinions and data contained in all publications are solely those of the individual author(s) and contributor(s) and not of MDPI and/or the editor(s). MDPI and/or the editor(s) disclaim responsibility for any injury to people or property resulting from any ideas, methods, instructions or products referred to in the content. |
© 2024 by the authors. Licensee MDPI, Basel, Switzerland. This article is an open access article distributed under the terms and conditions of the Creative Commons Attribution (CC BY) license (http://creativecommons.org/licenses/by/4.0/).
Copyright: This open access article is published under a Creative Commons CC BY 4.0 license, which permit the free download, distribution, and reuse, provided that the author and preprint are cited in any reuse.


