
Submitted:
03 December 2024
Posted:
04 December 2024
You are already at the latest version
Abstract
Electroconvulsive therapy (ECT) is utilized for treating psychiatric disorders such as schizo-phrenia (SCZ), major depressive disorder (MDD), and bipolar disorder (BD). To assess the comparative clinical efficacy and acceptability of ECT, pre- and post-treatment comparisons were conducted between groups of patients with SCZ and combined groups of patients with depression plus bipolar disorder (MDD+BD).
ECT was administered to SCZ (n = 17), and MDD+BD (n = 7) patients. Symptom were evaluated using the Brief Psychiatric Rating Scale (BPRS), and plasma brain-derived neurotrophic factor (BDNF) levels were measured.
While statistically significant differences were observed in the rating scales before ECT compared to those after ECT for each patient group, no significant change between the groups for each disorder was observed. Additionally, there were no significant differences in plasma BDNF levels between the groups at baseline and during the ECT. To estimate the difference between the SCZ and MDD + BD groups, we reanalyzed the 24 individual BPRS items. At baseline, only depression scores indicated favor towards SCZ, while positive symptoms and disorganization scores suggested a favorable condition in the MDD + BD group. During treatment, positive symptoms, activation and disorganization items showed favor in the MDD + BD groups compared to the SCZ group. The total BPRS scores were not associated with the plasma BDNF levels; however, rating scores of the several items in the activation, resistance and disorganization were positively correlated with BDNF levels.
In conclusion, although ECT was effective for patients with both SCZ and MDD+BD, the pos-itive symptoms, activation, and disorganization responses to ECT were statistically higher in MDD+BD than in SCZ, with the exception of depressive behavior. Additionally, the ECT ef-fects for several clinical outcomes of MDD+BD were associated with plasma BDNF levels. These findings suggest that ECT may be even more effective for MDD than for SCZ.
Keywords:
brief psychiatric rating scale
; electroconvulsive therapy
; schizophrenia
; major depressive disorder
; bipolar disorder
; plasma brain-derived neurotrophic factor
1. Introduction
Electroconvulsive therapy (ECT) has been widely utilized in the treatment of various psychiatric disorders, including major depressive disorder (MDD) [1,2,3,4], bipolar disorder (BD) [5,6], and schizophrenia (SCZ) [7,8,9]. Recent longitudinal magnetic resonance imaging studies have demonstrated ECT-induced changes in gray matter volume in patients with MDD [10,11,12] and SCZ [13,14,15]. Furthermore, differences in diagnosis-specific volume changes [16] and large-scale network interaction [17] between MDD and SCZ have been elucidated, although the mechanism of the antidepressant and antipsychotic actions of ECT remains incompletely understood. We are interested in whether the diagnosis-specific brain changes in response to ECT would be accompanied by clinical improvement. However, a direct comparison of ECT response between SCZ and MDD has not yet been performed using the same rating scale and measuring plasma BDNF levels.
BDNF is considered one of the potential biomarkers of ECT effects and clinical response [22]. BDNF induces sustained elevation of intracellular Ca2+ [24], and it might exhibit an anti-inflammatory effect through the inhibition of microglial activation [25,26]. These facts suggest that transdiagnostic or diagnosis-specific changes in BDNF could be associated with the clinical effects of ECT. Serum BDNF increases with long-term aerobic exercise, and it is thought that the neural activity associated with physical exercise leads to increased expression of BDNF. We are interested in whether a similar mechanism of increased BDNF expression, similar to the effects of aerobic exercise, occurs through a period of ECT in patients with severe psychiatric symptoms.
In this study, our aim is to estimate the comparative clinical efficacy and acceptability of ECT between groups of patients with SCZ and combined groups of patients with MDD and BD. The patients were evaluated using the Brief Psychiatric Rating Scale (BPRS), which is useful for measuring symptom severity and changes in symptom status in patients with MDD, BD, as well as SCZ [18,19]. We also investigated the relationship between BDNF levels and clinical outcomes before and after ECT.
2. Materials and Methods
All patients included in the study received ECT at the Hizen Psychiatric Center, Saga, Japan, between November 2017 and January 2020. Written informed consent for participation in the study was obtained from all patients and their relatives, and the procedure was approved by the ethics committee of the hospital.
Of the 24 participants, 17 were diagnosed as SCZ or schizoaffective disorder, 7 were diagnosed as MDD or BD based on DSM-IV guidelines. We have listed the patient profiles, dividing them into three groups: SC, MDD+BD, and the excluded group. The summary includes age, sex, duration of illness, number of ECT sessions, medications prescribed, and side effects. For the excluded patients, the reasons for their exclusion are also provided (Table 1). The results were compared between the SC and MDD+BD groups. Age and age of onset were significantly higher in the MDD+BD group, while the number of hospitalizations was significantly lower. Although the frequency of ECT varied depending on the patient's clinical condition, no significant differences were found in the number of ECT sessions between the two groups (Table 2).
The symptom and disease severity were assessed by experienced clinicians using the Brief Psychiatric Rating Scale (BPRS), the Clinical Global Impression scale (CGI), and the Global Assessment of Functioning (GAF). A six-factor model of the 24-item BPRS (Affect, Positive symptoms, Negative symptoms, Activation, Resistance, and Disorganization) was utilized [20].
ECT was administered with bilateral or unilateral electrodes. Anesthesia and muscle relaxation were induced intravenously using propofol (1–2 mg/kg body weight) and rocuronium (1 mg/kg), respectively.
After ECT, venous blood was collected in blood collection tubes containing EDTA 2Na and aprotinin, centrifuged at 3,500 g for 15 min at 4 °C, and the supernatant was used as a plasma sample. Plasma BDNF concentrations were measured using a commercially available ELISA kit (Mature BDNF ELISA Kit Wako 296-83201, Fujifilm Wako Pure Chemical Industries, Ltd., Osaka, Japan).
All samples were analyzed in duplicate in one session. The average values of plasma BDNF for pre-ECT (SCZ: 682±527 pg/mL and MDD+BD: 484±228 pg/mL) were close to the average value (747±193 pg/mL) and within the range (170–1126 pg/mL) reported previously [35]. All samples were anonymized, and no clinical parameters or patient data were available.
The JMP18 software (SAS Institute, Cary, NC, USA) was utilized for all statistical analyses. Analysis of variance (ANOVA) was used to compare BPRS, CGI, GAF, and BDNF between the groups, and the mean, standard deviation, F-value, and p-value were obtained. Cohen's d and 95% confidence intervals (CI) used in the forest plot were calculated from the sample size, mean, and standard deviation of each group [36]. Regression analysis was used to determine the correlation between BDNF blood concentration and BPRS sub-scores, yielding the correlation coefficient and p-value.
3. Results
There were statistically significant differences in the rating scales before ECT compared with those after ECT for each patient group; however, no significant change between the groups for each disorder was observed (Figure 1). In addition, there were no significant differences between the SCZ and MDD+BD groups in pre-ECT BPRS (p = 0.195), CGI (p = 0.938), GAF (p = 0.758), and BDNF (p = 0.736). Similarly, no significant differences were observed in post-ECT BPRS (p = 0.222), CGI (p = 0.116), GAF (p = 0.103), and BDNF (p = 1.000).
To estimate the difference between the SCZ and MDD plus BD groups, we used Cohen’s d effect size measure to reanalyze the 24 individual BPRS items. This involved subtracting the rating scales for depressive and bipolar patients from those for schizophrenia patients, thus negative values represent favoring of psychopathology in the schizophrenia group, and vice versa (Figure 2). At baseline, only depression showed negative values (p=0.029), indicating favoring of SCZ, while hallucinations (p<0.0001), unusual thought content (p=0.001), bizarre behavior (p=0.006), conceptual disorganization (p=0.025), and mannerisms and posturing (p=0.038) showed positive values, indicating favoring of MDD+BD group. During treatment, many items in addition to baseline showed significant differences between groups and positive values. Thus, the MDD+ BD groups favored compared with the SCZ in terms of hostility (p=0.007), grandiosity (p=0.011), suspiciousness (p<0.0001), hallucinations (p<0.0001), unusual thought content (p<0.0001), bizarre behavior (p<0.0001), self-neglect (p=0.018), disorientation (p=0.050), conceptual disorganization (p<0.0001), tension (p=0.044), excitement (p=0.012), distractibility (p=0.003), and mannerisms and posturing (p=0.001). Only depression showed negative values (p=0.014), indicating favoring of SCZ at post ECT.
There were no significant differences in plasma BDNF levels between the groups at baseline, and no significant variation occurred in any group during treatment (Figure 1).
Although there was a tendency for increased BPRS levels in patients with MDD+BD observed after ECT, the difference was not statistically significant. Therefore, correlations between BDNF levels and BPRS sub-scores were estimated, yielding the following results (Table 3): rating scales of hostility (p=0.0006), suspiciousness (p=0.0260), conceptual disorganization (p=0.0409), tension (p=0.0228), uncooperativeness (p=0.0006), excitement(p<0.0001), and mannerisms and posturing (p=0.0139), positively correlated with BDNF levels in MDD+BD patients after ECT. Only suspiciousness sub-score (p=0.0154), was correlated with BDNF levels in SCZ patients. These findings suggest that BDNF may be involved in the effects of ECT in patients with MDD and BD, but not in patients with SCZ.
4. Discussion
Although ECT was effective for patients with SCZ, the positive symptoms, activation, and disorganization responses to ECT were statistically lower in SCZ than in MDD+BD, with the exception of depressive behavior. The gray matter volume (GMV) has been reported to increase after ECT in both the MDD and SCZ groups, indicating that some aspects of the mechanism of ECT are common across diagnoses, while others differ between diagnoses. Specifically, alterations in GMV within the left pregenual anterior cingulate cortex (pACC) were identified as being unique to SCZ and significantly correlated with percent changes on BPRS [16]. In MDD, there was an increased SMN (somatomotor network) to VIN (visual network) connection, increased self-connection of DMN (default mode network), decreased connection from LIN (limbic network) to multiple networks, and from FPN (frontoparietal network) to SMN, as well as decreased self-connection of DAN (dorsal attention network) and LIN, compared to SCZ. The self-connection of DAN was positively associated with the Beck Depression Inventory revised version (BDI-II) scores. On the other hand, the self-connection within the DMN showed a positive association, whereas the self-connection within LIN exhibited a negative association, with the Positive and Negative Syndrome Scale (PANSS) positive symptom scores in SCZ. Furthermore, the SMN-to-VIN connection demonstrated a positive association, while the VIN-to-DMN connection and the self-connection of the DMN showed negative association with the PANSS general psychopathology scores in individuals with SCZ [17].
The diagnosis-specific effects of ECT found in this study might be related to GMV change or aberrant large-scale network interactions, although a direct explanation could not be possible. Thus, comparing post-ECT changes between the two diagnostic groups would provide differentiation between diagnosis-specific changes and transdiagnostic ones.
BDNF induces long-lasting Ca2+-activated K+ currents and sustained elevation of intracellular Ca2+ [24]. BDNF also impacts intracellular Ca (2+) signaling in microglial cells [25,26], which may be important for the regulation of inflammatory responses and could also be involved in the pathophysiology and/or treatment of psychiatric disorders. Additionally, BDNF induces a rapid increase in the total number of cell surface GABA(A) receptors through the activation of Trk B receptors [31], suggesting a relationship between GABA(A) receptor deficits and CNS disorders [33]. The pathophysiology of SCZ is related to inflammatory responses mediated by microglia and intracellular Ca (2+) signaling [34]. However, our results showed no significant change in BDNF levels in SCZ both before and after ECT. On the other hand, no association of pro BDNF and BDNF levels with depressive state was reported [35], although the present results elucidated positive correlations between BDNF levels and BPRS sub scores in MDD + BD patients after ECT. Our results might indicate a diagnosis-specific change in BDNF after ECT. The ECT-induced change in BDNF levels has been reported in patients with MDD [27] and SCZ [29], though the results were conflicting [28,30].
A 2019 Cochrane review revealed that ECT has a positive effect on medium-term clinical response for patients with treatment-resistant schizophrenia (TRS); however, there is no clear and convincing advantage or disadvantage for adding ECT to standard care for other outcomes [7]. On the other hand, ECT has been proven effective in patients with treatment-resistant depression (TRD) [1,21]. Searches of the PubMed database were conducted in June 2023 using the medical subject headings (MeSH) terms 'ECT', 'treatment-resistant depression (TRD)', and 'treatment-resistant schizophrenia (TRS)'. The search identified 7,994 TRD reports, including 761 ECT reports, and 2,857 TRS reports, including 202 ECT reports. Therefore, the percentage of 'ECT' in 'TRD' was larger than that in 'TRS' (9.9% vs. 7.1%). These identified publications suggest that the utilization rate of ECT may be lower for the treatment of SCZ than for MDD + BD.
Utilization and practice of ECT worldwide indicate that affective disorders (unipolar/bipolar depression) are the main diagnoses in Australia, New Zealand, USA, Europe, while SCZ is the main diagnosis in Asia overall [23]. In Western countries, the majority of patients are older women with MDD, whereas in Asian countries, younger men with schizophrenia constitute the majority [4].
If the brain sites of ECT's antipsychotic and antidepressant effects can be estimate, we may be able to predict the therapeutic efficacy of ECT using brain imaging after ECT. This might provide an effective means of treating treatment-resistant depression as well as treating treatment-resistant schizophrenia, including clozapine.
5. Conclusions
In conclusion, although ECT was effective for patients with both SCZ and MDD+BD, the positive symptoms, activation, and disorganization responses to ECT were statistically higher in MDD+BD than in SCZ, with the exception of depressive behavior. Additionally, the ECT effects for several clinical outcomes of MDD+BD were associated with plasma BDNF levels. These findings suggest that ECT may be even more effective for MDD than for SCZ. The findings and their implications should be discussed in the broadest context possible. Future research directions may also be highlighted.
Limitation: In this study, we grouped depression and bipolar affective disorder together. The breakdown is as follows: depression (F329) 3 cases, bipolar affective disorder (F319) 2 cases, bipolar affective disorder with severe depressive episode without psychotic symptoms (F314) 1 case, and bipolar affective disorder with severe depressive episode with psychotic symptoms (F315) 1 case. In general, manic episodes are last from two weeks to four to five months, while depressive episodes typically last around six months. Particularly in the elderly, depressive episodes can last for more than a year. The ages of the F319 cases are 57 and 63, which are elderly, and it is thought that their depressive states may continue for a relatively long time. Since F314 represents severe depression without psychotic symptoms, these three cases can be included in the depression group. The issue is with F315, but we have included this case in the group. The F323 exhibited severe psychiatric symptoms and was administered risperidone, so was added to the SC group. These points should be noted to draw attention to careful interpretation of the results.
Author Contributions
Conceptualization, H.I., M.H and Y.M. ; methodology, H.I., Y.I., H.K. and M.H.; software, N.N. and T.N.; validation, N.N., T.N., T.M. and T.U.; formal analysis, N.N.,Y.I., H.K. and T.N. ; investigation, N.N.,Y.I., H.K. and H.I.; resources, H.I., M.H.; data curation, N.N.,Y.I. and H.K.; writing—original draft preparation T.N., N.N. and T.M.; writing—review and editing, N.N.,T.M.,T.U. and Y.M.; visualization, N.N., T.N., T.M. and H.I.; supervision, T.U. and Y.M.; project administration, T.U.; funding acquisition, T.U. All authors have read and agreed to the published version of the manuscript.
Funding
This research was supported in part by Grants-in-Aid for Scientific Research on Health, Labour and Welfare KAKENHI under grant number 20GC1017 (TU).
Institutional Review Board Statement
The study was conducted in accordance with the Declaration of Helsinki, and approved by the Institutional Review Board of Hizen Psychiatric Medical Center (protocol code 29-3 and date of approval 27 April 2017).
Informed Consent Statement
Informed consent was obtained from all subjects involved in the study. Written informed consent was obtained from all subjects to publish this paper.
Data Availability Statement
The data that support the findings of this study are available on requestfrom the corresponding authors upon reasonable request. The data are not publicly available due to privacy or ethical restrictions.
Acknowledgments
We thank the Clinical Laboratory Department and Nursing Department of Hizen Mental Health Center for their cooperation in collecting blood samples.
Conflicts of Interest
The authors declare no conflicts of interest.
References
- Trifu S, Sevcenco A, Stănescu M, Drăgoi AM, Cristea MB. Efficacy of electroconvulsive therapy as a potential first-choice treatment in treatment-resistant depression (Review). Exp Ther Med. 2021, 22, 1281. [Google Scholar] [CrossRef] [PubMed]
- Hermida AP, Glass OM, Shafi H, McDonald WM. Electroconvulsive Therapy in Depression: Current Practice and Future Direction. Psychiatr Clin North Am. 2018, 41, 341–353. [Google Scholar] [CrossRef] [PubMed]
- Li M, Yao X, Sun L, Zhao L, Xu W, Zhao H, Zhao F, Zou X, Cheng Z, Li B, Yang W, Cui R. Effects of Electroconvulsive Therapy on Depression and Its Potential Mechanism. Front Psychol. 2020, 11, 80.
- Stippl A, Kirkgöze FN, Bajbouj M, Grimm S. Differential Effects of Electroconvulsive Therapy in the Treatment of Major Depressive Disorder. Neuropsychobiology. 2020, 79, 408–416. [Google Scholar] [CrossRef] [PubMed]
- Mutz, J. Brain stimulation treatment for bipolar disorder. Bipolar Disord. 2023, 25, 9–24. [Google Scholar] [CrossRef] [PubMed]
- Ljubic N, Ueberberg B, Grunze H, Assion HJ. Treatment of bipolar disorders in older adults: a review. Ann Gen Psychiatry 2021, 20, 45. [Google Scholar] [CrossRef] [PubMed]
- Sinclair DJ, Zhao S, Qi F, Nyakyoma K, Kwong JS, Adams CE. Electroconvulsive therapy for treatment-resistant schizophrenia. Cochrane Database Syst Rev. 2019, 3, CD011847. [PubMed]
- Grover S, Sahoo S, Rabha A, Koirala R. ECT in schizophrenia: a review of the evidence. Acta Neuropsychiatr. 2019, 31, 115–127. [Google Scholar] [CrossRef] [PubMed]
- Ali SA, Mathur N, Malhotra AK, Braga RJ. Electroconvulsive Therapy and Schizophrenia: A Systematic Review. Mol Neuropsychiatry 2019, 5, 75–83. [Google Scholar] [PubMed]
- Ousdal OT, Argyelan M, Narr KL, Abbott C, Wade B, Vandenbulcke M, Urretavizcaya M, Tendolkar I, Takamiya A, Stek ML, Soriano-Mas C, Redlich R, Paulson OB, Oudega ML, Opel N, Nordanskog P, Kishimoto T, Kampe R, Jorgensen A, Hanson LG, Hamilton JP, Espinoza R, Emsell L, van Eijndhoven P, Dols A, Dannlowski U, Cardoner N, Bouckaert F, Anand A, Bartsch H, Kessler U, Oedegaard KJ, Dale AM, Oltedal L; GEMRIC. Brain Changes Induced by Electroconvulsive Therapy Are Broadly Distributed. Biol Psychiatry. 2020, 87, 451–461. [PubMed]
- Joshi SH, Espinoza RT, Pirnia T, Shi J, Wang Y, Ayers B, Leaver A, Woods RP, Narr KL. Structural Plasticity of the Hippocampus and Amygdala Induced by Electroconvulsive Therapy in Major Depression. Biol Psychiatry. 2016, 79, 282–92. [Google Scholar] [CrossRef] [PubMed]
- Takamiya A, Plitman E, Chung JK, Chakravarty M, Graff-Guerrero A, Mimura M, Kishimoto T. Acute and long-term effects of electroconvulsive therapy on human dentate gyrus. Neuropsychopharmacology. 2019, 44, 1805–1811. [Google Scholar] [CrossRef] [PubMed]
- Thomann PA, Wolf RC, Nolte HM, Hirjak D, Hofer S, Seidl U, Depping MS, Stieltjes B, Maier-Hein K, Sambataro F, Wüstenberg T. Neuromodulation in response to electroconvulsive therapy in schizophrenia and major depression. Brain Stimul. 2017, 10, 637–644. [Google Scholar] [CrossRef] [PubMed]
- Jiang Y, Xia M, Li X, Tang Y, Li C, Huang H, Dong D, Jiang S, Wang J, Xu J, Luo C, Yao D. Insular changes induced by electroconvulsive therapy response to symptom improvements in schizophrenia. Prog Neuropsychopharmacol Biol Psychiatry. 2019, 89, 254–262. [Google Scholar] [CrossRef] [PubMed]
- Shan X, Zhang H, Dong Z, Chen J, Liu F, Zhao J, Zhang H, Guo W. Increased subcortical region volume induced by electroconvulsive therapy in patients with schizophrenia. Eur Arch Psychiatry Clin Neurosci. 2021, 271, 1285–1295. [Google Scholar] [CrossRef] [PubMed]
- Kawashima H, Yamasaki S, Kubota M, Hazama M, Fushimi Y, Miyata J, Murai T, Suwa T. Commonalities and differences in ECT-induced gray matter volume change between depression and schizophrenia. Neuroimage Clin. 2023, 38, 103429. [Google Scholar] [CrossRef] [PubMed]
- Ishida T, Nakamura Y, Tanaka SC, Mitsuyama Y, Yokoyama S, Shinzato H, Itai E, Okada G, Kobayashi Y, Kawashima T, Miyata J, Yoshihara Y, Takahashi H, Morita S, Kawakami S, Abe O, Okada N, Kunimatsu A, Yamashita A, Yamashita O, Imamizu H, Morimoto J, Okamoto Y, Murai T, Kasai K, Kawato M, Koike S. Aberrant Large-Scale Network Interactions Across Psychiatric Disorders Revealed by Large-Sample Multi-Site Resting-State Functional Magnetic Resonance Imaging Datasets. Schizophr Bull. Online ahead of print. 2023, 9, sbad022. [PubMed]
- Park SC, Jang EY, Kim D, Jun TY, Lee MS, Kim JM, Kim JB, Jo SJ, Park YC. Dimensional approach to symptom factors of major depressive disorder in Koreans, using the Brief Psychiatric Rating Scale: the Clinical Research Center for Depression of South Korea study. Kaohsiung J Med Sci. 2015, 31, 47–54. [Google Scholar] [CrossRef] [PubMed]
- Zanello A, Berthoud L, Ventura J, Merlo MC. The Brief Psychiatric Rating Scale (version 4.0) factorial structure and its sensitivity in the treatment of outpatients with unipolar depression. Psychiatry Res. 2013, 210, 626–33. [Google Scholar] [CrossRef] [PubMed]
- Dazzi F, Shafer A, Lauriola M. Meta-analysis of the Brief Psychiatric Rating Scale - Expanded (BPRS-E) structure and arguments for a new version. J. Psychiatr Res. 2016, 81, 140–151. [CrossRef] [PubMed]
- Li H, Cui L, Li J, Liu Y, Chen Y. Comparative efficacy and acceptability of neuromodulation procedures in the treatment of treatment-resistant depression: a network meta-analysis of randomized controlled trials. J Affect Disord. 2021, 287, 115–124. [Google Scholar] [CrossRef] [PubMed]
- Maffioletti E, Carvalho Silva R, Bortolomasi M, Baune BT, Gennarelli M, Minelli A. Molecular Biomarkers of Electroconvulsive Therapy Effects and Clinical Response: Understanding the Present to Shape the Future. Brain Sci. 2021, 11, 1120. [Google Scholar] [CrossRef] [PubMed]
- Leiknes KA, Jarosh-von Schweder L, Høie B. Contemporary use and practice of electroconvulsive therapy worldwide. Brain Behav. 2012, 2, 283–344. [Google Scholar] [CrossRef] [PubMed]
- Mizoguchi Y, Monji A, Nabekura J. Brain-derived neurotrophic factor induces long-lasting Ca2+-activated K+ currents in rat visual cortex neurons. Eur J Neurosci. 2002, 16, 1417–24. [Google Scholar] [CrossRef] [PubMed]
- Mizoguchi Y, Monji A, Kato T, Seki Y, Gotoh L, Horikawa H, Suzuki SO, Iwaki T, Yonaha M, Hashioka S, Kanba S. Brain-derived neurotrophic factor induces sustained elevation of intracellular Ca2+ in rodent microglia. J Immunol. 2009, 183, 7778–86. [Google Scholar] [CrossRef] [PubMed]
- Mizoguchi Y, Kato TA, Seki Y, Ohgidani M, Sagata N, Horikawa H, Yamauchi Y, Sato-Kasai M, Hayakawa K, Inoue R, Kanba S, Monji A. Brain-derived neurotrophic factor (BDNF) induces sustained intracellular Ca2+ elevation through the up-regulation of surface transient receptor potential 3 (TRPC3) channels in rodent microglia. J Biol Chem. 2014, 289, 18549–55. [Google Scholar] [CrossRef] [PubMed]
- Rocha RB, Dondossola ER, Grande AJ, Colonetti T, Ceretta LB, Passos IC, Quevedo J, da Rosa MI. Increased BDNF levels after electroconvulsive therapy in patients with major depressive disorder: A meta-analysis study. J Psychiatr Res. 2016, 83, 47–53. [Google Scholar] [CrossRef] [PubMed]
- Meshkat S, Alnefeesi Y, Jawad MY, D Di Vincenzo J, B Rodrigues N, Ceban F, Mw Lui L, McIntyre RS, Rosenblat JD. Brain-Derived Neurotrophic Factor (BDNF) as a biomarker of treatment response in patients with Treatment Resistant Depression (TRD): A systematic review & meta-analysis. Psychiatry Res. 2022, 317, 114857. [Google Scholar] [PubMed]
- Li J, Zhang X, Tang X, Xiao W, Ye F, Sha W, Jia Q. Neurotrophic factor changes are essential for predict electroconvulsive therapy outcome in schizophrenia. Schizophr Res. 2020, 218, 295–297. [Google Scholar] [CrossRef] [PubMed]
- Akbas I, Balaban OD. Changes in serum levels of brain-derived neurotrophic factor with electroconvulsive therapy and pharmacotherapy and its clinical correlates in male schizophrenia patients. Acta Neuropsychiatr. 2022, 34, 99–105. [Google Scholar] [CrossRef] [PubMed]
- Mizoguchi Y, Ishibashi H, Nabekura J. The action of BDNF on GABA(A) currents changes from potentiating to suppressing during maturation of rat hippocampal CA1 pyramidal neurons. J Physiol. 2003, 548, 703–9. [Google Scholar] [CrossRef] [PubMed]
- Wessels JM, Agarwal RK, Somani A, Verschoor CP, Agarwal SK, Foster WG. Factors affecting stability of plasma brain-derived neurotrophic factor. Sci Rep. 2020, 10, 20232. [Google Scholar] [CrossRef] [PubMed]
- Ghit A, Assal D, Al-Shami AS, Hussein DEE. GABAA receptors: structure, function, pharmacology, and related disorders. J Genet Eng Biotechnol. 2021, 19, 123. [Google Scholar] [PubMed]
- Mizoguchi Y, Kato TA, Horikawa H, Monji A. Microglial intracellular Ca (2+) signaling as a target of antipsychotic actions for the treatment of schizophrenia. Front Cell Neurosci. 2014, 8, 370. [Google Scholar] [PubMed]
- Ohto A, Mizoguchi Y, Imamura Y, Kojima N, Yamada S, Monji A. No association of both serum pro-brain-derived neurotrophic factor (pro BDNF) and BDNF concentrations with depressive state in community-dwelling elderly people. Psychogeriatrics. 2021, 21, 503–513. [Google Scholar] [CrossRef] [PubMed]
- Nakagawa S, Cuthill IC. Effect size, confidence interval, and statistical significance: a practical guide for biologists. Biol Rev Camb Philos Soc. 2007, 82, 591–605. [PubMed]
Figure 1.
Effects of ECT on BPRS (A), CGI (B), GAF (C) scores and plasma BDNF levels of patients with schizophrenia (SCZ) and depressive (MDD), bipolar (BD) disorder.
Figure 1.
Effects of ECT on BPRS (A), CGI (B), GAF (C) scores and plasma BDNF levels of patients with schizophrenia (SCZ) and depressive (MDD), bipolar (BD) disorder.
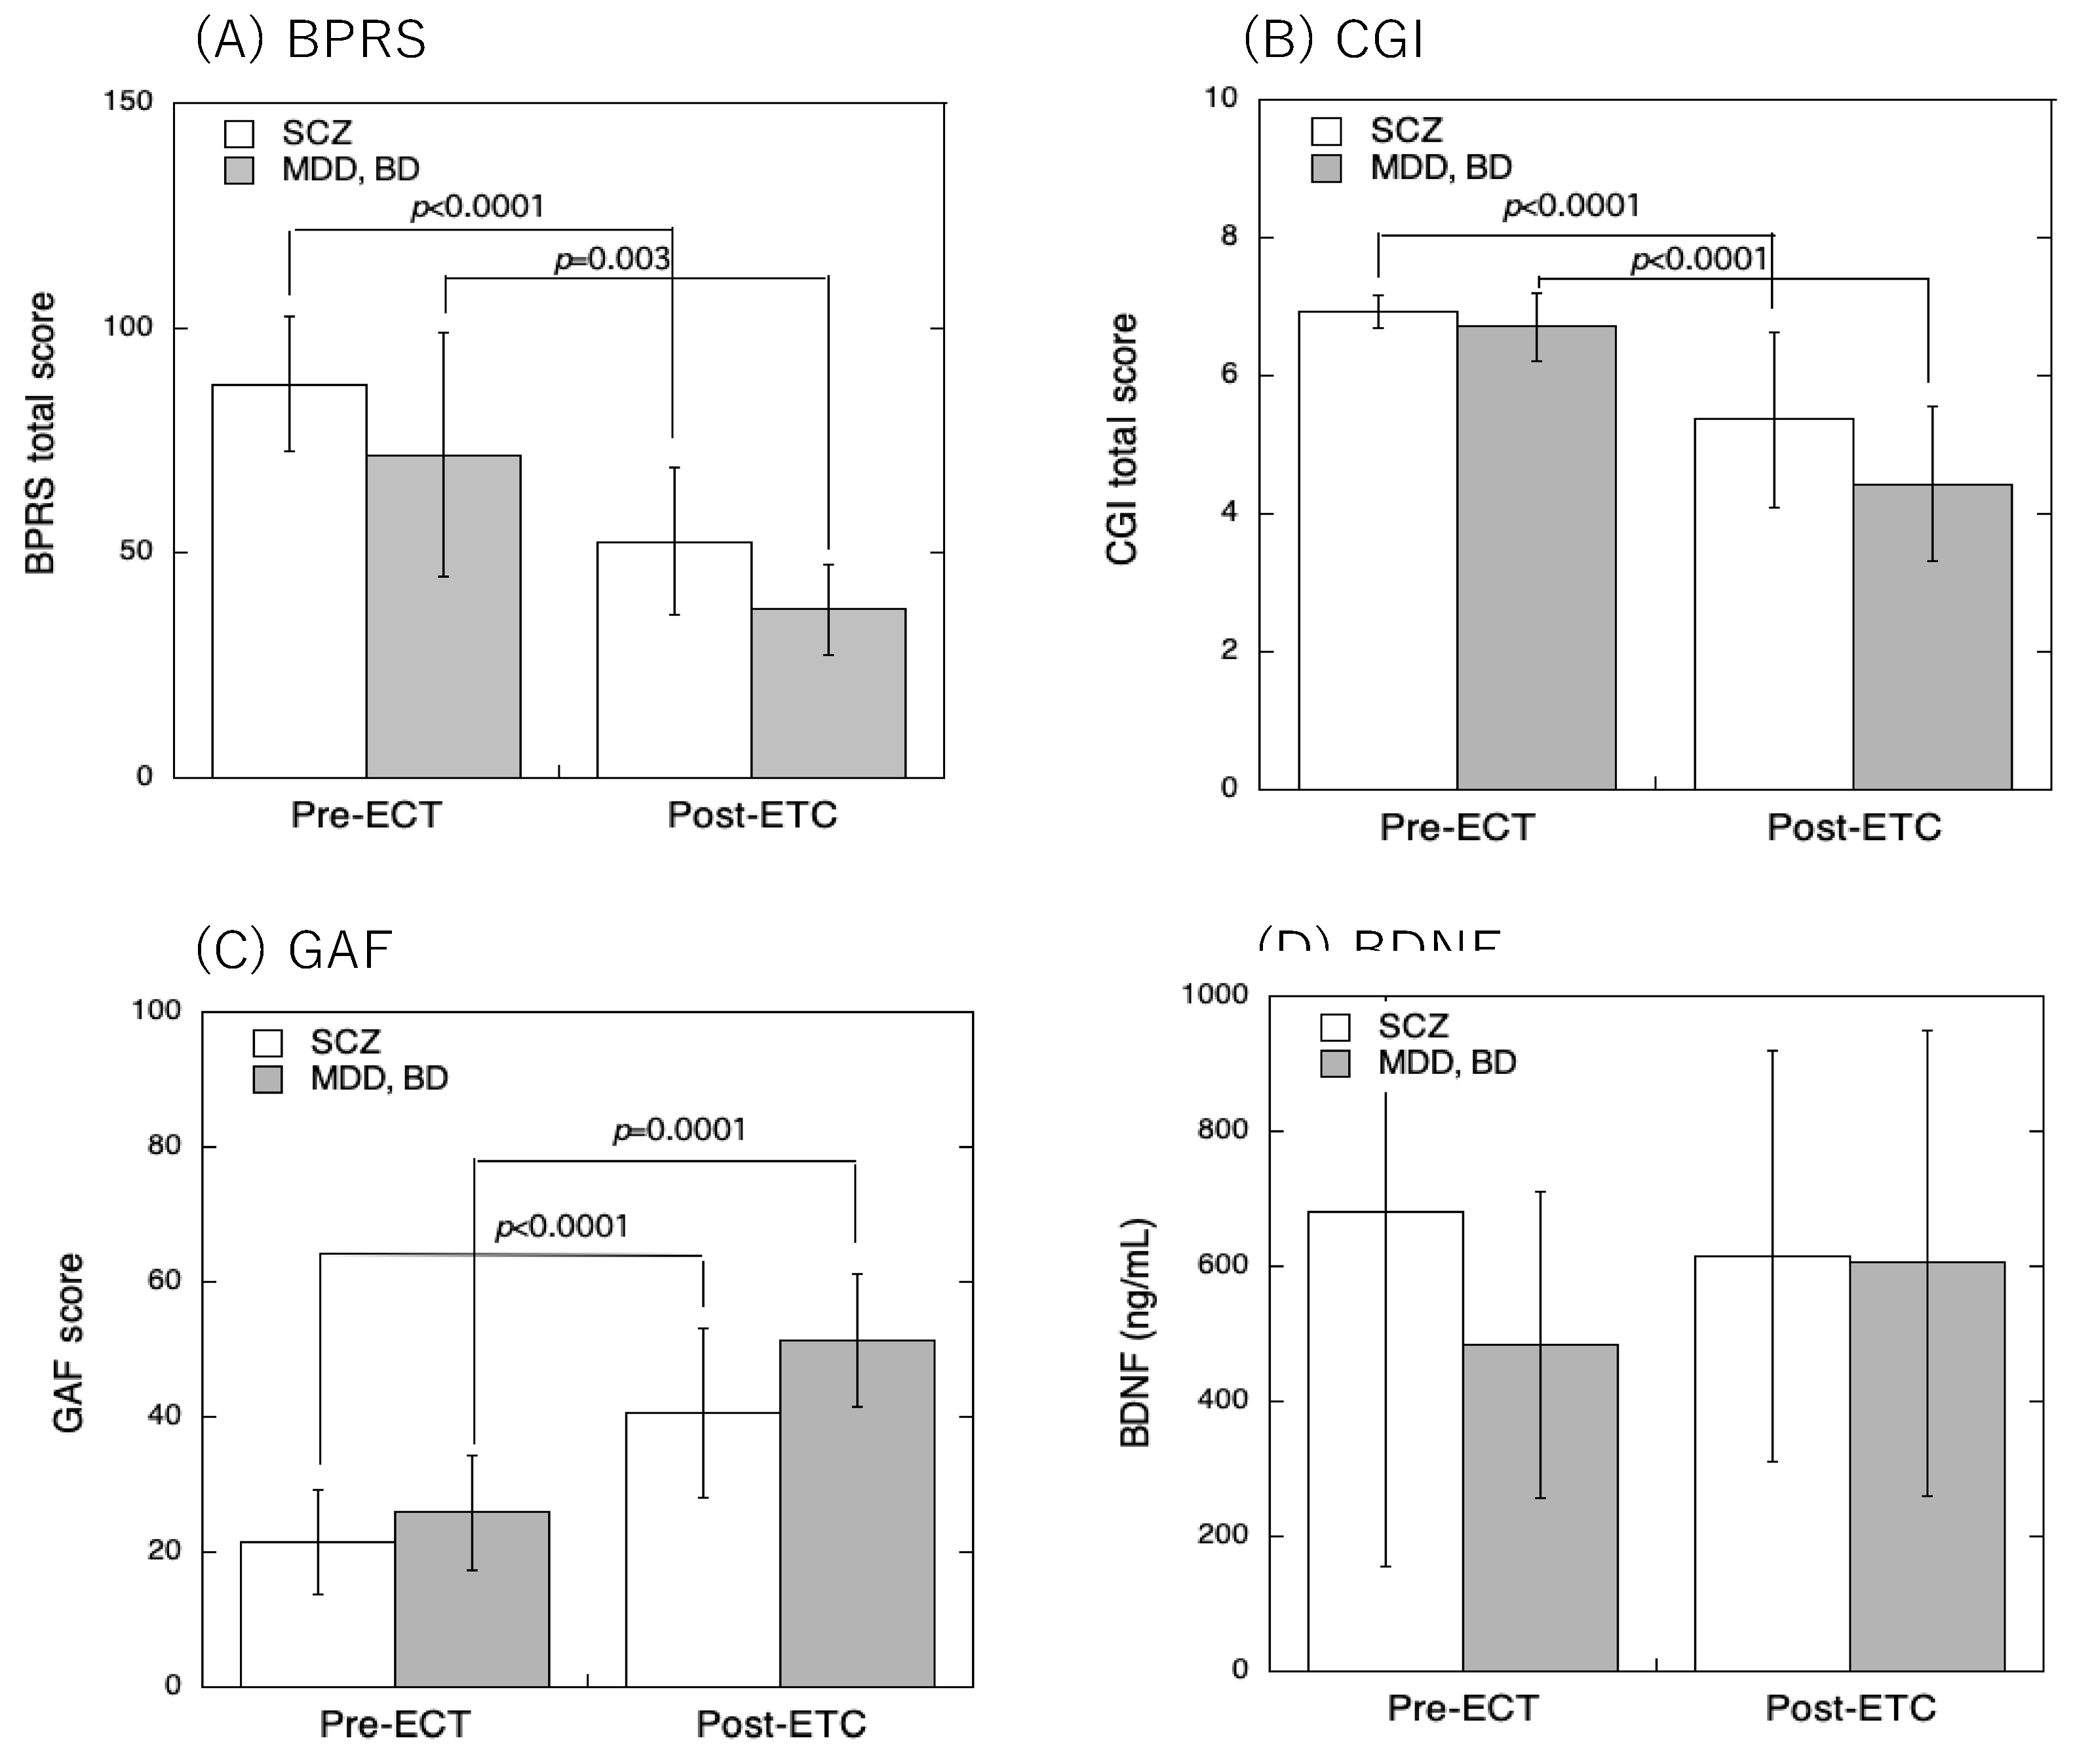
Figure 2.
Forrest plot comparison of pre- and post-ECT. Standardized mean differences in BPRS sub-scores (Cohen’s d) between schizophrenia (SCZ) and depressive disorder and bipolar disorder (MDD, BD) were plotted.
Figure 2.
Forrest plot comparison of pre- and post-ECT. Standardized mean differences in BPRS sub-scores (Cohen’s d) between schizophrenia (SCZ) and depressive disorder and bipolar disorder (MDD, BD) were plotted.
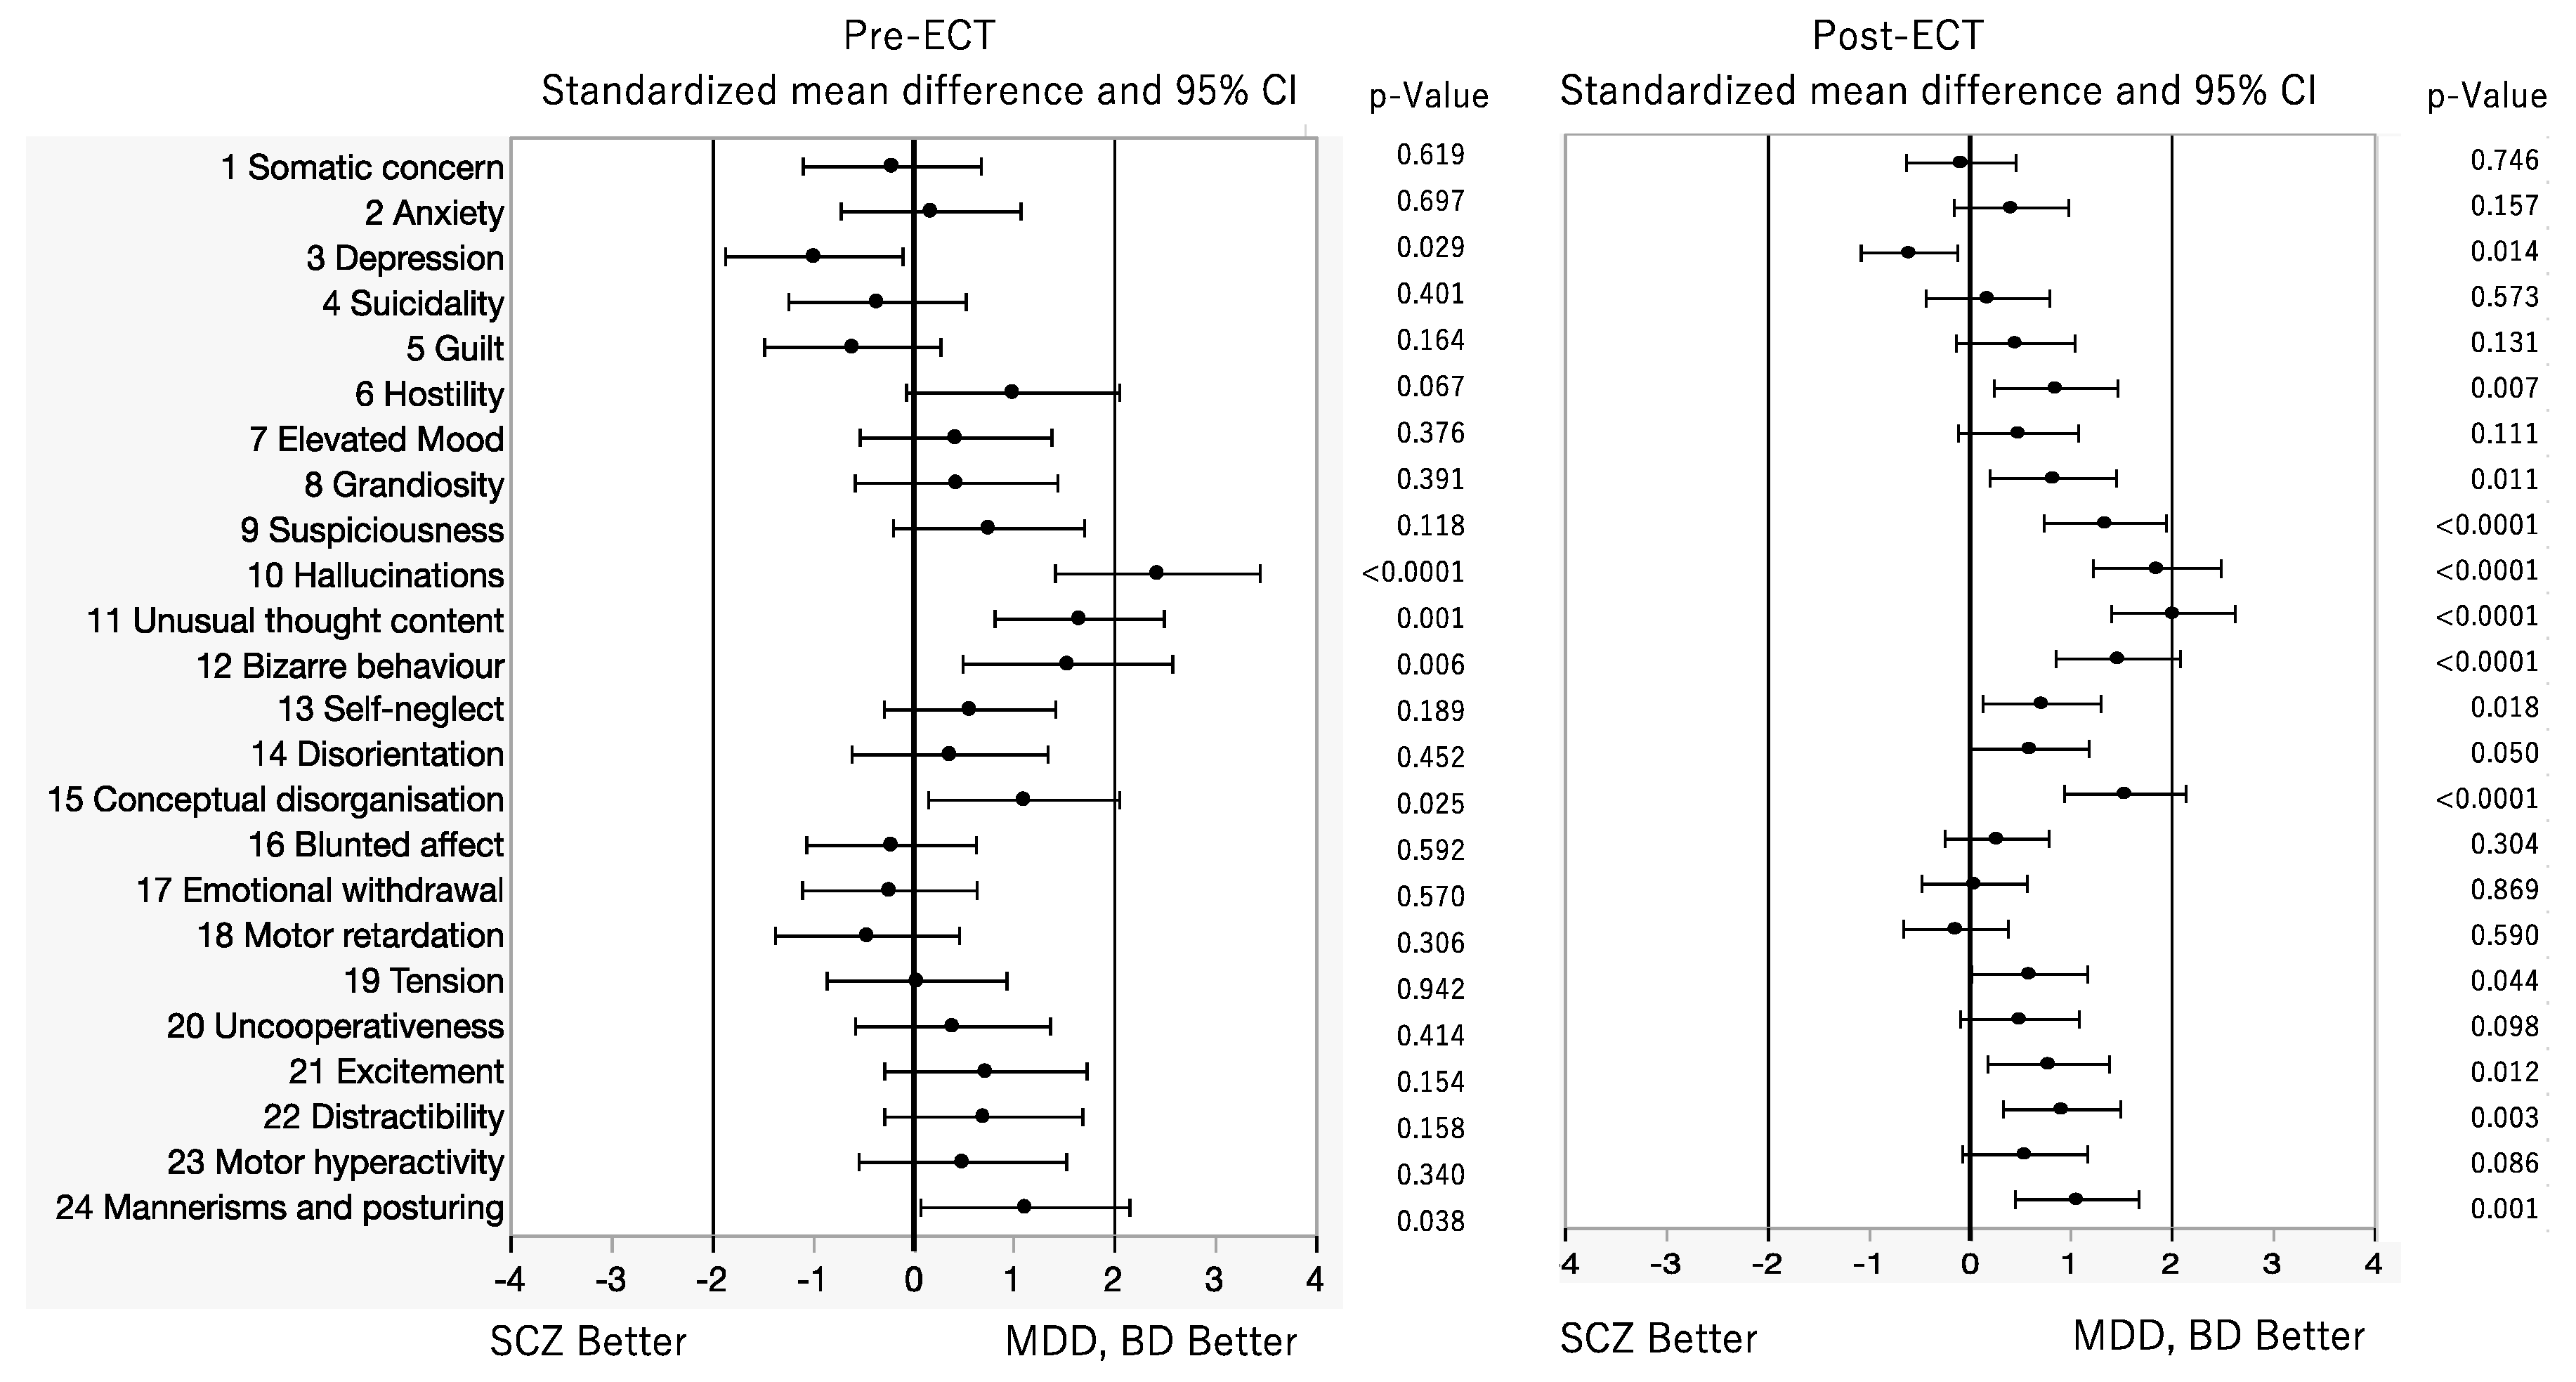

Table 1.
Participant demographic characteristics.
| Patients | No | Age | Sex | Diagnosis | Diagnosis (F-code) |
On set age(y) | Illness Period until ECT(y) | Number of hospitalizations | Number of acute ECT treatments | Number of continua-tion of ECT | Number of maintenance ECT | Concomitant psychotropics | Disorganization responses to ECT | |
|---|---|---|---|---|---|---|---|---|---|---|---|---|---|---|
| SC group | before | after | ||||||||||||
| 1 | 1 | 27 | M | SC | SC(F200) | 20 | 7 | 2 | 12 | - | - | HPD9mg, Que400mg | HPD3mg, Ola20mg | - |
| 2 | 3 | 26 | M | SC | SC(F209) | 18 | 8 | 2 | 15 | 18 | 10 | Ola20mg, HPD9mg | Ola20mg, Lam200mg, LPZ50mg | - |
| 3 | 4 | 64 | M | SC | SC(F202) | 28 | 36 | 5 | 11 | 8 | - | Zot75mg | Zot75mg | - |
| 4 | 5 | 32 | M | SC | SC(F209) | 25 | 7 | 2 | 12 | 25 | 2 | Ris12mg, Que200mg | Ris10mg, HPD4.5mg | - |
| 5 | 7 | 19 | M | SC | SC(F209) | 15 | 7 | 4 | 12 | - | - | Clo600mg | Clo550mg | |
| 6 | 8 | 30 | M | SC | SC(F209) | 24 | 6 | 6 | 27 | 10 | - | Zot150㎎,HPDinj5mg | Ola20mg, Zot150㎎、HPDinj5mg | Frequent epiletic wave, cognitive function decline. |
| 7 | 11 | 44 | M | SC | SC(F209) | 16 | 28 | 17 | 12 | - | - | Ris12mg, Ase20mg | Ris12mg, Ase20mg | First ECT started in 2011 |
| 8 | 12 | 45 | F | SC | SC(F209) | 22 | 23 | 45 | 19 | 17 | - | Ola5mg, Ris1mg | Ola20mg, | |
| 9 | 23 | 45 | M | SC | SC(F209) | 18 | 17 | 18 | 28 | - | - | Clo400mg, Lam300mg | Clo400mg, Lam300mg | Memory impairment present. |
| 10 | 26 | 64 | M | SC | SC(F202) | 30 | 34 | 2 | 12 | 5 | 4 | Ase15mg, CPZ100mg | Ase15mg, CPZ100mg | |
| 11 | 28 | 69 | F | SC | SC(F209) | 31 | 38 | 11 | 12 | - | - | Olz20mg | Olz15mg | Slowing of brain waves on EEG |
| 12 | 29 | 47 | F | SC | SC(F239) | 47 | 0 | 1 | 15 | - | - | Que300mg | Que750mg, Pal3mg | |
| 13 | 31 | 50 | M | SC | SC(F209) | 19 | 31 | 13 | 15 | - | - | Clo500mg | Clo500mg | Slowing of brain waves on EEG |
| 14 | 9 | 20 | F | SC | SC(F209) | 19 | 1 | 11 | 13 | 13 | - | Ola5mg | Ola5mg, HPDinj20mg | Elevated BDNF levels due to hemolysis |
| 15 | 16 | 38 | F | SC | SC(F209) | 23 | 15 | 8 | 16 | - | - | CPZ50mg, Zot50mg | CPZ150mg | Slowing of brain waves on EEG Elevated BDNF levels due to hemolysis |
| 16 | 20 | 52 | F | SC | SC(F209) | 19 | 33 | 5 | 23 | - | - | Ola6.25mg, Ris2mg | Ola20mg | Elevated BDNF levels due to hemolysis |
| MDD+BD group | ||||||||||||||
| 17 | 6 | 61 | M | MDD+BD | BD(F314) | 44 | 47 | 6 | 15 | 8 | 6 | Mir30mg | Lam100mg | |
| 18 | 10 | 70 | F | MDD+BD | MDD(F329) | 52 | 18 | 7 | 7 | - | - | Ola5mg, Mir45mg | Ola5mg, Mir30mg | |
| 19 | 13 | 57 | M | MDD+BD | BD(F319) | 39 | 18 | 2 | 26 | 8 | - | Mil50mg | ||
| 20 | 15 | 68 | F | MDD+BD | MDD(F329) | 67 | 1 | 3 | 12 | 5 | 5 | Esc20mg, Ris8mg,Ven225mg | Esc20mg, Que12.5mg | |
| 21 | 17 | 61 | F | MDD+BD | MDD(F329) | 60 | 1 | 3 | 13 | 8 | - | Mir30mg, Ola20mg | Mir30mg, Ola20mg | Memory impairment present. |
| 22 | 21 | 70 | M | MDD+BD | BD(F315) | 69 | 1 | 1 | 15 | 8 | - | Esc20mg, Mir45mg, Ari3mg | - | |
| 23 | 24 | 63 | F | MDD+BD | BD(F319) | 50 | 13 | 3 | 10 | 12 | - | VPA 800mg, Que112.5mg |
VPA 600mg, Que112.5mg |
|
| 24 | 30 | 67 | F | SC | MDD(F323) | 66 | 1 | 1 | 9 | - | - | Ris1mg, Esc20mg | Esc20mg | |
| Excluded group | ||||||||||||||
| 25 | 2 | 68 | F | BD(F319) | 7 | Ari3mg | Discontinued due to liver dysfunction and fever |
|||||||
| 26 | 14 | 57 | F | SSD(F459) | 2 | Que125mg, Mir15mg | Discontinued due to eye pain and discomfort in the mouth |
|||||||
| 27 | 19 | 75 | F | SC(F209) | 2 | Ris2mg, LPZ25mg | Interrupted due to bradycardia and cardiac arrest |
|||||||
Abbreviations: Ari, aripiprazole; Ase, asenapine; BD, bipolar depression; BPRS, Brief Psychiatric Rating Scale; Clo, clozapine; CPZ, chlorpromazine; Dul, duloxetine; Esc, escitalopram; F, female; HPD, haloperidol; M, male; MDD, major depressive depression; Lam, lamotrigine; LPZ,Levomepromazine; Lur, Lurasidone; Mil, milnacipran; Mir. mirtazapine; Ola, olanzapine; Pal, paliperidone; Que, quetiapine; ris, risperidone; Sc, schizophrenia; SSD, somatic symptom disorder; Tra, tradozone; Ven, venlafaxine; VPA, valproic acid; y, years; Zot, zotepine.
Table 2.
Comparison of patient’s profile between SC and MDD+BD groups.
| Diagnosis | SC | MDD+BD | p-Value |
|---|---|---|---|
| Age (y) | 43.4±16.2 | 64.2±5.1 | 0.0035* |
| Sex (M%) | 58.8 | 42.8 | |
| On set age (y) | 25.8±12.8 | 54.4±11.3 | <0.0001* |
| Illness period until ECT (y) | 17.1±13.7 | 14.1±16.4 | 0.6462 |
| Number of hospitalizations | 9.0±10.7 | 3.5±2.1 | 0.0249* |
| Number of acute ECT treatments | 15.4±5.6 | 14.0±6.0 | 0.5719 |
| Number of continuation of ECT treatments | 12.0±7.9 | 8.1±2.2 | 0.2783 |
| Number of maintenance ECT treatments | 5.3±4.1 | 5.5±0.7 | 0.9608 |
Table 3.
Correlation coefficient (r) and p-value of relationships between BDNF levels and BPRS sub scores for patients with SCZ and MDD+BD at pre- and post-ECT.
Table 3.
Correlation coefficient (r) and p-value of relationships between BDNF levels and BPRS sub scores for patients with SCZ and MDD+BD at pre- and post-ECT.
| Pre-ECT | Post-ECT | |||||||
|---|---|---|---|---|---|---|---|---|
| BPRS | SCZ | MDD+BD | SCZ | MDD+BD | ||||
| Subitem | r | p | R | p | r | p | r | p |
| 1 Somatic concern | 0.1671 | 0.5681 | -0.2155 | 0.6816 | -0.0500 | 0.7714 | -0.0254 | 0.9200 |
| 2 Anxiety | -0.1109 | 0.7056 | -0.3383 | 0.5178 | 0.1040 | 0.5462 | 0.1392 | 0.5818 |
| 3 Depression | 0.1017 | 0.7294 | -0.4929 | 0.3205 | 0.0585 | 0.7345 | 0.1130 | 0.6553 |
| 4 Suicidality | 0.1245 | 0.6716 | -0.2386 | 0.6489 | 0.2286 | 0.1798 | 0.3256 | 0.1873 |
| 5 Guilt | 0.0373 | 0.8990 | -0.3973 | 0.4354 | 0.0501 | 0.7713 | 0.0946 | 0.7087 |
| 6 Hostility | -0.4240 | 0.1308 | 0.6171 | 0.1918 | 0.1231 | 0.5235 | 0.7283 | 0.0006* |
| 7 Elevated Mood | -0.4662 | 0.0928 | 0.7732 | 0.0713 | -0.0844 | 0.6243 | -0.1240 | 0.6236 |
| 8 Grandiosity | -0.0822 | 0.7799 | 0.6223 | 0.1870 | 0.0118 | 0.9443 | -0.1240 | 0.4593 |
| 9 Suspiciousness | -0.0101 | 0.9728 | 0.1038 | 0.8448 | 0.4007 | 0.0154* | 0.5229 | 0.0260* |
| 10 Hallucinations | 0.1377 | 0.2320 | 0.2671 | 0.6088 | 0.2286 | 0.1800 | 0.3256 | 0.1873 |
| 11 Unusual thought content | -0.2588 | 0.8618 | -0.1111 | 0.8839 | 0.1473 | 0.3911 | 0.2277 | 0.3635 |
| 12 Bizarre behaviour | -0.3672 | 0.1963 | -0.0266 | 0.9599 | 0.1970 | 0.2494 | 0.0737 | 0.7714 |
| 13 Self-neglect | 0.2665 | 0.3571 | -0.4150 | 0.4132 | 0.0493 | 0.7752 | 0.0538 | 0.8320 |
| 14 Disorientation | -0.1670 | 0.5680 | -0.2585 | 0.6208 | 0.2666 | 0.1159 | 0.4477 | 0.0624 |
| 15 Conceptual disorganisation | -0.0634 | 0.8293 | -0.4044 | 0.4264 | 0.0839 | 0.6265 | 0.4859 | 0.0409* |
| 16 Blunted affect | -0.1171 | 0.6899 | -0.4383 | 0.3846 | -0.1109 | 0.5192 | 0.4145 | 0.0872 |
| 17 Emotional withdrawal | 0.1111 | 0.7054 | -0.7229 | 0.1045 | -0.0510 | 0.7671 | 0.3649 | 0.1365 |
| 18 Motor retardation | -0.0316 | 0.9144 | -0.2155 | 0.6816 | 0.1787 | 0.297 | 0.3470 | 0.1583 |
| 19 Tension | 0.3357 | 0.2406 | -0.3310 | 0.5215 | -0.1649 | 0.3364 | 0.5327 | 0.0228* |
| 20 Uncooperativeness | 0.1258 | 0.6682 | 0.5852 | 0.2224 | 0.1522 | 0.8062 | 0.7282 | 0.0006* |
| 21 Excitement | -0.3584 | 0.2082 | 0.4334 | 0.3906 | 0.0292 | 0.8658 | 0.8775 | <0.0001* |
| 22 Distractibility | 0.0985 | 0.7374 | -0.5905 | 0.2172 | -0.1809 | 0.2907 | 0.3066 | 0.2159 |
| 23 Motor hyperactivity | -0.0779 | 0.7912 | 0.5700 | 0.2376 | -0.0833 | 0.6289 | 0.3256 | 0.1873 |
| 24 Mannerisms and posturing | 0.0207 | 0.9944 | 0.1541 | 0.7707 | -0.1301 | 0.4492 | 0.5680 | 0.0139* |
Disclaimer/Publisher’s Note: The statements, opinions and data contained in all publications are solely those of the individual author(s) and contributor(s) and not of MDPI and/or the editor(s). MDPI and/or the editor(s) disclaim responsibility for any injury to people or property resulting from any ideas, methods, instructions or products referred to in the content. |
© 2024 by the authors. Licensee MDPI, Basel, Switzerland. This article is an open access article distributed under the terms and conditions of the Creative Commons Attribution (CC BY) license (http://creativecommons.org/licenses/by/4.0/).
Copyright: This open access article is published under a Creative Commons CC BY 4.0 license, which permit the free download, distribution, and reuse, provided that the author and preprint are cited in any reuse.


