Submitted:
03 December 2024
Posted:
04 December 2024
You are already at the latest version
Abstract
This study investigates the structural integrity and fatigue performance of subframes in hydrogen fuel cell vehicles under complex operating conditions. A systematic approach based on finite element analysis (FEA) is proposed to evaluate subframe performance across various conditions, including vertical impact, cornering, braking (front and rear), cornering braking, and front-wheel obstacle crossing. A 3D model of the subframe is first created using CATIA, followed by high-quality meshing in HyperMesh, which incorporates detailed geometric features, material properties, and connection characteristics. Multi-body dynamics simulations are conducted using Adams to extract data for typical operating conditions. Static and modal analyses are performed with Optistruct and Nastran to assess stress distribution, deformation behavior, and variations in natural frequency. Additionally, fatigue analysis is conducted using HyperLife to evaluate the subframe’s durability under these conditions. The results show that the subframe design exhibits excellent structural safety and fatigue resistance, meeting all design specifications. This research provides valuable theoretical and practical insights for optimizing subframe design in hydrogen fuel cell vehicles. Future work may integrate topology optimization and lightweight design strategies to further enhance subframe performance and cost-effectiveness.
Keywords:
subframe
; finite element method
; strength analysis
; modal analysis
; durability analysis
1. Introduction
The subframe, as a critical structural component of an automobile, primarily serves to support the suspension swing arms and other structural elements. During vehicle operation, the subframe is subjected to various excitations transmitted from the road to the car body, and its natural frequency may induce resonance coupling. Excessive vibrations resulting from this phenomenon can compromise the structural integrity of the subframe, directly impacting the vehicle’s safety[1].Moreover, the subframe's strength plays a vital role in determining the vehicle's comfort, handling performance, ride quality, and durability. Thus, the structural strength of the subframe is a key factor in ensuring the overall safety and performance of the vehicle [2].
This study investigates the subframe of a hydrogen energy vehicle as the research object. Leveraging the collaborative simulation capabilities of Adams and HyperMesh, the model data of the subframe was analyzed. The OptiStruct solver was employed to evaluate the structural strength of the subframe under various extreme working conditions, while the Nastran solver was used to conduct frequency avoidance analysis for the subframe as an individual component.[3] Additionally, HyperLife was utilized to perform fatigue damage and life analysis based on the stress analysis results. By comparing the finite element analysis results with material properties and performance requirements, the study determined whether the calculated results fell within the theoretical range, verified the accuracy of the numerical simulations, and provided a reliable theoretical foundation for the structural design of the subframe in hydrogen energy vehicles[4].
2. Basic Theory of Material Mechanics
The elastic mechanics equation can be utilized to determine the relationship between stress, strain, and external forces acting on the subframe. Its core components include the equilibrium equation, geometric equation, and constitutive equation [5]. Conducting a fundamental theoretical analysis of the subframe's mechanics during the early stages of structural design can effectively prevent design flaws and ensure structural reliability [6].
2.1. Equilibrium Equation
The equilibrium equation primarily examines the condition in which the elastomer remains in a state of equilibrium under the application of external forces. Accordingly, the stresses in the x, y,and z directions must satisfy the requirements of the equilibrium equation .
Equation (1)shows that gravity can be decomposed into com-ponents along the x,y,and z coordinates of the upper structure.represent the normal stresses on the x, y, and z coordinate planes, respectively. denotes the shear stress in the z direction on the x-coordinate plane, while represents the shear stress in the z direction on the y-coordinate plane.
2.2. Geometric Equations
The geometric equation defines the mathematical relationship between the strain components and the displacement components within a continuous body. This relationship is expressed in matrix form as follows:
In Equation (1),represents the strain components. ,andrepresent the normal strains.represent the shear strains. represents the displacement component in the x-direction. v represents the displacement component in the y-direction; w represents the displacement component in the z-direction. represents the rate of change of u in the x-direction; represents the rate of change of v in the y-direction; represents the rate of change of w in the z-direction.
2.3. Physical Equation
The physical equation defines the mathematical relationship between the stress and strain components of a body in differential form, which is determined by the material properties. This relationship is represented by the following six mathematical equations:
In formula (3), E represents the elastic modulus of the material; is the Poisson's ratio of the material; and G denotes the tangent modulus of the material.
The last three equations in (3) can be derived from the first three equations. Additionally, the mathematical relationship between the stress components and strain components can be obtained by substituting the relationship between the elastic modulus and the shear modulus from equation (4) into the physical equations.
In the formula, [D] denotes the elasticity matrix of the material, as expressed in the following formula:
To solve the above equation, this study primarily utilized the finite element method with the stress method, where the three principal stress components were treated as the primary unknowns. In the static analysis, the von Mises equivalent stress was typically selected as the criterion for assessing structural strength, and its expression is provided below:
In Equation (7),represent the first, second, and third principal stresses,respectively, withbeing the von Mises equivalent stress.The strength verification expression is given as follows:
In the equation, denotes the allowable stress of the material.
3. Establishment of Finite Element Model
3.1. Grid Division
In this study, the subframe is modeled as a shell element structure. HyperMesh was utilized to discretize the shell elements, with the mesh comprising a combination of tetrahedral and triangular elements.[7] The mesh size for all elements was set to 3 mm, resulting in a total of 21,493 elements. The finite element model is illustrated in Figure 1.
3.2. Material Characteristics of Subframe
Given that the subframe operates under various working conditions, the material must possess adequate stiffness and strength, making material selection a critical factor in its design[8].In this study, the subframe materials are 20# steel and Q235 steel, and their specific parameter characteristics are presented in Table 1 below.
3.3. Connection Relationship Simulation
3.3.1. Simulation of Solder Joints
The automobile subframe is composed of stamped parts of various sizes and shapes joined by welding, which places high demands on the weld structure. Consequently, it is essential to simulate the weld connections with different modeling approaches. In the strength analysis of the subframe, the weld positions are separately modeled using one-dimensional rigid elements. In this study, quadrilateral shell elements are employed to simulate the weld positions of the primary load-bearing components, enabling accurate simulation of the stress distribution at the welds [9], as shown in Figure 2.
3.3.2. Bolt Simulation
In the strength analysis of the automobile subframe, the components are connected using bolts, with the bolted joints subjected to shear forces and tension. As a result, accurate bolt simulation is crucial. In this study, bolted rigid elements were employed to connect the nodes at the edges of the bolt holes, while the software automatically analyzed independent nodes to perform the bolt simulation [10], as shown in Figure 3.
3.4. Boundary Conditions
Timely and accurate handling of boundary conditions in the finite element method is essential to ensuring the reliability of calculation results. If the boundary conditions are not properly defined based on the actual load conditions, significant deviations from the real scenario may occur, leading to calculation errors or even the failure of the entire computational process. In finite element analysis, every part must undergo an effective evaluation of its boundary conditions. Otherwise, the analyzed structure or component may experience unintended displacements.
In the calculation, to determine the node displacements and minimize the singular effects of the total stiffness matrix, the displacement caused by deformation can be identified by constraining the nodes at the two supports. Specifically, movement along the X and Z axes is restricted, and the rigid positioning of the frame is eliminated. Under these conditions, the stress distribution in the frame remains unaffected.
4. Finite Element Analysis and Calculation Results
4.1. Description of Working Conditions
Based on the actual working conditions, the supports are constrained, and the bolts are modeled as rigid elements to replicate the real-world scenario. Adams was employed to calculate the loads under various typical working conditions [11]. Ten typical working conditions of the automobile are presented in Table 2.
4.2. Calculation Res
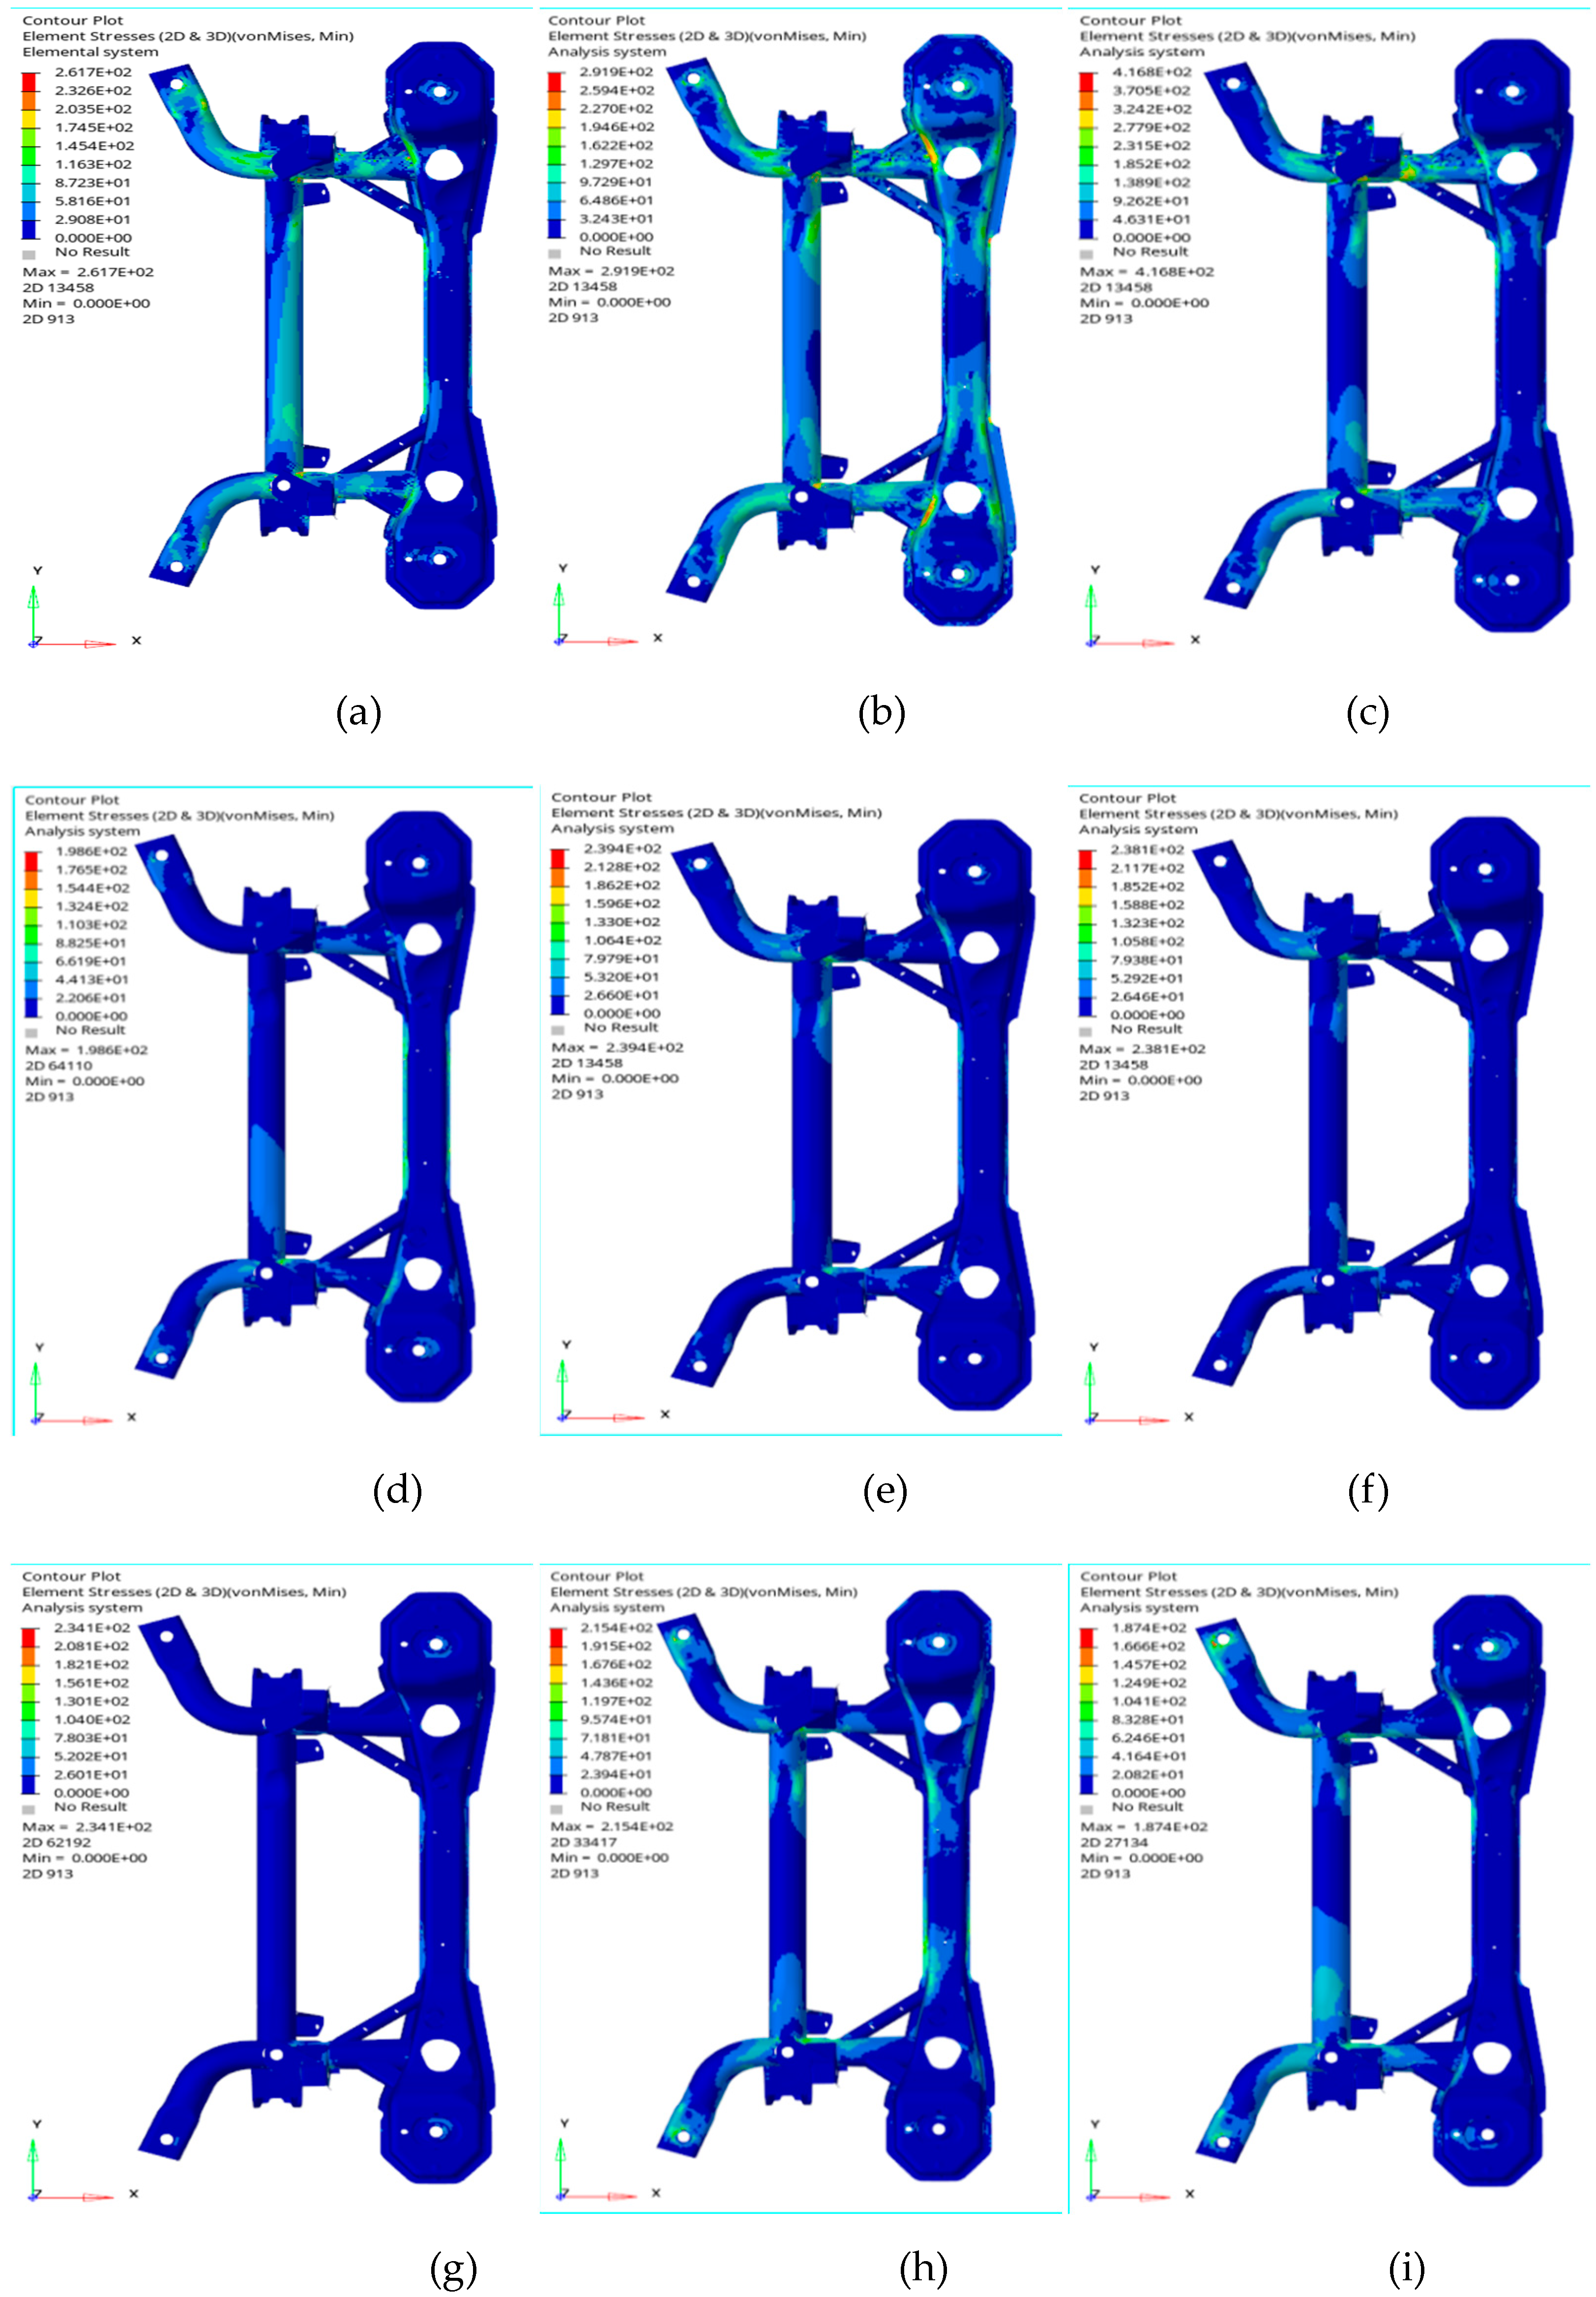
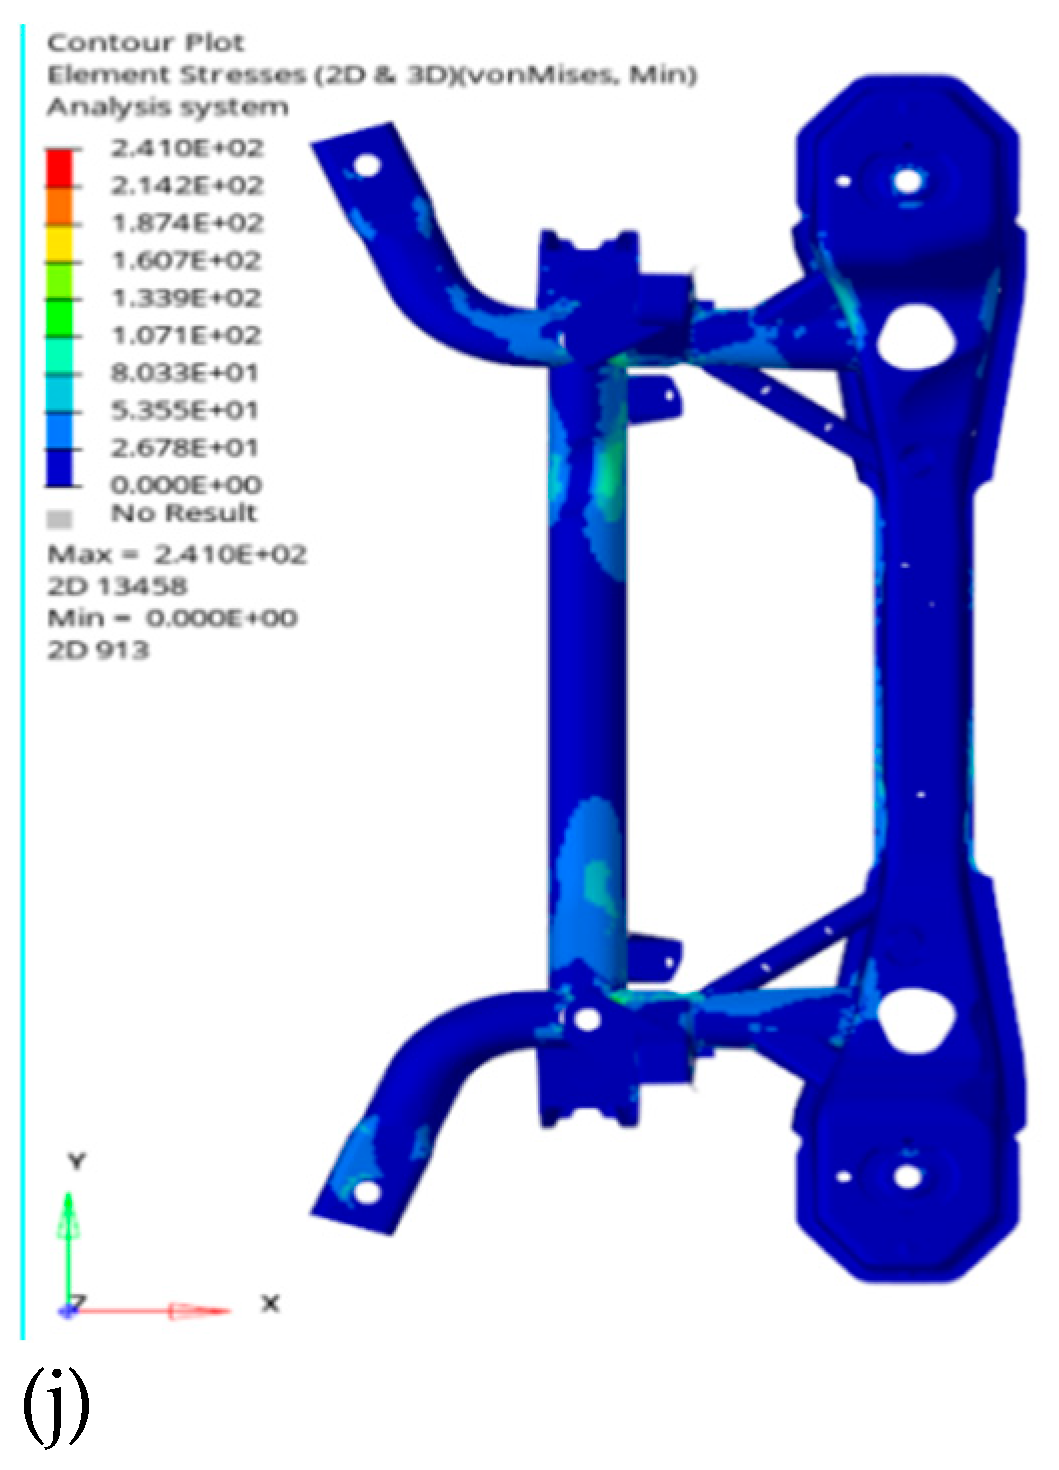
Using HyperMesh and Adams software, the finite element method was applied to analyze ten typical working conditions of the subframe, and strain contour plots were obtained. The calculation results indicate that the maximum stress of the structure under each working condition is 261.7, 291.9, 416.8, 198.6, 239.4, 238.1, 234.1, 215.4, 187.4, and 241 MPa, respectively. Under the 3.5g double-wheel runout condition, the maximum stress is lower than the material's yield strength of 468 MPa, satisfying the design requirements. The maximum stress is primarily distributed in the welding area of the bottom mounting plate. To prevent stress concentration in weak areas of the subframe during operation, or potential fractures caused by it, reinforcement plates can be added to the critical regions identified during optimization. Alternatively, the thickness of the material can be increased, or materials with higher yield strength can be used to further enhance the strength performance of the subframe[12].
Figure 4.
represents the cloud diagram for ten operating conditions. (a) illustrates the 1G static load condition. The maximum stress is concentrated in the welded joint between the crossbeam of the lower control arm mounting plate and the tubular beam, reaching a value of 261.7 MPa. (b) illustrates the 3.5G double-wheel runout condition. The maximum stress is concentrated at the shock absorber mounting plate, the lower arm mounting point, and the body connection area, with a peak stress value of 291.9 MPa. (c) illustrates the 2G longitudinal force condition. The maximum stress is concentrated in the welded joint between the longitudinal beam of the lower control arm and the tubular beam, with a peak stress value of 416.8 MPa. (d) illustrates the 2G lateral force condition. The maximum stress is concentrated in the welded joint between the rear shock absorber mounting plate and the tubular beam, with a peak stress value of 198.6 MPa. (e) illustrates the 0.5G forward acceleration condition. The maximum stress is concentrated in the welded joint between the lower control arm mounting plate and the tubular beam, with a peak stress value of 239.4 MPa. (f) illustrates the 1.1G forward braking condition. The maximum stress is concentrated in the welded joint between the lower control arm mounting plate and the tubular beam, with a peak stress value of 238.1 MPa. (g) illustrates the braking condition at 1.0 g deceleration. The maximum stress occurs at the region of the lower control arm mounting plate and the vehicle body attachment point, with a peak stress of 234.1 MPa. (h) illustrates the condition of a right turn at 1.2 g. The maximum stress is observed at the right-side control arm mounting plate and the vehicle body attachment point, as well as at the welded joint between the lower control arm and the tubular beam, with a peak stress of 215.4 MPa. (i) illustrates the condition of a left turn at 1.2 g. The maximum stress is located at the left-side control arm mounting plate and the vehicle body attachment point, as well as at the welded joint between the lower control arm and the tubular beam, with a peak stress of 187.4 MPa. (j) illustrates the condition of 0.7 g braking combined with 0.7 g right turn. The maximum stress is located at the right-side shock absorber mounting plate and the vehicle body attachment point, as well as at the welded joint between the lower control arm and the tubular beam, with a peak stress of 241 MPa.
5. Mode Frequency Avoidance Analysis
5.1. Theoretical Basis
Based on D'Alembert's principle and the general equation of structural dynamics, the structural inertia force of the rear subframe must be considered in its mechanical analysis. The vibration equation of the subframe is expressed as:
In Equation (9):represents the displacement matrix in generalized coordinates.[M]、[C]、and [K]represent the mass matrix, damping matrix, and stiffness matrix corresponding to , respectively.is the velocity array.represents the acceleration matrix. represents the external load matrix acting on the vehicle frame.For an undamped free vibration system, Equation (9) can be simplified as:
In the process of solving the free vibration of elastomer, it can be regarded as the combination of multiple simple harmonic vibrations in mathematics. It may be assumed that the solution of simple harmonic vibration is:
Where:φ and ω represent the vibration modes and natural frequencies of the system, respectively.Substituting equation (11) into equation (10) gives:
Equation (12) is the characteristic equation of the system. By solving the eigenvalues and eigenvectors of equation (12), namely and in the equation, two important dynamic design parameters of the frame structure, natural frequency and corresponding vibration mode, can be obtained. In order for the solution of equation (12) to be incomplete 0, the condition of equation (9) must be satisfied:
The frame is a vibration system with large degrees of freedom[13]. The natural frequency and vibration mode of the frame can be obtained by solving equation (13).
5.2. Calculation Resul
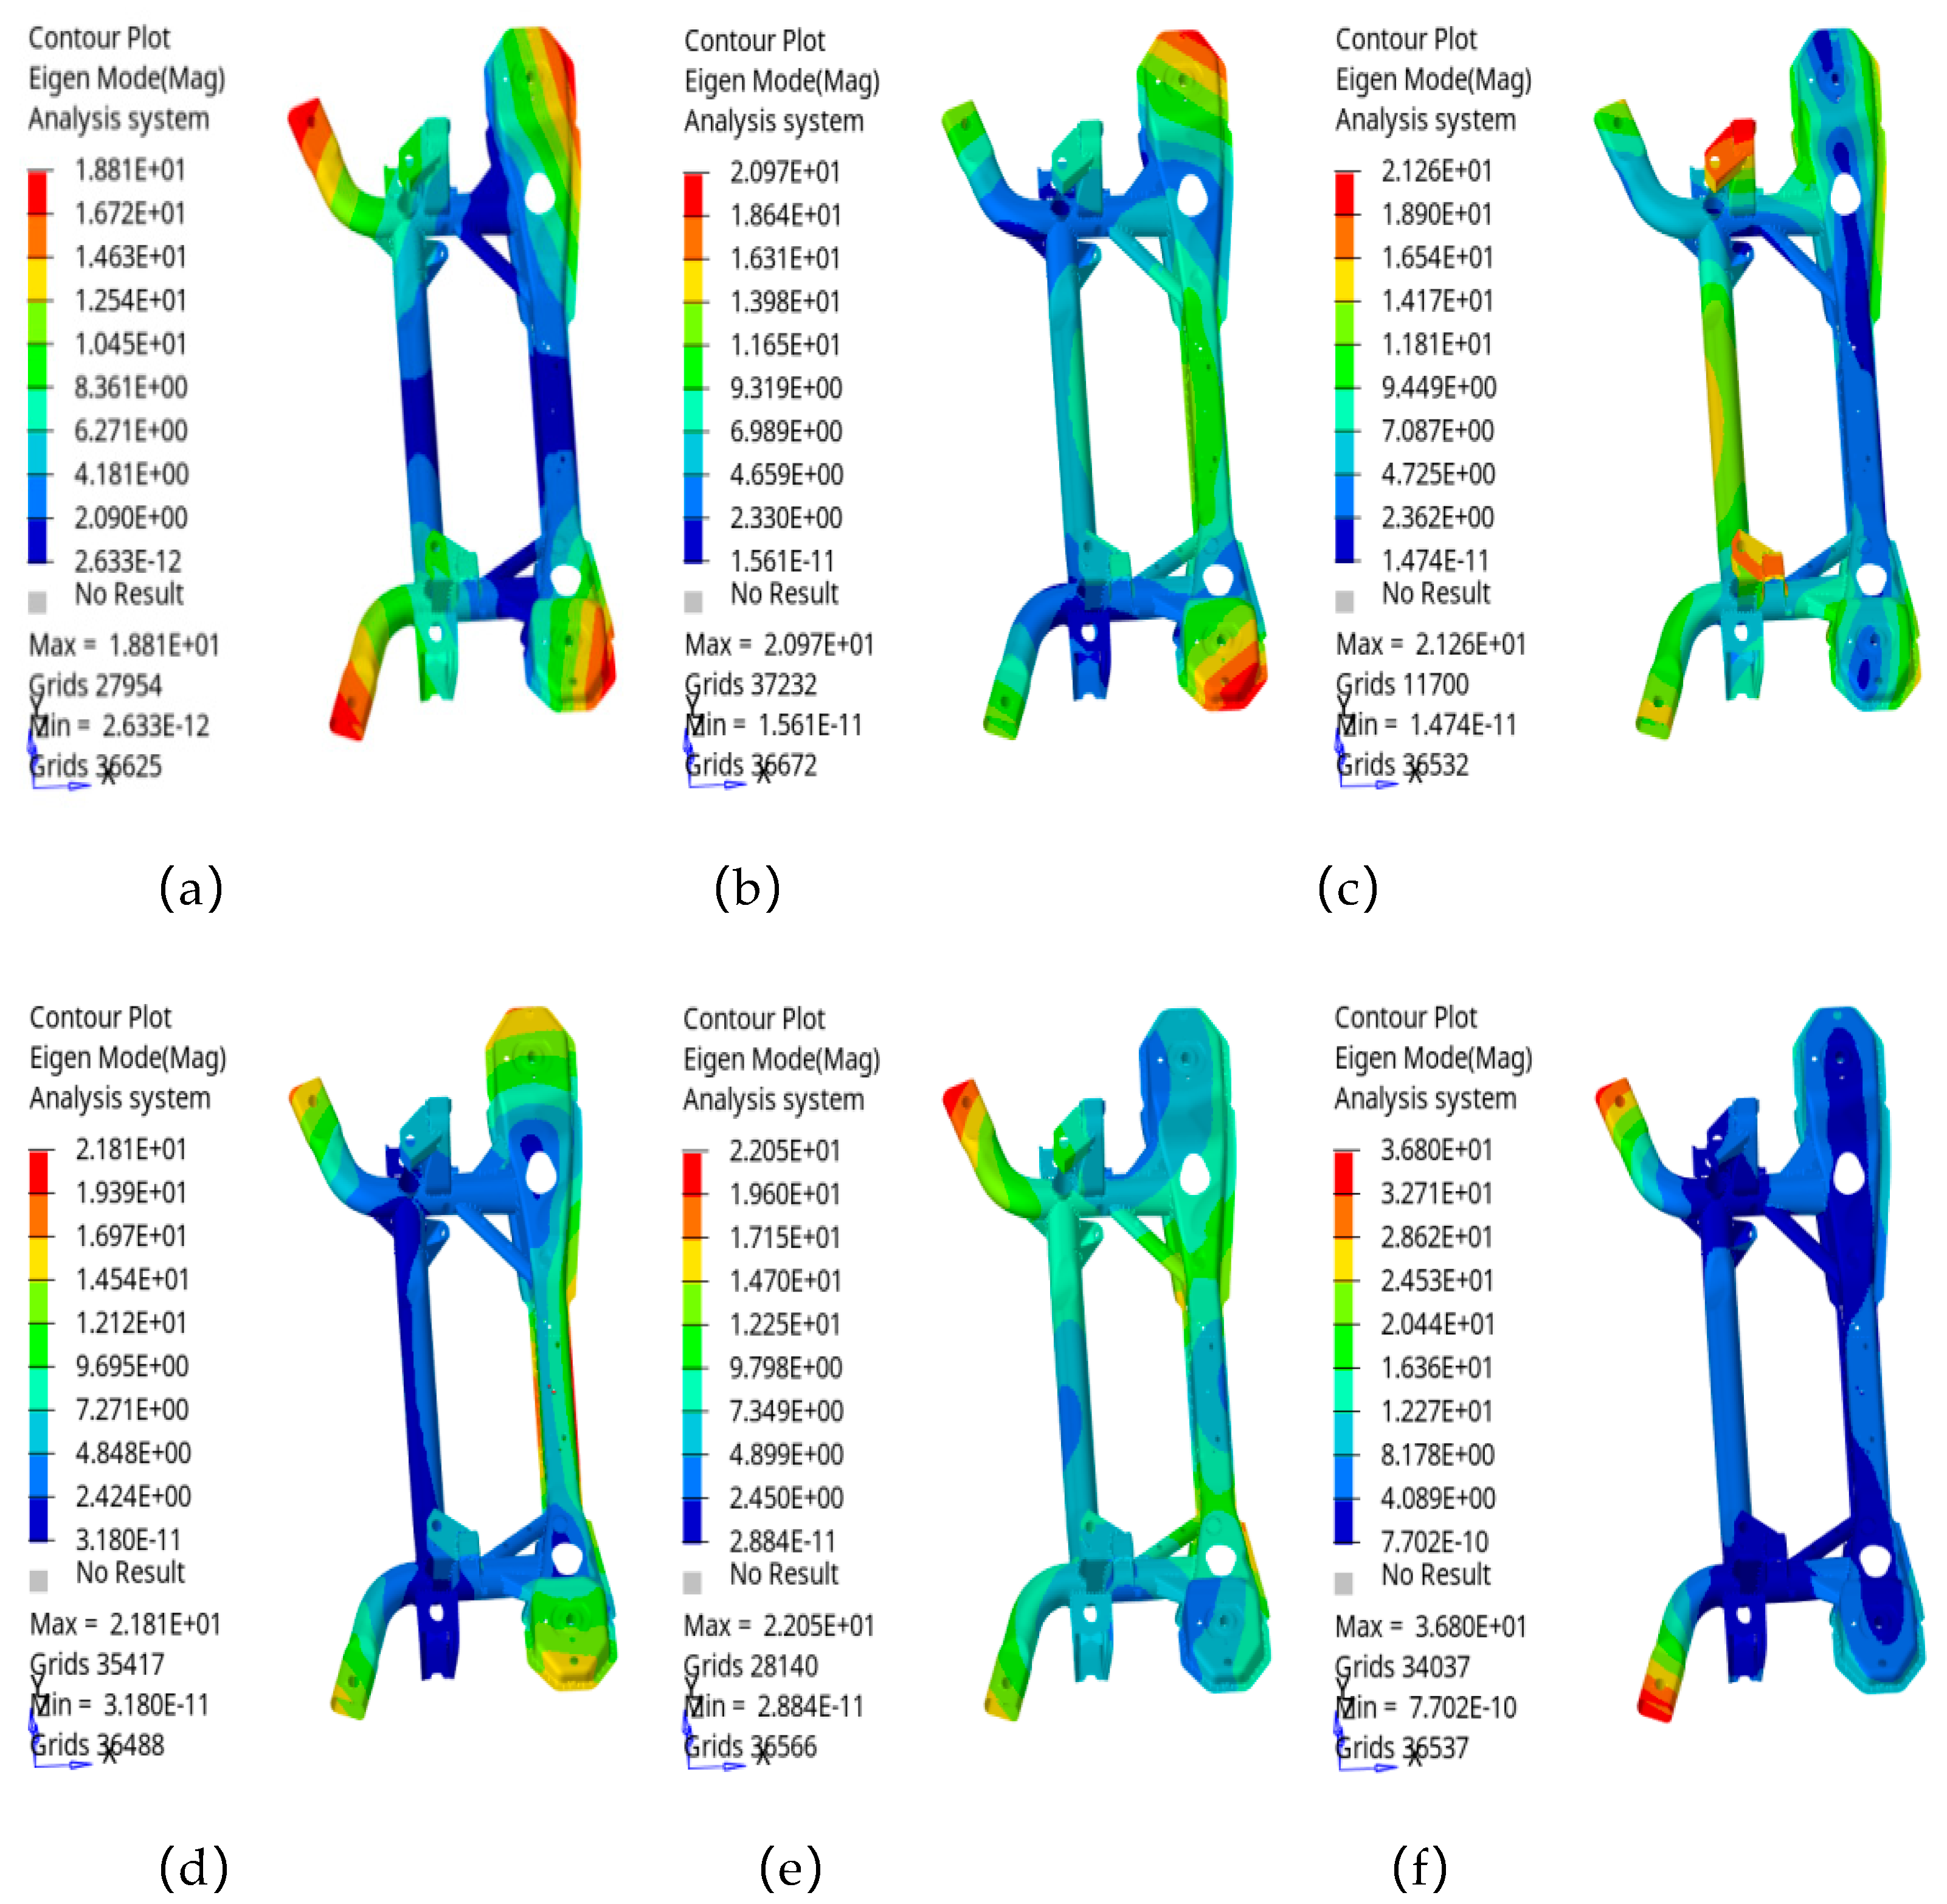
The subframe has a natural frequency and is subjected to excitations from both ground sources and the powertrain during vehicle operation. These excitations can lead to modal coupling, which increases the risk of resonance. To address this issue, a modal frequency-avoidance design for the subframe is necessary. Hydrogen fuel cells operate at relatively high frequencies, while the natural frequency of the subframe typically lies within the mid-to-low frequency range. Therefore, only the influence of the 25 Hz ground excitation on the first six modes of the subframe needs to be taken into consideration[14].
Figure 5.
Cloud image of modal analysis. In the above contour plots, (a) represents the first-order modal analysis with a frequency of 18.8 Hz; (b) shows the second-order modal analysis at 20.9 Hz; (c) corresponds to the third-order modal analysis at 21.2 Hz; (d) depicts the fourth-order modal analysis at 21.8 Hz; (e) represents the fifth-order modal analysis at 22 Hz; and (f) illustrates the sixth-order modal analysis at 36.8 Hz. All the results avoid the critical frequency of 25 Hz. Data analysis confirms that the design meets the expected requirements.
6. Fatigue Analysis
6.1. Theoretical Basis
From the perspective of fatigue analysis, fatigue research primarily focuses on the fatigue strength and fatigue life of materials or structures subjected to repeated loads. The most common approach involves utilizing the S-N curve, which represents the material's basic fatigue strength characteristics. In engineering applications, linear fatigue damage theories are predominantly employed, including Miner’s theory and its modified version. Miner’s theory is the most widely used when the load sequence is not considered[15]. Also known as the linear cumulative damage theory, Miner’s theory assumes that at the same stress level, each load cycle contributes an equal amount of damage, expressed as:
According to Miner’s linear cumulative fatigue damage theory, the fatigue damage under a single stress spectrum is expressed as:
In the equation, represents the number of cycles corresponding to different stress amplitude levels; and m are parameters of the S-N curve; and denotes the stress amplitude at each level .
6.2. Calculation Result
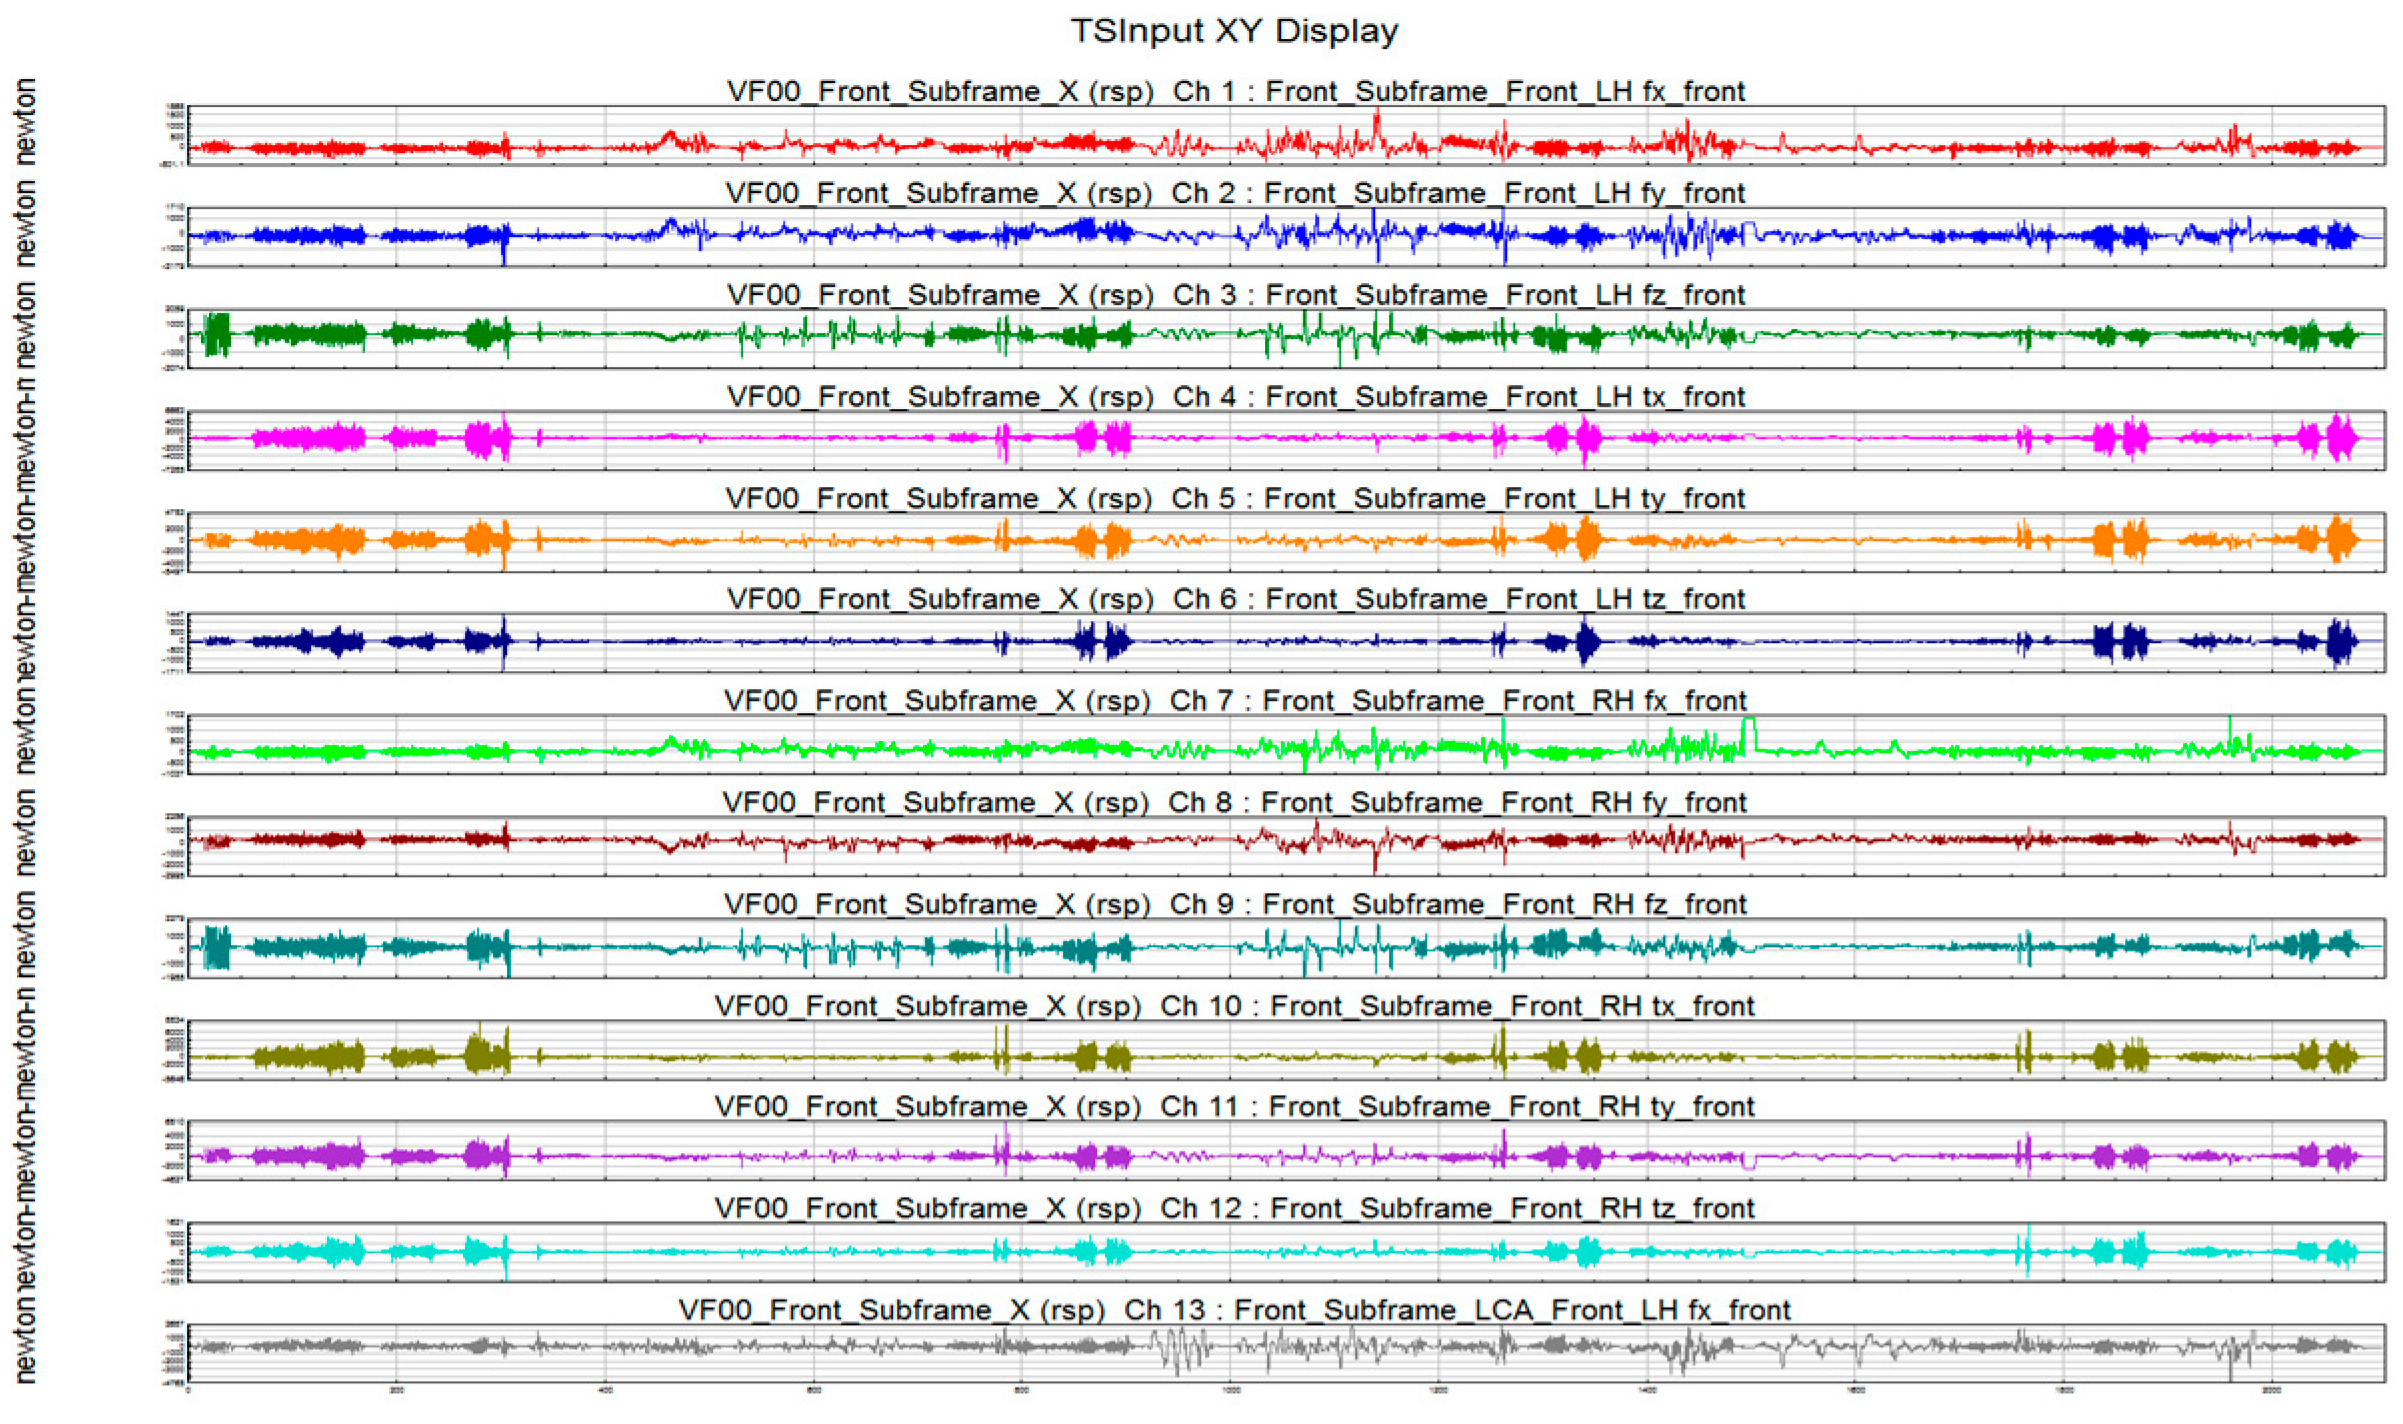
The data from the chassis hard-point strain gauges were collected, and the road spectrum load distribution was obtained, as shown in Figure 9. The finite element analysis of fatigue strength was then conducted.
Figure 6.
Road spectrum load distribution.
The H3D result file obtained from the previous static analysis in HyperMesh was imported into HyperLife. Since the material properties and forces were already defined, only the S-N file was required to obtain the fatigue analysis results. (a) illustrates the fatigue life analysis, while (b) shows the fatigue damage analysis.
Figure 7.
life analysis and damage analysis.
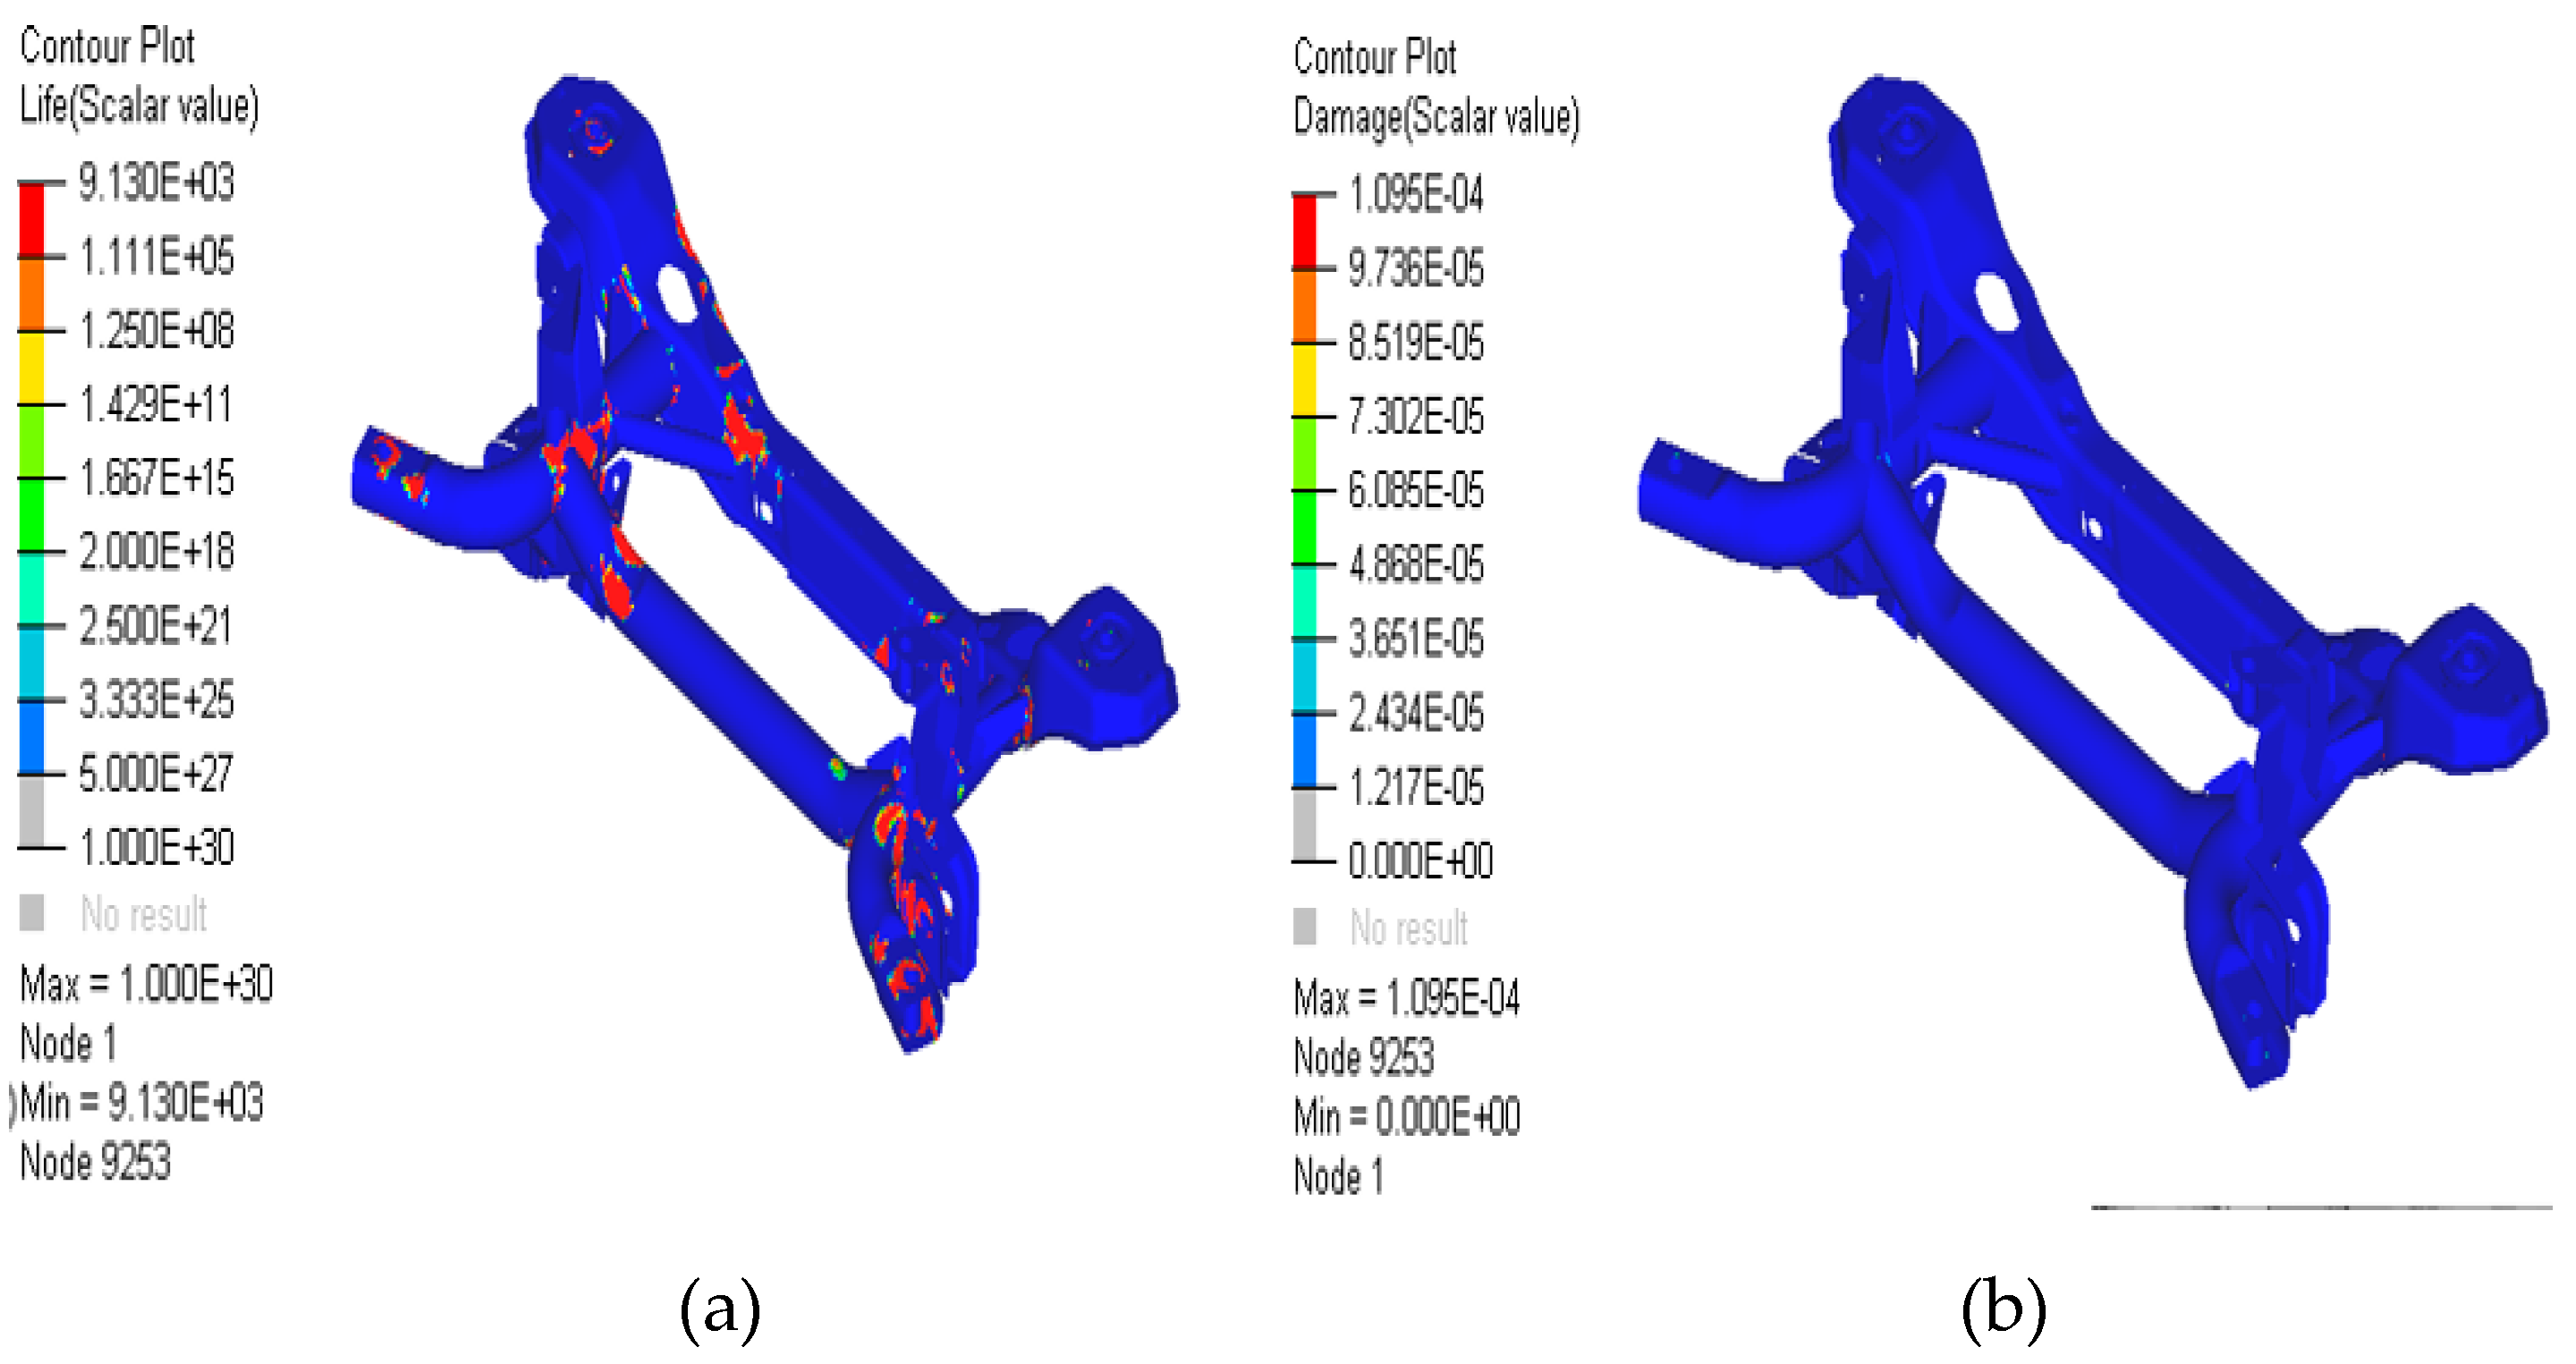

Table 3.
Damage Results.
| Front Subframe | Target Value | |
|---|---|---|
| Cycle Count | 9130 | >450 |
| Damage Value | 0.0011 | <0.022 |
According to the analysis results, the cycle life of the designed front subframe is 9130.1 cycles, which exceeds the threshold of 450 cycles. The damage value is 0.00011, significantly lower than the target value of 0.022. These analysis results confirm that the design meets the expected performance requirements.
7. Conclusions
This study systematically investigates the subframe of hydrogen fuel cell vehicles, using finite element simulations to assess its performance under various operating conditions. Strength analysis identifies the maximum stress values for each condition, validating the subframe's strength design and highlighting areas that require reinforcement. Modal analysis determines the first six natural frequencies, confirming the effectiveness of the frequency avoidance design. Fatigue analysis evaluates the subframe's fatigue life and damage accumulation, confirming the adequacy of the fatigue design. Based on these simulation results, the design and development process for the subframe has been completed, providing both theoretical and practical insights for future optimization. Future research could incorporate topology optimization and lightweight design strategies to further enhance the subframe's performance and cost-effectiveness, thereby advancing the design and application of subframes in hydrogen fuel cell vehicles.
Author Contributions
Conceptualization, JiHui Zhuang ; methodology, JiHui Zhuang.;software,Fan Zeng.;validation,Shiying Wang.;project administration, Chunshan Yin. All authors have read and agreed to the published version of the manuscript.
Funding
Structural Simulation and Development Project for High-Performance Hydrogen-Powered MPVs.
Data Availability Statement
The original contributions presented in the study are included in the article, further inquiries can be directed to the corresponding author.
Conflicts of Interest
The authors declare no conflict of interest.
References
- Xiubang, C. Modal analysis and structural noise control of vehicle body frame. Vibroengi-neering Procedia 2024, 56, 135–141. [Google Scholar]
- Zhu, Z.; Cai, S.; Si, G.; et al. The supporting structure strength analysis of indexing stamping machine for manufacturing thin-walled inverting steel tubes. Journal of Physics: Conference Series 2024, 2815, 012011–012011. [Google Scholar] [CrossRef]
- Li, X.; Zhuang, S. Strength analysis and structural improvement of the connection between rear shock a bsorber support and frame of a city bus based on Hypermesh. Journal of Physics: Conference Series.
- A Design Optimization Process of Improving the Automotive Subframe Dynamic Stiffness Using Tuned Rubber Mass Damper. SAE International Journal of Vehicle Dynamics, Stability, and NVH.
- Yan, X.; Tan, Y. Utilizing incineration bottom ash-infused steel fiber-reinforced concrete: An analysis of compressive strength and carbonation durability. Materials Letters 2025, 378, 137570–137570. [Google Scholar] [CrossRef]
- Wu, Y.; Qiu, X.; Bai, C.; et al. Connection strength analysis for composite fuselage gate structures of civil aircraft. Journal of Physics: Conference Series.
- Gao, J.; Du, M. Research on optimization of the vehicle handling stability considering flexibility of the front subframe. Advances in Mechanical Engineering 2024, 16. [Google Scholar] [CrossRef]
- Zhao, X.; Qian, C.; Wu, Z. Strength Analysis of Cylindrical Shells with Tangential Nozzles under Internal Pressure. Applied Sciences 2024, 14. [Google Scholar] [CrossRef]
- Lin, Q.; Yang, C.; Bai, Y.; et al. Structural Strength Analysis and Optimization of Commercial Aircraft Nose Landing Gear under Towing Taxi-Out Conditions Using Finite Element Simulation and Modal Testing. Aerospace 2024, 11, 414. [Google Scholar] [CrossRef]
- Meng, X.; Sun, Y.; He, J.; et al. Multi-Objective Lightweight Optimization Design of the Aluminium All oy Front Subframe of a Vehicle. Metals 2023, 13. [Google Scholar]
- Ran, Y. Analysis and optimization of vibrating screen structure based on modal simulation. Vibroengi neering Procedia 2024, 55, 97–103. [Google Scholar]
- Gao, J.; Du, M. Research on optimization of the vehicle handling stability considering flexibility of the front subframe. Advances in Mechanical Engineering 2024, 16. [Google Scholar] [CrossRef]
- Sahu, N.G.; Kanchwala, H. Experimental modal analysis of a tire: an exploration of different operating and boundary conditions. Journal of the Brazilian Society of Mechanical Sciences and Engineering 2024, 46, 667–667. [Google Scholar] [CrossRef]
- Zhiyuan, Z.; Jian, Z. Modal analysis and optimization design of ultra-high acceleration platform rail frame. Vibroengineering Procedia 2024, 56, 68–73. [Google Scholar]
- Silva, D.B.; Kasaei, M.; Safar, A.A.; et al. Fatigue analysis of novel hole hemmed joints for hybrid bus bars in electric vehicle batteries. Engineering Fracture Mechanics 2024, 311, 110590–110590. [Google Scholar] [CrossRef]
Figure 1.
Finite element model of subframe.
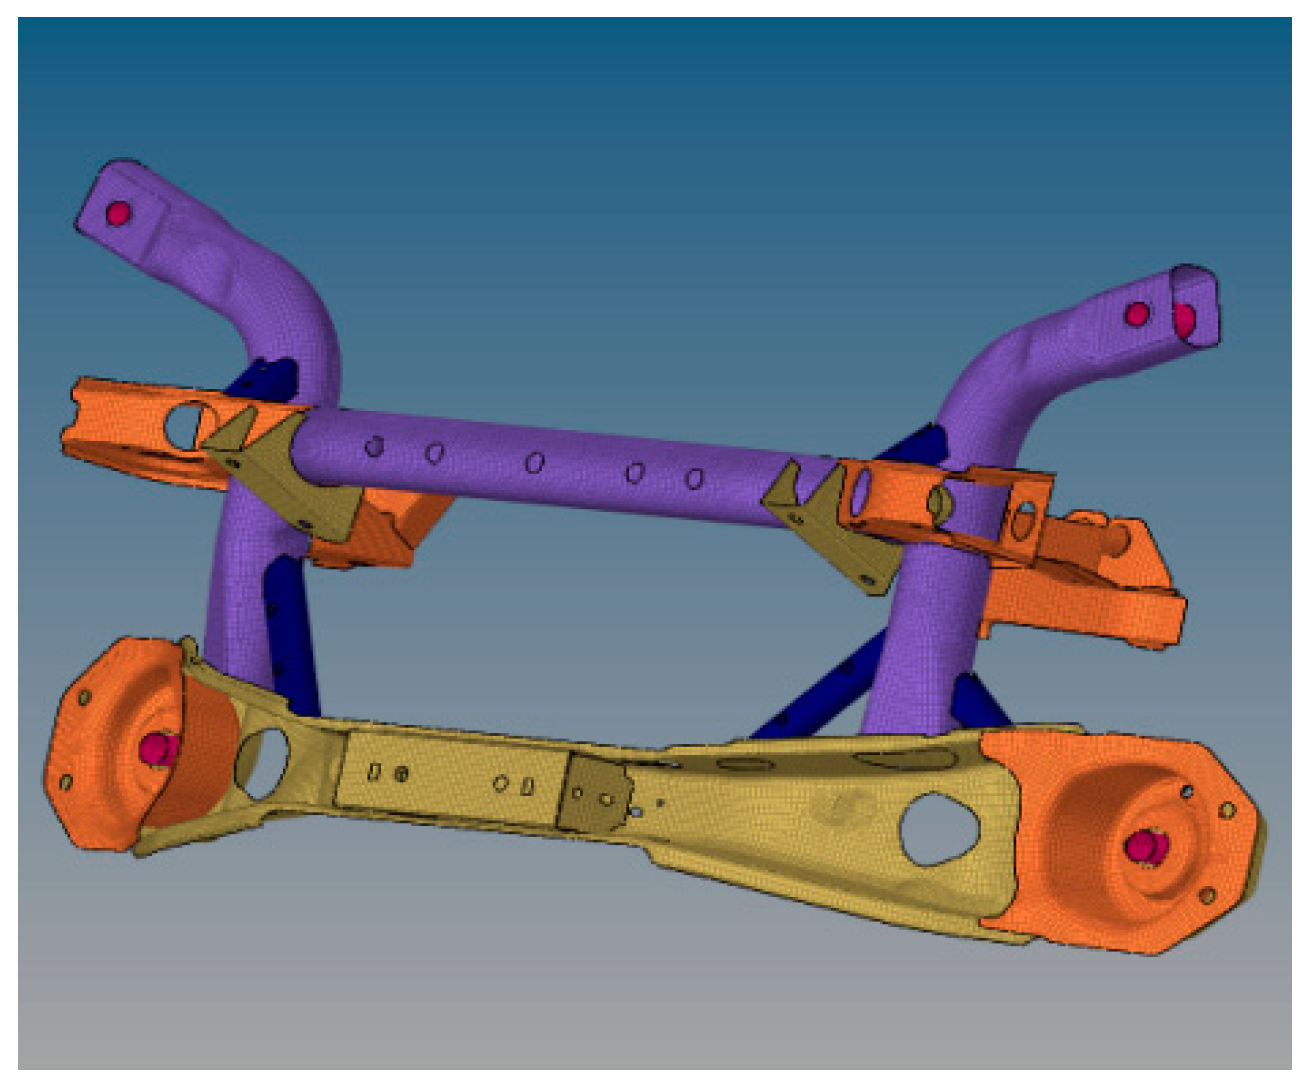
Figure 2.
Weld Spot Simulation of Shell Element.
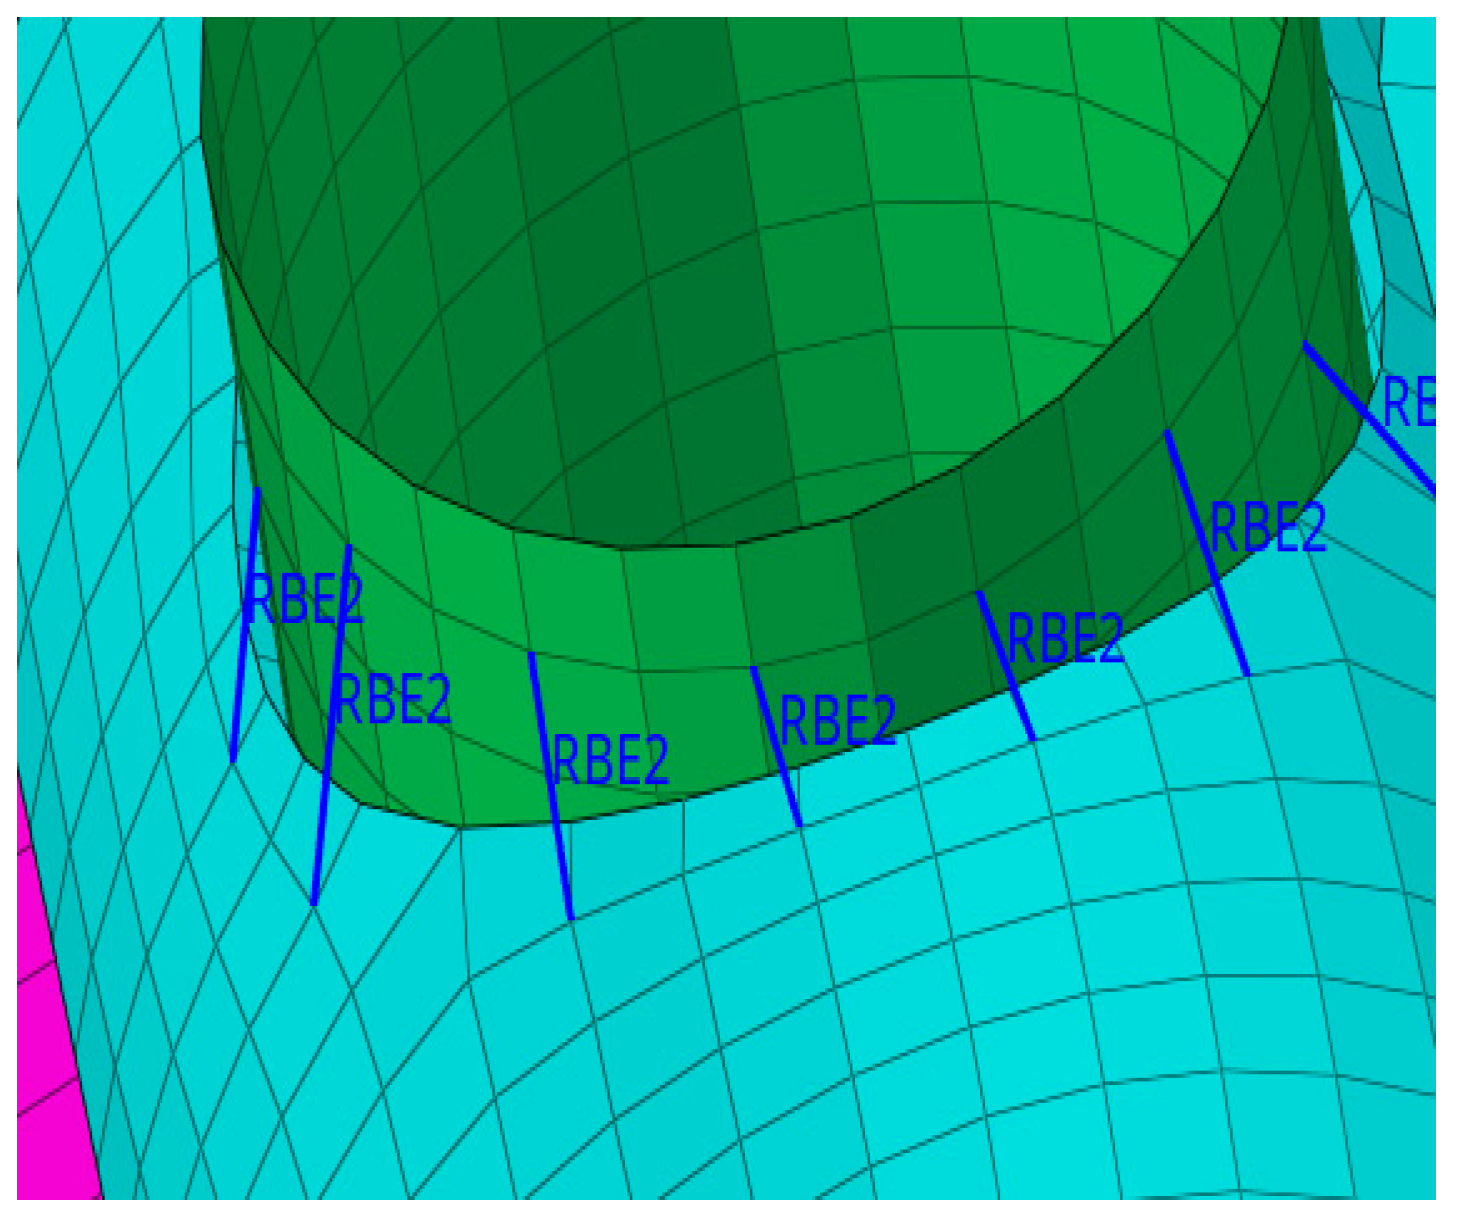
Figure 3.
Bolt Simulation.
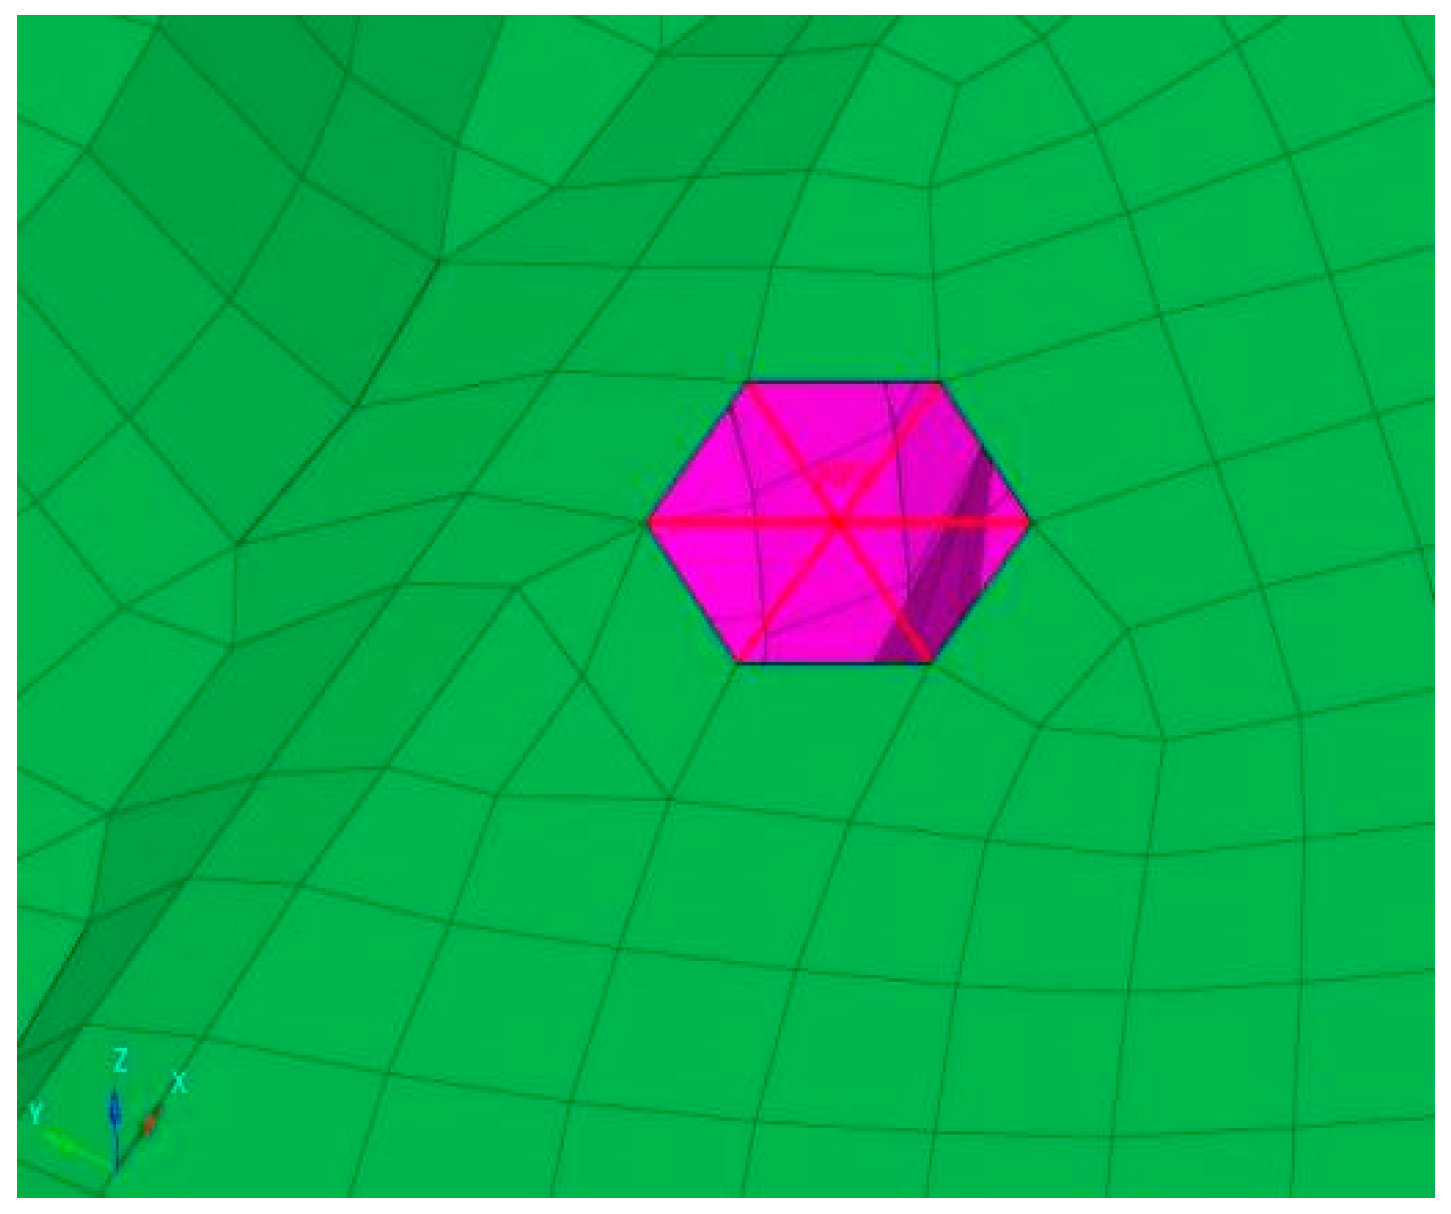
Table 1.
Material properties.
| Material Name | Poisson's Ratio(V) | Density(kg/m3) | Elastic Modulus(Gpa) | Elastic Modulus(Gpa) | Tensile Strength(MPa) |
| 20# | 0.3 | 7.83E+0.3 | 2.07E+0.2 | 245 | 410 |
| Q235 | 0.3 | 7.83E+0.3 | 2.07E+0.2 | 340 | 468 |
Table 2.
Ten Typical Working Conditions of the Automobile.
| Serial Number | Working Condition | Serial Number | Working Condition |
|---|---|---|---|
| 1 | 1g Static Load | 6 | 1.1g Forward Braking Condition |
| 2 | 3.5g Double-Wheel Runout Condition | 7 | 1.0g Rear Braking Condition |
| 3 | 2g Longitudinal Force Condition | 8 | 1.2g Right-Turning Condition |
| 4 | 0.5g Forward Acceleration Condition | 9 | 1.2g Left-Turning Condition |
| 5 | 2g Lateral Force Condition | 10 | 0.7g Braking+0.7g Right-Turning Condition |
Disclaimer/Publisher’s Note: The statements, opinions and data contained in all publications are solely those of the individual author(s) and contributor(s) and not of MDPI and/or the editor(s). MDPI and/or the editor(s) disclaim responsibility for any injury to people or property resulting from any ideas, methods, instructions or products referred to in the content. |
© 2024 by the authors. Licensee MDPI, Basel, Switzerland. This article is an open access article distributed under the terms and conditions of the Creative Commons Attribution (CC BY) license (http://creativecommons.org/licenses/by/4.0/).
Copyright: This open access article is published under a Creative Commons CC BY 4.0 license, which permit the free download, distribution, and reuse, provided that the author and preprint are cited in any reuse.


