
Submitted:
02 December 2024
Posted:
03 December 2024
You are already at the latest version
Abstract
In this study, an ANN-based model was developed to predict nitrate concentrations in drainage waters based on parameters that are easier and cheaper to measure in an irrigation area within the Lower Seyhan Basin, one of Turkey's important agricultural production regions. For this purpose, daily water samples were collected from a drainage measurement station during the 2022 and 2023 water years, and nitrate concentrations were determined in the laboratory. In addition to nitrate concentrations, other parameters, such as flow rate, EC, pH, and precipitation, were also measured simultaneously. The complex relationship between measured nitrate values and other parameters, which are easier and less costly to measure, was used in two different scenarios during the training phase of the ANN-Nitrate model. After the model was trained, nitrate values were estimated for the two scenarios using only the other parameters. In Scenario I, random values from the dataset were predicted, while in Scenario II, predictions were made as a time series, and model results were compared with measured values for both scenarios. The proposed model can be confidently used to fill gaps in the dataset (Scenario I) as well as to predict nitrate values in a time series (Scenario II).
Keywords:
Nitrate pollution
; nitrat modelling
; artificial neural networks (ANNs)
; climate change
; sustainability
1. Introduction
Monitoring water quality is critical to maintaining the sustainability of natural water bodies and providing clean drinking water. Numerous factors have led to the routine measurement of a variety of water quality measurements in rivers, lakes, and groundwater, including nitrate (NO3), pH levels, dissolved oxygen, and others. These variables assist in monitoring the health of aquatic ecosystems, identifying potential sources of pollution, and developing mitigation plans. Of these, nitrate concentrations are particularly important because high levels in natural streams can lead to eutrophication, which lowers oxygen levels and negatively impacts aquatic life. Nitrate occurs in both surface and groundwater due to natural processes and anthropogenic activities. The main contributors to the occurrence of nitrates in both surface and groundwater include decomposed plant and animal wastes, certain categories of solid waste, household waste, wastewater from industrial processes, agricultural fertilizers, and wastewater from sewage treatment plants [1,2,3].
Elevated nitrate concentrations in wastewater mean not only a lack of essential nitrogen fertilizers but also a reduction in overall production efficiency. Therefore, it is essential to monitor the movement of nitrate nitrogen in conjunction with intensive agricultural and livestock production methods. The use of neural networks represents a promising innovative tool for the precise simulation of complex nitrogen dynamics in artificially drained soils [4]. Due to its impact on water quality and ecosystem integrity, nitrate contamination occurs in shallow groundwater and natural water poses serious environmental management and public health problems. Continuous sampling over time to monitor nitrate levels provide important information for understanding pollution trends and guiding remediation techniques. However, gaps often appear in these data sets for a variety of reasons, including technical limitations or errors in data processing, requiring accurate techniques to fill in missing values to maintain data integrity and the quality of subsequent analysis. Missing values in these time series datasets complicate data analysis because they can distort statistical results and make it difficult to create trustworthy water management plans. To maintain the integrity of long-term monitoring datasets, accurate missing value imputation techniques are essential.
A number of factors, including equipment malfunctions, sampling problems, or external circumstances that may make routine data collection impossible, can result in missing water quality datasets. Monitoring water quality processes and characterizing contaminants involves significant financial and labor costs, requiring extensive sampling initiatives and complex laboratory testing. Therefore, current efforts are focused on developing novel innovations aimed at improving the practicality of these efforts. Due to the interactions and correlations among water quality parameters, such as the concentrations of anions and cations, it is pertinent to examine whether a domain-specific mechanism that governs the observed patterns is present, thereby affirming the predictability of these parameters. The discovery of such predictive models holds particular significance for ecologists and environmental scientists, as it equips them with the capability to forecast water pollution levels and implement necessary precautionary measures proactively in advance [5,6].
Recently, stochastic modeling techniques, including artificial neural networks (ANNs), have attracted considerable scientific attention due to their simplicity, fast computational capabilities, and relative effectiveness compared to deterministic models [7]. To maintain the integrity of long-term monitoring datasets, accurate missing value imputation techniques are essential. Predictive modeling methods such as ANNs are useful in this situation. The main challenge is training the model to accurately predict missing points, especially when the data gaps are large or when the data gaps include critical seasonal fluctuations. Since nitrate is considered the primary measure for assessing groundwater pollution due to feedlot waste or other agricultural activities, it is important to carefully monitor nitrate-nitrogen (NO3-N) concentrations in both surface groundwater and subsurface runoff. Nitrate leaching from agricultural fields receiving manure and fertilizers is typically significantly higher in subsurface drainage effluents than in surface runoff [8].
In environmental sciences and hydrology, ANNs are effective tools for predicting missing values in time series data. Inspired by the neural architecture of the human brain, ANNs are particularly well suited to predicting missing nitrate levels because they can capture the many nonlinear correlations in environmental data sets. ANNs are able to learn patterns and trends from previous nitrate readings and associated environmental variables, helping them predict missing values with a high degree of accuracy. One of the main advantages of ANNs is their ability to extract knowledge from incomplete data sets. With appropriate training, ANNs have the ability to “generalize” from the recognized patterns in the available data to extrapolate missing values. In this context, the input variables fed to the ANN include historical nitrate concentrations, meteorological data and possibly other ecological indicators. By incorporating information from these inputs, the ANN anticipates the missing nitrate concentrations within the time sequence.
Estimating nitrate concentrations using cost-effective technologies is essential. Black box models such as ANNs are attracting great interest in predicting nitrate concentration by using easily measurable water quality parameters such as temperature, electrical conductivity (EC), groundwater level and pH. In this context, ANNs do not require prior knowledge of the structure and possible relationships between significant variables. Furthermore, the inherent learning capabilities of ANNs have resulted in their ability to adapt to systemic changes [9]. ANNs are used for the purpose of modeling complex processes, recognizing patterns, and performing time series analysis in various scientific disciplines, including, but not limited to, financial and economic research, industrial engineering studies, hydrological studies, meteorological analysis, and agroecological research efforts [10,11,12,13,14,15,16,17]. Numerous publications also address the use of ANN models in agricultural water management [4,7,18,19,20,21], Chau [22], conducted a comprehensive examination of the integration and present advancements pertaining to the incorporation of artificial intelligence within the domain of water quality modeling. Hatzikos et al. [23], employed neural networks characterized by active neurons as a methodological instrument for forecasting seawater quality parameters such as temperature, pH, dissolved oxygen, and turbidity. Palani et al. [5], illustrated the utilization of ANNs to simulate the values of selected seawater quality metrics, reflecting the dynamic and intricate processes involved [6,24]. Wagh et al. [25], an ANN model was developed that is capable of predicting nitrate concentration based on input variables such as EC, TDS, TH, Mg, Na, Cl, HCO3, and SO4. The researchers used various ANN algorithms to predict nitrate levels. The optimal ANN model consisted of 7 and 8 input neurons, 6 hidden neurons, and nitrate as the output variable in the pre- and post-monsoon period in 2012. They proposed that neural networks are effective tools for water pollution prediction.
Long-term monitoring of nitrate levels is essential to track nutrient loading and ensure water quality. However, gaps in nitrate data sets, whether due to sporadic sampling or other issues, can have significant implications for data-driven decision-making in water resources management. In this study, we evaluate the application of ANNs to predict missing nitrate levels in analyses of water samples regularly collected from the basin. On the application of ANNs to predict, forecast, and fill gaps in the same set of missing water quality data, with a focus on nitrate concentrations in water samples. Various scenarios were considered as possible models for ANN structuring and used long-term data sets over specific time series in which gaps are intentionally inserted to simulate incomplete data scenarios. In this context, missing data scenarios were simulated by intentionally removing sections of a nitrate time series dataset and then using ANNs to predict the missing data. To validate the accuracy of the ANN predictions, it was compared the predicted values with the actual nitrate measurements that were deliberately excluded from the dataset. This approach allows us to evaluate the performance of the ANN model in predicting missing nitrate levels using known ground truth data, assessing both the accuracy of the predictions and the robustness of the model in different environmental contexts. In addition, another important contribution of the study is that it promises practical implications for water resources management, which requires a lot of time, effort, technical work, and environmental monitoring. Accurate and timely prediction of nitrate concentrations not only helps understand contamination dynamics but also supports decision-making processes aimed at mitigating negative impacts on water quality and human health. In this way, with this research, by validating the ANN predictions against actual measured values, a contribution is provided to improving the reliability and usefulness of predictive models in water quality research. With this comprehensive approach, it is also aimed to provide valuable predictions on the potential of ANNs to improve the accuracy and reliability of nitrate prediction in natural water systems.
2. Materials and Methods
2.1. Study Area, Water Sampling and Analyzing
The Akarsu Irrigation District (AID), the research area, is located in the Lower Seyhan Plain (LSP) of Turkiye, in a catchment area extending over 9495 hectares [26,27]. This region predominantly has flat, homogeneous topography. The AID records 18.9 °C as the annual average, 9.0 °C as the lowest, and 31.0 °C as the highest air temperature. Furthermore, the catchment and its surroundings are reported to receive an average of 649.5 mm annual precipitation.[28] In the research area, citrus fruits, wheat, onions, and potatoes mainly have been grown in the 2022 winter season. In Turkey, the summer season usually lasts from June 1st to the end of August, and the winter season usually runs from December 1st to the end of February. The shallow groundwater table and water quality of this semi-arid region have been affected by prolonged, continuous irrigation [28]. Therefore, continuous water quality management is essential in this area.
Figure 1 shows the AID, which is located in the eastern Mediterranean region of Turkiye. The map is a detailed overview of the Lower Seyhan Plain in Turkiye, with a focus on irrigation and drainage infrastructure. It includes a map showing the broader region and a smaller inset map focusing on the Lower Seyhan Plain itself. Flow directions represented with arrows indicate the irrigation and drainage flow directions of water within the plain.
The Lower Seyhan Plain is an agricultural area with a well-developed irrigation and drainage system. The pumping stations obtain water from a source (river, reservoir) to supply the irrigation canals. The measuring stations help monitor water flow and ensure efficient management of the system. As seen in Figure 1, an irrigation pumping station is used to pump water for agricultural areas; an irrigation gauging station measures the flow rate and water levels in irrigation canals. The drainage stations collect excess water from the fields and drain it into a suitable drain. Drainage water samples used in the study were automatically taken daily with the automatic water sampling device (ISCO-3700) installed at the drainage gauging station where observations were made. The water samples taken were brought to Çukurova University, Faculty of Agriculture, Department of Agricultural Structures and Irrigation Laboratory to be prepared for analysis and first recorded on the laboratory record sheet; then filtered with blue-band filter paper and transferred to plastic bottles cleaned by passing through chromic acid solution. The bottles were labeled according to the technique. Depending on the time and labor, the water samples were either analyzed immediately [29] or kept in the refrigerator at +4 oC until the analysis was performed. A Shimadzu brand spectrophotometer device was used in the analyses performed to determine the NO3 concentrations in irrigation and drainage waters in mg L-1 units.
2.2. Observed Data Used
The dataset used in the model studies was obtained through flow measurements taken at the drainage gauging station and laboratory analyses of collected water samples. Covering the 2022 and 2023 water years, the dataset spans 730 days and includes EC, pH, Q (Discharge), P (daily precipitation), NO3, and the DOWY (day of water year) value, which indicates the day of the water year for each measurement day to account for temporal variations in the dataset. Comprising 730 rows and 5 columns, the dataset was used in two scenarios during the training and testing phases of the proposed ANN model, with each scenario containing its own two different conditions. Detailed information regarding the scenarios is provided in section 2.3.
As mentioned above, since measuring nitrate is a difficult and costly process, this study aims to develop a method to express nitrate values in terms of a few parameters that are easier and cheaper to measure, rather than relying on laboratory analyses. For this process, as seen in Figure 2, correlations between nitrate levels and the values of DOWY, EC, pH, Q, and P were calculated, and the highest correlation with nitrate was found to be inversely proportional to flow rate (-0.668). This was followed by the correlation between nitrate and EC (0.623). Although the correlation between nitrate and the other parameters is relatively weak, preliminary tests indicated that using these parameters as inputs contributes positively to the model’s generalization and test performance. Therefore, all the parameters mentioned above were used during the training and testing phases of the Figure 3 illustrates the typical structure of multi-layer ANNs.
2.3. Developing an ANN Model for Nitrat Concentrations
To determine the optimal number of neurons in the hidden layer, 80% of the data was used for training the network, and 20% was used for testing. This process was repeated for 100 different randomly selected training and testing datasets, and the Mean Squared Error (MSE) value was calculated. This process was repeated in a loop from 1 to the maximum number of neurons, which is 30 in this study, and the number of neurons that yielded the minimum MSE value was selected as the optimal number of neurons, and the analyses were conducted accordingly [30,31]. As seen in Figure 4, the optimum number of neurons obtained for Scenario I and II is 12.
3. Results
The ANN-Nitrate model was implemented for the 2022 and 2023 water years using data obtained from the study area in two scenarios. In Scenario I, the data used in the training and testing phases was selected randomly from the dataset, while in Scenario II, it was chosen in two consecutive time periods. In Scenario I, the aim was to predict nitrate values for days without measurements due to various reasons within the measurement period, whereas in Scenario II, the aim was to predict values before or after the measurement period. For each scenario, the amount of data used in the training phase of the model was chosen as 20% and 50% of the total data, labeled as cases 1 and 2, respectively.
The measured values and model results for Scenario I are provided in Figure 5 as Case 1 and Case 2, respectively. As can be seen from Figure 5, the model results show good agreement with the measured values in both cases and represent the overall trend quite well. In Figure 5, the alignment of the model results with the measured values is shown through scatter plots. The R² values calculated for Case 1 and Case 2 are 0.7935 and 0.7831, respectively, which are considered to indicate that the proposed model has very good generalization and predictive capability.
Considering that the data ratio used in the training phase of ANN models commonly used in the literature [30,32,33] is between 0.70 and 0.80, the fact that the results obtained using 20% of the dataset are very close to those obtained using 50% of the dataset, and that they represent the actual situation quite well, indicates that the model’s input values and architecture could be a good alternative for predicting nitrate values.
In Scenario II, unlike in Scenario I, the data used for training and testing the ANN-Nitrate model was selected sequentially. In the training phase of the model, the first 0.20 and 0.50 portions of the dataset were used for case I and case II, respectively, and the remaining 0.80 and 0.50 were predicted in the testing phase. The results obtained for Scenario II are presented in Figure 6. As can be seen from Figure 6, there is a very good agreement between the model results and the measured nitrate values, and the overall trend is accurately reflected.
In Figure 7, the model results obtained for Scenario II are presented as a scatter plot against the measured nitrate values. As shown in Figure 7, the R2 values were calculated as 0.7789 and 0.7598 for case I and case II, respectively. It is noted that the R2 values calculated for Scenario II are somewhat lower than those in Scenario I. However, as seen in case II, it is expected that model performance will decrease as the prediction period increases. This situation will be discussed in more detail in the next section.
4. Discussion
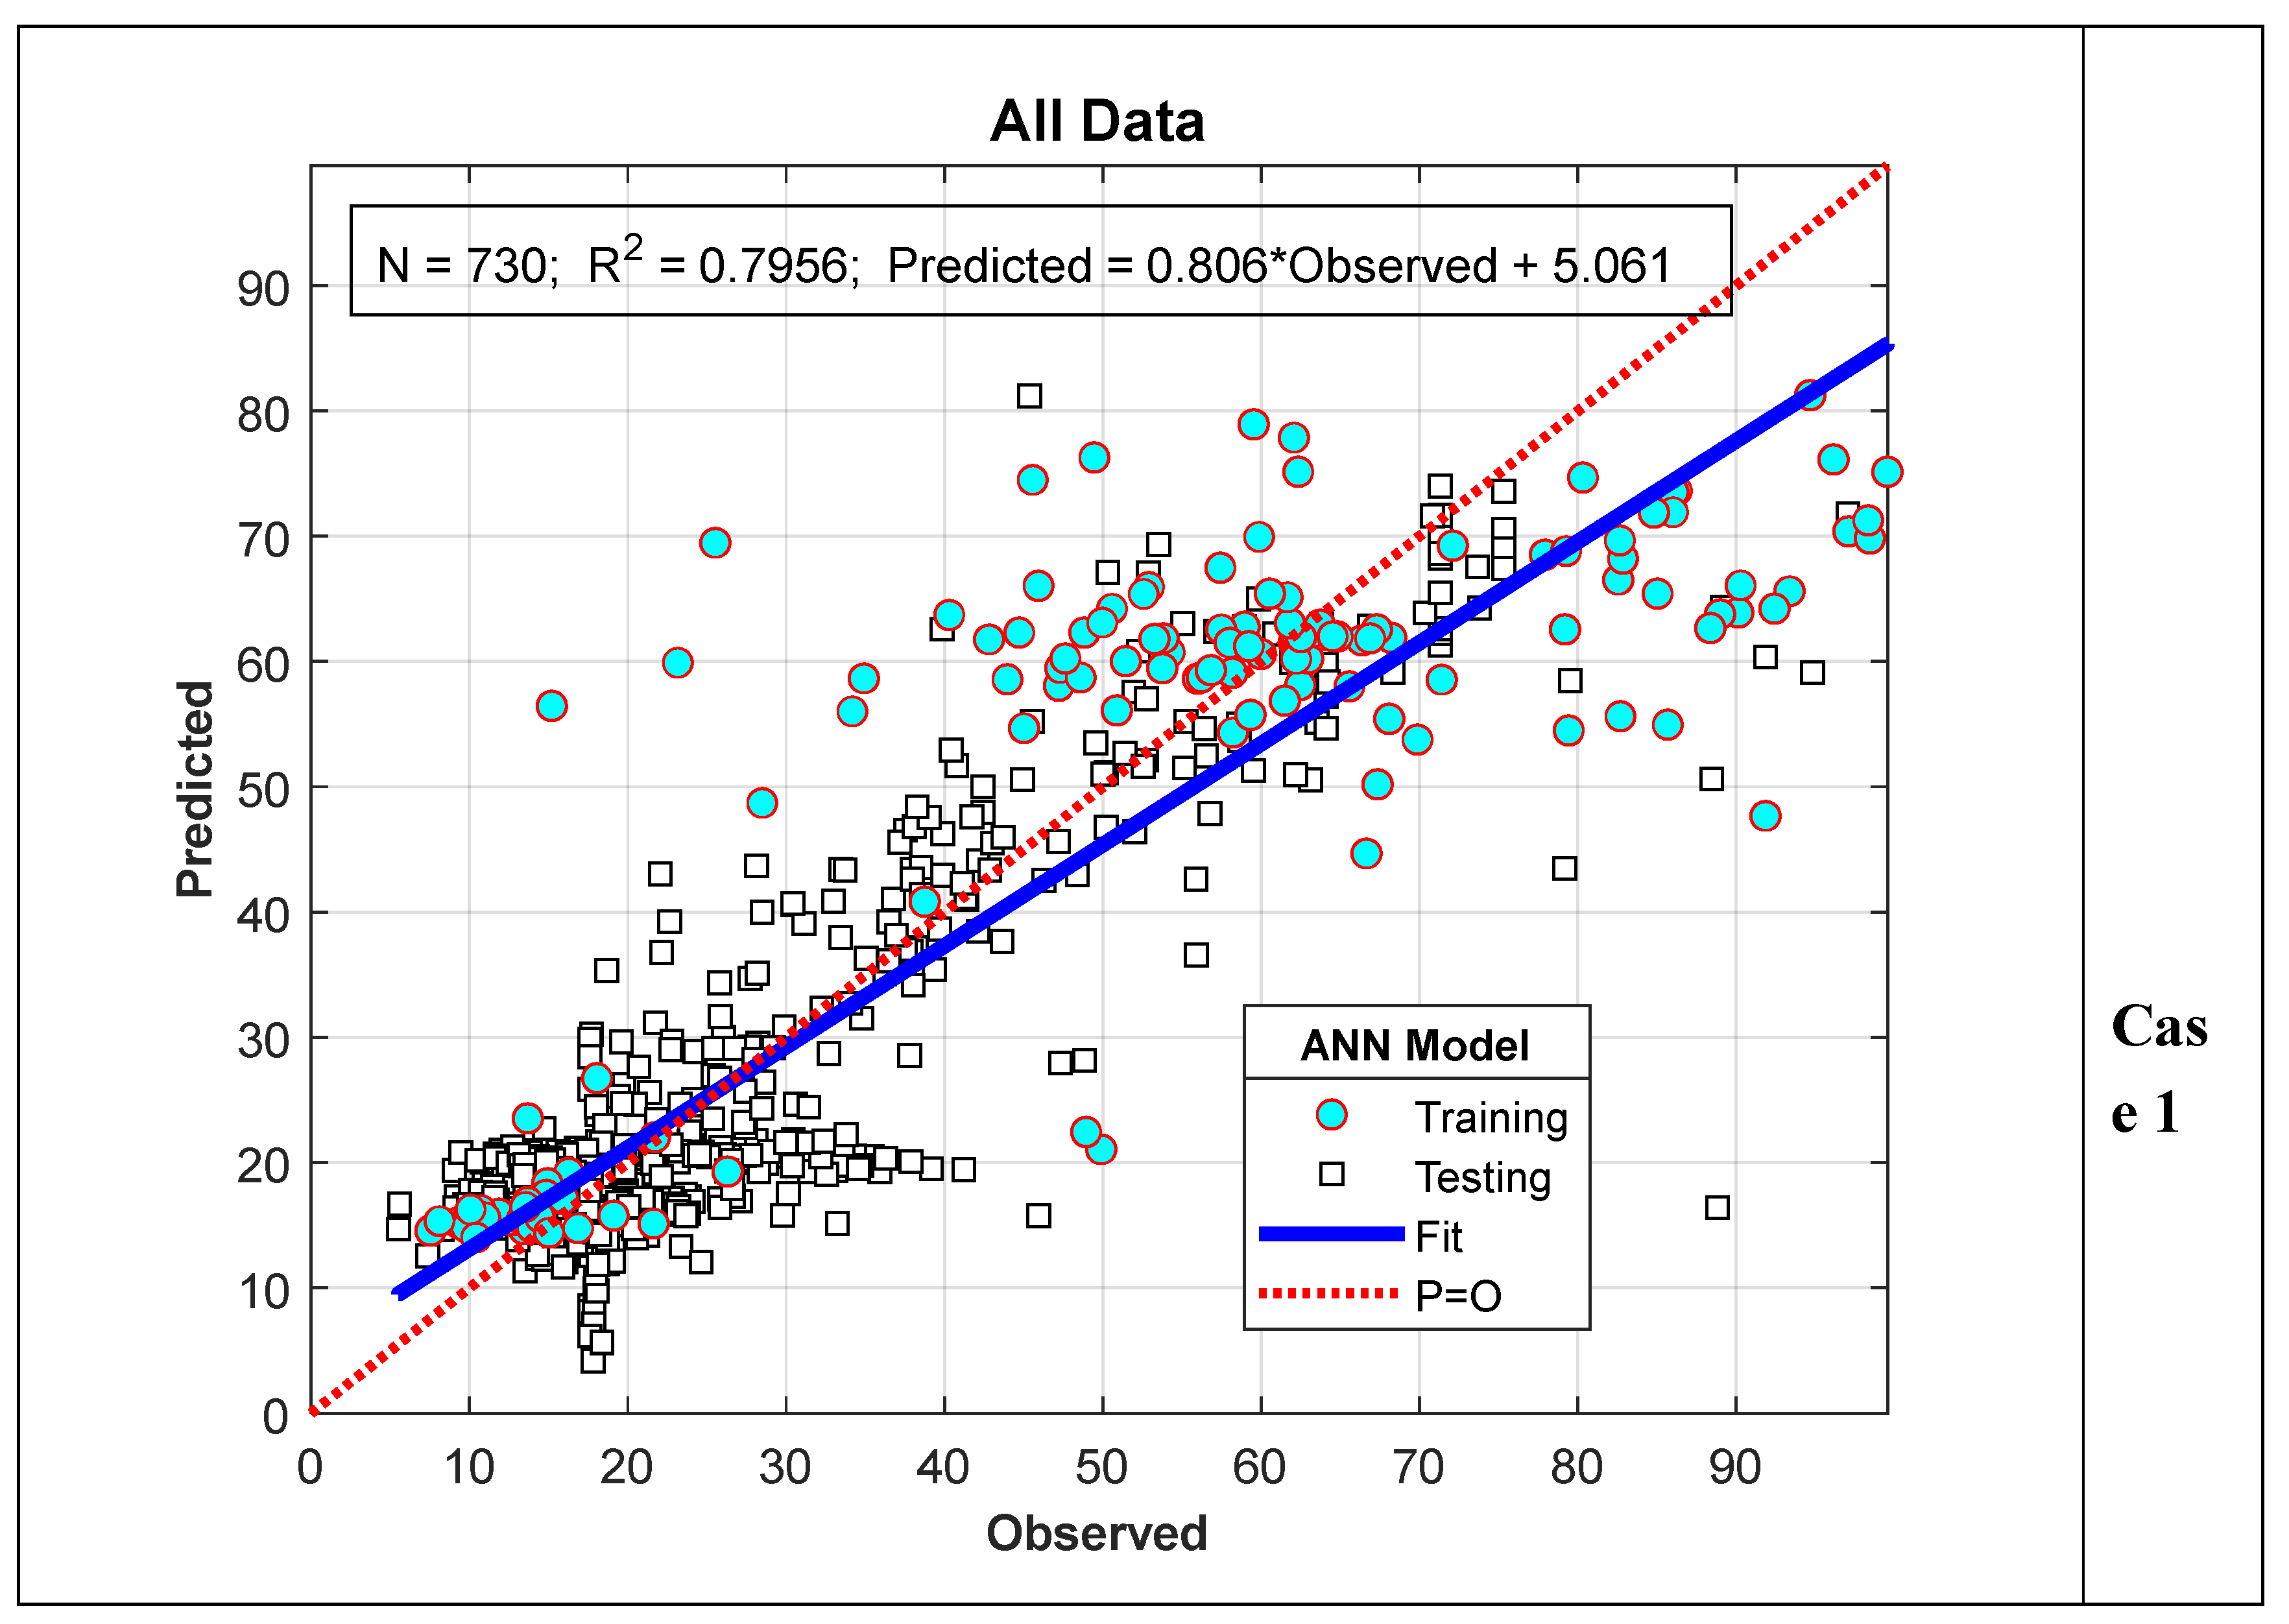
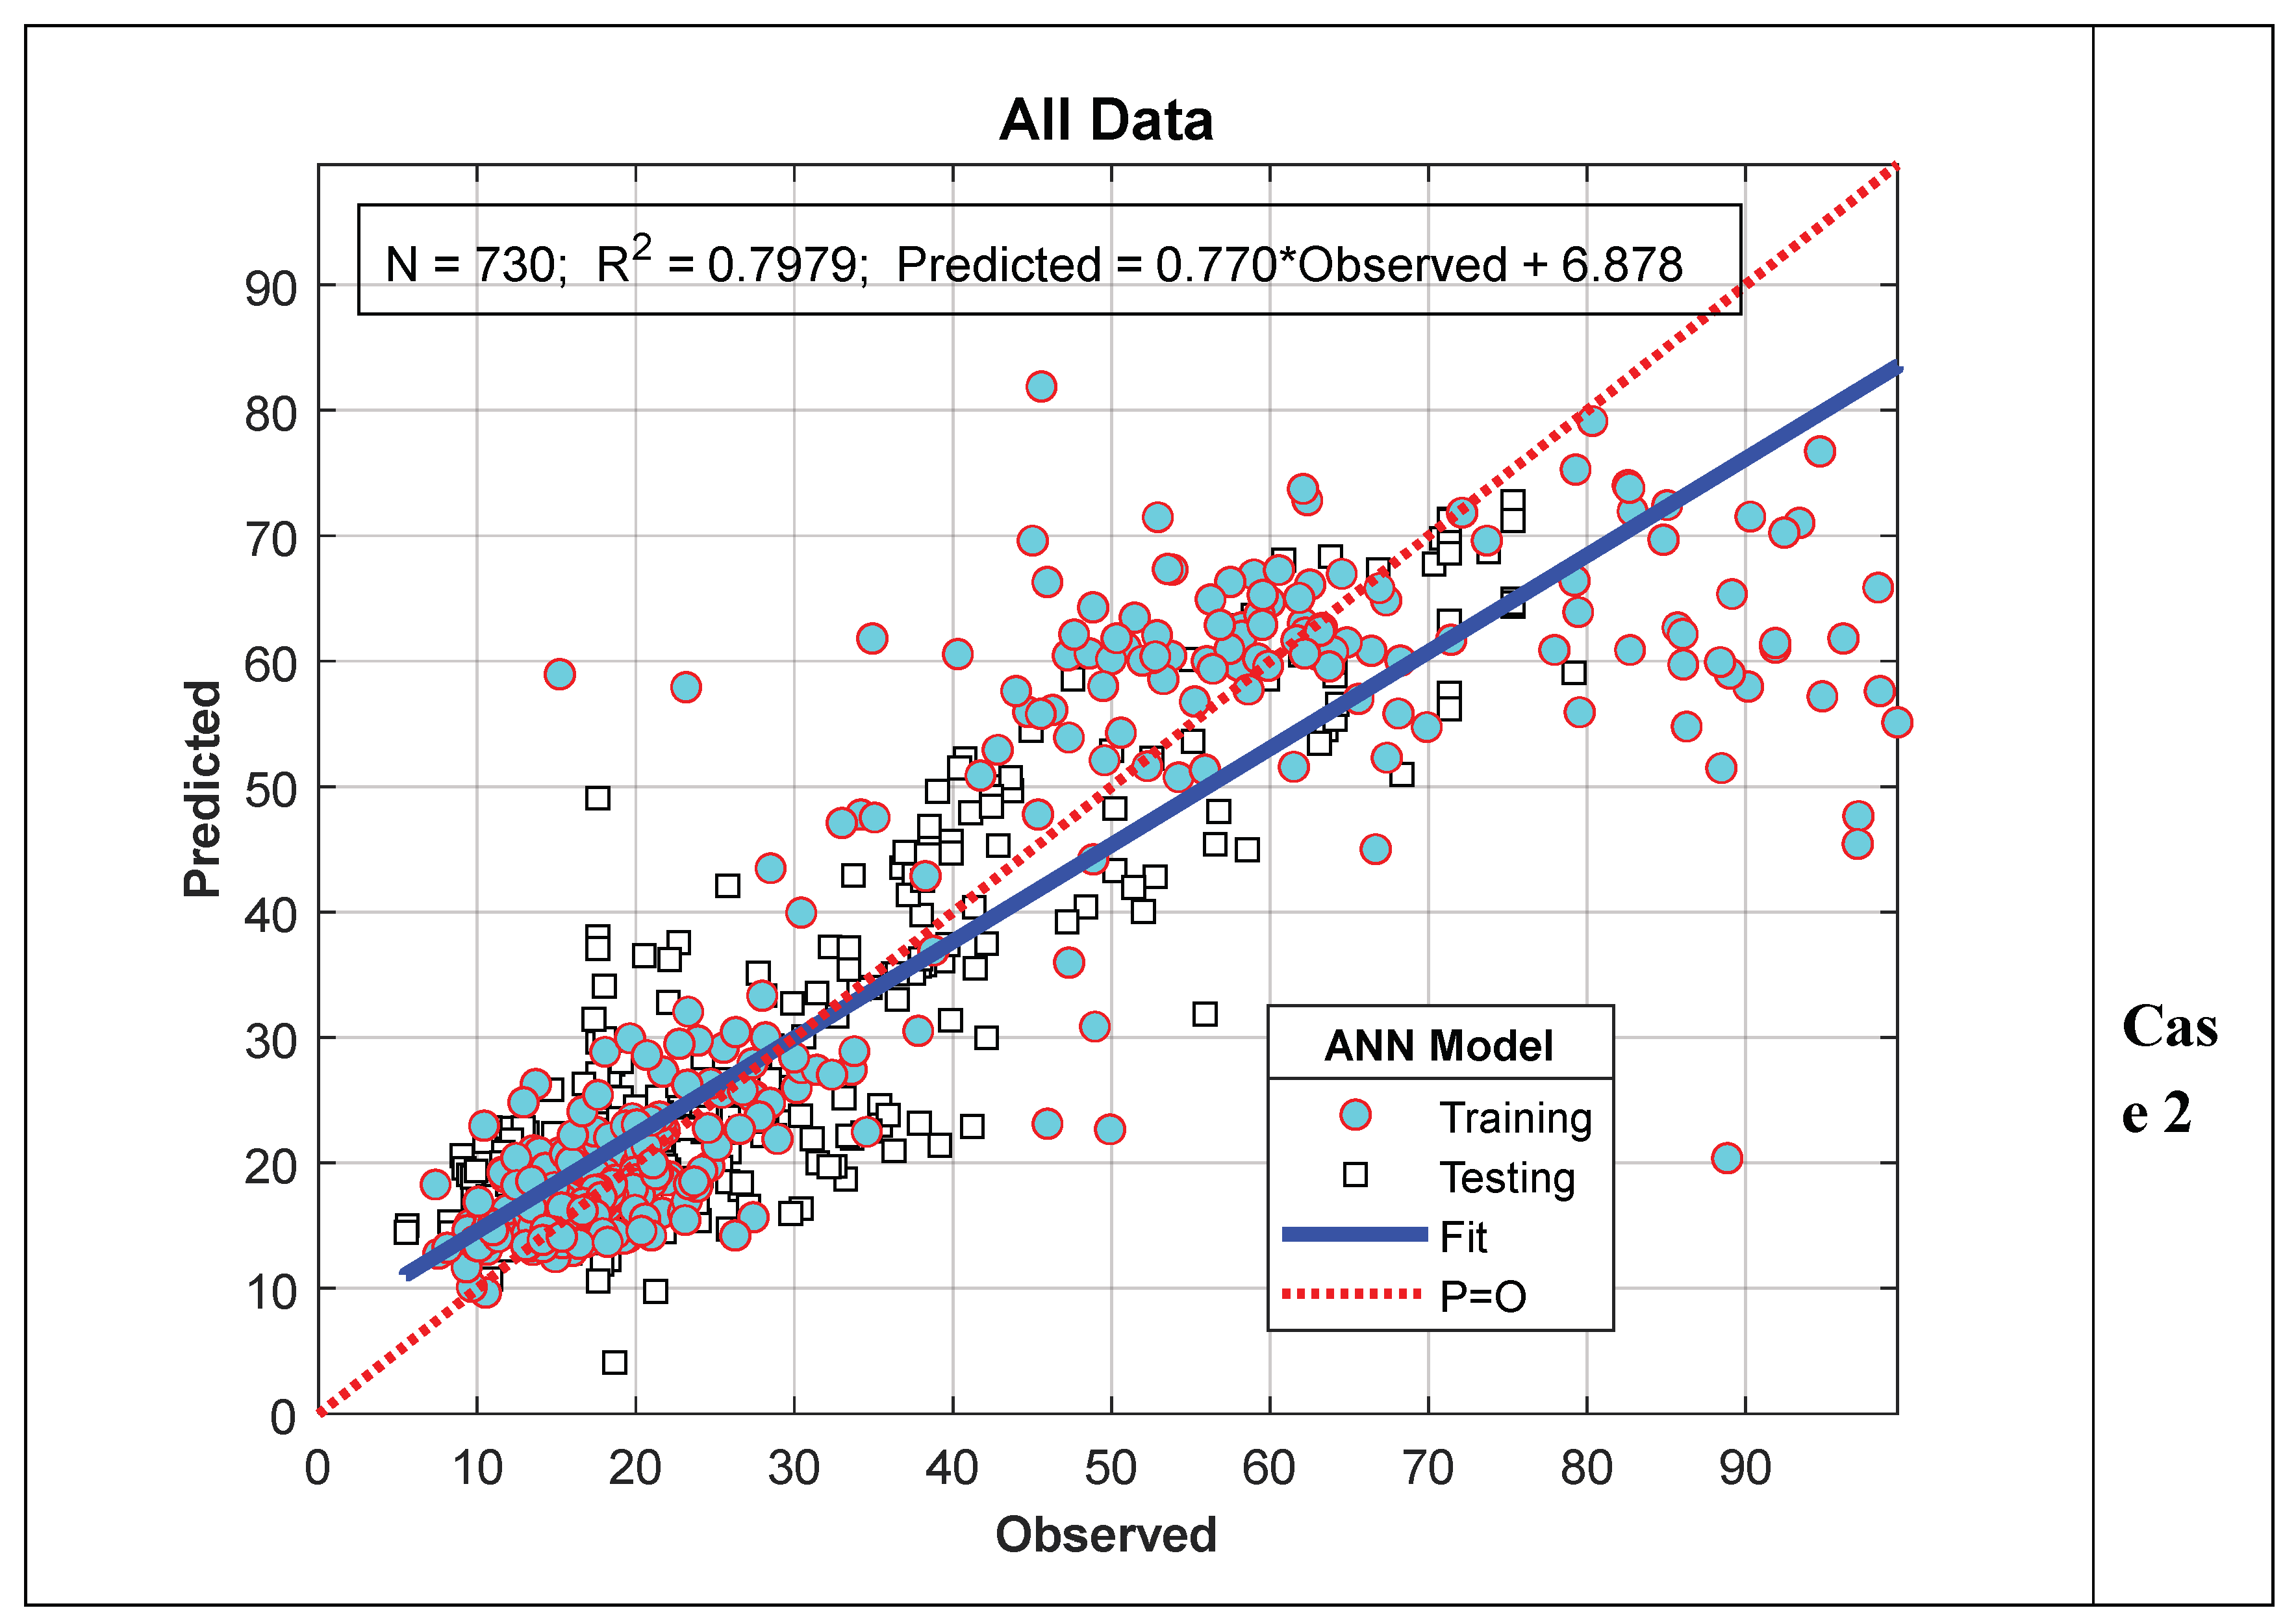
When evaluating the results of the ANN-Nitrate model presented in the previous section, it is evident that the results obtained for Scenario I are better than those for Scenario II. This is thought to be due to the fact that in Scenario I, the data used for the training and testing phases were randomly selected from the entire series, while in Scenario II, the data were selected as a consecutive time series. As can be clearly seen from Figure 4 and Figure 6, although the nitrate values measured for the 2022 water year show a similar trend to those for 2023, they are relatively smaller. Therefore, since all the data used in the training phase for Scenario II pertain to 2022, the test performance is slightly lower compared to Scenario I. This situation is particularly more evident in Case II. This is because all the data used in the training phase of Case II belong to 2022, while the model results calculated in the testing phase belong entirely to the 2023 water year. To verify this argument, in this section, data from 2023 were used in the model training phase instead of 2022, and values for 2022 were calculated as test data. In other words, the training and testing data used in Scenario II were swapped, and the analysis was repeated. The results are summarized in Figure 8 and Figure 9. As can be clearly seen from Figure 8, although the peak values for 2022 were very well predicted, deviations in minimum values showed a significant increase. On the other hand, as shown in Figure 9, the R² value increased to 0.7956 and 0.7979 for cases I and II, respectively. In other words, there was a noticeable improvement in model performance.
From the points raised in the previous section and the discussions in this section, it is clear that the overall performance of Scenario I is better than that of Scenario II. However, considering that the purposes of the two scenarios are different and that the results of Scenario II are also quite satisfactory in practical terms, it can be concluded that the proposed model can be reliably used for both scenarios.
5. Conclusions
In recent years, artificial neural networks (ANNs) have been successfully applied in modeling hydrological, meteorological, and hydrometeorological processes, which have highly complex structures. In irrigation areas, the addition of pollutants resulting from agricultural activities further increases the complexity of these processes and complicates their solution. In order to understand the spatial and temporal distribution of numerous parameters related to water quality, it is necessary to implement long-term and costly measurement programs. Implementing such long-term and expensive measurement programs is quite challenging in developing countries.
This study aims to develop an ANN-based model to determine nitrate concentrations in drainage waters within an irrigation area located in the Lower Seyhan Basin, one of Turkey’s significant agricultural production regions. For this purpose, water samples were taken daily during the 2022 and 2023 water years at a station where drainage waters from the entire irrigation area are collected, and nitrate concentrations were determined in the laboratory. Along with nitrate concentrations, other parameters such as discharge, electrical conductivity, pH, and precipitation were also measured simultaneously at the same station. The complex relationship between the measured nitrate values and other parameters, which are easier and cheaper to measure, was used in two different scenarios during the learning phase of the ANN-Nitrate model. The model, once trained, predicted nitrate values using the other parameters. In Scenario I, random values were predicted, while in Scenario II, predictions were made as a time series, and the model results were compared with measured values.
For Scenario I Case 1, the model performance (R²) for training, testing, and the entire dataset was 0.8805, 0.7732, and 0.7935, respectively, while for Case 2, it was 0.7637, 0.8048, and 0.7831, respectively. As observed, despite the data proportions used in training the model varying from 0.20 to 0.50 of the total data in both cases, there was no significant change in model performance for the full dataset. This outcome is considered a result of the careful selection of both the parameters used in training the ANN-Nitrate model and the model’s network architecture. Furthermore, training the model with less data and achieving a high test performance highlights another significant aspect of this study.
Similarly, in Scenario II Case 1, model performance (R²) for training, testing, and the entire dataset was 0.8722, 0.7498, and 0.7789, respectively, while for Case 2, it was 0.8422, 0.7155, and 0.7598, respectively. The overall performance of Scenario I appears to be better than Scenario II. However, considering that each scenario serves a different purpose and that Scenario II also provides practically satisfactory results, it can be said that the proposed model can be reliably used for both scenarios.
In conclusion, the ability to accurately predict nitrate -a significant parameter in terms of irrigation and general water quality- using an ANN-based model with parameters that are easier and cheaper to measure, such as EC, pH, Q, and P, is considered an important contribution of this study to the literature. This model aids both in filling in missing data and in making future predictions.
Author Contributions
Conceptualization, H.K. and M.E.C.; Methodology, H.K and M.E.C and M.E.C.; Software, H.K.; Validation, H.K.; Formal analysis, M.E.C. .; Investigation, H.K. and M.E.C.; Resources.; Data curation, H.K.., M.E.C.; Writing-original draft, H.K., M.E.C..; Writing-review & editing, H.K. and M.E.C; Supervision, H.K.; Project administration, H.K. All authors have read and agreed to the published version of the manuscript.
Funding
“This research was funded by Scientific and Technological Research Council of Turkiye (TUBITAK), Project number: 122Y007”. The authors thank the TUBITAK for obtaining financial support for this work.
References
- McNeely, R.N.; Neimanis, V.P.; Dwyer, L. Water quality sourcebook: a guide to water quality parameters. Inland Waters Directorate, Water Quality Branch, 1979; pp. 1-89.
- Hem, J.D. Study and interpretation of the chemical characteristics of natural water (Vol. 2254). Department of the Interior, US Geological Survey. 1985.
- Benzer, S.; Benzer, R. Modelling nitrate prediction of groundwater and surface water using artificial neural networks. Journal of Polytechnic. 2018, 21, 321–325. [Google Scholar] [CrossRef]
- Sharma, V.; Negi, S.C.; Rudra, R.P.; Yang, S. Neural networks for predicting nitrate-nitrogen in drainage water. Agric. Water Manage. 2003, 63, 169–183. [Google Scholar] [CrossRef]
- Palani, S.; Liong, S.Y.; Tkalich, P. An ANN application for water quality forecasting. Marine Poll. Bull. 2008, 56, 1586–1597. [Google Scholar] [CrossRef]
- Zare, A.; Bayat, V.; Daneshkare, A. Forecasting nitrate concentration in groundwater using artificial neural network and linear regression models. International Agrophysics. 2011, 25, 2–187. [Google Scholar]
- Sarangi, A.; Singh, M.; Bhattacharya, A.K.; Singh, A.K. Subsurface drainage performance study using SALTMOD and ANN models. Agric. Water Manage. 2006, 84, 240–248. [Google Scholar] [CrossRef]
- Logan, T.J.; Eckert, D.J.; Beak, D.G. Tillage, crop and climatic effects of runoff and tile drainage losses of nitrate and four herbicides. Soil and Tillage Res. 1994, 30, 75–103. [Google Scholar] [CrossRef]
- Strik, D.P.; Domnanovich, A.M.; Zani, L.; Braun, R.; Holubar, P. Prediction of trace compounds in biogas from anaerobic digestion using the MATLAB Neural Network Toolbox. Environ. Modell. Softw. 2005, 20, 803–810. [Google Scholar] [CrossRef]
- Koekkoek, E.J.W.; Booltink, H. Neural network models to predict soil water retention. Eur. J. Soil Sci. 1999, 50, 489–495. [Google Scholar] [CrossRef]
- Co, H.C.; Boosarawongse, R. Forecasting Thailand’s rice export: Statistical techniques vs. artificial neural networks. Comput. Ind. Eng. 2007, 53, 610–627. [Google Scholar]
- Erzin, Y.; Rao, B.H.; Singh, D.N. Artificial neural network models for predicting soil thermal resistivity. Int J Therm Sci. 2008, 47, 1347–1358. [Google Scholar] [CrossRef]
- Baker, L.; Ellison, D. Optimisation of pedotransfer functions using an artificial neural network ensemble method. Geoderma. 2008, 144, 212–224. [Google Scholar] [CrossRef]
- Liu, H.; Xie, D. , Wu, W. Soil water content forecasting by ANN and SVM hybrid architecture. Environ Monit Assess. 2008, 143, 187–193. [Google Scholar] [CrossRef]
- Patil, S.L.; Tantau, H.J.; Salokhe, V.M. Modelling of tropical greenhouse temperature by auto regressive and neural network models. Biosyst Eng. 2008, 99, 423–431. [Google Scholar] [CrossRef]
- Xu, L.; Yang, J.; Zhang, Q.; Niu, H. Modelling water and salt transport in a soil–water–plant system under different groundwater tables. Water and Environment Journal. 2008, 22, 265–273. [Google Scholar] [CrossRef]
- Zou, P.; Yang, J.; Fu, J.; Liu, G.; Li, D. Artificial neural network and time series models for predicting soil salt and water content. Agric. Water Manage. 2010, 97, 2009–2019. [Google Scholar] [CrossRef]
- Sarangi, A.; Bhattacharya, A.K. Comparison of artificial neural network and regression models for sediment loss prediction from Banha watershed in India. Agric. Water Manage. 2005, 78, 195–208. [Google Scholar] [CrossRef]
- Kim, M.Y.; Seo, M.C.; Kim, M.K. Linking hydro-meteorological factors to the assessment of nutrient loadings to streams from large-plotted paddy rice fields. Agric. Water Manage. 2007, 87, 223–228. [Google Scholar] [CrossRef]
- Landeras, G.; Ortiz-Barredo, A.; López, J.J. Comparison of artificial neural network models and empirical and semi-empirical equations for daily reference evapotranspiration estimation in the Basque Country (Northern Spain). Agric. Water Manage. 2008, 95, 553–565. [Google Scholar] [CrossRef]
- Chinh, L.V.; Hiramatsu, K.; Harada, M.; Mori, M. Estimation of water levels in a main drainage canal in a flat low-lying agricultural area using artificial neural network models. Agric. Water Manage. 2009, 96, 1332–1338. [Google Scholar] [CrossRef]
- Chau, K.W. A review on integration of artificial intelligence into water quality modelling. Marine Poll. Bull. 2006, 52, 726–733. [Google Scholar]
- Hatzikos, E.; Anastasakis, L.; Bassiliades, N.; Vlahavas, I. Simultaneous prediction of multiple chemical parameters of river water quality with tide. Proc. 2nd Int. Sci. Conf. Computer Sci., Varna, Bulgaria, 2005, IEEE Computer Society, May 11-13.
- Faruk, D.O. A hybrid neural network and ARIMA model for water quality time series prediction. Eng. Appl. Artificial Intell. 2010, 23, 586–594. [Google Scholar] [CrossRef]
- Wagh, V.; Panaskar, D.; Muley, A.; Mukate, S.; Gaikwad, S. Neural network modelling for nitrate concentration in groundwater of Kadava River basin, Nashik, Maharashtra, India. Groundwater Sustain. Develop. 2018, 7, 436–445. [Google Scholar]
- Alsenjar, O.; Çetin, M.; Aksu, H.; Akgül, M.A.; Golpinar, M.S. Cropping pattern classification using artificial neural networks and evapotranspiration estimation in the Eastern Mediterranean region of Turkey. Journal of Agricultural Sciences. 2023, 29, 677–689. [Google Scholar] [CrossRef]
- Alsenjar, O.; Cetin, M.; Aksu, H.; Golpinar, M.S.; Akgul, M.A. Actual evapotranspiration estimation using METRIC model and Landsat satellite images over an irrigated field in the Eastern Mediterranean Region of Turkey. Med. Geosc. Rev. 2023, 5, 35–49. [Google Scholar] [CrossRef]
- Cetin, M.; Kaman, H.; Kirda, C.; Sesveren, S. Analysis of irrigation performance in water resources planning and management: a case study. Fresenius Environ. Bull. 2020, 29, 3409–3414. [Google Scholar]
- Rice, E. W.; Bridgewater, L. Standard methods for the examination of water and wastewater (Vol. 10). 2012, Washington, DC: American public health association.
- Karahan, H.; Iplikci, S.; Yasar, M.; Gurarslan, G. River flow estimation from upstream flow records using support vector machines. Journal of Applied Mathematics. 2014, 2014, 714213. [Google Scholar] [CrossRef]
- Karahan, H.; Ayvaz, M.T. Simultaneous parameter identification of a heterogeneous aquifer system using artificial neural networks. Hydrogeol. J. 2008, 16, 817–827. [Google Scholar] [CrossRef]
- Maier, H.R.; Dandy, G.C. Neural networks for the prediction and forecasting of water resources variables: a review of modelling issues and applications. Environmental Modelling & Software. 2000, 15, 101–124. [Google Scholar]
- Karahan, H.; Cetin, M.; Can, M.E.; Alsenjar, O. Developing a New ANN Model to Estimate Daily Actual Evapotranspiration Using Limited Climatic Data and Remote Sensing Techniques for Sustainable Water Management. Sustainability. 2024, 16, 6–2481. [Google Scholar] [CrossRef]
Figure 1.
Location of the study area in Turkiye, irrigation and drainage water flows directions and the water sampling station (Drainage gauging station).
Figure 1.
Location of the study area in Turkiye, irrigation and drainage water flows directions and the water sampling station (Drainage gauging station).
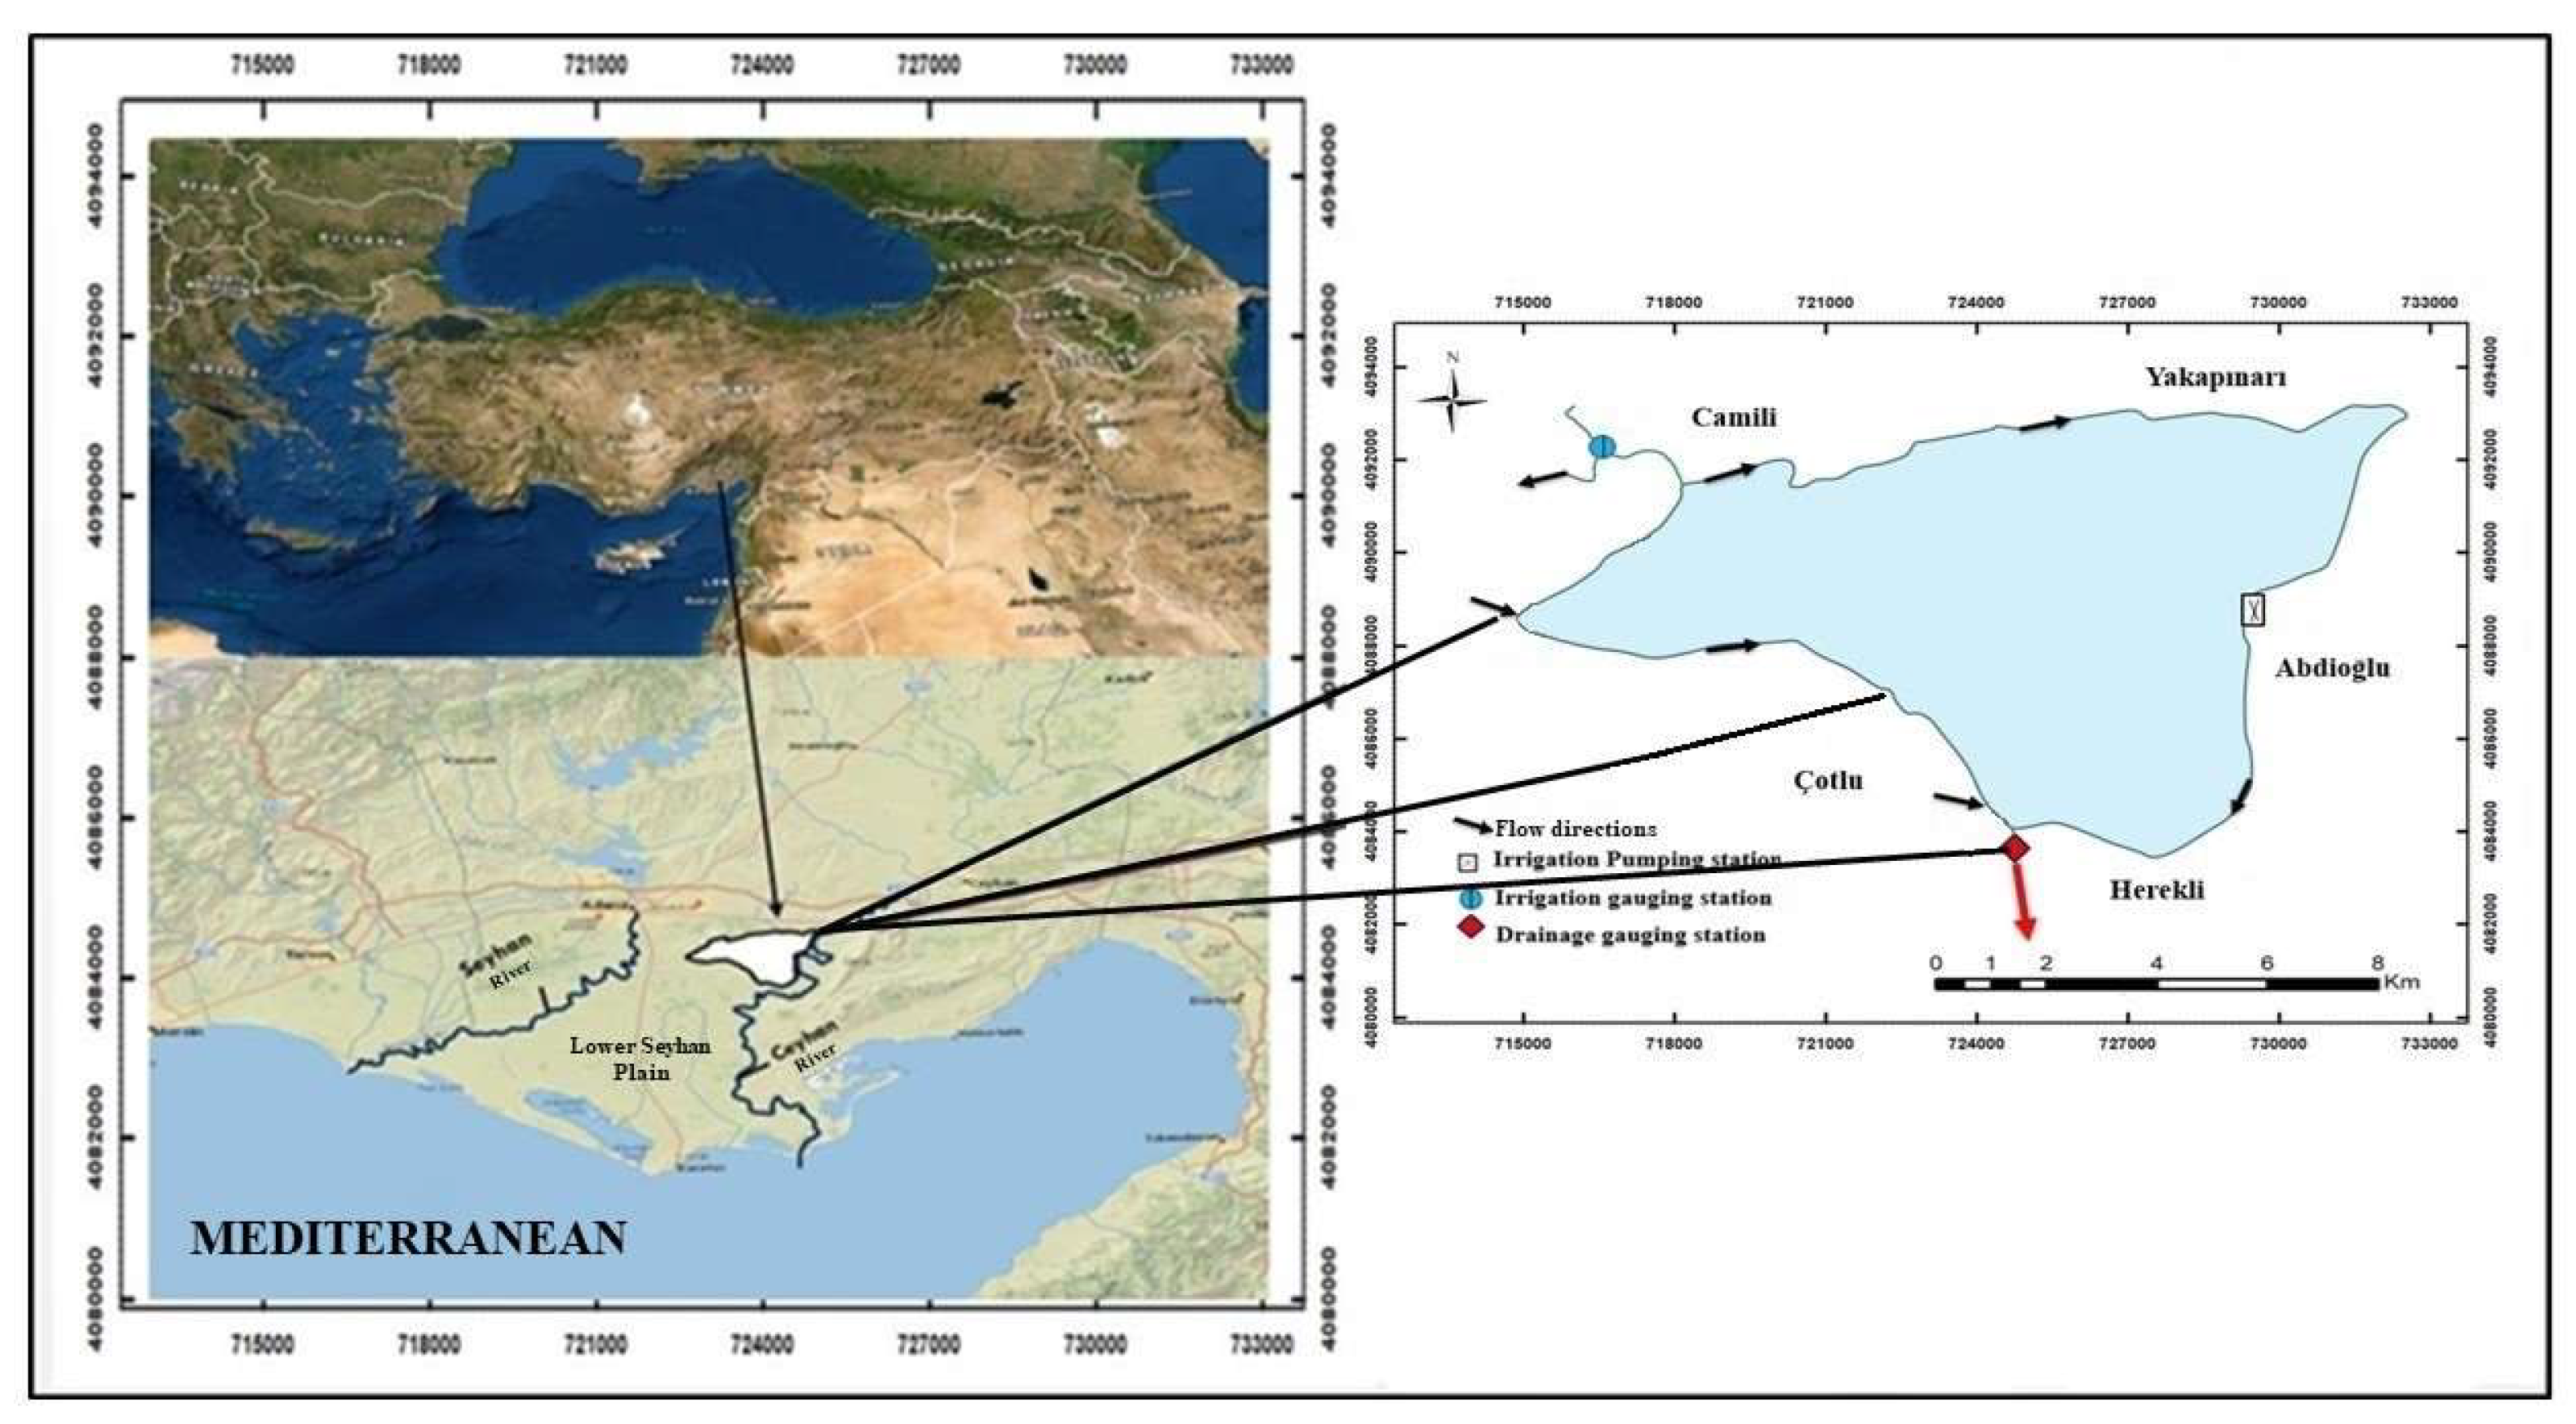
Figure 2.
The correlation relationship between NO3 and model parameters.
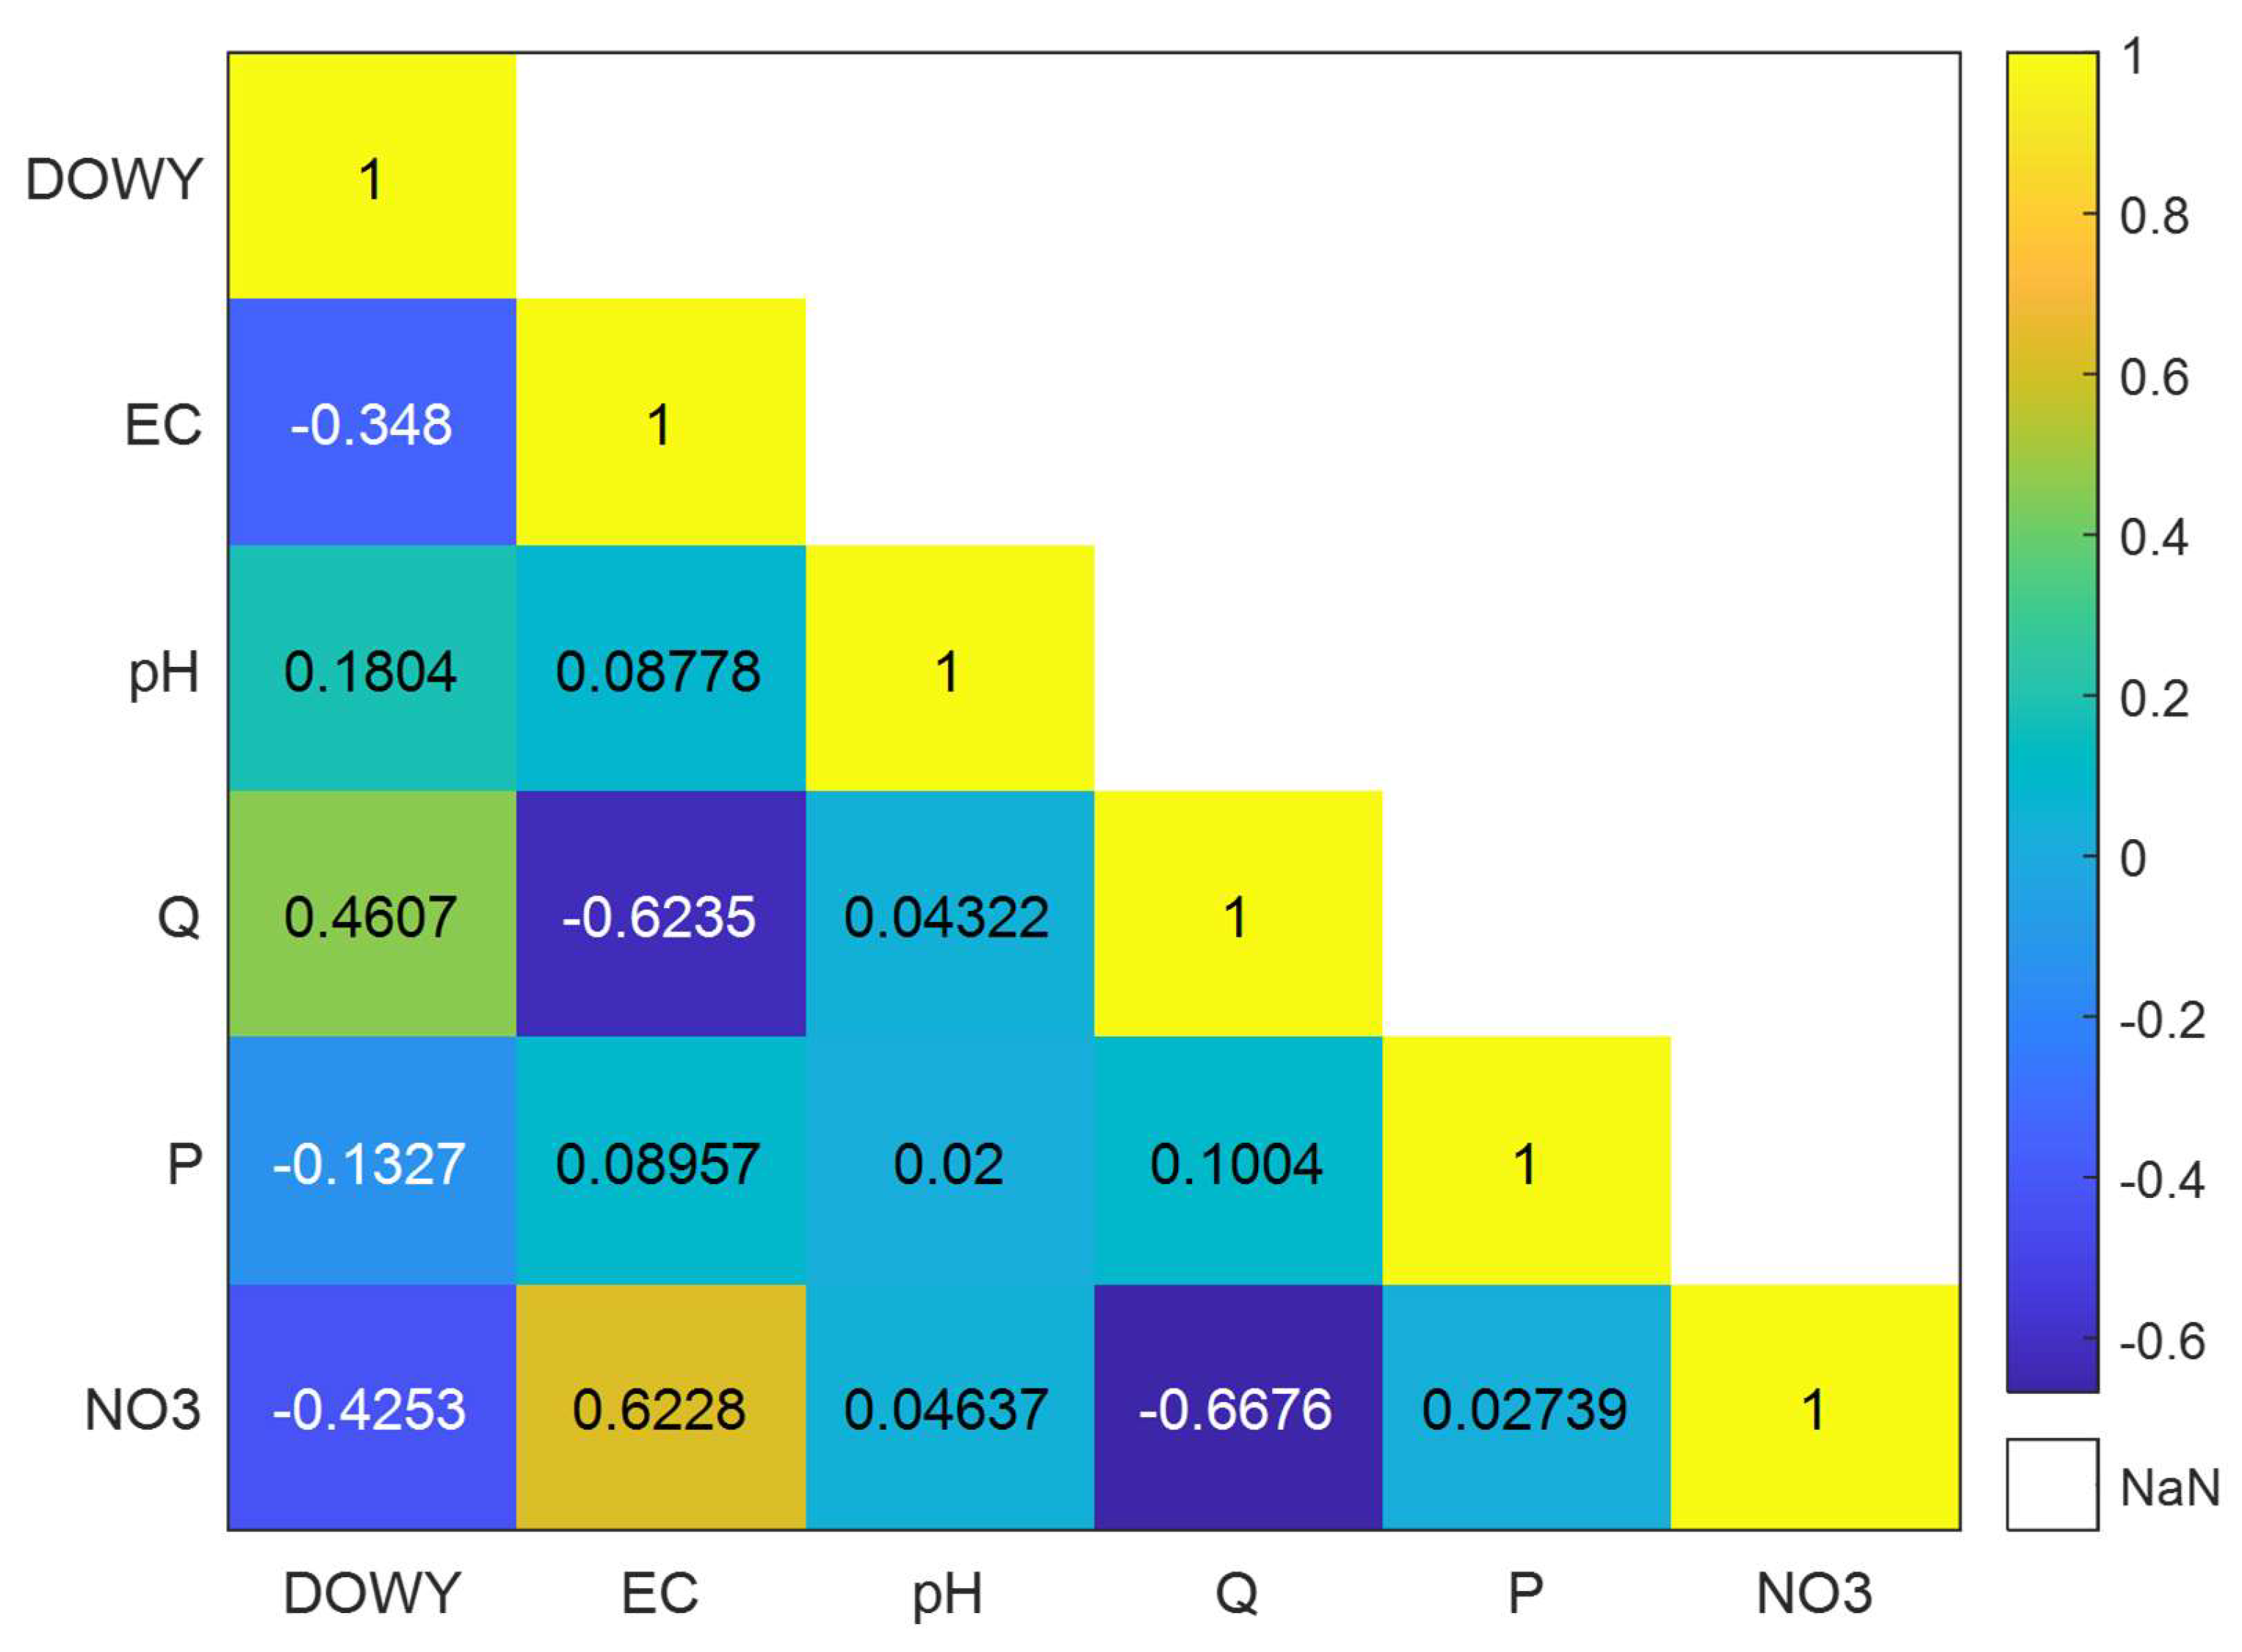
Figure 3.
The typical structure of multi-layer ANNs used in this study.
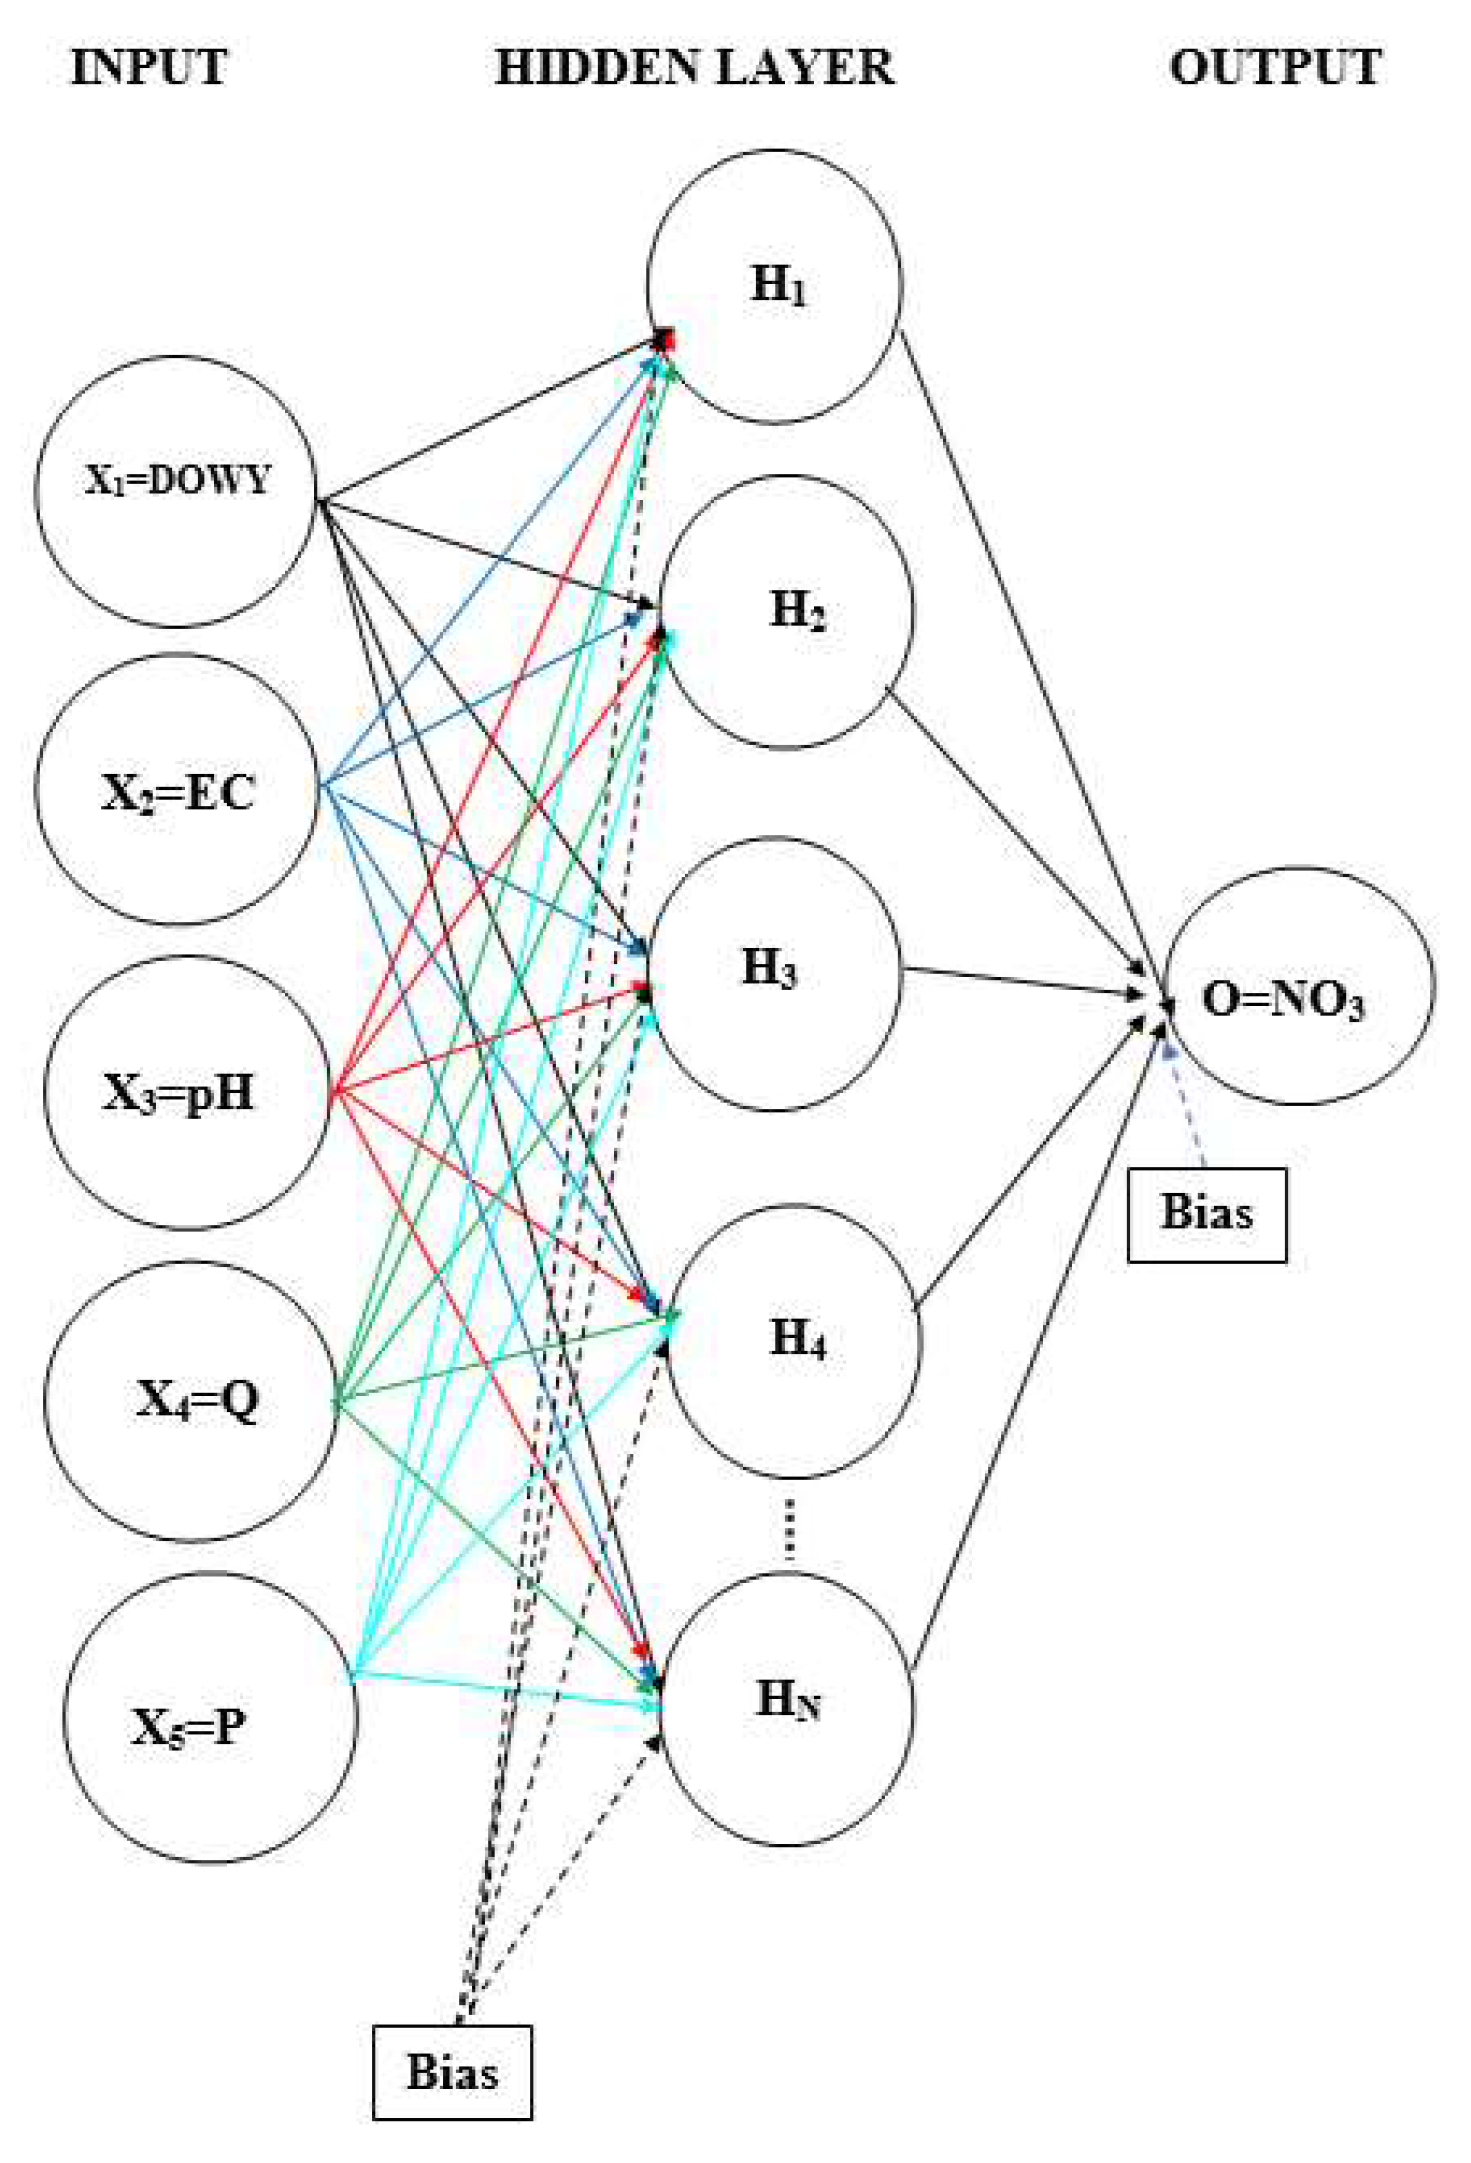
Figure 4.
A three-layer feed-forward ANN.
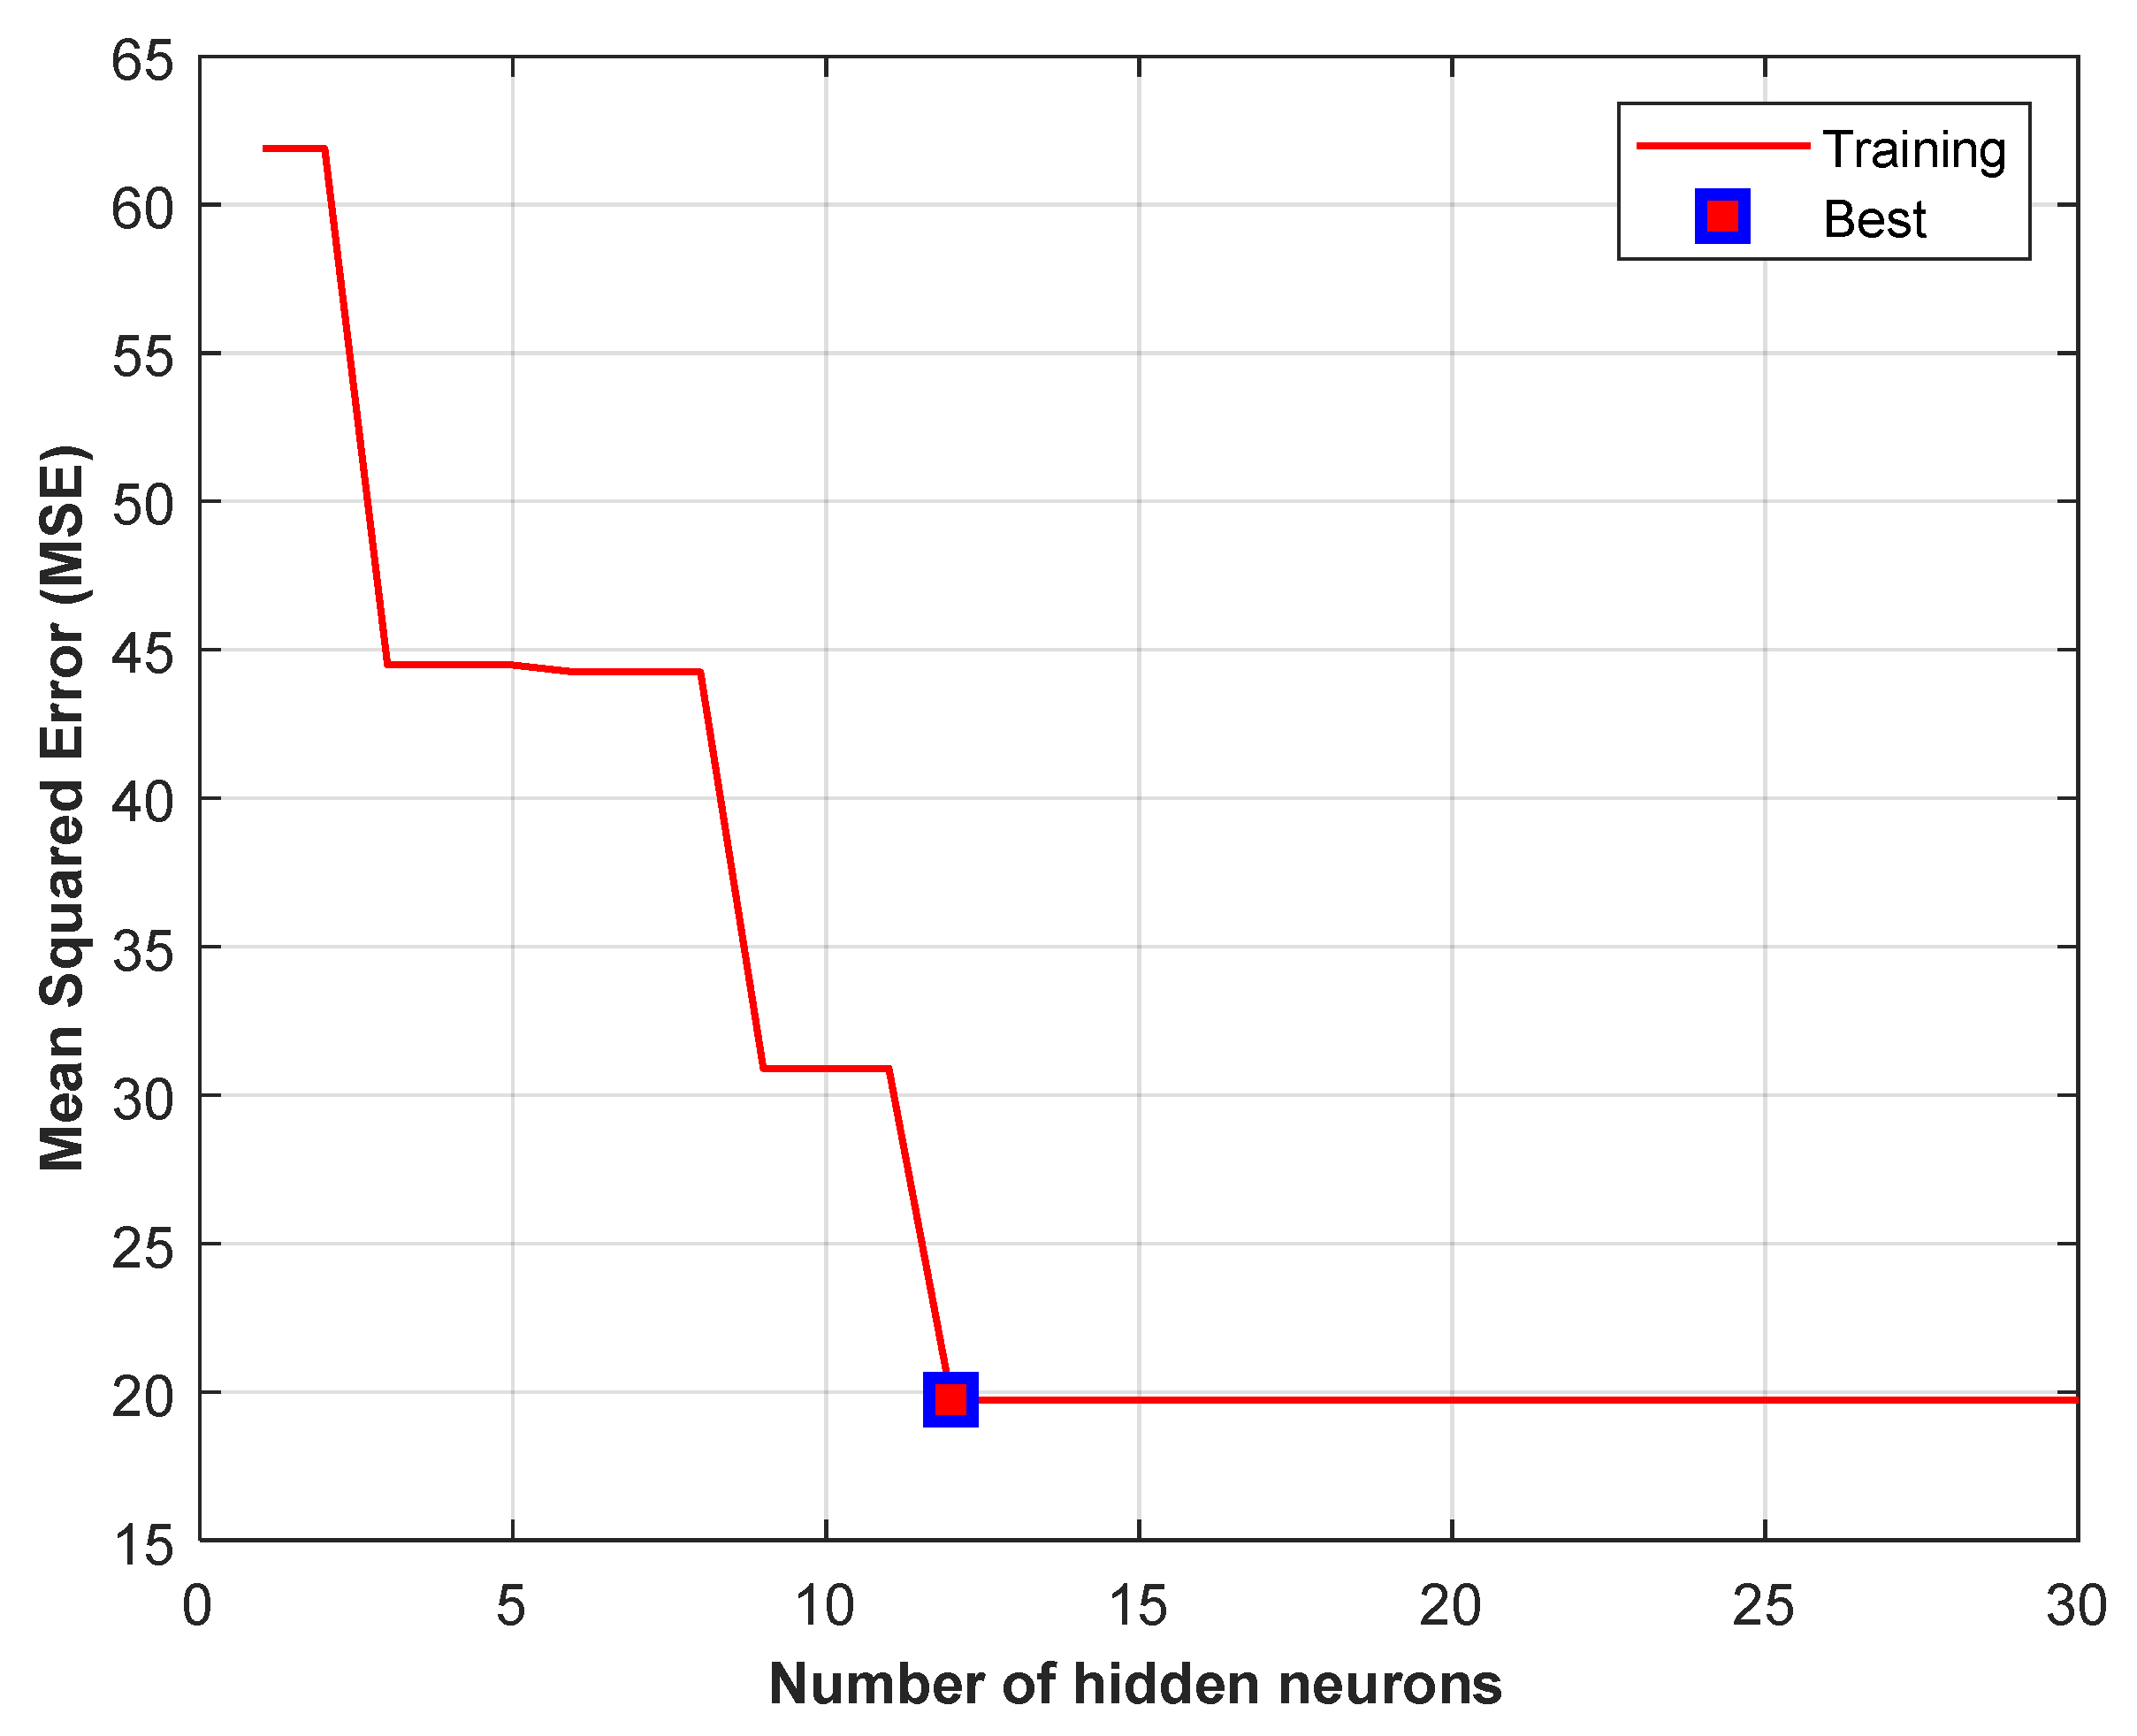
Figure 5.
Model results for Scenario I.
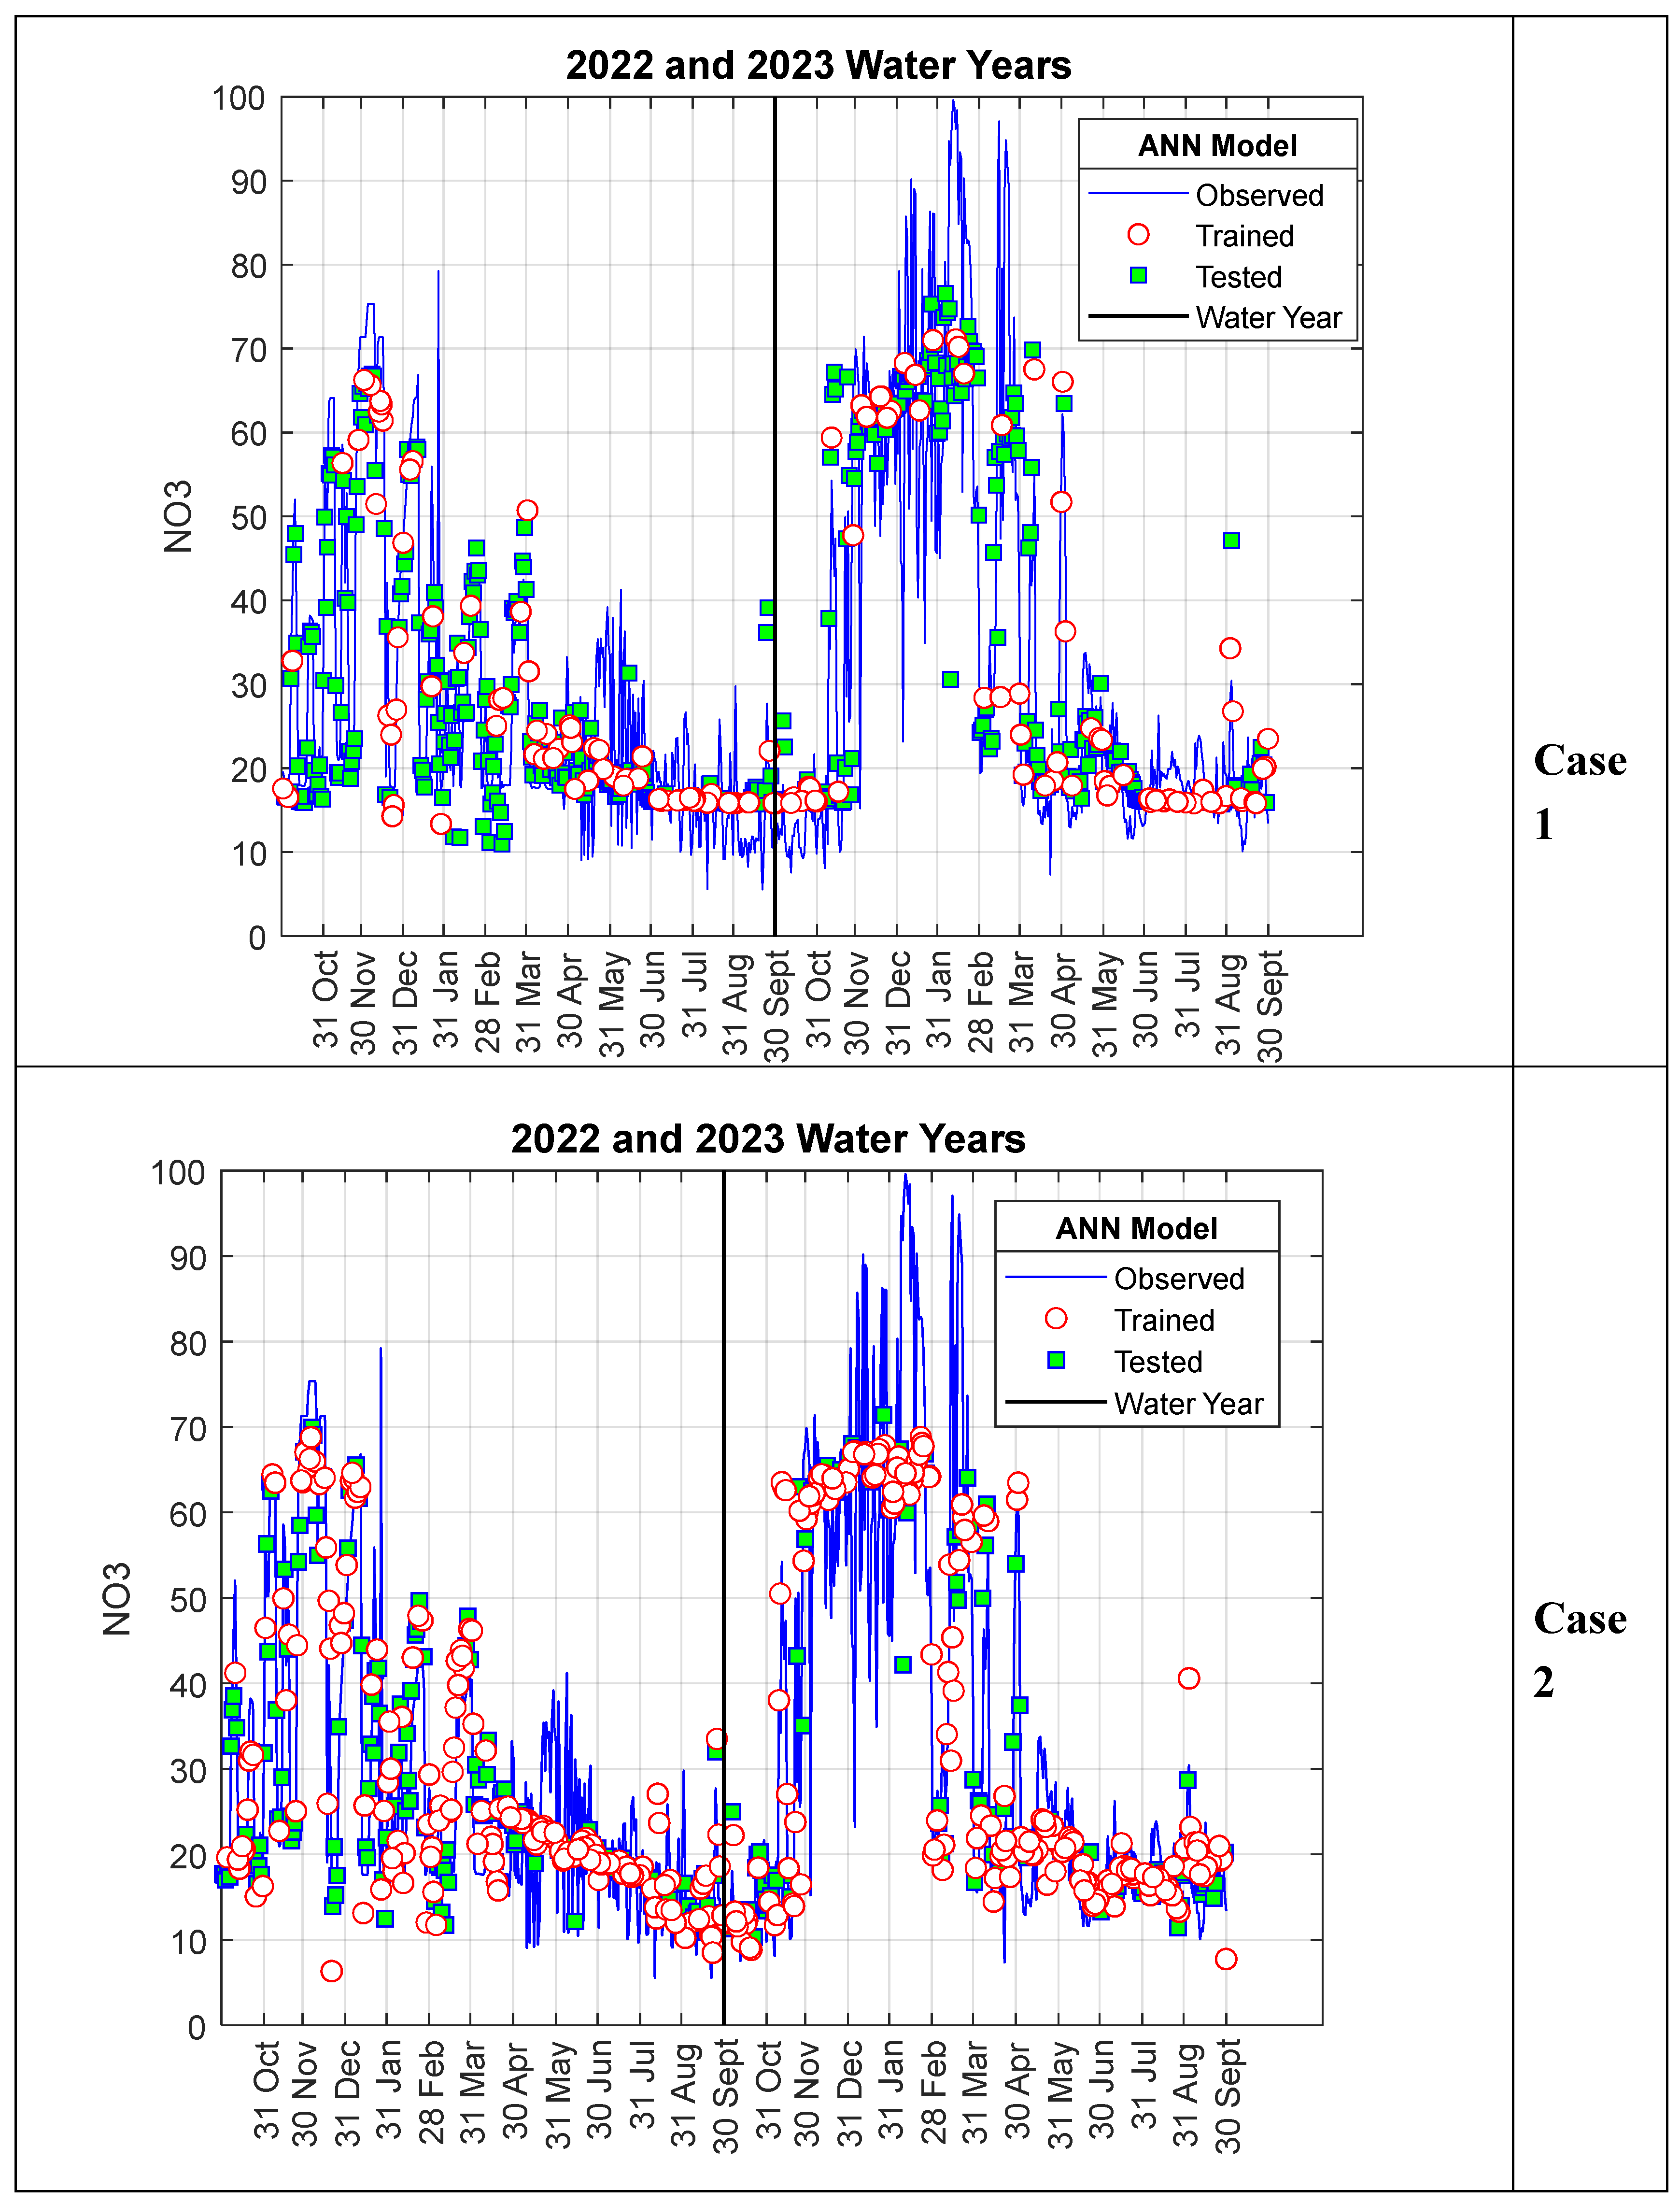
Figure 6.
Model results for Scenario II.
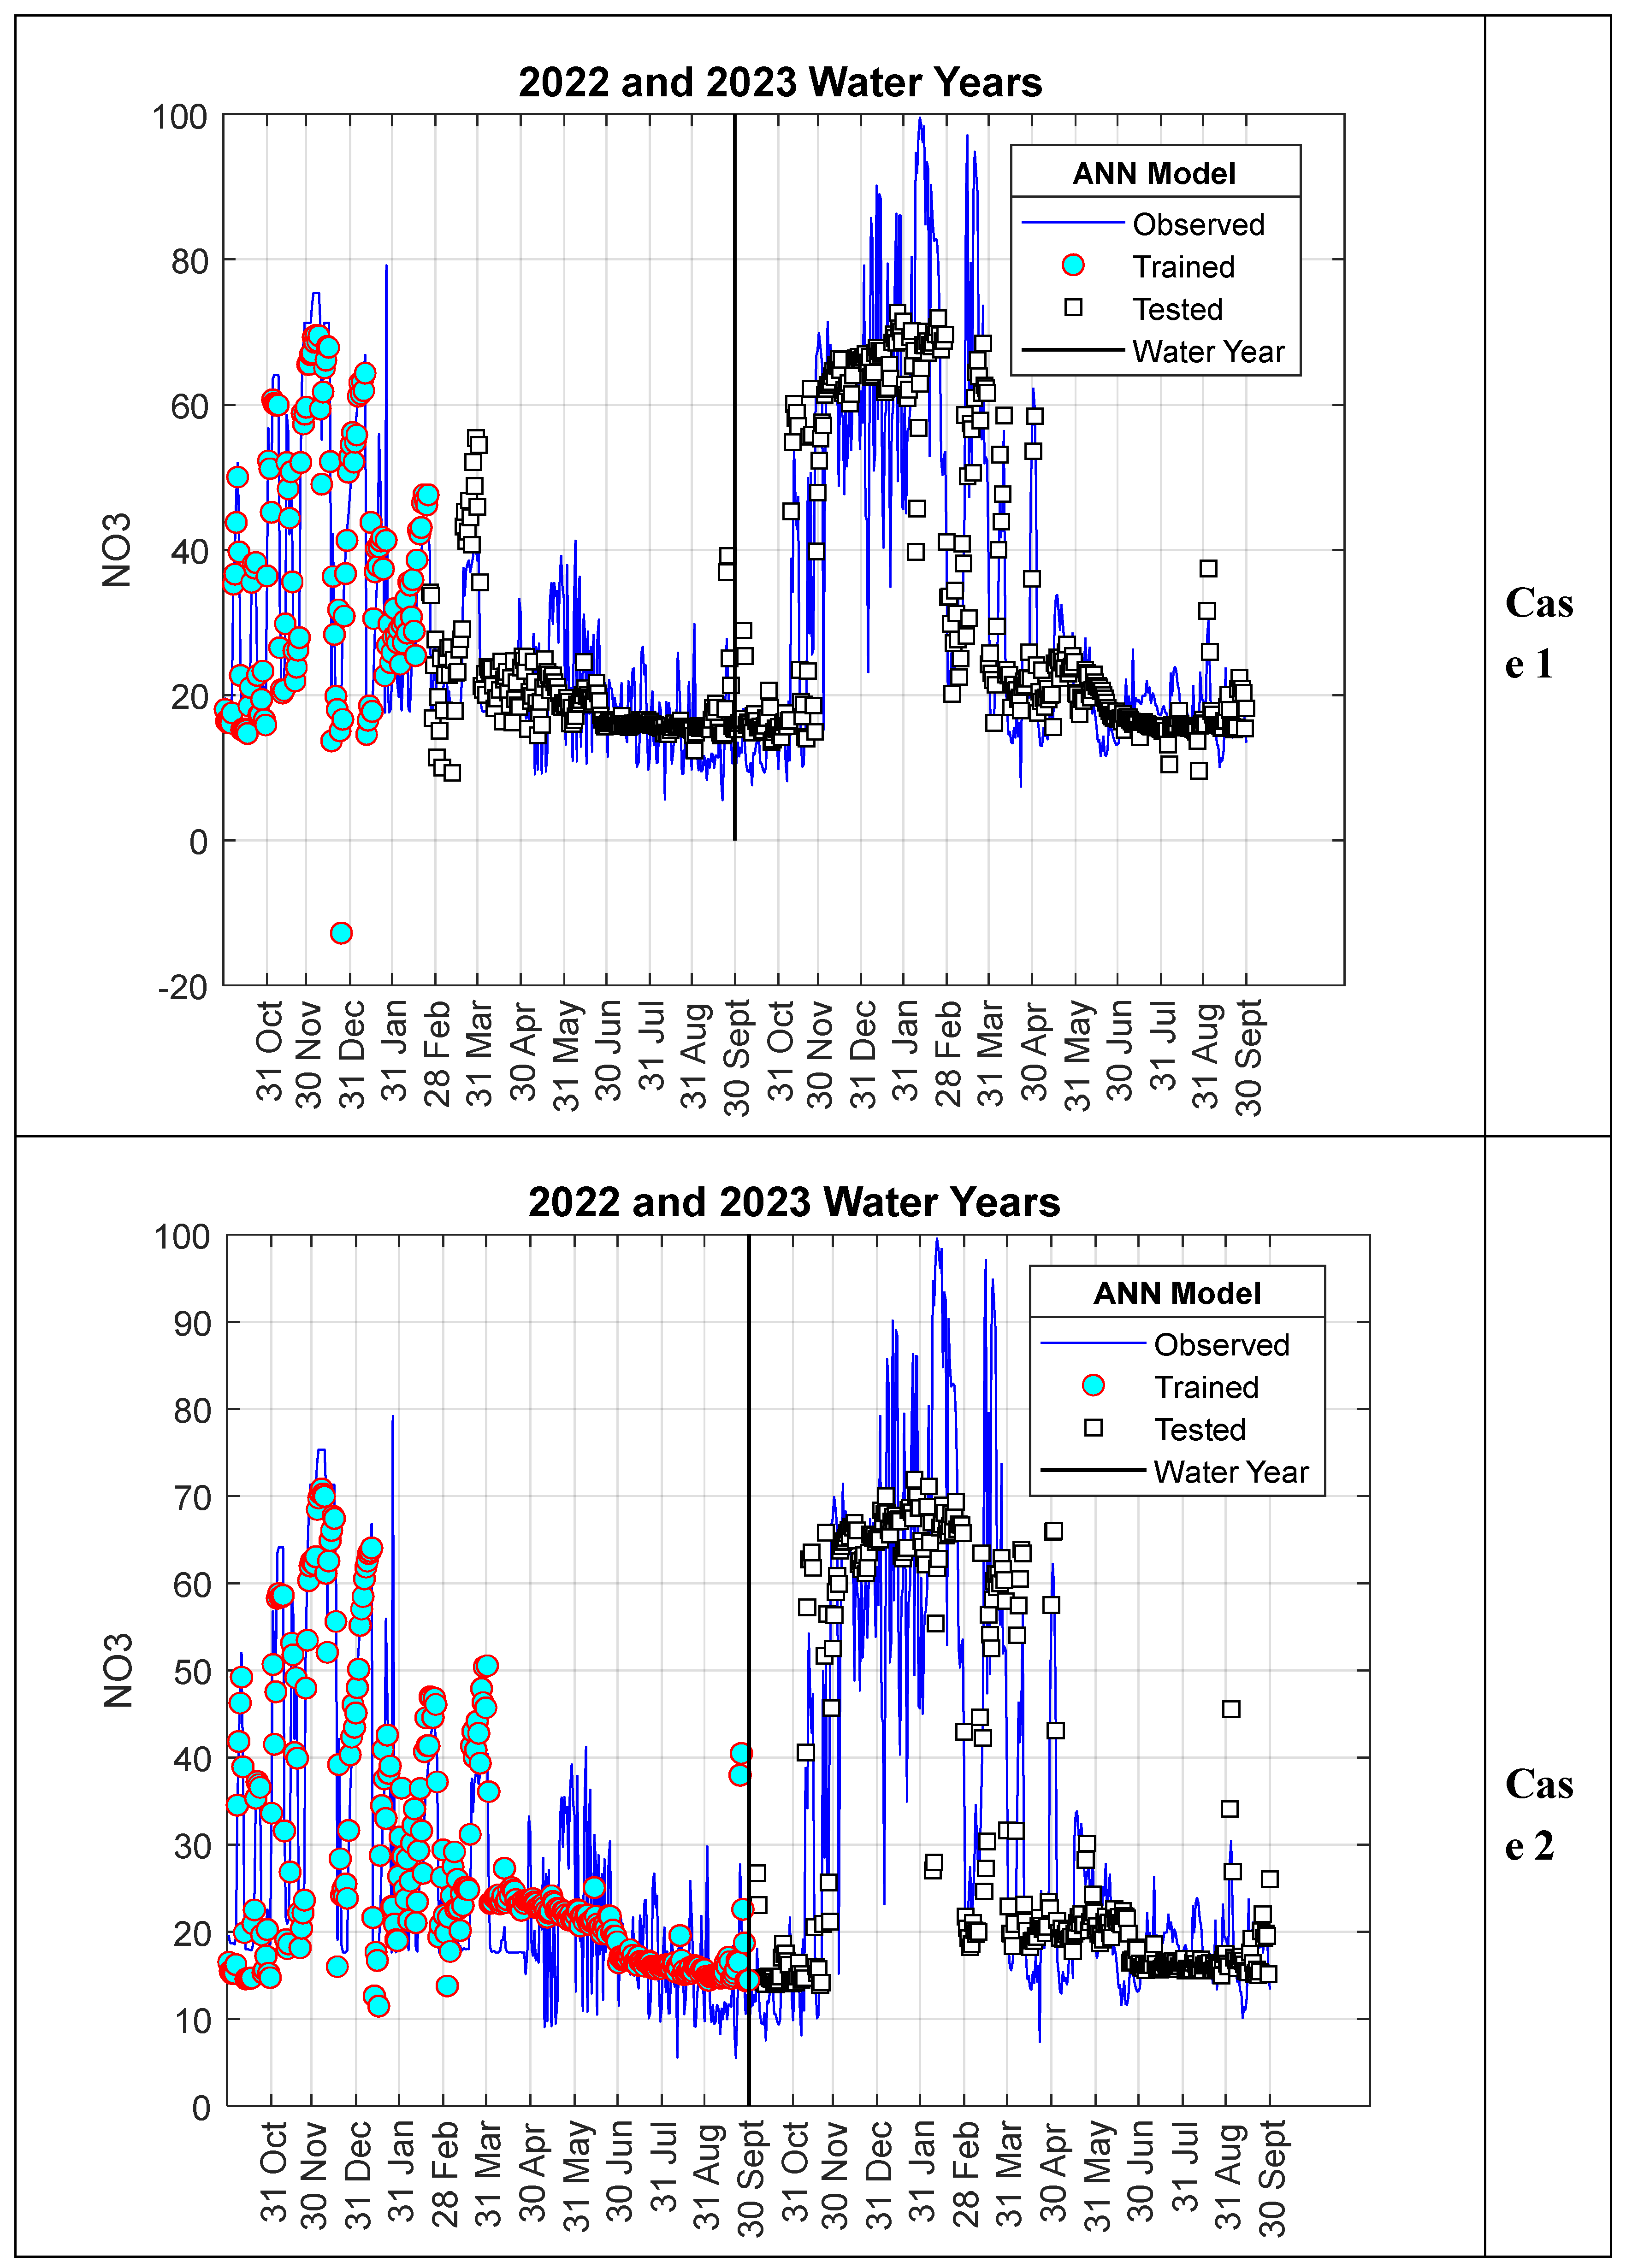
Figure 7.
Model performance for Scenario II.
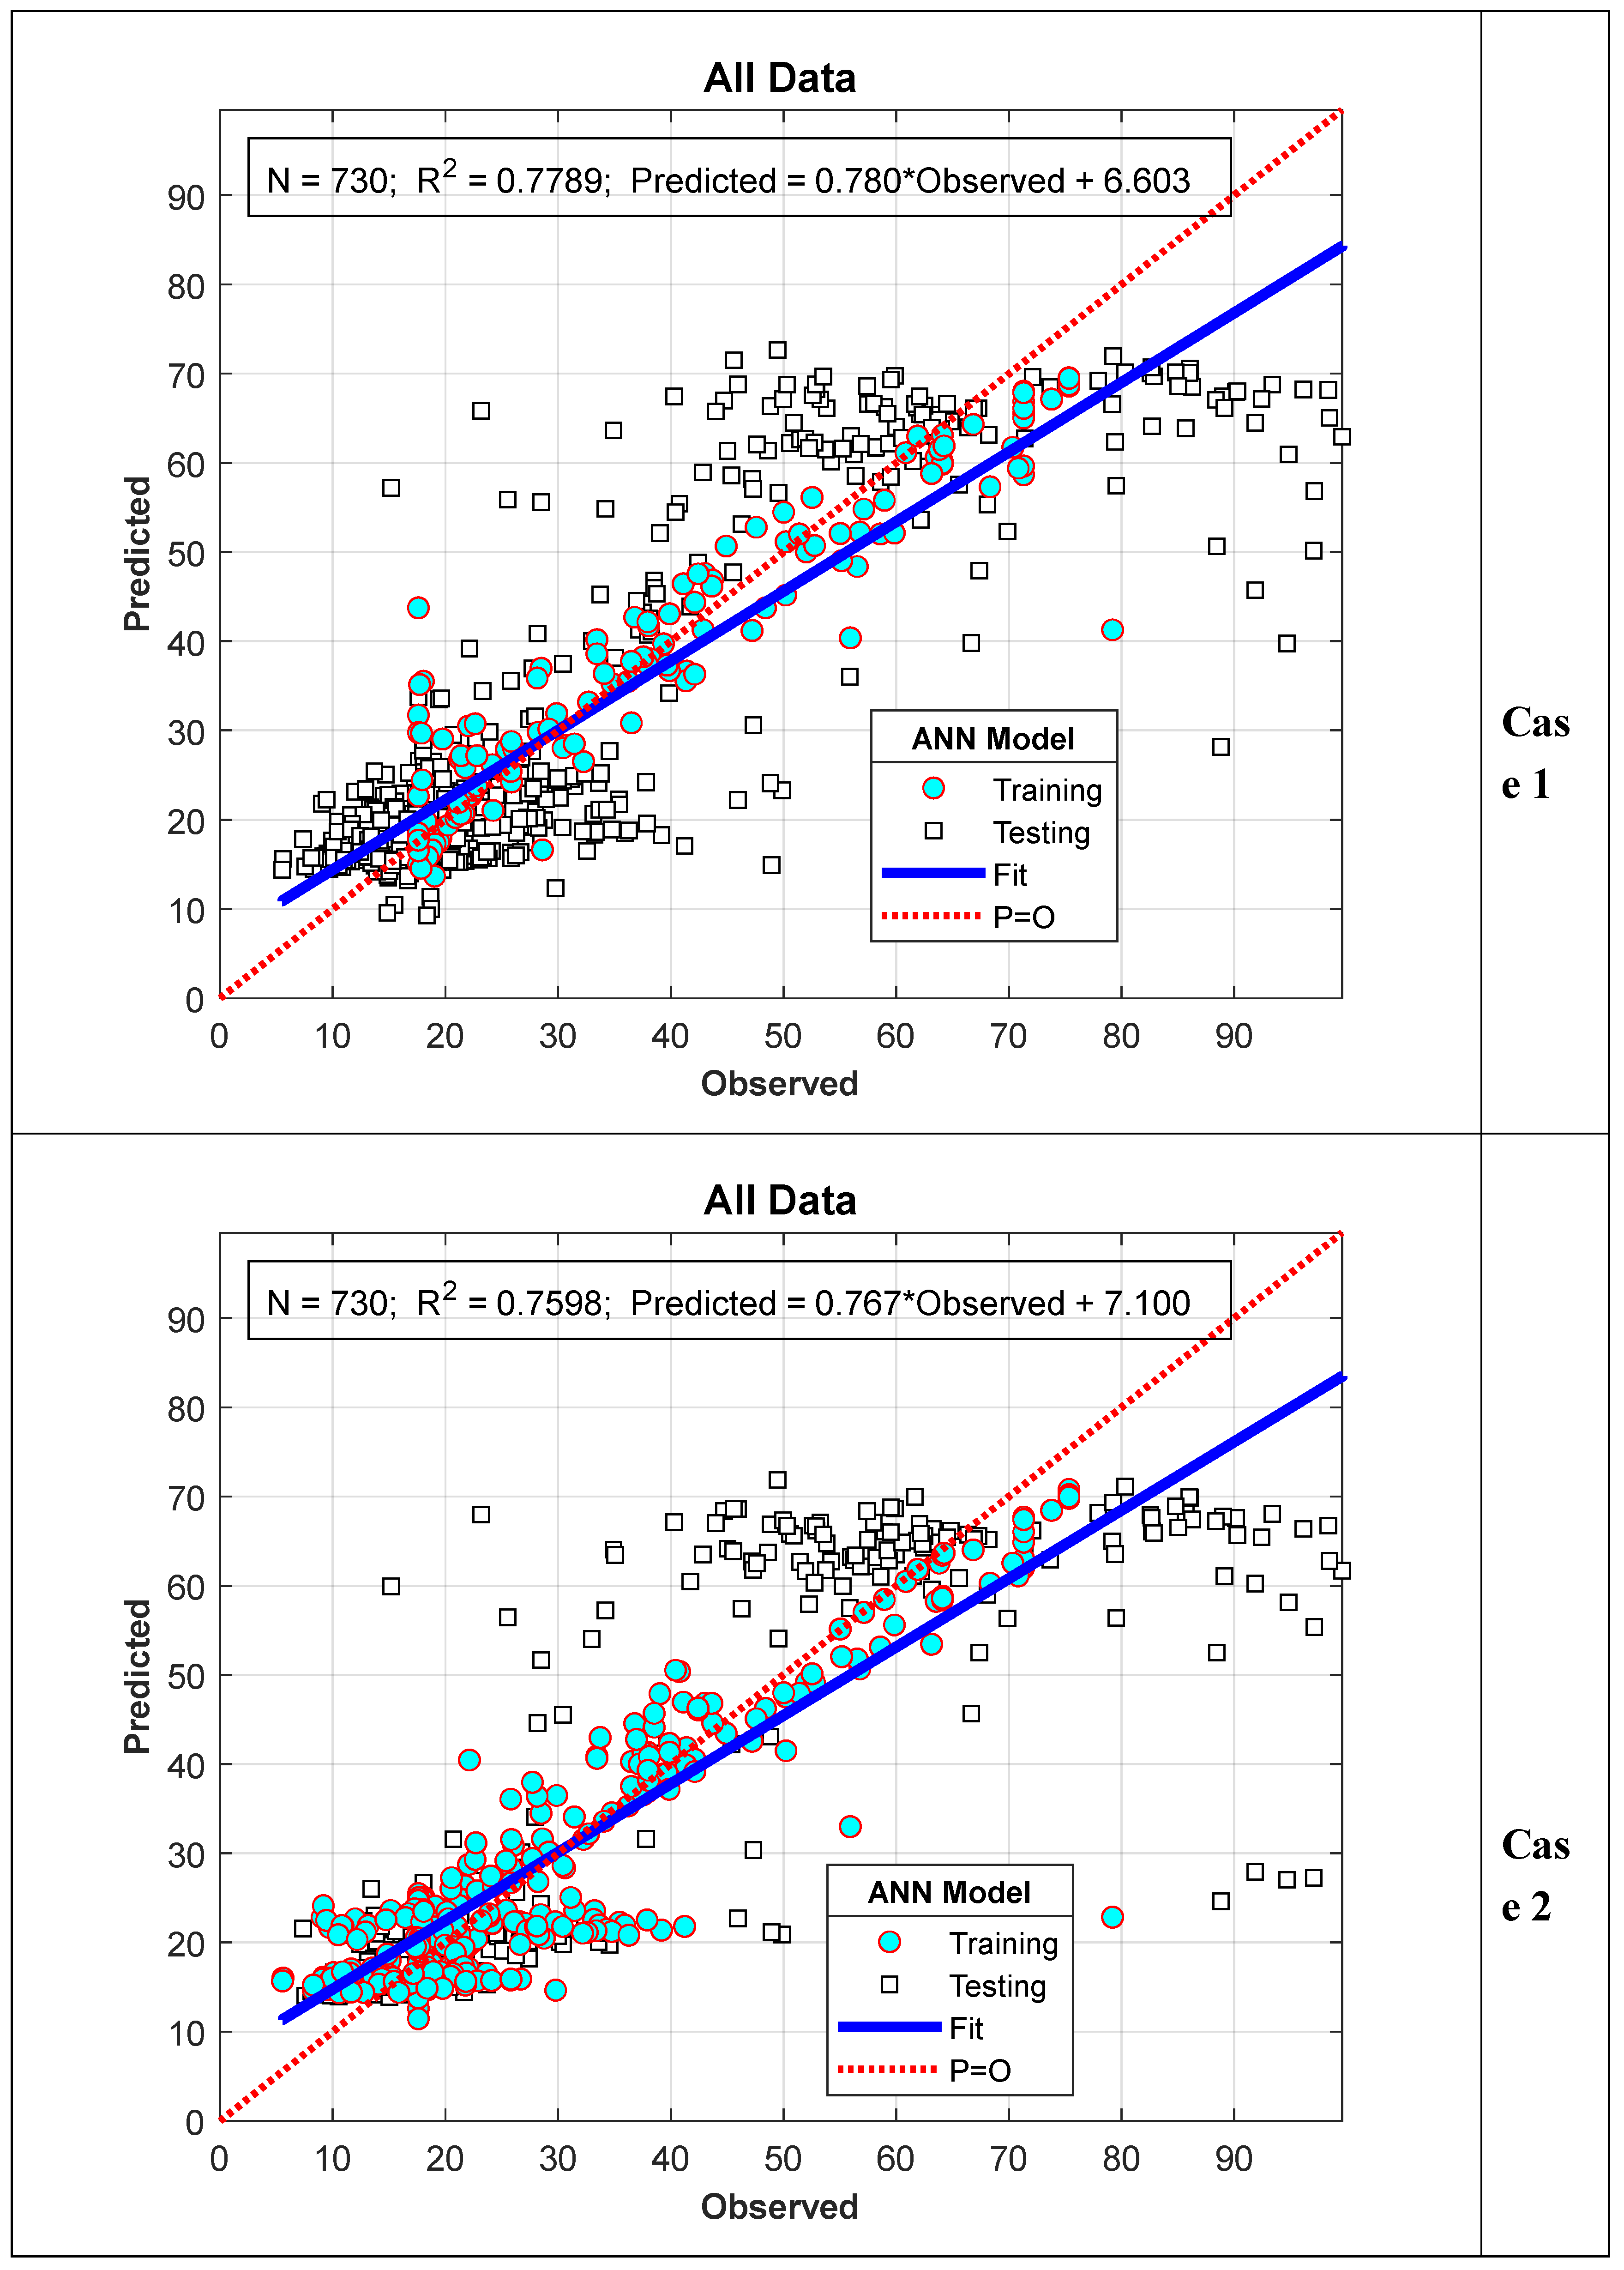
Figure 8.
Model results for Scenario II.
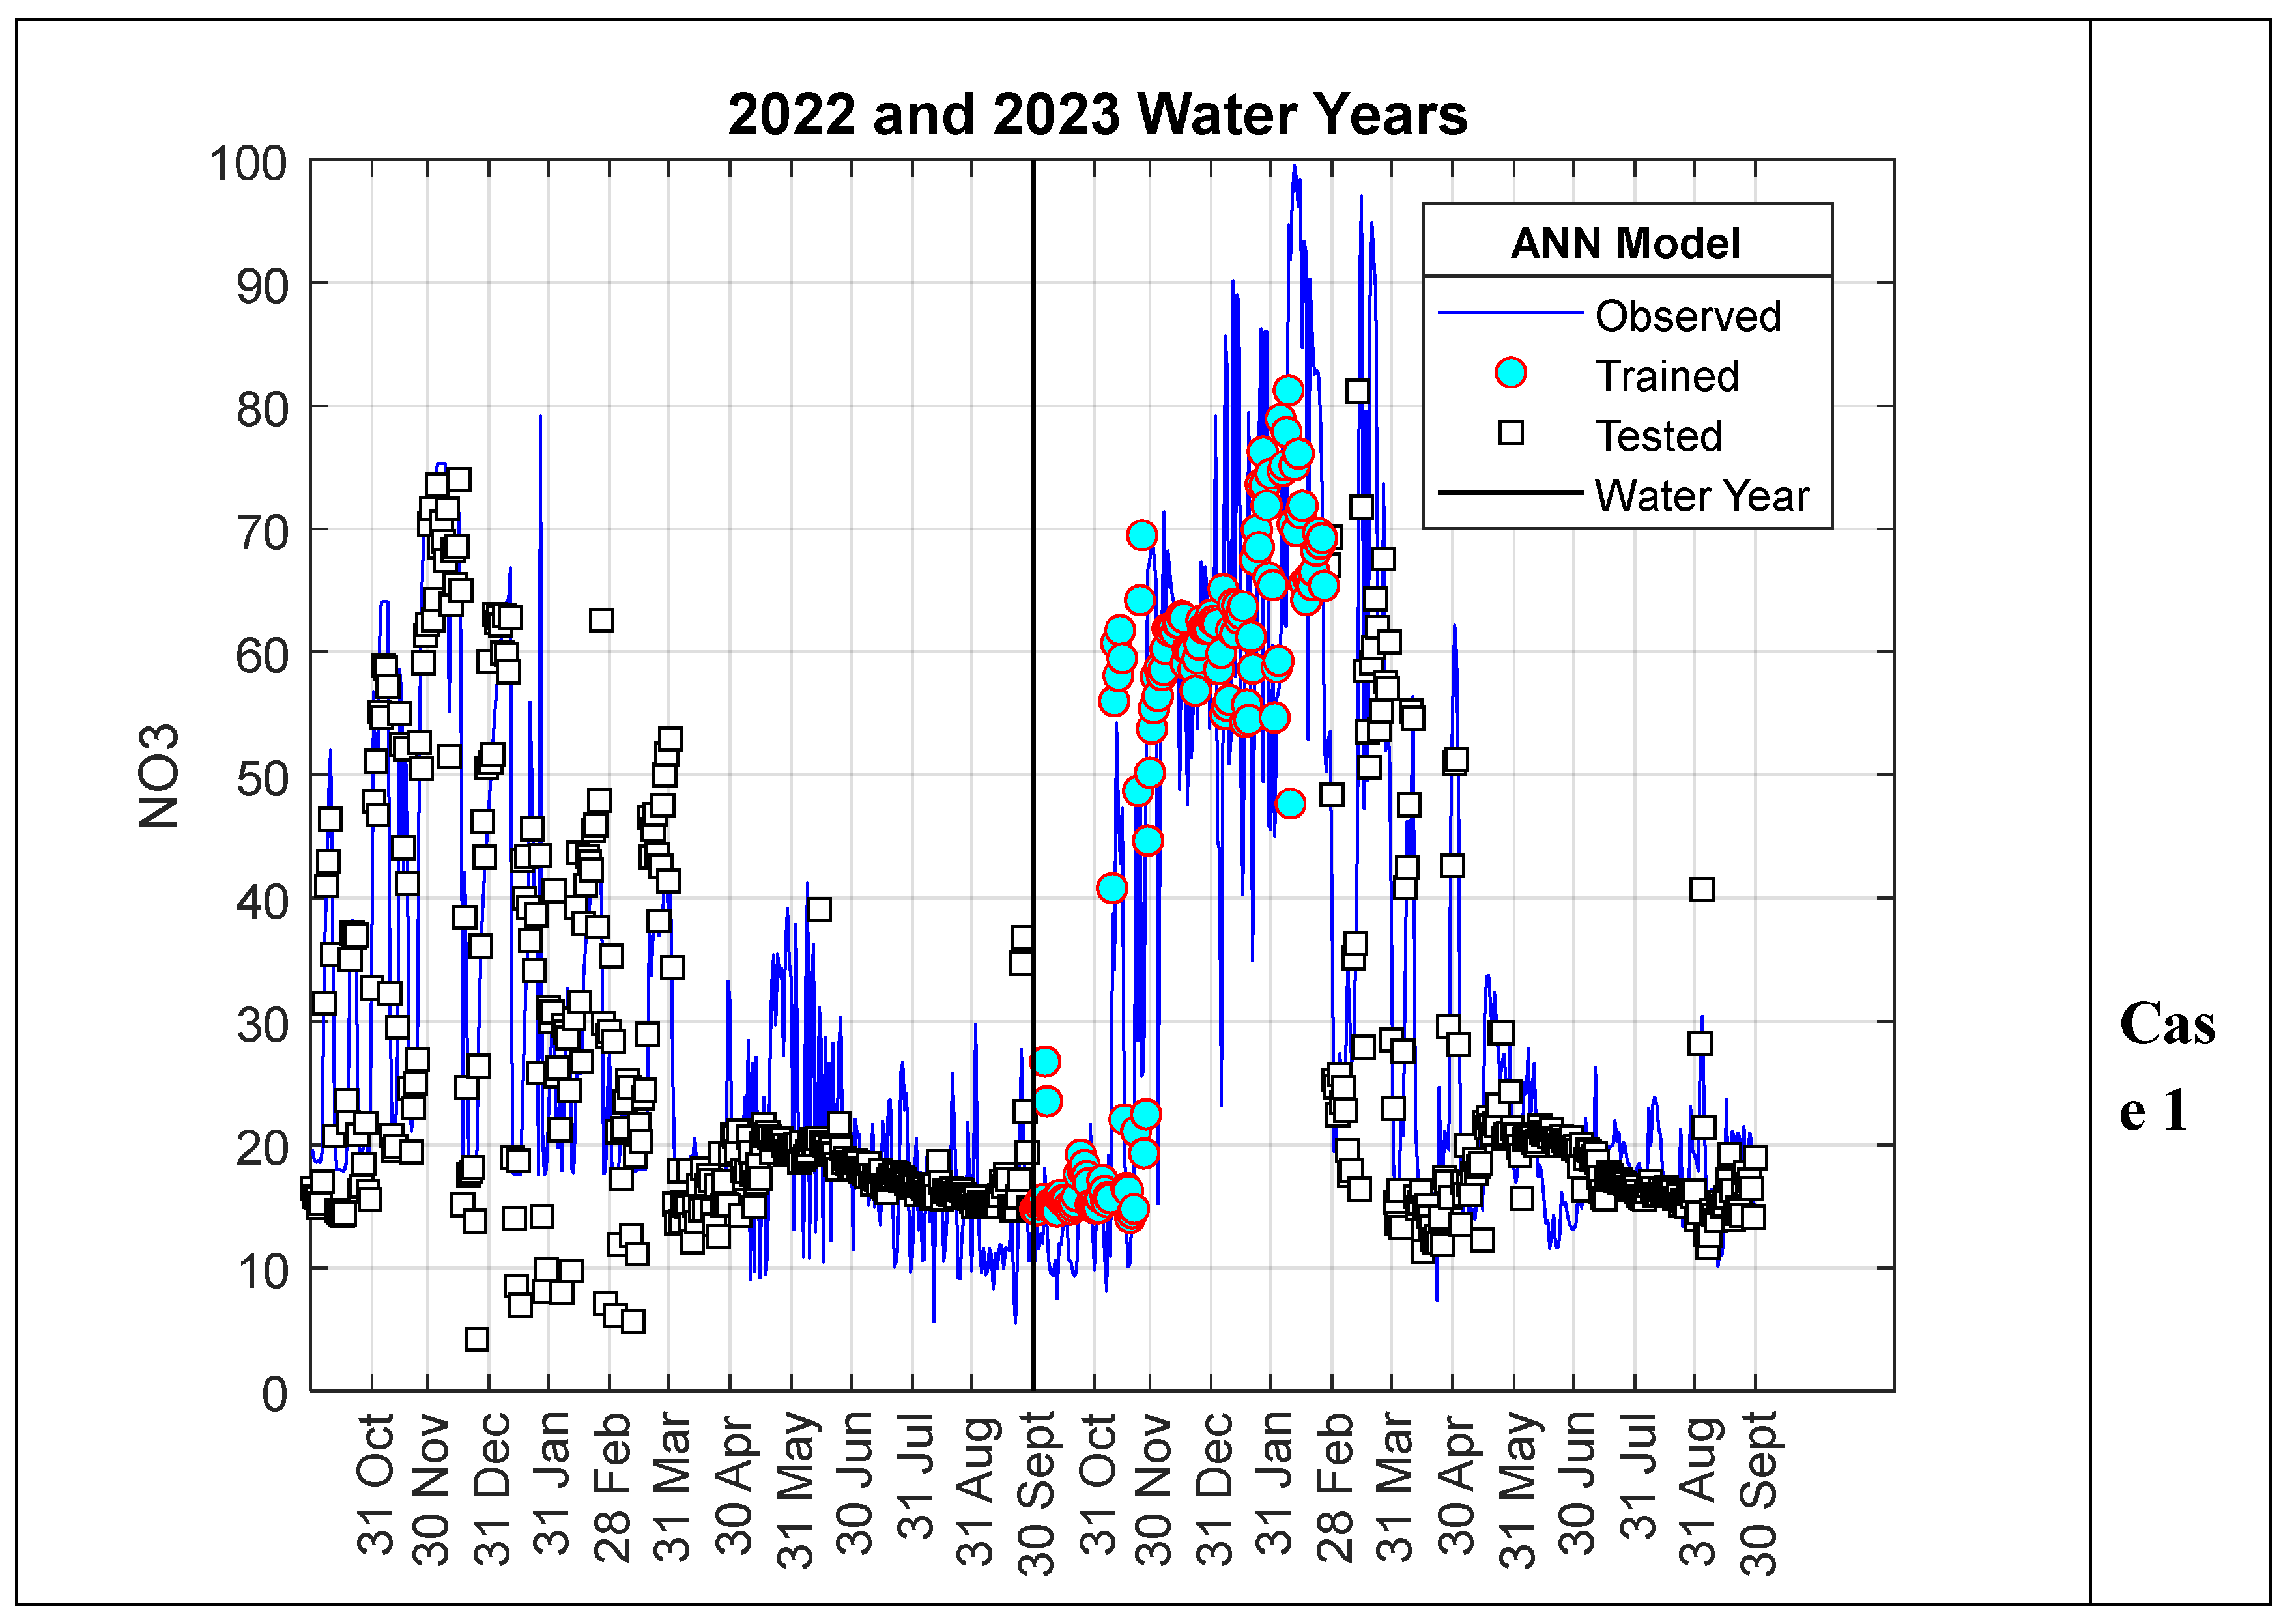
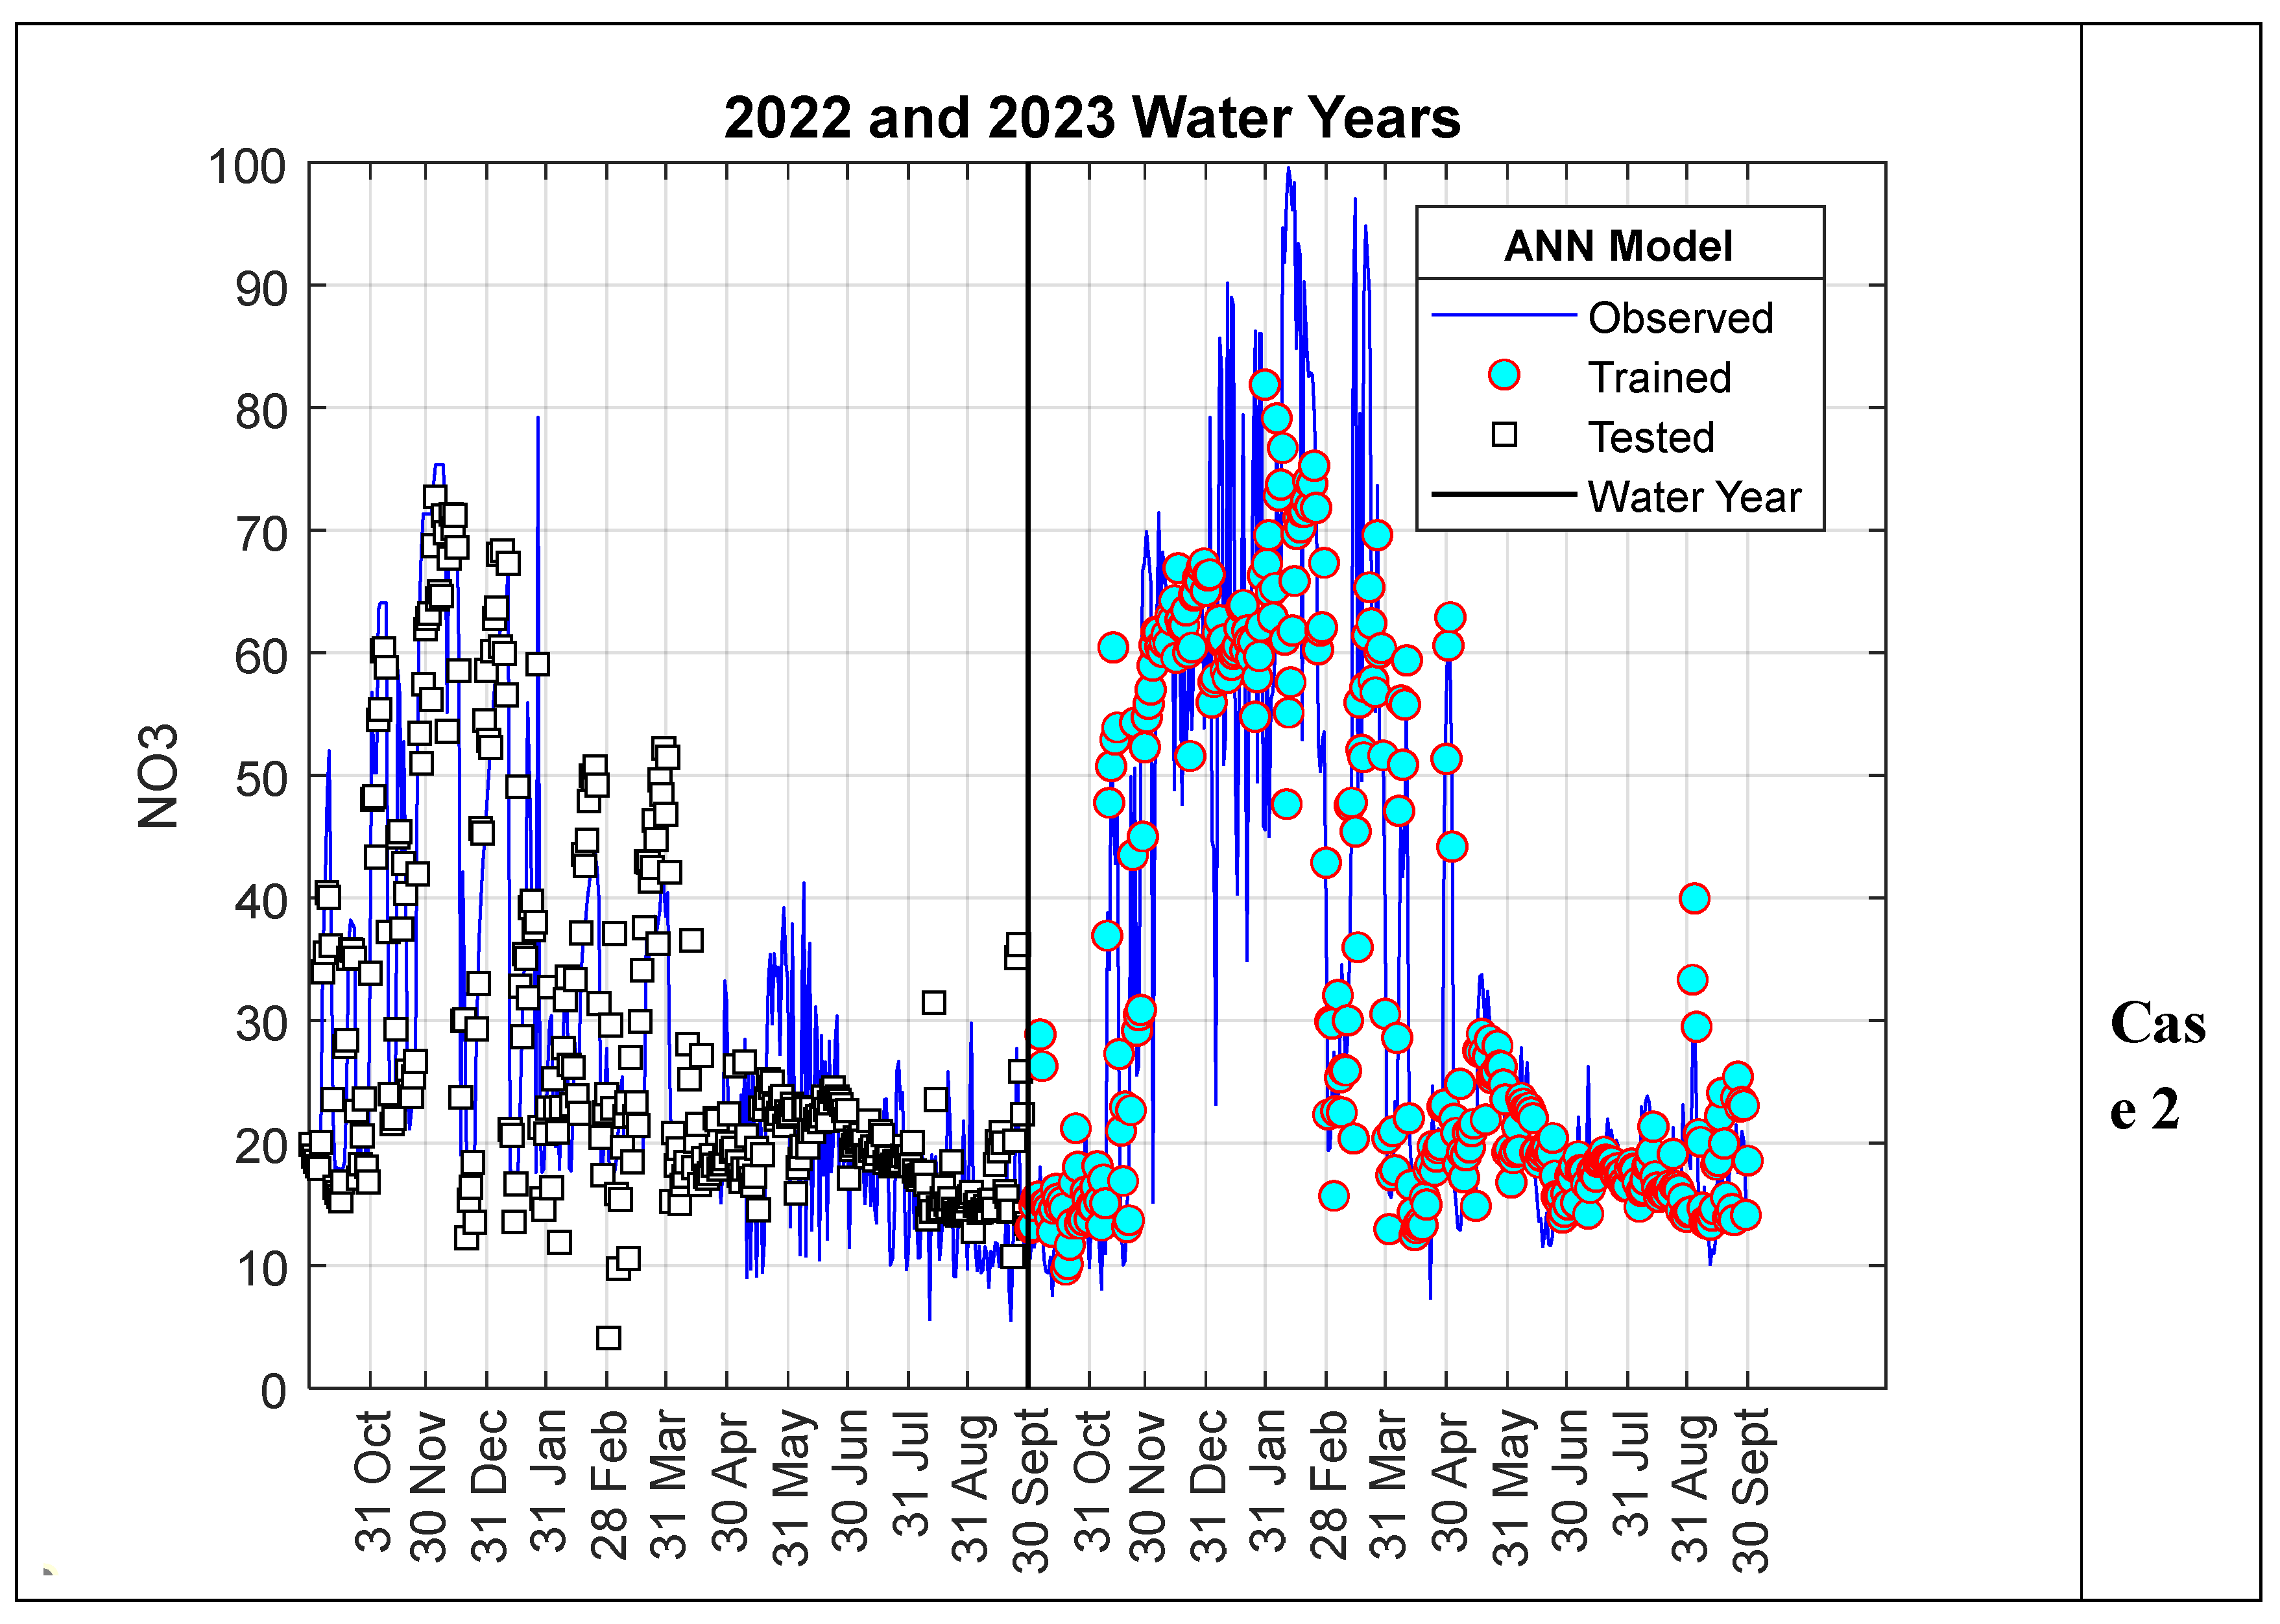
Figure 9.
Model performance for Scenario II.
Disclaimer/Publisher’s Note: The statements, opinions and data contained in all publications are solely those of the individual author(s) and contributor(s) and not of MDPI and/or the editor(s). MDPI and/or the editor(s) disclaim responsibility for any injury to people or property resulting from any ideas, methods, instructions or products referred to in the content. |
© 2024 by the authors. Licensee MDPI, Basel, Switzerland. This article is an open access article distributed under the terms and conditions of the Creative Commons Attribution (CC BY) license (https://creativecommons.org/licenses/by/4.0/).
Copyright: This open access article is published under a Creative Commons CC BY 4.0 license, which permit the free download, distribution, and reuse, provided that the author and preprint are cited in any reuse.


