Submitted:
02 December 2024
Posted:
04 December 2024
You are already at the latest version
Abstract
Review of natural materials that that exhibit negative permittivity or permeability is presented including gaseous plasma, metals, superconductors and ferromagnetic materials. It is shown that samples made of such materials can store large amount of the electric (magnetic) energies and for some values of permittivity, permeability and dimensions they create plasmonic resonators. The electric and the magnetic plasmon resonances in spherical samples made of such materials are analyzed employing rigorous electrodynamic methods and results of analysis are compared to experiments and to results obtained with other methods. Results of free oscillation and Mie scattering theories are compared. Similarities and differences between permittivity and permeability tensors for magnetized plasma and magnetized ferromagnetic material are underlined. Several physical phenomena are explained on the ground of rigorous electrodynamic analysis and experiments. These phenomena include not equal electric and magnetic energies stored in plasmonic resonators, small influence of dielectric losses on the Q-factors of magnetic plasmon resonances, role of radiation and dissipation losses on properties of plasmonic resonators and theoretical possibility of lightning plasma balls existence.
Keywords:
negative permittivity
; negative permeability
; magnetic plasmon
; electric plasmon
; lightning plasma ball
1. Introduction
There are several natural materials that exhibit negative permittivity or negative permeability at some frequency ranges. Among them are gaseous plasma in broad frequency range, metals and semiconductors at optical and infrared frequencies, superconductors and ferromagnetic materials at microwave frequencies. The most extensive research on materials that exhibit negative permittivity, has been undertaken for plasma. Fundamentals of plasma physics can be found e.g. in [1,2,3]. Many metals e.g. gold, silver and aluminum exhibit negative permittivity values at optical frequencies and nanoparticles that are made of them behave as electric plasmon resonators [4,5,6,7,8,9,10,11,12,13,14,15,16,17,18,19,20]. They have been already employed in selective optical induced heating, enhancement of non-linear optical excitation in nanomaterials or sensing of biological and chemical substances [8,9]. The main difference between ordinary resonators and plasmonic resonators is their size, which for plasmonic resonators is much smaller than the wavelength. The electric plasmon resonators have been observed in antient times and have been theoretically and experimentally studied for more than 100 years, but so far, only few papers have been published on the electrodynamic analysis of magnetic plasmon resonators [21,22,23,24]. Spherical yttrium iron garnet (YIG) resonators have been used at microwave and frequencies for a long time, but they have been considered as operating at the ferromagnetic but not at the plasmonic resonance. There are two analytic approaches to the electrodynamic analysis of plasmonic resonators. In the first one the sample (resonator) is considered as an electromagnetic scatterer. For samples having sizes than are smaller but comparable to the wavelength Mie [4] scattering theory is applicable. These days Mie theory is well advanced [25] and publicly available computer programs allow computations of extinction coefficients of spherical particles having arbitrary values of permittivity and permeability [26,27,28]. Mie extinction coefficients maxima correspond to the electromagnetic resonances excited in the sample by an incident plane wave. Mie scattering analysis is equivalent to analysis of forced oscillations of an electromagnetic resonator. In the second approach free oscillations of a resonance object are considered. Formally free oscillations are analyzed as solutions of an a boundary value problem (eigenvalue problem) for source free Maxwell equations. For low loss resonators, resonance frequencies obtained with these two approaches perfectly agree, for both ordinary and plasmonic resonators [24]. Mie scattering theory is commonly used at optical frequencies because it directly corresponds to physical experiments performed at these frequencies with various types of spectrometers and microscopes. At microwave frequencies, sizes of resonators are about four orders of magnitude larger than in optical frequencies which allows for precise machining of their shapes. Also vector network analyzers (VNA) are available which allow accurate measurements of the resonance frequencies, Q-factors and coupling coefficients of resonance structures. For these reasons the relative measurement accuracy of plasmonic resonators parameters at microwave frequencies is higher than at optical frequencies.
The goal of this paper is review of materials that exhibit negative permittivity or permeability and description of electrodynamic properties of the electric or the magnetic plasmon resonators that are made of them. We focus our attention on spherical resonators because analytic solutions of Maxwell equations are available for them and they create benchmarks for intercomparison studies. Although Mie scattering and free oscillation theories are already well established, less attention has been given in literature to analysis of electromagnetic energy storage and dissipation in dispersive media that exhibit negative permittivity or permeability. It has been already shown that for plasmonic resonators the stored magnetic and the stored electric energy per period of oscillations are different, sometimes by orders of magnitude, but this knowledge is still uncommon. Another problems, that will be considered in this paper are differences between permeability (permeability) for free and forced oscillation modelling. Complicated formulae related to electrodynamic analysis are avoided in this paper but references to them are given.
2. Permittivity and Permeability in Dispersive Media
The complex permittivity and the complex permeability are material parameters that describe propagation of monochromatic electromagnetic waves but also the electromagnetic energy storage and dissipation in various media. Generally, permittivity and permeability are tensor quantities. In description of material properties the unit-less relative permittivity and the unitless relative permeability are used, where and are permittivity and permeability of vacuum. If losses are present permittivity (permeability) are complex quantities: , . We choose minus signs for the imaginary parts of permittivity and permeability, which is common at RF and microwave frequencies, but in optics these signs are usually taken as positive. Consequently the complex angular frequency for the free oscillations in our approach is taken as contrary to optics where . Conductivity can be formally included into the imaginary part of permittivity , where denotes the relative complex permittivity of medium excluding conductivity term. The real parts of permittivity or/and permeability can be negative at some frequency ranges but the electromagnetic energy stored in the areas of space filled with such media should be positive. General expressions for the electric and the magnetic energy densities in scalar dispersive media are as follows [29,30,31,32].
For nondispersive media expressions (1) and (2) reduce to and . Dispersion relations for the existing in nature passive media with negative permittivity (permeability) are such that expressions (1) and (2) are positive. Derivatives in expressions (1) and (2) can be considered as the “effective” permittivity (permeability) values of dispersive medium in the electromagnetic energy calculations.
2.1. Models of Permittivity and Permeability
Let us consider permittivity and permeability models for few natural media that exhibit negative permittivity or permeability at some frequency ranges. The most frequently used simple model of the complex permittivity is known as the Lorentz oscillator model which is derived as a driven damped harmonic oscillator. According to this model the complex permittivity can be written as:
– radian plasma frequency (rad/s), , – free electron density, – charge of the electron, – the effective mass of the electron, - damping factor (rad/s), – radian resonance frequency of bounded charges, in solids involving the nucleus and the electron cloud.
Lorentz model is usually used to describe permittivity of dielectrics at optical frequencies and above. For gaseous plasma and conductors, where electrons are unbounded, Drude [33,34] model of permittivity is used which can be considered as simplification of Lorentz model by assuming = 0. For metals it is additionally assumed that permittivity at infinite frequency is not equal to unity but to . Thus the relative permittivity of metals according to Drude model is expressed as follows.
Electric plasma is a common state of matter at the Universe. Free electron density in different plasmas that appear at the Universe vary in the range of 20 decades or more from for interstellar and galactic plasmas to at the center of stars such as Sun. For ionosphere of the Earth so . Ionosphere reflects electromagnetic waves when permittivity becomes negative. For noble metals so .
The “effective” permittivity’s for Lorentz and for Drude models are positive in the whole frequency spectrum.
When an ideal plasma is situated in an uniform external static magnetic field oriented along z-axis of Cartesian or cylindrical coordinate system then its permittivity becomes tensor quantity (5). In expressions for tensor components we used notation adapted from [35].
Permittivity’s of plasma in a static magnetic field for circular polarization of the electric field in the plane orthogonal to the static magnetic field is given by the following expressions.
corresponds to the left-handed circular polarization, while to the right-handed circular polarization The “effective” permittivity values for the circular polarization in the direction perpendicular to the static magnetic field are positive for arbitrary frequency values.
Magnetic properties of ferromagnetic materials in the presence of an internal static magnetic field are described by permeability tensor (Polder tensor), given by expression (9) [36]. Similarly as for plasma it is assumed that oriented along z-axis of Cartesian or cylindrical coordinate system).
where ,
where: , , is frequency, (often named as the natural frequency of ferromagnetic resonance), – the internal static magnetic field in ferromagnetic medium (kA/m), – saturation magnetization in (kA/m), – Gilbert damping factor, γ – gyromagnetic ratio γ ≈ 35.217 MHz/(kA/m). For saturated medium when , = 1.
For circularly polarized electromagnetic field (in the plane which is orthogonal to the static magnetic field) permeability of ferromagnetic material can be represented by two scalar quantities corresponding to the left-handed circular polarization (sign “-“), and the to the right-handed circular polarization (sign“+”).
Permeability exhibits resonance character and for some static biasing field is negative, while permeability is non-resonance and positive. For magnetically lossless medium
Denote , (in vacuum but for ferromagnetic materials these values are slightly different because is slightly different than ). Then the expression for can be written as.
The “effective” permeability for is as follows.
Similarly as the the “effective” permittivity for in plasma, subjected to the static magnetic field, the “effective” permeability for is positive. Further similarities between expressions for and should be noted. in (6) corresponds to in (12). For known ferromagnetic materials lays in microwave frequency range while for metals belongs to optical frequency range. The influence of the static magnetic field on in metals at optical frequencies is negligibly small, for the fields available in laboratories, because . However, the static magnetic field is commonly used for frequency tuning of magnetic plasmon resonators.
Conductivity of a superconductor, at temperatures , can be described by the two fluid conductivity model [37]. For an isotropic superconductor its conductivity is given as where and are conductivities related to normal and superconducting charge carriers respectively. σ1 is responsible for the normal conduction, and σ2 is responsible for the kinetic inductance. Substituting the complex conductivity into the expression for the complex permittivity one obtains: . Electromagnetic fields in superconductors in both the superconducting and the normal state decay exponentially in the direction of propagation. For a lossless superconductor (when ) the electromagnetic energy is stored without dissipation in the superconducting medium. The distance when evanescent electromagnetic fields decays to 1/e is called the penetration depth (. If then can be written as . Then the resulting “effective” permittivity responsible for the electric energy storage in superconductor is . For high temperature superconductor such as YBCO penetration depth is the order of 250 nm so at frequency of 10 GHz the “effective” permittivity is the order of which means very large electric energy density stored in superconductor, even at microwave frequencies, although the energy is stored in a small volume, restricted by the penetration depth. At lower frequencies the electric energy density would become even larger because it is proportional to . Transition from the superconducting state to the normal state, due to the change of temperature, results in very rapid electromagnetic energy release, called quench, which is occasionally observed in superconducting magnets and in particle accelerators.
2.2. Experimental Data for Some Materials with Negative Permittivity or Permeability
The largest amount of experiments on materials that exhibit negative permittivity values have been performed for noble metals at optical frequencies [11,12,13,14,15] and they will not be reproduced here. Good fit to the experimental data [15] for gold in visible and near infrared frequencies has been obtained employing modified Drude model [18] with parameters Hz, Hz.
In Figure 1 experimental data are presented for permeability of YIG [40] and permittivity of YBCO which become negative at microwave frequencies. As it is seen In Figure 1a, both the diagonal component of permeability tensor and permittivity corresponding to the right-handed circular polarization become negative when the static magnetic field is sufficiently large, but still smaller than the field corresponding to the ferromagnetic resonance when . By definition, in the lossless case, permittivity components and become singular at the ferromagnetic resonance. It should be noted that measured permeability values perfectly agree with the Polder tensor model for saturated material.
In Figure 1b permittivity components of thin YBCO films versus temperature are presented, scaled to 13.3 GHz. The data shown in this figure are based on measurements of the complex conductivity components [41] and formulae . The real part of permittivity of YBCO is negative at cryogenic temperatures, up to its critical temperature (about 86 K) where superconductivity disappears. It should be noted that the real part of permittivity is negative (). Its modulus is extremely large and about two orders of magnitude larger than the imaginary part of permittivity.
3. Free and Driven Electromagnetic Oscillations in Resonance Structures Containing Dispersive Materials
The electromagnetic response of an isolated plasmonic resonator where a plasmon is excited by monochromatic signal is characterized by the model of a driven damped oscillator. Free oscillations describe harmonic, exponentially decaying electromagnetic fields in a resonance system. In electrodynamic approach free oscillations are formulated as a boundary value problem for Maxwell’s equations. Solutions of the eigenvalue problem lead to determination of electromagnetic field distribution, the resonance frequencies and the Q-factors in the resonance structure. The resonance frequencies are complex and describe the time dependence of the electromagnetic fields for the i-th free evanescent harmonic oscillation. The real part of the complex frequency describes the oscillatory term, while the imaginary part the evanescent term. Analytic solutions of eigenvalue problem related to free oscillations can be obtained for resonance structures that possess certain kind of symmetry with nonuniformity of material properties along only one coordinate of an orthogonal coordinate system e.g. cartesian, cylindrical or spherical. In this paper we focus our attention on the structures shown in Figure 2. Figure 2a,b correspond to the gyromagnetic medium with permeability (10) in the r- plane, while Figure 2c,d to the medium described by permittivity (6) in this plane. Rigorous solutions of Maxwell’s equations for these structures are only available for isotropic media, however these solutions remain valid for some modes in gyromagnetic medium. For the modes in spherical coordinate system (subsequent mode subscripts correspond to coordinates) the magnetic field has two components and and the electric field only one component . If we chose circularly polarized RF magnetic field in the r- plane which is perpendicular to the static magnetic field than the RF field will “see” only permeability’s in this plane. Because the electromagnetic fields of modes do not depend on the coordinate so the electromagnetic field distribution will be the same as for the isotropic case.
Validity of such approach for analysis of spherical modes in spherical gyromagnetic sample has been supported by experiments [21,22], FE numerical simulations [42], and by the magnetostatic model [45]. When the diameter of the sphere converges to zero then the electrodynamic solutions of electrodynamic eigenvalue problem converge to the magnetostatic ones. The same arguments hold for the modes in the structures shown in Figure 2c,d.
Let us focus our attention on the modes in gyromagnetic medium. For the structures shown in Figure 2a,b, the complex resonance frequencies of the modes can be found as the complex roots , of transcendental equations (TDE) which have a general form . By determining one can also uniquely determine . The approximate values of resonance frequencies for infinitesimally small gyromagnetic samples can be found employing magnetostatic model [21].The dominant mode in the magnetostatic approximation (the mode of uniform precession) for spherical sample has only two magnetic field components in the plane which is perpendicular to the static magnetic field. This mode corresponds to the spherical electrodynamic mode (magnetic dipole mode). Such correspondence is also valid for higher order spherical modes (multipole magnetic modes) which have only two magnetic field components in the plane perpendicular to the static magnetic field. However, due to anisotropy of permeability, resonance frequencies of modes with m > 0 are different than those for the modes in the isotropic medium. The resonance frequencies of such modes and also all quasi modes can only be found employing advanced electrodynamic numerical simulations e.g. finite element method.
In formulation of eigenvalue problem for lossy resonance structures the frequency has to be complex. It is should be underlined that the complex frequency has to be also included in definitions of permittivity and permeability. The unloaded Q-factor (Q-factor excluding coupling losses) of i-th oscillations can be determined as . For low loss, non-radiating, resonance structures, often simplified method of Q-factor determination is employed. In the simplified method in the first step of analysis, the system is assumed to be lossless. In such case we have steady state harmonic oscillations and the resonance frequencies are real. As the next step the Q-factors are computed according to formulae (14).
Integration in the numerator of (15) is performed over the whole volume of the resonance structure, including the exterior part of the structure for open resonators (Figure 2a,c).
In Figure 3 the modulus of the real part of permeability , the “effective” permeability and the imaginary parts of permeability’s for the real and the complex are presented. The imaginary part of permeability for the complex frequency (for free damped oscillations) is the order of magnitude smaller than for real frequency (steady state solutions). The real part of permeability is negative and its modulus is up to one order of magnitude smaller than the “effective” permeability. However as it has been shown in [22] Q-factor values computed with the two approaches remain essentially the same. The steady state solution approach (14) allows for the direct determination of the stored electric and magnetic energies per the cycle of oscillations.
4. Computations of Resonance Frequencies and Q-Factors of Spherical Samples Made of Materials with Negative Permittivity or Negative Permeability Values
Complex resonance frequencies of free oscillations for the modes (subsequent subscripts indicate the mode orders along spherical coordinates respectively) in an isotropic sphere having diameter d and permittivity (4) can be found as solutions of appropriate transcendental equation (TDE) involving spherical Bessel functions [18,19,20,21,22,23]. The resonance frequencies of spherical modes in isotropic medium are n-fold degenerated (they do not depend on the azimuthal mode number m). Alternatively the resonance frequencies of the modes can be evaluated from the geometric parameter values () corresponding to maxima ( of extinction coefficient function employing Mie scattering computer programs. In Figure 4a. computed Mie spectrum of extinction coefficient for and is presented where three maxima corresponding to the three modes with n=1, 2 and 3 can be observed. In Figure 4b permittivity’s corresponding to the three plasmon modes versus normalized resonance frequencies (TDE solutions for , ) are presented. Solid green squares denote three normalized frequencies evaluated from Mie spectrum shown in Figure 4a, solid blue circles show normalized frequencies evaluated from Mie spectra obtained for various . The red shift of plasmonic resonances with the increase of diameter of the sphere, observed in experiments with gold particles at optical frequencies [20] corresponds to the decrease of permittivity requested for the appearance of these resonances, with the increasing . In Figure 4c Q-factors due to radiation losses (), for lossless medium (TDE solutions) are presented. Green squares represent values corresponding to . For converging to zero, permittivity values related to the appearance of plasmonic resonances, converge to the electrostatic approximations (Rayleigh scattering) given by the expression: . As expected, from the theory of spherical dipole antenna radiation, Q-factors due to radiation losses decrease with the increase of as (Figure 4c). Low peak values of for and modes in Figure 4a are related to the relatively low values for these modes. It should be noted that for a fixed value, the values increase with the increase of the mode index .
In Figure 5a permittivity’s corresponding to the three plasmon modes (TDE solutions) of gold spheres immersed in water are presented assuming Hz, Hz, . Solid blue circles represent results evaluated from Mie spectra for values obtained from TDE solutions. In Figure 5b) Q-factors of the three plasmonic resonances are presented (TDE solutions). Broken lines represent Q-factors due to radiation losses () computed for . As it is seen, for the mode radiation losses becomes dominant when . Results of computations shown in Figure 5a,b correspond to the experimental data shown in [20]. In Figure 5c results of computations of extinction coefficients maxima ( are presented, for gold and for a hypothetical low loss gaseous plasma ( MHz, , ). Additionally Q-factor values are shown, obtained for the low loss plasma from the TDE solutions. As it is shown in Figure 5c Mie extinction coefficients maxima ( approach the largest values near the points when the absorption and the radiation losses become equal to each other for both low loss plasma and gold. Such behavior is related to the variations of coupling rate between plasmonic resonator and the source of electromagnetic energy (in Mie theory the plane electromagnetic wave). The coupling rate is related to the value. The smaller the value that larger the coupling rate. Critical coupling of resonator enables the efficient transfer of energy from a source of the EM energy to the resonator. Such condition is achieved when the total loss rate of resonator (including radiation and absorption losses) is equal to the coupling rate. At RF and microwave frequencies coupling between a resonator and a waveguide can be achieved by many different manners and accurate adjustment and measurements of coupling coefficients are possible [43].
Gaseous plasma balls are occasionally observed in nature as lightning balls [44]. Assuming parameters of gaseous plasma as in our modelling, and uniform electron density distribution within the ball, we have the largest value of for (Figure 5c). In such case, the resonance frequency of the mode corresponds to Rayleigh scattering, so 5.77 MHz (m). Therefore, the diameter of the ball corresponding to the largest value of is about 18 cm and the electromagnetic energy transfer to the ball at frequency 5.77 MHz is the most efficient. If density of electrons in plasma ball becomes smaller due do recombination of electrons and nuclei of plasma, then will be shifted towards lower frequencies. In such case the resonance frequency of the mode will be smaller as well. Simulataneously the Q-factor due to radiation losses will be much larger because and the electromagnetic losses within the ball will be predominantly caused by the absorption. Review of measurements of the RF spectrum of radiation from lightning [45] has shown that the dominant part of the RF spectrum belongs to low acoustic and sub-acoustic frequencies. The lower frequency, the longer lifetime of oscillations. As an estimate of the lifetime (when the magnitude of the electric field decreases by a factor of e) we can use the expression . Assuming rad/s (acoustic frequency) and one obtains . When the free electron density in plasma becomes smaller, the plasma frequency and the resonance frequency of the mode are shifted to the lower frequencies and the lifetime becomes longer. The question remains open, how the lightning plasma ball has been created at some initial state. Nonetheless, the existence of lightning plasma ball as a plasmonic resonance with relatively long lifetime has been theoretically confirmed.
Figure 6a shows (corresponding to ) versus normalized internal static magnetic field () for few modes in the magnetostatic approximation computed from Fletcher’s TDE [46]. Having known and one can determine from Eq. (11) and for a lossless medium. For the most of these “magnetostatic” modes, the corresponding and exhibit negative values. In Figure 6b graphs of versus are presented for the electrodynamic , and modes computed as solutions of TDE [23] for the structure shown in Figure 2a. Right vertical axis represents corresponding to the values. For infinitesimally small samples electrodynamic solutions converge to the magnetostatic ones, similarly as it takes place for the electric plasmon modes. Corresponding permeability values for infinitesimally small samples are given by the expression . In electrodynamic approach for large samples values corresponding to magnetic plasmonic resonances converge to the minus infinity (ferromagnetic resonance in an infinite medium). The same is true for and values corresponding to electric plasmonic resonances.
Figure 7 shows the ratios of the magnetic to the electric energies stored per period of oscillations versus for the modes in lossless spherical samples having different diameters and , . Variations of for fixed diameter of samples have been achieved by the change of the external static magnetic field in the expression for permeability (12). Computations of energies have been performed by obtaining magnetic and electric field distribution for a lossless sample (solutions of TDE [23]) and using expressions for the energies as in the numerator of (14). The magnetic to the electric energy ratio vary by several orders of magnitude. For converging to zero the ratio is converging to infinity and sample behaves as pure magnetic dipole, as it expected from the magnetostatic model. For very small samples the influence of dielectric losses, including conductor losses become negligibly small. As it has been shown [40], for ferromagnetic metal thin films having thickness of 50 nm and conductivity S/m, such large dielectric losses (conductivity contributes to the imaginary part of permittivity) the change the Q-factor of the plasmonic resonance is only few percent. From the electrodynamic point of view thin ferromagnetic film also creates plasmonic resonator [40].
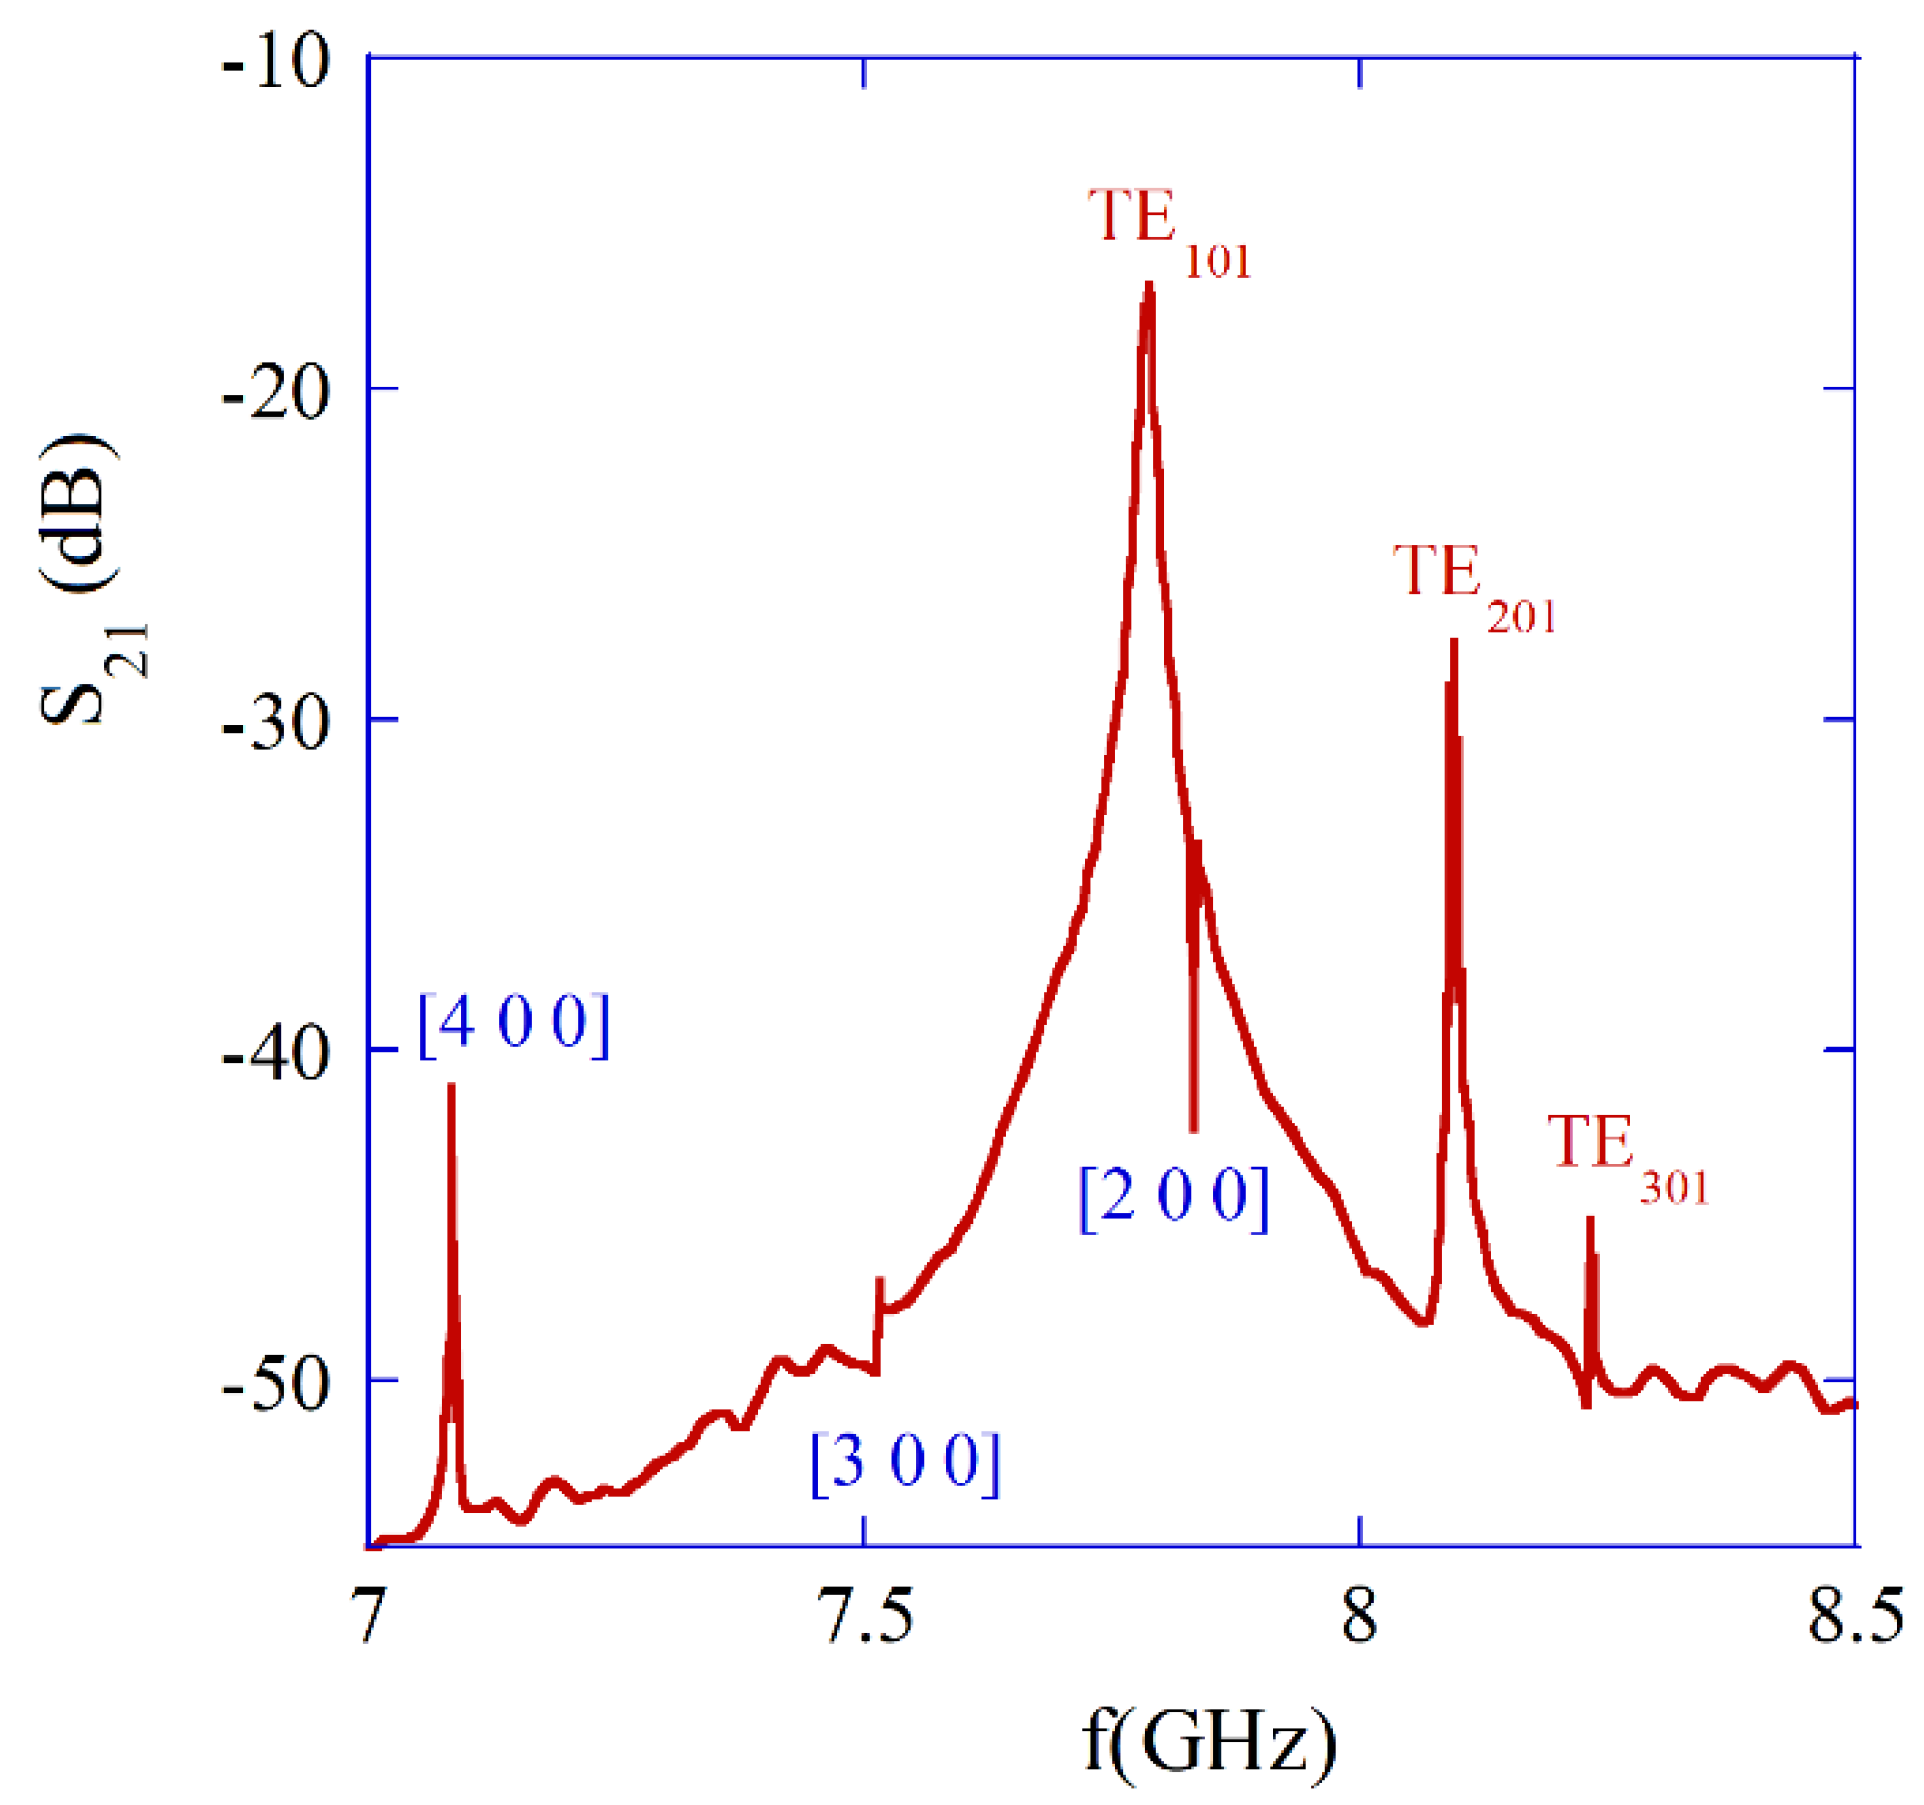
In Figure 8 measurement results are presented, showing few resonance frequencies on the single crystal YIG sample having diameter of 0.5 mm [40]. Three plasmonic , and modes are clearly seen. Measurements have been performed employing VNA. In the frequency range shown in Figure 8, so frequencies obtained with magnetostatic approximation well agree with the electrodynamic ones. Also frequency separations between subsequent modes with n =1, 2 and 3 are similar for both the electrodynamic and the magnetostatic approaches.
The remaining resonances seen in Figure 8, correspond to the magnetostatic modes [4 0 0], [3 0 0] and [2 0 0] respectively (compare Figure 6a). As it has been mentioned, in the electrodynamic approach, for gyromagnetic medium, the modes with m > 0, but also quasi modes are hybrid and advanced numerical methods have to be used for their analysis e.g. finite element [42,43,44,45,46,47]. This is outside the scope of this paper, since these modes are usually undesirable in practice. Magnetic plasmon resonators used in tunable microwave filters have Q-factors the order of 10000 which are predominantly related to the Gilbert damping factor of ferrite material [48].
5. Comments
Materials that exhibit negative permittivity or permeability are encountered in different areas of physics and engineering such as plasmonics, atmospheric physics, microwave electronics, physics of superconductors. Such materials have unique electromagnetic properties that are especially manifested in plasmonic resonators, that are made of them. Each plasmonic resonance is associated with a specific negative value of permittivity (permeability) which generally depends on the size and shape of the sample and on the mode of oscillations. Plasmonic resonators have typically size (at least one of its dimensions) which is much smaller than the wavelength. Radiation losses for the subwavelength plasmonic resonators are smaller than for the dielectric resonators. As it has been shown in this paper on the ground of electrodynamic analysis, in many aspects physical properties of electric and magnetic plasmonic resonators are similar. For ionosphere subjected to the static magnetic field of the Earth values become of the same order as and the properties of electric plasmons would be similar to the magnetic plasmons described in this paper. Rigorous electrodynamic analysis of plasmonic resonators explains several physical phenomena that are experimentally observed by researchers working on various plasmonic resonators but also on atmospheric physics.
References
- Stix T.H., The Theory of Plasma Waves, McGraw-Hill Advanced Physics, (1962).
- Shafranov V. D., Reviews of Plasma Physics, 22, Springer (2001). [CrossRef]
- Maier S., Plasmonics: Fundamentals and Applications, Springer Science+Business Media LLC, New York, (2007).
- Mie G. Beiträge zur Optik trüber Medien, speziell kolloidaler Metallösungen Ann. Phys. Lpz., 330, 377–445, (1908).
- Bohren C. F., How can a particle absorb more than the light incident on it?, American Journal of Physics 51, 323 (1983). [CrossRef]
- Bohren C. F. and. Huffman D. R, Absorption and Scattering of Light by Small Particles, Wiley, New York, (1983).
- Tzarouchis D. and Shivola A., Light scattering by a dielectric sphere: Perspectives on the Mie resonances, Applied Sciences, 8, 184 (22 pages) (2018).
- Gonçalves M.R.,. Minassian H. and Melikyan A., Plasmonic resonators: fundamental properties and applications”, J. Phys. D: Appl. Phys. 53 443002, (2020).
- Aslan K., Lakowicz J. R. and Geddes C. D., Plasmon light scattering in biology and medicine: new sensing approaches, visions and perspectives, Current Opinion in Chemical Biology 9, 538 – 544, (2005). [CrossRef]
- Yang H. U., D'Archangel J., Sundheimer M. L., Tucker E., Boreman G. D. and Raschke M. B., Optical dielectric function of silver, Phys. Rev. B 91 235137, (2015). [CrossRef]
- Johnson P B and Christy R W, Optical constants of the noble metals, Phys. Rev. B 6 4370–9, (1972). [CrossRef]
- Ordal MA, Bell RJ, Alexander RW, Long LL, Querry MR Optical properties of fourteen metals in the infrared and far infrared: Al, Co, Cu, Au, Fe, Pb, Mo, Ni, Pd, Pt, Ag, Ti, V, and W. Appl Opt., 24:4493–4499, (1985).
- Palik ED Handbook of Optical Constants of Solids. Academic Press, San Diego, (1998).
- Blanchard NP, Smith C, Martin DS, Hayton DJ, Jenkins TE, Weightman P, High-resolution measurements of the bulk dielectric constants of single crystal gold with application to reflection anisotropy spectroscopy. Phys Stat Sol C 8:2931–2937, (2003). [CrossRef]
- Ehrenreich H, Philipp H R, Optical properties of Ag and Cu. Phys. Rev. 128:1622–1629, (1962). [CrossRef]
- Naik G V, Shalaev V M and Boltasseva A, Alternative plasmonic materials: beyond gold and silver, Adv. Mater. 25 3264–94, (2013).
- K. L. Kelly, E Coronado, Lin Lin Zhao, G.C. Schatz, The Optical properties of petal nanoparticles: The influence of size, shape, and dielectric environment, J. Phys. Chem. B 2003, 107, 668-677, (2003).
- Derkachova A.,·Kolwas K. and Demchenko I., Dielectric function for gold in plasmonics applications: size dependence of plasmon resonance frequencies and damping rates for nanospheres, Plasmonics, 11:941–951, (2016).
- Voshchinnikov, N. V. and Farafonov V. G., Optical properties of spheroidal particles, Astrophys, Space Sci., 204, 19-86, (1993). [CrossRef]
- Njoki P. N., Lim I. IS., Mott D , Park H. Y., Khan B., Mishra S., Sujakumar R., Luo .J, Zhong C. J. “Size correlation of optical and spectroscopic properties for gold nanoparticles”, J Phys Chem C 111:14664–14669, 2007.
- Krupka J., Aleshkevych P., Salski B., Kopyt P. and Pacewicz A., Ferromagnetic resonance revised – electrodynamic approach,” Scientific Reports, 6, 2017. [CrossRef]
- Krupka J., Pacewicz A., Salski B., Kopyt P., Bourhill J., Goryachev M. and Tobar M. E., Resonances in large ferrimagnetic YIG samples - electrodynamic analysis, Journal of Magnetism and Magnetic Materials, 521, 167536 (2021). [CrossRef]
- Krupka J., Aleshkevych P., Salski B., Kopyt P., Hartnett J., Magnetic and electric solid-state plasmon spherical resonators, Plasmonics, 14, 945-950, (2019). [CrossRef]
- Krupka J., Salski B., Pacewicz A. and Kopyt P., Mode spectra of magnetic and dielectric plasmon spheres obtained from Mie scattering and free oscillations theories, Eur. Phys. J. B 95:1,(2022). [CrossRef]
- Shah G., Numerical methods for Mie theory of scattering by a sphere, Kodalkenel Obs. Bull. Ser. A, 2, 42-63, (1977).
- Matlab program with Mie theory implemented [Online]. Available: https://scattport.org/index.php/programs-menu/mie-type-codes-menu/111-mie-matlab-maetzler.
- Matzler C., MATLAB Functions for Mie Scattering and Absorption, Institute of Applied Physics, Bern, Switzerland, Research Report No. 2002-08, (2002).
- Shore, R.A. Scattering of an electromagnetic linearly polarized plane wave by a multilayered sphere: Obtaining a computational form of Mie coefficients for the scattered field, IEEE Antennas Propag. Mag., 57, 69–116, (2015). [CrossRef]
- Veselago V. G., The electrodynamics of substances with simultaneously negative values of ε and μ, Soviet Physics Uspekhi, 10, 509-514, (1968).
- Ruppin, R. Electromagnetic energy density in a dispersive and absorptive material. Phys. Lett. A 299, 309–312, (2002). [CrossRef]
- Vorobyev, O.B. Energy density of macroscopic electric and magnetic fields in dispersive medium with losses, Prog. Electromagn. Res. B 40, 343–360, (2012). [CrossRef]
- Zhenga, X. and Palffy-Muhoray, P. Electrical energy storage and dissipation in materials, Physics Letters A 379, 1853–1856 (2015).
- P. Drude, "Zur Elektronentheorie der Metalle", Annalen der Physik. 306 (3): 566–613, 1900. [CrossRef]
- Nesterenko V. V., Plasma model and Drude model permittivities in Lifshitz formula, Eur. Phys. J. C 82: 874, 2022. [CrossRef]
- Rylyuk V.M., Tkachenko I. M. and Ortner J., Dielectric tensor and electromagnetic modes in magnetized non-ideal plasmas", J. Plasma Physics (2000), 63, pp. 239–253, (2000). [CrossRef]
- Gurevich A. G., Ferrites at Microwave Frequencies, New York, Consultants Bureau Enterprises Inc., (1963).
- Bardeen J., Two fluid model of superconductivity, Phys. Rev. Letters 1, 399-400, (1958). [CrossRef]
- Agrawal A., Shin Hum Cho, Zandi O., Ghosh S., Johns R. W., and. Milliron D. J, Localized surface plasmon resonance in semiconductor nanocrystals, Chemical Reviews 118 (6), 3121-3207, (2018). [CrossRef]
- Giannini, V.; Fernandez-Domínguez, A. I.; Heck, S. C.; Maier, S. A., Plasmonic nanoantennas: fundamentals and their use in controlling the radiative properties of nanoemitters”, Chem. Rev. 111, 3888− 3912, (2011). [CrossRef]
- Krupka, J. Measurement of the complex permittivity, initial permeability, permeability tensor and ferromagnetic linewidth of gyromagnetic materials. Meas. Sci. Technol. 29, 092001 (2018). [CrossRef]
- Krupka J, Wosik J, Jastrzebski C, Ciuk T, Mazierska J and Zdrojek M, Complex conductivity of YBCO films in normal and superconducting states probed by microwave measurements IEEE Trans. Appl. Supercond. 23 1501011 (2013). [CrossRef]
- Warecka M., Fotyga G., Kowalczyk P., Lech R., Mrozowski M., Pacewicz A., Bartłomiej Wacław Salski B. and Krupka J., Modal FEM analysis of ferrite resonant structures, IEEE Microwave and Wireless Components Letters, 32, 819-822, (2022).
- Kajfez D. Q-factor, Wiley, (2005).
- Meessen A., Explanation of ball lightning by plasma oscillations, Journal of Modern Physics, 14, 1355-1381 (2023). [CrossRef]
- D. M. Le Vine, Review of measurements of the RF spectrum of radiation from lightning, NASA Technical Memorandum 87788 (1986). [CrossRef]
- 4Fletcher P C and Bell R O Ferrimagnetic resonance modes in spheres J. Appl. Phys. 30, 687-698, (1959).
- Zouros K, Kolezas G D and Kyrannas I G, Complex resonances of anisotropic spherical resonators, IEEE Trans. Antennas and Propagation, 66, 5282-5290 (2018). [CrossRef]
- Pacewicz A, Krupka J, Salski B and Kopyt P, Rigorous broadband study of the intrinsic ferromagnetic linewidth of monocrystalline garnet spheres, Sci Rep 9, 9434 (2019). [CrossRef]
Figure 1.
a) Measured permeability tensor components for thin polycrystalline YIG rods versus normalized static magnetic field [40]. b) The real and the imaginary part of permittivity for thin YBCO films versus temperature at 13.3 GHz (based on experiments [41]).
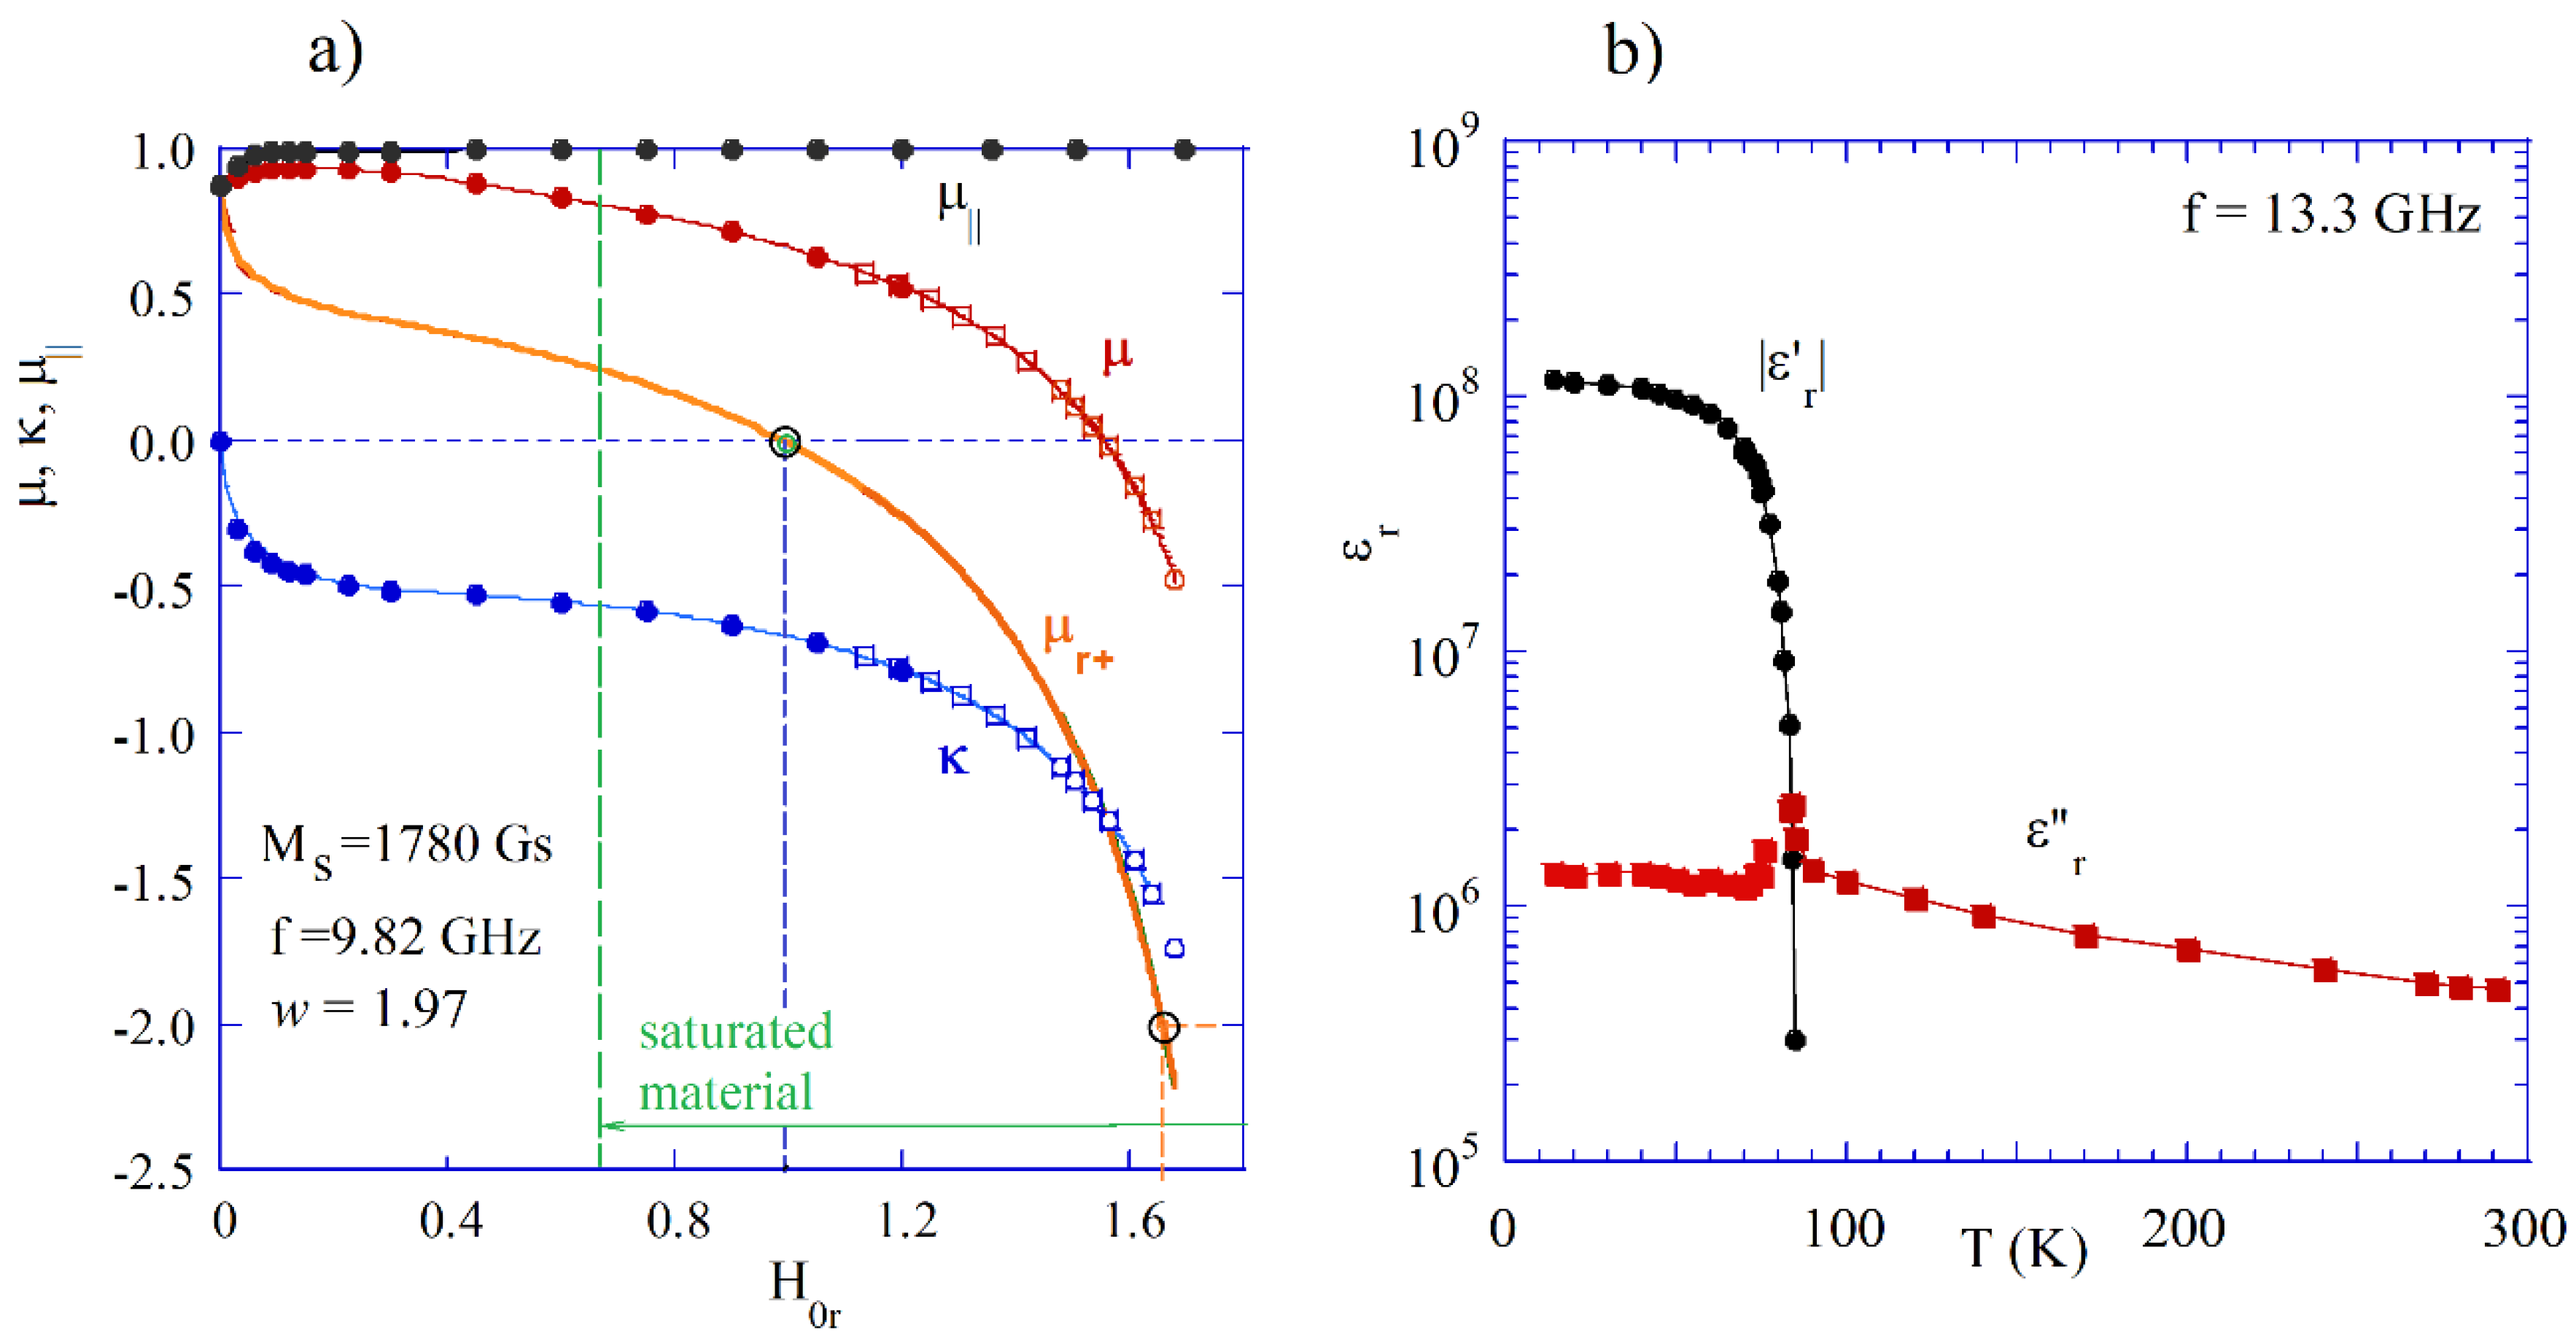
Figure 2.
a) spherical gyromagnetic sample in free space, b) spherical gyromagnetic sample in spherical perfect conductor enclosure, c) spherical electric plasmon sample in free space, d) spherical electric plasmon sample in spherical perfect conductor enclosure.
Figure 2.
a) spherical gyromagnetic sample in free space, b) spherical gyromagnetic sample in spherical perfect conductor enclosure, c) spherical electric plasmon sample in free space, d) spherical electric plasmon sample in spherical perfect conductor enclosure.
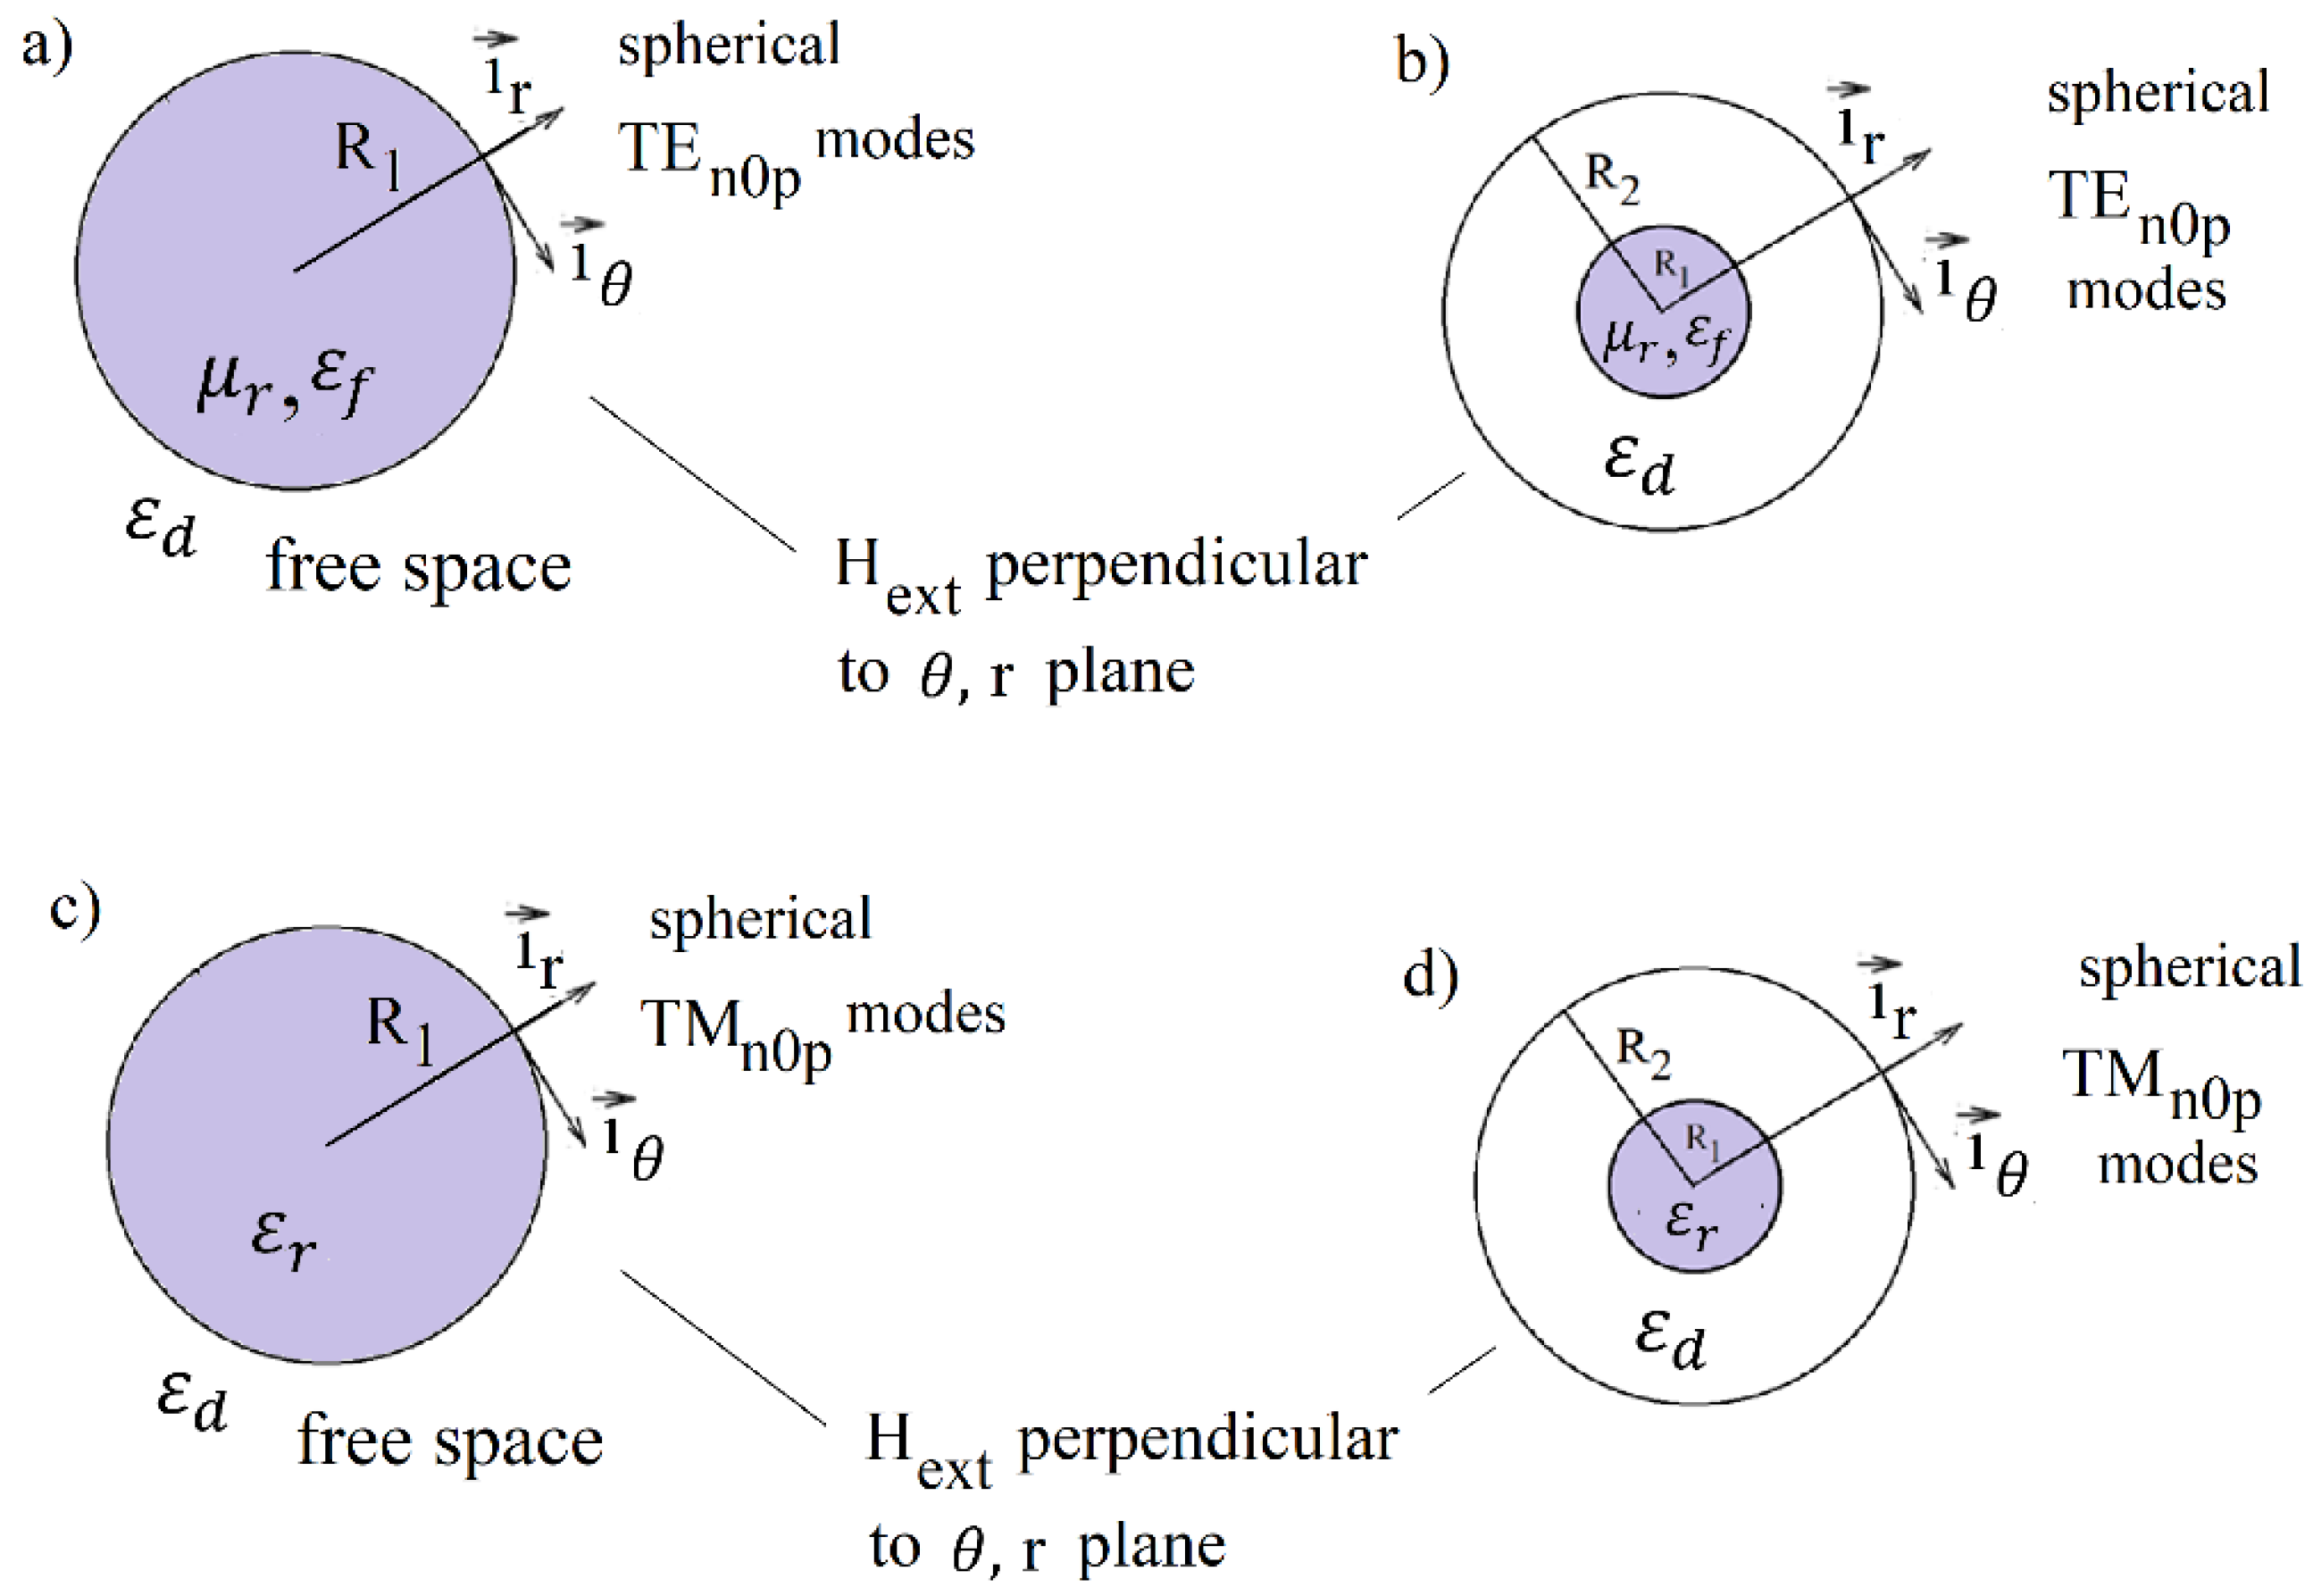
Figure 3.
Components of permeabilities for transient (complex ) and steady state solutions (real ω) for the plasmonic mode in single crystal YIG sphere d = 5 mm in spherical metal enclosure (reproduced from [22]).
Figure 3.
Components of permeabilities for transient (complex ) and steady state solutions (real ω) for the plasmonic mode in single crystal YIG sphere d = 5 mm in spherical metal enclosure (reproduced from [22]).
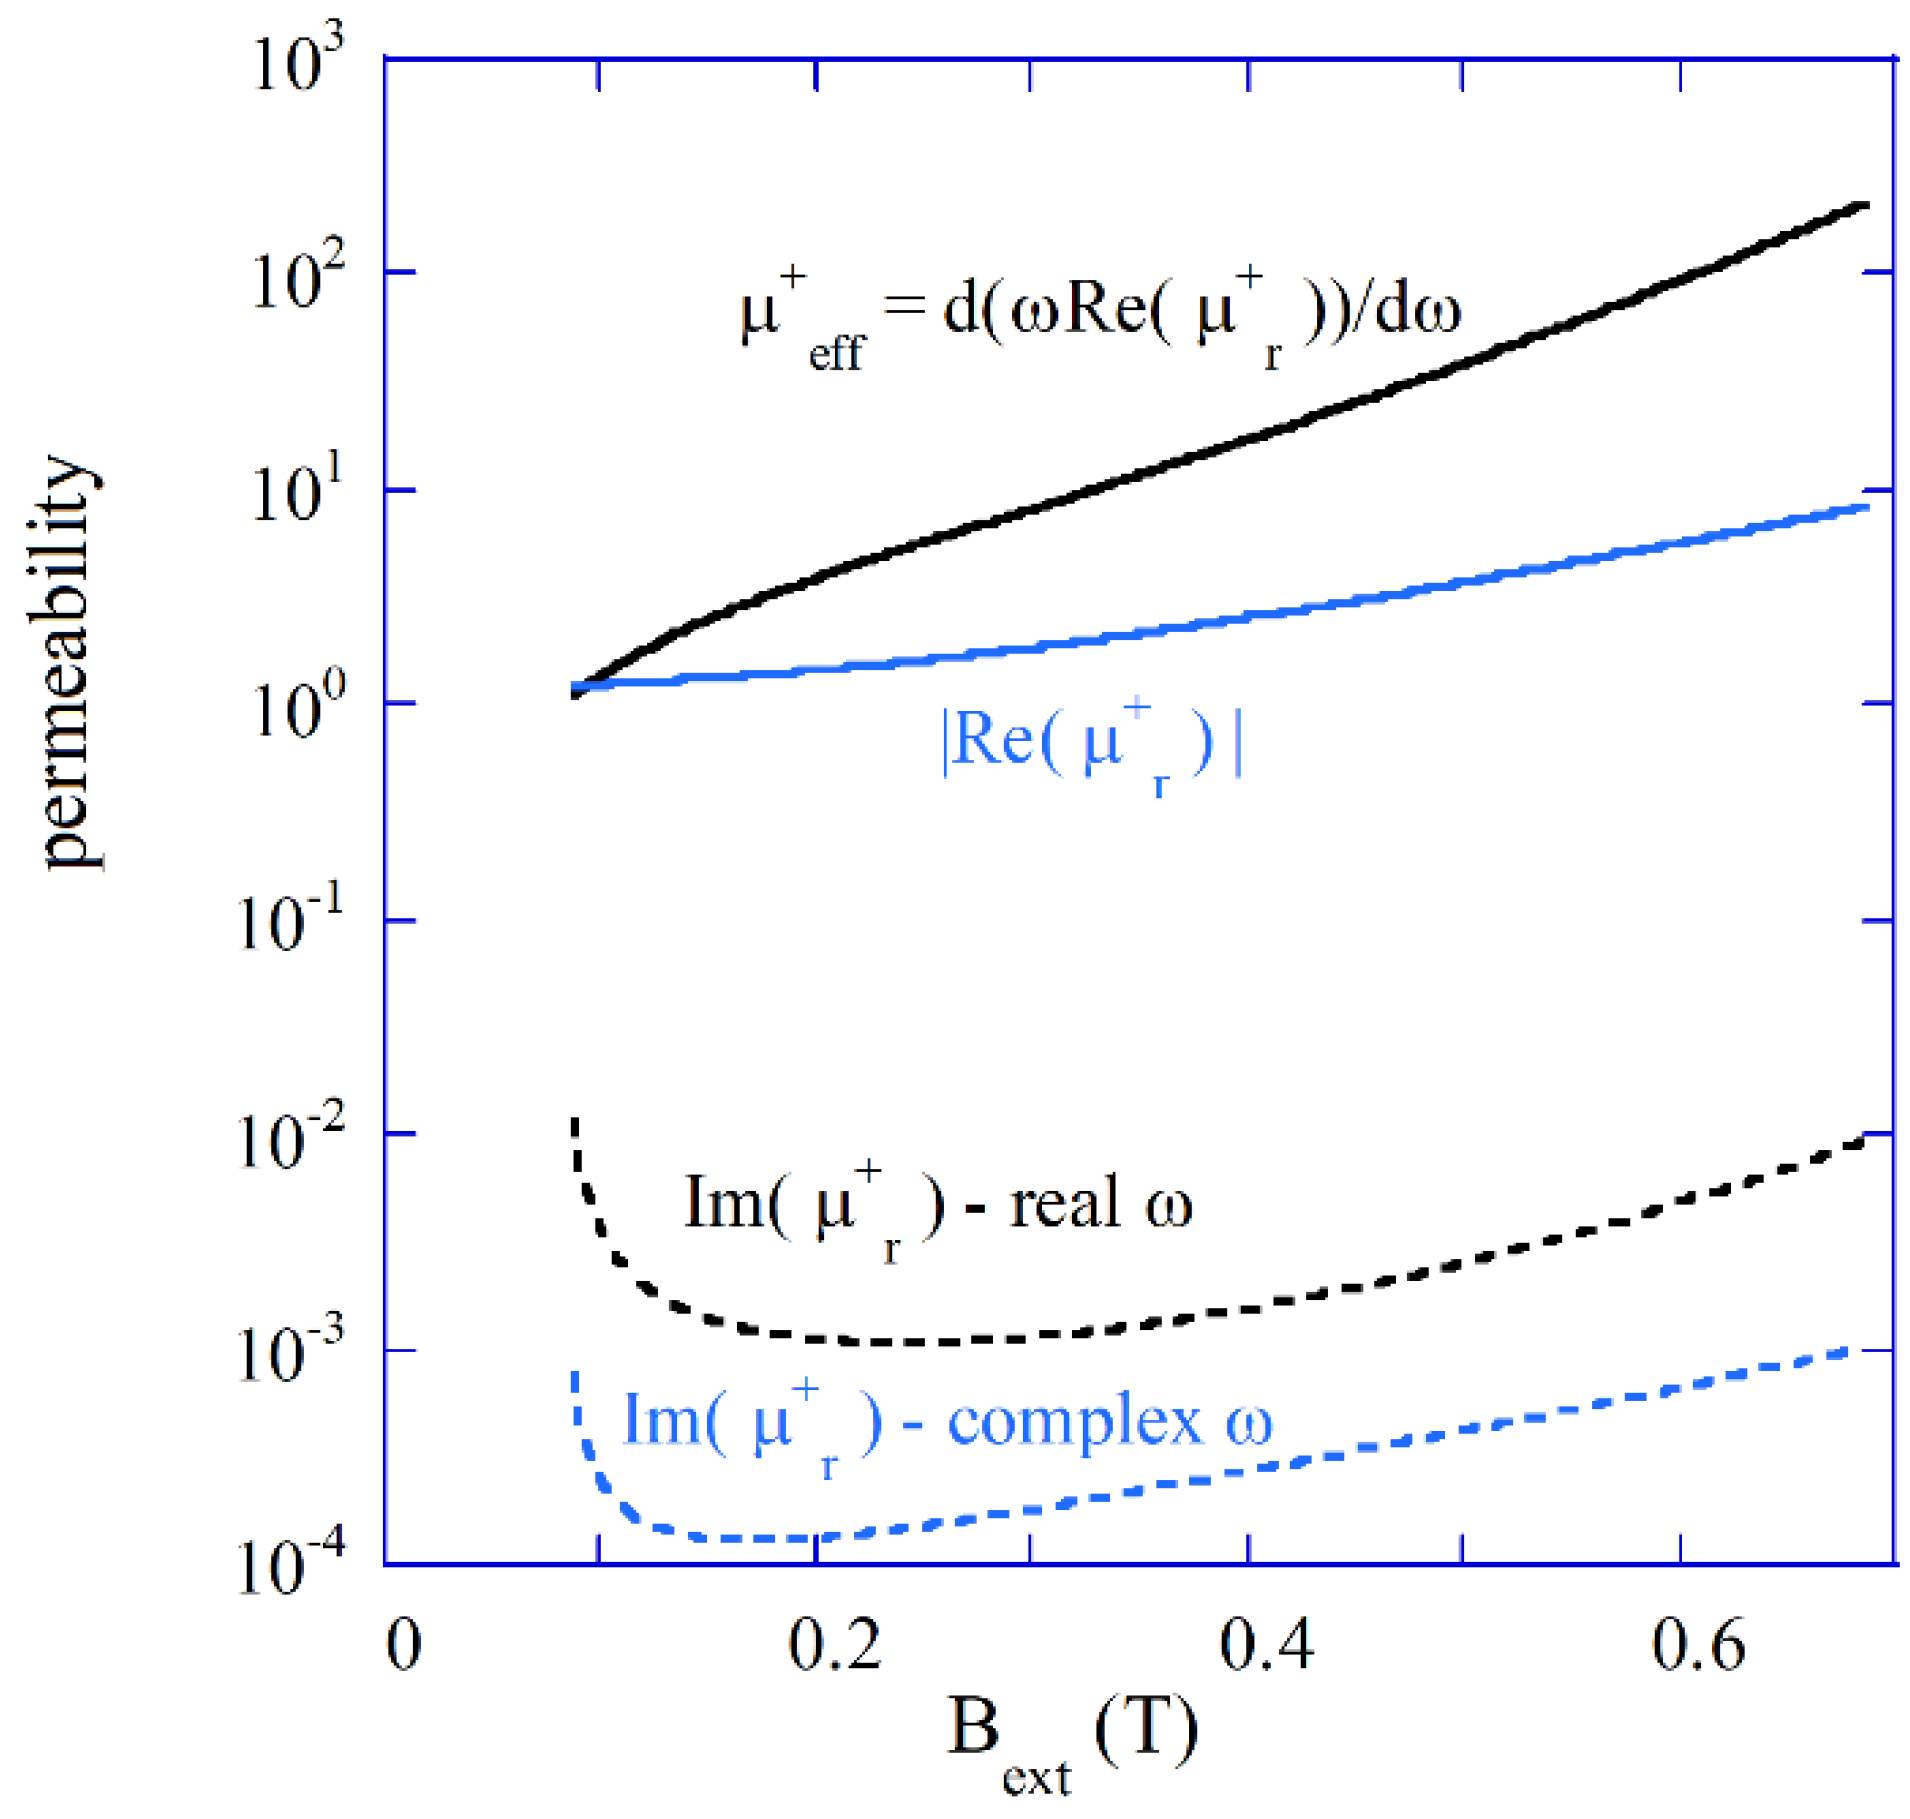
Figure 4.
a) Computed Mie spectrum of extinction coefficient for low loss nondispersive sphere with and b) Permittivity’s corresponding to the three plasmon modes versus normalized resonance frequencies (TDE solutions for , ), solid green squares correspond to three normalized frequencies evaluated from Mie spectrum ( from Figure 4a, solid blue circles represent values evaluated from Mie spectra obtained for various , c) Q-factors due to radiation losses (), for lossless medium (TDE solutions). Green squares represent values corresponding to .
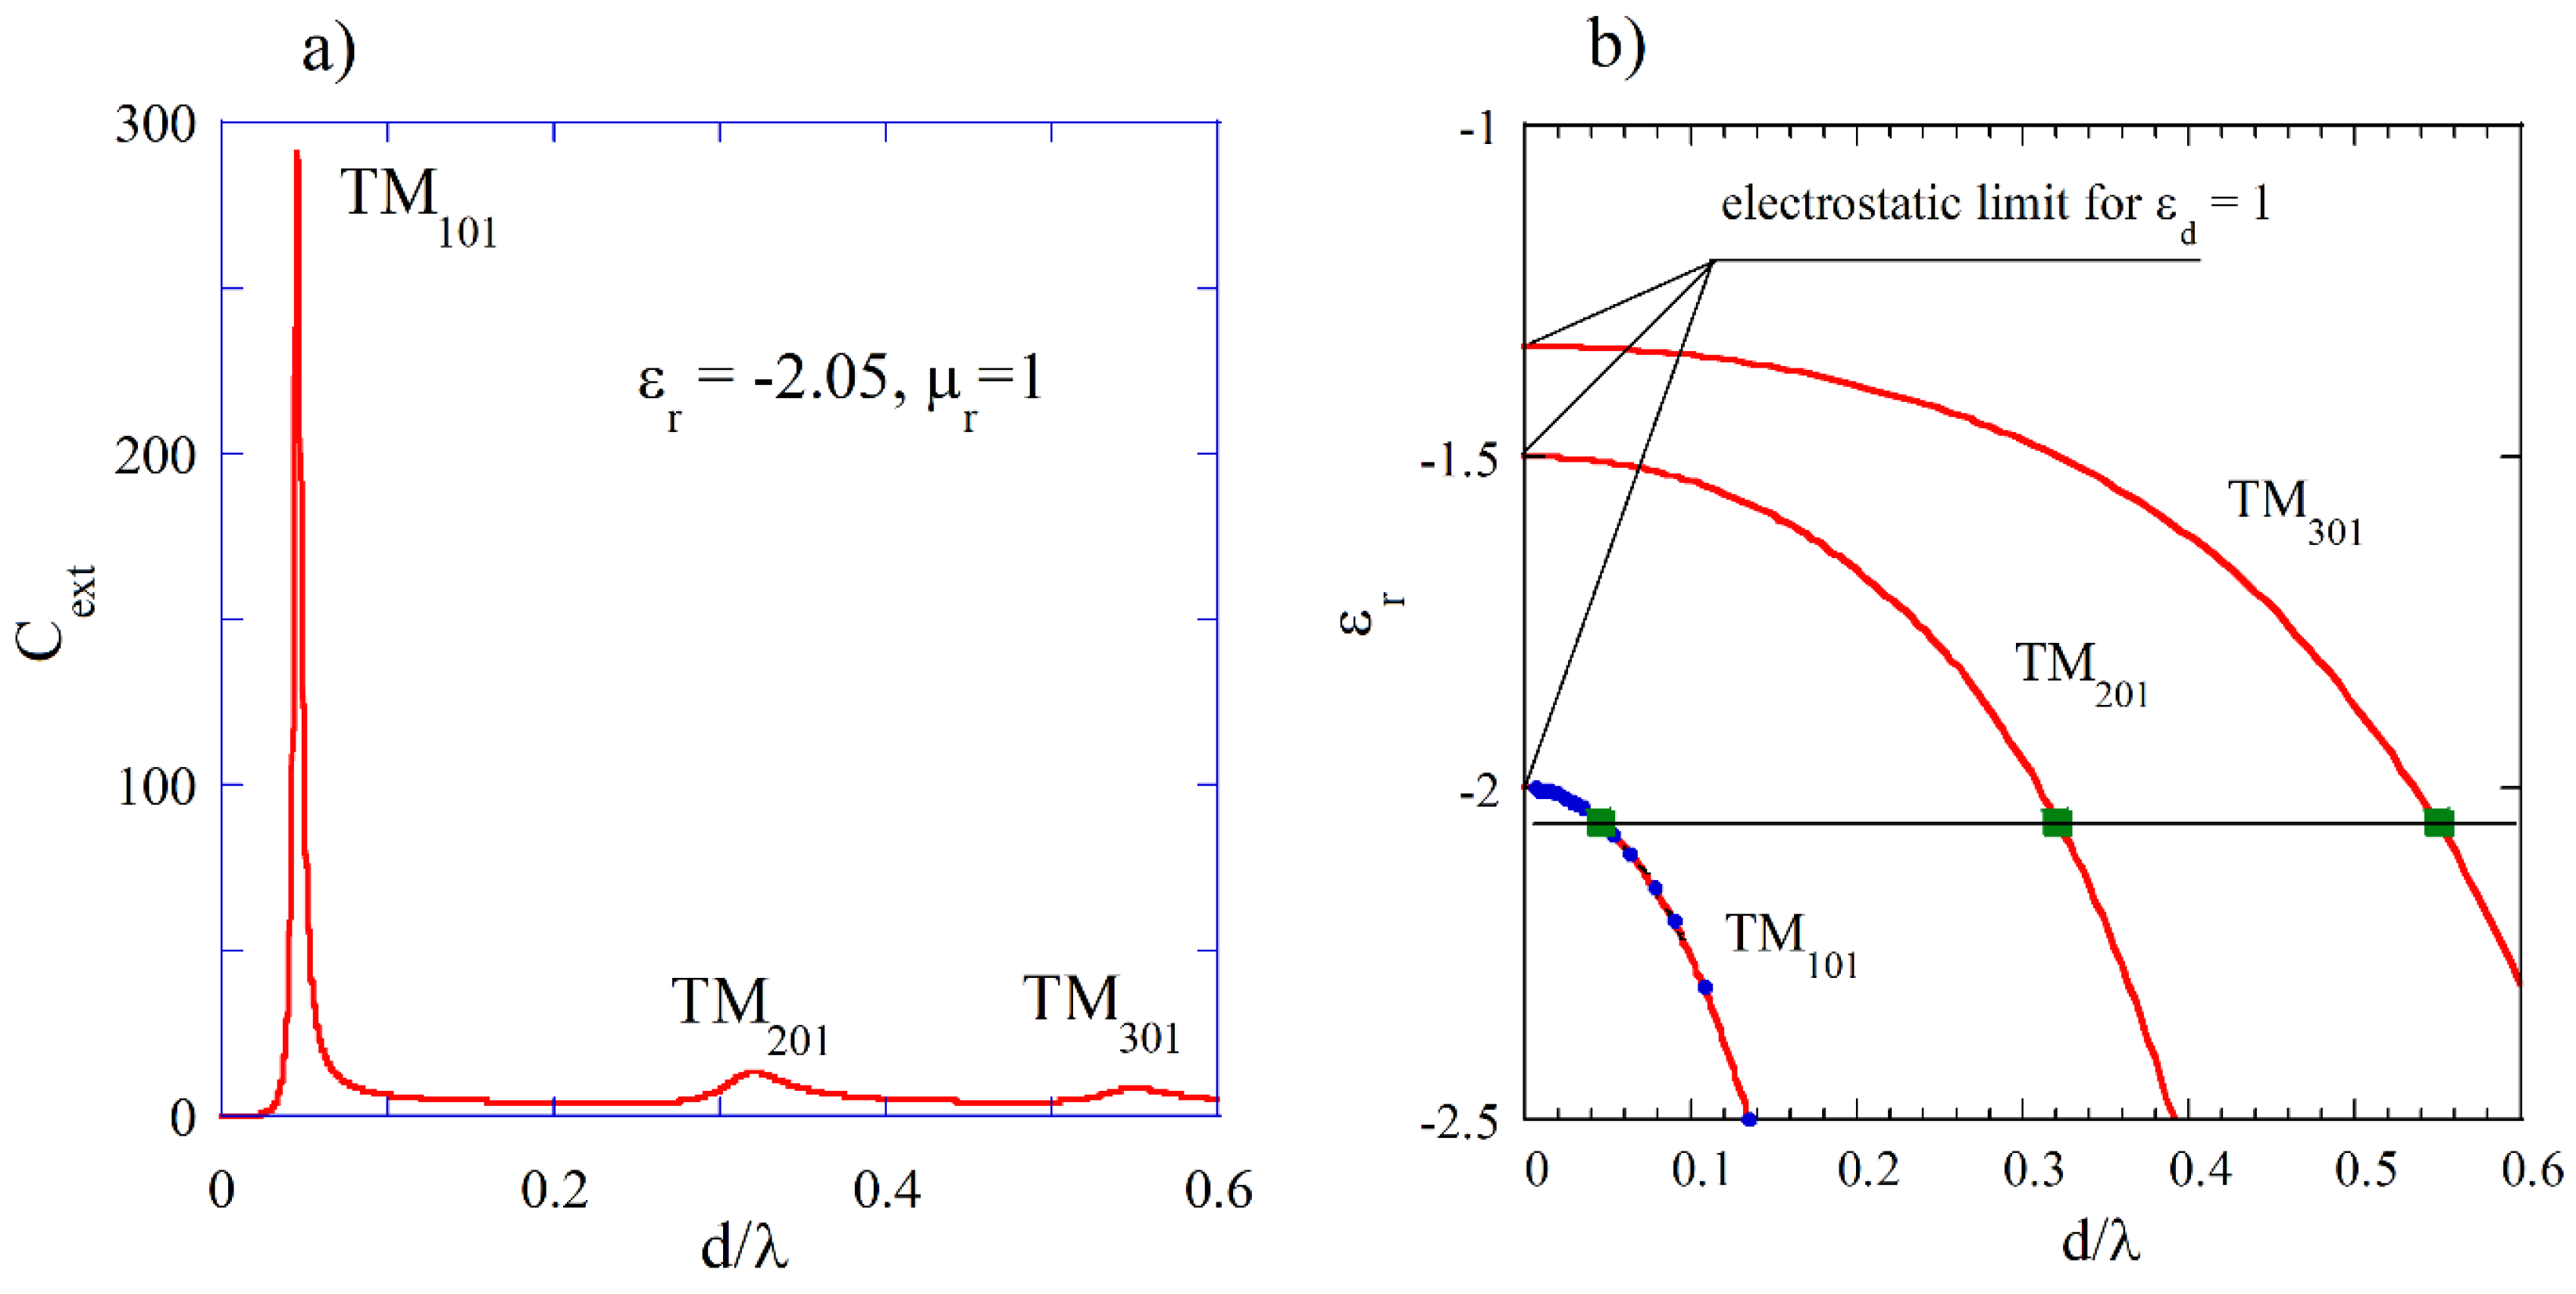
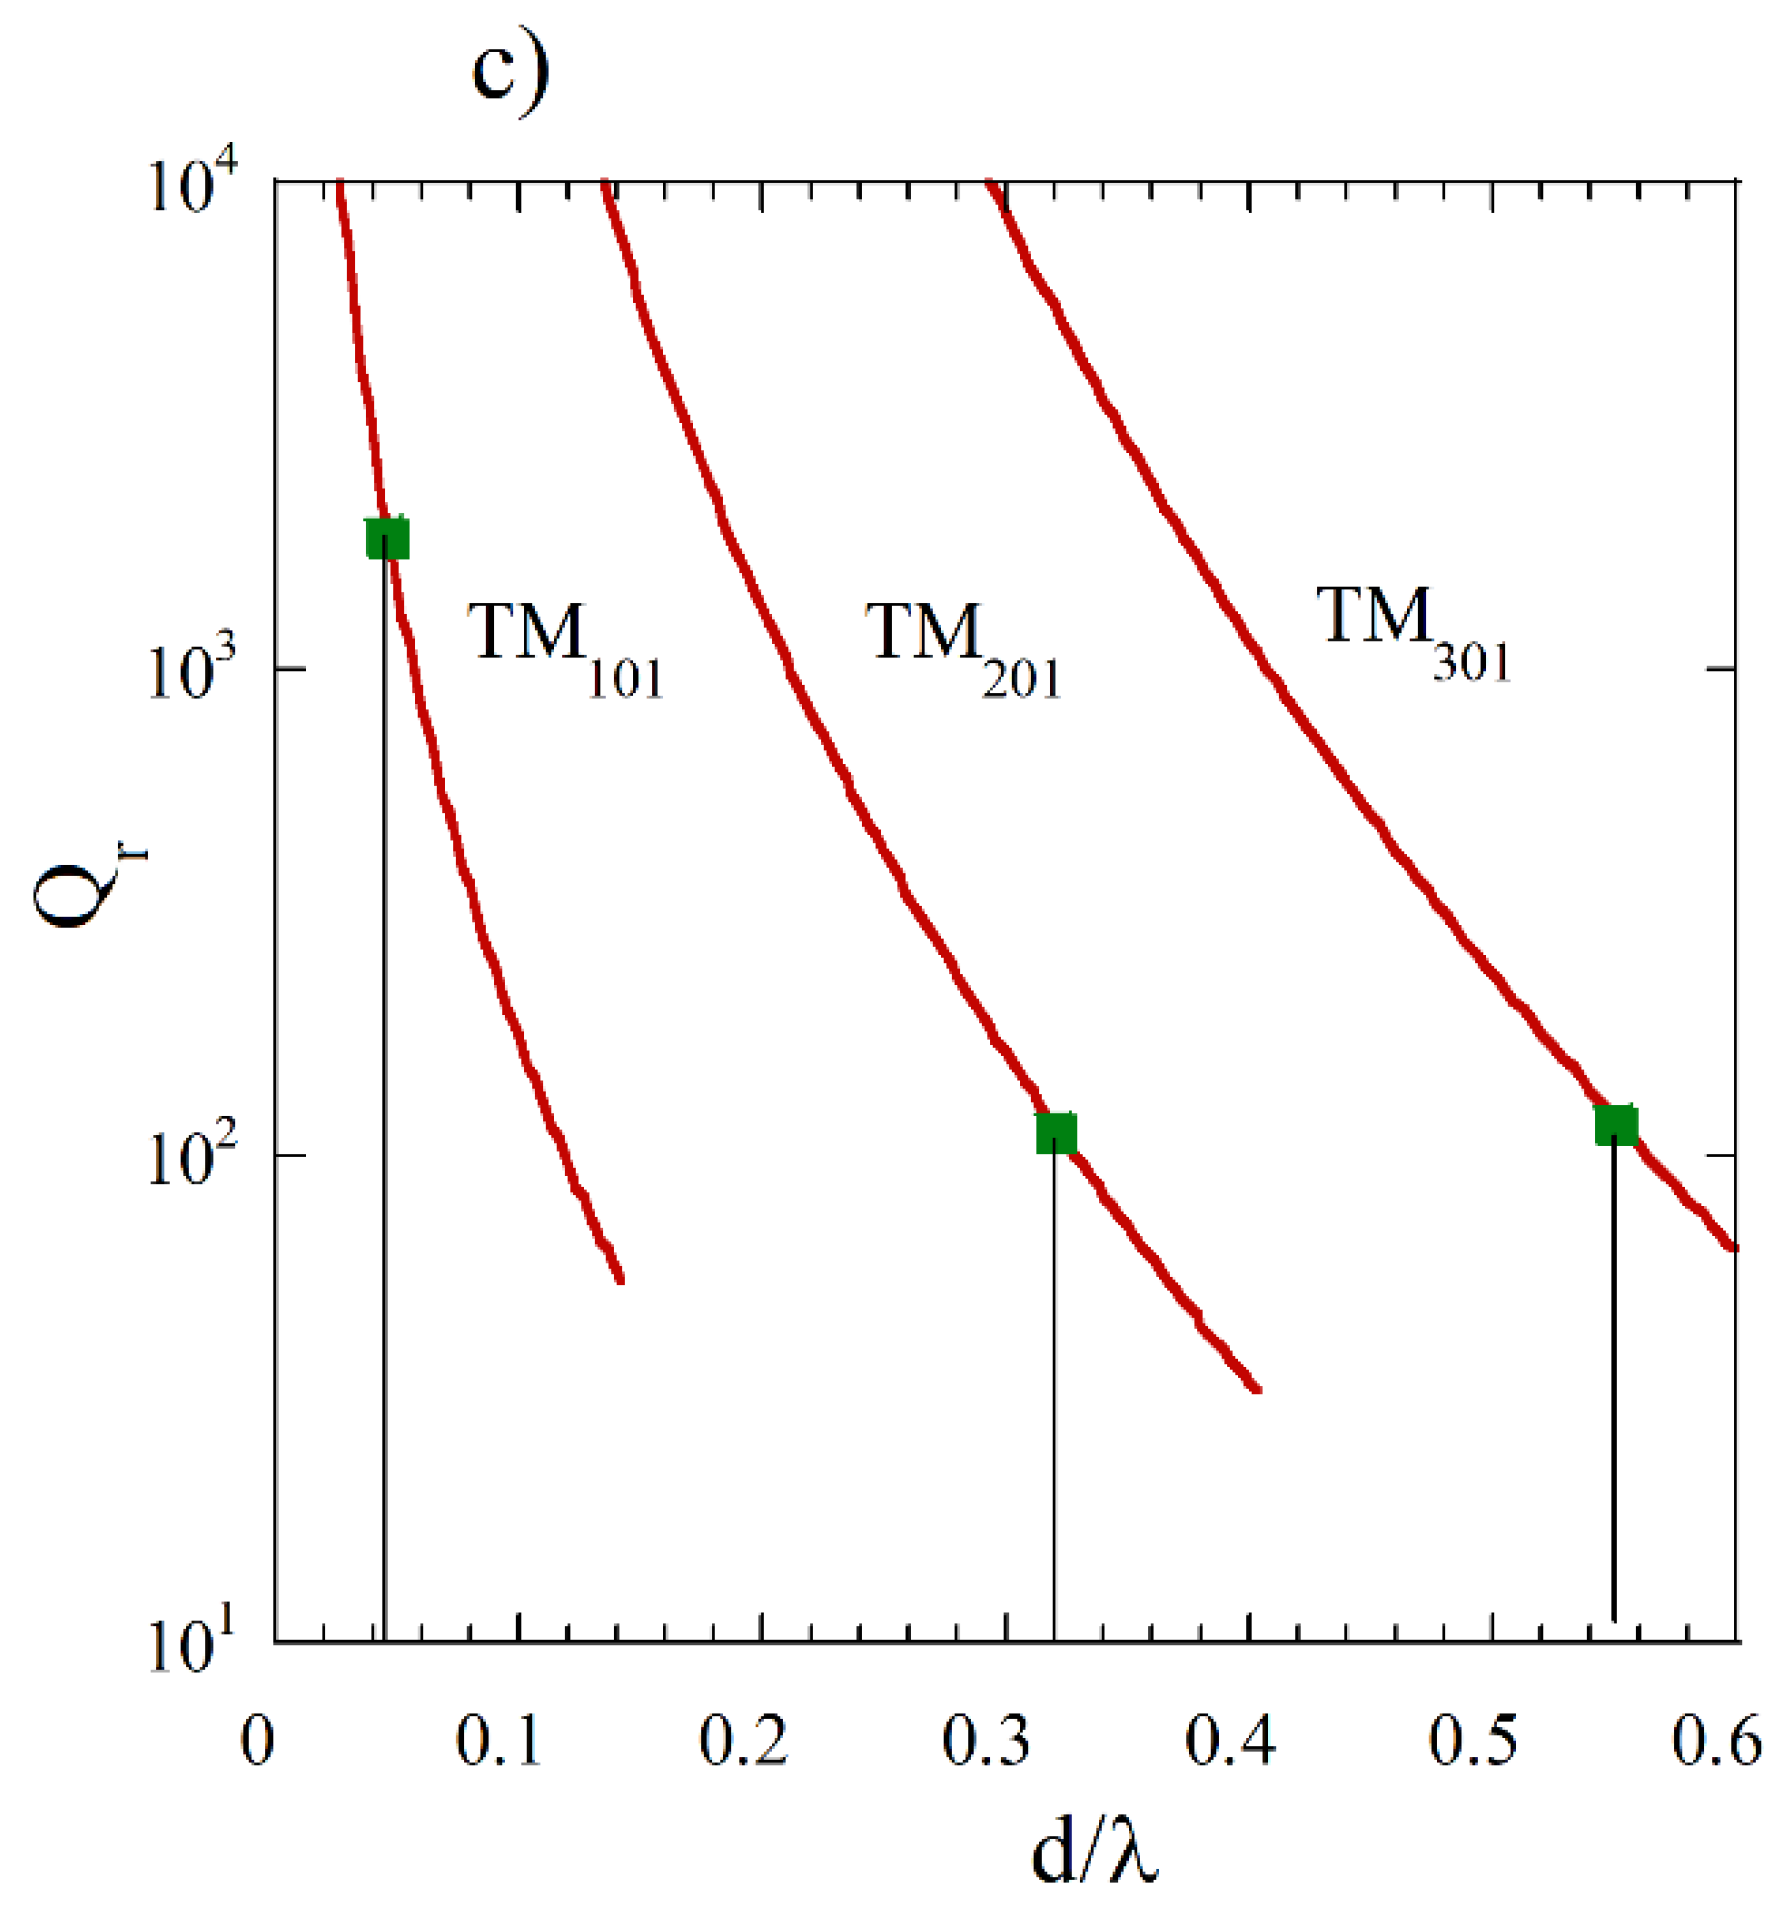
Figure 5.
a) Permittivity’s corresponding to the three plasmon modes (TDE solutions) for gold spheres immersed in water assuming Hz, Hz, , solid blue circles represent results obtained from Mie spectra, b) Q-factors of three plasmonic resonances. Solid lines denote the total Q-factors computed for gold spheres, broken lines the Q-factors due to radiation losses (lossless medium, TDE solutions). c) Mie extinction coefficients for gold (blue squares), for an hypothetical low loss gaseous plasma (green circles) with MHz, , and the total Q-factor for the low loss gaseous plasma (TDE solutions).
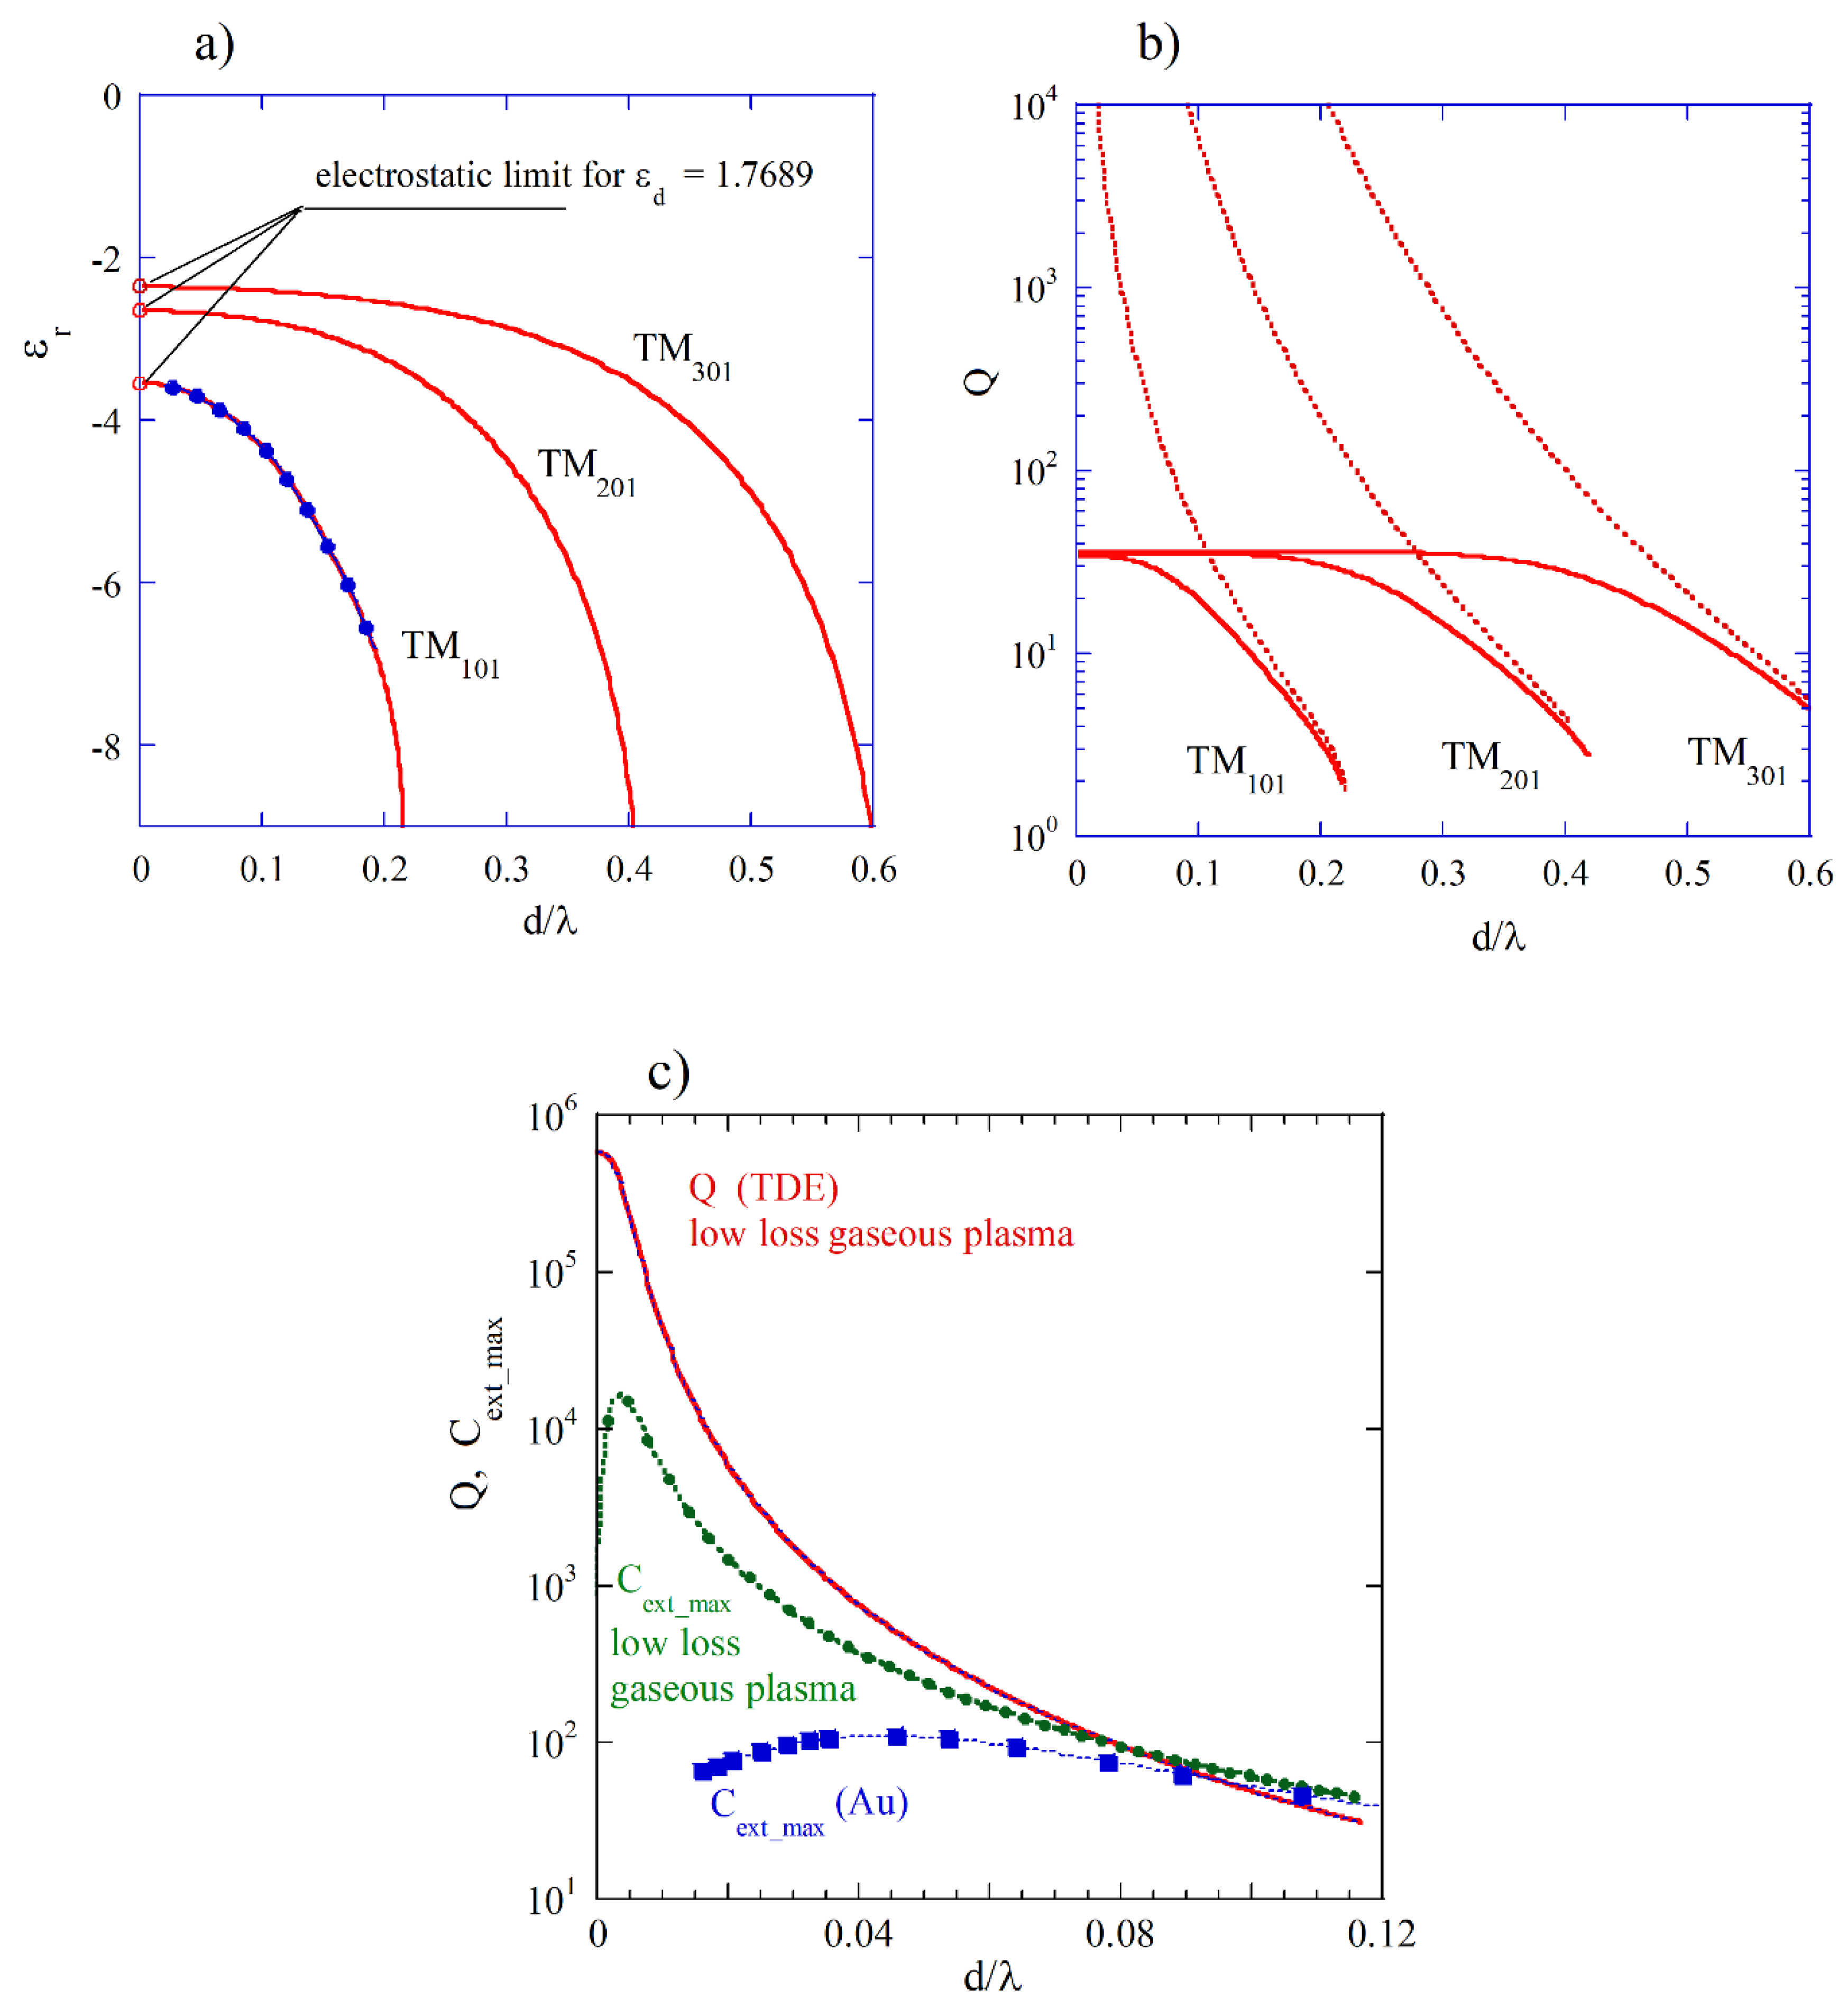
Figure 6.
a) for few modes in magnetostatic approximation computed from Fletcher’s TDE [46]. b) as function of (d = 0.5 mm, , ) computed as solutions of TDE [23] for the first three magnetic plasmon modes of spherical sample.
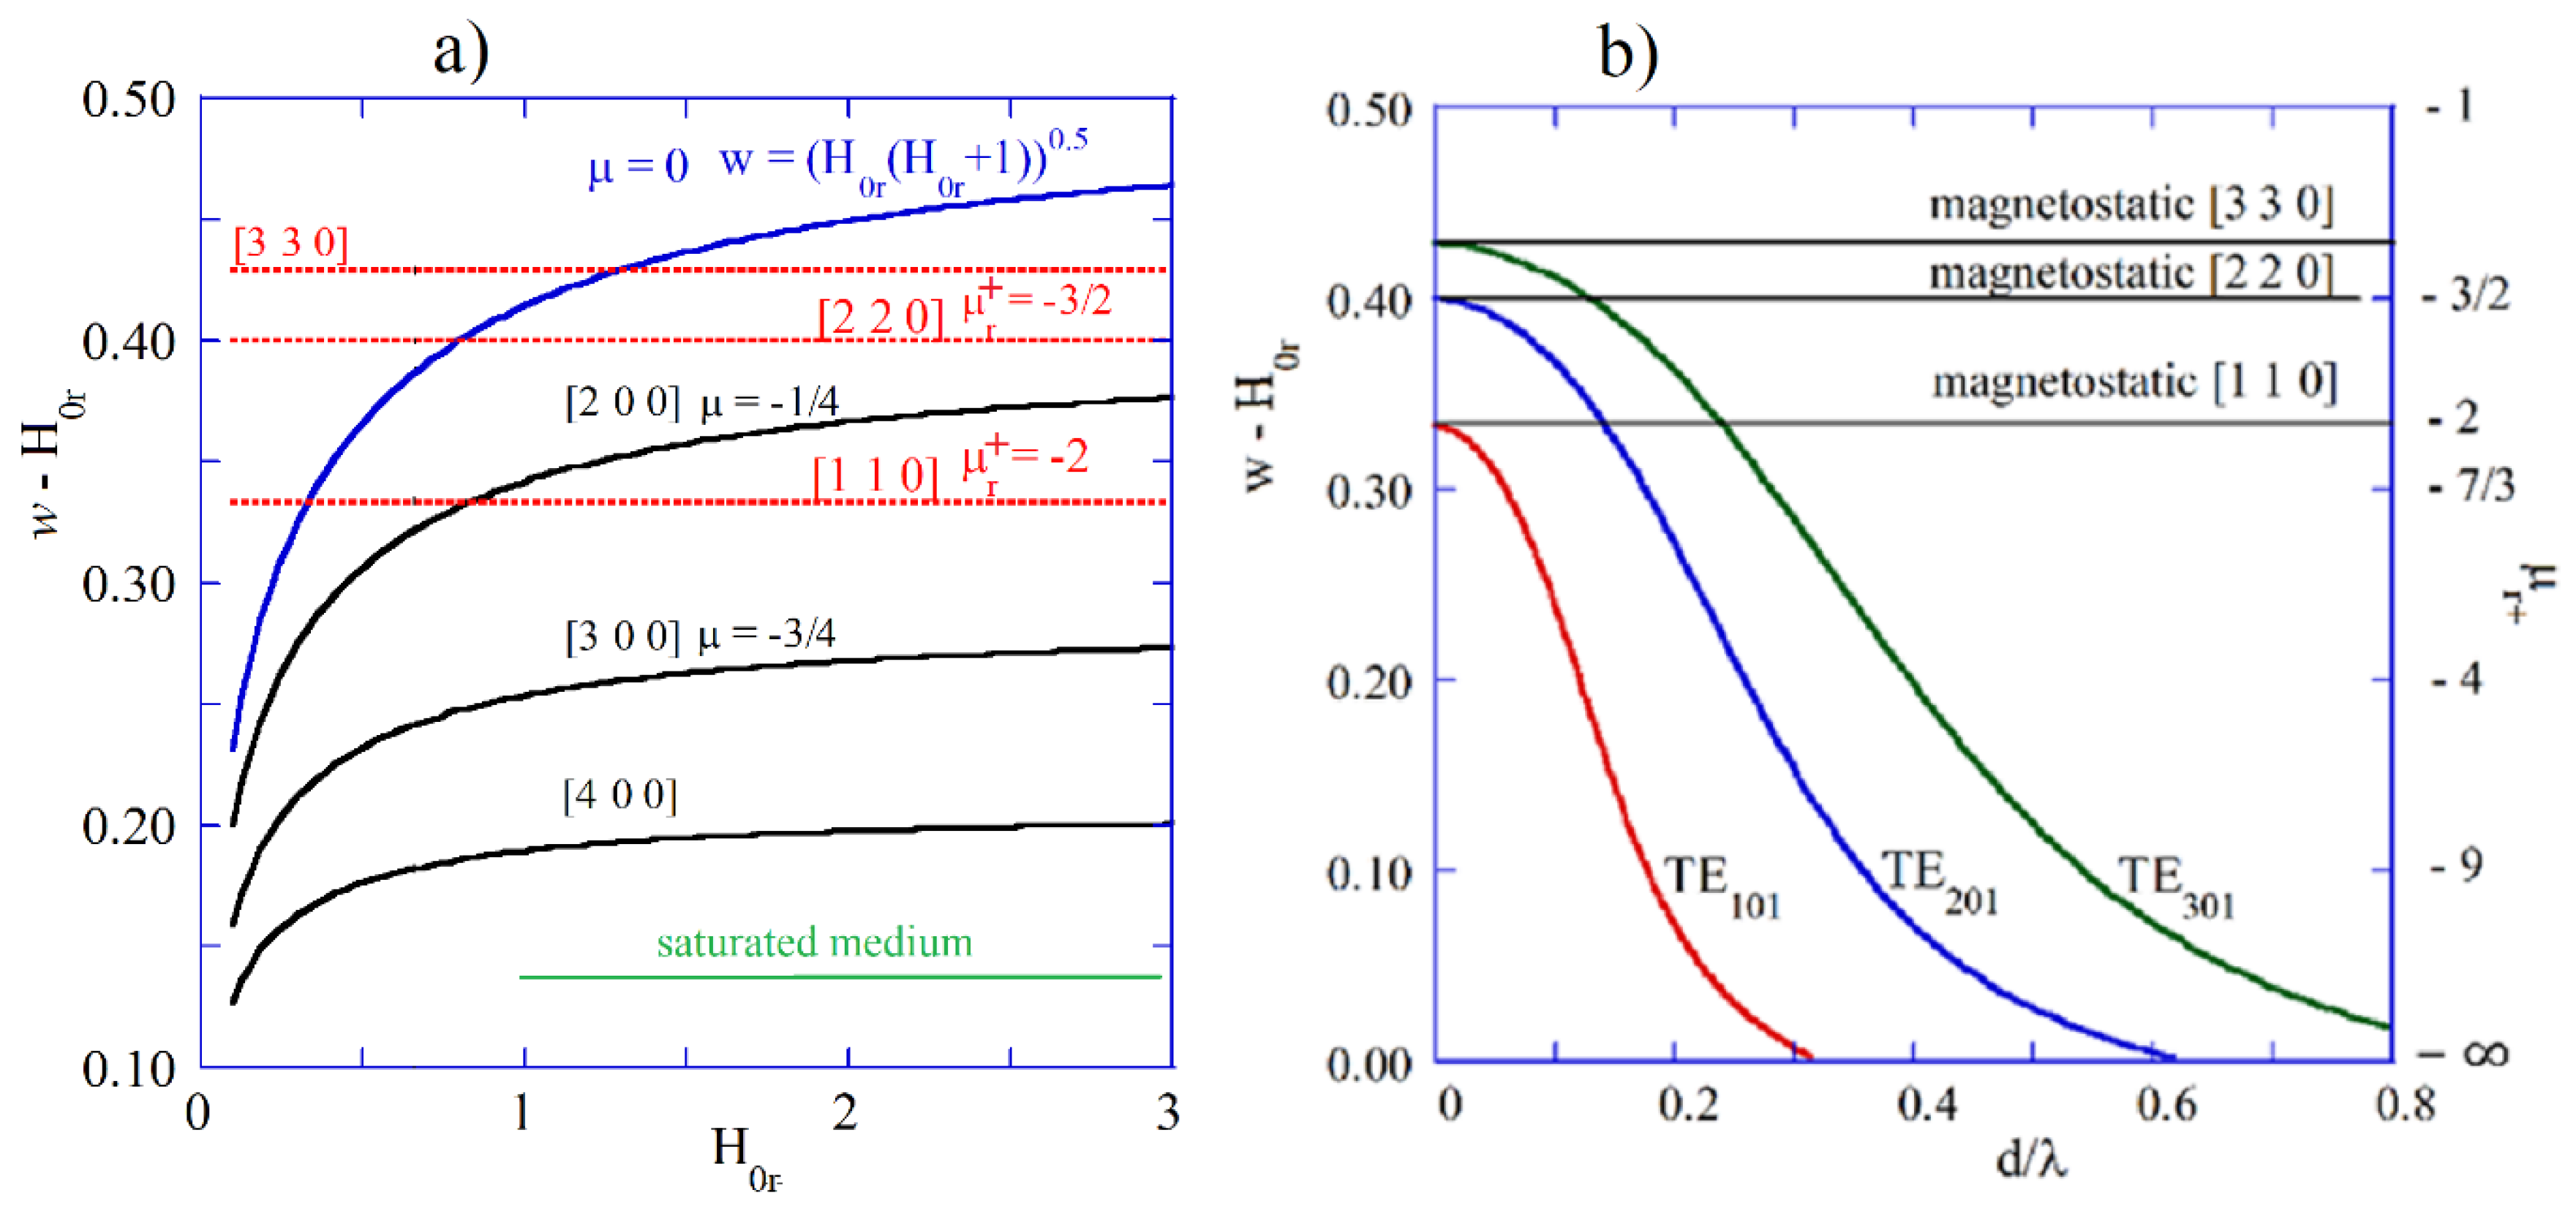
Figure 7.
Ratios of the magnetic to the electric energy stored per period of oscillations versus for the modes in lossless spherical samples having different diameters for , . Computations of energies using expressions from Eq.14.
Figure 7.
Ratios of the magnetic to the electric energy stored per period of oscillations versus for the modes in lossless spherical samples having different diameters for , . Computations of energies using expressions from Eq.14.
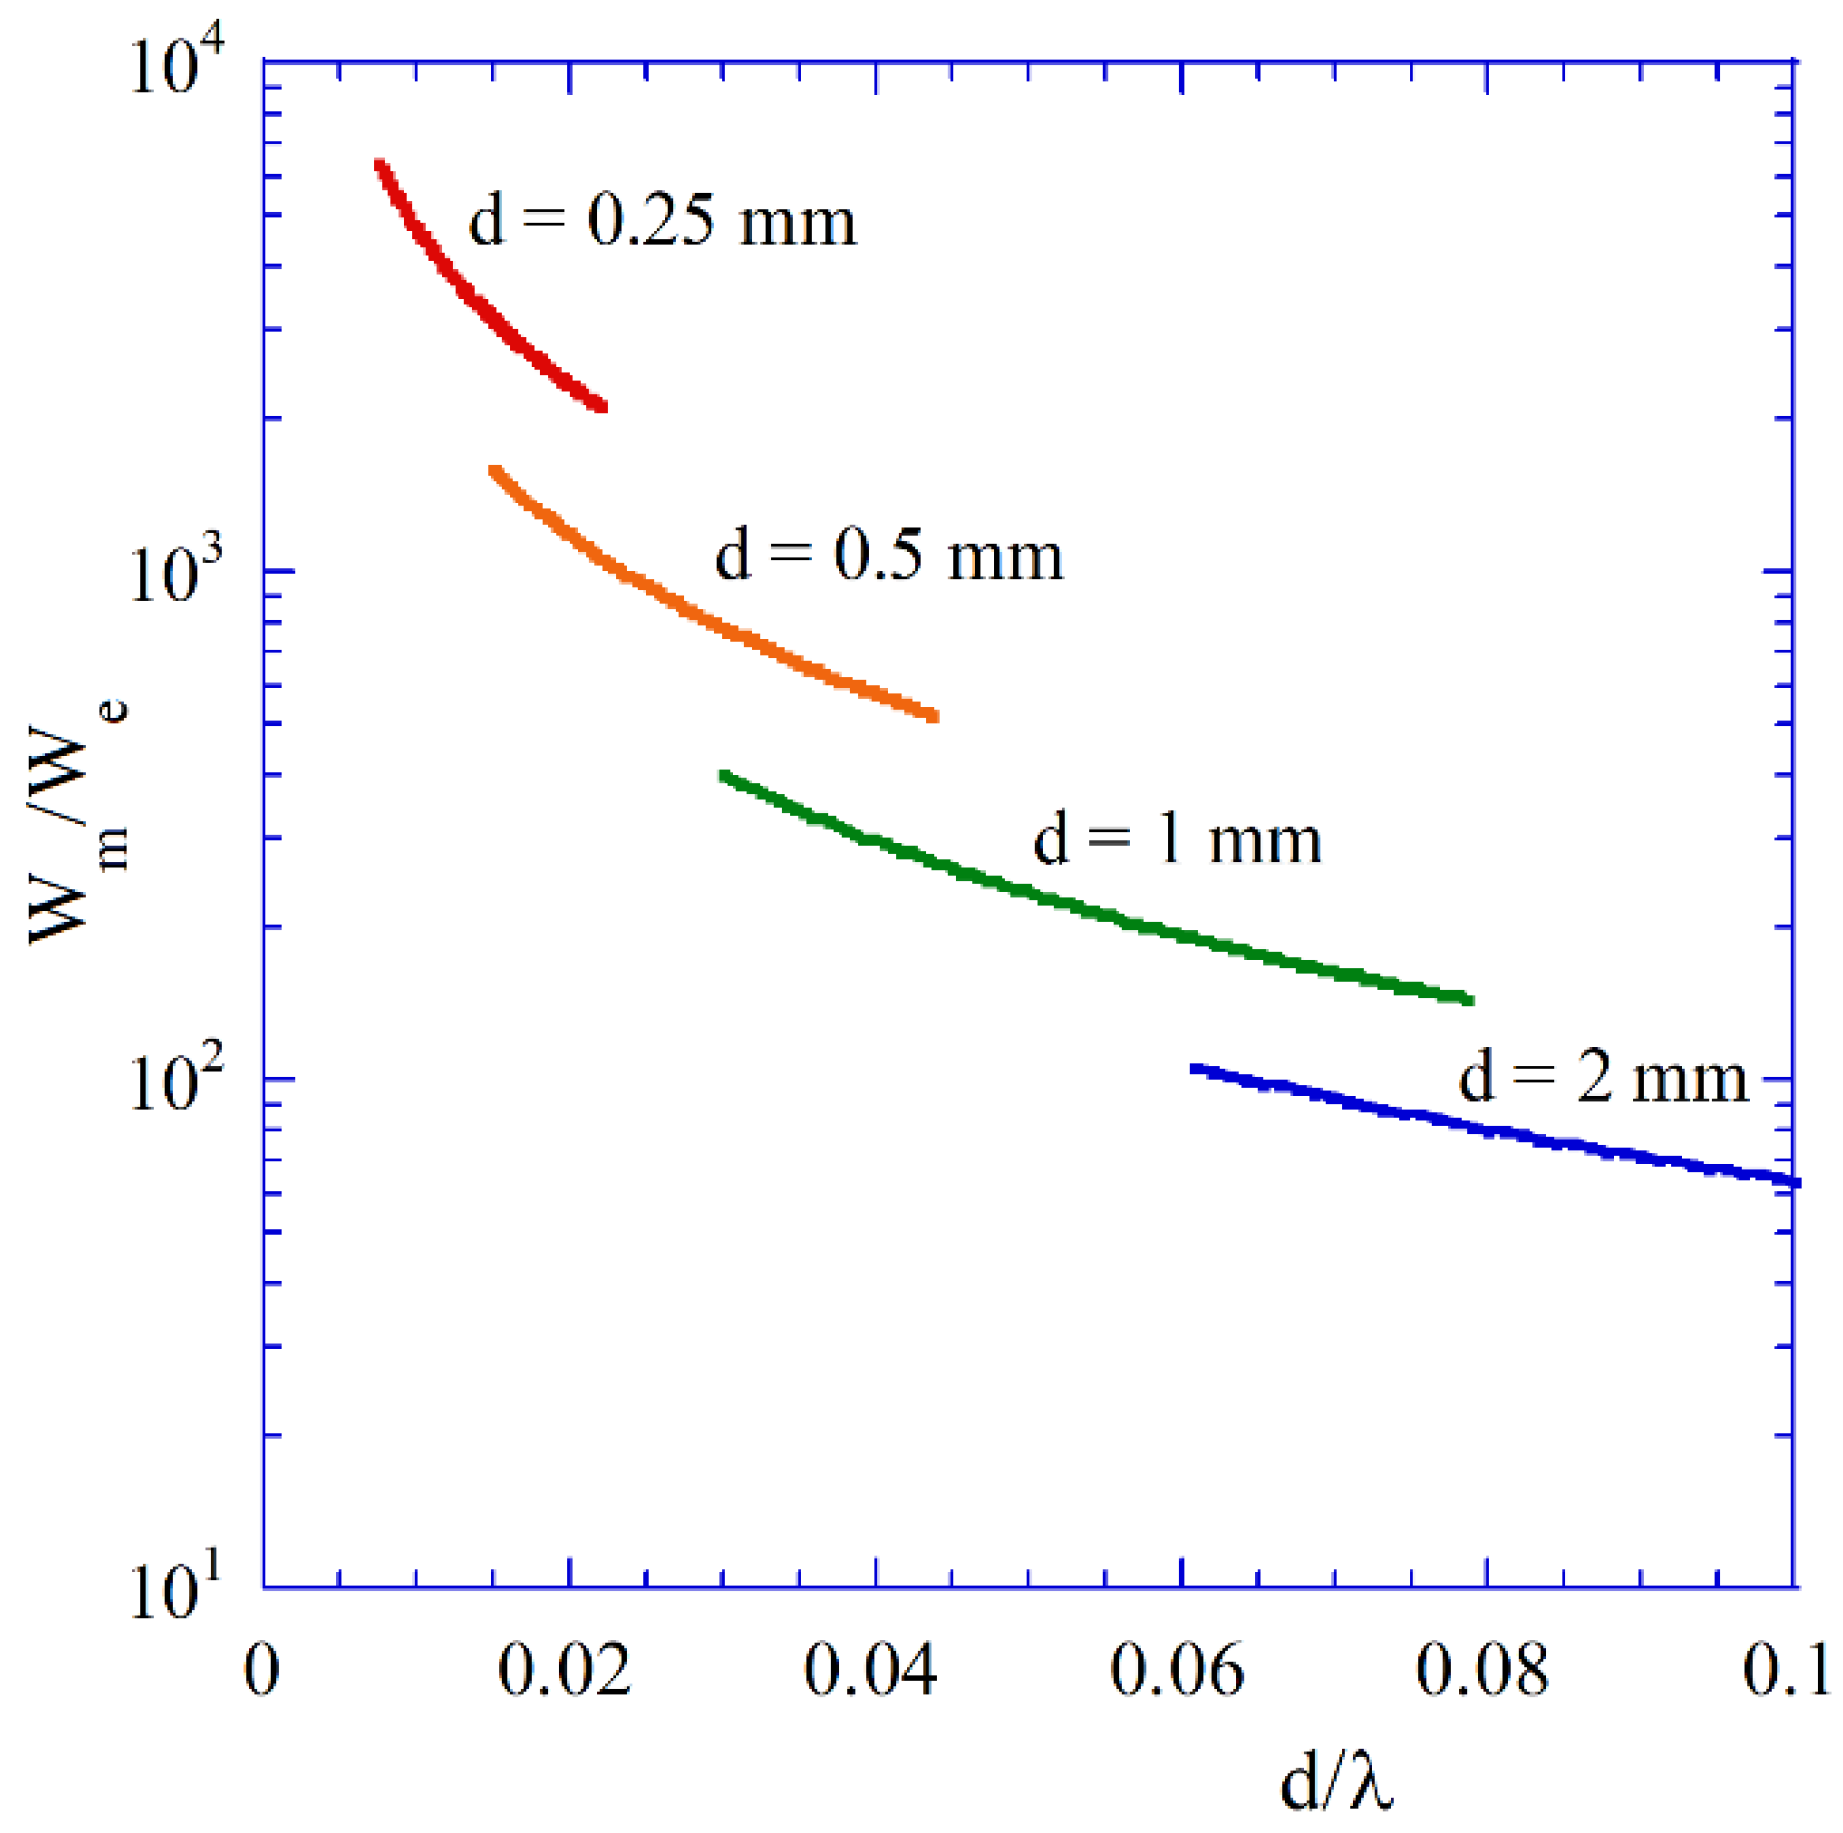
Figure 8.
a) Measured |S21| values of sub-wavelength metal resonator containing single crystal YIG sample (d= 0.5 mm, = 0.47 Oe at 10 GHz), for (. Data and details of experiment as in [40].
Figure 8.
a) Measured |S21| values of sub-wavelength metal resonator containing single crystal YIG sample (d= 0.5 mm, = 0.47 Oe at 10 GHz), for (. Data and details of experiment as in [40].
Disclaimer/Publisher’s Note: The statements, opinions and data contained in all publications are solely those of the individual author(s) and contributor(s) and not of MDPI and/or the editor(s). MDPI and/or the editor(s) disclaim responsibility for any injury to people or property resulting from any ideas, methods, instructions or products referred to in the content. |
© 2024 by the authors. Licensee MDPI, Basel, Switzerland. This article is an open access article distributed under the terms and conditions of the Creative Commons Attribution (CC BY) license (http://creativecommons.org/licenses/by/4.0/).
Copyright: This open access article is published under a Creative Commons CC BY 4.0 license, which permit the free download, distribution, and reuse, provided that the author and preprint are cited in any reuse.


