
Submitted:
29 November 2024
Posted:
03 December 2024
You are already at the latest version
Abstract
Background/ Objectives: Cirrhosis is the precursor to most cases of hepatocellular carcinoma (HCC). Understanding the mechanisms leading to the transition from cirrhosis to HCC and identifying key biomarkers is crucial to developing effective screening strategies and reducing HCC-related mortality. DNA methylation is associated with gene inactivation and plays an important role in physiological and pathological processes; however, its role in cirrhosis progression to HCC is unknown. Methods: We performed genome-wide DNA methylation profiling using Illumina Infinium MethylationEPI BeadChip, in pre-diagnostic samples from 22 cirrhosis patients who subsequently developed HCC and 22 cirrhosis patients who remained HCCfree during an average 4-year follow-up. In a secondary analysis, we examined a subset of patients without hepatitis C virus (HCV) infection. Results: We identified three differentially methylated positions (DMPs) located in ADAM12 (cg13674437) and PSD3 (cg06758847 and cg24595678) that show a strong association with HCC risk (lower median vs. higher median hazards ratio (HR): HR cg13674437=0.34, 95% CI=0.14 – 0.83; HR cg06758847=4.89, 95% CI=1.79 – 13.33; HR cg24595678=11.19, 95% CI=3.27 – 38.35). After excluding all HCV-active patients from our analysis, HR for the DMPs remained as significant. Conclusions: In conclusion, the findings in this study support that buffy coat-derived DNA methylation markers could be used to identify biomarkers among cirrhosis patients at high risk for HCC before clinical symptoms appear. A further multi-omics study with a large prospective cohort is required to validate these findings.
Keywords:
progression
; methylation markers
; ADAM12
; PSD3
; biomarkers
; risk stratification
; early detection
; epigenetic changes
; epigenome
Simple Summary :Cirrhosis is the precursor to most cases of hepatocellular carcinoma (HCC). HCC incidence and mortality have increased rapidly over the past two decades in the US, with a < 20% 5-year survival rate. Understanding the mechanisms of this transition and identifying biomarkers is vital for effective screening and reducing HCC-related mortality. This study evaluated genome-wide DNA methylation patterns in the buffy coats of cirrhosis patients who developed HCC and those who remained HCC-free during an average four-year follow-up. We then identified differentially methylated sites distinguishing cirrhosis with HCC from cirrhosis without HCC. The findings support that buffy coat-derived DNA methylation markers could be implementable to stratify cirrhosis patients at high risk before clinical symptoms appear.
1. Introduction
Hepatocellular carcinoma (HCC) is a leading cause of death worldwide [1]. HCC incidence and mortality in the US have increased rapidly over the past two decades [2]. Despite advancements in treatment, cure remains only possible for fewer than 10% of HCC patients, and 5-year survival remains < 20% [3]. Cirrhosis is the precursor to more than 80% of HCCs diagnosed in the United States. Therefore, understanding the transition mechanism from cirrhosis to HCC and identifying key biomarkers are crucial to developing effective screening, risk stratification, prevention strategies, and improving survival.
DNA methylation is an epigenetic modification that can control gene expression and chromosomal stability without changing the DNA sequence [4]. Changes in methylation patterns have been observed in many solid cancers and play a key role in biological mechanisms of carcinogenesis [5,6,7]. Previous studies that explored differentiated DNA methylation in tumor tissues have demonstrated changes in overall DNA methylation in the progression of liver disease from cirrhosis to early HCC [7,8,9,10]. These studies have also identified genes with differential methylation and expression levels and suggested that differentially methylated CpG sites could be used to predict early-stage HCC [7,8]. The Cancer Genome Atlas (TCGA) studies profiled HCC tissues compared to adjacent normal tissues based on in silico. Then, they found that methylation levels of CTF1, FZD8, PDK4, and ZNF334 were associated with worse overall survival [9]. A genome-wide DNA methylation study by Hernandez-Meza et al. found that tissue methylation levels in the promoter regions of TSPYL5, KCNA3, LDBH, and SPINT2 increased from cirrhosis to early-stage HCC and were associated with lower gene expression level [10]. Patients with metabolic dysfunction-associated steatotic liver disease (MASLD) related HCC show higher methylation levels of FLCN and WDR6, and lower methylation levels of MAML3, TRIM4, PRC1, TUBA1B, and WHSC1 in tissue compared to patients with hepatitis B virus (HBV) or/and hepatitis C virus (HCV) infection and HCC [11,12]. An unsupervised hypermethylation clustering study identified that PAX6 was more frequently hypermethylated in HCV-related HCC than in HBV-related HCC [13].
Multiple studies have shown cancer-specific aberrant DNA methylation in the peripheral blood of patients with breast, ovarian, colon, and prostate cancers. The studies suggested the application of analysis of buffy coats for understanding the mechanism of cancer progression [14,15,16,17,18,19,20,21]. DNA methylation profiles in peripheral blood mononuclear cells (PBMCs), leukocytes, or white blood cells (WBC) of patients with chronic HBV seemed different in those with liver cirrhosis or HCC. The differentially methylated promoters are associated with the progression of
HBV-related liver disease [22,23]. Prospective studies have shown that the methylation pattern in PBMCs or WBCs of HCC patients changes before clinical symptoms appear and is linked to immune-related mechanisms [24,25,26,27]. The DNA methylation profiles are affected by the cell-type compositions. The development of liver cancer in cirrhosis may involve changes in different cell types. However, studies of the DNA methylation patterns related to the progression from cirrhosis to HCC were limited to CpG sites in BeadChip 450K and remain unexplored in buffy coats.
In this study, we performed a genome-wide DNA methylation profiling in buffy coats for cirrhosis patients who developed HCC and cirrhosis patients who remained HCC-free during an average 4-year follow-up. We then identified differentially methylated sites using Illumina Infinium MethylationEPIC BeadChips, which covers over 850K CpG sites distributed genomewide. In addition, we evaluated the cell type-specific enrichment and pathway enrichment analysis to investigate the biological functions of the differentially methylated sites.
2. Materials and Methods
2.1. Patient Recruitment and Sample Collection
In the current study, we used baseline pre-diagnostic samples from 22 cirrhosis patients who subsequently developed HCC (HCC group) and baseline samples from 22 gender- and age-matched cirrhosis patients who remained cancer-free (Cirrhosis group) during an average 4-year follow-up (ranging from 1.4 to 5.9 years) from the Texas Hepatocellular Carcinoma Consortium (THCCC) cohort. We excluded samples from the patients who followed for less than one year to limit potential time-related biases. Patients’ body mass index (BMI), age, race, smoking habits, diabetes, and pre-existing liver disease history were collected from electronic medical records.
Patients with cirrhosis in the THCCC cohort were recruited from the Baylor St. Luke’s Medical Center and Michael E. DeBakey VA Medical Center in Houston between 1/4/2017 and 1/16/2019. Every 6-month follow-up was performed as part of clinical HCC surveillance. All participants provided written informed consent to participate. At the time of enrollment and blood collection, none of the participants had HCC. Whole blood samples were collected into EDTA tubes and underwent refrigerated centrifugation (4°C 1300xg) for 10 mins to isolate buffy coat samples and then subsequently shipped to the Population Sciences Biorepository Core at Baylor College of Medicine to extract DNA. This study was conducted in accordance with the Declaration of Helsinki, and the protocol was approved by the Institutional Review Board at Baylor College of Medicine.
2.2. DNA Extraction and Bisulfite Conversion
DNA was extracted within five days of initial collection, and samples were frozen at -80°C until analysis. DNA was extracted from the 400 µL of buffy coats using the Qiagen Qiacube and the QIAamp DNA blood mini qiacube kit (cat no: 51126) according to the manufacturer’s instructions (Qiagen; Venlo, The Netherlands). DNA purity and concentration were estimated using a Quibt3.0 fluorometer (Thermo Fisher Scientific; Waltham, MA, USA). 500ng of DNA was treated with sodium bisulfite using EZ-96 DNA Methylation Kit accruing to the manufacturer’s protocol (Zymo Research; Irvine, CA, USA) at the University of Texas Health Science Center at Houston, School of Public Health, Human Genetic Center Laboratory.
2.3. DNA Methylation Quality Control and Data Processing
Genome-wide methylation analysis using Infinium MethylationEPIC BeadChips (Illumina,
Inc.: San Diego, CA, USA) was performed according to the manufacturer’s protocol [28]. The BeadArray Controls Reporter tool (Illumina, Inc., San Diego, CA) was used to assess laboratory- or chemistry-related failures. All samples included in the analysis had a call rate > 99%. Genders were confirmed, and values clustered as expected after performing a principal component analysis of using the wateRmelon R package (4.3.2) [29]. Median methylated/unmethylated (M/U) signals were reviewed, and no issues were detected.
The Chip Analysis Methylation Pipeline (ChAMP) methylation analysis package was used in R (4.3.2) [30]. The probes that targeted the sex chromosomes, with < 3 beads in at least 5% of the sample per probe, aligned to multiple locations, or were associated with single nucleotide polymorphisms in the probe sequence were filtered to remove prior to analysis [31]. Beta values (β ranging from 0 - 1) were normalized using the beta mixture quantile dilation (BMIQ) algorithm to remove type1 and type 2 probe bias [32]. The wateRmelon and ChAMP packages are available from Bioconductor (https://www.bioconductor.org).
The normalized β values were corrected for the proportions of different cell types except the lowest average cell type proportion. FlowSorted.Blood.EPIC package of R (4.3.2) was used to estimate the cell type proportions of each of the major cell types present in the blood (B-cell, CD8+ T cell, CD4+ T cell, natural killer lymphocytes, monocytes, and neutrophils) [33]. We ran Singular Value Decomposition (SVD) regression analysis to estimate the impact of the following covariates: array, plate, well, age, sex, diabetes, smoking, alcohol consumption, hypertension, BMI, and etiology of liver disease on HCC prognosis and then adjusted for the covariates with pvalues < 0.05 using ChAMP.runCombat function. CpG sides were annotated using EPICanno.ilm10b4.hg19.
2.4. Differentially Methylated Positions (DMPs)
DMPs were identified as CpG sites with Benjamini–Hochberg adjusted p-value (q-value) < 0.05 by using ChAMP.DMP function, which implements the limma package [34,35]. The DMPs were classified into their location relative to their genomic regions: promoter, 3′-UTR (3′untranslated region), gene body, exon boundary, and intergenic region. The promoter region was divided into 1st Exon, 5′-UTR (5′-untranslated region), TSS 1500 (within 1,500 bp upstream of the transcription start site), TSS200 (within 200 bp upstream of the transcription start site). The DMPs were also classified by distance from the CpG islands: CpG island, shore, shelf, and open sea.
2.5. Gene Set Enrichment Analysis
To clarify the biological functions of the genes and the signaling pathways involved, we annotated each gene associated with the DMPs and performed gene set enrichment analysis. The Kyoto Encyclopedia of Genes and Genomes (KEGG) pathway enrichment analysis was performed using ShinyGO 0.8 (http://bioinformatics.sdstate.edu/go) [36].
2.6. Identification of DMPs to Distinguish Cirrhosis with HCC from Cirrhosis Without HCC
To identify the most important and specific DNA methylation sites for subjects who progressed to HCC, we restricted the analysis to DMPs that had a q-value < 0.05 and an absolute difference of β values between HCC and cirrhosis groups of (Δ β HCC group – Cirrhosis group) ≥ 0.15. We also identified highly associated DMPs with HCC prognosis based on the importance scores (> 0.1) from a 5-fold cross-validation random forest (RF) analysis. Random Forest (RF) is a machine-learning methodology that employs an ensemble of decision trees, in which a random set of cases and controls, as well as a random set of features, is selected. It applies the optimal tree developed on a set of features and observations based on the observations that were not studied in a particular sample of the data. Each feature is ranked by ordering the importance score, which indicates how much of a decrease in prediction accuracy occurs when a variable is not included in a classification tree that is fitted as a part of random forest analysis. Caret R package v6.0.94 was used to perform the RF model [37]. To rank the DMPs and covariates (age, sex, alcohol consumption, smoking behavior, hypertension, BMI, cirrhosis etiology at baseline) according to how they affect the model predictions (importance score), we used varImp function.
In addition, we examined the association of the β values of the selected DMPs, and covariates with the risk of HCC using univariate Cox proportional hazard regression using survival R package v 3.7 [38]. The patients were grouped into two groups according to the β values for each DMP: high (β value was higher than the median methylation level of the individual DMP) and low (β value was lower than the median methylation level of the individual DMP). HCV infection is a well-known risk factor for inflammation in the liver, which can cause cirrhosis and HCC, as well as aberrant methylation patterns [39,40,41,42]. Thus, we conducted a secondary analysis stratified by HCV status at enrolment.
3. Results
3.1. Patient and Tumor Characteristics
A total of 44 samples from 44 unique patients (22 HCC group and 22 cirrhosis group) were used for DNA methylation profiling. Of the patients, 72% were male, with a median age of 64 years (range 48-72 years) at baseline. HCV was the underlying etiology for over half (54.5%) of patients. The characteristics of the patients are shown in Table 1.
3.2. Genome-Wide DNA Methylation Landscape of HCC in Buffy Coats
Figure 1A shows an overview of the study design. After filtering out the low-quality probes, we identified 742,949 methylated CpG sites. The median methylation levels across all CpG sites in buffy coats for HCC and cirrhosis groups were 0.724 and 0.727, respectively (Figure 1B). Figure
1C shows principal component analysis (PCA) based on the normalized β values of each CpG site.
Figure 1.
Genome-wide DNA methylation landscape in buffy coat of cirrhosis patients. A) Flow chart of samples and analysis. B) Average methylation levels of all CpG sites in buffy coat DNA after filtering out the probes targeting the sex chromosomes, probes aligning to multiple locations, and probes with single nucleotide polymorphisms in the probe sequence (Median beta values of HCC group=0.724 and Cirrhosis group=0.727, Wilcoxon rank sum test p-value > 0.05). C) Principal Component Analysis (PCA) performed using all CpG sites. Each dot represents an individual sample and is shown in different colors; purple dots, cirrhosis patients with HCC cancer; yellow dots, cirrhosis patients without HCC cancer. D) Cell-type proportions of B-cell, CD8+ T cell, CD4+ T cell, natural killer lymphocytes, monocytes, and neutrophils between cirrhosis patients with HCC (HCC group) and without HCC (cirrhosis group). E) Volcano plot of differentially methylated probes (DMPs) with adjusted p-value < 0.05 (Benjamini–Hochberg). Purple, significant DMPs with Δ β ≥ 0.15; Orange, significant DMPs Δ β - 0.15, Grey, DMPs with | Δ β ≥ 0.15|. F) Distribution of DMPs by the location relative to their genomic regions: gene body, 3′-UTR (3′-untranslated region), intergenic region, exon boundary, TSS1500 (within 1,500 bp upstream of the transcription start site), TSS200 (within 200 bp upstream of the transcription start site), 5′-UTR (5′-untranslated region.
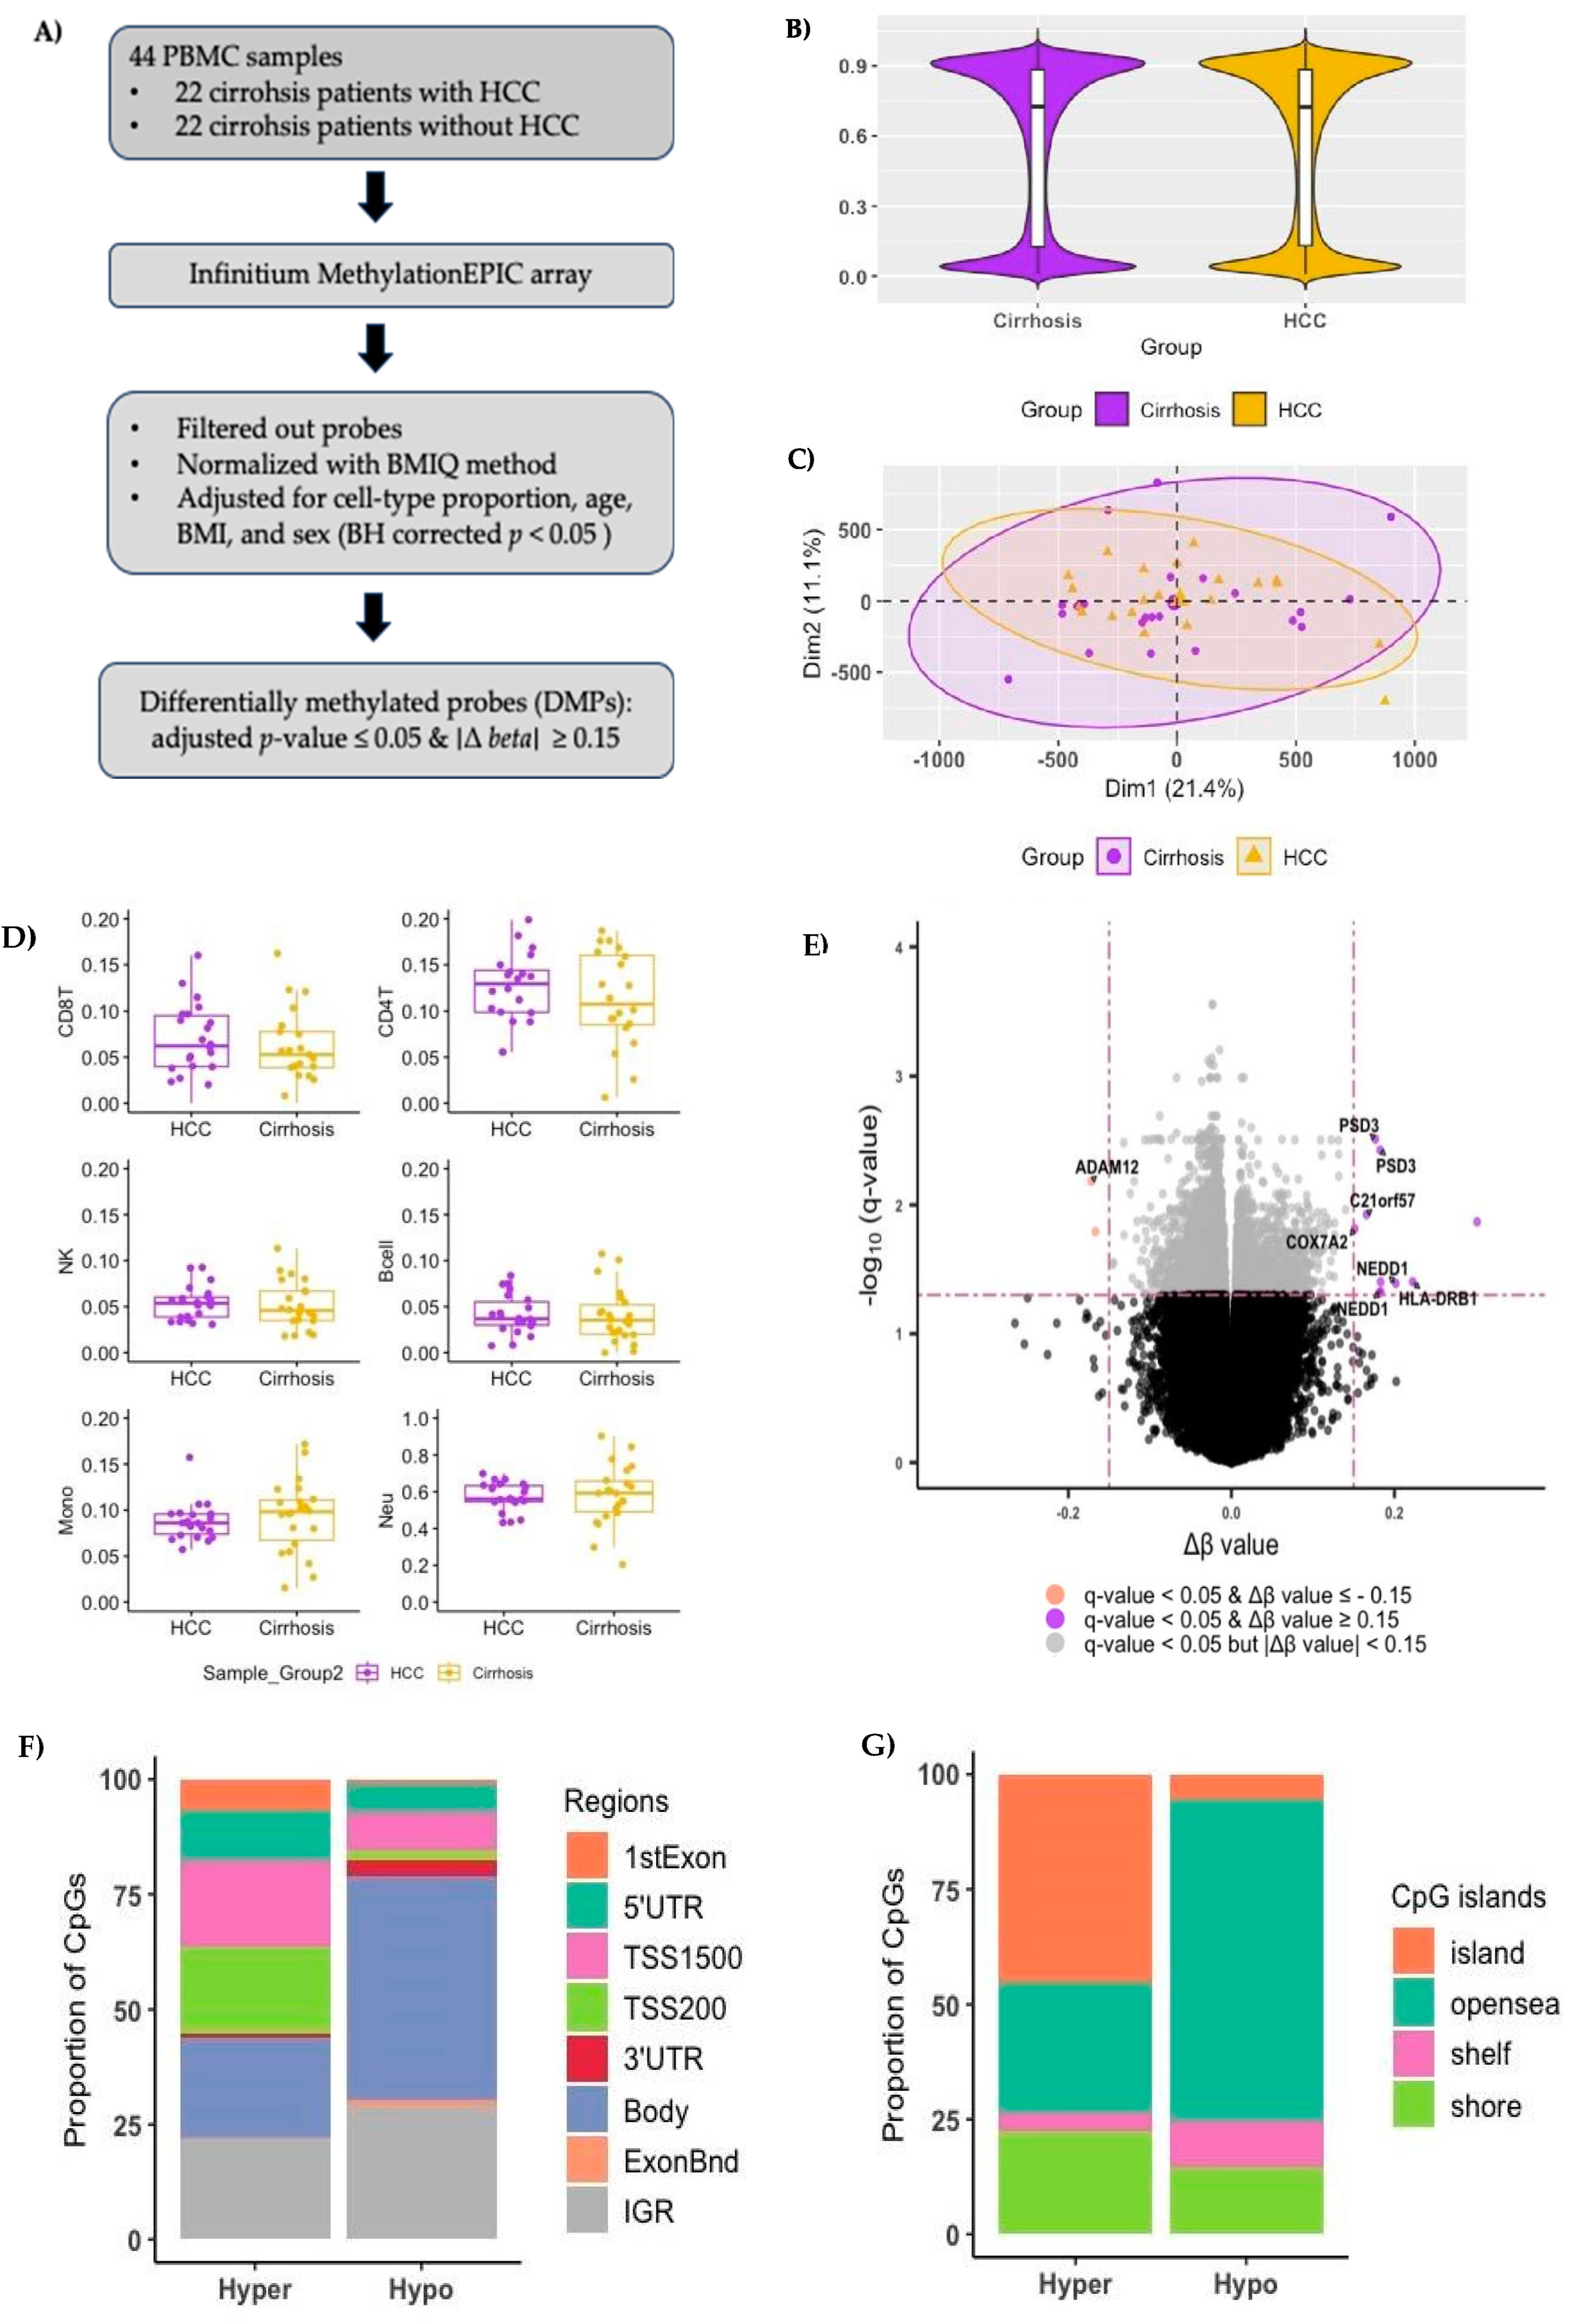
The median proportions of CD8 T cells, CD4 T cells, natural killer lymphocyte cells, and B-cells in HCC patients were numerically higher than those in cirrhosis patients, but the p-values based on the Wilcox rank sum test were > 0.05 (Figure 1D). The B-cell had the smallest cell proportion in both the HCC and cirrhosis groups. Thus, the normalized β values were corrected for the cell types excluding B-cell and significant covariates (plate, sex, and BMI) by linear regression method.
We identified 8,802 DMPs, which (Δ β HCC group – Cirrhosis group) ≥ 0.15, in a total of 6,410 genes (Figure 1E), among which 2,342 were hypermethylated (hyper-DMPs: Δ β HCC group – Cirrhosis group ≥
0.15) in 1,828 genes, and 6,460 were hypomethylated (hypo-DMPs: Δ β HCC group – Cirrhosis group ≤ - 0.15) in 4,582 genes in patients with HCC (Supplementary Table 1). Classification of DMPs according to their location relative to genomic regions revealed that the largest proportion of hypoDMPs were located in the gene bodies and intergenic regions (IGR)compared to hyper-DMPs (Figure 1F). Most hyper-DMPs were located in the promoter regions that regulate gene transcription. Figure 1G shows the proportion of DMPs in opensea was the largest in hypo-DMPs while the CpG island was the largest in hyper-DMPs (Figure 1G).
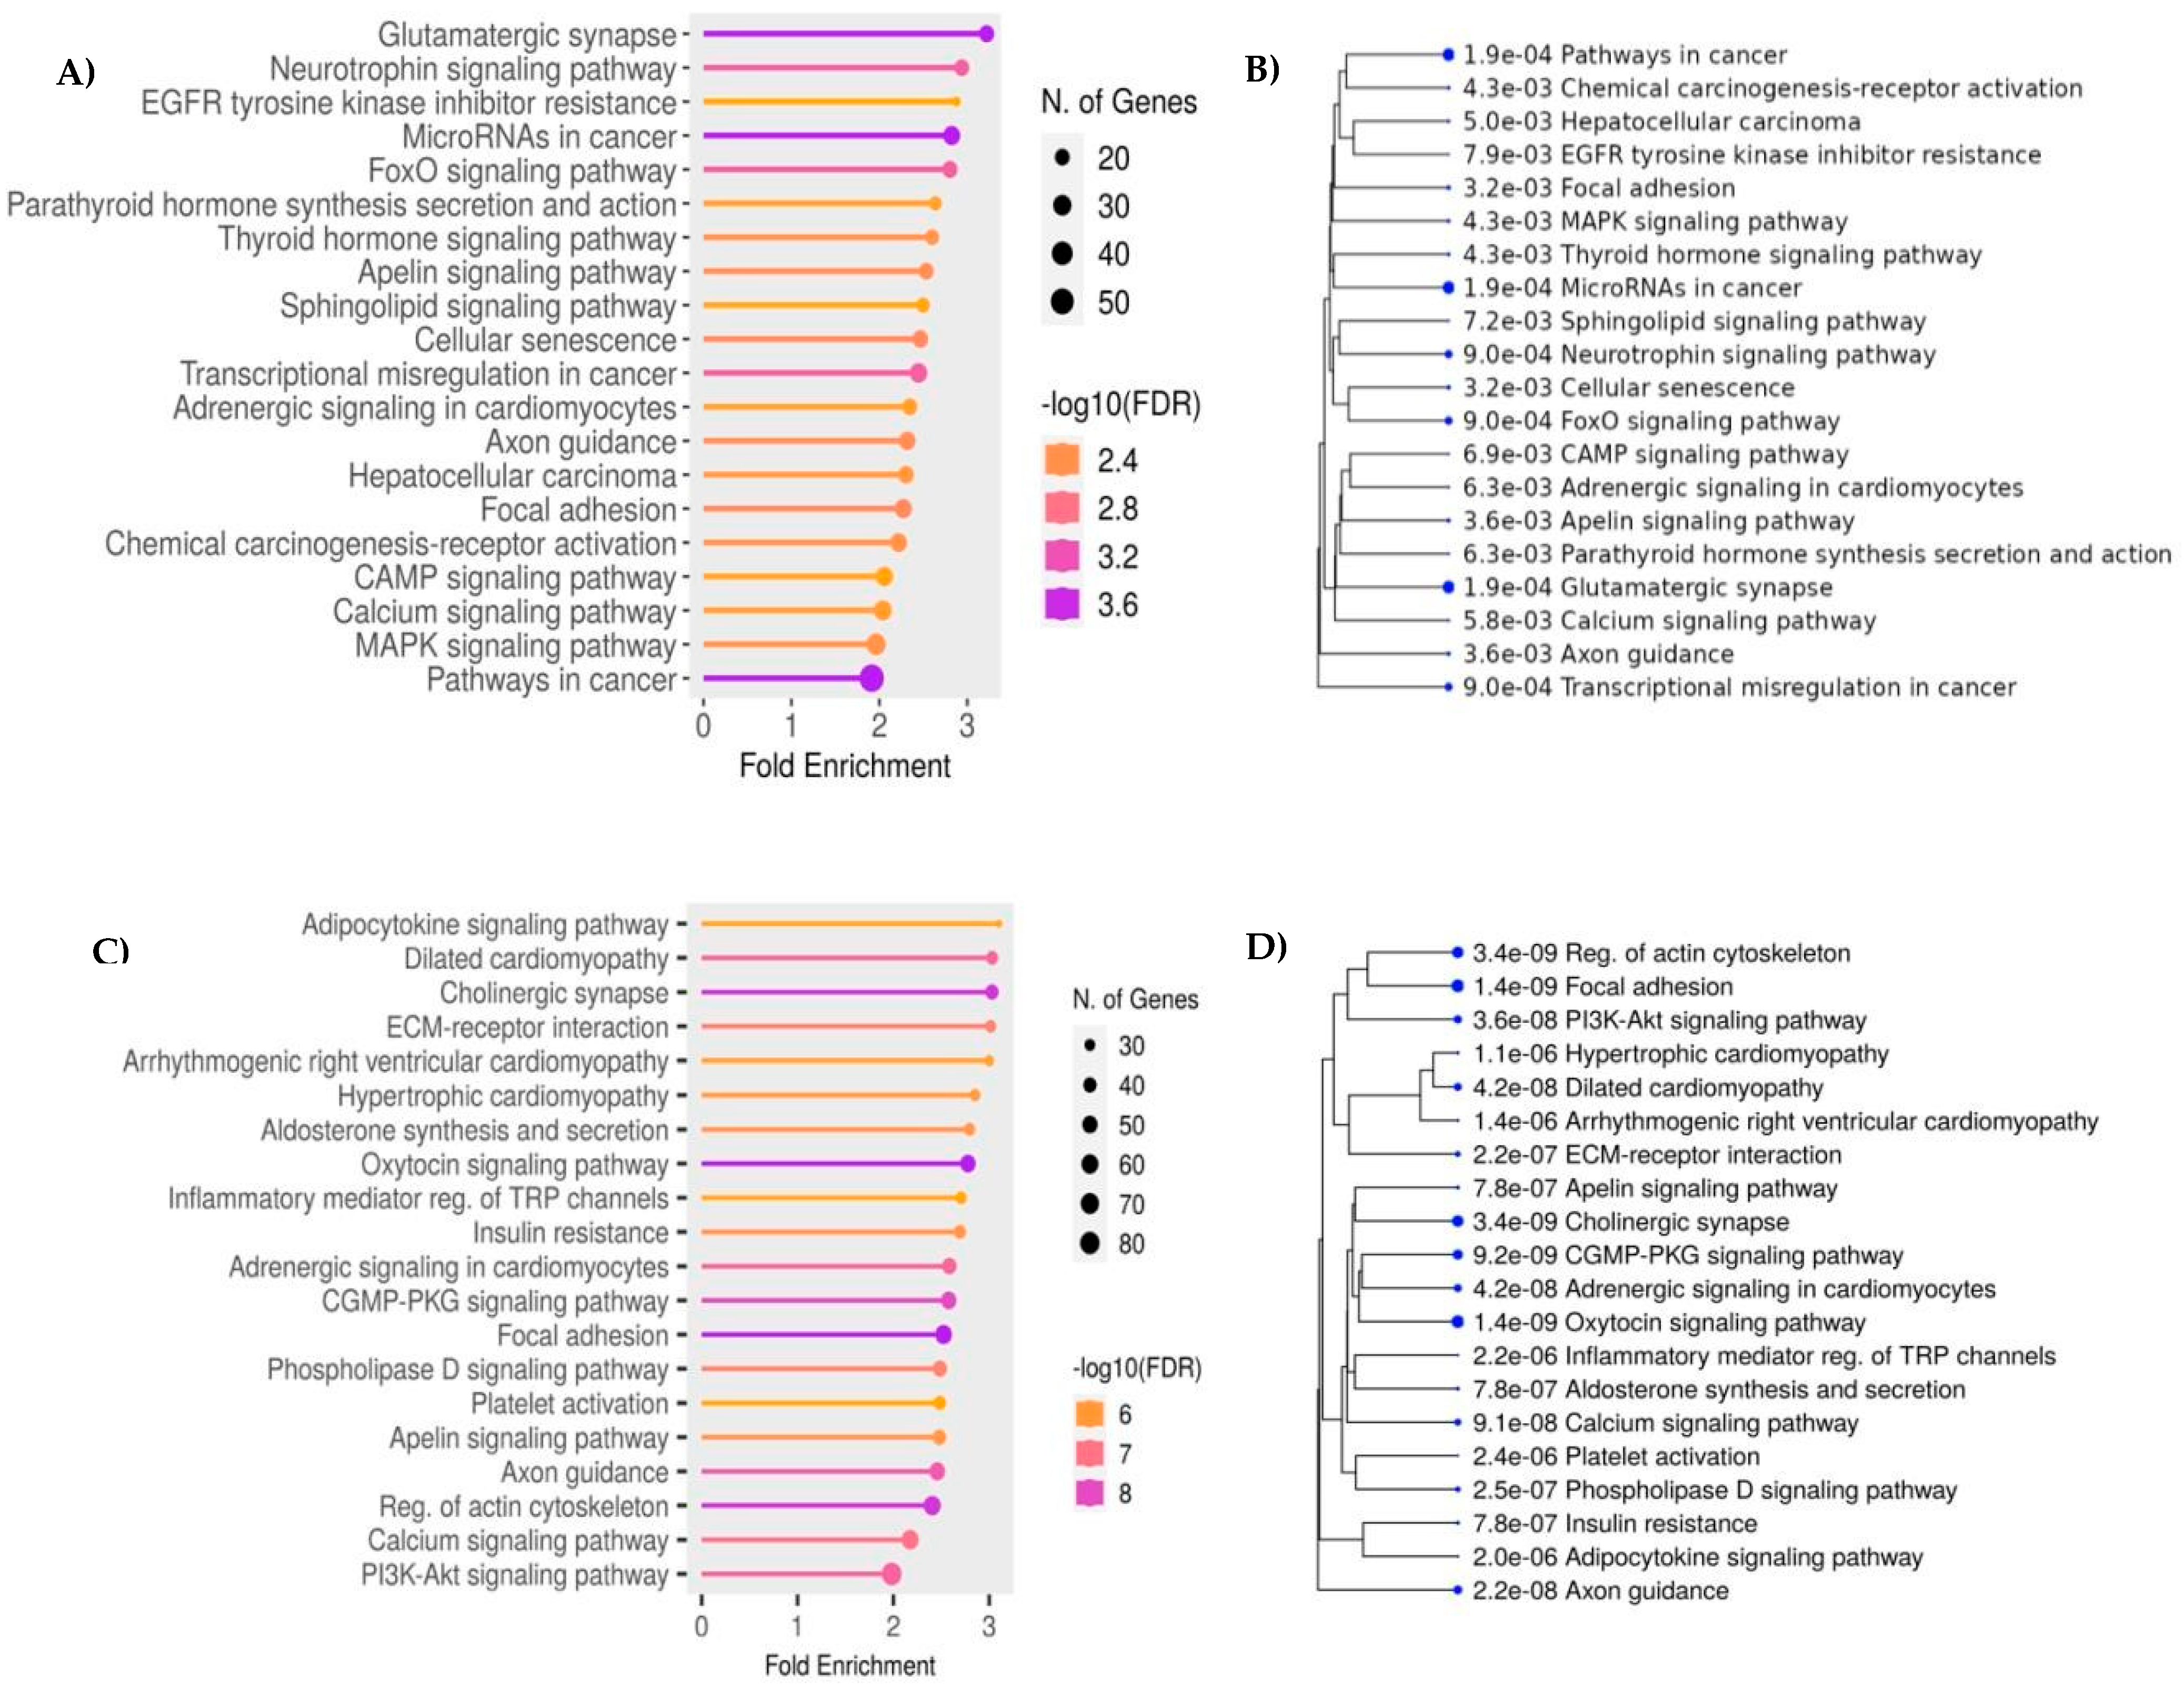
KEGG enrichment analysis showed that hyper-DMPs were mainly enriched in cancer pathways, and pathways associated with the dysregulation of gene expression such as neurotrophin signaling pathway, apelin signaling pathway, and mitogen-activated protein kinase (MAPK) signaling pathway (Figure 2A). Genes associated with hypo-DMPs were also enriched in the pathways related to cancer progress (Oxytocin signaling, GMP-protein kinase G (PKG) signaling, apelin signaling, and PI3K-Akt signaling) (Figure 2B)
.distance from CpG island. patients
Figure 2.
KEGG (Kyoto Encyclopedia of Genes and Genomes) Enrichment analysis of genes Functional analysis of differentially methylated probes (DMPs) A) The potential pathways associated with genes corresponding to hyper-DMPs between HCC cases and cirrhosis controls. B) A hierarchical clustering tree summarizes the correlation among significant pathways related to the hyper-DMPs. Pathways with many shared genes are clustered together. Bigger dots indicate more significant P-values. The width of the plot can be changed by adjusting the width of your browser window. C) The potential pathways associated with genes corresponding to hypo-DMPs between HCC cases and cirrhosis controls. D) A hierarchical clustering tree summarizes the correlation among significant pathways related to the hypoDMPs. .
3.3. Identification of Significant DNA Markers
We identified 5 DMPs in four genes (PSD3, GRB10, RGL1, and BLCAP) with an importance score > 0.1. Twelve significant DMPs were screened according to the β values-based threshold (Δ β ≥ 0.15), including ten significantly hyper-DMPs and two significantly hypo-DMPs, corresponding to 8 known genes (PSD3, ADAM12, C21orf57, COX7A2, HLA-DRB1, and NEDD1) (Supplementary Table 2). Two out of the 10 significant hyper-DMPs (cg25716013/ COX7A2 and cg00481382/ NEDD1) were within the TSS1500, and 5′-UTR, respectively (Supplementary Table
1). cg24595678 in PSD3 was detected as a significant DMP based on the importance score and the
Δ β values.
3.4. Association of the Selected DMPs with HCC Prognosis from Cirrhosis
Figure 3 shows the hazard ratios (HRs) for HCC compared to cirrhosis by β value (reference: lower than the median) of the 16 DMPs. HRs were statistically significant for 11 DMPs (9 hyperDMPs and 2 Hypo DMPs) (Figure 3, and Supplementary Table 1; four of these DMPs are newly included CpG sites in the 850K array (cg09743635/RGL1, cg13674437/ADAM12, cg06758847/PSD3, cg24595678/PSD3).
3.5. DNA Methylation Landscape Of Buffy Coat Excluding the Hepatitis C Virus (HCV) Active Cases at Baseline
We conducted a sensitivity analysis by excluding the six patients with HCV active cirrhosis etiology (2 from the HCC group and four from the cirrhosis group). We identified 740,917 methylated CpG sites, and the median methylation levels of all CpG sites for HCC and cirrhosis groups were 0.725 and 0.727, respectively. The proportions of neutrophils remained the highest, while B-cells were the lowest.
After adjusting the β values for CD8+ T cell, CD4+ T cell, natural killer lymphocytes, monocytes, neutrophils, and significant covariates (plate, sex, and BMI) by linear regression method, we identified 11,680 DMPs in a total of 8,614 genes, among which, 3,173 CpG sites were hypermethylated (hyper-DMPs) in 2,401 genes, and 8,507 CpG sites were hypomethylated (hypoDMPs) in 6,213 genes in patients with HCC (Supplementary Table 2). A volcano plot was generated to visualize the DMPs (Supplementary Figure 1A). The proportion of DMPs according to their location relative to genomic regions and CpG island remained as same as previously (Supplementary Figures 1B,1C).
KEGG enrichment showed that hyper-DMPs were mainly enriched in pathways in cancer and dysregulation of gene expression, but the neurotrophin signaling pathway and apelin signaling pathway were not in the top 20 pathways. We found a new pathway that regulated metabolic processes (AMP-activated protein kinase [AMPK] signaling pathway and mammalian target of rapamycin [mTOR] signaling pathway), or cancer progress (adenylyl cyclase [cAMP] signaling pathway), and phosphoinositide 3-kinase [PI3K]/Ak PI3K-Akt phosphoinositide 3-kinase (PI3K)/AKT signaling pathway) (Supplementary Figure 1D). The insulin signaling pathway and membrane-associated kinase regulator (MAKR) was identified as main enriched pathways
Twenty-four DMPs were screened according to the threshold Δ β ≥ 0.15, including 11 significantly hyper-DMPs (Δ β ≥ 0.15) and 13 significantly hypo-DMPs (Δ β ≤ - 0.15), corresponding to 15 known genes (ADAM12, LTB4R2, STX2, PRR12, KLHL31, ELMOD1, UBAP2L, LCLAT1, LCE3C, LCLAT1, and MTUS1). We identify two DMPs (cg06758847 and cg24595678) in PSD3 based on the importance score from the RF model (Supplementary Table
2). The univariate Cox proportional hazard regression analysis was statistically significant for 10 DMPs in 6 genes (ADAM12, LTB4R2, STX2, PSD3, PRR12, and KLHL31 (Supplementary Table 2). Three DMPs of those (cg13674437/ADAM12, cg06758847/PSD3, and cg24595678/PSD3) showed statistically significant association in the primary and secondary analysis (Supplementary Table 1 and 2).
4. Discussion
We examined DNA methylation profiles in baseline buffy coats of patients with cirrhosis and identified specific methylated sites that predicted the transition from cirrhosis to HCC within the next 4 years. Most of the HCC-associated DMPs were hypomethylated DMPs (80%), the three DMPs (cg13674437/ ADAM12, cg06758847/ PSD3, and cg24595678 PSD3) shows a strong
association with progression from cirrhosis to HCC regardless of etiology.
The association between hypo-DMPs and HCC risk is consistent with a previous study of circulation cell-free DNA methylation in the plasma of HCC patients [43]. The DMP genes were enriched in the cancer pathways, such as the regulation of cancer stem cells, regulation of cell proliferation, and migration; this adds biological plausibility supporting that DNA methylation changes in relation to HCC development in buffy coats. We identified three DMPs in ADAM12 and PSD3 genes highly associated with HCC prognosis regardless of the HCV up to 4 years before the clinical symptoms.
In recent years, DNA methylation has become the basis of many biomarkers for cancer diagnosis and prognosis because they are more stable than other classes of biomarkers, such as RNA or protein-based markers. Although previous research has focused on DNA methylation in tumor tissue, recent studies have shown that the epigenetic changes in the DNA of peripheral blood can also serve as potential biomarkers for solid tumors. The three DMPs we identified in our study are related to the genes identified as HCC-related biomarkers from tissue and adjacent studies. The downregulated PSD3 by short interfering RNA reduces intracellular lipid content, resulting in an increased risk of fatty liver, inflammation, and fibrosis [44]. It has been shown to inhibit HCC cell migration and invasion in a vitro study [45]. The ADAM (a disintegrin and metalloproteinase) protein family affects cell adhesion, migration, and signal transduction, resulting in regulated cell phenotypes [46]. The ADAM12 gene has been associated with liver injury and liver cancer, suggesting a potential biomarker for liver cancer diagnosis [47].
A large Taiwanese prospective cohort study with 16 years of follow-up, in which 237 HCC cases developed, reported that the overall predictive accuracy of hypermethylated genes (CDKN2A, RASSF1A, STEAP4, TBX2, VIM, and ZNF154) in HCC tumors compared to adjacent tissues was 89% with 84% sensitivity and 94% specificity [48]. The same group also profiled prediagnostic plasma DNA methylation and identified hypermethylated TBX2 highly associated with increased HCC risk (OR=3.2, 95% confidence interval: 1.8 – 6.0) adjusting for age, HBV surface antigen (HBsAg) status, and anti-HCV status [48]. These different findings between our study and the Taiwanese study could be from different types of sources (tissue vs. buffy coat), controls (adjacent normal, HCC free, cirrhosis), or the number of probes covered between studies. The main limitation of our study is the small sample size. Therefore, the results need to be validated in large prospective study cohorts.
5. Conclusions
We identified buffy coat DNA methylation biomarkers that may be associated with HCC risk in cirrhosis using pre-diagnostic samples and compared to patients who did not develop HCC. Our findings can be leveraged to develop biomarkers for screening, surveillance, and risk stratification of HCC in patients with cirrhosis.
Supplementary Materials
The following supporting information can be downloaded at the website of this paper posted on Preprints.org.
Author Contributions
Conceptualization, Hyeyeun Lim, Christopher Amos and Aaron Thrift; Data curation, Hashem El-Serag, Michelle Luster and Megan Grove; Formal analysis, Hyeyeun Lim; Funding acquisition, Hashem El-Serag and Aaron Thrift; Methodology, Hyeyeun Lim, Jinyoung Byun and Christopher Amos; Project administration, Michelle Luster; Resources, Hashem El-Serag, Michelle Luster and Aaron Thrift; Supervision, Hashem El-Serag, Eric Boerwinkle, Christopher Amos and Aaron Thrift; Visualization, Hyeyeun Lim and Yuri Jung ; Writing – original draft, Hyeyeun Lim; Writing – review & editing, Hyeyeun Lim, Hashem El-Serag, Michelle Luster, Megan Grove, Jinyoung Byun , Yuri Jung , Younghun Han, Eric Boerwinkle, Christopher Amos and Aaron Thrift.All authors will be updated at each stage of manuscript processing, including submission, revision, and revision reminder, via emails from our system or the assigned Assistant Editor.
Funding
This research was supported in part by a grant from the Cancer Prevention and Research Institute of Texas (CPRIT) for the Systems Epidemiology of Cancer Training (SECT) Program (RP210037). The Texas Hepatocellular Carcinoma Consortium (THCCC) is supported by CPRIT (RP150587, RP190641, RP220119) and the NCI (CA263025, CA230997). Patient blood samples were stored and processed at the Population Sciences Biorepository core at Baylor College of Medicine with funding from the National Cancer Institute (P30 Cancer Center Support Grant CA125123).
Data Availability Statement
All analyses were performed in RStudio version 4.3.2 for data wrangling and visualization. Data available within the article or its supplementary materials. Further information is available on request from the authors.
Conflicts of Interest
The authors declare no conflicts of interest.
References
- Bray, F.; Laversanne, M.; Sung, H.; Ferlay, J.; Siegel, R.L.; Soerjomataram, I.; Jemal, A. Global Cancer Statistics 2022: GLOBOCAN Estimates of Incidence and Mortality Worldwide for 36 Cancers in 185 Countries. CA Cancer J Clin 2024, 74, 229–263. [Google Scholar] [CrossRef]
- Siegel, R.L.; Miller, K.D.; Wagle, N.S.; Jemal, A. Cancer Statistics, 2023. CA Cancer J Clin 2023, 73, 17–48. [Google Scholar] [CrossRef]
- Lee, Y.; Wang, J.; Luu, M.; … M.N.-… the N.C.; 2021, undefined The Mortality and Overall Survival Trends of Primary Liver Cancer in the United States. academic.oup.com.
- Li, Y.; Fan, Z.; Meng, Y.; Liu, S.; Zhan, H. Blood-Based DNA Methylation Signatures in Cancer: A Systematic Review. Biochim Biophys Acta Mol Basis Dis 2023, 1869. [Google Scholar] [CrossRef] [PubMed]
- Van Tongelen, A.; Loriot, A.; De Smet, C. Oncogenic Roles of DNA Hypomethylation through the Activation of Cancer-Germline Genes. Cancer Lett 2017, 396, 130–137. [Google Scholar] [CrossRef] [PubMed]
- Friso, S.; Udali, S.; Guarini, P.; Pellegrini, C.; Pattini, P.; Moruzzi, S.; Girelli, D.; Pizzolo, F.; Martinelli, N.; Corrocher, R.; et al. Global DNA Hypomethylation in Peripheral Blood Mononuclear Cells as a Biomarker of Cancer Risk. Cancer Epidemiology Biomarkers and Prevention 2013, 22, 348–355. [Google Scholar] [CrossRef]
- Fu, S.; Debes, J.D.; Boonstra, A. DNA Methylation Markers in the Detection of Hepatocellular Carcinoma. Eur J Cancer 2023, 191. [Google Scholar] [CrossRef]
- Shen, J.; Wang, S.; Zhang, Y.J.; Kappil, M.; Wu, H.C.; Kibriya, M.G.; Wang, Q.; Jasmine, F.; Ahsan, H.; Lee, P.H.; et al. Genome-Wide DNA Methylation Profiles in Hepatocellular Carcinoma. Hepatology 2012, 55, 1799–1808. [Google Scholar] [CrossRef] [PubMed]
- Matsushita, J.; Suzuki, T.; Okamura, K.; Ichihara, G.; Nohara, K. Identification by TCGA Database Search of Five Genes That Are Aberrantly Expressed and Involved in Hepatocellular Carcinoma Potentially via DNA Methylation Changes. Environ Health Prev Med 2020, 25. [Google Scholar] [CrossRef] [PubMed]
- Hernandez-Meza, G.; von Felden, J.; Gonzalez-Kozlova, E.E.; Garcia-Lezana, T.; Peix, J.; Portela, A.; Craig, A.J.; Sayols, S.; Schwartz, M.; Losic, B.; et al. DNA Methylation Profiling of Human Hepatocarcinogenesis. Hepatology 2021, 74, 183–199. [Google Scholar] [CrossRef]
- Tian, Y.; Arai, E.; Makiuchi, S.; Tsuda, N.; Kuramoto, J.; Ohara, K.; Takahashi, Y.; Ito, N.; Ojima, H.; Hiraoka, N.; et al. Aberrant DNA Methylation Results in Altered Gene Expression in Non-Alcoholic Steatohepatitis-Related Hepatocellular Carcinomas. J Cancer Res Clin Oncol 2020, 146, 2461–2477. [Google Scholar] [CrossRef] [PubMed]
- Kuramoto, J.; Arai, E.; Tian, Y.; Funahashi, N.; Hiramoto, M.; Nammo, T.; Nozaki, Y.; Takahashi, Y.; Ito, N.; Shibuya, A.; et al. Genome-Wide DNA Methylation Analysis during Non-Alcoholic Steatohepatitis-Related Multistage Hepatocarcinogenesis: Comparison with Hepatitis Virus-Related Carcinogenesis. Carcinogenesis 2017, 38, 261–270. [Google Scholar] [CrossRef] [PubMed]
- Shih, Y.L.; Kuo, C.C.; De Yan, M.; Lin, Y.W.; Hsieh, C.B.; Hsieh, T.Y. Quantitative Methylation Analysis Reveals Distinct Association between PAX6 Methylation and Clinical Characteristics with Different Viral Infections in Hepatocellular Carcinoma. Clin Epigenetics 2016, 8. [Google Scholar] [CrossRef] [PubMed]
- Li, Y.; Fan, Z.; Meng, Y.; Liu, S.; Zhan, H. Blood-Based DNA Methylation Signatures in Cancer: A Systematic Review. Biochim Biophys Acta Mol Basis Dis 2023, 1869. [Google Scholar] [CrossRef]
- Wang, T.; Li, P.; Qi, Q.; Zhang, S.; Xie, Y.; Wang, J.; Liu, S.; Ma, S.; Li, S.; Gong, T.; et al. A Multiplex Blood-Based Assay Targeting DNA Methylation in PBMCs Enables Early Detection of Breast Cancer. Nat Commun 2023, 14. [Google Scholar] [CrossRef] [PubMed]
- Mehdi, A.; Cheishvili, D.; Arakelian, A.; Bismar, T.A.; Szyf, M.; Rabbani, S.A. DNA Methylation Signatures of Prostate Cancer in Peripheral T-Cells. BMC Cancer 2020, 20. [Google Scholar] [CrossRef] [PubMed]
- Arayataweegool, A.; Srisuttee, R.; Mahattanasakul, P.; Tangjaturonsasme, N.; Kerekhanjanarong, V.; Kitkumthorn, N.; Mutirangura, A. Head and Neck Squamous Cell Carcinoma Drives Long Interspersed Element-1 Hypomethylation in the Peripheral Blood Mononuclear Cells. Oral Dis 2019, 25, 64–72. [Google Scholar] [CrossRef] [PubMed]
- Huang, W.Y.; Su, L.J.; Hayes, R.B.; Moore, L.E.; Katki, H.A.; Berndt, S.I.; Weissfeld, J.L.; Yegnasubramanian, S.; Purdue, M.P. Prospective Study of Genomic Hypomethylation of Leukocyte DNA and Colorectal Cancer Risk. Cancer Epidemiology Biomarkers and Prevention 2012, 21, 2014–2021. [Google Scholar] [CrossRef] [PubMed]
- Flanagan, J.M.; Munoz-Alegre, M.; Henderson, S.; Tang, T.; Sun, P.; Johnson, N.; Fletcher, O.; dos Santos Silva, I.; Peto, J.; Boshoff, C.; et al. Gene-Body Hypermethylation of ATM in Peripheral Blood DNA of Bilateral Breast Cancer Patients. Hum Mol Genet 2009, 18, 1332–1342. [Google Scholar] [CrossRef] [PubMed]
- Chung, F.F.L.; Maldonado, S.G.; Nemc, A.; Bouaoun, L.; Cahais, V.; Cuenin, C.; Salle, A.; Johnson, T.; Ergüner, B.; Laplana, M.; et al. Buffy Coat Signatures of Breast Cancer Risk in a Prospective Cohort Study. Clin Epigenetics 2023, 15. [Google Scholar] [CrossRef] [PubMed]
- Widschwendter, M.; Zikan, M.; Wahl, B.; Lempiäinen, H.; Paprotka, T.; Evans, I.; Jones, A.; Ghazali, S.; Reisel, D.; Eichner, J.; et al. The Potential of Circulating Tumor DNA Methylation Analysis for the Early Detection and Management of Ovarian Cancer. Genome Med 2017, 9. [Google Scholar] [CrossRef]
- Sun, L.; Li, K.; Liu, G.; Xu, Y.; Zhang, A.; Lin, D.; Zhang, H.; Zhao, X.; Jin, B.; Li, N.; et al. Distinctive Pattern of AHNAK Methylation Level in Peripheral Blood Mononuclear Cells and the Association with HBV-Related Liver Diseases. Cancer Med 2018, 7, 5178–5186. [Google Scholar] [CrossRef]
- Zhao, Q.; Fan, Y.C.; Zhao, J.; Gao, S.; Zhao, Z.H.; Wang, K. DNA Methylation Patterns of Peroxisome Proliferator-Activated Receptor Gamma Gene Associated with Liver Fibrosis and Inflammation in Chronic Hepatitis B. J Viral Hepat 2013, 20, 430–437. [Google Scholar] [CrossRef]
- Wu, H.C.; Shen, J.; Yang, H.I.; Tsai, W.Y.; Chen, C.J.; Santella, R.M. Blood DNA Methylation Markers in Prospectively Identified Hepatocellular Carcinoma Cases and Controls from Taiwan. World J Hepatol 2016, 8, 301–306. [Google Scholar] [CrossRef] [PubMed]
- Slowly, M.; Domingo-Relloso, A.; Santella, R.M.; Haack, K.; Fallin, D.M.; Terry, M.B.; Rhoades, D.A.; Herreros-Martinez, M.; Garcia-Esquinas, E.; Cole, S.A.; et al. Blood DNA Methylation and Liver Cancer in American Indians: Evidence from the Strong Heart Study. Cancer Causes and Control 2024, 35, 661–669. [Google Scholar] [CrossRef]
- Kao, W.Y.; Yang, S.H.; Liu, W.J.; Yeh, M.Y.; Lin, C.L.; Liu, C.J.; Huang, C.J.; Lin, S.M.; Lee, S.D.; Chen, P.J.; et al. Genome-Wide Identification of Blood DNA Methylation Patterns Associated with Early-Onset Hepatocellular Carcinoma Development in Hepatitis B Carriers. Mol Carcinog 2017, 56, 425–435. [Google Scholar] [CrossRef] [PubMed]
- Lubecka, K.; Flower, K.; Beetch, M.; Qiu, J.; Kurzava, L.; Buvala, H.; Ruhayel, A.; Gawrieh, S.; Liangpunsakul, S.; Gonzalez, T.; et al. Loci-Specific Differences in Blood DNA Methylation in HBV-Negative Populations at Risk for Hepatocellular Carcinoma Development. Epigenetics 2018, 13, 605–626. [Google Scholar] [CrossRef] [PubMed]
- Martino, D.; Neeland, M.; Dang, T.; Cobb, J.; Ellis, J.; Barnett, A.; Tang, M.; Vuillermin, P.; Allen, K.; Saffery, R. Epigenetic Dysregulation of Naive CD4+ T-Cell Activation Genes in Childhood Food Allergy. Nat Commun 2018, 9. [Google Scholar] [CrossRef] [PubMed]
- Pidsley, R.; Y Wong, C.C.; Volta, M.; Lunnon, K.; Mill, J.; Schalkwyk, L.C. A Data-Driven Approach to Preprocessing Illumina 450K Methylation Array Data; 2013; Vol. 14. [CrossRef]
- Morris, T.J.; Butcher, L.M.; Feber, A.; Teschendorff, A.E.; Chakravarthy, A.R.; Wojdacz, T.K.; Beck, S. ChAMP: 450k Chip Analysis Methylation Pipeline. Bioinformatics 2014, 30, 428–430. [Google Scholar] [CrossRef]
- Zhou, W.; Laird, P.W.; Shen, H. Comprehensive Characterization, Annotation and Innovative Use of Infinium DNA Methylation BeadChip Probes. Nucleic Acids Res 2017, 45, e22. [Google Scholar] [CrossRef] [PubMed]
- Teschendorff, A.E.; Marabita, F.; Lechner, M.; Bartlett, T.; Tegner, J.; Gomez-Cabrero, D.; Beck, S. A Beta-Mixture Quantile Normalization Method for Correcting Probe Design Bias in Illumina Infinium 450 k DNA Methylation Data. Bioinformatics 2013, 29, 189–196. [Google Scholar] [CrossRef]
- Salas, L.A.; Koestler, D.C.; Butler, R.A.; Hansen, H.M.; Wiencke, J.K.; Kelsey, K.T.; Christensen, B.C. An Optimized Library for Reference-Based Deconvolution of WholeBlood Biospecimens Assayed Using the Illumina HumanMethylationEPIC BeadArray. Genome Biol 2018, 19. [Google Scholar] [CrossRef] [PubMed]
- Wettenhall, J.M.; Smyth, G.K. LimmaGUI: A Graphical User Interface for Linear Modeling of Microarray Data. Bioinformatics 2004, 20, 3705–3706. [Google Scholar] [CrossRef]
- Wettenhall, J.M.; Smyth, G.K. LimmaGUI: A Graphical User Interface for Linear Modeling of Microarray Data. Bioinformatics 2004, 20, 3705–3706. [Google Scholar] [CrossRef] [PubMed]
- Xijin Ge, S.; Jung, D.; Yao, R. ShinyGO: A Graphical Gene-Set Enrichment Tool for Animals and Plants. [CrossRef]
- Kuhn, M. Journal of Statistical Software Building Predictive Models in R Using the Caret Package; 2008. [CrossRef]
- Therneau, T. A Package for Survival Analysis in R; 2024.
- Karrar, A.; Hariharan, S.; Fazel, Y.; Moosvi, A.; Houry, M.; Younoszai, Z.; Jeffers, T.; Zheng, L.; Munkhzul, O.; Hunt, S.; et al. Analysis of Human Leukocyte Antigen Allele Polymorphism in Patients with Non Alcoholic Fatty Liver Disease. Medicine (United States) 2019, 98. [Google Scholar] [CrossRef] [PubMed]
- Aggarwal Bokyung, B.B.; Subash, S.; Gupta, C. Inflammation and Cancer; Vol. 816. [CrossRef]
- Tillmann, H.L.; Chen, D.-F.; Trautwein, C.; Kliem, V.; Grundey, A.; Berning-Haag, A.; Böker, K.; Kubicka, S.; Pastucha, L.; Stangel, W.; et al. Low Frequency of HLA-DRB1*11 in Hepatitis C Virus Induced End Stage Liver Disease. Gut 2001, 48, 714. [Google Scholar] [CrossRef]
- Lin, Y.Y.; Yu, M.W.; Lin, S.M.; Lee, S.D.; Chen, C.L.; Chen, D.S.; Chen, P.J. GenomeWide Association Analysis Identifies a GLUL Haplotype for Familial Hepatitis B Virus-Related Hepatocellular Carcinoma. Cancer 2017, 123, 3966–3976. [Google Scholar] [CrossRef]
- Hlady, R.A.; Zhao, X.; Pan, X.; Dong Yang, J.; Ahmed, F.; Antwi, S.O.; Giama, N.H.; Patel, T.; Roberts, L.R.; Liu, C.; et al. Genome-Wide Discovery and Validation of Diagnostic DNA Methylation-Based Biomarkers for Hepatocellular Cancer Detection in Circulating Cell Free DNA. Theranostics 2019, 9, 7239–7250. [Google Scholar] [CrossRef]
- Mancina, R.M.; Sasidharan, K.; Lindblom, A.; Wei, Y.; Ciociola, E.; Jamialahmadi, O.; Pingitore, P.; Andréasson, A.C.; Pellegrini, G.; Baselli, G.; et al. PSD3 Downregulation Confers Protection against Fatty Liver Disease. Nat Metab 2022, 4, 60–75. [Google Scholar] [CrossRef]
- Xu, L.; Wang, P.; Li, L.; Li, L.; Huang, Y.; Zhang, Y.; Zheng, X.; Yi, P.; Zhang, M.; Xu, M. CircPSD3 Is a Promising Inhibitor of UPA System to Inhibit Vascular Invasion and Metastasis in Hepatocellular Carcinoma. Mol Cancer 2023, 22. [Google Scholar] [CrossRef] [PubMed]
- Reiss, K.; Saftig, P. The “A Disintegrin And Metalloprotease” (ADAM) Family of Sheddases: Physiological and Cellular Functions. Semin Cell Dev Biol 2009, 20, 126–137. [Google Scholar] [CrossRef] [PubMed]
- Du, S.; Sun, L.; Wang, Y.; Zhu, W.; Gao, J.; Pei, W.; Zhang, Y. ADAM12 Is an Independent Predictor of Poor Prognosis in Liver Cancer. Sci Rep 2022, 12. [Google Scholar] [CrossRef]
- Wu, H.C.; Yang, H.I.; Wang, Q.; Chen, C.J.; Santella, R.M. Plasma DNA Methylation Marker and Hepatocellular Carcinoma Risk Prediction Model for the General Population. Carcinogenesis 2017, 38, 1021–1028. [Google Scholar] [CrossRef]
Figure 3.
Forest plot of the association of β values of the 16 DMPs and covariates with the HCC prognosis of cirrhosis patients. Hazard ratio (HR) and 95% confidence interval (CI) were derived based on univariate Cox regression models. The selected DMPs were divided into the high group (> median β value of the individual DMP) and the low group ( < median β value of the individual DMP). .
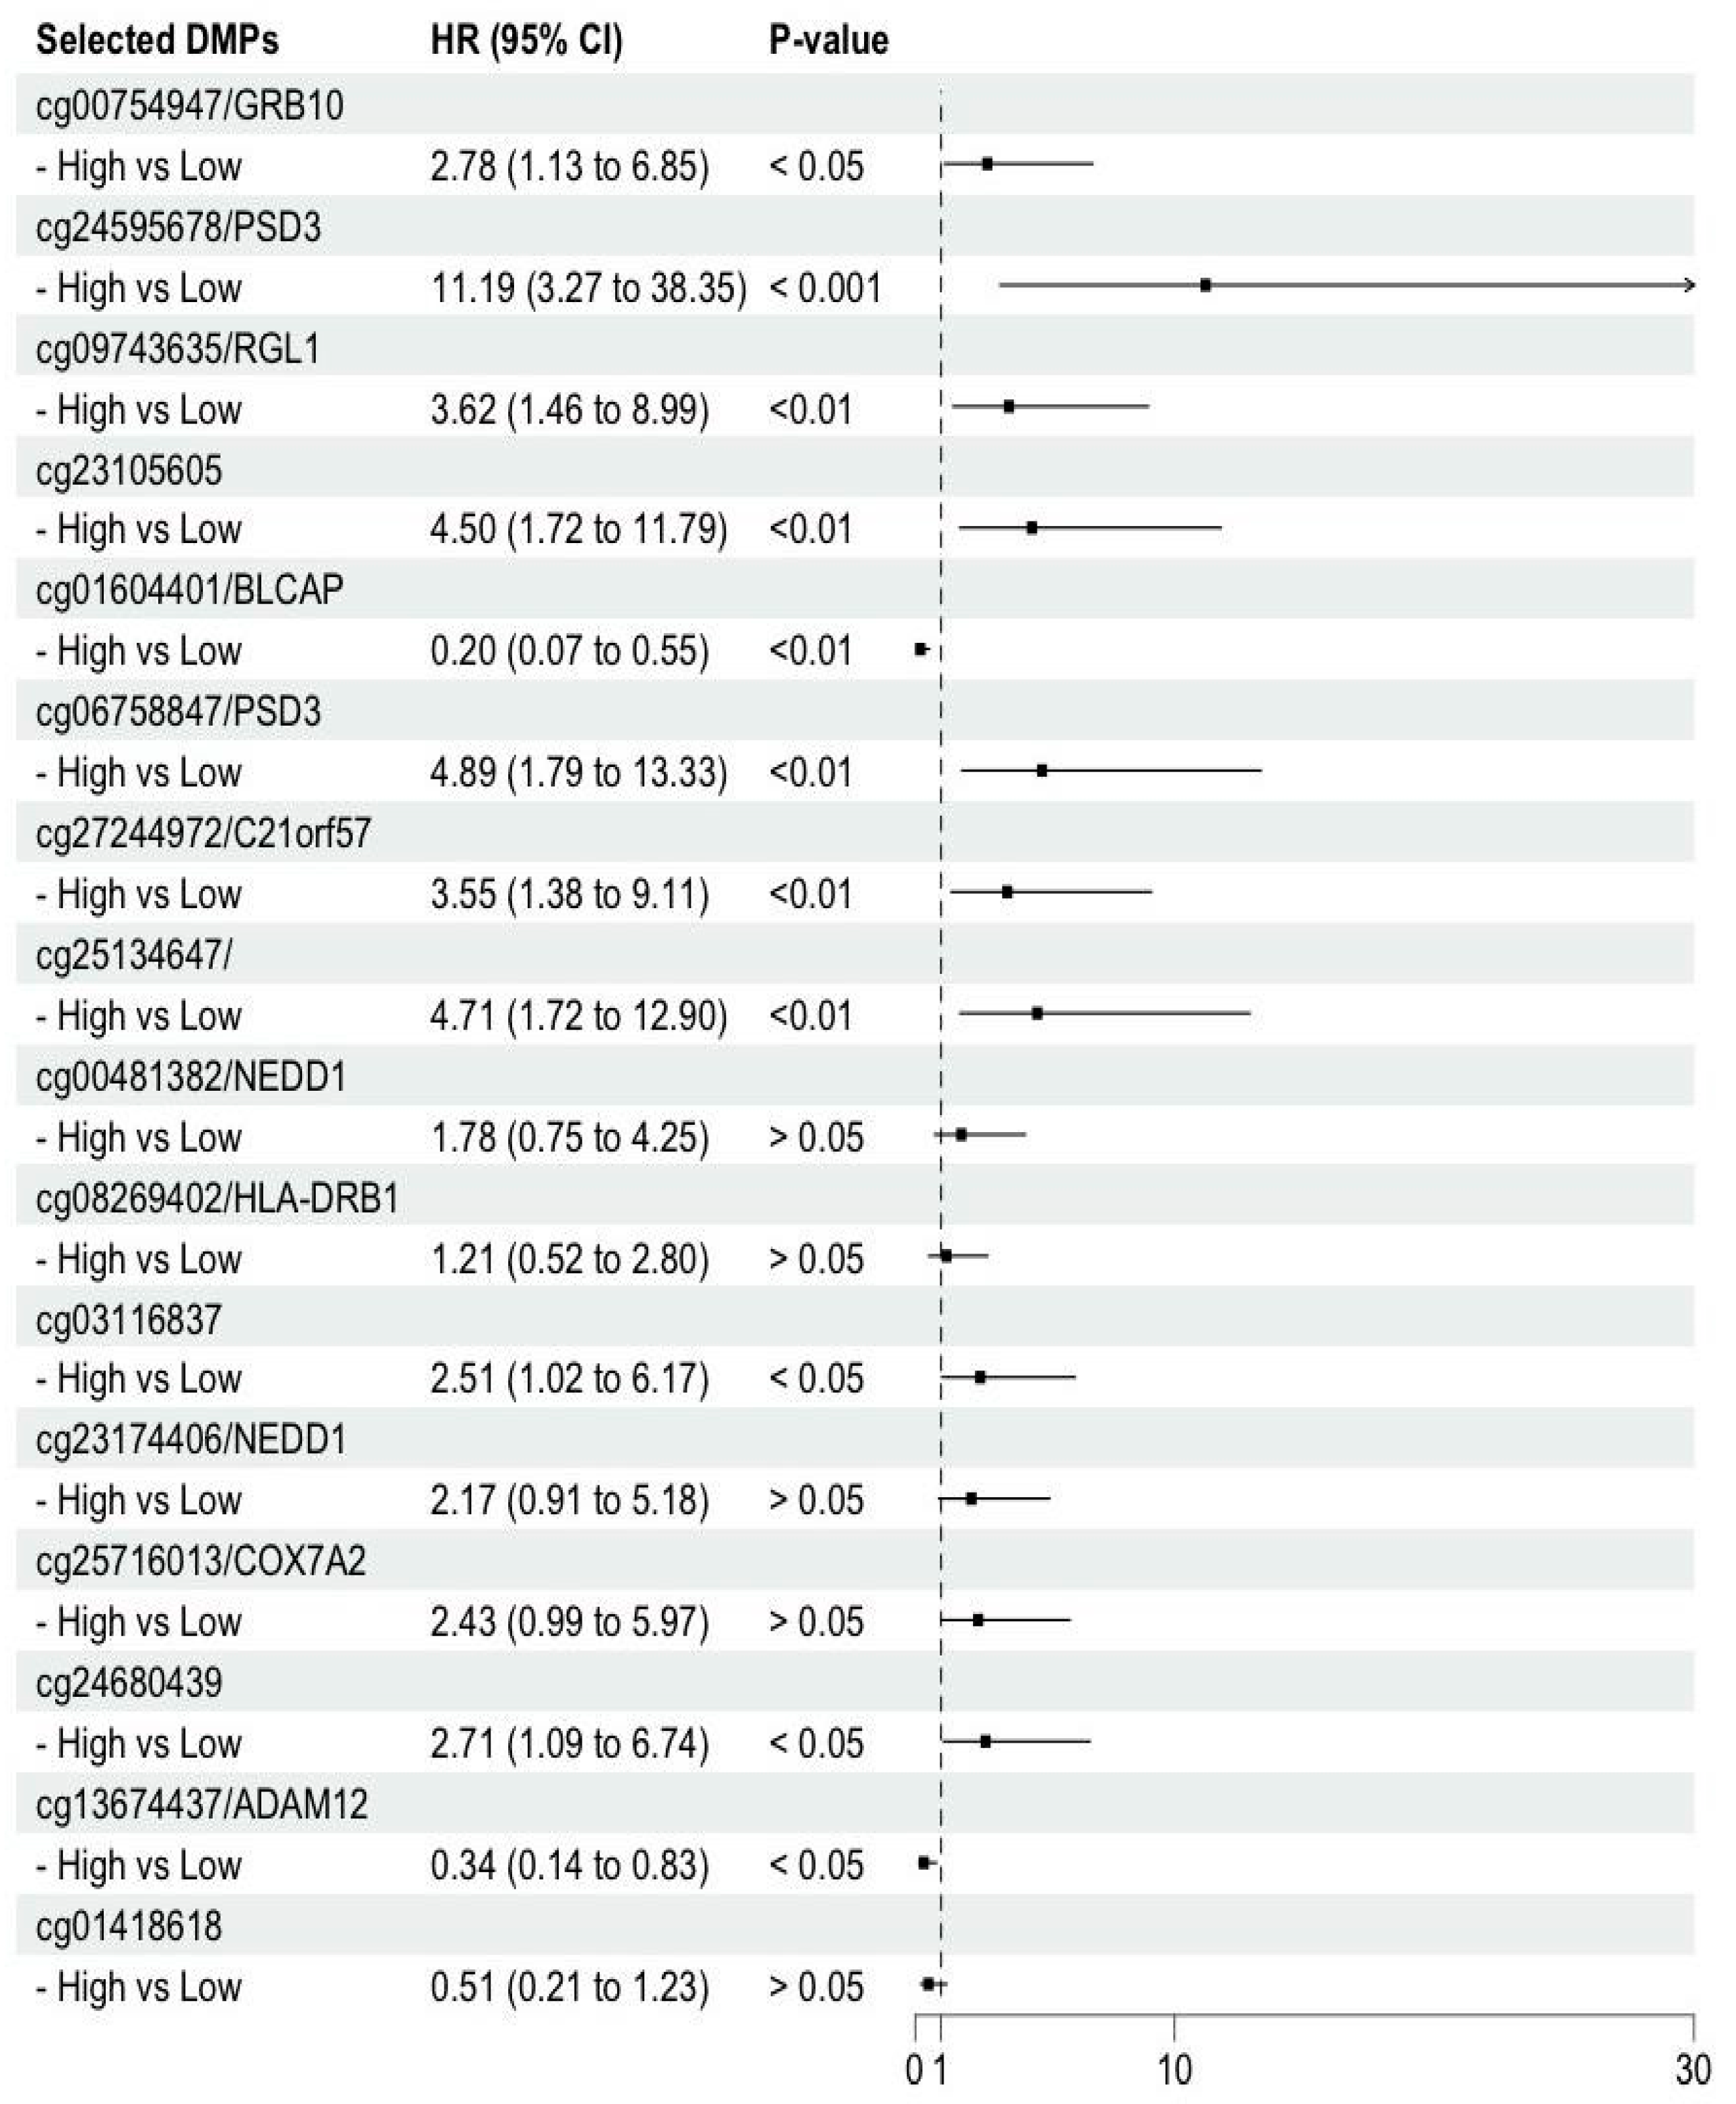

Table 1.
Clinical and pathological characteristics of patients at baseline.
| Cirrhosis with future HCC (n=22) |
Cirrhosis without HCC (n=22) |
|
|---|---|---|
| Sex | ||
| Female | 6 (27.3) | 6 (27.3) |
| Male | 16 (72.7) | 16 (72.7) |
|
Age Median (Std Dev) |
66 (6.7) | 66 (6.7) |
| Drinking Alcohol | ||
| Never | 3 (13.6) | 7 (31.8) |
| Current | 3 (13.6) | 5 (22.7) |
| Past | 16 (72.7) | 10 (45.5) |
| Cigarette smoking | ||
| Never | 5 (22.7) | 8 (36.4) |
| Current | 4 (18.2) | 6 (27.3) |
| Past | 13 (59.1) | 8 (36.4) |
|
BMI Median (Std Dev) |
30.8 (7.1) | 29.2 (6.6) |
| Etiology | ||
| NAFLD | 4 (18.2) | 7 (31.8) |
| HCV active | 2 (9.1) | 4 (18.2) |
| HCV cured | 11 (50) | 7 (31.8) |
| Alcohol-related | 3 (13.6) | 4 (18.2) |
| Others | 2 (9.1) | 0 |
| Hypertension | ||
| No | 11 (50) | 13 (59.1) |
| Yes | 11 (50) | 9 (40.9) |
Disclaimer/Publisher’s Note: The statements, opinions and data contained in all publications are solely those of the individual author(s) and contributor(s) and not of MDPI and/or the editor(s). MDPI and/or the editor(s) disclaim responsibility for any injury to people or property resulting from any ideas, methods, instructions or products referred to in the content. |
© 2024 by the authors. Licensee MDPI, Basel, Switzerland. This article is an open access article distributed under the terms and conditions of the Creative Commons Attribution (CC BY) license (https://creativecommons.org/licenses/by/4.0/).
Copyright: This open access article is published under a Creative Commons CC BY 4.0 license, which permit the free download, distribution, and reuse, provided that the author and preprint are cited in any reuse.


