Submitted:
30 November 2024
Posted:
03 December 2024
You are already at the latest version
Abstract
Increased NH3 emissions from intensive agriculture negatively affect environmental and ecosystem health, contributing to particulate matter (PM) formation and the potent greenhouse gas, N2O. Better understanding ammonia emissions from the manure composting process and their behavior as a constituent of the atmospheric aerosol load is a crucial element in creating better farm management systems, improved public health outcomes and mitigating the broader environmental and climatic impacts of agriculture. Retarded generation of PM with major constituent source of NH3 is a primary mechanism evaluating the effects of agricultural contribution to PM. This study aims to quantify NH3 emissions, examine the influence of environmental factors, and investigate the relationship between precursor gases (SO2, NOx, NH3) and PM2.5 at a modern manure composting facility in Paju, South Korea. Over 35 days, average internal concentrations of NH3, SO2, and NOx were significantly higher than external levels. NH3 concentrations reached 3.64 ± 0.06 mg m-3 at 3m height and 2.43 ± 0.16 mg m-3 at ground level, while the total NH3 flux from the facility was 24.47 ± 1.39 NH3-N kg d-1. Internal PM2.5 concentrations (36.9 ± 2.6 µg m-3) were about 50% higher than external levels (23.7 ± 2 µg m-3), with a moderate correlation (r = 0.341) suggesting some contribution of external PM2.5 to internal levels. Despite large internal emissions, the facility's sealed design with a negative pressure ventilation system effectively minimized external emissions. These results suggest that while manure composting facilities are significant sources of NH3 and PM2.5, advanced systems like high-volume ventilation and scrubbing technologies can effectively reduce their impact on regional air pollution, contributing to better environmental management in agriculture.
Keywords:
Particle Matter
; Greenhouse gas
; Precursor gases
; Manure composting facility
1. Introduction
Agriculture-related emissions, including greenhouse gases (GHGs), ammonia (NH₃), particulate matter precursors, and toxic pollutants, can travel across regions, adversely affecting air quality and posing significant risks to human health (XXX). These far-reaching impacts highlight the urgent need for effective emission management strategies in agricultural systems to mitigate their environmental and health consequences (XX).
In 2017, agricultural activities were estimated to be responsible for approximately 80% of ammonia (NH3) emissions from the Republic of Korea [1] in line with similar figures from the United States, China and the European Union [2-5]. Livestock manure is thought to be the single largest contributor to NH3 emissions [6], estimated to account for around 50% of the total in the US and China [7,8]. Increased NH3 emissions as a result of intensive agriculture are known to negatively affect environmental and ecosystem health through eutrophication [9], and as an indirect source of the potent greenhouse gas, nitrous oxide (N2O) [3,10].
Per capita meat consumption in South Korea is projected to continue increasing over the next decade, with consumption of chicken and pork having doubled since the year 2000, and beef consumption increasing by more than 40% [11]. Available grazing and arable land is limited in South Korea [12], and pressure on agriculture production means that concentrated animal feeding operations (CAFOs) are common. Effectively managing the manure produced in these facilities is important to controlling NH3 and odour pollution [8,13]. Manure composting is an appealing management technique, involving the growth of aerobic micro-organisms within the manure that break it down into a nutrient rich organic fertilizer that can be applied to agricultural land [5]. When composted, biological degradation of the manure results in the production of Sulfur Dioxide (SO2) and Nitric Oxide (NOx) gasses, as well as greenhouse gasses (GHGs) such as Carbon Dioxide (CO2), Methane (CH4) and N2O [14,15]. Ammonium (NH4+) is also created through microbial processes within the manure and although not volatile itself, exists in equilibrium with NH3 gas [10]. Factors that affect NH3 emissions from manure compost include temperature, moisture content, pH, initial nitrogen content and air turbulence [5,10]. Aerating compost (via forced aeration, mechanical turning, and the use of organic bulking agents such as wood chips) has also been found to reduce direct emissions of GHGs CH4 and N2O, lowering the impact of manure composting on climate change, but this causes increases in the pH and temperature of the manure, shifting the equilibrium towards gaseous NH3, increasing emissions, and leading to interest in capturing and scrubbing NH3 from the air [16-18].
NH3 emissions are thought to be an important contributor to the formation of secondary particulate matter. NH3 gas reacts with acidic compounds (such as SO2 and NOx) in the atmosphere resulting in PM2.5 formation [19,20]. Studies have investigated the role of NH3 interactions with SO2 and NOx in contributing to severe PM2.5 episodes in both South and East Asia [4,21,22], as well as in Europe [23,24], and North America [7,25]. Poor air quality is among the greatest issues currently facing East Asian societies, negatively affecting health outcomes [26,27] and economic productivity [28] across the region.
Better understanding NH3 emissions from the manure composting process and their behavior as a constituent of the atmospheric aerosol load is a crucial element in creating better farm management systems, improved public health outcomes and mitigating the broader environmental and climatic impacts of agriculture. This study aims to characterize and quantify SO2, NOx, NH3 (SNA) and PM2.5 emissions from a modern manure composting facility in South Korea in order to a) calculate NH3 flux, b) assess the role that physical and environmental variables play in NH3 emission, c) investigate any relationship between SNA and PM2.5 formation within the facility. In addition, this study aims to evaluate whether this modern facility, equipped with an NH3 scrubbing system, is able to minimize external emissions that may contribute to regional air pollution.
2. Materials and Methods
A multi-instrument monitoring system was set-up to monitor SNA emissions and PM concentrations at a manure composting facility located in Papyeong-myeon, Paju City, Gyeonggi Province, South Korea. The chosen facility began operations in 2017, and is a purpose built, modern manure composting facility installed with a high-volume ventilation and scrubber system. The monitoring instruments were operated over a 5-week period between 11th June – 16th July 2020. Internal concentrations of SNA and external concentrations of NH3 and PM2.5 were monitored continuously. In addition, internal PM2.5 concentrations were monitored for shorter durations during the monitoring period.
2.1. Monitoring Site
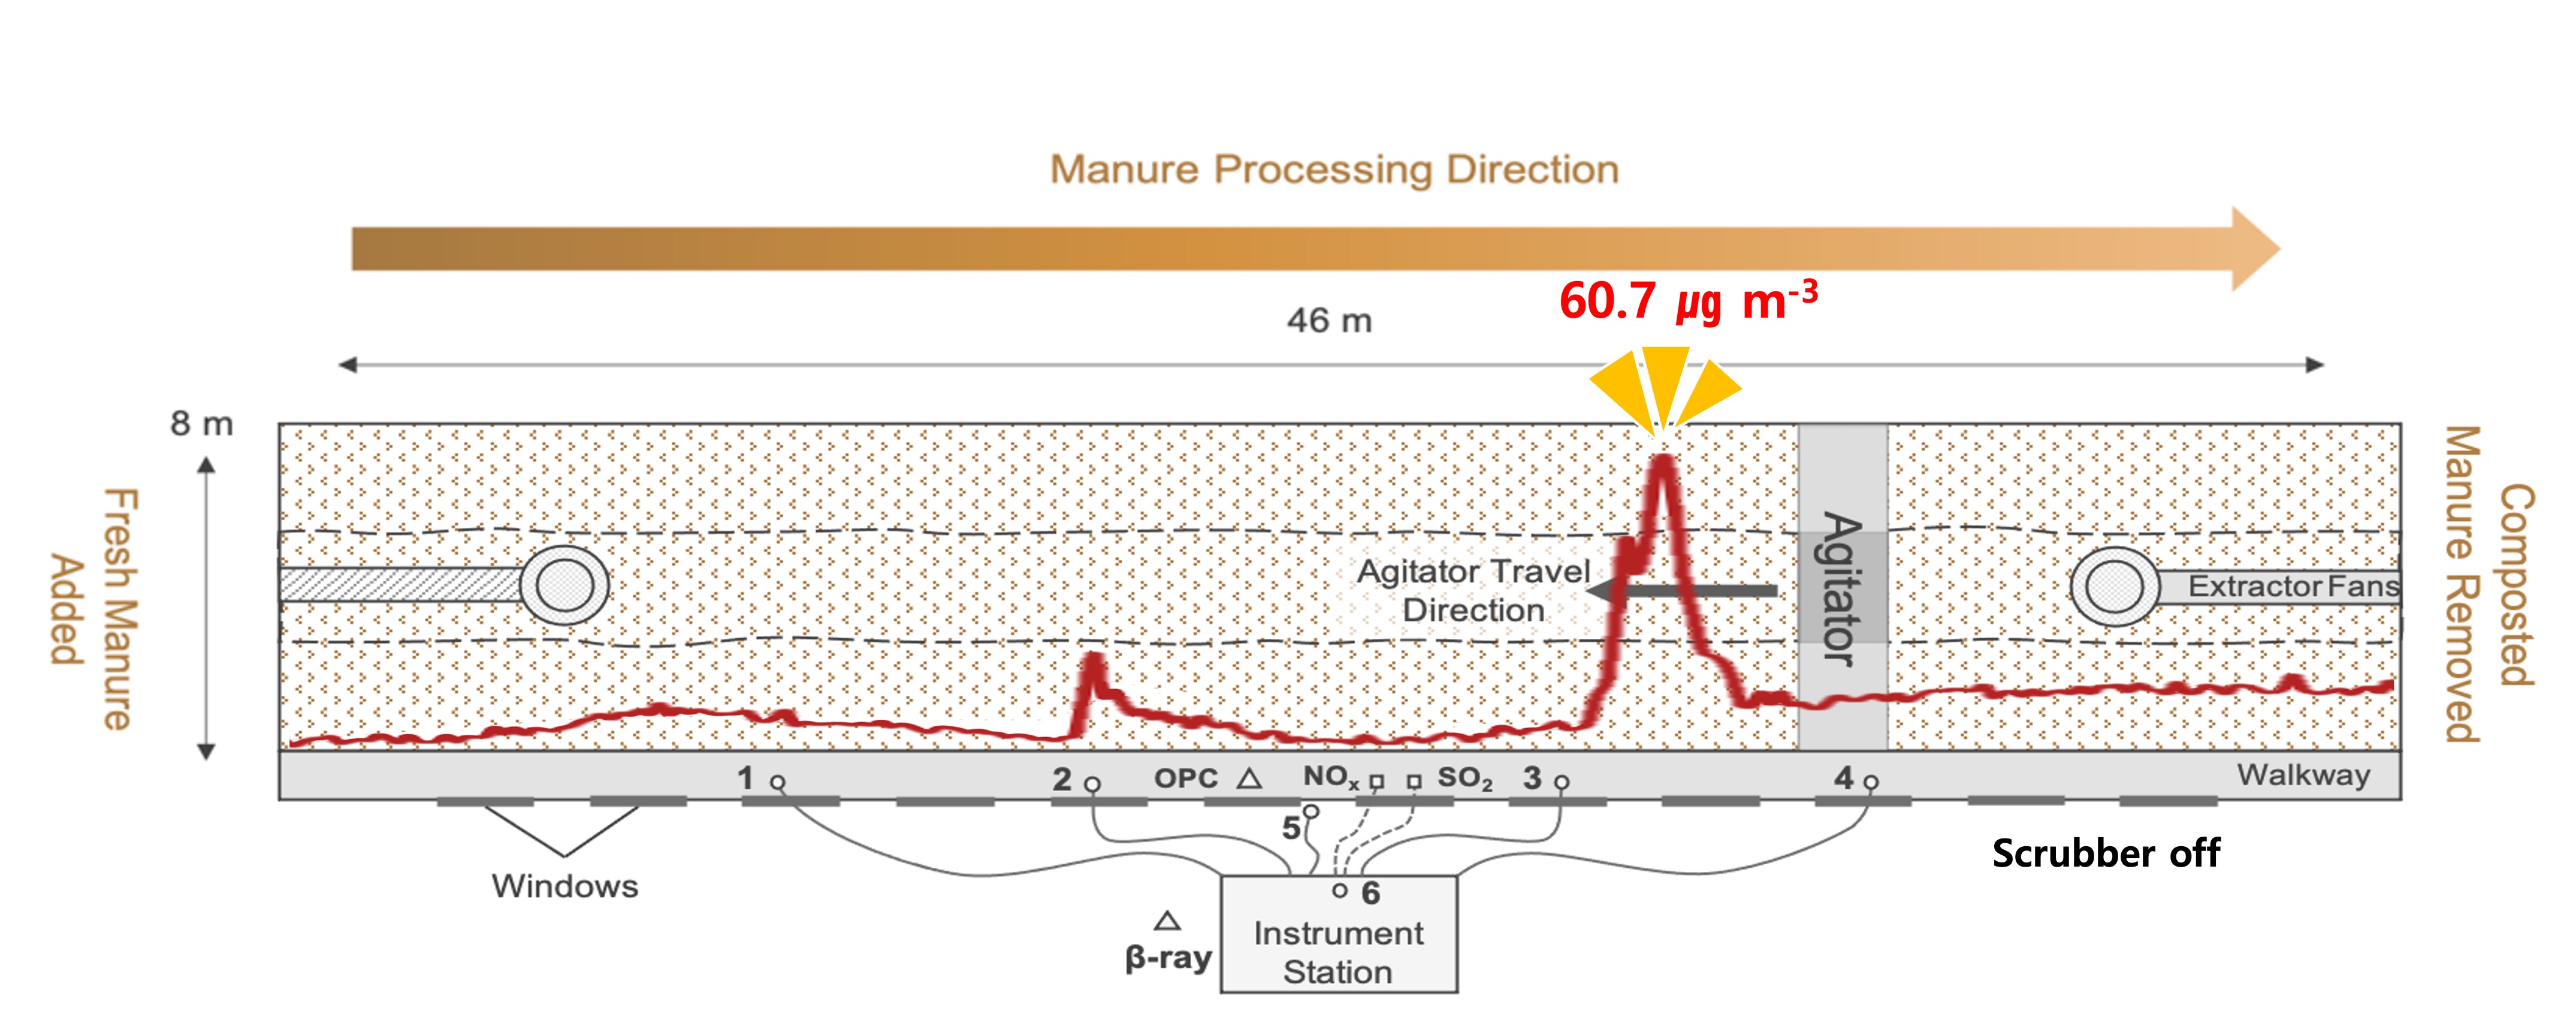
The Paju manure composting facility (PMCF) is designed to process animal manure from animal feeding operations (AFOs) into organic fertilizer for agricultural use. The facility is composed of several distinct sections. Fresh manure is delivered from local poultry and livestock farms and stored for 25 days in an atrium sectioned into ten large bays for bulk manure storage prior to composting. The manure is then mixed at a manure 85 : 15 sawdust ratio and added to one of two halls designed to agitate the manure during the composting process. In each hall, the manure is mixed daily by a conveyor-type agitator that lifts, aerates and deposits the manure along three windrows. During the daily agitation the manure is gradually moved from the input to the extraction end of each hall over a period of 18 days. Following the composting agitation process, the manure is extracted and taken to a composted manure storage hall where it is allowed to rest for approximately 33 days, before being moved to a facility for packaging composted manure for sale as organic fertilizer. The facility also contains a separate underground tank for processing the liquid / slurry component of manure. This study focused on monitoring precursor gas and PM emissions from one of the manure composting agitation halls (Figure 1). It is expected that the greatest NH3 losses occur during this stage of the manure composting process due to the regular agitation and aeration of the manure.
The building is installed with two 1400 m3 min−1 capacity extraction fans which remove the air in the facility, maintaining a negative pressure internally, and pass it through scrubbers designed to remove precursor gasses and PM before it is emitted externally. Two ceiling-mounted vents leading to the extractor fans are located in each manure composting agitation hall.
2.2. Monitoring System
A weatherproof station to house the monitoring instruments was installed outside of the PMCF, adjacent to one of the manure composting agitation halls. The instruments were housed externally to reduce the possibility for contamination and corrosion of the instruments due to high precursor gas SNA concentrations inside the facility. Filtered gas samplers were placed along a walkway inside the manure composting agitation hall. The instruments were connected to the filtered gas samplers with 10-meter lengths of 4 mm diameter Teflon tubing, wrapped in a heated trace to reduce condensation, and run through holes in the buildings window fittings. Filtered gas samplers were used to ensure that the tubing did not become blocked with dust particles entrained during the daily manure agitation cycles.
2.2.1. Precursor gas measurement
NH3 gas concentrations were monitored via a 6-channel gas sampling doser (INNOVA1403) connected to an INNOVA1512i photoacoustic NH3 gas analyzer (INNOVA1403 & 1512i, LumaSense Technologies, Ballerup, Denmark). Four channels were used to monitor NH3 concentrations along the length of the manure composting agitation hall. In addition, two gas sampling channels were installed outside the facility, one located at a height of 3 m above ground level adjacent to a window on the outer wall of the manure composting agitation hall and one located at ground level next to the instrument station. The INNOVA gas sampling system provided NH3 concentrations (measurement range: 0 - 500 ppm, sensitivity: 1 ppb) sequentially across the 6 channels at approximately 45 second intervals. Except where explicitly mentioned, internal NH3 emissions are an average of the data from the four internal channels.
Sulphur Dioxide (SO2) and Nitrogen Oxide (NOx) gas concentrations (measurement range: 0 - 500 ppb, sensitivity: 0.1 ppb) were sampled at five-minute intervals at single points inside the manure composting agitation hall using KENTEK gas analyzers (KENTEK CO. LTD., Daejeon, South Korea). NOx was measured on a KENTEK Mezus 210 instrument via chemiluminescence. SO2 was measured by a KENTEK MEZUS 110 instrument, using an ultraviolet fluorescence method. NOX gas concentrations are only available prior to the 4th July 2020. While heated traces were used to avoid moisture condensation inside the teflon sampling tubes, condensation buildup after this date caused abnormal NOX data readings after 4th July.
The presented precursor gas concentration datasets measured at the facility have been transformed to 15-minute averages to reduce noise and to aid cross comparison between data sampled at different time intervals. For comparison with Environmental Variables and Regional PM and gas concentration measurements, precursor gas concentrations have been converted to hourly average values to match the data resolution of this externally sourced data
Regional hourly SO2 and Nitrogen Dioxide (NO2) gas concentration data measured at local government operated air quality monitoring sites in Paju were downloaded from the Air Korea government website for the duration of the study (https://www.airkorea.or.kr/index).
This study investigates the difference in gas concentrations during day time and night time, and between weekdays and weekends. This is because manure agitation only occurs during the day time on weekdays. Day time is defined in this study as between 7am – 7pm, while night time is from 7pm to 7am. Weekends are defined as the 48 hours from 7am on Saturday until 7am on Monday.
2.2.2. Particulate Matter measurement
A Beta-ray absorption method ultrafine dust automatic measuring device was installed at ground level outside the facility next to the instrument station to monitor external PM concentrations. The β-ray instrument conducted hourly air samples for the duration of the sampling period.
A GRIMM 11-D Aerosol Spectrometer Optical Particle Counter (GRIMM OPC 11-D, Grimm Aerosol Technik Ainring GmbH & Co.KG, Ainring, Germany) instrument was used to sample internal PM concentrations in the composting conveyor hall for two separate periods, from 24-26 June and from the 8-16 July 2020.
Regional particulate matter concentration data measured at local government operated air quality monitoring sites in Paju were downloaded from the Air Korea government website at an hourly resolution for the duration of the study (https://www.airkorea.or.kr/index).
2.2.3. Environmental Variables
Hourly local temperature and humidity data measured at a government operated meteorological station in Paju were downloaded from the Korean Meteorological Association website for the duration of the study (https://data.kma.go.kr/).
2.3. Ammonia Emission Flux Calculations
For calculation of the flux of NH3 emissions from manure being processed inside the manure composting agitation hall, the extraction fans were disabled, allowing gaseous NH3 concentrations to rise until they reach peak concentration, likely as a result of equilibrium in the concentration gradient at the manure – air boundary. The difference in normal (ventilated) NH3 concentrations and saturated NH3 concentrations was divided by the time taken for this increase to occur, and the results were averaged across the four internal NH3 sampling channels.
Emission RateNH3 = (CNH3(sat.) - CNH3(vent.)) / Δt
Equation 1 demonstrates how NH3 emission rate was calculated, where CNH3(sat) is the point at which NH3 concentrations in the air reach equilibrium with NH3 concentrations at the manure surface (i.e. there is no longer a concentration gradient leading, to a stabilization of NH3 concentrations in the air), CNH3(vent) is the ambient concentration of NH3 under ventilated conditions (i.e. when there is negative pressure, and emitted NH3 is being constantly removed and scrubbed by the ventilation system during ordinary operation), and Δt is the change in time in minutes between these two states following the disengagement of the ventilation system.
2.4. Statistical Analyses
The bivariate correlations between gas concentrations and environmental variables were tested using Pearson’s correlation coefficients, while the significance of differences in precursor gas concentrations between day, night, weekday and weekend conditions were tested using a one-way ANNOVA test at a 95% confidence level using the package R version 4.0.2.
3. Results and Discussion
3.1. Environmental Variables: Temperature and Relative Humidity
Data for environmental variables shows that temperature and relative humidity maintained a relatively consistent diurnal pattern throughout the monitoring period (Figure 2). While separate internal data for temperature and humidity was not measured, it is expected to be closely related to local meteorological conditions. The agitation hall is not climate controlled, but the air is constantly ventilated to maintain a negative pressure situation ensuring that the internal environment remains similar to prevailing local environmental conditions.
The average temperature during the monitoring period was 22.3°C, with a coldest temperature of 16.1°C degrees in the early morning of 17th June and an overall high of 34°C on the afternoon of 22nd June (Table 1). Daily minimum temperatures (mean = 18.3°C, standard deviation = 1.3°C) varied slightly less than Daily maximum temperatures (mean = 27.1°C, standard deviation = 2.9°C). As expected relative humidity showed an inverse pattern compared to temperature, with lower humidity during the day and higher humidity during cooler nights (Figure 2). Relative humidity reached dew point (100% RH) most nights. Relative Humidity data attests to two periods of rain during the monitoring period from 23-26th June and 12-14th July. The environmental variable data shows that the main variation was diurnal, with no discernible trends over the whole monitoring period.
3.2. Gas Concentrations
3.2.1. Ammonia monitoring results
NH3 was the most abundant of the monitored gasses, with internal NH3 concentrations averaging 57.1 ± 1.3 mg m−3 across the entire monitoring period (excluding the two occasions when the extractor fans where disabled – these periods will be discussed separately). There was substantial variation in NH3 concentrations depending on the timing of the measurements. The highest average NH3 concentrations were recorded during weekend day time at 66.3 ± 8.2 mg m−3 (Table 2), although this was not significantly different (p < 0.05) to average weekday day time concentrations of 64 ± 2.5 mg m−3 (Figure 3). Average weekday night time NH3 concentrations were found to be slightly lower, at 54.2 ± 2.1 mg m−3, and statistically significantly different to day time concentrations. Weekend night time average NH3 concentrations were measured to be less than 60% of average day time levels at 37.9 ± 2.6 mg m−3. The differences in average concentrations of NH3 during separate time periods likely reflect differences in environmental variables (i.e. temperature and humidity) and manure agitation activity between night and day, and the absence of manure agitation activities on the weekend..
The diurnal fluctuations in NH3 concentrations and the difference in concentration patterns between weekday and weekends can be clearly seen across all four internal NH3 sampling points (Figure 4). On weekdays, all internal sampling points show concentrations peaking sharply, three times, during the daily agitation events, matching the travel of the agitator along the three manure windrows (Figure 1). On weekends a single broader NH3 concentration peak is observed. It is likely that agitation itself results in shorter, higher magnitude NH3 concentrations that are quickly cleared by the ventilation system, reducing peak NH3 emissions outside of the agitation period. By contrast, on weekends there is a lower but broader NH3 concentration peak during the day (Figure 4). On weekdays, the lowest concentrations of NH3 are usually recorded immediately after manure agitation has ceased, while on weekends the lowest concentrations of NH3 are observed overnight, in the early morning prior to sunrise. The pattern of emissions on the weekend may suggest a greater role of temperature in NH3 emissions at this time.
Turning of the manure during agitation cycles aerates the compost and provides a supply of oxygen to the microorganisms that are performing aerobic digestion [18]. The biological oxidation of C to CO2 releases heat that raises the temperature of the compost into a thermophilic (>40°C) state [18]. In addition, aeration exposes the manure to air allowing the release of dissolved CO2, which raises the pH of the manure [10]. Increases in either temperature or pH promote the emission of NH3 by increasing the dissociation of NH4+ [10,16,17]. The process of turning / aeration itself increases the ability for NH3 vitalization through air turbulence across the greatly expanded manure surface area [10], leading to the high NH3 concentrations recorded during agitation events. However, alongside volatizing the reservoir of NH3 gas in the manure, it also temporarily lowers the temperature of the manure, likely leading to the lower NH3 concentrations that are recorded directly after agitation. Following aeration, the increased availability of oxygen leads to temperature increases within the compost over the next day [15]. Following aeration during the week, during the weekends, the temperature of the undisturbed manure likely remains higher leading to increased NH3 concentrations during the warmer day time and lower NH3 concentrations during the cooler night time temperatures.
The agitation events can be clearly recognized in the raw NH3 concentration dataset for the internal sampling points (Figure 5). Three periods of raised concentrations are apparent, representing the agitator travelling along each of the three windrows. The first period of raised concentrations with the highest peaks (at 275 – 500 mg m−3) shows the agitation of the windrow closest to the internal sampling points, and distinctly displays sequential concentration peaks as the agitator passes each of the four sampling points.
External NH3 concentrations were generally an order of magnitude lower than internal concentrations. Average NH3 concentrations at 3 m height above ground level adjacent to the manure agitation hall window were 3.64 ± 0.06 mg m−3 across the whole monitoring period, while average external NH3 concentrations at ground level were slightly lower at 2.43 ± 0.16 mg m−3 (Figure 6; Table 2). There was no substantial diurnal / weekday – weekend variation in external NH3 concentrations at 3 m height, although at ground level weekday day NH3 concentrations (3.1 mg m−3) were approximately 50% higher than during the other time periods (1.7 – 2.1 mg m−3). Although the data shows that the NH3 emitted by the facility is low compared to internal concentrations, increases in external NH3 concentrations were detected contemporaneous to increases in internal concentrations, demonstrating that some leakage does occur. In addition, external NH3 concentrations at 3m height are comparable to average concentrations of 3.7 – 5 mg m−3 measured inside a Chinese commercial manure-belt layer house (Wang et al., 2020), and as such they are not negligible. It is expected that the external sampling point at 3m height would record higher average NH3 concentrations than the ground-level sampling point due to the potential for emissions through the window fitting. However, external ground-level NH3 concentrations, although lower on average, regularly displayed greater peak concentrations of NH3 during manure agitation activity (Figure 6), although it is unclear why this might be the case.
3.2.2. SO2
Recorded concentrations of SO2 gas shared a similar pattern to NH3 concentrations (Figure 7), displaying high but variable concentrations during manure agitation and more broadly elevated concentrations during weekend day time when agitation did not occur. This similarity is reflected by a strong positive correlation (r = 0.751, p < 0.001) in the concentration of NH3 and SO2 (Figure 8, Table 3). Although sharing a similar profile, SO2 concentrations were consistently two orders of magnitude lower than NH3 concentrations, averaging 307.2 ± 17.4 µg m−3 over the monitoring period. Unlike NH3, the average concentrations of SO2 during weekday days (371 ± 30.5 µg m−3) and nights (321.1 ± 23.7 µg m−3) were not found to be significantly different (p < 0.05). In addition, unlike NH3, average weekend day SO2 concentrations (265 ± 45.6 µg m−3) were lower than both weekday day and night concentrations, although were also not statistically different (p > 0.95). However, average SO2 concentrations on weekend nights (147.2 ± 15.7 µg m−3) were found to be significantly lower (p < 0.05) than SO2 concentrations at all other times. During weekday manure agitation events SO2 concentrations share a similar pattern with NH3 of three main concentration spikes related to the sequential agitation of the three manure windrows. Weekday SO2 concentrations were consistently measured to be lowest in the period directly after agitation activity ceased. However, again showing similarities to NH3 concentration patterns, weekend day time concentrations of SO2 were elevated for longer durations throughout the day and lowest concentrations occurred during the night, prior to sunrise.
This data suggests that both NH3 and SO2 are emitted during the manure composting process, and the similarity in the pattern of recorded concentrations may suggest similar emission mechanisms. SO2 can result from incomplete oxidation during manure breakdown by microorganisms activity, perhaps as a result of intermittently aerobic conditions [15]. However, unlike this study, research by Wang [29] found that indoor SO2 concentrations at a belt-layer house Beijing were predominantly from the ambient air. While that study found a positive correlation between internal and regional SO2 concentrations, data from this study rules out any substantial affect of ambient air on internal SO2 concentrations at the PMCF (Table 3). Indeed, the strong positive correlation between NH3 and SO2 concentrations suggests that manure composting is the predominant source of both. Two existing studies both found that SO2 is emitted during the manure composting process, however they produced widely different results for Sulphur mass loss ranging from <1% [30] to approximately 20% [15], and the SO2 emission mechanism is not well understood.
3.2.3. NOx
NOx are the total combination of NO and NO2, which were both measured during this study. In this study NO was found to be the predominant component of NOx (Table 2), with average concentrations (33.4 ± 3.2 µg m−3) four and a half times greater than those of NO2 (7.3 ± 0.8 µg m−3). Unfortunately, NOx concentration data was contaminated after 4th July 2020, due to a build-up of condensation in the sampling tube, meaning that NOx data for the final 12 days of the study has not been used. Weekday Day (34 ± 4.1 µg m−3) and Night (32 ± 5.4 µg m−3) concentrations of NO were similar, and weekend day concentrations were slightly lower (28 ± 6.6 µg m−3). Average NO concentrations were greatest on weekend nights (49.7 ± 13.6 µg m−3), however these difference were not found to be statistically significant (p < 0.05). Similar to NH3 and SO2, NO concentrations recorded increases during manure agitation (Figure 7), however during weekends NO concentrations appear to display an approximately inverse pattern to NH3 and SO2. That is, when NH3 and SO2 concentrations are elevated during the weekend day time, NO concentrations are depleted, and this situation reverses during the weekend nights. NO is produced as a result of nitrification and denitrification processes during composting [15,29]. Similar to the increased concentrations of NH3 and SO2 during agitation, NO concentrations may be increased by manure turning by exposing more manure to the air, increasing diffusion potential [15]. The lower concentrations of NO during weekend days may be explained by the inhibition of nitrobacteria activity by high temperatures [15,17], with greater concentrations of NO overnight when temperatures are lower. Fillingham [16] reported an inverse relationship between NH3 emissions and NO emissions, with NH3 emissions greater in well aerated and higher temperature conditions, while NO emissions increased during manure storage. Previous research has found that NO emissions substantially increase only later in the composting process (beyond 15 – 30 days), after the thermophilic phase, when mesophilic nitrifying bacteria were able to grow [31,32].
Unlike NO, concentrations of NO2 display a pattern more similar to NH3, with elevated concentrations during weekday and weekend day time, and lower concentrations at night time (Table 2). Internal NO2 concentrations were not correlated with ambient regional NO2 concentrations (Table 3), suggesting that the main source of NO2 in the facility was the composting manure. However, analysis showed that NO2 concentrations had a strong negative correlation with Relative Humidity (r = -0.6, p < 0.001) (Figure 9, Table 3), and a moderate positive correlation with temperature (r = 0.476, p < 0.001), although the latter likely only reflects the relationship between temperature and humidity. It is possible that greater humidity could cause the poor relationship between NO2 and NO concentrations by providing water for the reaction from NO2 to nitric acid and NOx (Eq. 2), and thus also explain the negative correlation with humidity.
3NO2 + H2O + → 2HNO3 + NO
3.3. Particulate Matter Concentrations
Average external PM2.5 concentrations during the monitoring period were 23.7 ± 2 µg m−3 (Table 2), and unlike internal NH3 concentrations, there was no significant variability between day-night and weekday-weekend periods. The hourly external PM2.5 concentrations measured at the PMCF closely matched regional PM2.5 concentrations (Figure 10), with which they had a strong positive correlation (r = 0.67, p < 0.001).
There were two exceptions, on the 25th and 26th June 2020, respectively, when external PMCF PM2.5 concentrations greatly diverged from regional concentrations (Figure 10). However, internal NH3, SO2 and NOx concentration data on these two dates do not appear to show any large anomalies that might correspond with the high PM2.5 concentrations. This suggests that the elevated PM2.5 concentrations measured outside the facility on the 25th and 26th June did not originate from the manure composting function of the facility and were from a different source. Together with the high correlation with regional PM2.5 concentrations, this data suggests that the PMCF is unlikely to be a significant local or regional source of PM2.5.
Average internal PM2.5 concentrations were 36.9 ± 2.6 µg m−3. Similar PM2.5 concentrations (39 – 56 µg m−3) were found during monitoring of slatted floor hog houses in China [33], and are slightly lower than PM2.5 concentrations (40 – 80 µg m−3) at a commercial laying hen house in Canada [34]. However, they are much lower than the PM2.5 concentration (100 – 140 µg m−3) measured in Chinese manure-belt laying hen houses by Wang [29], and in a range of swine (75 – 177 µg m−3) and poultry houses (233 – 389 µg m−3) in the mid-western US [35]. Elevated periods of PM2.5 concentrations appear to coincide with manure agitation (Figure 11), and could be a result of mechanical lofting of fine fraction dust particles and / or secondary aerosol formation from elevated precursor gas concentrations. Secondary aerosol formation can occur when NH3 gas reacts with acidic species SO2 and NOx to form NH4+ salts like (NH4)2SO4 and NH4NO3 [7,19]. Reaction between NH3 and sulfuric acids will occur preferentially over nitric acids under normal atmospheric conditions [19], and the reaction rate between NH3 and sulfuric acids is faster than for nitric acids [20]. Peak PM2.5 concentrations were recorded at 889 µg m−3 and 1479 µg m−3 on the 14th and 15th July 2020 respectively (Figure 11), showing that very high internal PM2.5 concentrations occasionally occur for brief durations coincident with agitation activity. However, PM2.5 concentrations rarely rose above 200 µg m−3 and it is likely that the high-volume ventilation system at the PMCF was an important factor in the relatively low internal PM2.5 concentrations, removing fine-fraction dust particles and precursor gasses before PM2.5 formation was able to occur.
Due to the shorter duration (approx. 10 days) over which internal PM2.5 was measured it was not possible to assess statistical differences between weekend and weekday concentrations. Although internal PM2.5 was observed to reach much higher concentrations on weekday days following manure agitation, concentrations appeared to show comparatively little variability on weekends. A weak but significant correlation was found between regional and internal PM2.5 concentrations (r = 0.341, p < 0.001), suggesting that PM2.5 in the ambient air was responsible for a portion of internal PM2.5 concentrations, however no correlation existed between external and internal PM2.5 (Table 3).
3.4. Ammonia Emission Rate
An experiment was undertaken during a 5-hour period between 12:30 – 17:30 on Saturday 11th July 2020 in which the high-volume ventilation / scrubber system was turned off in order to measure the flux of NH3 from the composting manure (Figure 12). Prior to the experiment, under ventilated conditions, internal NH3 concentrations were stable at approximately 100 mg m−3, rising to around 150 mg m−3 as all entrances and exits to the facility were closed. After the ventilation system was disabled, NH3 concentrations were recorded to drop to an average of ~30 mg m−3 initially, before rising quickly to reach values of ~250 mg m−3 within 30 minutes. Peak concentrations of ~325 mg m−3 were reached after approximately 40 minutes. Concentrations of SO2 followed a similar pattern to NH3, initially dropping before exceeding the monitoring instrument’s detection limit at 1.31 mg m−3 (500 ppb). It is not clear why NH3 concentrations dropped after the ventilation system was disabled, but we hypothesise that the negative pressure environment created by the ventilation system causes a greater flux of NH3 from the manure surface due to the pressure gradient, and therefore when the ventilation system is disabled, NH3 is emitted at a reduced rate. Alternatively, the decrease could be related to lower air turbulence across the manure surface which would be expected to reduce convective mass transfer of NH3 from the manure surface to the air [10].
The emission rate of NH3 was calculated according to Equation 1, and based on the time taken for NH3 concentrations to rise from their minima at ~30 mg m−3 to the inflection point at ~250 mg m−3 after which concentration increases slow down. The results show that under stable non-ventilated conditions NH3 emission rate inside the manure agitation hall is between 6.16 – 8.02 (mean = 7.28 ± 0.41) NH3-N mg min−1 m−3 (Table 4), and that extrapolated, the total mass of NH3 emitted daily is between 20.7 – 26.96 (mean = 24.47 ± 1.39) NH3-N kg d−1.
There is little standardisation of the units used to report NH3 emission rates across various studies. The data from this study is compared to that of other studies in the unit in which those studies published their data. The scaled NH3 emission rates in the PMCF are high compared to studies investigating emissions from AFOs. Hristov [10] present a compilation of data from multiple dairy farms and beef feed lots (n=29), where all but one study found NH3 emissions between 0.01 - 0.9 g h−1 m−2, compared to 2.77 ± 0.41 g h−1 m−2 NH3-N in this study. Daily NH3 emissions from a composting facility at a manure belt poultry house were estimated to be much greater at 596 kg d−1 [5], approximately 20 times higher than this study. However, Zhao [5] also relay data from conference proceedings presented by Matsusada [36] reporting NH3 emissions of 0.32 – 2.84 g kg−1, 0.02 – 2.74 g kg−1, and 0.04 – 0.46 g kg−1, for composting of swine, poultry and dairy manure respectively. These figures are comparable to NH3 emissions of 1.52 ± 0.09 g kg−1 from the mixed manure at the PMCF. A separate study of cattle manure composting reported NH3 emissions of 0.07 – 0.19 g d−1 kg−1 during the first 50 days [37], again similar to a figure of 0.084 ± 0.005 g d−1 kg−1 for this study. As expected, the NH3 emission rate at the PMCF is more similar to measurements from other manure composting operations than from AFOs.
Internal PM2.5 concentrations were also measured during the ventilation-off experiment, and were found to initially rise from approximately 3 – 10 µg m−3 under ventilated conditions to 18 µg m−3 when the ventilation system was disengaged before decreasing again to ~5 µg m−3 during the experiment. At the end of the experiment, when the ventilation system was re-engaged PM2.5 concentrations peaked at 65 µg m−3. It was expected that the high concentrations of NH3 and SO2 during the ventilation-off experiment would lead to secondary inorganic particulate formation and higher PM2.5 concentrations. The presence of PM2.5 concentration peaks at the beginning and end of the experiment, but not during it when NH3 and SO2 concentrations were highest, suggests that the processes affecting PM2.5 formation are more complex than the co-existence of precursor gasses alone. This could be a productive area for future research.
4. Conclusions
The concentrations of SNA precursor gasses and PM2.5 were continuously measured at a modern manure composting facility in Paju, South Korea over a period of 35 days in June and July 2021. Average internal NH3 concentrations were 57.1 ± 1.3 mg m−3, compared to external NH3 concentrations of 3.64 ± 0.06 mg m−3 at 3m-height, and 2.43 ± 0.16 mg m−3 at ground level. Internal concentrations of NH3 were found to differ significantly between day time (higher) and night time (lower), and weekend nights had concentrations that were significantly lower than weekday nights. These concentration differences are likely caused by manure agitation activity, which occurs during the weekday day time, and temperature differences between day and night. Sulfur Dioxide (SO2) concentrations followed a similar pattern with NH3, and it was found to be the second most abundant precursor gas, with average concentrations of 307.2 ± 17.4 µg m−3. Weekend night time concentrations of SO2 were found to be significantly lower than at all other times. The predominant component of NOx gasses, was determined to be NO with average concentrations of 33.4 ± 3.2 µg m−3, compared to NO2 concentrations of 7.3 ± 0.8 µg m−3. Although there was no significant difference between NOx concentrations at different times, the NOx concentration profile was markedly different to both NH3 and SO2, suggesting that the processes governing emission are different. Average PM2.5 concentrations inside the facility (36.9 ± 2.6 µg m−3), were about 50% higher than external concentrations (23.7 ± 2 µg m−3), and a moderate correlation (r = 0.341, p < 0.001) between the two is suggestive that ambient PM2.5 contributes part of the internally measured concentrations. The NH3 emission rate from the facility’s manure agitation hall was calculated to be 7.28 ± 0.41 NH3-N mg min−1 m−3, corresponding to scaled emissions rates of 1.85 ± 0.1 NH3-N g h−1 m−3 of manure compost, or 1.52 ± 0.09 NH3-N g kg−1 of manure compost over the full 18-day composting period. Based on these figures, total daily NH3 flux from the manure agitation hall is approximately 24.47 ± 1.39 NH3-N kg d−1. The data from this study suggests that despite the large fluxes of NH3 and other precursor gasses emitted inside the manure composting facility, the sealed building design with a negative pressure high-volume ventilation / scrubber system is effective at minimizing NH3 and PM2.5 emissions to the atmosphere.
References
- Korean National Air Pollutants Emission Service. Gaseous Emissions by Sector. 2017. (Accessed on 3 February 2021).
- Streets, D.G.; Bond, T.C.; Carmichael, G.R.; Fernandes, S.D.; Fu Q.; He, D.; Klimont, Z.; Nelson, S.M.; Tsai, N.Y.; Wang, M.Q. An inventory of gaseous and primary aerosol emissions in Asia in the year 2000. J. Geophys. Res. Atmos. 2003, 108. [CrossRef]
- Velthof, G.L.; van Bruggen, C.; Groenestein, C.M.; de Haan, B.J.; Hoogeveen, M.W.; Huijsmans, J. A model for inventory of ammonia emissions from agriculture in the NetherlandsAtmos. Environ. 2012, 46, 248–255.
- Wang, S., Nan, J.; Shi, C.; Fu, Q.; Gao, S.; Wang, D.; Cui, H.; Saiz-Lopez, A.; Zhou, B. Atmospheric ammonia and its impacts on regional air quality over the megacity of Shanghai, China. Sci. Rep. 2015, 5, 1–13. [CrossRef]
- Zhao, L.; Hadlocon, L.J.S.; Manuzon, R.B.; Darr, M.J.; Keener, H.M.; Heber, A.J.; Ni, J. Ammonia concentrations and emission rates at a commercial poultry manure composting facility. Biosyst. Eng. 2016, 150, 69–78. [CrossRef]
- Sommer, S.G.; Webb, J.; Hutchings, N.D. New emission factors for calculation of ammonia volatilization from European livestock manure management systems. Front. Sustain. Food Syst. 2019, 3, 1–9. [CrossRef]
- Hristov, A.N. Technical note: Contribution of ammonia emitted from livestock to atmospheric fine particulate matter (PM2. 5) in the United States. J. Dairy Sci. 2011, 94, 3130–3136. [CrossRef]
- Zhang, N.; Bai, Z.; Winiwarter, W.; Ledgard, S.; Luo, J.; Liu, J.; Guo, Y.; Ma, L. Reducing ammonia emissions from dairy cattle production via cost-effective manure management techniques in China. Environ. Sci. Technol. 2019, 53, 11840–11848. [CrossRef]
- Sutton, M.A.; Oenema, O.; Erisman, J.W.; Leip, A.; van Grinsven, H.; Winiwarter, W. Too much of a good thing. Nature 2011, 472, 159–161.
- Hristov, A.H.; Hanigan, M.; Cole, A.; Todd, R.; Mcallister, T.A.; Ndegwa, P.M.; Rotz, A. Review: ammonia emissions from dairy farms and beef feedlots. Can. J. Ani. Sci. 2011, 91, 1–35. [CrossRef]
- OECD. Meat consumption (indicator). 2021. (Accessed on 10 March 2021).
- Won, S.; Yoon, Y.; Hamid, M.M.A.; Reza, A.; Shim, S.; Kim, S.; Ra, C.; Novianty, E.; Park, K. Estimation of greenhouse gas emission from Hanwoo (Korean native cattle) manure management systems. Atmosphere (Basel) 2020, 11, 845. [CrossRef]
- Jo, S.; Kim, K.; Jeon, B.; Lee, M.; Kim, Y.; Kim, B.; Cho, S.; Hwang, O.; Bhattacharya, S.S. Odor characterization from barns and slurry treatment facilities at a commercial swine facility in South Korea. Atmos. Environ. 2015, 119, 339–347. [CrossRef]
- Ba, S.; Qu, Q.; Zhang, K.; Groot, J.C.J. Meta-analysis of greenhouse gas and ammonia emissions from dairy manure composting. Biosyst. Eng. 2020, 193, 126–137. [CrossRef]
- Wang, Y.; Liu, S.; Xue, W.; Guo, H.; Li, X.; Zou, G.; Zhao, T.; Dong, H. The characteristics of carbon, nitrogen and sulfur transformation during cattle manure composting—based on different aeration strategies. Int. J. Environ. Res. Public health 2019, 16, 3930. [CrossRef]
- Fillingham, M.A.; VanderZaag, A.C.; Burtt, S.; Baldé, H.; Ngwabie, N.M.; Smith, W.; Hakami, A.; Wagner-Riddle, C.; Bittman, S.; MacDonald, D. Greenhouse gas and ammonia emissions from production of compost bedding on a dairy farm. Waste Manag. 2017, 70, 45–52. [CrossRef]
- Jiang, T.; Li, G.; Tang, Q.; Ma, X.; Wang, G.; Schuchardt, F. Effects of aeration method and aeration rate on greenhouse gas emissions during composting of pig feces in pilot scale. J. Environ. Sci. (China) 2015, 31, 124–132. [CrossRef]
- Pardo, G.; Moral, R.; Aguilera, E.; Prado, A. Gaseous emissions from management of solid waste: a systematic review. Glo. Chang. Biol. 2015, 21, 1313–1327. [CrossRef]
- Behera, S.N.; Sharma, M.; Aneja, V.P.; Balasubramanian, R. Ammonia in the atmosphere: a review on emission sources, atmospheric chemistry and deposition on terrestrial bodies. Environ. Sci. Pollut. Res. 2013, 20, 8092–8131. [CrossRef]
- Behera, S.N.; Sharma, M. Degradation of SO2, NO2 and NH3 leading to formation of secondary inorganic aerosols: An environmental chamber study. Atmos. Environ. 2011, 45, 4015–4024. [CrossRef]
- Sharma, M.; Kishore, S.; Tripathi, S.N.; Behera, S.N. Role of atmospheric ammonia in the formation of inorganic secondary particulate matter: a study at Kanpur, India. J. Atmos. Chem. 2007, 58, 1–17. [CrossRef]
- Ye, Z.; Guo, X.; Cheng, L.; Cheng, S.; Chen, D.; Wang, W.; Liu, B. Reducing PM2. 5 and secondary inorganic aerosols by agricultural ammonia emission mitigation within the Beijing-Tianjin-Hebei region, China. Atmos. Environ. 2019, 219, 116989. [CrossRef]
- Backes, A.; Aulinger, A.; Bieser, J.; Matthias, V.; Quante, M. Ammonia emissions in Europe, part I: Development of a dynamical ammonia emission inventory. Atmos. Environ. 2016, 131, 55–66. [CrossRef]
- Erisman, J.W.; Schaap, M. The need for ammonia abatement with respect to secondary PM reductions in Europe. Environmental Pollution 2004, 129, 159–163. [CrossRef]
- Pozzer, A.; Tsimpidi, A.P.; Karydis, V.A.; Meij, A.; Lelieveld, J. Impact of agricultural emission reductions on fine-particulate matter and public health. Atmos. Chem. Phys. Discuss. 2017, 1–19. [CrossRef]
- Kashima, S.; Yorifuji, T.; Bae, S.; Honda, Y.; Lim, Y.; Hong, Y. Asian dust effect on cause-specific mortality in five cities across South Korea and Japan. Atmos. Environ. 2016, 128, 20–27. [CrossRef]
- Kwon, H.J; Cho, S.H.; Chun, Y.; Lagarde, F.; Pershagen, G. Effects of the Asian dust events on daily mortality in Seoul, Korea. Environ. Res. 2002, 90, 1–5.
- Jeong, D. Socio-economic costs from yellow dust damages in South Korea. Korean Soc. Sci. J. 2008, 35, 1–29.
- Wang, Y.; Niu, B.; Ni, J.; Xue, W.; Zhu, Z.; Li, X.; Zou, G. New insights into concentrations, sources and transformations of NH3, NOx, SO2 and PM at a commercial manure-belt layer house. Environ. Pollut. 2020, 262, 114355.
- Løes, A.; Khalil, R.; McKinnon, K. Exhaust Gas Concentrations and Elemental Losses from a Composting Drum Treating Horse ManureCompost. Sci. Util. 2020, 28, 36–48.
- Fukumoto, Y.; Suzuki, K.; Kuroda, K.; Waki, M.; Yasuda, T. Effects of struvite formation and nitratation promotion on nitrogenous emissions such as NH3, N2O and NO during swine manure composting. Bioresour. Technol. 2011, 102, 1468–1474. [CrossRef]
- Wang, Y.; Dong, H.; Zhu, Z.; Li, L.; Zhou, T.; Jiang, B.; Xin, H. CH4, NH3, N2O and NO emissions from stored biogas digester effluent of pig manure at different temperatures. Agric. Ecosyst. Environ. 2016, 217, 1–12. [CrossRef]
- Dai, C.; Huang, S.; Zhou, Y.; Xu, B.; Peng, H.; Qin, P.; Wu, G. Concentrations and emissions of particulate matter and ammonia from extensive livestock farm in South China. Environ. Sci. Pollut. Res. 2019, 26, 1871–1879. [CrossRef]
- Morgan, R.J.; Wood, D.J.; Van Heyst, B.J. The development of seasonal emission factors from a Canadian commercial laying hen facility. Atmos. Environ. 2014, 86, 1–8. [CrossRef]
- Yang, X.; Wang, X.; Zhang, Y.; Lee, J.; Su, J.; Gates, R.S. Characterization of trace elements and ions in PM10 and PM2. 5 emitted from animal confinement buildings. Atmos. Environ. 2011, 45, 7096–7104. [CrossRef]
- Matsusada, J.; Maeda, T.; Ohmiya, K. Ammonia emissions from composting of livestock manure 2002, 283–286.
- Bai, M.; Flesch, T.; Trouvé, R.; Coates, T.; Butterly, C.; Bhatta, B.; Hill, J.; Chen, D. Gas emissions during cattle manure composting and stockpiling. J. Environ. Qual. 2020, 49, 228–235. [CrossRef]
Figure 1.
a) a birds-eye view of the facility showing the location of sampling points, and b) a side on view.
Figure 1.
a) a birds-eye view of the facility showing the location of sampling points, and b) a side on view.
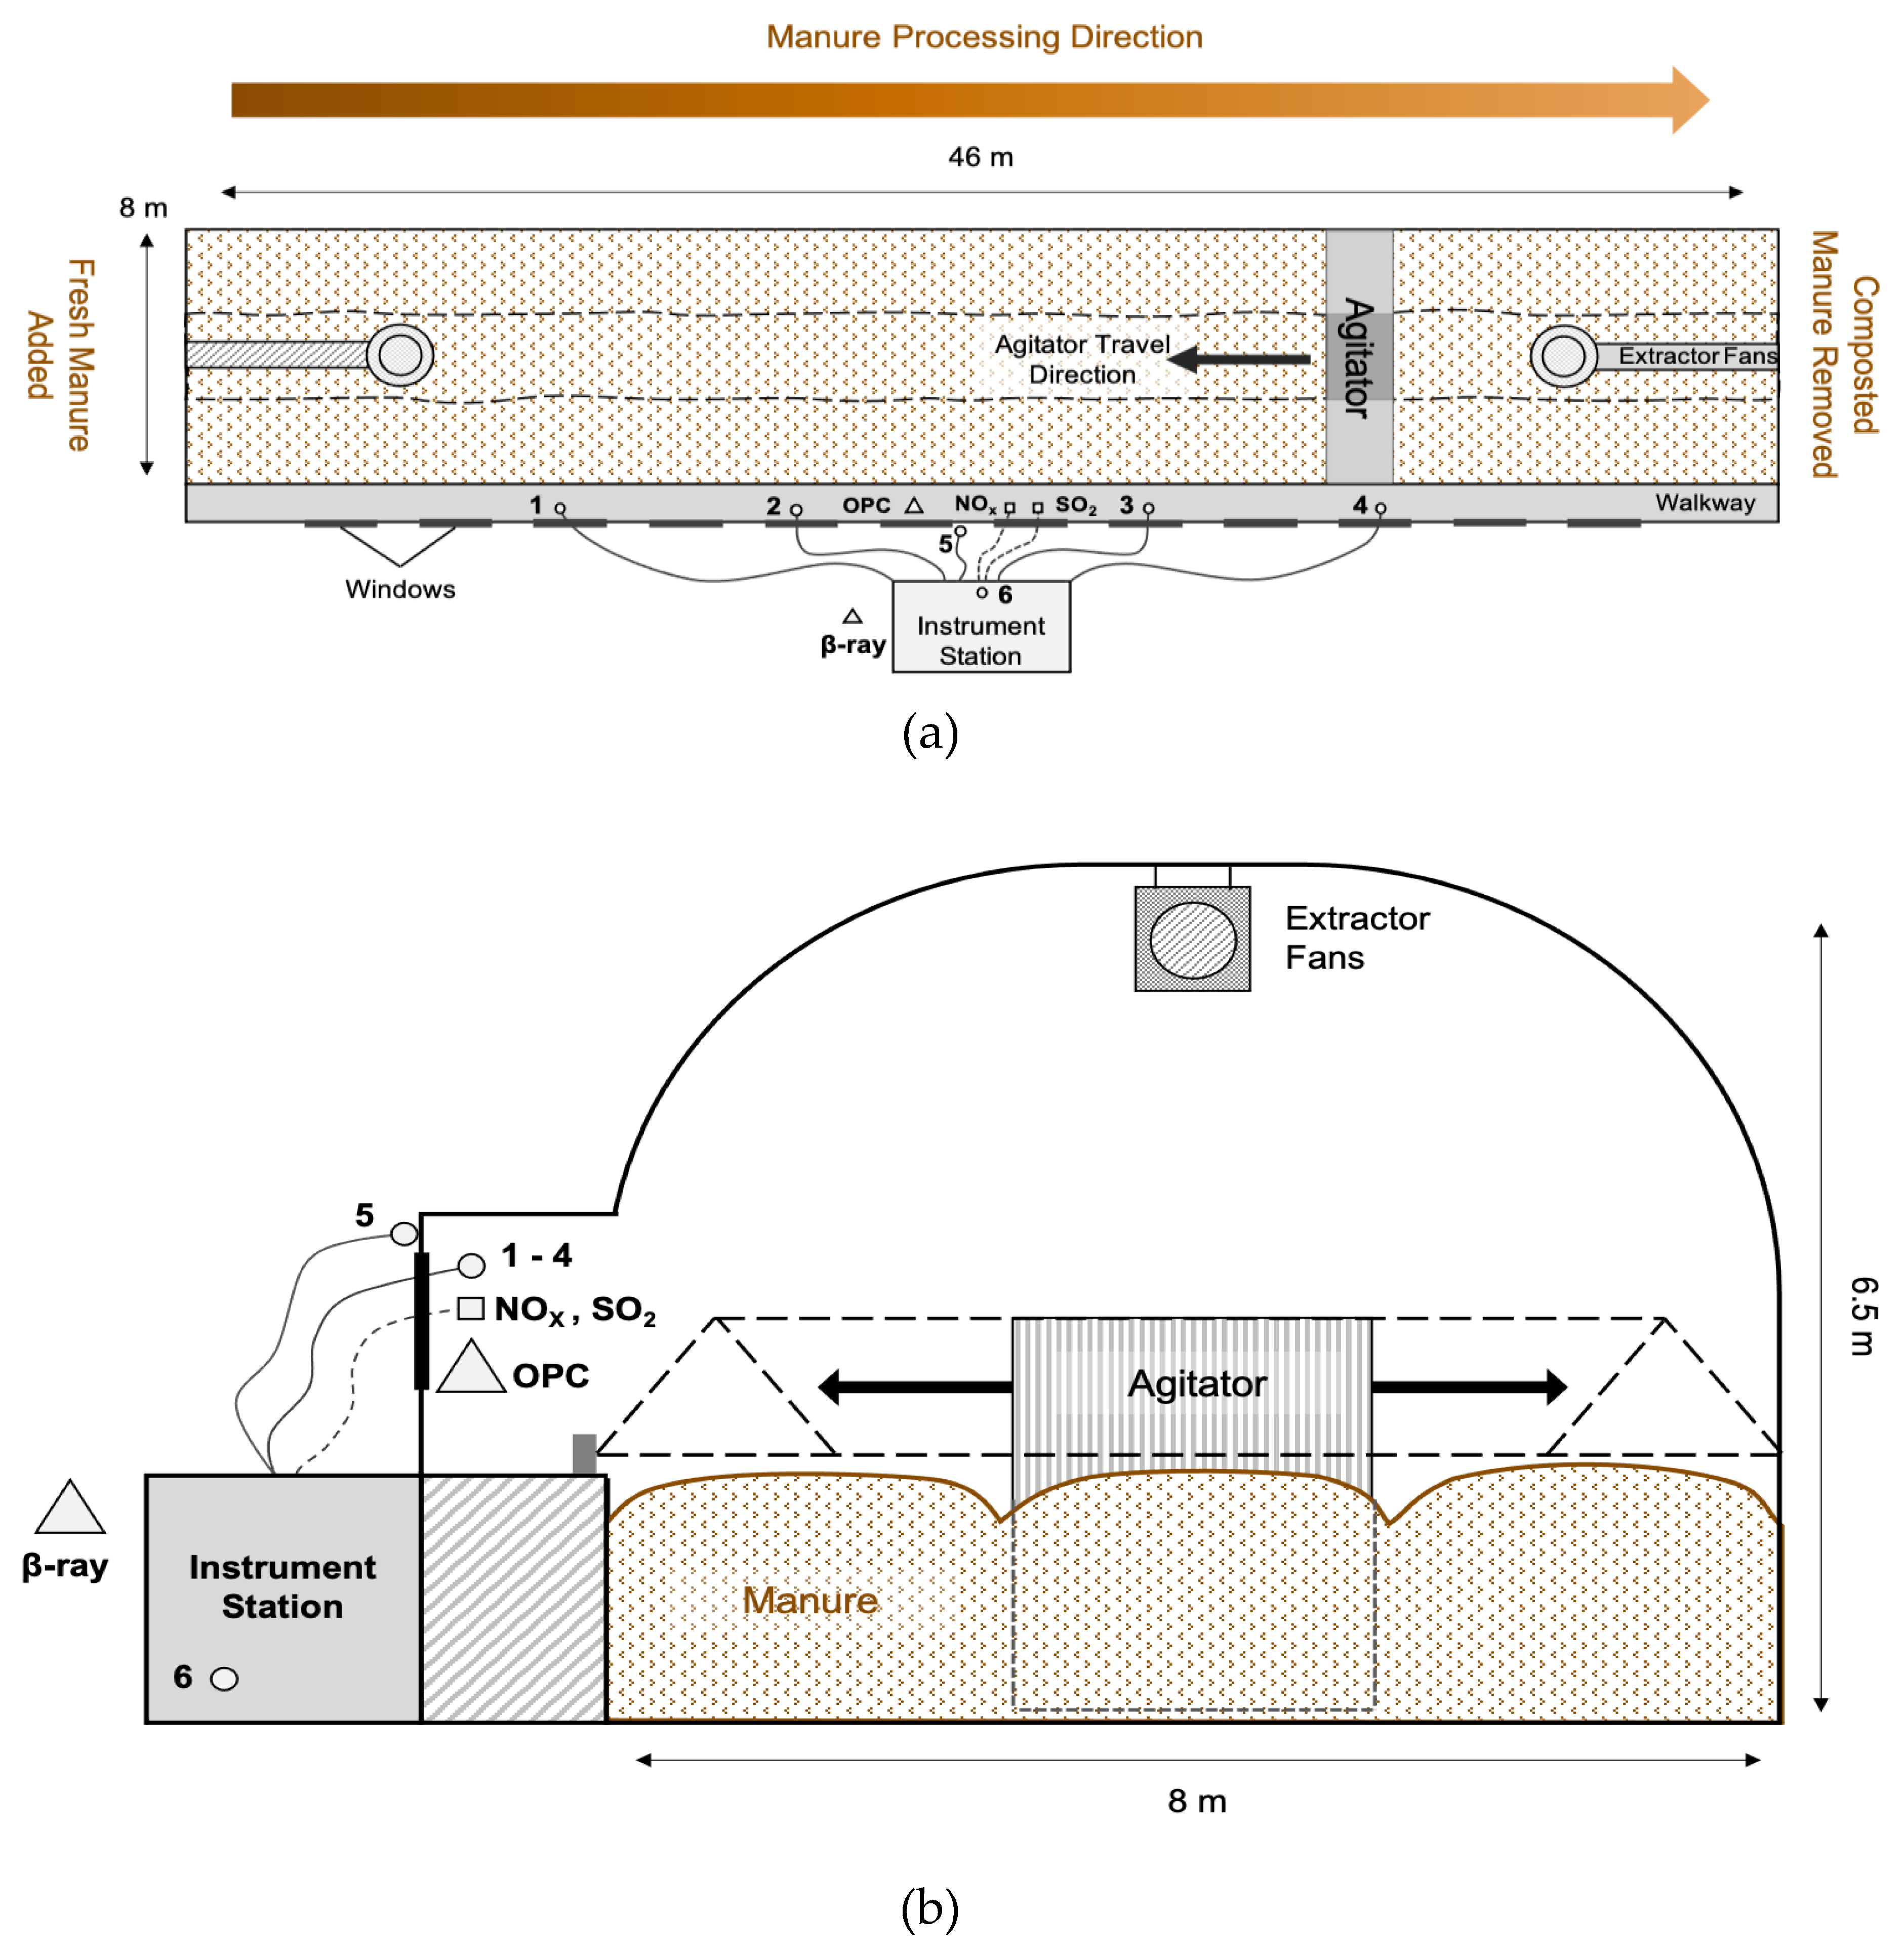
Figure 2.
Consistent diurnal pattern of temperature and relative humidity throughout the monitoring period.
Figure 2.
Consistent diurnal pattern of temperature and relative humidity throughout the monitoring period.
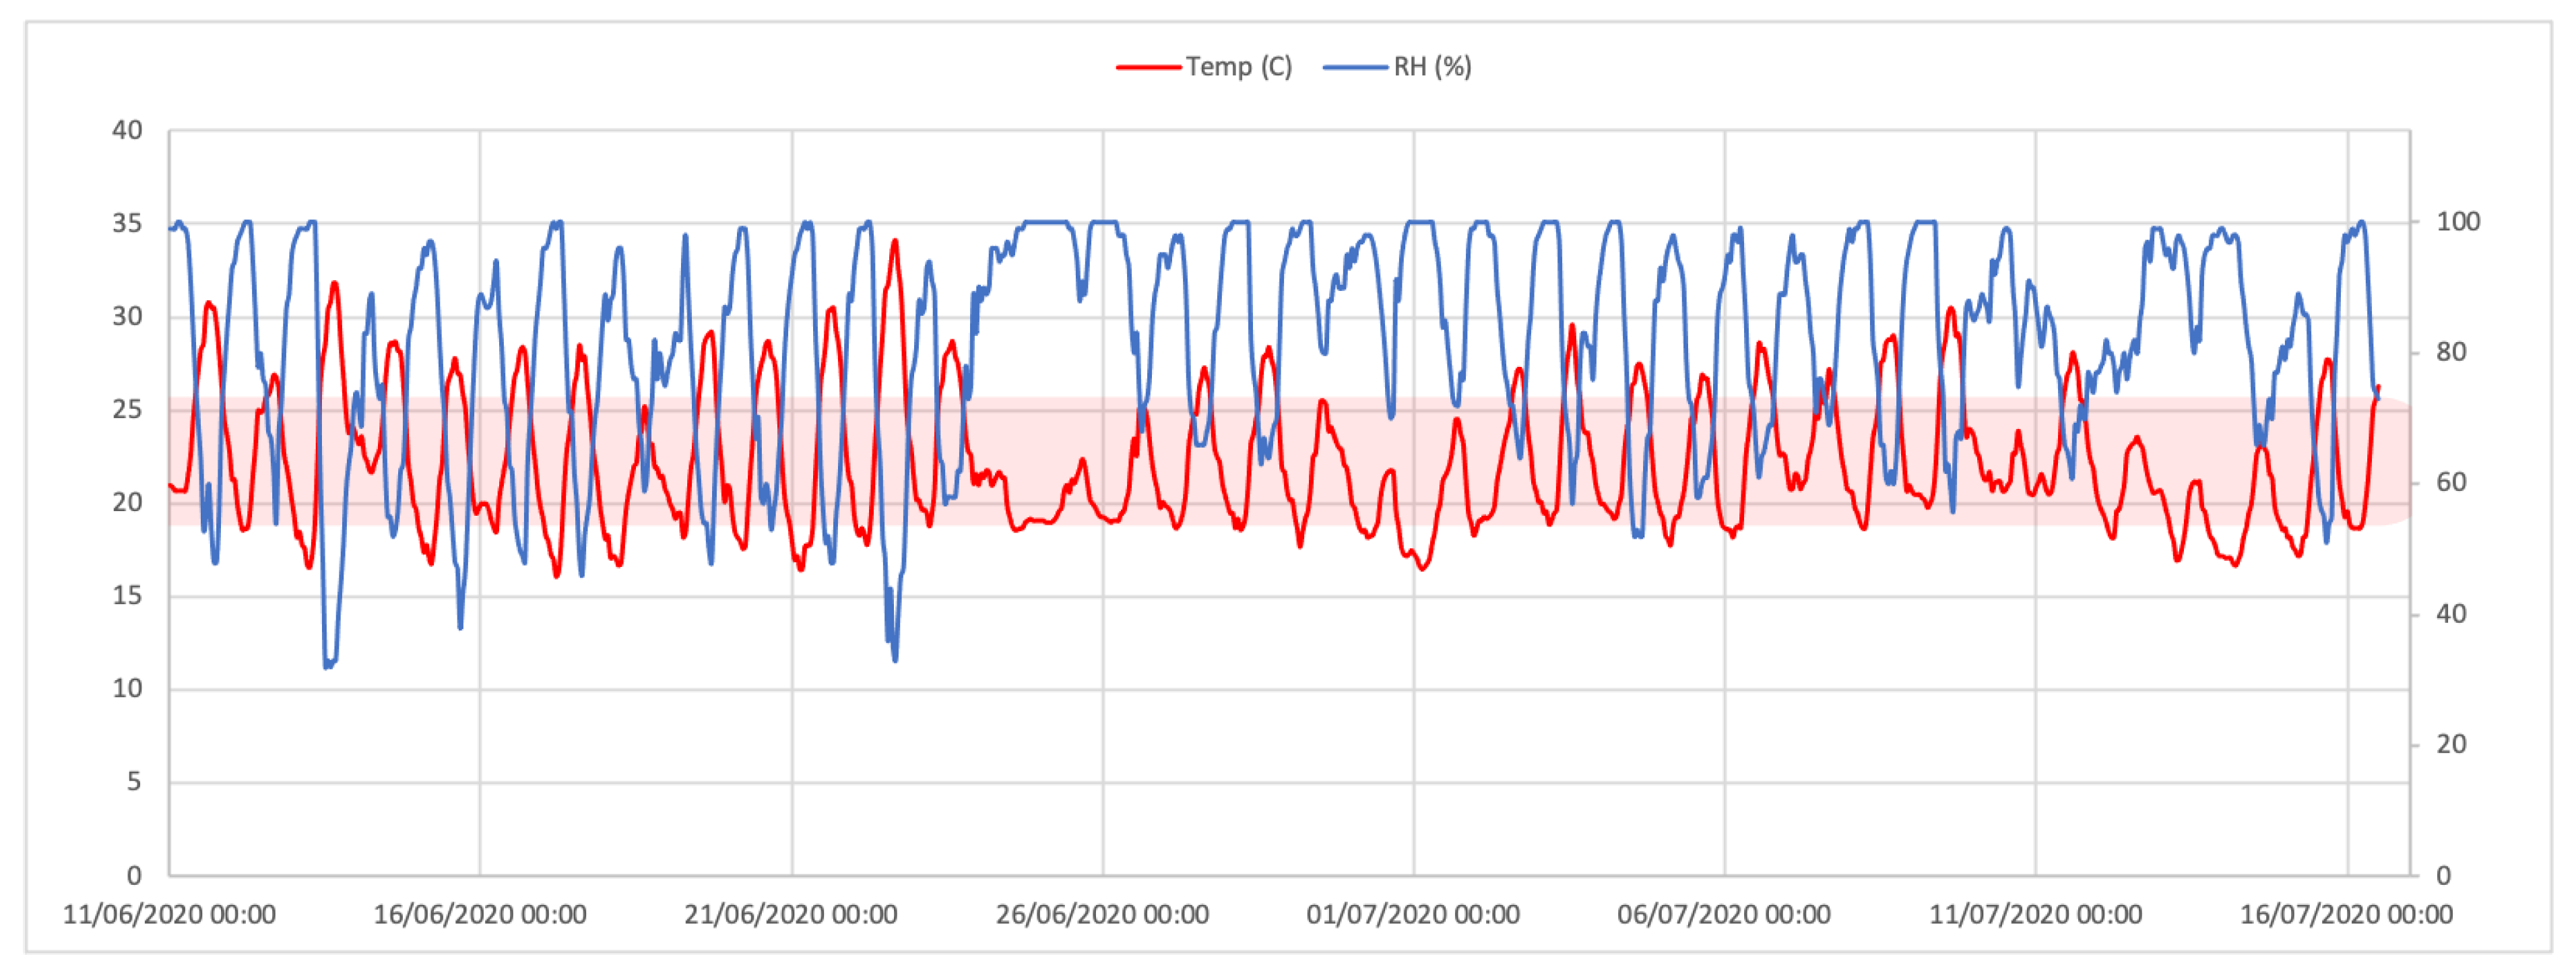
Figure 3.
Average concentrations and standard errors of measured pre-cursor gasses. The letters denote the results of a one-way ANNOVA test showing whether there is a significant difference in concentrations measured during separate periods: Weekday Day, Weekday Night, Weekend Day, and Weekend Night.
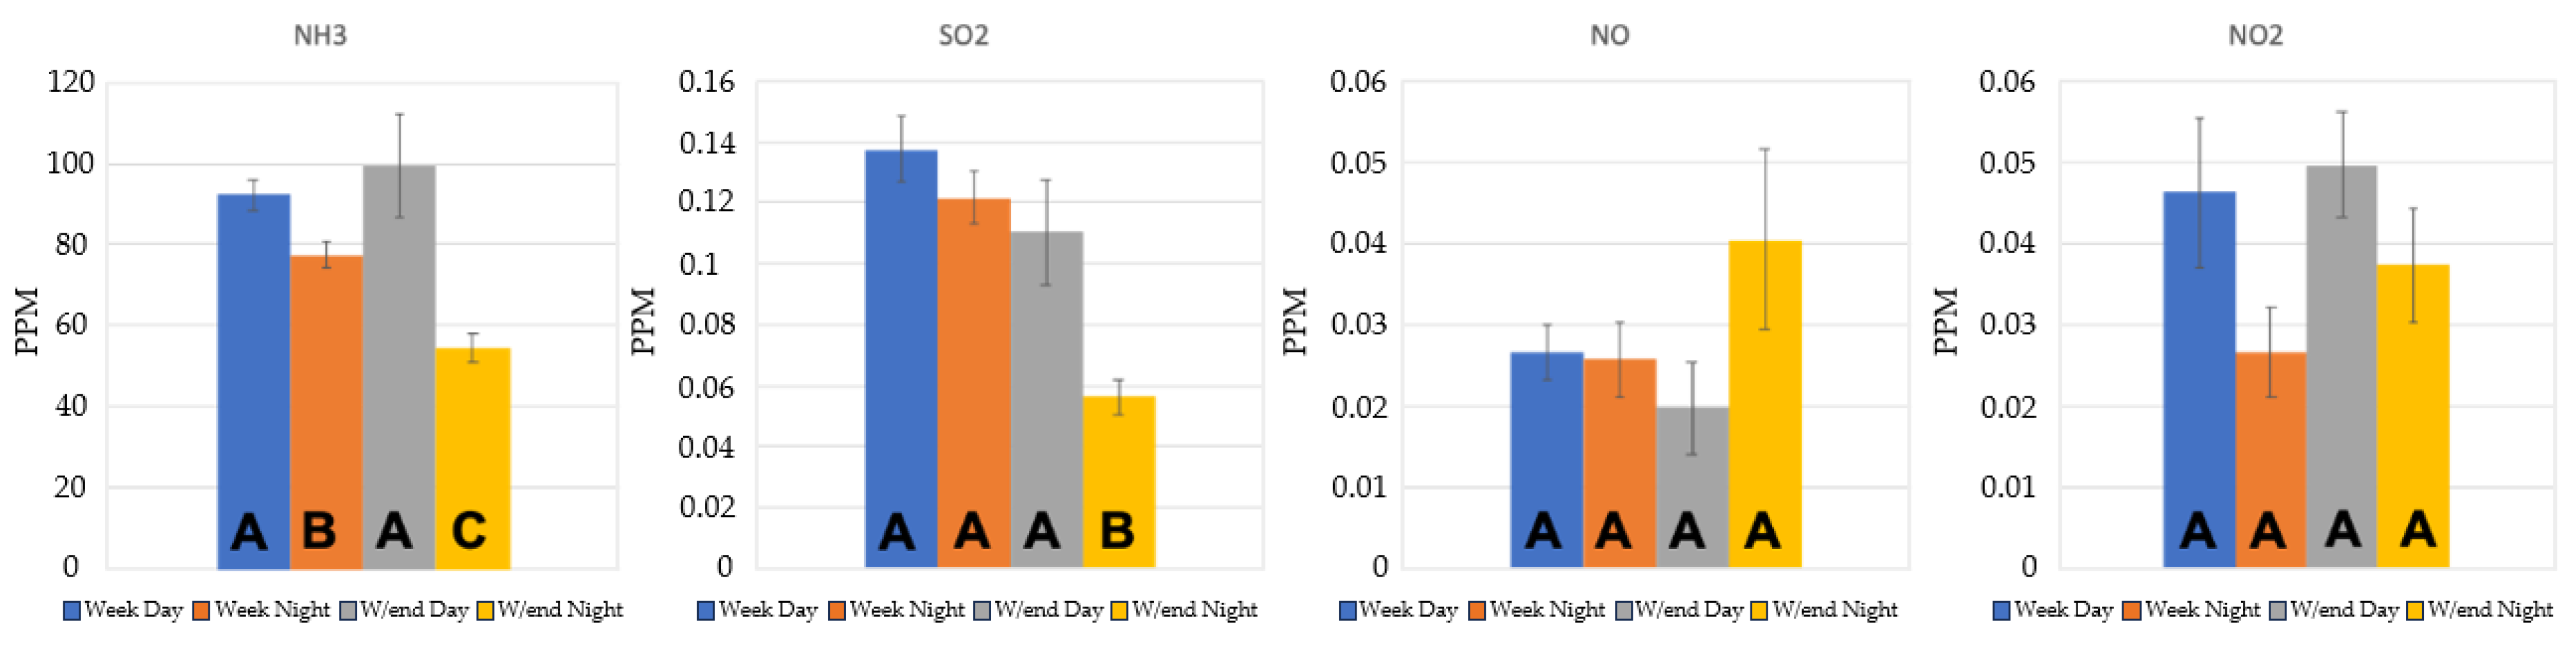
Figure 4.
Concentration trends along with a weekend event (20-21, June, 2020) of single broader NH3 concentration peak during 1 week time series (18 June to 25 June, 2020).
Figure 4.
Concentration trends along with a weekend event (20-21, June, 2020) of single broader NH3 concentration peak during 1 week time series (18 June to 25 June, 2020).
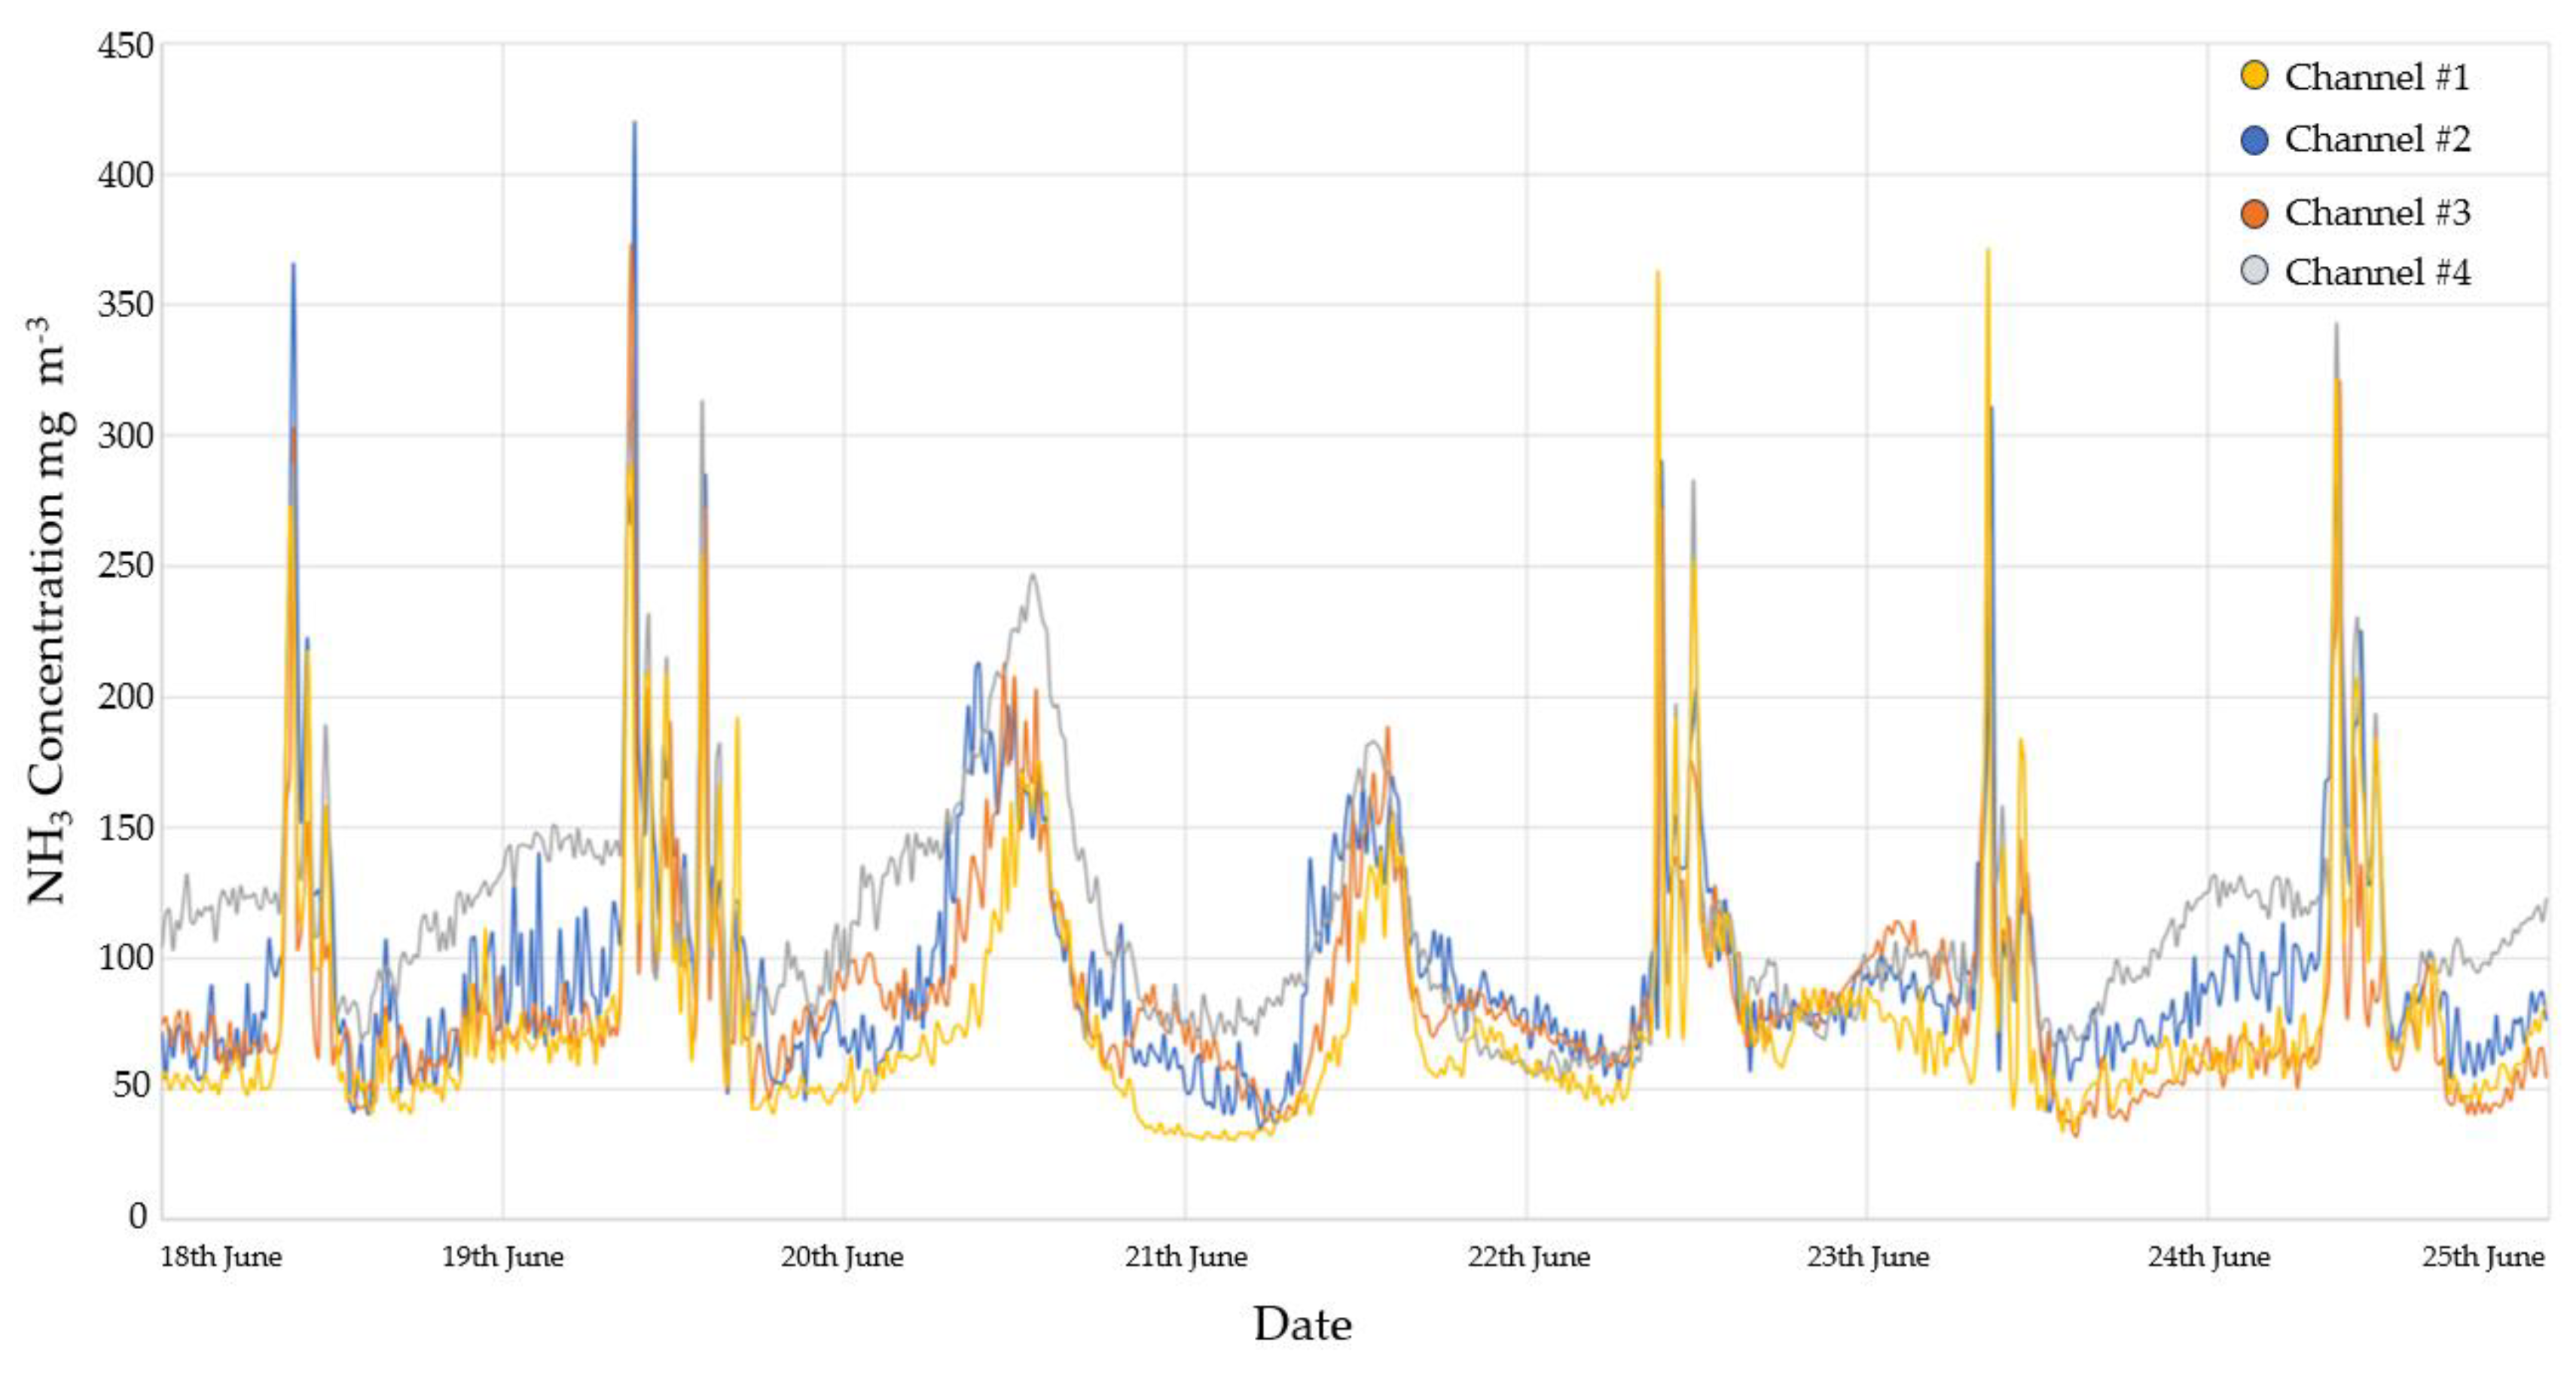
Figure 5.
Spikes of NH3 trends followed by agitation practice from four sampling points (18 June 2022).
Figure 5.
Spikes of NH3 trends followed by agitation practice from four sampling points (18 June 2022).
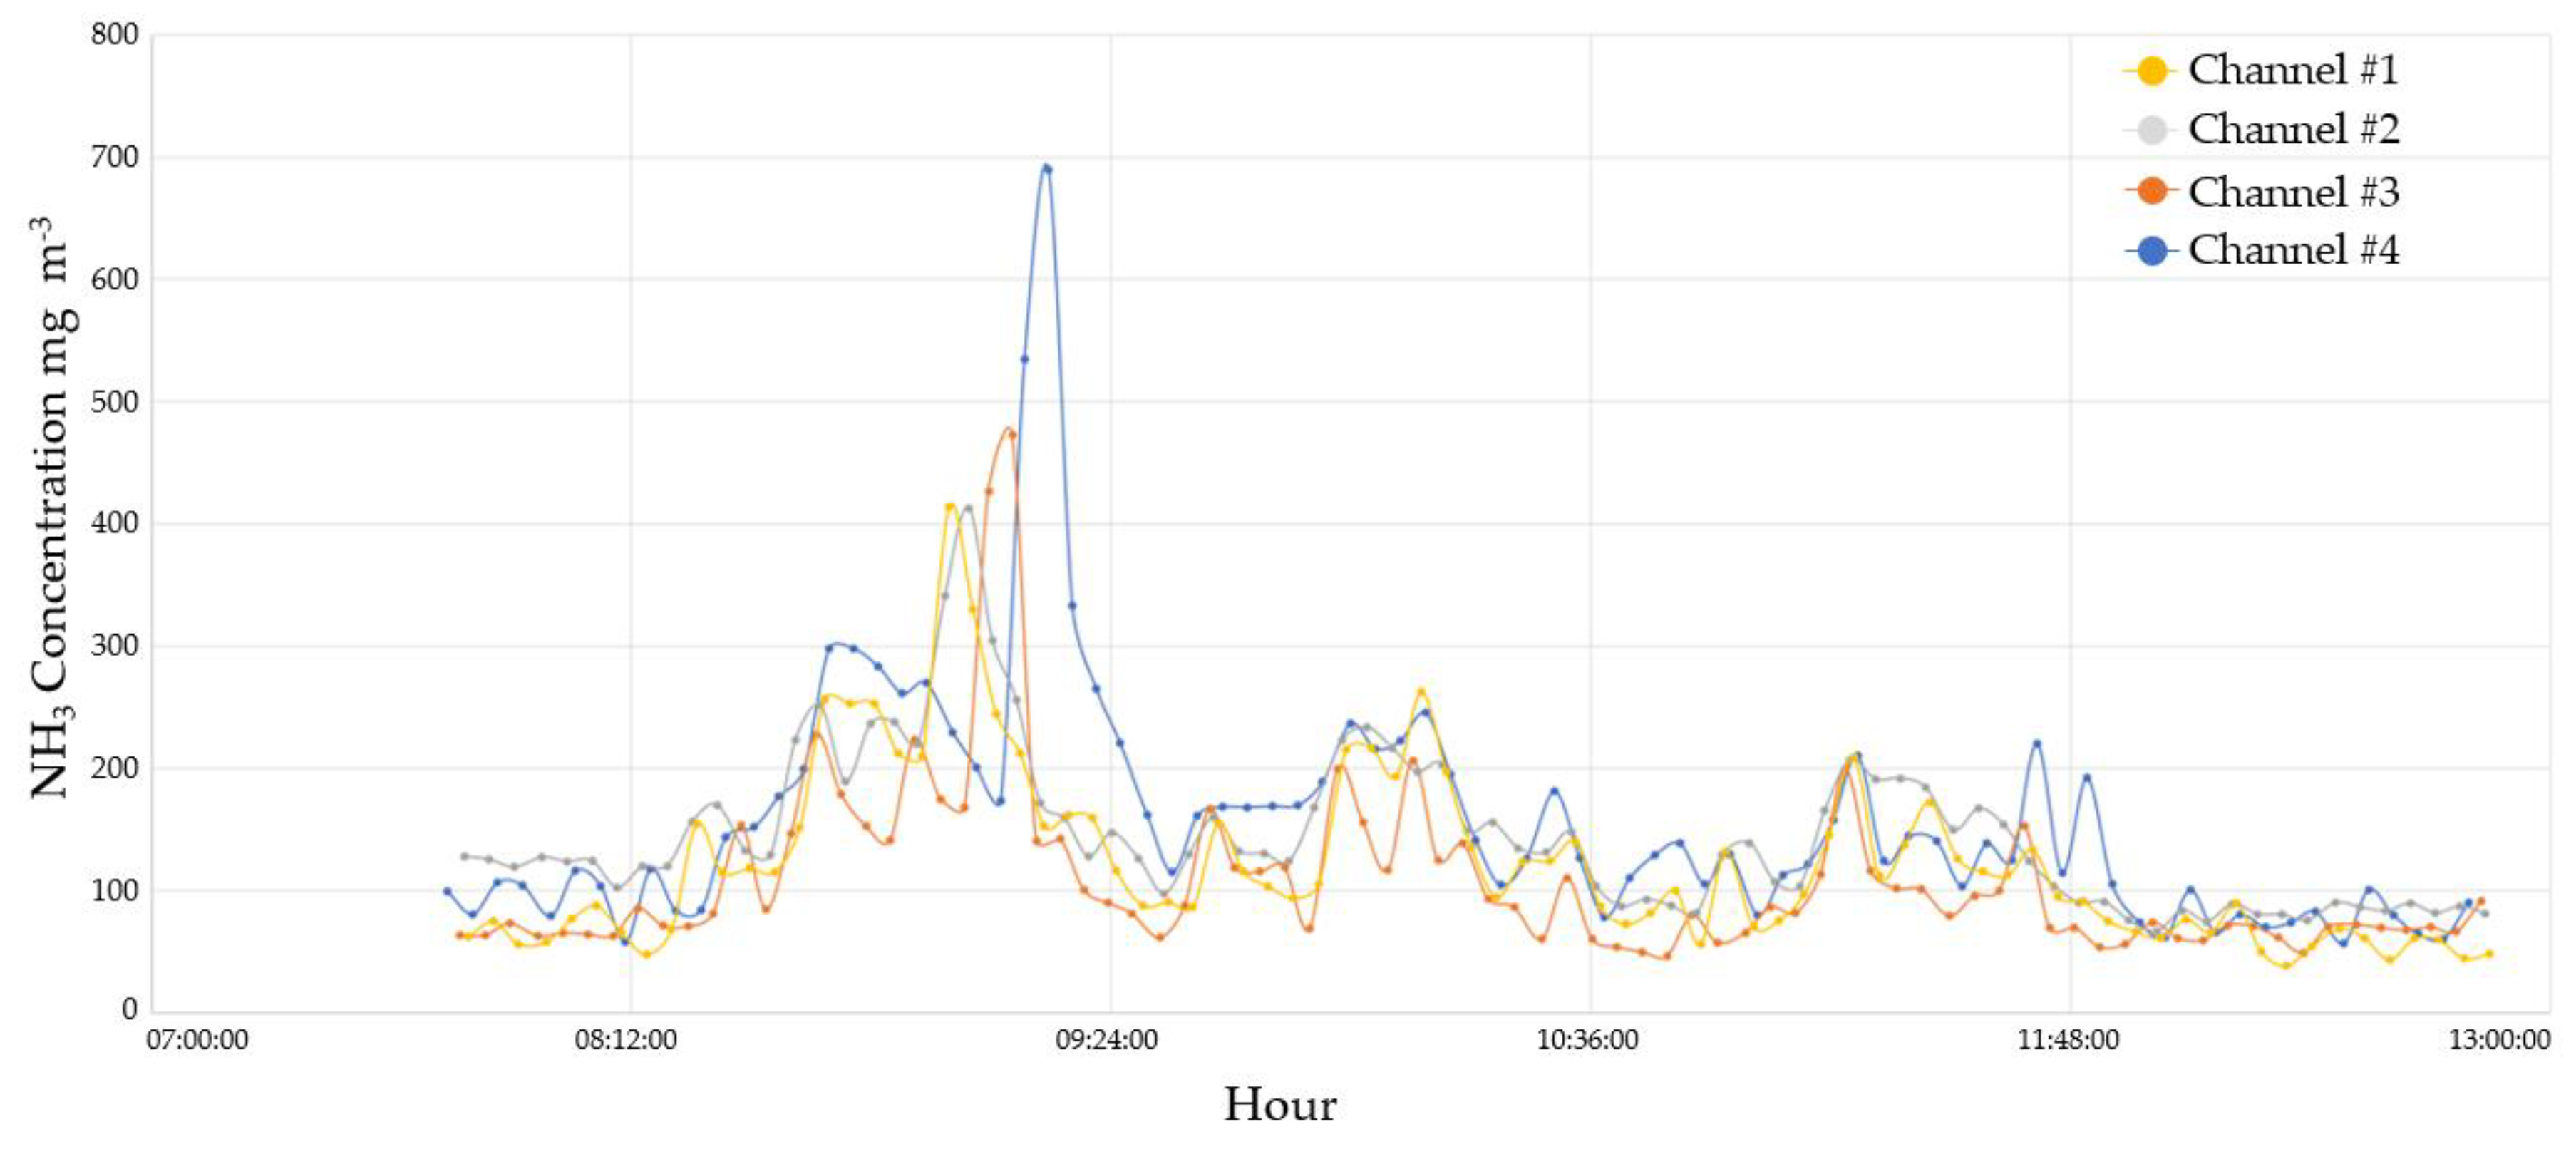
Figure 6.
Comparison of average and peak NH3 concentrations inside the facility (internal) and outside at 3m height and ground level (external) adjacent to manure agitation hall.
Figure 6.
Comparison of average and peak NH3 concentrations inside the facility (internal) and outside at 3m height and ground level (external) adjacent to manure agitation hall.
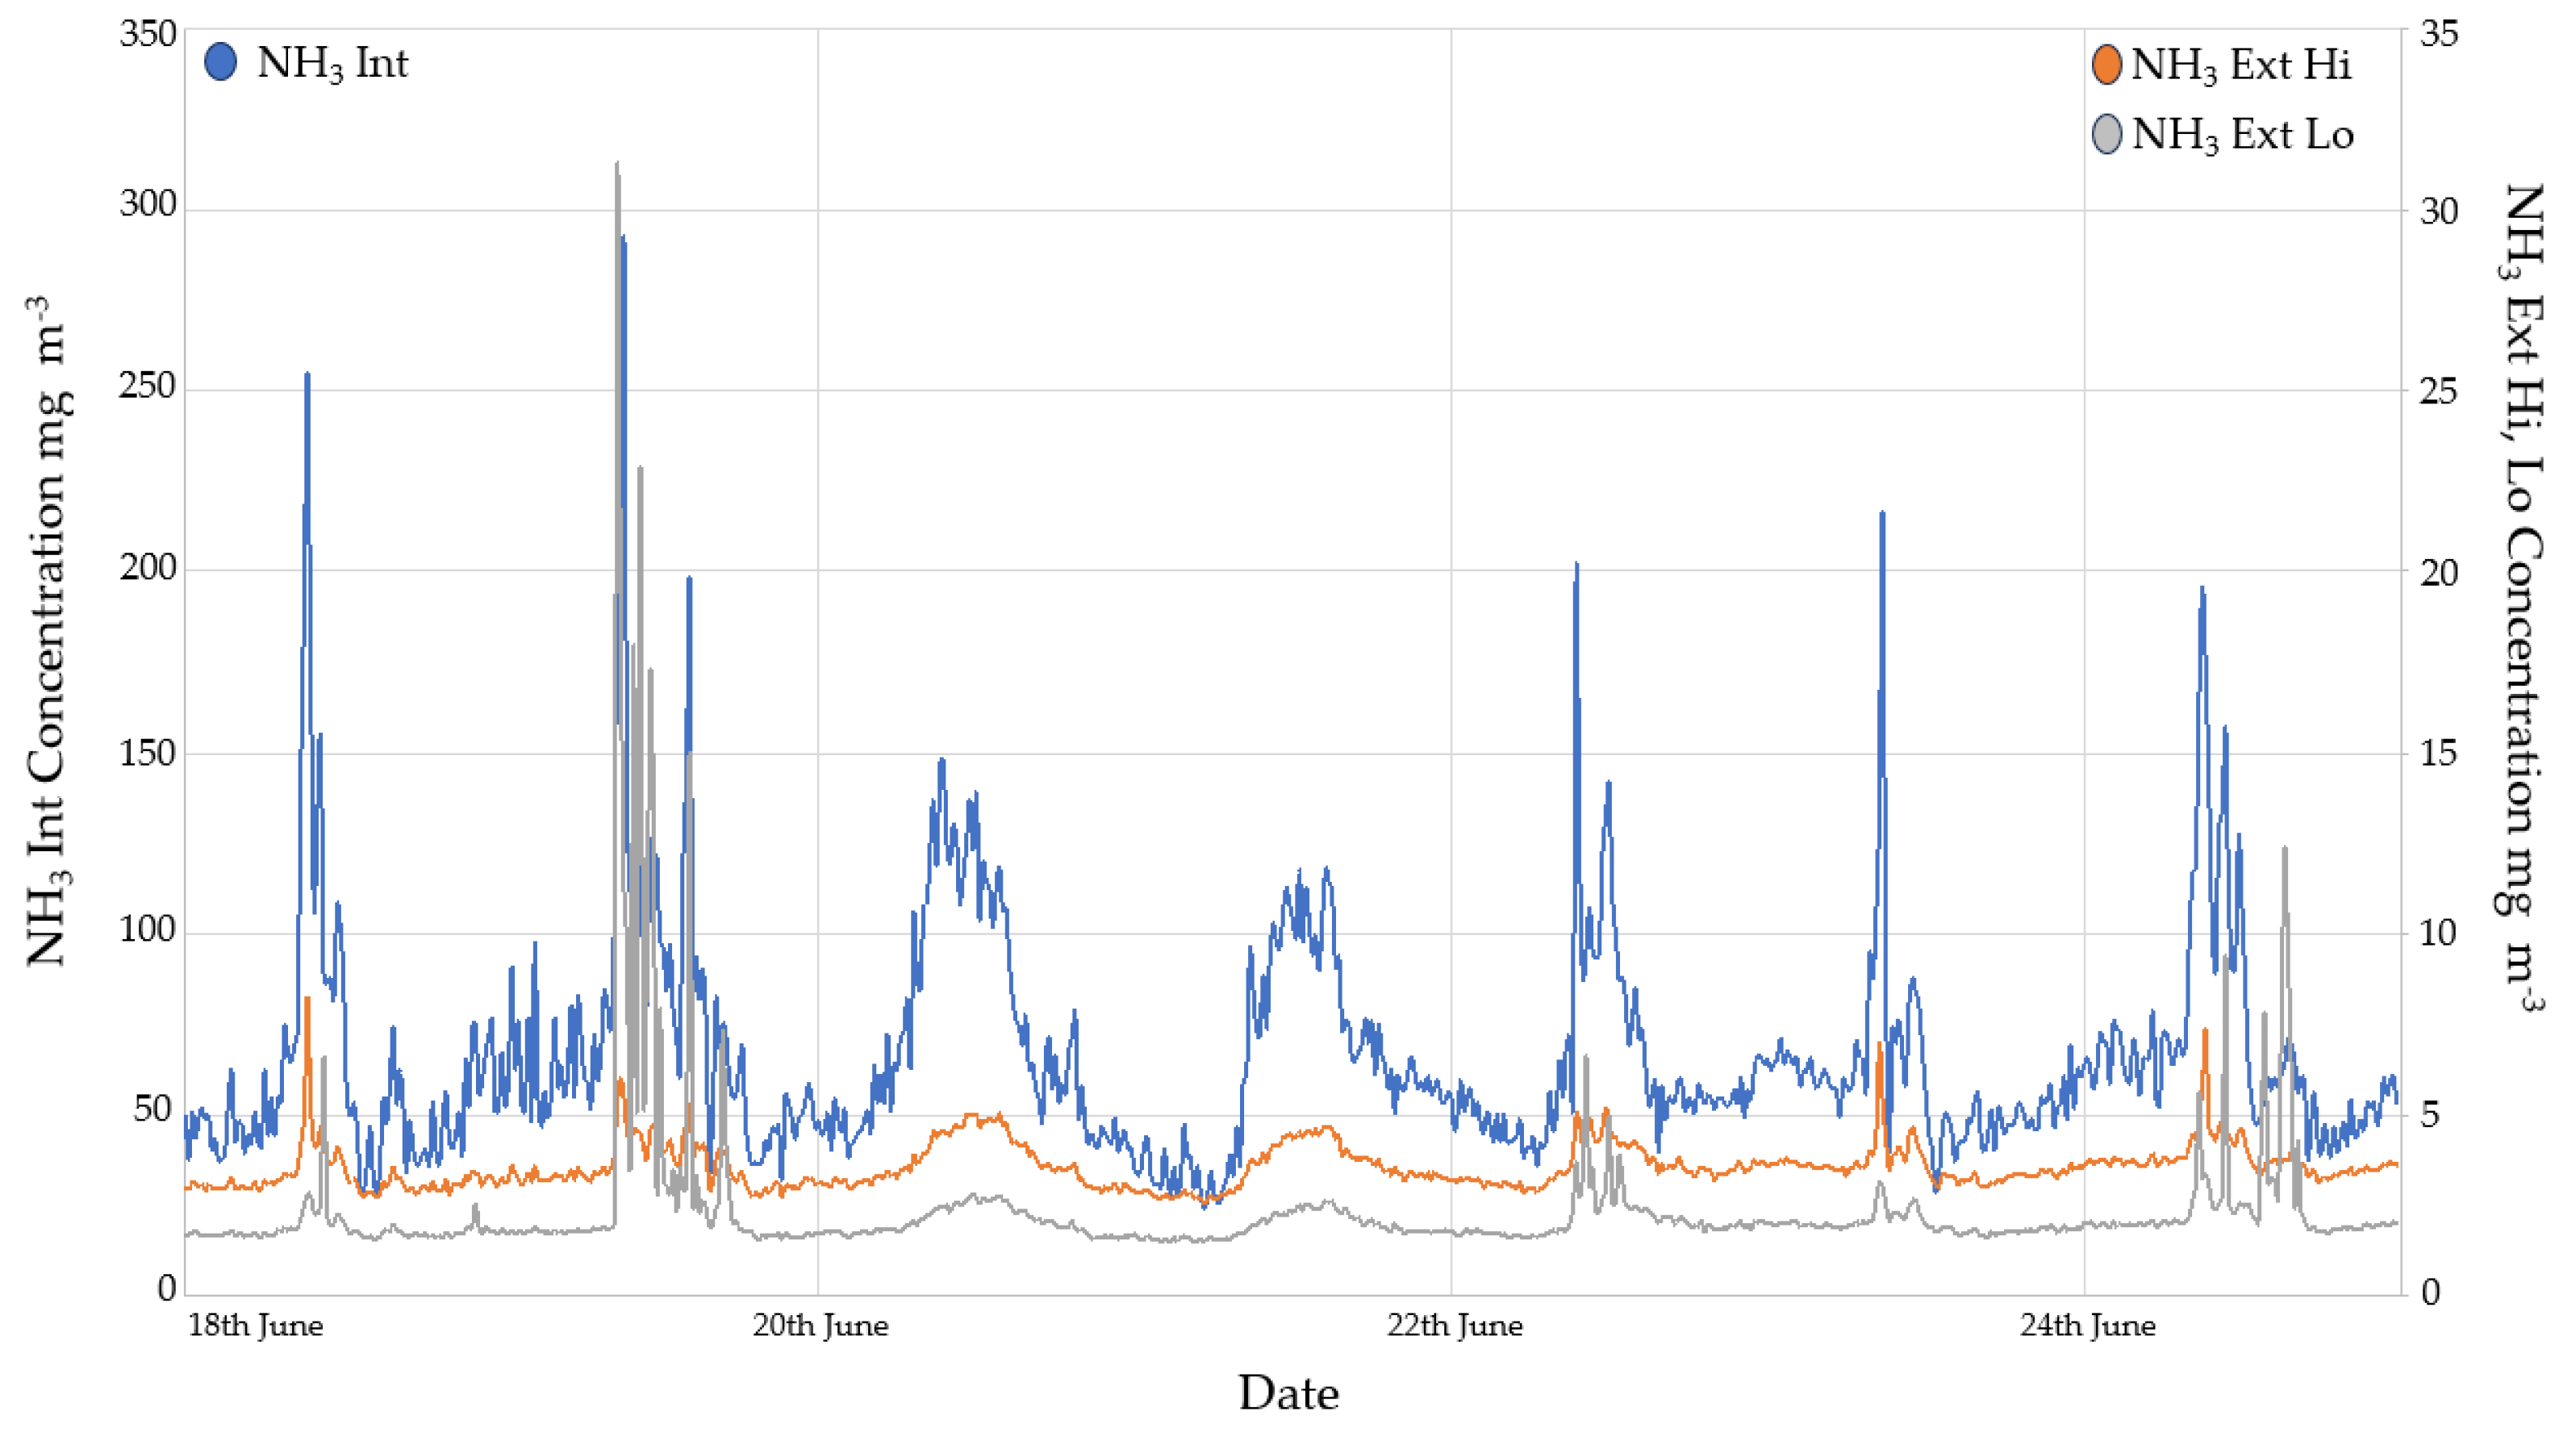
Figure 7.
Comparative analysis of SO2, NH3, and NO concentrations around a manure facility that showed patterns of emission peaks during agitation activities and weekend variability.
Figure 7.
Comparative analysis of SO2, NH3, and NO concentrations around a manure facility that showed patterns of emission peaks during agitation activities and weekend variability.
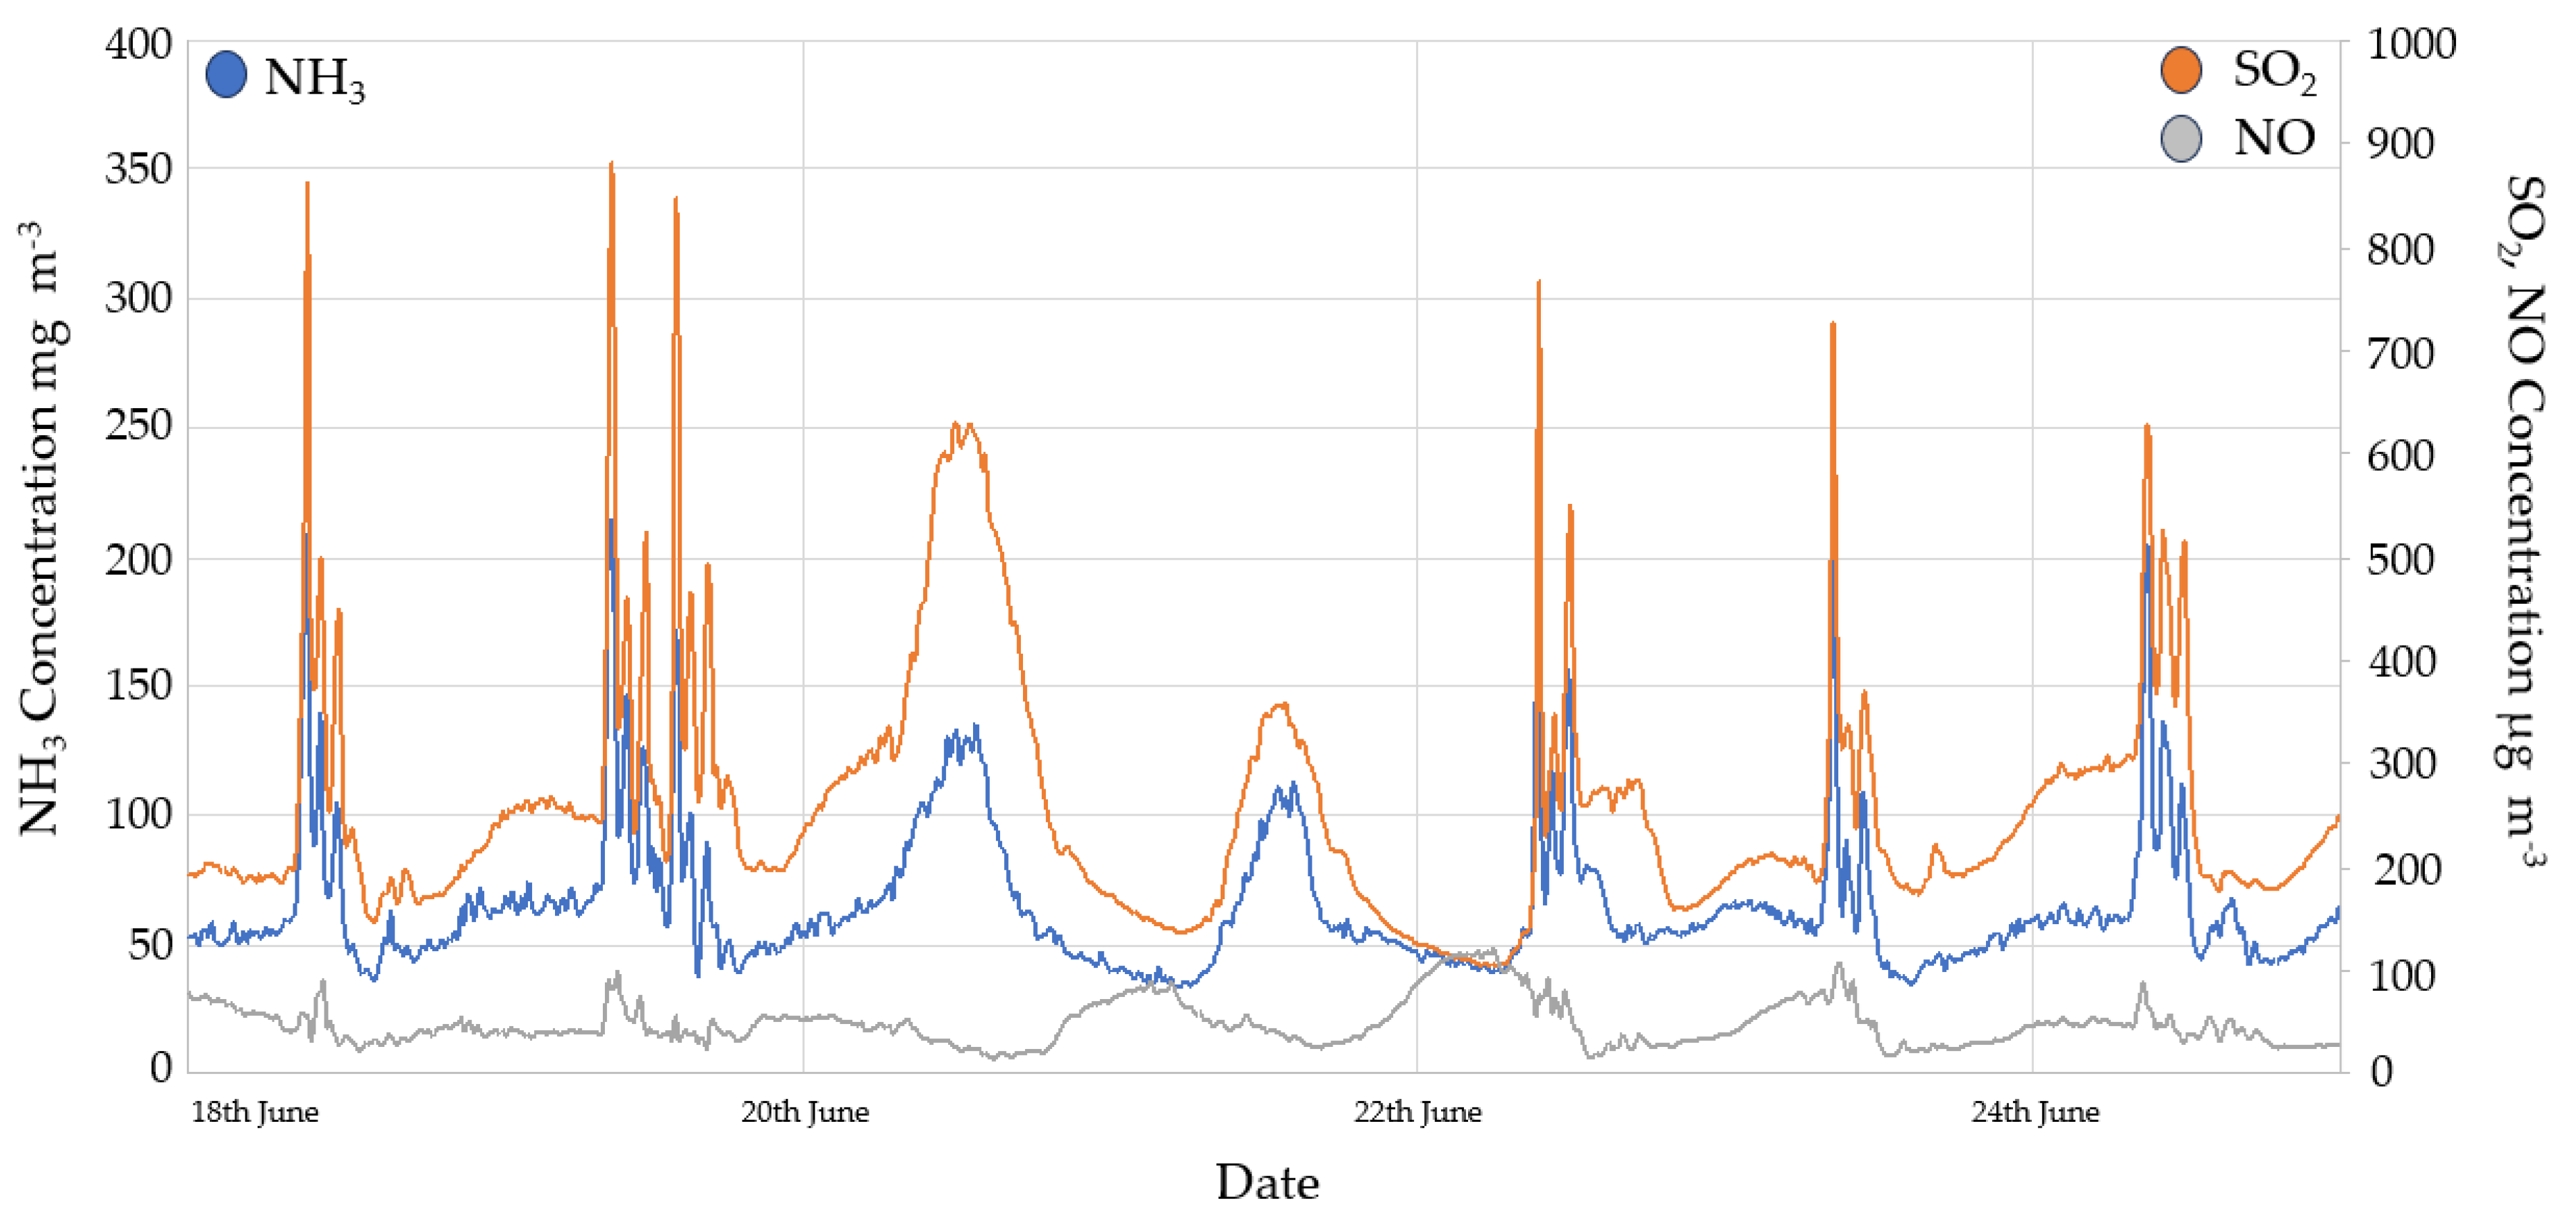
Figure 8.
Correlation analysis of NH3 and SO2 concentrations which is evidence of strong positive association during emission events.
Figure 8.
Correlation analysis of NH3 and SO2 concentrations which is evidence of strong positive association during emission events.
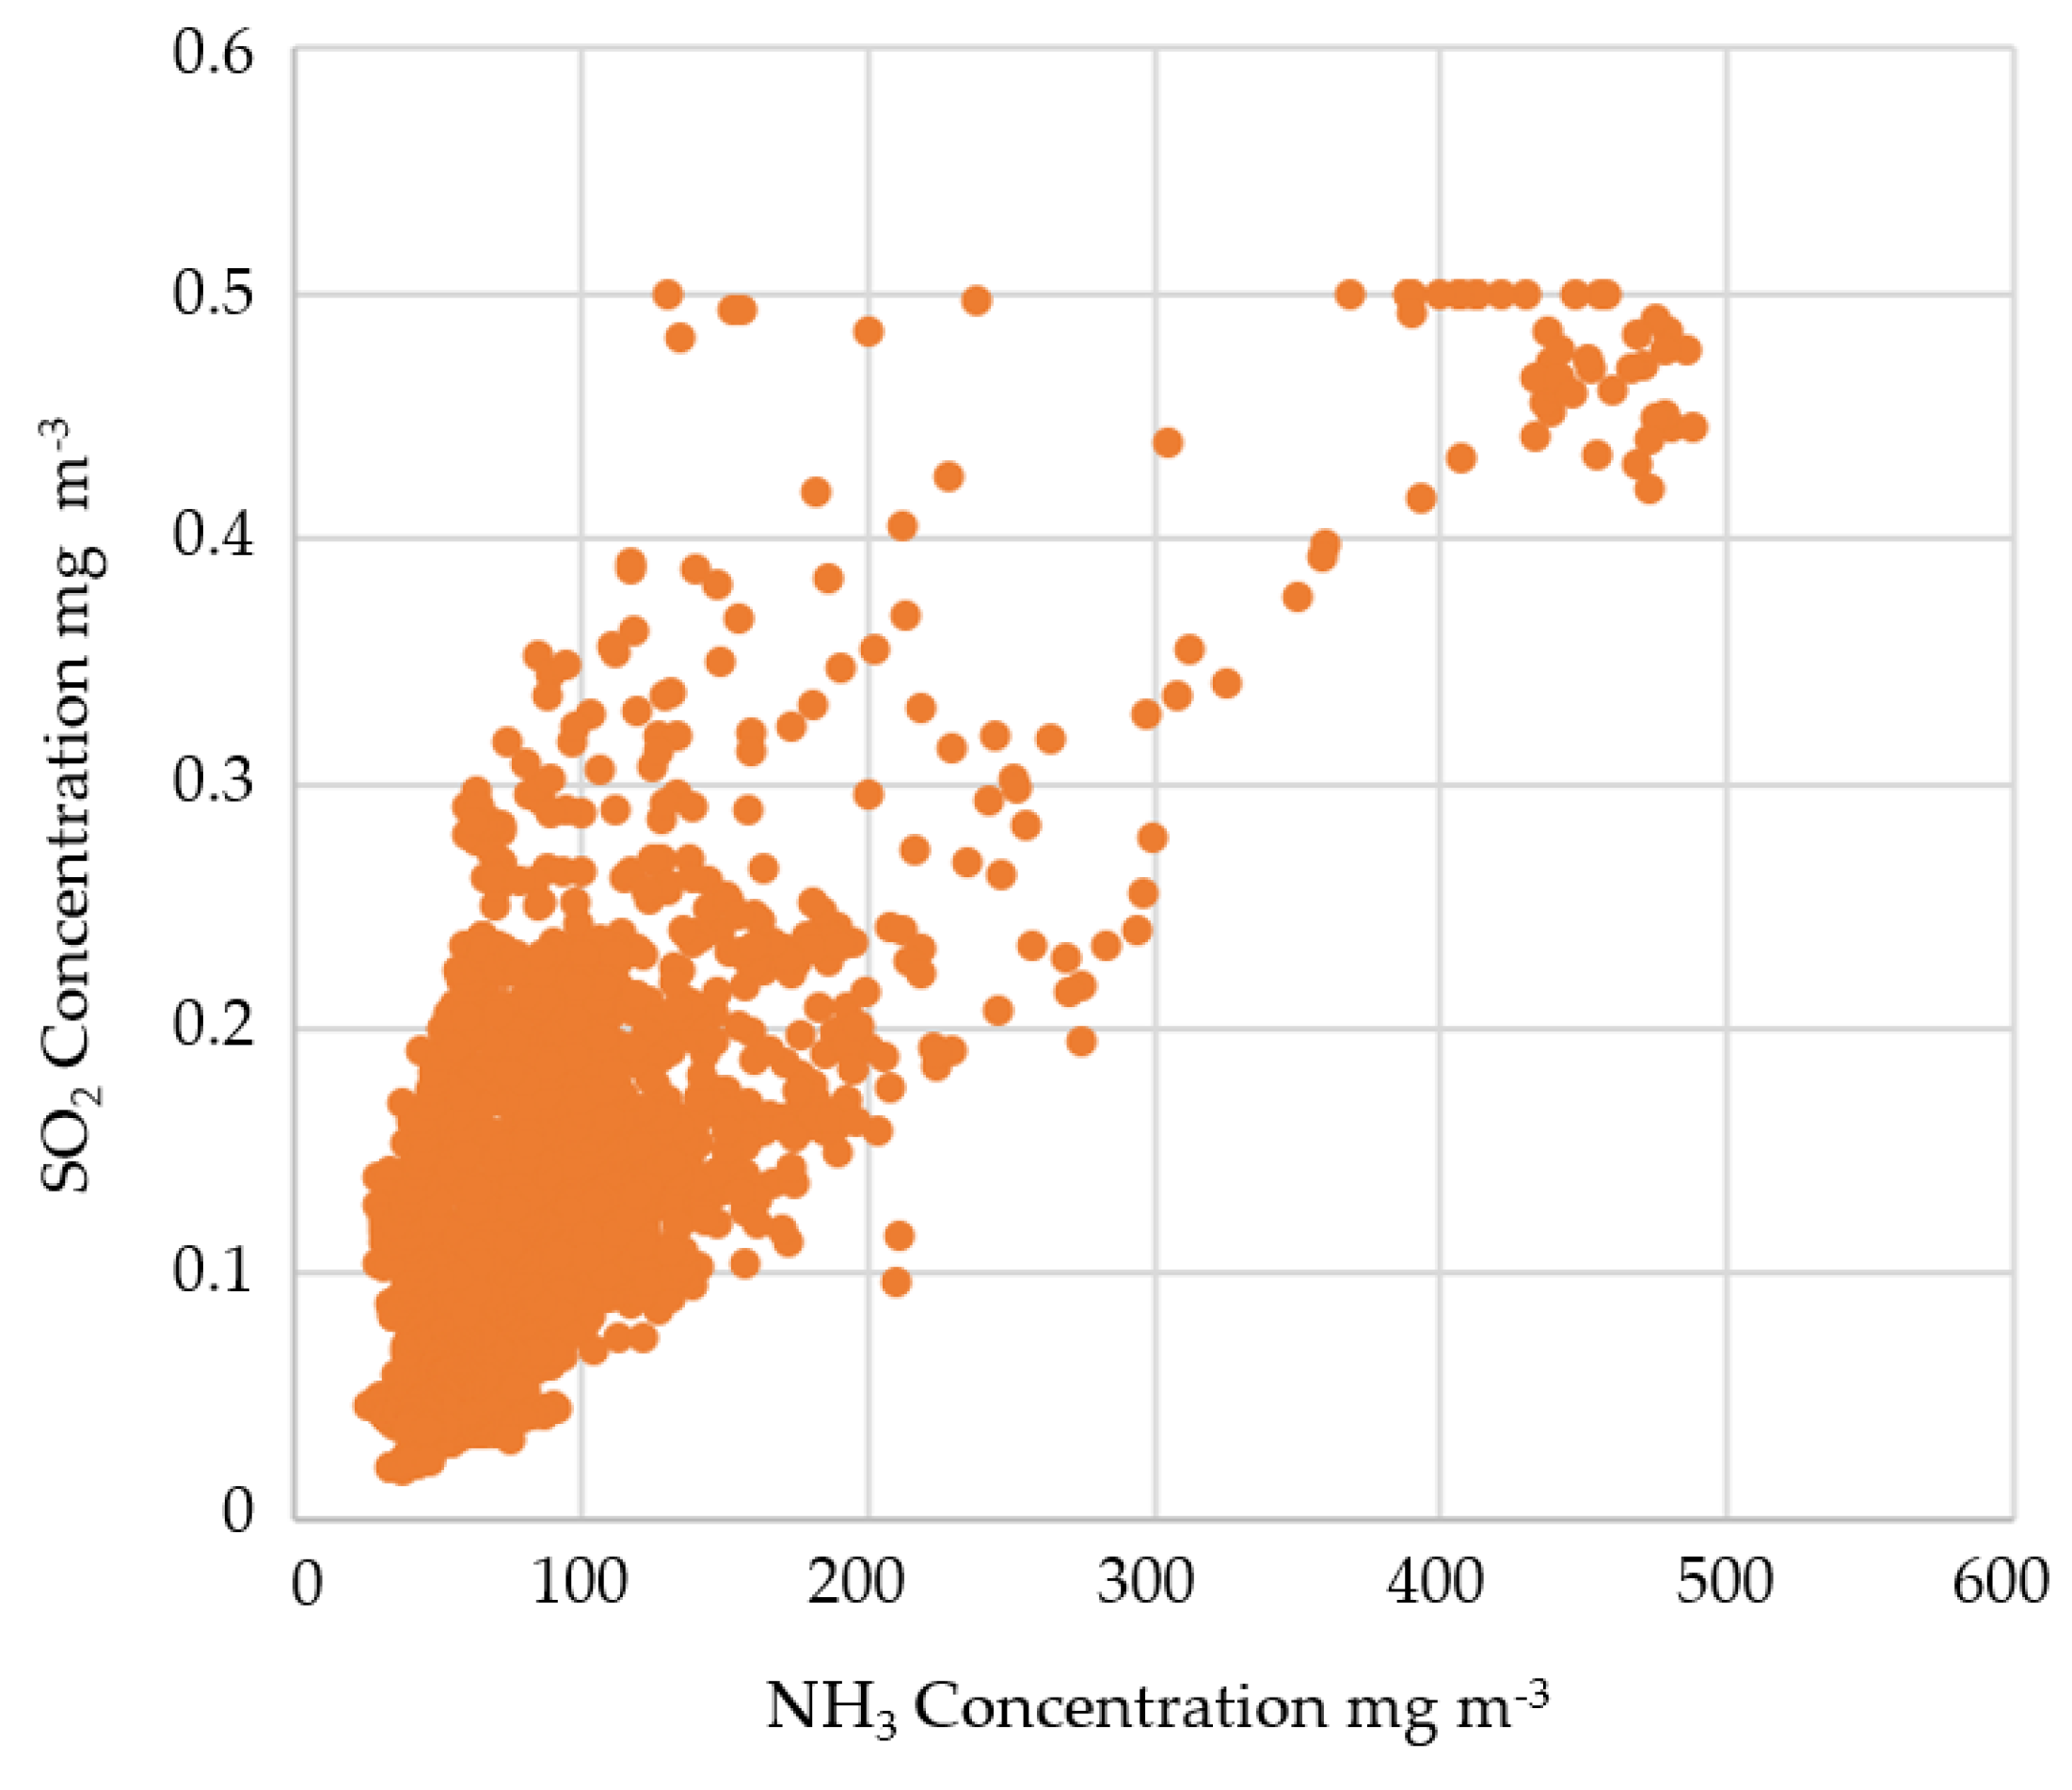
Figure 9.
Negative correlation with the relative humidity on NO2 concentrations.
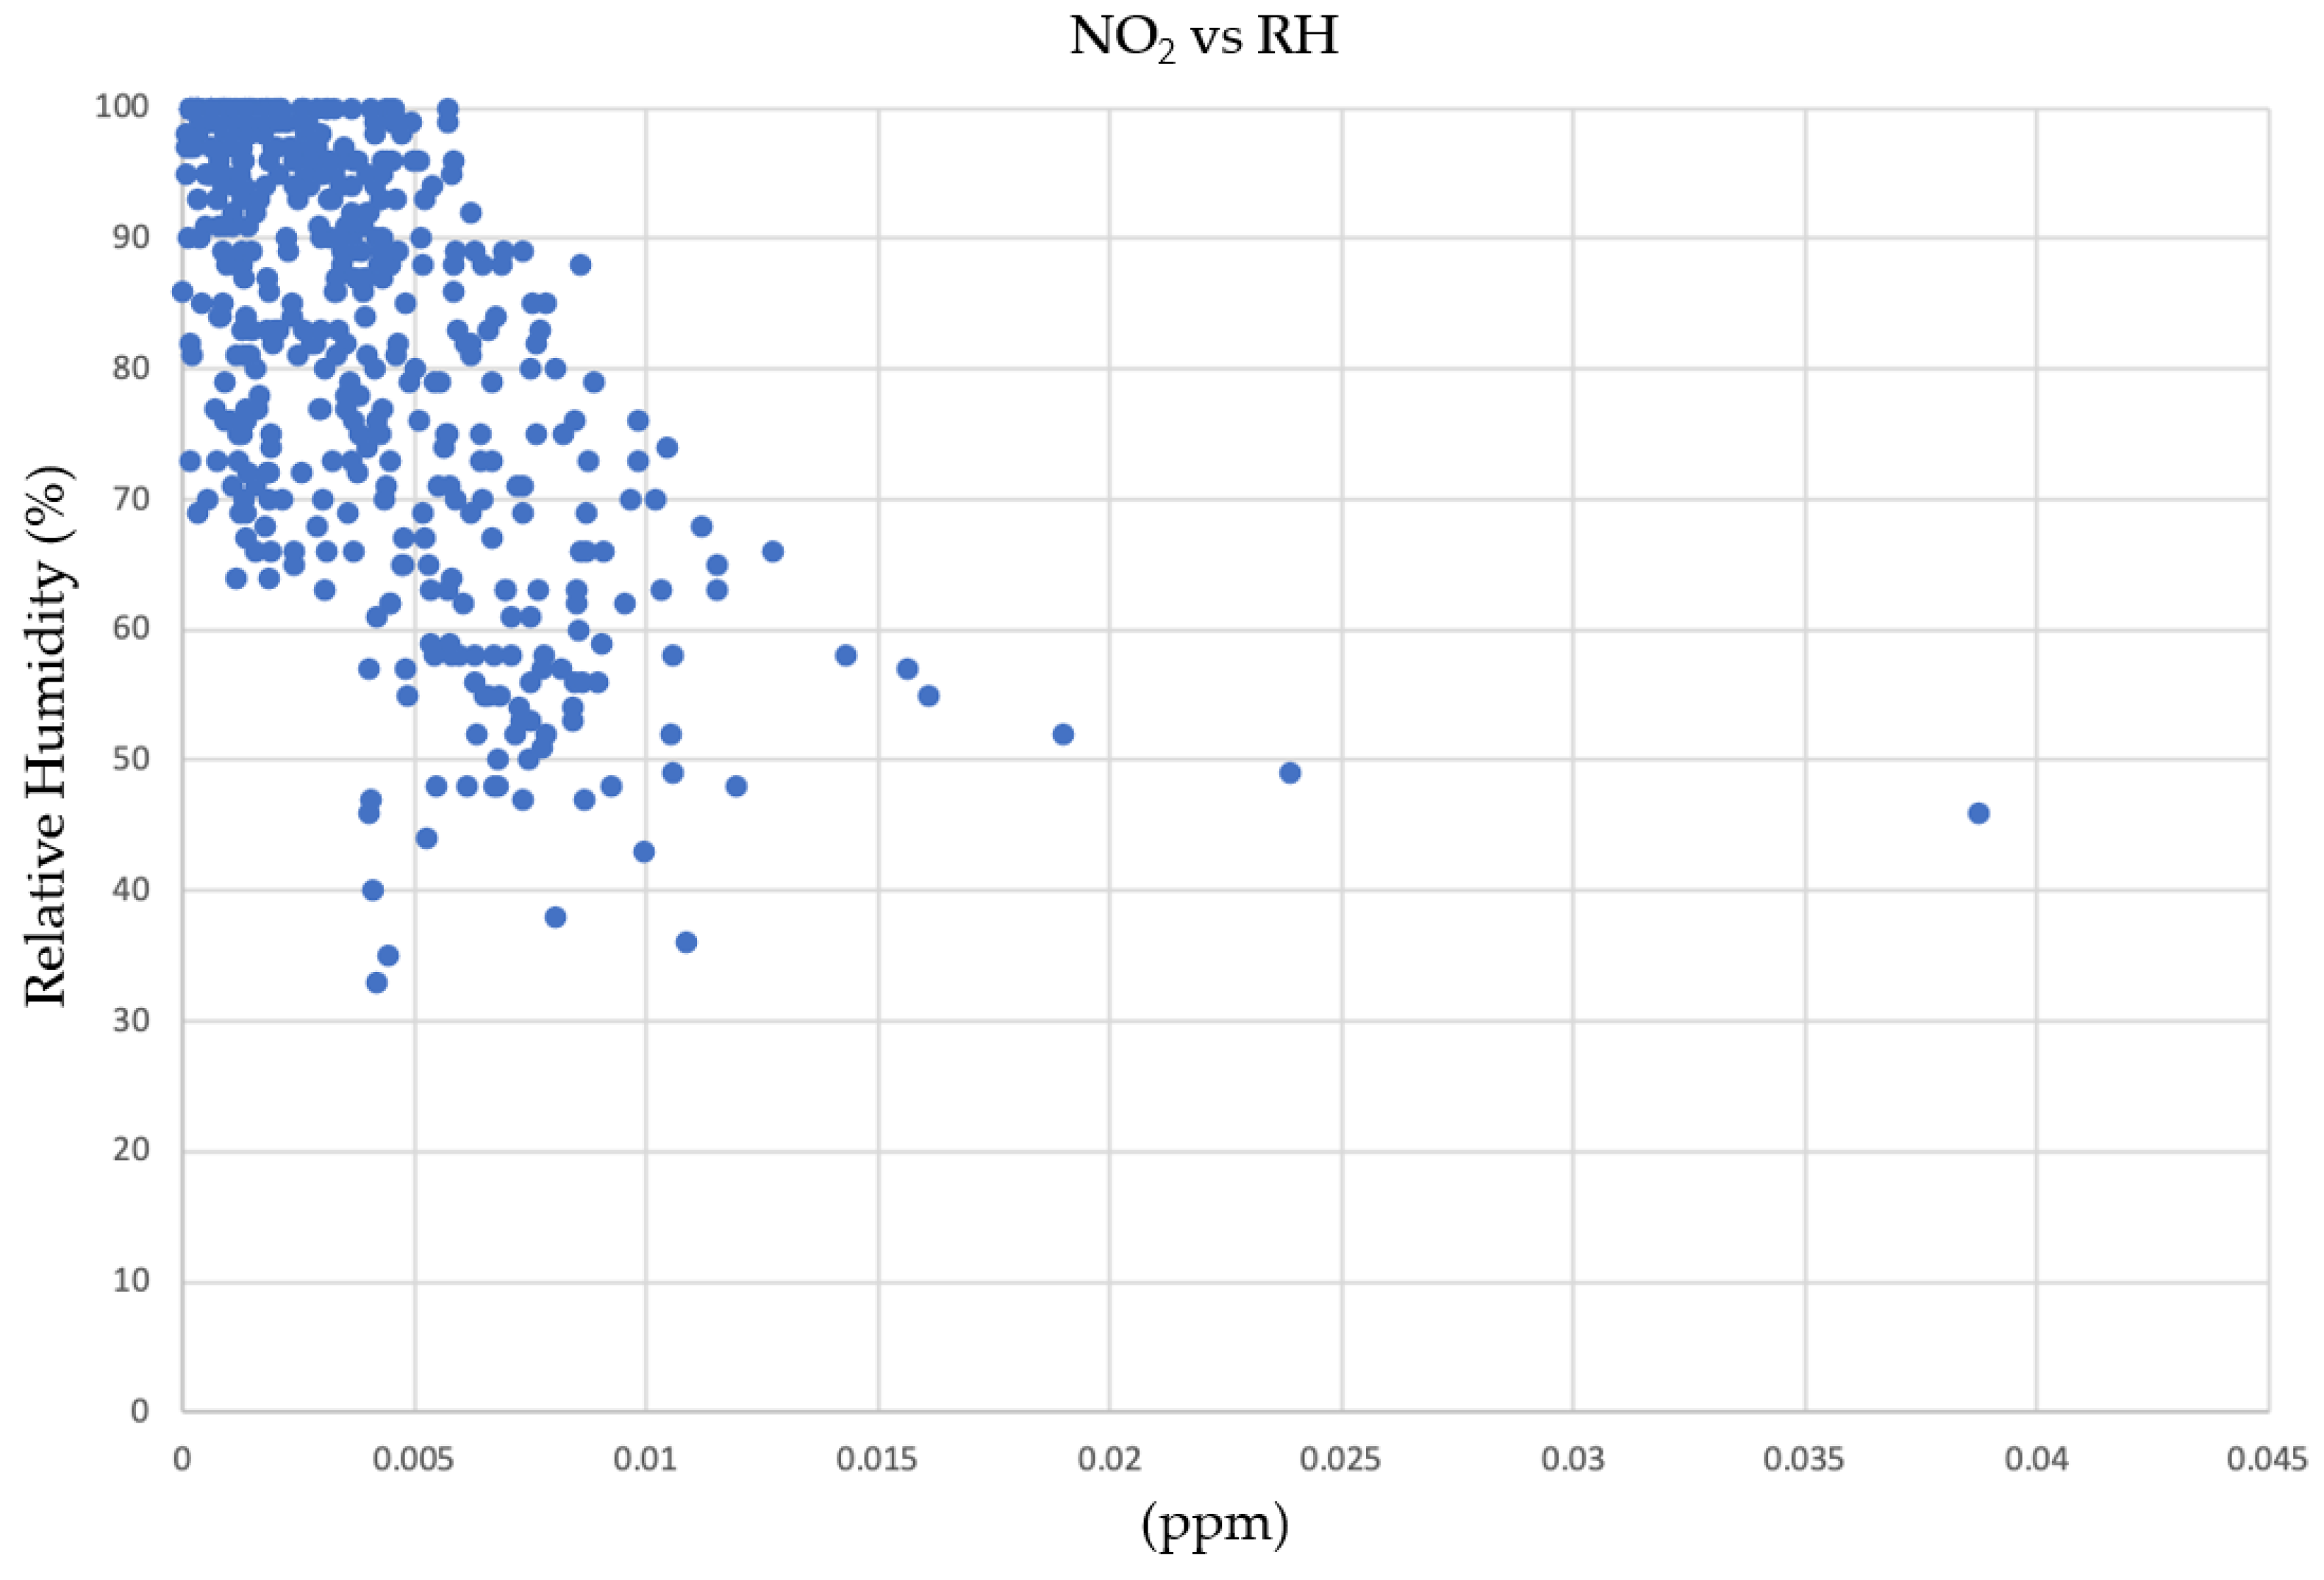
Figure 10.
Comparison with PM2.5 results between Beta-ray measurements and data from Paju weather station.
Figure 10.
Comparison with PM2.5 results between Beta-ray measurements and data from Paju weather station.
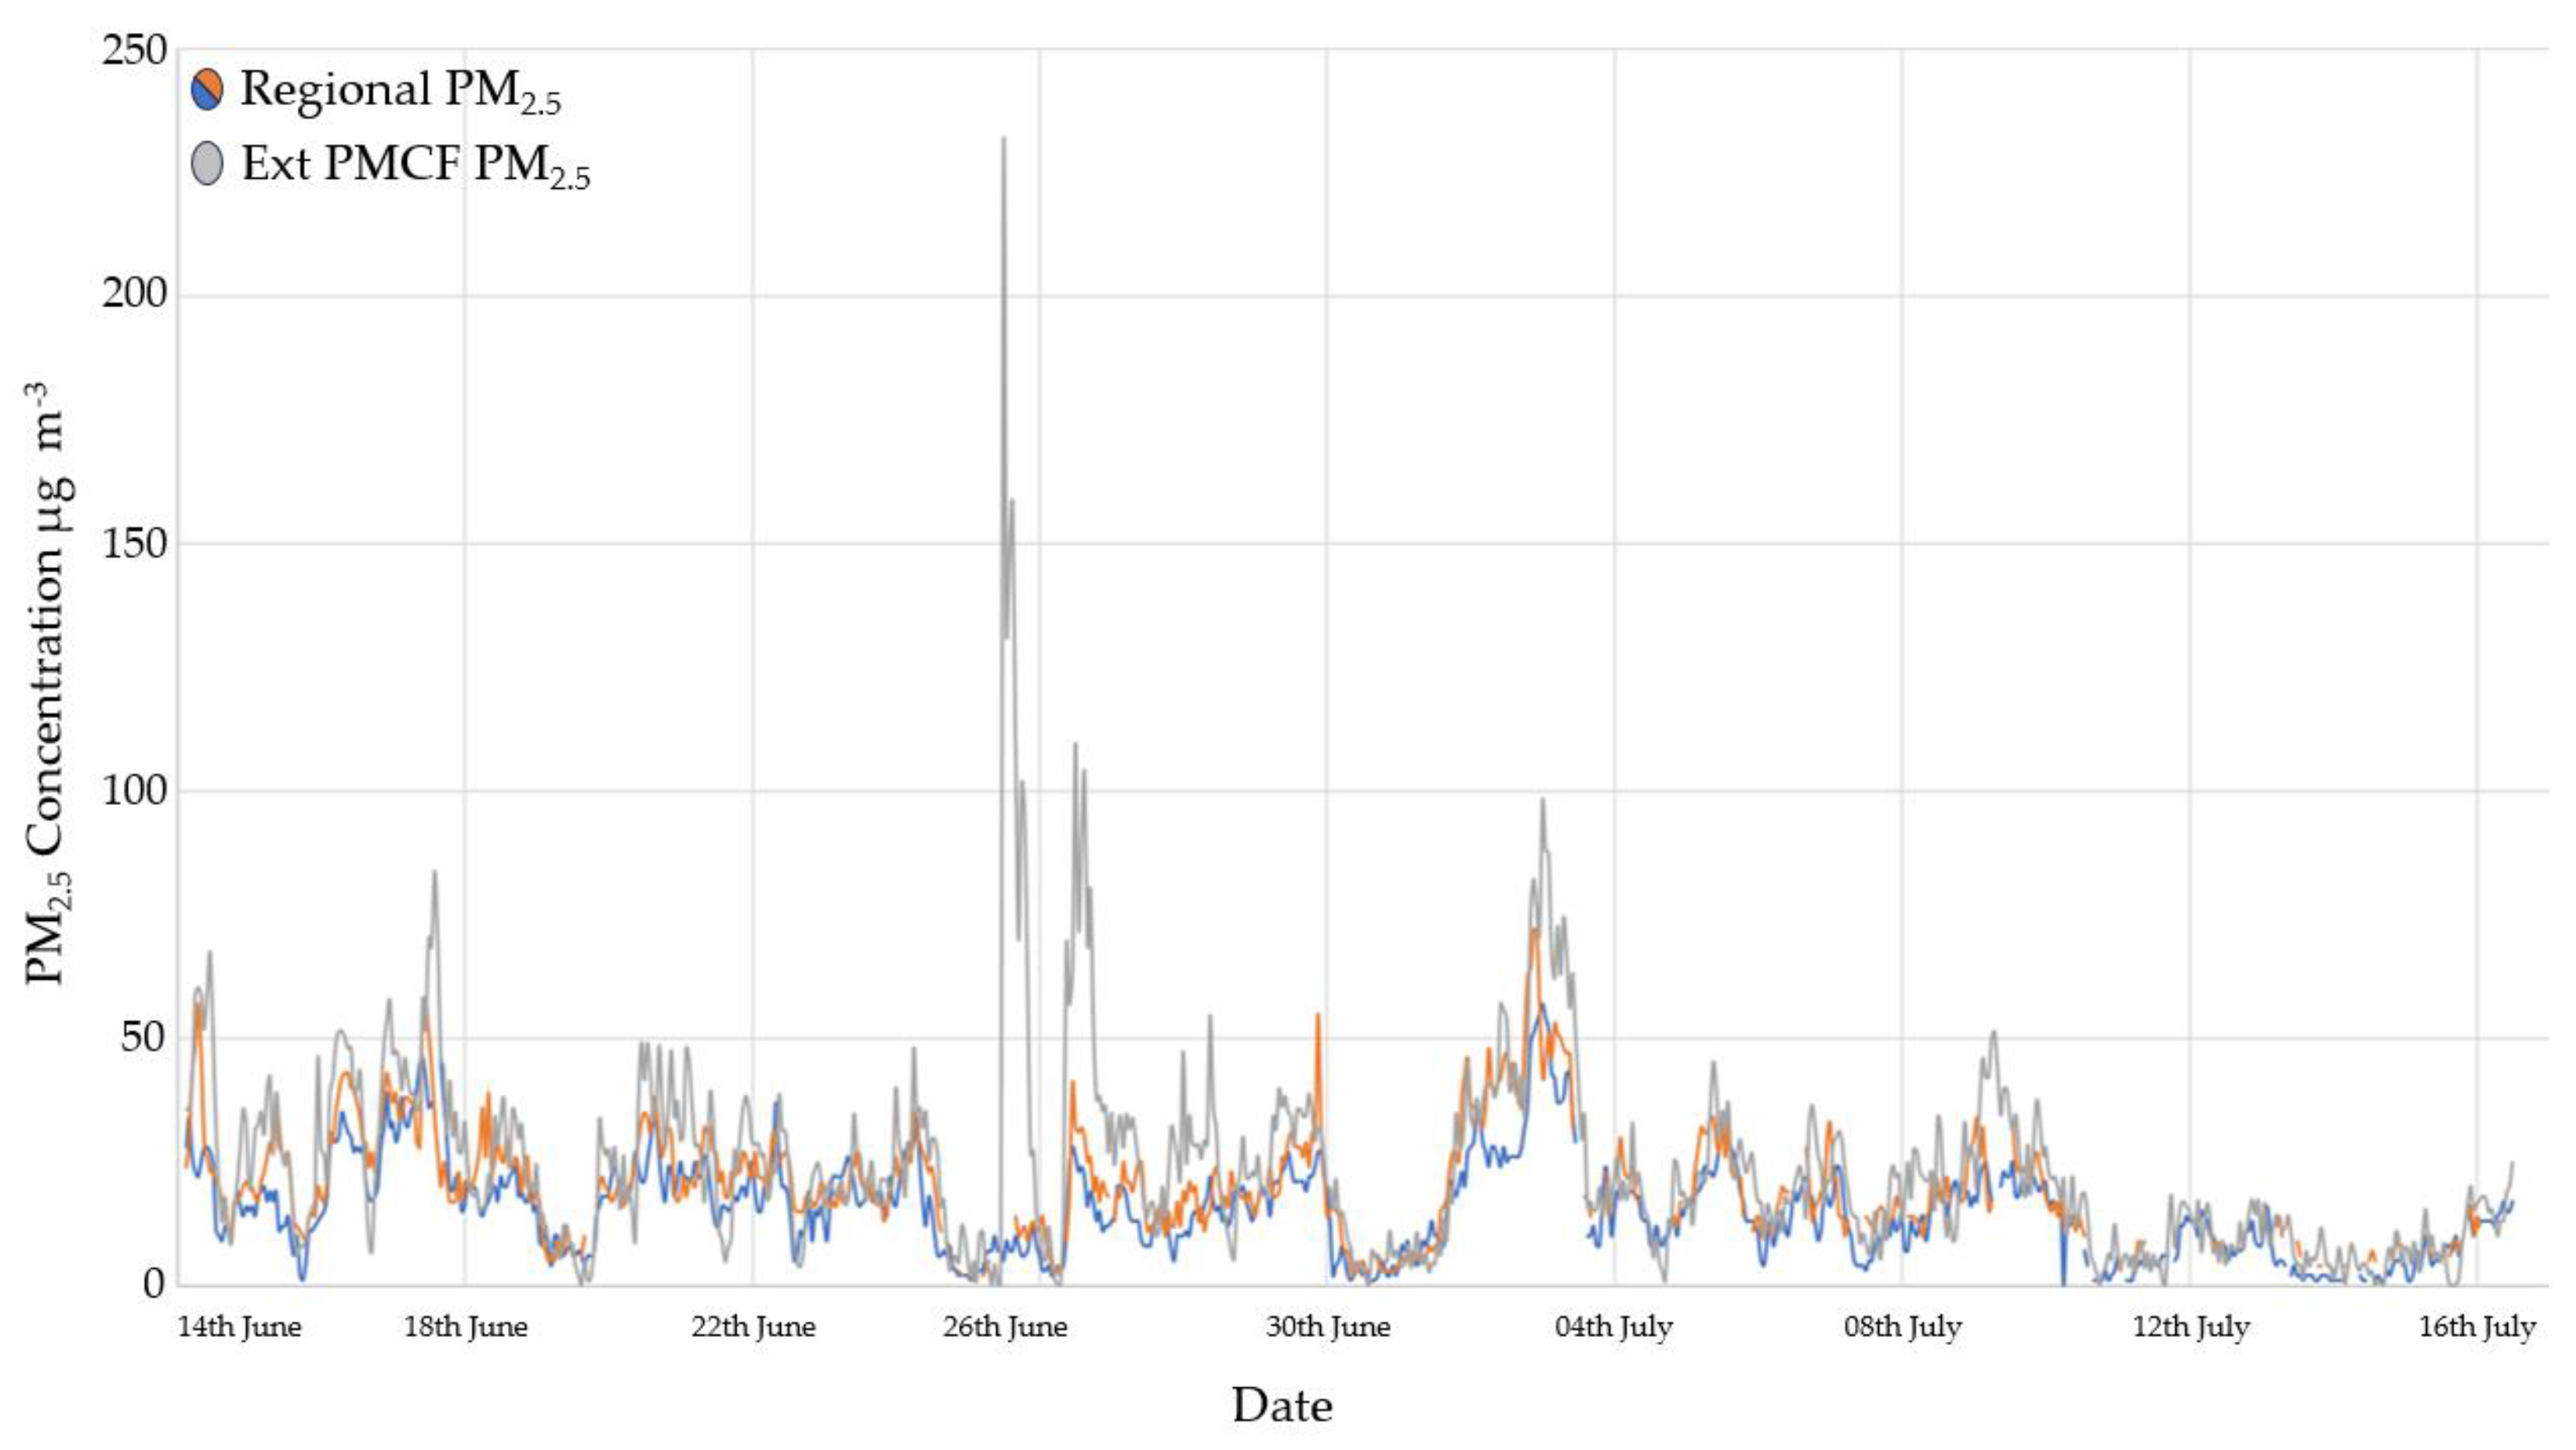
Figure 11.
Trailing internal concentrations of PM2.5 along with NH3 and SO2.
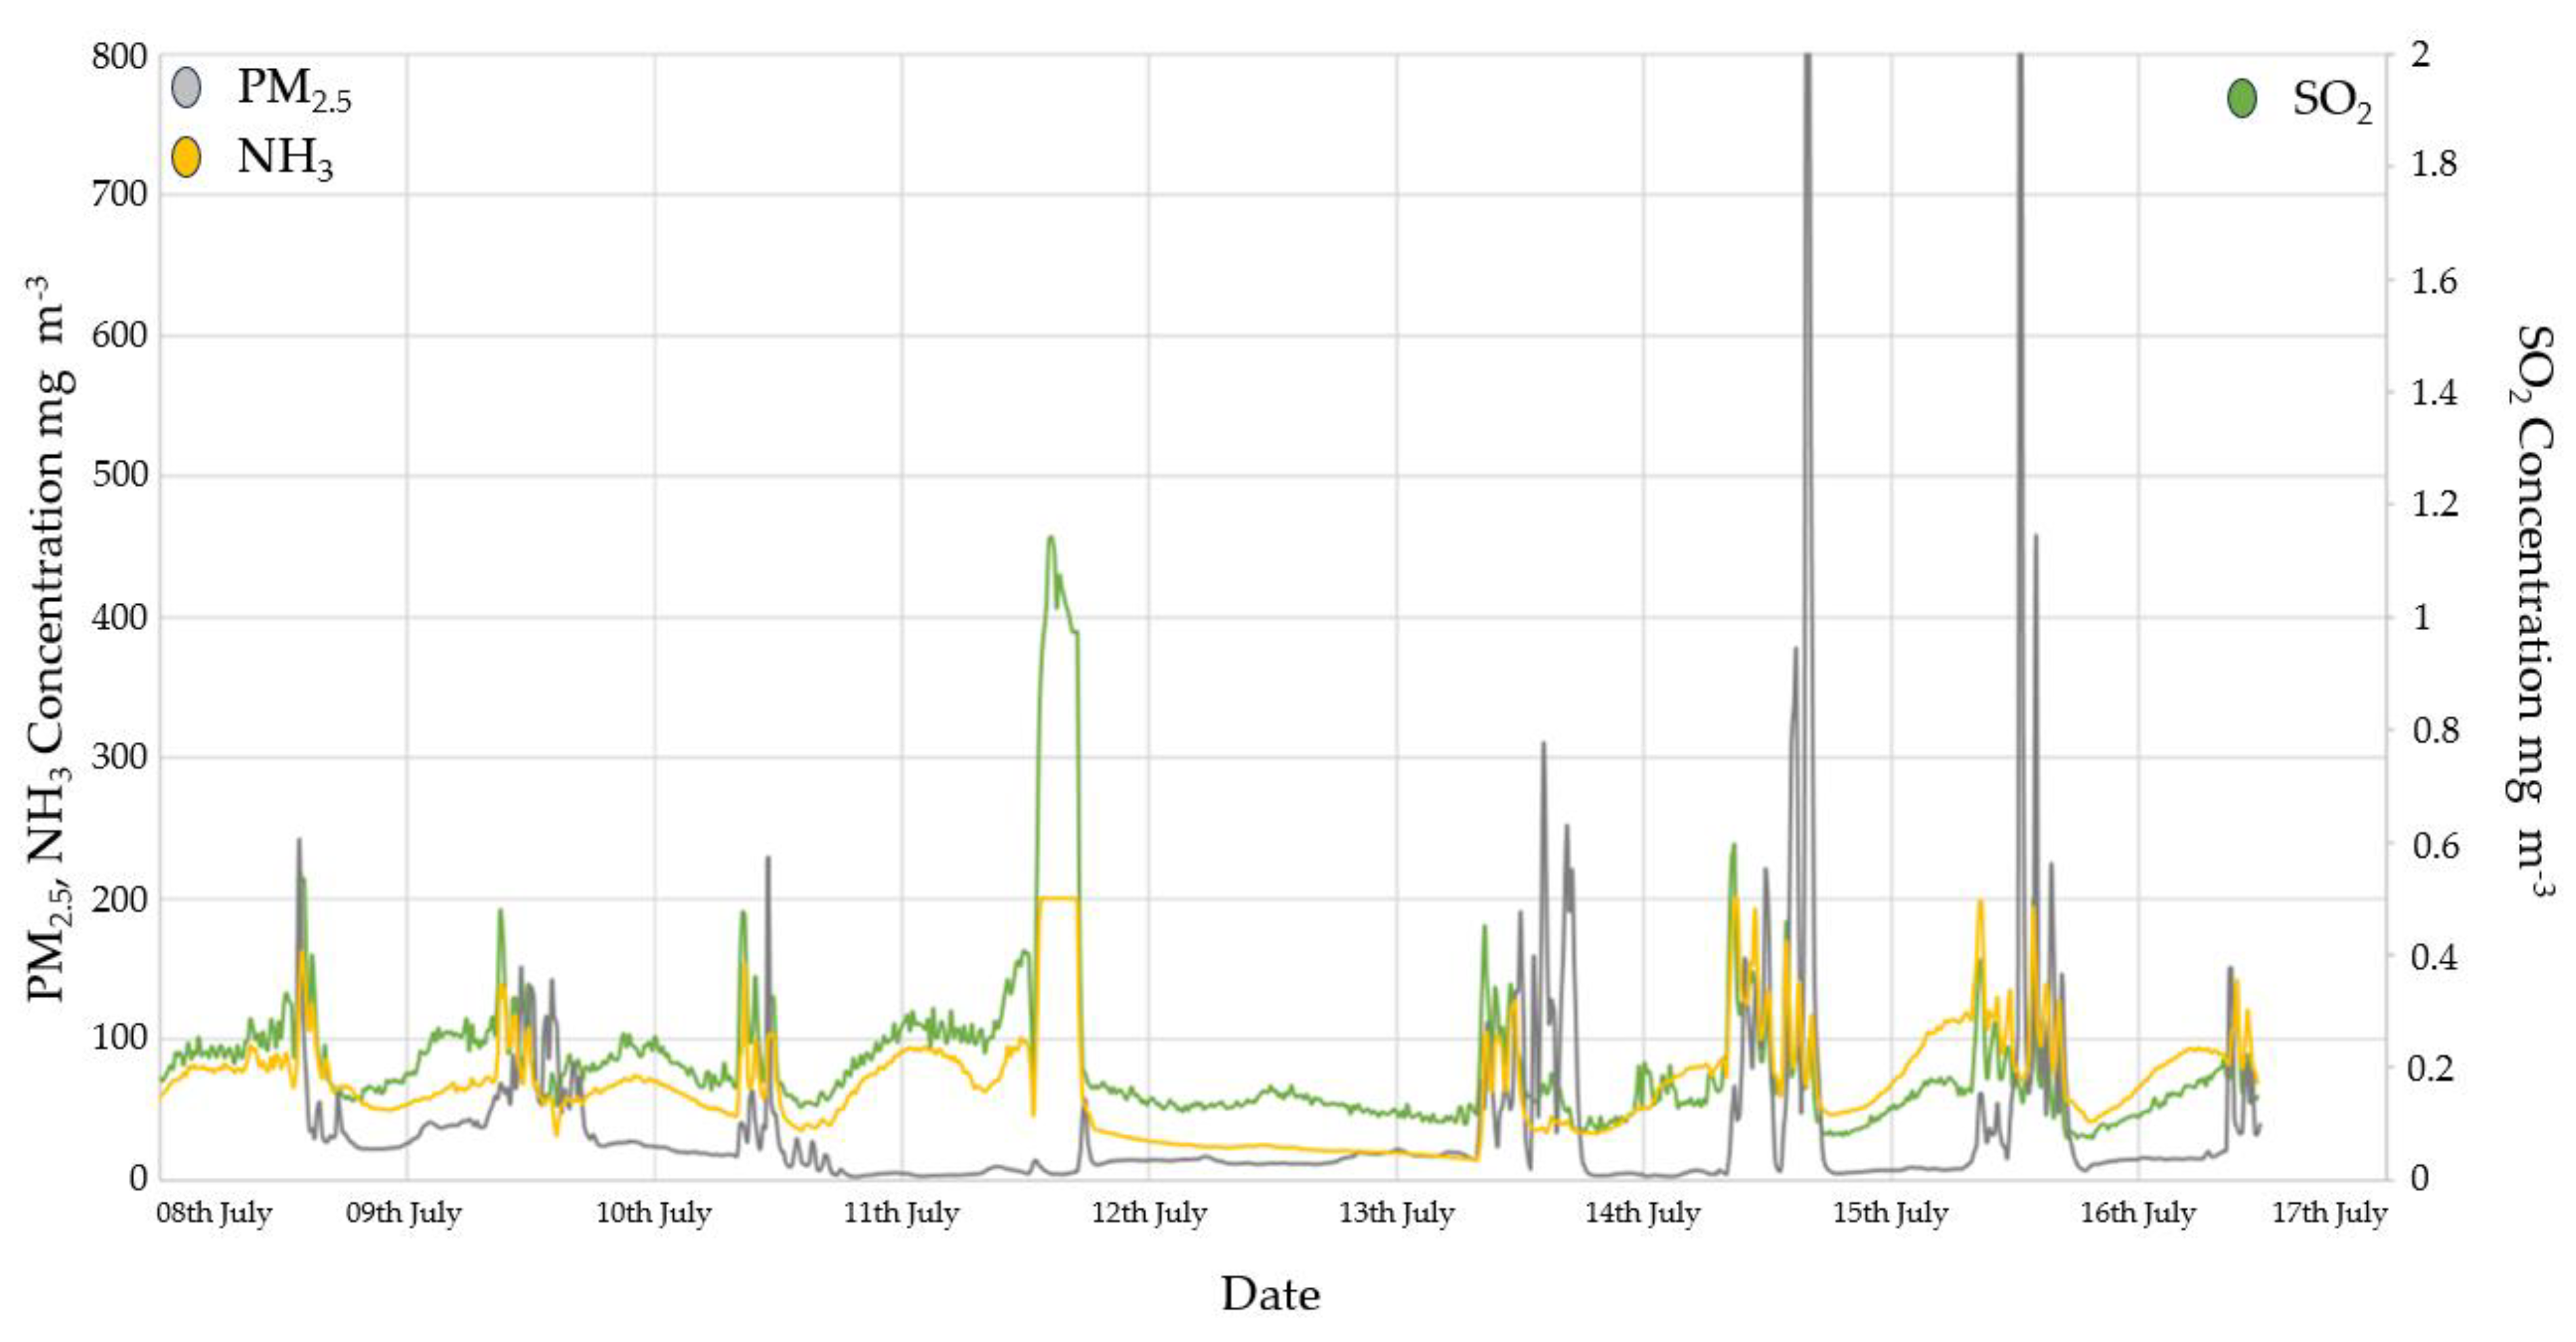
Figure 12.
Emission flux response to high volume ventilation and scrubber system off during a 5-hour period between 12:30 – 17:30 on Saturday 11 July 2020.
Figure 12.
Emission flux response to high volume ventilation and scrubber system off during a 5-hour period between 12:30 – 17:30 on Saturday 11 July 2020.
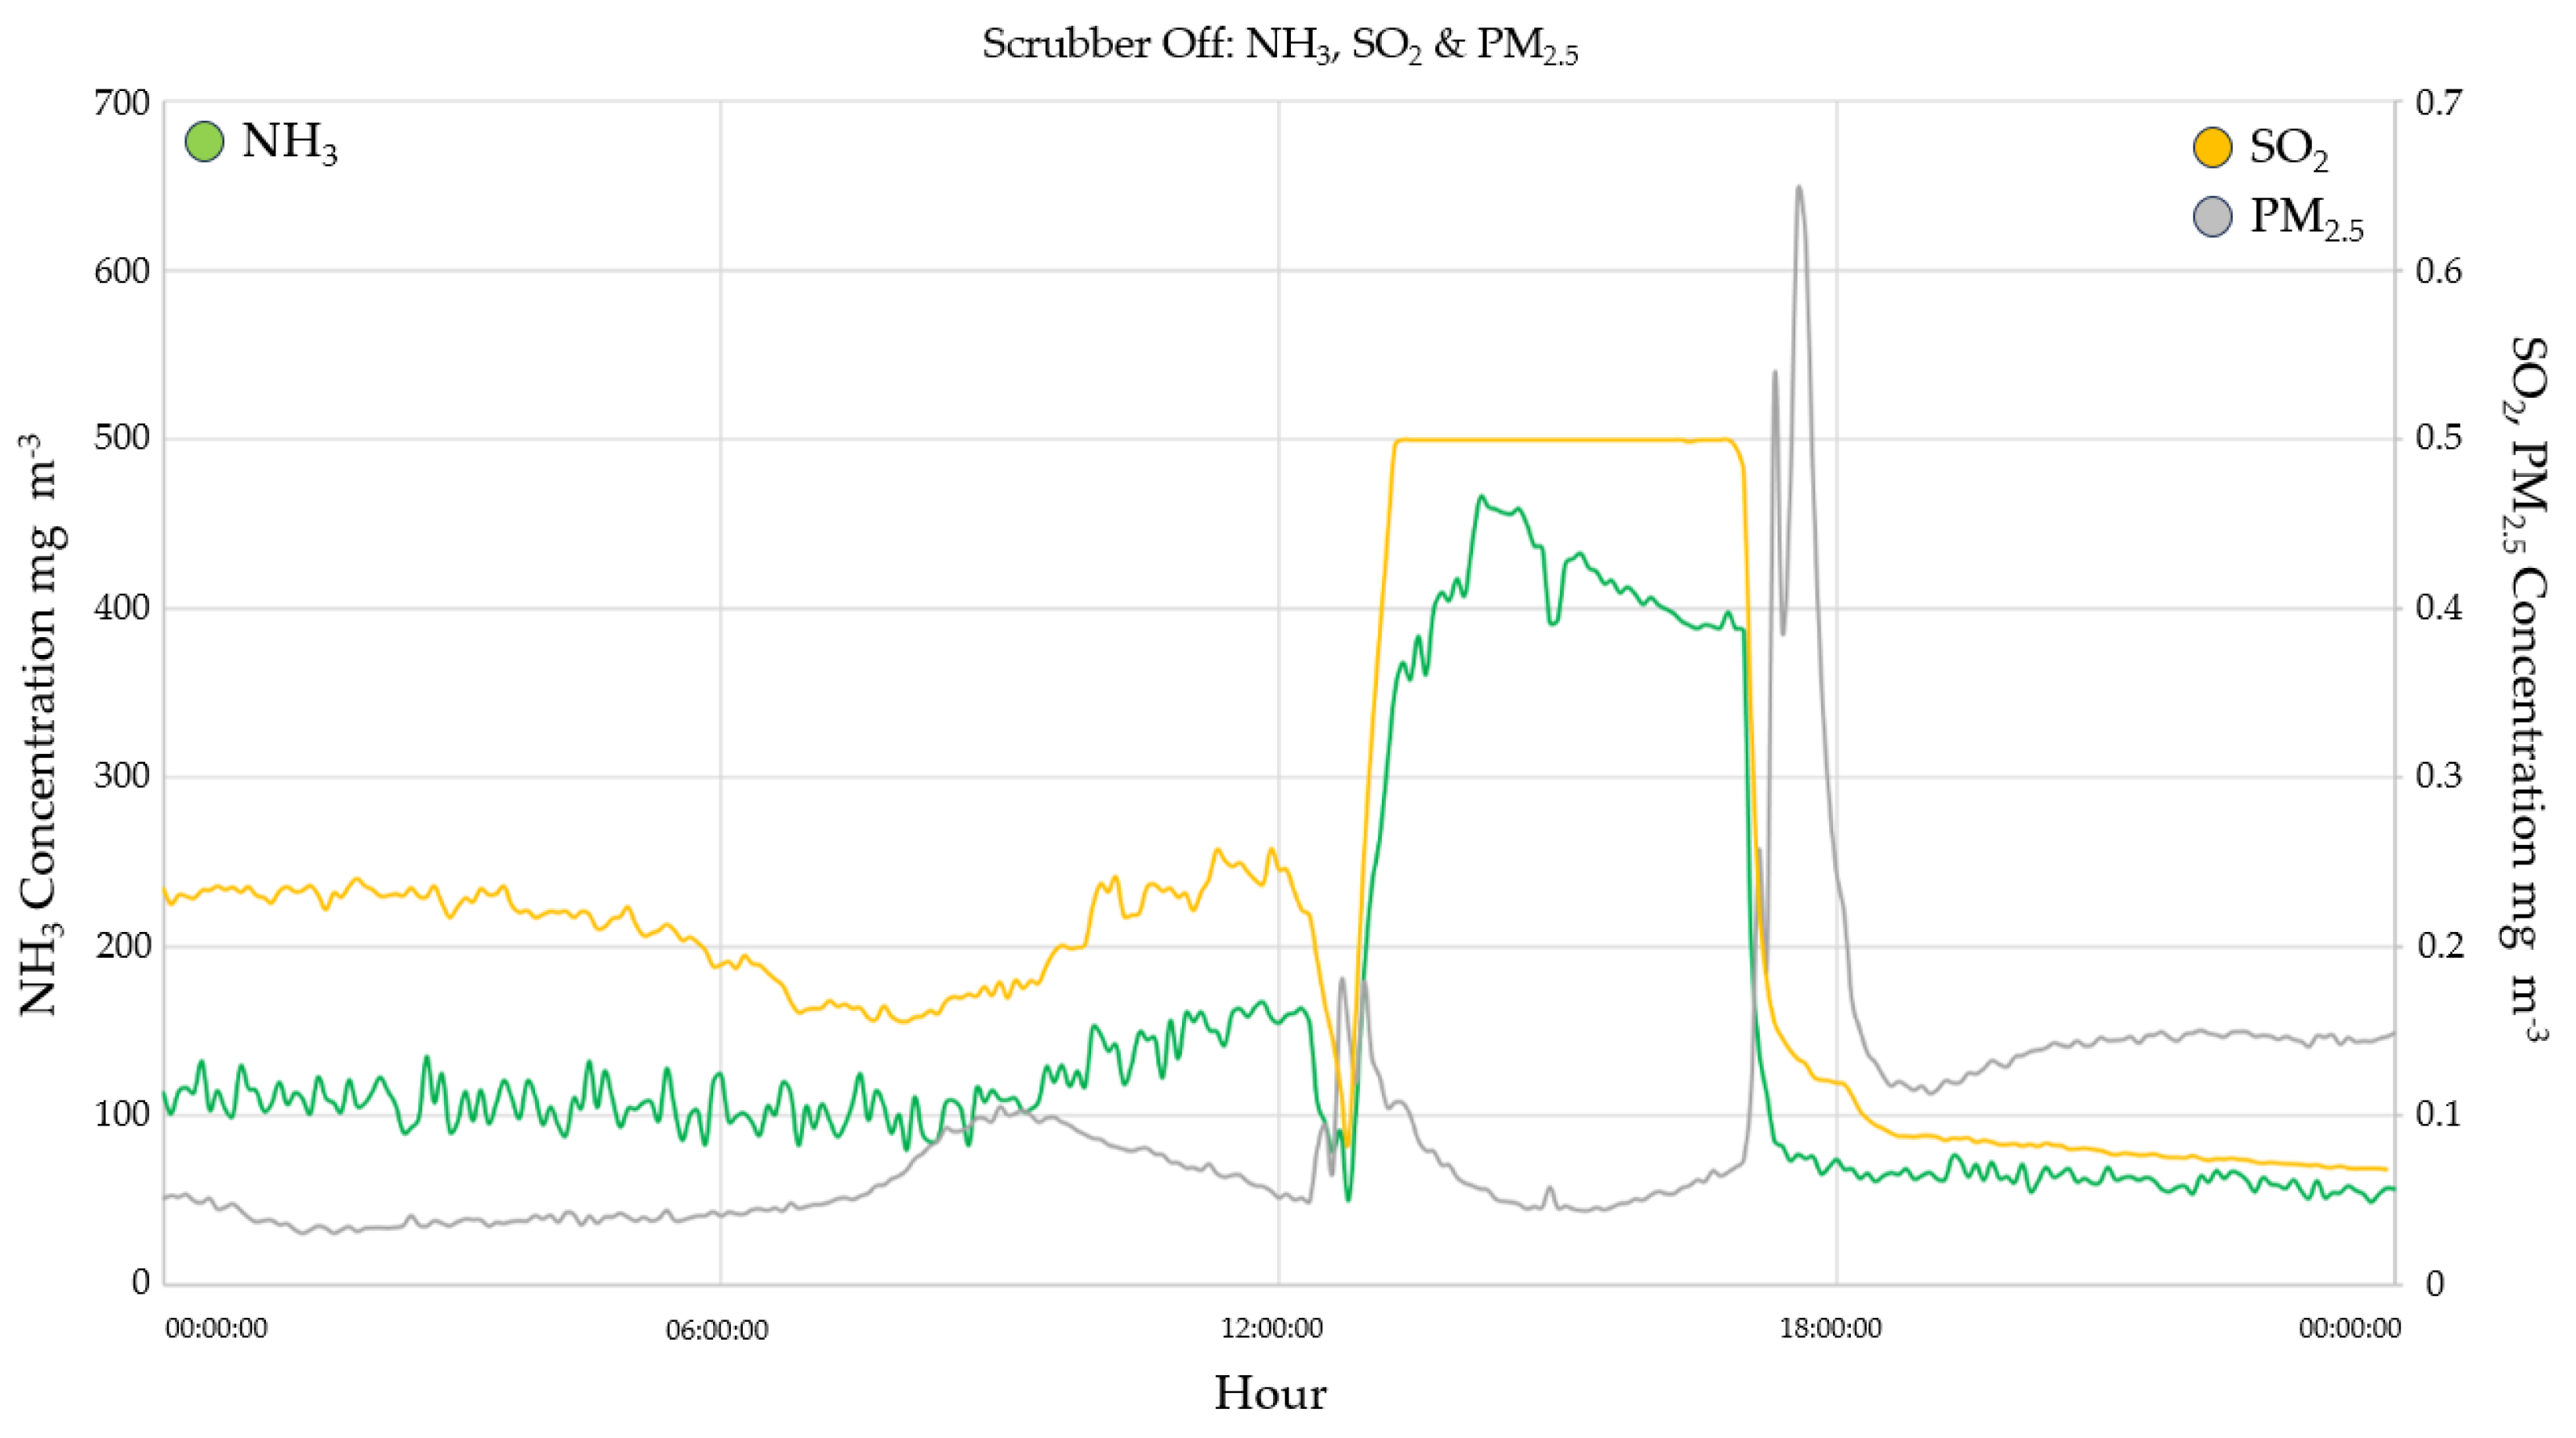

Table 1.
Summary of average, minimum, maximum, and standard deviation values of temperature and relative humidity along with daily maximum and minimum averages.
Table 1.
Summary of average, minimum, maximum, and standard deviation values of temperature and relative humidity along with daily maximum and minimum averages.
| Temperature (℃) | Relative Humidity (%) | |
|---|---|---|
| Average | 22.3 | 82 |
| Min. | 16.1 | 32 |
| Max. | 34.1 | 100 |
| St. Dev. | 3.6 | 15.9 |
| Daily Max. Average | 27.1 | 98.4 |
| St. Dev. | 2.9 | 2.9 |
| Daily Min. Average | 18.3 | 60.2 |
| St. Dev. | 1.3 | 13.7 |
Table 2.
Average internal and external concentrations of monitored SNA gasses and PM2.5.
| NH3 Int | NH3 Ext Hi | NH3 Ext Lo | NO Fac | NO2 Fac | SO2 Fac | PM2.5 Int | PM2.5 Ext | ||
|---|---|---|---|---|---|---|---|---|---|
| mg m−3 | μg m−3 | ||||||||
| Week Day | Mean | 63.951 | 3.850 | 3.155 | 34.007 | 9.000 | 371.004 | - | 23.570 |
| Std. Err. | 2.530 | 0.070 | 0.366 | 4.052 | 1.846 | 30.452 | - | 3.832 | |
| Week Night | Mean | 54.217 | 3.555 | 2.053 | 31.928 | 4.991 | 321.118 | - | 22.171 |
| Std. Err. | 2.074 | 0.084 | 0.092 | 5.421 | 1.052 | 23.671 | - | 3.277 | |
| W / end Day | Mean | 66.278 | 3.793 | 2.079 | 27.939 | 10.332 | 264.985 | - | 22.337 |
| Std. Err. | 8.157 | 0.179 | 0.092 | 6.616 | 1.363 | 45.646 | - | 3.529 | |
| W / end Night | Mean | 37.911 | 3.180 | 1.736 | 49.723 | 7.032 | 147.155 | - | 23.319 |
| Std. Err. | 2.558 | 0.112 | 0.056 | 13.629 | 1.328 | 15.669 | - | 2.644 | |
| Over all | Mean | 57.063 | 3.642 | 2.425 | 33.350 | 7.276 | 307.224 | 36.901 | 23.713 |
| Std. Err. | 1.316 | 0.056 | 0.159 | 3.153 | 0.846 | 17.426 | 2.599 | 1.959 | |
Table 3.
15 Min / 1 hour Correlations Table - NH3 Int, NH3 Ext 1, NH3 Ext 2, SO2, NO, NO2, Temp, RH, Beta-Ray PM, Paju PM.
Table 3.
15 Min / 1 hour Correlations Table - NH3 Int, NH3 Ext 1, NH3 Ext 2, SO2, NO, NO2, Temp, RH, Beta-Ray PM, Paju PM.
| NH3 Int | NH3 Ext wi | NH3 Ext gr | NO Fac | NO2 Fac | SO2 Fac | PM2.5 Int | PM2.5 Ext | ||
|---|---|---|---|---|---|---|---|---|---|
| Temp | 0.101 | 0.086 | 0.071 | -0.191 | 0.476 | 0.073 | 0.277 | 0.033 | |
| RH | -0.072 | -0.012 | -0.063 | 0.059 | -0.600 | -0.047 | -0.322 | 0.078 | |
| PM2.5 Paju | 0.191 | 0.154 | -0.139 | 0.072 | 0.096 | 0.053 | 0.341 | 0.666 | |
| NO2 Paju | 0.023 | -0.025 | 0.084 | 0.412 | |||||
| SO2 Paju | -0.204 | -0.017 | 0.404 | ||||||
| NH3 Int | |||||||||
| NH3 Ext wi | 0.831 | ||||||||
| NH3 Ext gr | 0.429 | 0.345 | *=0.05 | ||||||
| NO Fac | 0.191 | 0.140 | 0.107 | **=0.01 | |||||
| NO2 Fac | -0.084 | -0.139 | -0.102 | 0.290 | ***=0.001 | ||||
| SO2 Fac | 0.751 | 0.702 | 0.400 | -0.008 | -0.201 | ||||
| PM2.5 Int | 0.047 | 0.117 | 0.026 | 0.063 | 0.051 | 0.155 | |||
| PM2.5 Ext | 0.096 | 0.072 | -0.110 | -0.030 | 0.028 | -0.065 | 0.088 |
Table 4.
NH3 emission rates inside the Paju Manure Composting Facility under non-ventilated conditions.
Table 4.
NH3 emission rates inside the Paju Manure Composting Facility under non-ventilated conditions.
| Emission Rate | Scaled Emission Rates | |||
|---|---|---|---|---|
| mg min−1 m−3 | g h−1 m−2 manure | g h−1 m−3 manure | g kg−1 manure* | |
| Mean | 7.28 | 2.77 | 1.85 | 1.52 |
| Std. Error | 0.41 | 0.16 | 0.1 | 0.09 |
| * over entire 18 day composting period | ||||
Disclaimer/Publisher’s Note: The statements, opinions and data contained in all publications are solely those of the individual author(s) and contributor(s) and not of MDPI and/or the editor(s). MDPI and/or the editor(s) disclaim responsibility for any injury to people or property resulting from any ideas, methods, instructions or products referred to in the content. |
© 2024 by the authors. Licensee MDPI, Basel, Switzerland. This article is an open access article distributed under the terms and conditions of the Creative Commons Attribution (CC BY) license (http://creativecommons.org/licenses/by/4.0/).
Copyright: This open access article is published under a Creative Commons CC BY 4.0 license, which permit the free download, distribution, and reuse, provided that the author and preprint are cited in any reuse.


