
Submitted:
30 November 2024
Posted:
03 December 2024
You are already at the latest version
Abstract
Australian lungfish, <i>Neoceratodus forsteri</i>, has a slow life-history, are one of the world’s oldest living vertebrate lineages, are listed as a threatened species and requires immediate conservation management. The main threats to lungfish populations are degradation and availability of key macrophyte habitats, and water regulation and flow modification. As this long-lived species (at least 77 years) has delayed maturity (mature at 10 years), field monitoring alone will not be enough to inform the challenge of ensuring sustainable populations. A stochastic metapopulation model was developed for the Burnett River (south-east Queensland, Australia), an important habitat for the lungfish that is a highly regulated system with extensive water infrastructure. The model consists of three interacting populations, each with post-development streamflow, habitat and movement rules and is underpinned by an 80 year-class population projection matrix. The model highlights the longer-term interaction between dams and stream flows on habitat availability and subsequent recruitment. Through a pre-development streamflow, we quantify the impact of high regulation and development on the lungfish population in the Burnett River, with 95% decline in one population and a metapopulation decline of 31%. Our modelling approach substantially advances conservation management of this species as it can be adapted to suit other populations in other river systems and used to test sensitivity to recovery actions.
Keywords:
Dams
; environmental flows
; threatened species
; population viability analysis
; slow life history
; long lived
; generation time
Introduction
Biodiversity is shrinking globally in response to a wide range of anthropogenic stressors with the risk of extinction increasing for many species [1]. These impacts are global and affect a diverse range of species across all taxonomic groups. Life-history traits and basic biology of species are likely to determine their vulnerability, and thus extinction risk [2]. Species at a higher risk of extinction have some or all of the following life-history traits: large body size, small geographic ranges and slow life-history strategies which include late maturity, longer life spans, greater generation times and lower reproductive output [3,4,5].
The conservation and management of species that are long-lived, with slow life histories and that are geographically restricted, pose challenges. The first challenge is that these species might persist through human impacts and for extended periods afterwards but then suffer delayed extinctions long after impacts have ceased, a phenomenon which is known as ‘extinction debt’ [6]. This could happen if populations or metapopulations persist for extended periods below minimum viable populations sizes [7], or declines in intraspecific diversity occur following impacts i.e. recruitment failure leads to populations dominated by older post-reproductive individuals [8]. The second challenge is that such species are often difficult to study (for example difficult to detect recruitment), and thus there are key knowledge gaps in our understanding of their life-history, which means that management actions need to be undertaken in the face of considerable uncertainty. Thirdly, such species may also exhibit slow responses to conservation management actions, making it difficult to collect adequate monitoring data to evaluate responses, and more critically to identify which path of action will lead to the best outcomes. Tools are therefore needed to help predict how long-lived species may respond to both human impacts, as well as to conservation interventions designed to ensure persistence.
Successfully managing threatened species requires a detailed process that integrates the best available science and management knowledge, considers the risks and compares outcomes from feasible conservation actions [9,10,11]. Population viability analysis (PVA) provides a model-based approach used to summarise a species’ biology and ecology for assessing the viability of a threatened species and the likely outcomes of conservation management options [12,13]. Models provide powerful tools for predicting a species’ response to impacts (natural and anthropogenic) and for evaluating management options [12,14,15]. Such population models characterise the rate of change in the population within defined temporal and spatial scales and have been successfully used for a variety of threatened freshwater fishes [13,16,17,18]. Population models are especially useful tools for informing management of long-lived species where the effect of recovery actions or population changes are unlikely to be evident from short-term monitoring programs [19].
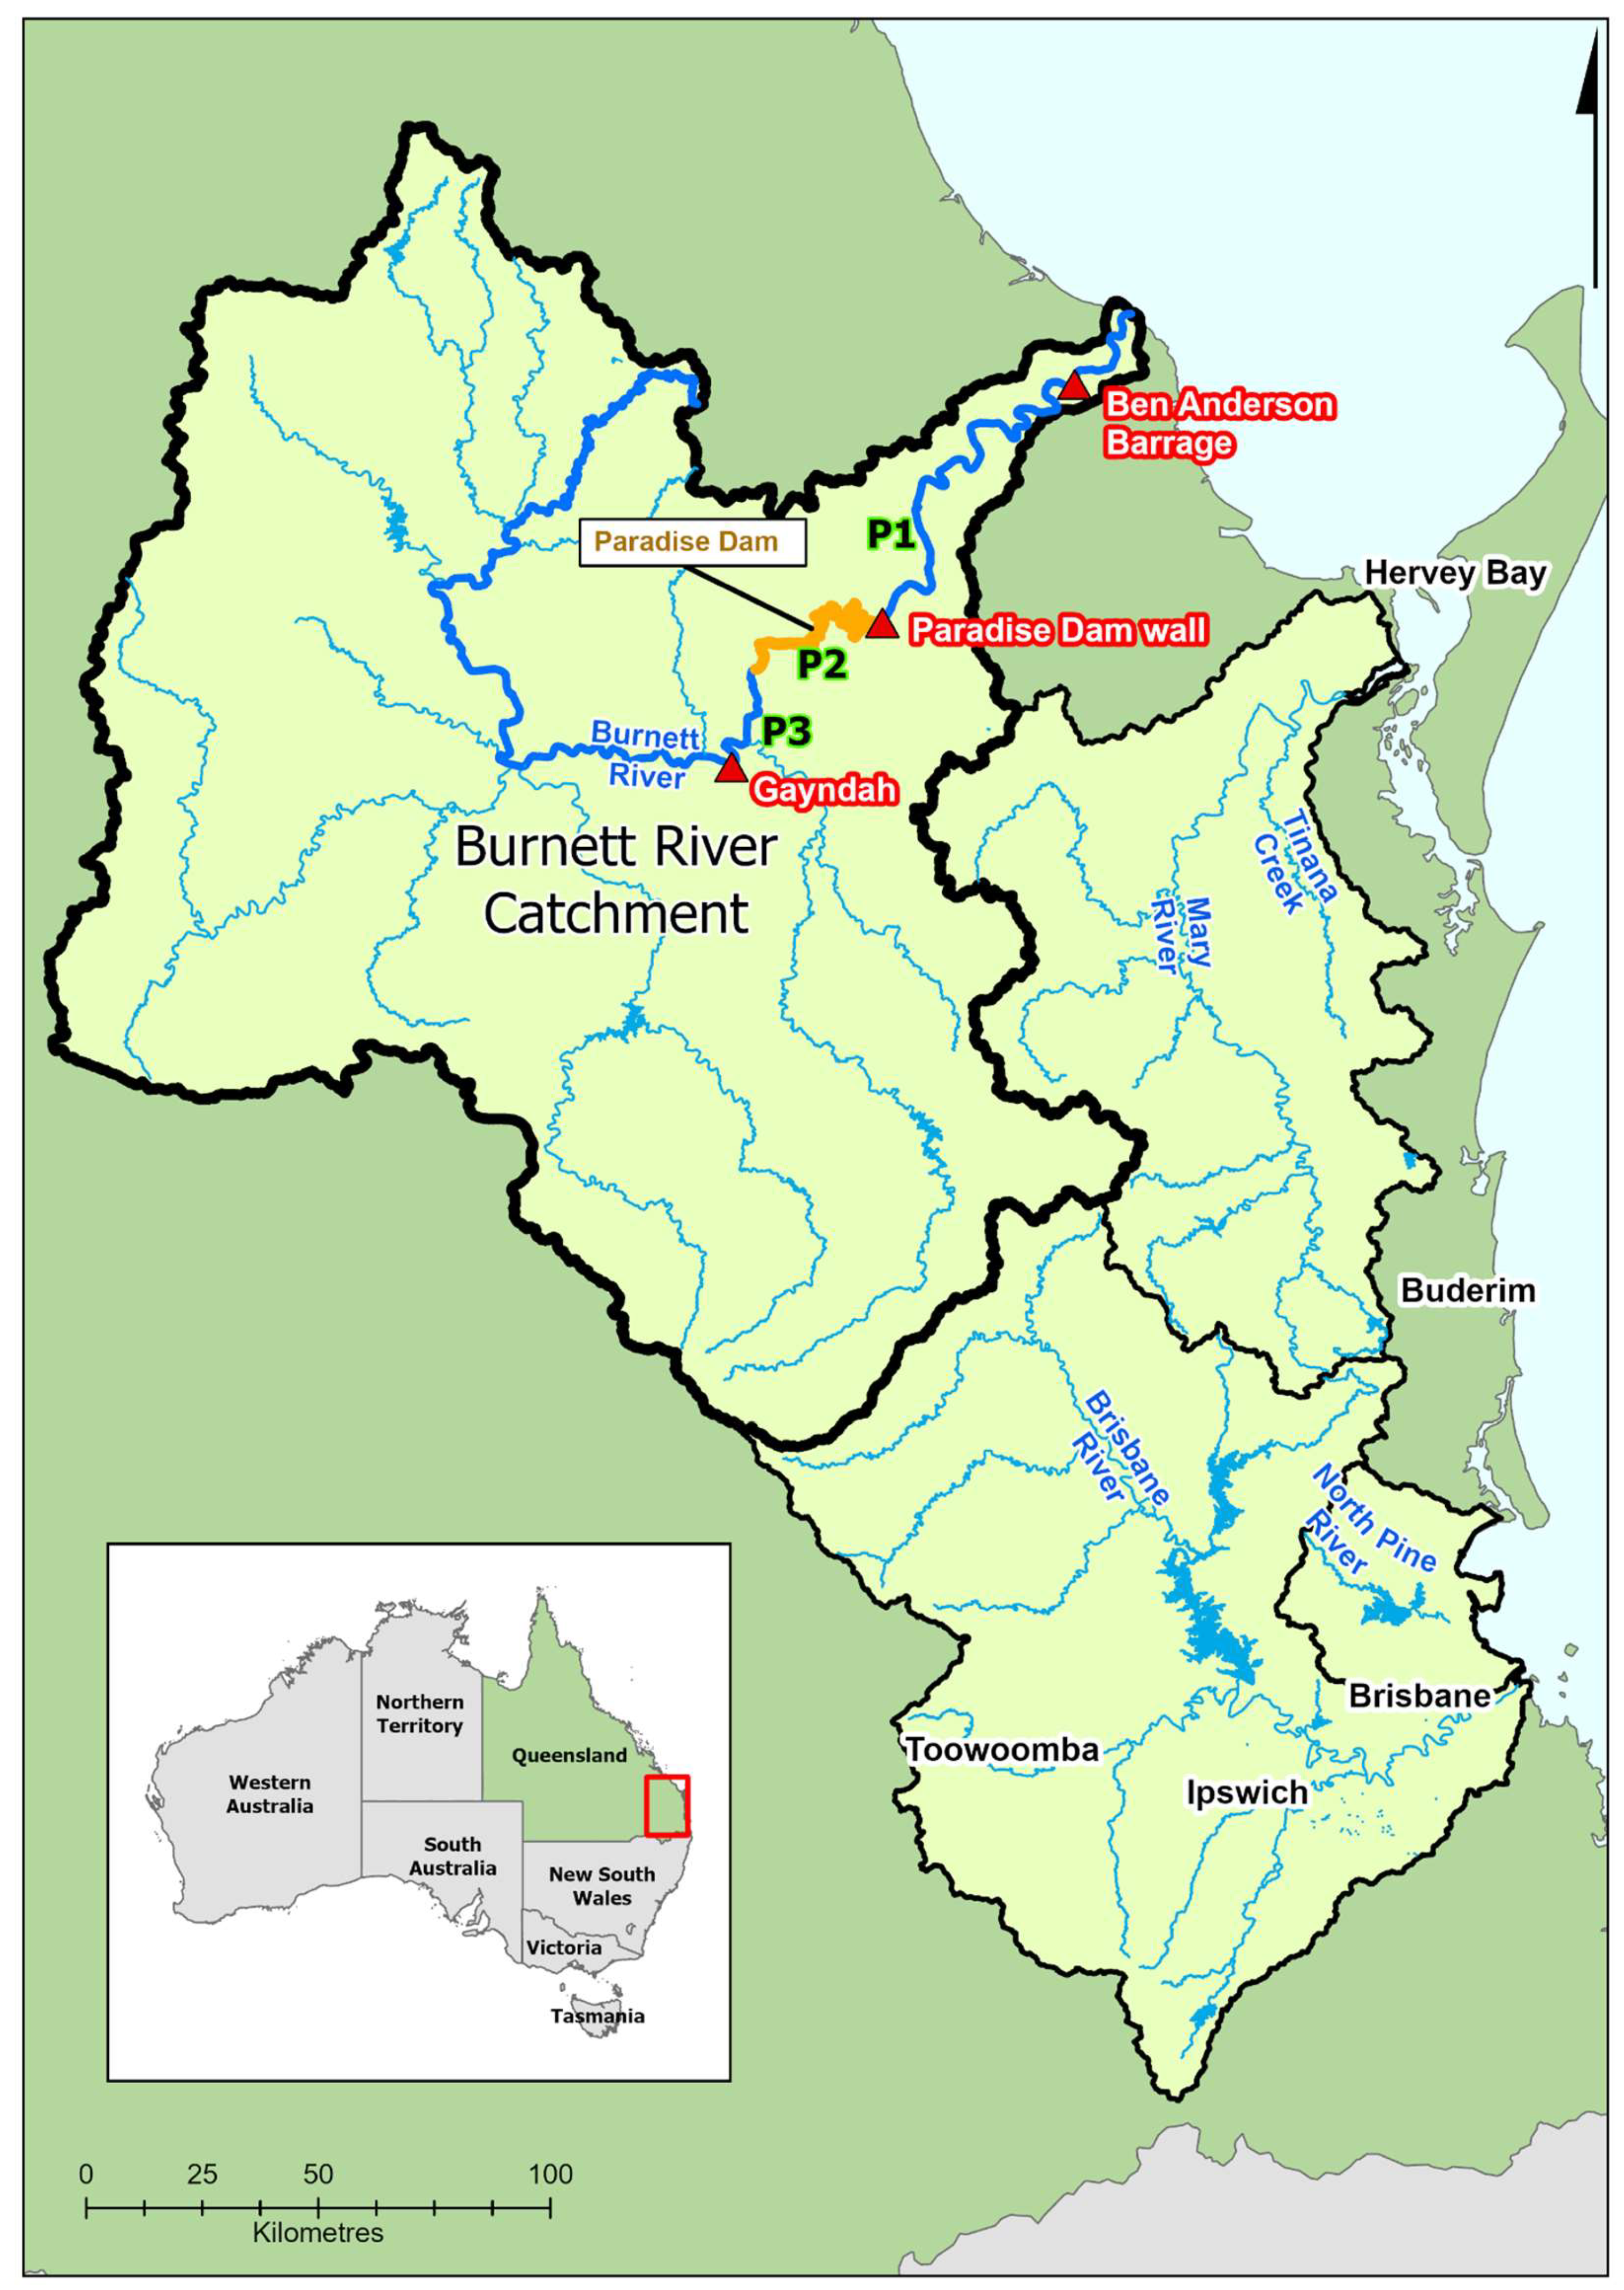
Australian lungfish, Neoceratodus forsteri, are long-lived freshwater fish with a slow life-history, endemic to southeast Queensland Australia (Figure 1). The species occurs in the geographically isolated Burnett and Mary rivers and Tinana Creek (a tributary of the Mary River) as distinct genetic populations [20,21], however the populations in the Brisbane and Pine rivers may comprise a mix of endemic and translocated gene pools [22]. Australian lungfish belongs to an ancient lineage of vertebrates, morphologically unchanged for 100 million years, arising in the geological record about 400 million years ago and splitting from the lungfish lineage about 277 million years ago [23,24,25,26]. Australian lungfish are a culturally iconic species [27] and is internationally recognized for its scientific significance to tetrapod evolution [24,28]. Australian lungfish are listed as Endangered under the IUCN Red List criteria [29] and Vulnerable under the Australian Commonwealth Environment Protection and Biodiversity Conservation Act 1999, and the Queensland Nature Conservation Act 1992 [30] which requires any threatening processes that limit the recovery of this species be addressed. Australian lungfish populations in the Burnett River have been adversely affected by the construction of large water storages, predominantly through the loss of riverine breeding habitats via inundation of aquatic macrophytes, changes to natural flow regimes and barriers to movement [31,32,33] (Figure 1). In addition, lungfish are found less frequently in lentic environments with little evidence of successful spawning and recruitment in existing impoundments due to fluctuating water levels and poor water quality conditions creating unsuitable habitat conditions for the development of eggs and very young fish [31,34,35]. The development of a population model was identified as a priority action within the Draft National Recovery Plan for Australian lungfish [36].
The purpose of this study was to develop a stochastic metapopulation model to assess the viability of Australian lungfish population in the Burnett River in southeast Queensland. The largest dam on the Burnett River, Paradise Dam, poses a barrier to movement and has fragmented what was once a continuous population into three partially connected populations [37]. Across these semi-connected populations, we compared alternative flow scenarios, including a water resource development flow (including impoundments) versus a natural flow to assess the impact of the construction of Paradise Dam and other water management changes on Australian lungfish population in the Burnett River. We assess the viability of Australian lungfish and use the model outputs to understand the likely long-term impacts of water infrastructure on this long-lived threatened species and discuss the impacts of water management and actions directed at conserving the species through threat mitigation. Our study provides an example of how population models can be applied to comprehensively explore various management options to conserve a threatened, long-lived species.
2. Materials and Methods
2.1. Study site
The Burnett River and tributaries account for approximately 40% of the known range of Australian lungfish, with an estimated total population of about 10,000 individuals [37]. Australian lungfish occur in the main channel and major tributaries of the Burnett River from the tidal barrage (Ben Anderson Barrage) upstream to Three Moon Creek near the township of Monto, 310 km from the mouth (Kind et al., 2008; Macdonald et al., 2012) (Figure 1). However, lungfish are much more common in the middle to lower reaches between the township of Gayndah and the tidal barrage, with the lower downstream section recognised as a key spawning area [34]. The river is heavily regulated and highly developed [40], with more than 40 structures (barrages, weirs and dams) [41] supporting water supply schemes [32,42]. Paradise Dam (37 m high), constructed in 2005, is the most recent infrastructure built and inundates approximately 24 km of riverine habitat when full [32]. The dam includes a stepped spillway on the downstream face where Australian lungfish mortalities have been reported to occur under a range of flow conditions [43], but especially flood events with 152 adult deaths reported in 2010 [43]. Likewise, an increase in population downstream of the dam was observed after two of the largest floods recorded in the Burnett River, suggesting a net downstream migration [37]. Overall, however, assessment of tag-recapture data suggested there was no significant short-term change in the population in the Burnett River since the dam was constructed [37]. Other barriers in the system include the tidal barrage dividing fresh from saline water which regularly leads to stranding of lungfish in the estuarine waters of the Burnett River [34,42].
To capture this structure in the distribution in the Burnett River catchment, we recognise three populations in this study:
- Population 3 (P3) – the riverine reach downstream of Claude Wharton Weir in Gayndah down to the upper impounded area of Paradise Dam (Adopted Middle Thread Distance (AMTD) 176–202.4 km).
- Population 2 (P2) – the water impounded area of Paradise Dam (AMTD 131.4–176 km).
- Population 1 (P1) – the riverine reach downstream of Paradise Dam through to Ben Anderson Barrage (AMTD 25.9–131.4 km)
Figure 1.
Map of lungfish distribution in SE Queensland with the Burnett River study site and populations P1, P2, and P3 (highlighted).
Figure 1.
Map of lungfish distribution in SE Queensland with the Burnett River study site and populations P1, P2, and P3 (highlighted).
2.2. The biology and ecology of Australian lungfish
An expert workshop with fish ecologists, managers and modellers, combined with knowledge from published and unpublished literature, provided an up-to-date understanding of Australian lungfish biology and ecology. The species is long-lived (77 years) [44] large-bodied (up to 1.5 m and 29 kg) [45] largely a sedentary species with restricted home ranges (1–1.5 km) and does not have an obligatory migratory life-history strategy, but may undertake larger scale (10s of kilometres) movements to seek out suitable spawning habitats between July and December or in response to elevated flow events [34].
The entire lifecycle of Australian lungfish is completed in freshwater [34] with a strong affinity for dense submerged macrophytes (>90% cover), considered critical habitat for spawning and recruitment [45]. Annual spawning occurs in late-winter (Austral) to late-spring (August to November) in shallow (still or flowing) waters [46] when water temperatures are 18–28°C [35,47], although may begin as early as July and extend to January [48]. Spawning occurs in pairs or groups with the large (3 mm diameter) loosely adhesive eggs encapsulated in a jelly capsule (total diameter of 1 cm after water hardening) [45], deposited singly, attached to plants and unlikely to survive if they fall to the substrate ) [45],. Spawning most often occurs at night, amongst dense aquatic macrophytes in still to fast-moving water [25,33,35,49,50]. Brooks and Kind [34] found that Australian lungfish egg densities increased with the density of macrophytes and the density of eggs was greatest with shorter macrophyte stands in shallower waters. Small fluctuations in the water level can impact on the viability of eggs, due to the species preference for egg deposition in shallow water. Conversely, eggs deposited in deeper calmer waters may be negatively impacted by deleterious effects like water quality, substrate composition, or light attenuation on macrophyte condition [36]. Flooding in river systems can remove aquatic macrophytes through scouring, leaving limited spawning habitat available [36] until recovery occurs some four or more years without further disturbances.
Recruitment is believed to follow a cyclical pattern of high or good spawning years interspersed with years of low or poor spawning. Pusey et al. [51] reported a one-in-five year ‘good’ spawning event occurring regardless of environmental conditions while Kemp [25] suggested that successful breeding seems to have occurred at intervals of around 20 years since 1900. Good spawning years have been linked with suitable antecedent water levels and baseflow conditions that benefit aquatic macrophytes, which are intricately linked with spawning [34]. However, breeding may be delayed or skipped if spawning habitat is disturbed [52] or unavailable [53]. There is evidence that successful spawning and recruitment within impoundment habitats is unlikely due to having steep bank profiles, fluctuating water levels, highly variable water quality conditions and anoxic soft substrates, resulting in conditions considered unsuitable for macrophytes persistence and creation of habitats that support egg development and the food and shelter for young fish [31,32,34].
2.3. Structure for Australian lungfish population model based on life-history analysis
Figure 2.
A depiction of (a) the stage structure for female lungfish with associated estimated time transitions; and (b) the age network diagram of the structure adopted for the female only lungfish population model, where recruitment is a combination of fecundity and egg, larval and young-of-year survival (b).
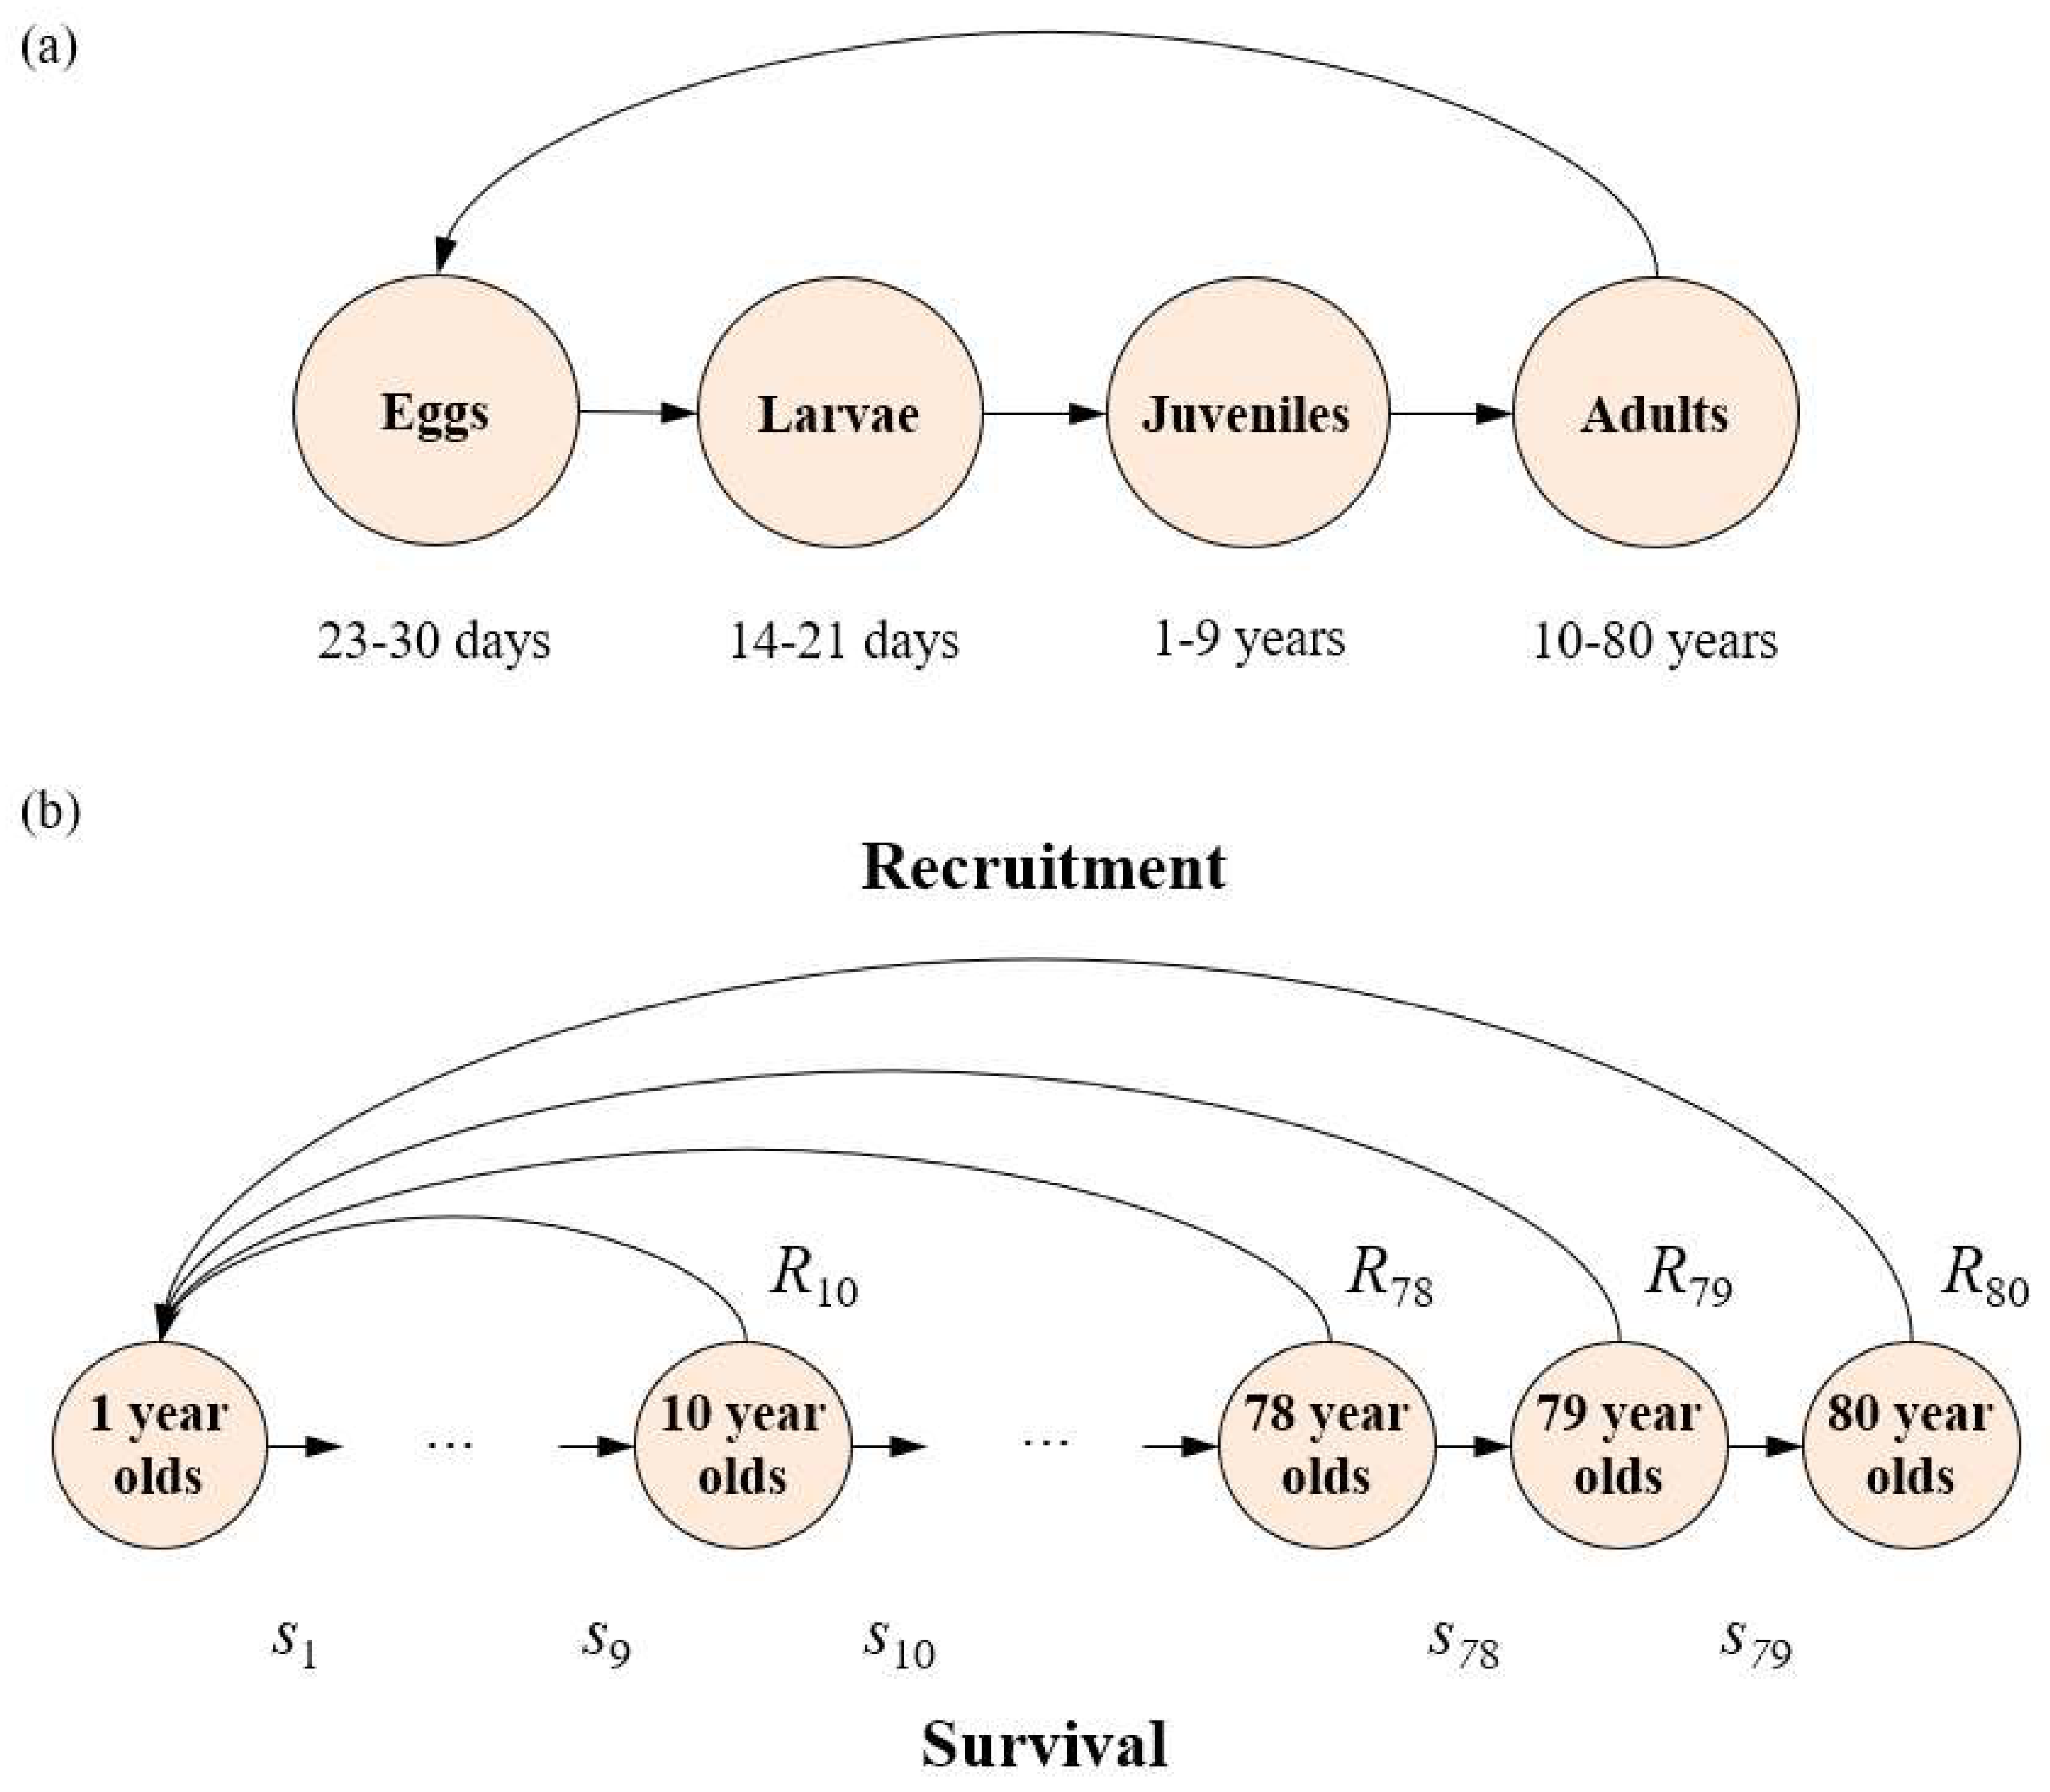
We transformed stage-based life-history information of Australian lungfish into an age-based life-history (Figure 2), which allowed us to construct an age-based model that better describes the ecology of the species, and better aligns with mainly annual timescales for planning and implementation of management actions. The use of a stage- and age-based model was essential to capture the interaction of key threatening processes for this species that act upon different stages such as flooding (removes habitat for eggs/larvae/young-of-the-year), loss of fish passage (adult spawning movement) and spillway mortality (adults moving downstream with flows) [36,37]. To ensure complete capture of the birth and death process, it was decided to construct an 80-age class model where fish in the final 80-year-old age class do not survive. Adopting an 80-age class model was considered sufficient to capture the longevity of the species based on the maximum age measured in the wild (77 years) [54]. The 80 × 80 matrix (Figure S1), with a pre-breeding census [55], represents this construct, allowing the population growth rate to be calculated from the associated female only characteristic equation (1), where the sex ratio is 1:1 [45], and estimated vital rate parameters with a meaning and description of the parameters explained in the following figures, tables and text.
2.4. Parameter estimation
2.4.1. Age-specific survival
The age-structured matrix requires estimates of age-based survival rates and age-based fecundity as a function of recruitment to one-year-old fish. Age data is essential to generate estimates of age-specific survival [18,58,59]. The data from Fallon et al. [54] provided 158 aged Australian lungfish, with a maximum age of 77 (Figure S2). An age-frequency data set was compiled with a regression of the form fitted to the data. This form produces an idealised age-frequency for all age-classes (not restricted to the data age-classes) from which survival rates were estimated as the ratio between idealised age classes, taken as the ‘average’ or mean survival rate [17,60]. Age-specific survival rates were estimated from the proportion of fish in one age divided by the proportion of fish in the previous age class to estimate , i = 1…79 (see Table 1), age-specific survival rates, that ranged between 0.2331–0.9997 (Figure S3).
Early life-history survival, the survival of eggs larvae and young-of-the-year (YOY) juvenile fish in the wild are unknown. Egg survival was estimated to be 0.2 based on observations and repeated sampling of eggs over time (Steven Brooks, unpubl. data.), larval survival was assumed to be one fifth of egg survival, i.e. which is similar to the estimate by Houde [61] of larval survival for freshwater fish of 0.05 and consistent with larval survival in other Australian freshwater fish [18,58,59]. Survival of YOY juvenile fish , over the 10 month period prior to becoming a one-year-old fish, was estimated from the age specific survival equation in Table 1 with i = 3/12 (the first month as a YOY) and i + 1 = 12/12 (the final month as a YOY: note that setting i + 1 as the final month is equivalent to taking the product of each individual month to be one fifth of first year survival, i.e. The combined survival of early life-history provides approximately one in 2400 eggs hatch and survive to become one year old fish, similar to other long-lived Australian native fish [17]. The high survival rates from accords with the expected high survival rates for adults [62].

Table 1.
Life history and key parameters for the Australian lungfish metapopulation model.
| Survival rates | Values pre-burn in | ||
| 0.2 | P1 upstream initial pop size | 10,000 | |
| 0.04 | P1 upstream LTA | 10,000 | |
| 0.0521 | P2 midstream initial pop size | 12,500 | |
| i:1...79 | P2 midstream LTA | 12,500 | |
| a | 208.97 | P3 downstream initial pop size | 7,500 |
| b | -1.55 | P3 downstream LTA | 7,500 |
| c | 2.14 | Burn in time steps | 200 |
| Coefficient of variation in survival rates | Post burn in (time step 200) | ||
| All survival rates | 10% | P1 average initial pop size | 10,083.79 |
| Paradise dam spillway survival reduction | 50% | P1 min initial pop size | 819 |
| (only occurs for WRD flow) | P1 max initial pop size | 22,508 | |
| Fecundity | P2 average initial pop size | 12,488.16 | |
| i:10…80 | P2 min initial pop size | 1,116 | |
| MF | 75,000 | P2 max initial pop size | 32,508 |
| Coefficient of variation in fecundity | 10% | P3 average initia7 pop size | 7,552.16 |
| Proportion of females breeding (PFB) | 95% | P3 min initial pop size | 398 |
| PFB in Paradise Dam | 2% | P3 max initial pop size | 17,530 |
| Maximum movement rates | |||
| Single population model summary | P1 to estuary | 0.005 | |
| Maximum age | 80 years | P1 to P2 WRD flow | 0.001 |
| Annual growth rate (λ) | 1.0587 | P1 to P2 Natural flow | 0.025 |
| Generation time (G) (years) | 46.24 | P2 to P1 | 0.05 |
| Net reproductive rate | 8.13 | P2 to P3 | 0.025 |
| Average no. of eggs survives to adulthood | ~8*10^-6 | P3 to P2 | 0.025 |
2.4.2. Age-specific fecundity
The matrix construct requires age-specific survival and recruitment to one-year-old fish to be estimated using the equation: , where is age-specific fecundity and stage-specific survival estimates outlined above. It is likely that some females may mature early, and accordingly a sigmoidal function was used to calculate age-specific fecundity increasing from 10year olds to 80-year-olds, (see Figure S4). Australian lungfish lay 200–600 eggs in a single event, it is assumed that fish are serial spawners laying for several days in a row and repeated during the season with the maximum total potential fecundity of 77,289 based on the average of three large running ripe female lungfish from the Brisbane River in September 2019 (David Roberts, Seqwater, unpubl. data). We assumed a maximum fecundity of 75,000.
2.5. Mathematical and sensitivity analysis
The characteristic equation (1) when parameterised with the mean fecundity and survival rates provides several summary population statistics on the status of the species. Stossel et al. [17] identify these statistics as population growth rate (λ) which summarises the capacity of the population to grow (or decline); the net reproduction rate which is the average number of female lungfish produced per female; and generation time (G) which measures the average age of parents of the current cohort [63]. Generation time is one of the measures used in categorising level of threat in the Guidelines for Using the IUCN Red List Categories and Criteria [63], and directly influences the time period of assessment and the period over which conservation efforts need to be considered [63,64].
Alongside these estimates, the use of sensitivity analysis allows for the exploration of uncertainties in the deterministic model and to assess this model for any disproportionate changes to the population growth rate due to uncertainty or changes in parameter estimation [65] (Todd et al., 2024). This approach reveals the importance of each parameter and its influence on model outcomes. Two types of perturbation analysis are used: (1) elasticity analysis, measuring the proportional rate of change in the population growth rate for a small change in a vital rate; (2) sensitivity analysis, measuring the absolute rate of change in growth rate given a small change in a vital rate; and we also calculate the age-specific reproductive values, measuring the contribution of an age-class to future generations, and summarising reproduction, survival, and timing [56].
2.6. Modelled flow effects on Australian lungfish
Conservation of Australian lungfish relies on maintaining sufficient macrophyte habitat for spawning, and for the survival of eggs and larvae. Smaller floods have stream velocities sufficient to remove macrophyte leaves, but allow for rapid regeneration, whereas higher flood flows can scour the bed of the stream and completely remove macrophytes including all propagules. Large flows can cause total loss of macrophyte cover, with adverse consequences for Australian lungfish spawning and recruitment success [36]. Recovery of macrophytes from large floods takes multiple years, regenerating from seed stock and propagules and can take up to four or more years to recover in minimally impacted catchments, longer in catchments with significant water impoundments.
In the Burnett River, flows ≥ 40,000 megalitres (ML)/day result in a proportional loss of macrophyte habitat based on observed losses of macrophytes following a range of flow magnitudes (Figure S5). This proportional loss of macrophyte habitat will remain for 365 days until natural recovery (or 3 years if the flow ≥ 155,000 ML/day – due to observed loss of all macrophytes and substrate) [36], unless one of the following happens:
- A larger flow occurs. In this case, the level of macrophyte loss will now be the corresponding level as per Figure S5, with the recovery period reset to 365 days (or 3 years, depending on size).
- A flow ≥ 100,000 ML/day, but smaller than the last flow to reduce cover. In this case the recovery period will be extended back to 365 days.
- flow ≥ 40,000 ML/day, but smaller than the last flow to reduce cover. In this case the recovery period will be extended to
, unless this is less than the current recovery period (in which case, the recovery period won’t change), where is daily flow data. It is thought that these flows would affect the recovery time of macrophytes as recovering macrophytes would be more sensitive to flows due to shallower root systems [66].
After the recovery period has ended, macrophyte habitat is reset to 100%.
In the model, the maximum potential recruitment from a breeding season (as a proportion) is based on the level of macrophyte habitat and the level of macrophyte habitat was determined by daily flow data as above. During the spawning season (August to November), in the model Australian lungfish have a daily probability of spawning as a parabolic curve (: Figure S6). Hatching occurs after 23–30 days and larvae take another 14–21 days while the yolk sack is consumed before becoming free swimming juveniles, all the while it is assumed they remain within the dense macrophyte habitat used for spawning [25,67]. Therefore, we assumed macrophyte habitat is critical for the 240-day period following spawning, the period that spans the most habitat sensitive life stage (eggs to YOY). To calculate the daily contribution to seasonal recruitment, the proportion of eggs spawned on day (j), is multiplied by the minimum level of macrophyte habitat from j until j+240. Summing this over each day (d) in the breeding season (L) gives the maximum potential recruitment based on macrophyte cover:
Macrophyte habitat also influences survival of YOY fish, with declining effects on 1–4-year-old survival. The proportion of available habitat (macrophyte cover) was used to scale survival of YOY fish and reduced scale of 0.5, 0.25, 0.125, 0.0625 on survival of fish aged 1–4.
2.7. Density dependence
The ecology of Australian lungfish provides some direction for a suitable density-dependence mechanism. Juveniles have been rarely encountered in the wild and the recruitment of juveniles to the adult population is not well understood [51,68]. The relatively high survival rate of freshwater larvae, in comparison with marine larvae, supports the likelihood that the juvenile stage controls the level of recruitment [61]. Australian lungfish less than one-year-old are vulnerable to interspecific and intraspecific competition and changes in resource availability [45]; juveniles are thought to remain in their natal habitat for long periods [45]; and, in above ground tanks, yearling lungfish shelter in complex shaded habitats [45]. Kemp [68] suggests that low recruitment frequency, or episodic recruitment, is a normal strategy for such a long-lived species. These insights indicate that competition for resources may be high when there is strong recruitment, and that the competition is highest for YOY lungfish as they transition to one-year-old lungfish and this boundary is a plausible location for the impacts of density dependence (increased food demands and habitat requirements as fish grow). Young-of-year lungfish are much smaller compared with other age classes and are likely to be able to utilise habitat (food and refuge) not available to larger lungfish. As the total population would likely influence the strength of density dependence, density dependence was applied to YOY with their number proportionally decreased when the total population was above a weighted average population size (or long-term average in the absence of flow variation). The density dependence ratio of the average population size to total population size was weighted by a factor of 5 to account for size disparity (1 year old ~300 mm and adults up to 1.5 m [34,45]), similar to density dependence mechanisms used for other Australian freshwater fish [58,59].
2.8. Individual population stochastic population model construct
Using the 80 age-class projection matrix (Figure S1) as the structure, the pre-birth census female-only population model, where males were thought not to be limiting, is represented by the following equations:
where t is an annual time interval. is the number of female Australian lungfish in the ith age-class at time t; is a random variate describing environmental variation in the survival rates in the ith age class drawn from normal distributions transformed to the unit interval [69] with no loss of information from the specified means and standard deviations; , and are random variates describing environmental variation in survival rates of lungfish less than one-year-old, larvae, and eggs respectively, similarly to age-specific survival at time t, where survival rates across all ages and stages are perfectly correlated; is the density-dependence factor for one-year-old lungfish based on the total number of female lungfish at time t; is the maximum recruitment potential governed by flow at time t; is the total number of eggs produced at time t from females aged 10 and older with full maturity from age 20 and older; is the fecundity for lungfish in the ith age-class at time t, where age-fecundity is perfectly correlated but not with survival; MF is the maximum fecundity for lungfish and is a standard normal deviate at time t for variation in fecundity due to environmental variation; LTA is the long-term average total female population size (including juveniles); is the total female population size (including juveniles) at time t; is a random variate representing demographic variation in the transition from one age-class to the next drawn from a binomial distribution and is a random variate representing demographic variation in recruitment drawn from a Poisson distribution . Variation in survival rates is unknown, we assumed a coefficient of variation for all survival rates of 10%.
2.9. Burnett River metapopulation model
In the Burnett River, Paradise Dam poses a barrier to Australian lungfish movement and has fragmented what was once a continuous population into three partially connected populations [37]. We constructed a metapopulation model containing three populations that are allowed to move between populations (Figure 1) based on specific rules related to flow. Flow data used in the model for the Burnett River was based on modelled flow data from 1st July 1890 to 30th June 2009 extracted from the SOURCE program that is used by the Queensland Government to guide management of water resources particularly through the use of water plans [70]. The reason modelled streamflow data were used instead of measured streamflow is two-part: (1) the gauged flow data from each site is for a shorter time period (GS136007A Burnett River at Fig Tree since 1997; 1/3 the lifespan) and included missing data; and (2) the use of modelled data allowed the separation of flow alteration impacts for lungfish. Separation of the flow-alteration impacts was achieved by comparison of two specific modelled scenarios. The first modelled flow sequence was a Water Resource Development (WRD) flow which represents current conditions including all water storages in the Burnett water plan area, including Paradise Dam, and the full use of existing water entitlements, as well as improved environmental flow release rules from dams implemented in the 2014 water plan [70] (Figures S10, S11). The second modelled flow sequence was a Predevelopment (Natural) flow which represents a counterfactual flow and was modelled without water extraction or the impact of dams and weirs, including the absence of Paradise Dam. The length of both WRD and Natural flow sequences was 118 years, long enough for population-level impacts to become apparent.
2.9.1. Recruitment and movement rules
Recruitment
Recruitment in Population 1 and Population 3 were calculated using modelled streamflow data at two river gauge sites (GS136002D Burnett River at Mount Lawless: Figure S7; and GS136007A Burnett River at Fig Tree: Figure S8; respectively) [71], based on equation (2). For the WRD flow, it was assumed minimal recruitment occurred in Population 2 (MRP=0.02, based on failed spawning and recruitment in storages) [35] and for the Natural flow it was assumed the recruitment in Population 2 followed the same pattern as Population 1.
WRD flow movement
All downstream movement in the Burnett River model is a proportional movement of the population based on daily flow data, calculated as the sum across the year of daily movement, based on distributions for each population (Figure S9), multiplied by the proportion that hadn’t moved before that day, up to a maximum proportion dependent on the population. The maximum annual movement from population P3 to population P2 is 0.025. There is no movement between these populations during flows under 10,000 ML/day, with flows above this resulting in a daily movement between 0.005 and 0.025 (Figure S9). Because there are no physical barriers between populations P3 and P2, we assumed a minimum annual movement of 0.005, with the sum of daily movement added to this amount. The maximum annual movement from population P2 to population P1 is 0.05. There is no movement between these populations during flows under 40,000 ML/day, with flows above this resulting in a daily movement between 0.002 and 0.05 as in Figure S9 [72]. The maximum annual movement from population P1 into the estuary (past the Ben Anderson Barrage) is 0.005. No movement into the estuary occurs during flows under 8,600 ML/day, with flows above this resulting in a daily movement between 0.0001 and 0.005 (Figure S9). Australian lungfish rarely survive in the estuary [45] and are assumed to die following movement into the estuary.
Upstream movement from Paradise Dam was assumed to be negatively correlated with flow. The annual movement from population P2 to population P3 is calculated as 0.03 less the annual movement from population P3 to population P2 (giving between 0.025 and 0.005). There is limited upstream movement from population P1 as Australian lungfish were rarely reported using the Paradise Dam fish lift [43]. As such, we set movement from population P1 to population P2 at 0.001 for the WRD flow.
Natural flow movement
For Natural flow movement between population P3 and population P2 was used for movement between population P2 and population P1 (see Figure S9). For movement between population P1 and the estuary we used the downstream rule for WRD flow and an 80% return rate for juveniles and adults from the estuary to population P1 assuming no tidal barrage in place but some loss due to predation [45].
2.9.2. Initial conditions
The initial population size and age distribution represents the antecedent conditions of a population model. Age data presented in Fallon et al. [54] shows the age data to have significant gaps and it is likely that the antecedent conditions will have a mix of years where successful recruitment has occurred and years where little or no recruitment occurred [25,51]. We generated a random distribution of proportional age classes that sum to one, with a mix of zero (years of no recruitment) and non-zero years (Figure S10) and multiplied this distribution by the initial population size to generate an initial population distribution. The long-term average female population size (LTA) was set at a level to return an average female adult population size equivalent to the initial female adult population size. The model was run for 200 time-steps (years), a burn in period, to allow the model to escape the influence of the initial conditions, before the flow sequences were implemented. We used a 200 year burn-in as the species is long-lived. This approach has two additional benefits over escaping the influence of the initial conditions before the flow sequences were implemented from time step 201: 1) a variety of population structures are tested after time step 200; and 2) a variety of population sizes are tested after time step 200, creating a range of initial population sizes when the flow sequence is implemented. We set the initial female adult population size for P1 at 7,500, for P2 at 12,500, and P3 at 10,000. The total female adult population size at time step 200 was an average population size of 30,017.23 (see Table 1 for P1, P2 and P3 populations sizes at time step 200). From time step 201 we implemented the flow sequence and applied the associated rules for macrophyte loss and movement.
2.9.3. Other assumptions
Due to infertility and uncertainty about fish near the maximum age being reproductive, it was assumed that only 95% of adult fish produce fertile eggs [25]. Paradise Dam is a large impoundment with a stepped spillway and in high flows some lungfish moving with the flowing water are damaged by impacting on the spillway in overtopping events causing mortality. It was assumed that in high flows, the lungfish moving downstream from population P2 to population P1 would have a 50% reduction in survival due to high turbulence of spillway flows causing mortal injuries.
2.10. Model outputs – expressions of risk
All scenarios were run for 118 time-steps (the length of the WRD and Natural flow sequences) following the 200 time-step burn-in period, with 1000 iterations or trajectories to explore the underlying distributions of the stochastic parameters’ influence on population outcomes. One method to compare stochastic scenarios is to record the minimum population size from each trajectory and present these minimum populations sizes as a cumulative frequency distribution known as risk curves [55]. Risk curves represent the likelihood of extinction (probability of falling to zero) but also the likelihood of falling below some non–zero population threshold known as quasi-extinction risk [55] and has been used successfully on multiple species to document differences between the effectiveness of modelled scenarios on population risk [13,59,73]. Risk curves can be easily compared, a risk curve closer to zero represents a greater likelihood of lower populations sizes in comparison with a risk curve further from zero [73]. Associated with risk curves is the concept of quasi-extinction. Quasi-extinction risk is the likelihood of a population falling to, or below, some non-zero threshold that may be detrimental to the population if below or increase the likelihood the population is exposed to additional threats that it may not be able to recover from, such as behavioural, genetic or ecological [57]. Quasi-extinction risk is a key consideration in conservation management, with those species with reduced distribution range, reduced numbers or limited genetic diversity at a higher risk of extinction and quasi-extinction. Furthermore, as risk curves are a probability distribution we can also calculate the expected value of the risk curves, the expected value of the minimum population size distribution (EV) provides a quantitative comparison between risk curves [13,74]. The EV was recorded in the risk curve figures with the percentage difference between the Natural flow and the WRD flow. We also present plots of all 1000 trajectories, with summary statistics as well as plots of mean trajectories with shaded areas of standard deviation from the mean.
2.11. Model coding
The Australian lungfish model for the Burnett River was constructed in the software package ESSENTIAL [75]. This software and approach have been used extensively to model a variety of other aquatic species in Australia to aid in determining appropriate future management options [13,17,65,73,76]. The platform allows running of a metapopulation model and in this application to Australian Lungfish in the Burnett River includes the options of (a) Water storages scenario including the WRD flow sequence which includes Paradise Dam, limits fish movement upstream of the dam, includes a percentage of spillway mortality on flood flows as well as severely limits the macrophyte growth potential in the dam storage; and (b) running a Natural scenario including the Natural flow sequence and no water storages to impact movement rates. Each scenario was run for 1000 iterations over 318 time-steps with a burn in of 200 time-steps.
3. Results
3.1. Mathematical and sensitivity analysis
The Australian lungfish population growth rate was calculated as for the deterministic (matrix) model, the average number of female fish produced per female in her lifetime was calculated as and the generation time was calculated to be G = 46.24. Perturbation analysis shows that the population growth rate is relatively insensitive to proportional change (elasticity analysis) in vital rates, except for the aggregated adult survival rate which is not an individual age class (: Figure S11a). The population growth rate is sensitive to additive changes (sensitivity analysis) in larval and YOY survival (Figure S11a). Survival of larvae and YOY fish are vital rates that are very hard to measure in the wild. Our best estimate for YOY survival rate comes from the age specific survival equation in Table 1 and may change if additional age data becomes available, however this would change all age survival estimates not just the YOY survival rate. While the model is most sensitive to the estimation of larval survival, doubling larval survival only produces a 2.6% change in the population growth rate. The reproductive value indicates that the highest value was achieved between the ages of 20 and 40 and declines thereafter (Figure S11b), a common trait for reproductive values [56], and is still relatively high around the generation time age, indicating the contribution that these older fish provide to future generations.
3.2. Model outcomes
For the Burnett River, the 118-year WRD flow data was used to analyse the impact of flow on recruitment and to model the response of population dynamics to changes in macrophyte habitat based on the flow rules identified in the methods. The results highlight that there are some differences in overall adult population trajectories between the three populations within the Burnett River using the WRD flow data (Figure 3). All populations exhibit a decline through the first 80 years, reflecting the lower recruitment opportunities through this period. Populations P3 and P1 (Figure 3a and 3c) recover after this period. However, population P2 (Figure 3b) continues to decline and remains low. Reduced spawning habitat is the key driver for the decline in population P2 (Paradise Dam) coupled with a net migration of lungfish downstream to population P1, albeit low level, due to limitations in the upstream fishway at Paradise Dam. The combined total population trajectories (Figure 3d) have a similar pattern to population P3 (Figure 3a) though recovery is proportional less due to population P2.
Comparing WRD flow with Natural flow produces different responses depending on the population (Figure 4). The mean trajectories and ± 1 standard deviation in populations P3 and P1 show little difference between the two flows (Figure 4a and 4e) which is reflected in the associated risk curves and expected value of the minimum population size EV (Figure 4b and 4f). In contrast, the mean trajectories and ± 1 standard deviation in population P2 show sharp differences between the two flows (Figure 4c) which is reflected in the associated risk curves and EV (Figure 4d) indicating a higher risk of a small population size under the WRD flow compared with the Natural scenario flow. At the metapopulation level the clear differences in population P2 between the flow scenarios are reduced (Figure 4g), though the risk curves indicate a higher risk of a smaller population size for the WRD flow compared with the Natural scenario flow (Figure 4h). This is an example of the benefits of constructing a metapopulation model to demonstrate the effects of flow changes at the local population level.
The expected value of the minimum population size distribution between WRD flow and the Natural flow: produces in population P3 a Natural flow EV 11% higher than the WRD flow (Figure 4b); produces in population P2 a Natural flow EV 179% higher than the WRD flow (Figure 4d); produces in population P1 a Natural flow EV 1% lower than the WRD flow (Figure 4f); and the metapopulation produces a Natural flow EV 29% higher than the WRD flow (Figure 4h).
Figure 4.
Plots of mean female adult population size paired with the risk curves: population P3 (a) mean and standard deviation and (b) risk curve; population P2 (c) and (d); population P1 (e) and (f); and total population TP (g) and (h). Orange – modelled WRD flow and blue – modelled Natural flow: shaded areas are ± 1 standard deviation.
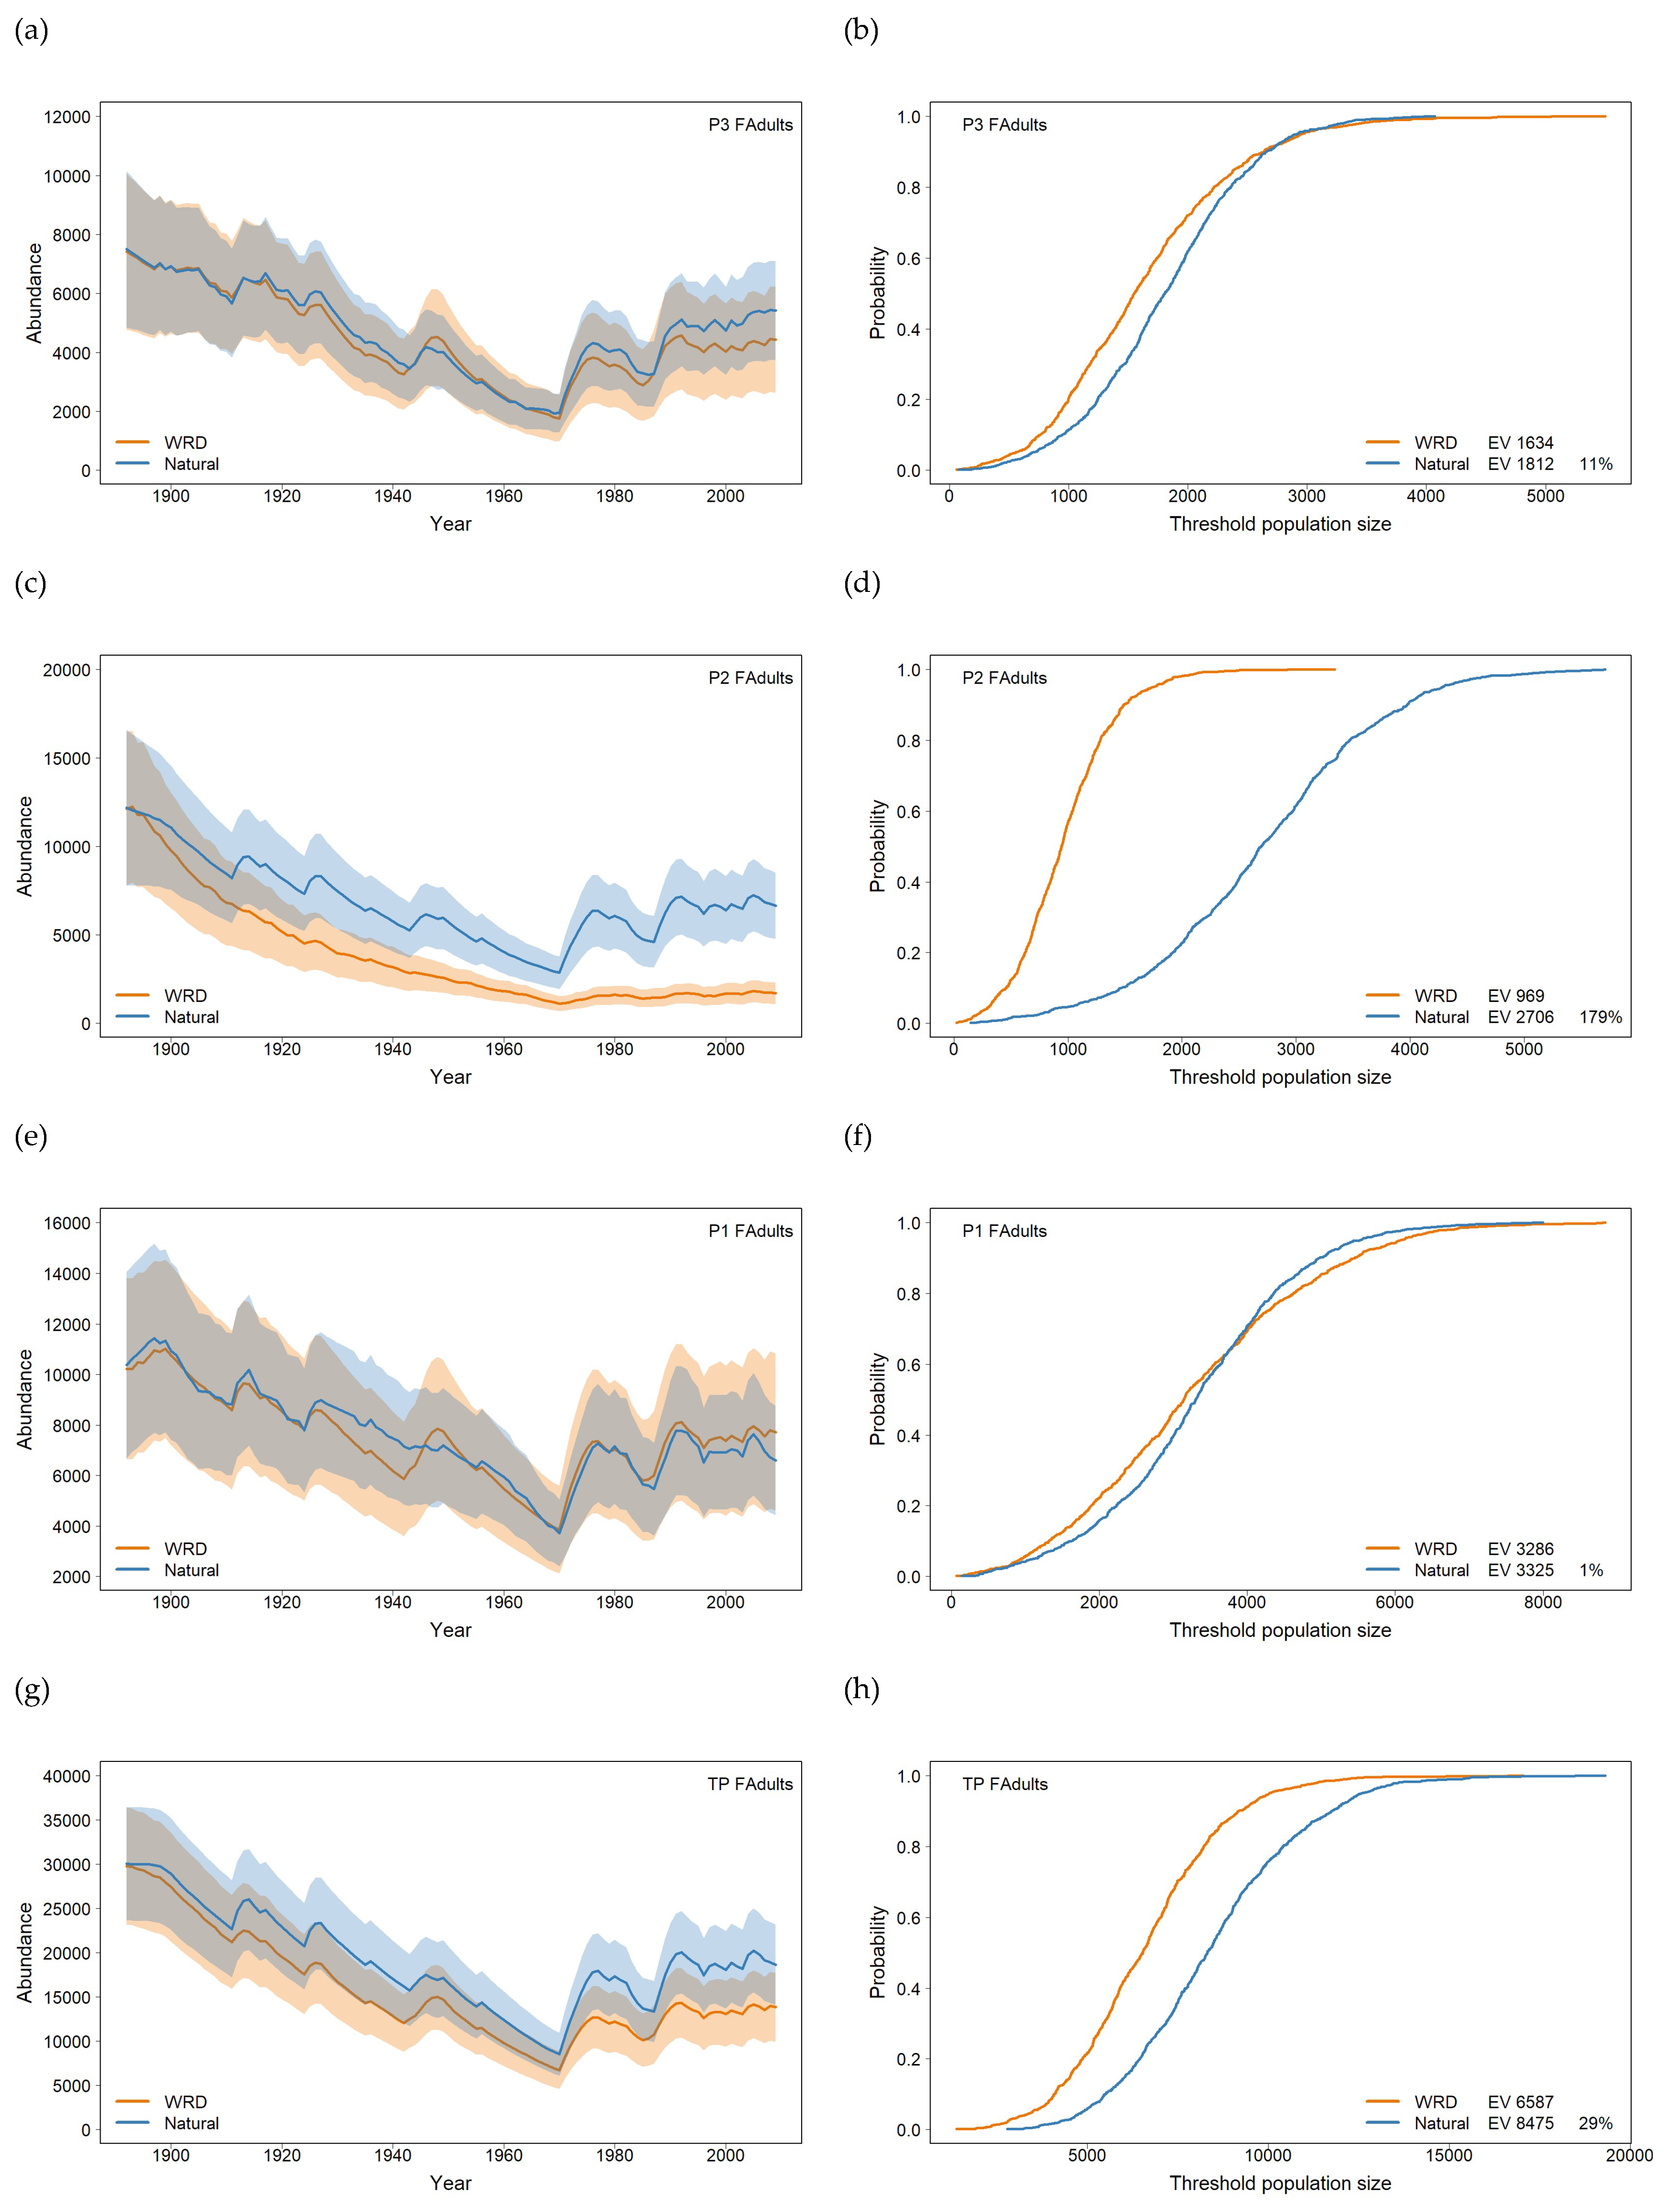
The quasi-extinction risks for Population P2 highlight the difference between the WRD and Natural flows (Table 2) consistent with the risk curves (Figure 4d). For the Natural flow the risk of falling below 500 female adults was 0.015 and 0.123 for the WRD flow, and the risk of falling below 2,000 female adults was 0.227 for the Natural flow and 0.981 for the WRD flow.
Figure 5.
Plots of modelled recruitment events paired with the proportion of available aquatic macrophyte for each population: population P3 (a) mean abundance and (b) macrophyte habitat proportion; population P2 (c) and (d); and population P1 (e) and (f). Orange – modelled WRD flow and Blue – modelled Natural flow: shaded areas are ± 1 standard deviation.
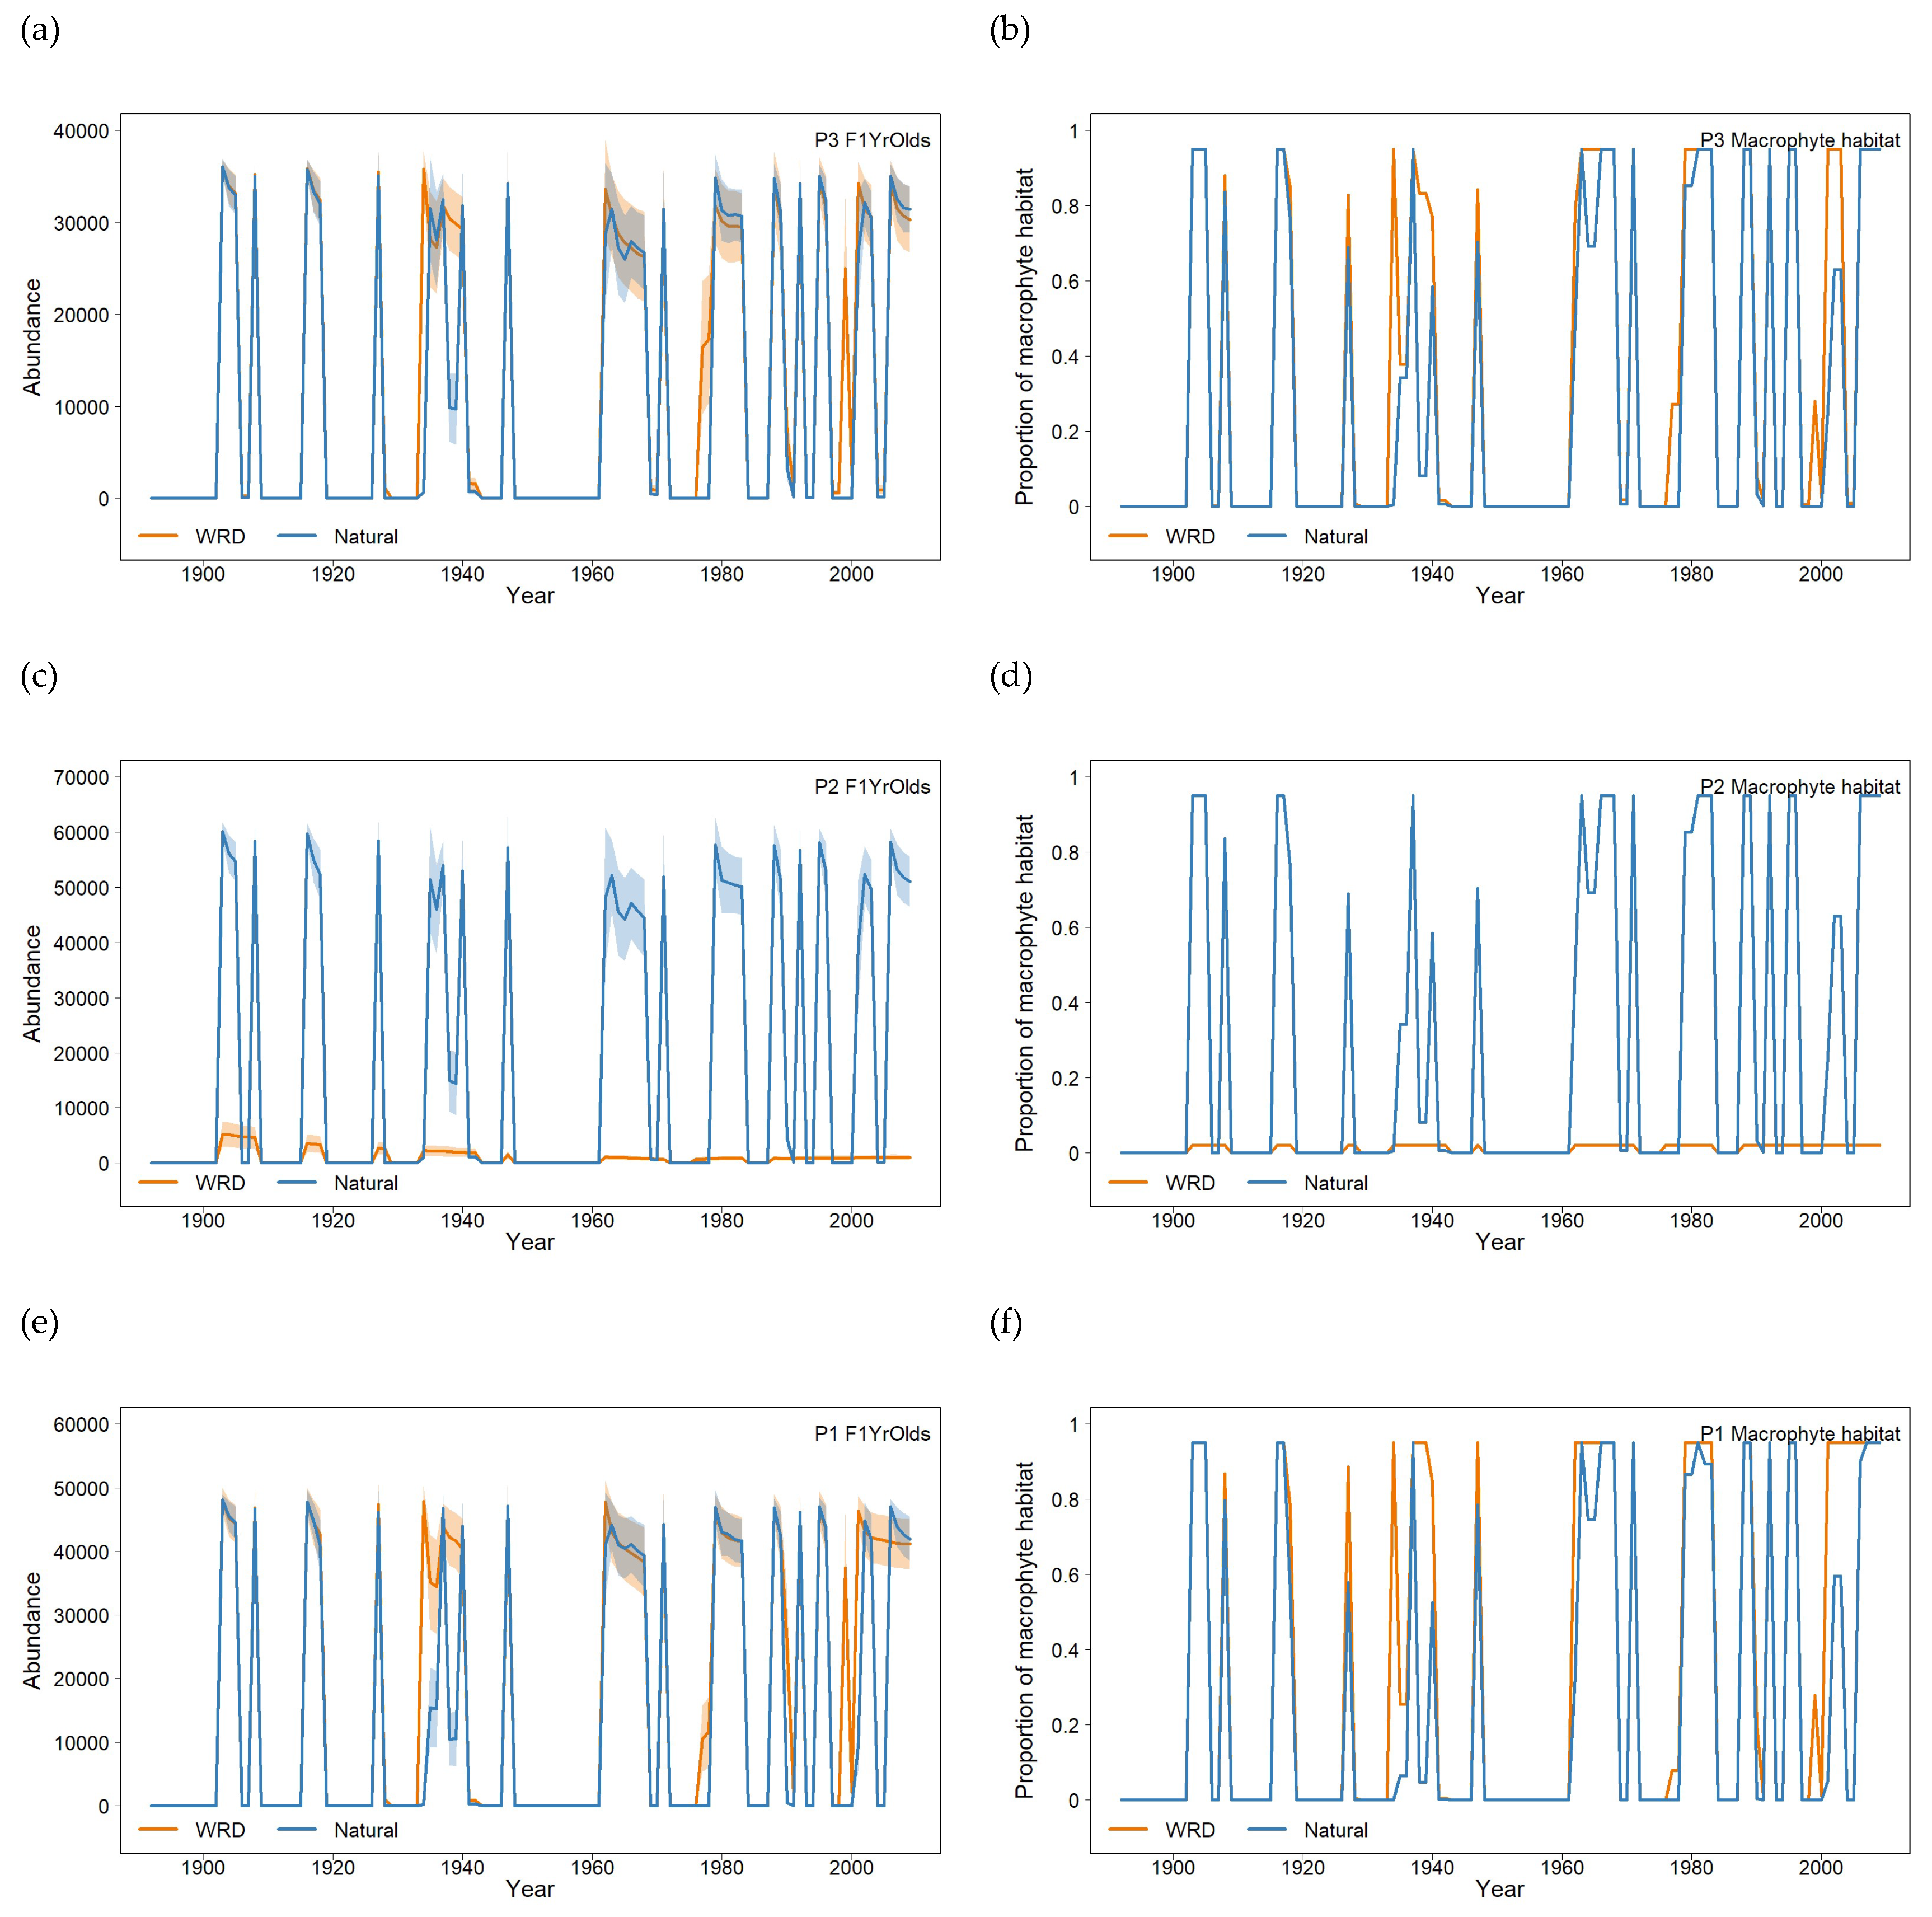
The modelled effects of flow on macrophyte habitat resulted in episodic recruitment to 1 year olds (Figure 5). In populations P3 and P1, changes in macrophyte habitat and abundance of recruits were broadly consistent between the two flows (Figure 5a, b and 5e, f), whereas in comparison, in population P2, there were almost no available macrophytes (Figure 5d) and thus no recruitment under the WRD flow (Figure 5c).
4. Discussion
We developed a metapopulation model to conduct a population viability analysis (PVA) for Australian lungfish in the Burnett River which considered both viability and uncertainty to inform conservation management. The population model was constructed for this specific river for this long-lived, threatened species using the best available estimates of survival and fecundity rates, density dependence constraints and habitat loss from variable river flows impacting on the early life-history stages (eggs; larvae; and young-of-year fish) to ensure that the resultant model was both realistic and appropriate for this system [12].
The model considered the main identified threats to the species being the loss of habitat (naturally occurring and induced through water infrastructure) and the consequences of water infrastructure being the cause of other threats: altered hydrology and water regulation, spillway mortality and barriers to movement where for example fish experience mortality through exposure to excess salinity and predation by stranding in estuaries below tidal barrages [30]. The ability to model these influences on the long-term population viability of a long-lived, threatened species cannot be easily achieved through field-based monitoring techniques, and enables the assessment of various priority conservation measures, whilst being explicit about the uncertainties and minimising subjective judgements [77,78]. The lungfish PVA model is an important tool towards longer-term management of this species as it allows biologists and managers to test specific scenarios for the distinct sub-populations that may influence their viability as well as understanding consequences for the whole metapopulation.
4.1. The role of aquatic macrophytes as habitat for Australian lungfish
The Australian lungfish life-history traits align to that of periodic strategists, fish that are larger, long-lived and thereby reduce the risks of periods of unfavourable recruitment conditions [79]. Species with this strategy tend to have a lower degree of variability in abundance and high variability in recruitment, with the longevity of these species offsetting the period between strong recruitment events, which can be up to several decades [79]. As there is at least a 10-year lag from spawning to reproductive maturity in Australian lungfish, recruitment success may not be evident for decades using traditional field monitoring programs alone. The Burnett River lungfish PVA model has demonstrated that when the influence of flood flows on macrophyte development are included as inputs to spawning and recruitment success, that there are significant impacts to the resultant average adult population size over time (Figure 4, 5). This repeated loss of macrophytes due to flooding was considered the key reason for a decadal lack of recruits of Australian lungfish in the Mary River observed during the high flood period of the 1970s [54].
Whilst large dams like Paradise Dam on the Burnett River may reduce the peak discharge of flood flows and allow macrophytes downstream of the dam to persist during some flow events, this is compensated for by the significantly reduced macrophyte habitat availability and suitability throughout the inundated upstream reach (population P2) where up to 45 km of river channel now contains suboptimal habitat [32,36]. Additionally, dams can prevent the reestablishment of valuable macrophyte habitat through sequestration of seedbanks in deep sediments. Furthermore, large dams have the capacity to capture smaller flows disrupting natural hydrochory processes essential to aid recovery after destructive flood events that scour macrophytes [80]. This reduction in propagule dispersal required for recolonisation by macrophytes after large floods, could extend the period of reduced spawning potential for Australian lungfish, exacerbating the population impacts of habitat loss from inundation.
4.2. Impacts of water management
While inundation of aquatic macrophytes and the fluctuating water levels in storages have a direct effect on aquatic habitat for Australian lungfish in storages [66], interruption of movement patterns is also a key threat [30]. Direct monitoring has documented mortality of lungfish wounded as a result of impact with the stepped spillway of Paradise Dam following downstream displacement during high overtopping flows [36]. Translation of this spillway effect to population-levels may not be evident for many decades using traditional monitoring. Additional mortality of individuals occurs after flooding events due to being stranded downstream of the tidal barrage in the estuary as the fishway is ineffective and lungfish are unable to utilise it to return to freshwater environments. Both of these additional sources of mortality add to the loss of adults from the breeding population and are relevant to the conservation of Australian lungfish where adult survival was estimated to be very high, typical of long-lived species [81]. While the destructive impact of large floods has been included in the model, the influence of small stable flows during the breeding season necessary for spawning stimulus and egg development should be considered in future model development. Improved environmental flow management rules from storages in the Burnett River have, however, been shown to be associated with successful lungfish spawning downstream of storages [82]. These environmental management rules have been implemented throughout the core range of lungfish in the Burnett River and may offset some of the negative impacts of dams by providing a more natural low flow regime downstream.
4.3. Population viability and risk
The Australian lungfish population growth rate for the deterministic (matrix) model was calculated to be relatively low, = 1.0587. The average number of female fish produced per female in her lifetime was relatively high = 8.13. Generation time (the average age of parents of the current cohort) was calculated to be very long G = 46.24. We do not consider these summary statistics unusual for a long-lived fish with a slow life-history, for example Bjørkvoll et al. [83] found that generally, marine species with a slow life-history had low reproduction and population growth, high survival rates and long generation times.
Our modelling of Australian lungfish in the Burnett River over a period of 118 years is the first attempt to understand population viability and extinction risk for this species. The results suggest that although the current hydrological threats may reduce the average adult population, it is likely that this results in only a modest increase in risk of the population being smaller for the total population when compared with the modelled Natural flow scenario (Figure 4). However, it is likely that there is a considerable increase in risk for the population within the Paradise Dam impoundment with a relatively high likelihood of the population being small under the WRD flow scenario. This highlights the benefits of developing a metapopulation model to be able to examine the impacts of spatially variable habitat alterations and effects on individual populations within a large river system with significant regulation. Conservation of Australian lungfish needs to consider the multiple genetic stocks across the current range and hence the importance of managing threats unique to each [20]. The original conservation advice listed Australian lungfish as ‘Vulnerable’ highlighted that there was ‘sufficient evidence to suspect that the adult breeding population will undergo a substantial decline over the next three generations’ [30]. This listing preceded significant research into age estimation, population estimations from tag-recapture and genetic differentiation. The generation time for Australian Lungfish in the Burnett River was calculated to be very long (G = 46.24), with three generations equating to 138 years. This is similar to the modelled simulation of 118 years where the model suggested that there may be a 28% reduction in the abundance of adult female lungfish, assuming water infrastructure has been in place for that whole period. Whilst the outcome of this scenario is of concern and aligns with the original conservation listing, there is no evidence to suggest these pressures will cause the extinction of the species. The Burnett River PVA model now allows us to test a range of scenarios to understand which management actions may be taken to reduce the risk to the metapopulation [10].
Population viability models are essential tools for prioritising management actions for long-lived species where generation time often exceeds even the longest long-term monitoring programs in well researched species [84]. For example, population modelling of the US Atlantic loggerhead sea turtle (Caretta caretta), a species with a ~70-year lifespan [85], highlighted that mortality of adult turtles by drowning in prawn trawls was a major threat that could be mitigated through implementation of turtle excluder devices [81]. Even though these devices became mandatory in 2002, due to the long generation time for marine turtles, it has taken nearly two decades for the numbers of nesting turtles within the local area to improve [86].
4.4. Future uses of the model
The existing Burnett River PVA model for Australian lungfish has highlighted the trajectory of the species in the river system with the existing modelled threats. Due to construction issues with Paradise Dam, the spillway height has been reduced and a new dam is currently being investigated [87]. In addition, the Burnett Basin water plan is being reviewed which means that hydrological modelling for the river system will be updated with new stream flow sequences that include the new dam design and an additional 14 years of streamflow data [40]. Updating the flow sequences in the PVA model will improve the confidence in understanding the longer-term impact of spillway mortality, macrophyte losses, spawning successes and losses to the estuary as all of these effects have been measured for the past decade [36]. This highlights the importance of updating models and modelling as new data, knowledge and management scenarios arise. Whilst the PVA model can be used as purely to understand extinction risks, its real power is to compare scenarios with altered parameters to evaluate outcomes of future conservation actions. Such actions could include reducing the lag period between flood scouring and macrophyte recovery downstream of large dams by actively rehabilitating lost aquatic macrophytes, improved fishway passage effectiveness for lungfish on modelled barriers, or reduced mortality rates of altered spillway design. Population models can also be used to understand where the vulnerability of the species (especially for long-lived species), lies in relation to the life cycle, whether that be the early life-history, breeding, adult mortality or at all stages [81,88].
Many of the knowledge gaps originally identified within the Draft National Recovery Plan for Australian lungfish have been advanced, including understanding the age structure of the population [36,54]. Such information has provided an essential basis for this modelling and the subsequent conservation management of this threatened species. The populations in separate drainages need to be managed as genetically distinct units, as they are experiencing differing threatening processes. The increased research on the species in the past decade has enabled realistic and precise construction of a species population model to represent geographically distinct populations [12]. The metapopulation model for the Burnett River Australian lungfish, comparing the two flow scenarios, identified a significant increase in risk of the population being small for one of the populations most affected by habitat modifications and a modest increase in risk for the total population within the river system. The model has the flexibility to test future conservation strategies to manage impacts, explore options to promote sustainable population levels and in the longer-term, may be used to help remove Australian lungfish’s threatened species status.
5. Conclusions
We developed a metapopulation model for a very long-lived threatened species using interventions that target different elements of the species’ life-history that drives subsequent population dynamics. The study of long-lived species may be restricted by a lack of high-quality long -term data, and particularly in the case of threatened species, restricting our capacity to predict systemic decline or recovery in response to threat amelioration. As such, it is imperative that tools such as this metapopulation model are used to guide and develop future management strategies, particularly for species of high conservation value, even where data may be limited. Alongside targeted research and monitoring that address knowledge gaps, metapopulation models can inform species conservation efforts. The PVA model presented here can be updated as knowledge on life-history or key threats become better understood to re-test alternate management scenarios into the future. Moreover, the approach described here could be adapted to inform management of other long-lived threatened species.
Supplementary Materials
The following supporting information can be downloaded at the website of this paper posted on Preprints.org. Figure S1: Projection matrix construct for the lungfish population model; Figure S2: Age-frequency data and regression line to estimate age specific survival; Figure S3: Survival rates by age, survival at age 1, ; Figure S4: Age specific fecundity increasing from age 10 with a maximum fecundity of 75,000 eggs; Figure S5: Proportion of macrophyte cover lost after large flows in the Burnett River, there is no loss of macrophyte cover for flows less than 40,000 ML/day; Figure S6: Probability of spawning on a given day in the spawning season (August 1 to November 30); Figure S7: Daily flow for the Burnett River at Mt Lawless: orange – modelled WRD flow and blue – modelled Natural flow; Figure S8: Daily flow for the Burnett River at Figtree: orange – modelled WRD flow and blue – modelled Natural flow; Figure S9: Daily downstream movement from each population in the Burnett River, there is no movement for flows to the left of the dotted lines; Figure S10: Random relative frequency initial age distribution; Figure S11: Perturbation analysis (a) with light blue depicting sensitivity analysis and dark blue depicting elasticity analysis; and (b) reproductive values.
Author Contributions
Manuscript conceptualization C.R.T., A.J.M., S.M.C.R., D.T.R., T.R.B., J.D.K., S.G.B., T.E., B.G.F., P.K.K., and S.M.M. Model development, coding, data analysis C.R.T., and T.R.B. Writing–original draft preparation C.R.T., A.J.M., S.M.C.R., D.T.R., R.H., J.D.K., W.F.H. and A.M.K. Writing–review and editing C.R.T., A.J.M., S.M.C.R., D.T.R., J.D.K., W.F.H., T.E., B.G.F., P.K.K. and S.M.M. All authors have read and agreed to the published version of the manuscript.
Funding
This research was funded by SunWater and Seqwater, Queensland Australia.
Institutional Review Board Statement
Not applicable.
Informed Consent Statement
Not applicable.
Data Availability Statement
The data are available on request from the corresponding author.
Acknowledgements
The authors thank members of the Australian lungfish Australian Research Council (ARC) project team for their willingness to share knowledge and provide sensitive data. We are grateful to SunWater and Seqwater for instigating and funding this project, Andrew Boulton and Ashley Sparrow for useful comments on the paper, and Gordon Delaney, Jane Hughes, Dan Schmidt, Nick Bond, Mark Kennard, Stewart Fallon, and for their contribution to the lungfish workshop (Brisbane, November 2018). Authors gratefully thank Michael Scroggie for reviewing this manuscript as well as two anonymous reviewers who have helped improve this manuscript. The production of this manuscript was supported by the Applied Aquatic Ecology writing retreat through the Arthur Rylah Institute Capability Fund.
Conflicts of Interest
The authors declare no conflicts of interest.
References
- Almond, R.E.A.; Grooten, M.; Juffe Bignoli, D.; Petersen, T. Living Planet Report 2022: Building a Nature-Positive Society; WWF: Gland, Switzerland, 2022;
- Hernández-Yáñez, H.; Kim, S.Y.; Che-Castaldo, J.P. Demographic and life history traits explain patterns in species vulnerability to extinction. PLoS One 2022, 17, e0263504. [CrossRef]
- Pyron, M. Relationships between geographical range size, body size, local abundance, and habitat breadth in North American suckers and sunfishes. J. Biogeogr. 1999, 26, 549–558.
- Ripple, W.J.; Wolf, C.; Newsome, T.M.; Hoffmann, M.; Wirsing, A.J.; McCauley, D.J. Extinction risk is most acute for the world’s largest and smallest vertebrates. Proc. Natl. Acad. Sci. U.S.A. 2017, 114, 10678–10683. [CrossRef]
- Sanders, E.; Wassens, S.; Michael, D.R.; Nimmo, D.G.; Turner, J.M. Extinction risk of the world’s freshwater mammals. Conserv. Biol. 2024, 38, e14168. [CrossRef]
- Kuussaari, M.; Bommarco, R.; Heikkinen, R.K.; Helm, A.; Krauss, J.; Lindborg, R.; Öckinger, E.; Pärtel, M.; Pino, J.; Rodà, F.; et al. Extinction debt: a challenge for biodiversity conservation. Trends Ecol. Evol. 2009, 24, 564–571. [CrossRef]
- Figueiredo, L.; Krauss, J.; Steffan-Dewenter, I.; Sarmento Cabral, J. Understanding extinction debts: spatio–temporal scales, mechanisms and a roadmap for future research. Ecography 2019, 42, 1973–1990. [CrossRef]
- Schmidt, D.J.; Fallon, S.; Roberts, D.T.; Espinoza, T.; McDougall, A.; Brooks, S.G.; Kind, P.K.; Bond, N.R.; Kennard, M.J.; Hughes, J.M. Monitoring age-related trends in genomic diversity of Australian lungfish. Mol. Ecol. 2018, 27, 3231–3241. [CrossRef]
- Koster, W.; Amtstaetter, F.; Dawson, D.; Coleman, R.; Hale, R. Environmental influences on the juvenile migration of the threatened amphidromous Australian grayling (Prototroctes maraena). Mar. Freshwater Res. 2020. [CrossRef]
- McDougall, A.J.; Espinoza, T.; Hollier, C.; Limpus, D.J.; Limpus, C.J. A risk assessment approach to manage inundation of Elseya albagula nests in impounded waters: a win-win situation? Environ. Manage. 2015, 55, 715–724. [CrossRef]
- Tonkin, Z.; Yen, J.; Lyon, J.; Kitchingman, A.; Koehn, J.D.; Koster, W.M.; Lieschke, J.; Raymond, S.M.C.; Sharley, J.; Stuart, I.G.; et al. Linking flow attributes to recruitment to inform water management for an Australian freshwater fish with an equilibrium life-history strategy. Sci. Total Environ. 2021, 752, 141863. [CrossRef]
- Raimondo, S.; Schmolke, A.; Pollesch, N.; Accolla, C.; Galic, N.; Moore, A.; Vaugeois, M.; Rueda-Cediel, P.; Kanarek, A.; Awkerman, J.; et al. Pop-guide: population modeling guidance, use, interpretation, and development for ecological risk assessment. Integr. Environ. Assess. Manage. 2021, 17, 767–784. [CrossRef]
- Todd, C.R.; Koehn, J.D.; Pearce, L.; Dodd, L.; Humphries, P.; Morrongiello, J.R. Forgotten fishes: What is the future for small threatened freshwater fish? Population risk assessment for southern pygmy perch, Nannoperca australis. Aquat. Conserv. Mar. Freshwater Ecosyst 2017, 27, 1290–1300. [CrossRef]
- Burgman, M.A.; Possingham, H.P. Population viability analysis for conservation: the good, the bad and the undescribed. In Genetics, Demography and Viability of Fragmented Populations; Young, A.G., Clark, G.M., Eds.; Cambridge University Press, 2000.
- Todd, C.R.; Whiterod, N.; Raymond, S.M.C.; Zukowski, S.; Asmus, M.; Todd, M.J. Integrating fishing and conservation in a risk framework: a stochastic population model to guide the proactive management of a threatened freshwater crayfish. Aquat. Conserv. Mar. Freshwater Ecosyst. 2018, 28, 954–968. [CrossRef]
- Koehn, J.D.; Todd, C.R. Balancing conservation and recreational fishery objectives for a threatened fish species, the Murray cod, Maccullochella peelii. Fish. Manage. Ecol. 2012, 19. [CrossRef]
- Stoessel, D.; Todd, C.R.; Brown, T.; Koehn, J.D.; Walsh, C.; van der Meulen, D.; Williams, J.; Birleson, M. Assessing outcomes of environmental flows for an estuary-dependent fish species using a novel stochastic population model approach. Estuaries Coasts 2022, 45, 2040–2058. [CrossRef]
- Todd, C.R.; Lintermans, M. Who do you move? A stochastic population model to guide translocation strategies for an endangered freshwater fish in south-eastern Australia. Ecol. Model. 2015, 311, 63–72. [CrossRef]
- Spencer, R.-J.; Janzen, F.J. Demographic consequences of adaptive growth and the ramifications for conservation of long-lived organisms. Biol. Cons. 2010, 143, 1951–1959. [CrossRef]
- Hughes, J.M.; Schmidt, D.J.; Huey, J.A.; Real, K.M.; Espinoza, T.; McDougall, A.; Kind, P.K.; Brooks, S.; Roberts, D.T. Extremely low microsatellite diversity but distinct population structure in a long-lived threatened species, the Australian lungfish Neoceratodus forsteri (Dipnoi). PLoS One 2015, 10, e0121858. [CrossRef]
- Whitley, G.P. The Queensland lungfish. Aust. Mus. Mag. 1927, 3, 50–52.
- Biello, R.; Ghirotto, S.; Schmidt, D.J.; Fuselli, S.; Roberts, D.T.; Espinoza, T.; Hughes, J.M.; Bertorelle, G. Unravelling the mystery of endemic versus translocated populations of the endangered Australian lungfish (Neoceratodus forsteri). Mol. Ecol. 2024, 33, e17266. [CrossRef]
- Cavin, L.; Kemp, A. The impact of fossils on the evolutionary distinctiveness and conservation status of the Australian lungfish. Biol. Cons. 2011, 144, 3140–3142. [CrossRef]
- Clement, A.M.; Ahlberg, P.E. The first virtual cranial endocast of a lungfish (Sarcopterygii: Dipnoi). PLoS One 2014, 9, e113898. [CrossRef]
- Kemp, A. The biology of the Australian lungfish, Neoceratodus forsteri (krefft 1870). J. Morphol. 1986, 190, 181–198. [CrossRef]
- Schartl, M.; Meyer, A. Neoceratodus forsteri (Australian lungfish). Trends Genet. 2021, 37, 600–601. [CrossRef]
- Arthington, A.H.; Milton, D.A.; McKay, R.J. Effects of urban development and habitat alterations on the distribution and abundance of native and exotic freshwater fish in the Brisbane region, Queensland. Aust. J. Ecol. 1983, 8, 87–101. [CrossRef]
- Ebner, B.C.; Morgan, D.L.; Kerezsy, A.; Hardie, S.; Beatty, S.J.; Seymour, J.E.; Donaldson, J.A.; Linke, S.; Peverell, S.; Roberts, D.; et al. Enhancing conservation of Australian freshwater ecosystems: identification of freshwater flagship fishes and relevant target audiences. Fish Fish. 2016, 17, 1134–1151. [CrossRef]
- Brooks, T.M.; Pimm, S.L.; Akçakaya, H.R.; Buchanan, G.M.; Butchart, S.H.M.; Foden, W.; Hilton-Taylor, C.; Hoffmann, M.; Jenkins, C.N.; Joppa, L.; et al. Measuring Terrestrial Area of Habitat (AOH) and Its Utility for the IUCN Red List. Trends Ecol. Evol. 2019, 34, 977–986. [CrossRef]
- Australian Government Approved Conservation Advice for Neoceratodus Forsteri (Australian Lungfish) s266B of the EPBC Act 1999 Available online: https://environment.gov.au/biodiversity/threatened/species/pubs/67620-conservation-advice.pdf.
- Arthington, A. Australian lungfish, Neoceratodus forsteri, threatened by a new dam. Environ. Biol. Fishes 2009, 84. [CrossRef]
- Marshall, S.M.; Espinoza, T.; McDougall, A.J. Effects of water level fluctuations on spawning habitat of an endangered species, the Australian lungfish (Neoceratodus forsteri). River Res. Appl. 2015, 31, 552–562. [CrossRef]
- Roberts, D.T.; Mallett, S.; Krück, N.C.; Loh, W.; Tibbetts, I. Spawning activity of the Australian lungfish Neoceratodus forsteri in an impoundment. J. Fish Biol. 2014, 84, 163–177. [CrossRef]
- Brooks, S.G.; Kind, P.K. Ecology and Demography of the Queensland Lungfish (Neoceratodus Forsteri) in the Burnett River, Queensland; Department of Primary Industry, Queensland, 2002;
- Espinoza, T.; Marshall, S.M.; McDougall, A.J. Spawning of the endangered Australian lungfish (Neoceratodus forsteri) in a heavily regulated river: a pulse for life. River Res. Appl. 2013, 29, 1215–1225. [CrossRef]
- Department of Agriculture and Fisheries Paradise Dam – Lungfish and Aquatic Ecosystem Monitoring 2006-2016. Biennial Summary Report 5 and Final Report; Report prepared for Burnett Water Pty Ltd., 2017;
- Fanson, B.G.; Todd, C.R. Independent Analysis of Lungfish Monitoring Data at Paradise Dam; Department of Environment, Land, Water and Planning: Heidelberg, Victoria, 2017;
- Kind, P.K.; Ramage, A.; Brooks, S. Survival Strategy for the Australian Lungfish Neoceratodus Forsteri; Issued September 2008 to the Coordinator-General., 2008;
- Macdonald, J.I.; Tonkin, Z.D.; Ramsey, D.S.L.; Kaus, A.K.; King, A.K.; Crook, D.A. Do invasive eastern gambusia (Gambusia holbrooki) shape wetland fish assemblage structure in south-eastern Australia? Mar. Freshwater Res. 2012, 63, 659–671. [CrossRef]
- Queensland Government Burnett Basin Water Plan Review Available online: https://www.rdmw.qld.gov.au/water/consultations-initiatives/burnett-water-plan-review.
- Brigza, S.; Arthington, A.; Choy, S.; Duivenvoorden, L.J.; Kennard, M.; Maynard, R.; Poplawski, W. Burnett Basin WAMP: Current Environmental Conditions and Impacts of Existing Water Resource Development; Department of Natural Resources, 2000;
- Stuart, I.G.; Berghuis, A.P. Upstream passage of fish through a vertical-slot fishway in an Australian subtropical river. Fish. Manage. Ecol. 2002, 9, 111–122. [CrossRef]
- 2012; Queensland Government Paradise Dam Upstream Fishway Monitoring Program; Fisheries Queensland, 2012;
- Mayne, B.; Espinoza, T.; Roberts, D.; Butler, G.L.; Brooks, S.; Korbie, D.; Jarman, S. Nonlethal age estimation of three threatened fish species using DNA methylation: Australian lungfish, Murray cod and Mary River cod. Mol. Ecol. Resour. 2021, 21, 2324–2332.
- Kind, P.K. The natural history of the Australian lungfish Neoceratodus forsteri (Krefft, 1870). In The Biology of Lungfishes; Jørgensen, J.M., Joss, J., Eds.; CRC Press: Enfield, New Hampshire, USA, 2011.
- Grigg, G.C. Spawning behaviour in the Queensland lungfish, Neoceratodus forsteri (Krefft). Aust. Nat. Hist. 1965, 15, 75.
- Allen, G.R.; Midgley, S.H.; Allen, M. Field Guide to Freshwater Fishes of Australia; CSIRO Publishing: Melbourne, Victoria, 2002;
- Kind, P.K.; Brooks, S.G.; Piltz, S.A. Burnett River Dam Baseline Lungfish Monitoring 2004/2005; Department of Primary Industry and Fisheries: Queensland, 2005;
- Bancroft, T.L. On a weak point in the life history of Neoceratodus forsteri Krefft. Proc. R. Soc. Queensl. 1911, 251–256.
- Brooks, S. Short-term Study of the Breeding Requirements of Lungfish (Neoceratodus Forsteri) in the Burnett River with Specific Reference to the Possible Effects of the Proposed Walla Weir; Department of Primary: Queensland, 1995;
- Pusey, B.; Kennard, M.J.; Arthington, A.H. Freshwater Fishes of North-Eastern Australia; CSIRO publishing, 2004;
- Kemp, A. Unusual oviposition site for Neoceratodus forsteri (Osteichthyes: Dipnoi). Copeia 1993, 1993, 240–242. [CrossRef]
- Kemp, A.; Kemp, A. Spawning of the Australian lungfish, Neoceratodus forsteri (Krefft) in the Brisbane River and in Enoggera Reservoir, Queensland. Mem. Queensl. Mus. 1984, 21, 391–399.
- Fallon, S.J.; McDougall, A.J.; Espinoza, T.; Roberts, D.T.; Brooks, S.; Kind, P.K.; Kennard, M.J.; Bond, N.; Marshall, S.M.; Schmidt, D.; et al. Age structure of the Australian lungfish (Neoceratodus forsteri). PLoS One 2019, 14, e0210168. [CrossRef]
- Burgman, M.A.; Ferson, S.; Akçakaya, H.R. Risk Assessment in Conservation Biology; Chapman and Hall: London, UK, 1993;
- Caswell, H. Matrix Population Models; 2nd ed.; Sinauer Associates: Sunderland, Massachusetts, USA, 2001; p. 746;
- Morris, W.F.; Doak, D.F. Quantitative Conservation Biology: Theory and Practice of Population Viability Analysis; Sinauer Associates: Sunderland, Massachusetts, USA, 2002;
- Todd, C.R.; Ryan, T.; Nicol, S.J.; Bearlin, A.R. The impact of cold water releases on the critical period of post-spawning survival and its implications for Murray cod (Maccullochella peelii peelii): A case study of the Mitta Mitta River, southeastern Australia. River Research and Applications 2005, 21, 1035–1052.
- Todd, C.R.; Nicol, S.J.; Koehn, J.D. Density-dependence uncertainty in population models for the conservation management of trout cod, Maccullochella macquariensis. Ecol. Model. 2004, 171, 359–380. [CrossRef]
- Ricker, W.E. Computation and Interpretation of Biological Statistics of Fish Populations; Bulletin of the Fisheries Research Board: Ottawa, Canada, 1975;
- Houde, E.D. Differences between marine and freshwater fish larvae: implications for recruitment. ICES J. Mar. Sci. 1994, 51, 91–97. [CrossRef]
- Fanson, B.G. Lungfish Survival Analyses. Unpublished Report; Arthur Rylah Institute for Environmental Research, Department of Environment, Land, Water and Planning: Heidelberg, Victoria, 2019;
- IUCN Standards and Petitions Committee Guidelines for Using the IUCN Red List Categories and Criteria. Version 16; Prepared by the Standards and Petitions Committee, 2024;
- Jonasson, J.; Härkönen, T.; Sundqvist, L.; Edwards, S.; C, H. A unifying framework for estimating generation time in age-structured populations: implications for phylogenetics and conservation biology. Am. Nat. 2022, 200, 48–62.
- Todd, C.R.; Koehn, J.D.; Stuart, I.G.; Wootton, H.F.; Zampatti, B.P.; Thwaites, L.; Conallin, A.; Ye, Q.; Stamation, K.; Bice, C. Modelling the response of common carp (Cyprinus carpio) to natural and managed flows using a stochastic population model. Biol. Invasions 2024, 26, 1437–1456. [CrossRef]
- Duivenvoorden, L.J. Baseline Study of the Aquatic and Semi-Aquatic Flora of the Burnett River in Relation to the Proposed Walla Weir; Report for Queensland Department of Natural Resources, Resource Development Planning. Prepared by Central Queensland University: Rockhampton, Queensland, 1997;
- Kind, P.K. Movement Patterns and Habitat Use in the Queensland Lungfish Neoceratodus Forsteri (Krefft 1870). PhD, Department of Zoology and Entomology, The University of Queensland: Queensland, 2002.
- Kemp, A. Threatened fishes of the world: Neoceratodus forsteri (Kreft, 1870) (Neoceratodontidae). Environ. Biol. Fishes 1995, 43, 310–310. [CrossRef]
- Todd, C.R.; Ng, M.P. Generating unbiased correlated random survival rates for stochastic population models. Ecol. Model. 2001, 144, 1–11. [CrossRef]
- Queensland Government Water Plan (Burnett Basin) 2014 Available online: https://www.legislation.qld.gov.au/view/whole/html/inforce/current/sl-2014-0184.
- DRDMW Water Monitoring Information Portal Available online: https://water-monitoring.information.qld.gov.au/.
- 2011; Queensland Government Paradise Dam Downstream Fishway Monitoring Program; Fisheries Queensland, 2011;
- Raymond, S.M.C.; Todd, C.R.; Ryall, J. Understanding the effects of egg loss from fisher handling to improve conservation of a threatened freshwater crayfish (Euastacus armatus). Mar. Freshwater Res. 2024, 75, NULL-NULL. [CrossRef]
- McCarthy, M.A.; Thompson, C. Expected minimum population size as a measure of threat. Anim. Conserv. 2001, 4, 351–355. [CrossRef]
- Todd, C.R.; Lovelace, P.R. Essential Version 2.21. Retrieved from https://www.ari.vic.gov.au/__data/assets/file/0035/589562/Essential-Population-Modelling-Software.zip 2019.
- Todd, C.R.; Lintermans, M.; Raymond, S.M.C.; Ryall, J. Assessing the impacts of reservoir expansion using a population model for a threatened riverine fish. Ecol. Indic. 2017, 80, 204–214. [CrossRef]
- McCarthy, M.A.; Keith, D.; Tietjen, J.; Burgman, M.A.; Maunder, M.; Master, L.; Brook, B.W.; Mace, G.; Possingham, H.P.; Medellin, R.; et al. Comparing predictions of extinction risk using models and subjective judgement. Acta Oecol. 2004, 26, 67–74. [CrossRef]
- McDonald-Madden, E.; Baxter, P.W.J.; Possingham, H.P. Making robust decisions for conservation with restricted money and knowledge. J. Appl. Ecol. 2008, 45, 1630–1638. [CrossRef]
- King, J.; McFarlane, G. Marine fish life history strategies: applications to fishery management. Fish. Manage. Ecol. 2003, 10, 249–264. [CrossRef]
- Jones, P.E.; Consuegra, S.; Börger, L.; Jones, J.; Garcia de Leaniz, C. Impacts of artificial barriers on the connectivity and dispersal of vascular macrophytes in rivers: A critical review. Freshwater Biol. 2020, 65, 1165–1180.
- Heppell, S.; Limpus, C.; Crouse, D.; Frazer, N.; Crowder, L. Population model analysis for the loggerhead sea turtle, Caretta caretta, in Queensland. Wildl. Res. 1996, 23, 143–159. [CrossRef]
- Marshall, S.; McDougall, A.; Obst, S. Summary of Lungfish Confirmation Monitoring in the Burnett Basin 2019-2021; Technical Report. Department of Regional Development, Manufacturing and Water, 2024;
- Bjørkvoll, E.; Grøtan, V.; Aanes, S.; Sæther, B.-E.; Engen, S.; Aanes, R.; Solow, A.E.A.R.; Shaw, E.R.G. Stochastic population dynamics and life-history variation in marine fish species. Am. Nat. 2012, 180, 372–387. [CrossRef]
- Santangelo, G. Conservation of long-lived maring species: some hints for adopting a population approach. Arq. Ciênc. Mar 2022, 55 (especial Labomar 60 anos, 231–259.
- Avens, L.; Goshe, L.R.; Coggins, L.; Snover, M.L.; Pajuelo, M.; Bjorndal, K.A.; Bolten, A.B. Age and size at maturation- and adult-stage duration for loggerhead sea turtles in the western North Atlantic. Mar. Biol. 2015, 162, 1749–1767. [CrossRef]
- Shimada, T.; Anderson, D.; Debets, K.; Fien, L.; McLaren, M.; Robertson, K.; Gatley, C.; Limpus, C.J. Queensland Turtle Conservation Project: Data Report for Marine Turtle Breeding on the Woongarra Coast, 2022-2023 Breeding Season; Department of Environment and Science, Queensland Government: Brisbane, 2023;
- Sunwater Paradise Dam Improvement Project - New Dam Wall Available online: https://www.sunwater.com.au/projects/paradise-dam-improvement-project/new-dam-wall/.
- Congdon, J.; Dunham, A.; Sels, R. Demographics of Common Snapping Turtles (Chelydra serpentina): Implications for Conservation and Management of Long-lived Organisms. American Zoologist 1994, 34. [CrossRef]
Figure 3.
Female adult population trajectories for the each of the populations, and total female population, in the Burnett River using the modelled Water Resource Development (WRD) flow: coloured lines are individual trajectories; solid black line is the average adult population size; blue lines are ± 1 standard deviation; and the red dotted lines are the maximum and minimum values over all trajectories. population P3 (a) – the upper Burnett River, upstream of Paradise Dam; population P2 (b) – Paradise Dam; population P1 (c) – lower Burnett River, downstream of Paradise Dam; and the total population TP (d).
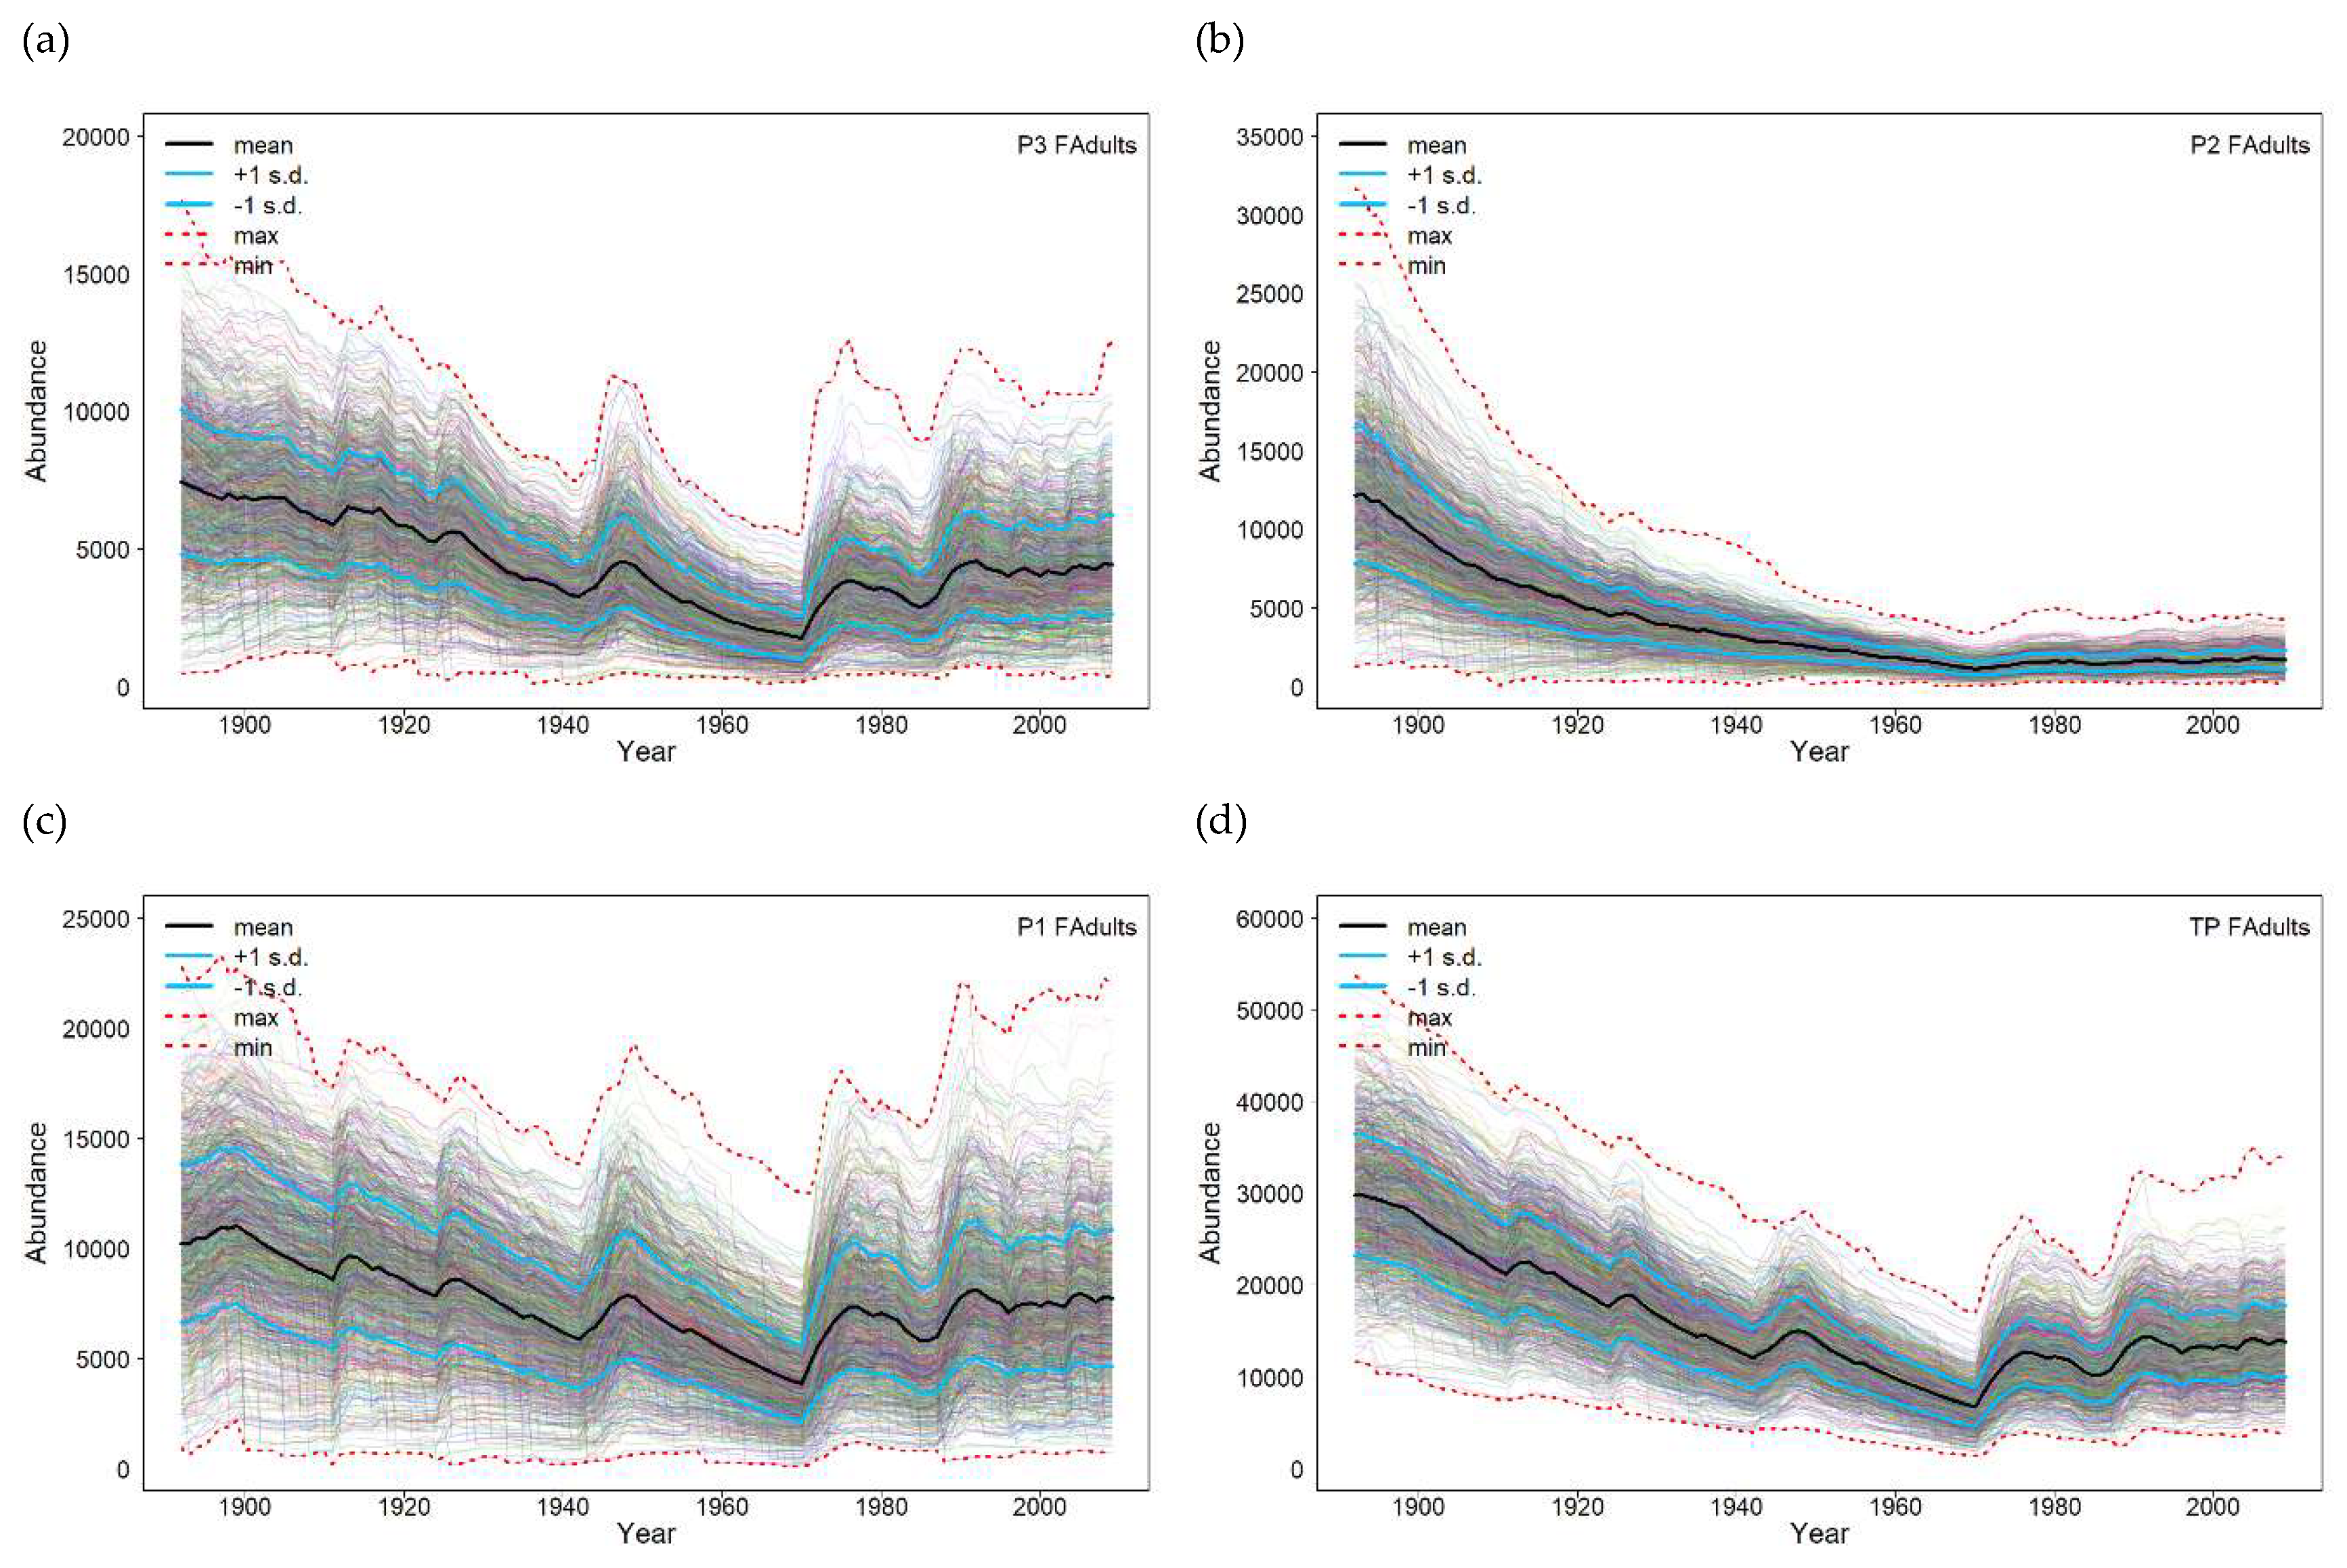
Table 2.
Quasi-extinction risk of the population falling to specified female adult thresholds for each population and two flow scenarios.
Table 2.
Quasi-extinction risk of the population falling to specified female adult thresholds for each population and two flow scenarios.
| P1 | P2 | P3 | ||||
| Threshold (Pi≤threshold) | WRD | Natural | WRD | Natural | WRD | Natural |
| 500 | 0.018 | 0.012 | 0.123 | 0.015 | 0.042 | 0.024 |
| 1000 | 0.058 | 0.042 | 0.567 | 0.046 | 0.205 | 0.115 |
| 2000 | 0.221 | 0.158 | 0.981 | 0.227 | 0.72 | 0.62 |
Disclaimer/Publisher’s Note: The statements, opinions and data contained in all publications are solely those of the individual author(s) and contributor(s) and not of MDPI and/or the editor(s). MDPI and/or the editor(s) disclaim responsibility for any injury to people or property resulting from any ideas, methods, instructions or products referred to in the content. |
© 2024 by the authors. Licensee MDPI, Basel, Switzerland. This article is an open access article distributed under the terms and conditions of the Creative Commons Attribution (CC BY) license (http://creativecommons.org/licenses/by/4.0/).
Copyright: This open access article is published under a Creative Commons CC BY 4.0 license, which permit the free download, distribution, and reuse, provided that the author and preprint are cited in any reuse.


