
Submitted:
28 November 2024
Posted:
29 November 2024
You are already at the latest version
Abstract
This paper presents a time-series point-to-point generative adversarial network (TS-p2pGAN) for synthesizing realistic electric vehicle (EV) driving data. The model accurately generates four critical operational parameters—battery state of charge (SOC), battery voltage, mechanical acceleration, and vehicle torque—as multivariate time-series data. Evaluation on 38 real-world driving trips from an open battery dataset reveals the model's exceptional accuracy in estimating SOC values, particularly under complex stop-and-restart scenarios and across diverse initial SOC levels. The model delivers high accuracy, with root mean square error (RMSE) and mean absolute error (MAE) consistently below 3% and 1.5%, respectively. Qualitative analysis using principal component analysis (PCA) and t-distributed stochastic neighbor embedding (t-SNE) demonstrates the model's ability to preserve both feature distributions and temporal dynamics of the original data. This data augmentation framework offers significant potential for advancing EV technology, digital energy management of lithium-ion batteries (LIBs), and autonomous vehicle comfort system development.
Keywords:
Conditional generative adversarial networks
; principal component analysis (PCA)
; SOC estimation
; time-series synthesis
1. Introduction
The escalating global energy demand and environmental challenges posed by climate change have intensified the search for clean energy solutions and efficient storage technologies. Lithium-ion batteries (LIBs), with their broad operating temperature range, extended cycle life, and high energy density, have emerged as a cornerstone of the green energy transition. While these batteries power diverse applications from consumer electronics to spacecraft, their role in electric vehicles (EVs) is particularly crucial. Industry and academic researchers have made significant strides in enhancing EV safety, performance, and range. The continuous advancement of EV technologies—including battery systems, autonomous capabilities, and other innovations—underscores their fundamental role in achieving a sustainable future.
State of charge (SOC) estimation is crucial for battery management systems (BMS), particularly in EV applications. Various estimation methods [1,2,3] have emerged, ranging from simple direct measurements to sophisticated algorithmic approaches. Direct measurement monitors voltage or current, offering simplicity but limited accuracy due to non-linear voltage-SOC relationships and environmental influences. Coulomb counting integrates current overtime for real-time estimation but requires accurate initial SOC to prevent drift. The open-circuit voltage (OCV) method correlates resting voltage with SOC, providing good accuracy but requiring extended rest periods and showing sensitivity to temperature and aging effects.
Advanced estimation techniques have evolved to address these limitations. Kalman filtering approaches [4], including Extended Kalman Filter (EKF) and Unscented Kalman Filter (UKF), combine measurement data with battery models for dynamic estimation, offering noise resilience but requiring precise modeling and substantial computation. Observer-based methods, including Luenberger and sliding mode approaches, provide robust performance under dynamic conditions while depending on accurate system models. Electrochemical modeling delivers unmatched accuracy through fundamental equation solving but involves complex implementation and heavy computational load.
Hybrid methods have emerged as a promising solution, combining multiple approaches such as Coulomb counting with Kalman filtering to optimize accuracy, robustness, and computational efficiency. The selection of an appropriate SOC estimation method ultimately depends on application-specific requirements. While basic applications may find simpler methods sufficient, high-performance EVs typically require advanced techniques to ensure reliable operation across diverse conditions.
Recent advances in machine learning have demonstrated significant potential for improving SOC estimation in LIBs without explicit modeling, though these approaches demand substantial computational resources despite their high accuracy with sufficient training data. The complexity and variability of real-world LIBs and EV time-series data present significant challenges for both comprehensive dataset collection and model reliability. Sarda et al. [5] highlighted critical challenges in their comprehensive review, particularly emphasizing non-linear battery behavior and evolving Battery Management System (BMS) requirements, while Obuli et al. [6] identified Gaussian Process Regression as particularly effective despite challenges with variable driving conditions. Khan et al. [7] advanced the field through innovations in deep neural networks, addressing battery behavior in dynamic environments and proposing novel approaches to architectural design and hyperparameter optimization. Selvaraj et al. [8] further enhanced this progress by implementing Bayesian methods for hyperparameter tuning, demonstrating robust SOC predictions across diverse operational conditions, including varying vehicle velocities and environmental factors.
To address real-world data limitations stemming from the high cost and time demands of data collection, researchers have increasingly turned to data augmentation techniques as a cost-effective alternative to extensive physical testing. Iglesias et al. [9] demonstrated the effectiveness of various augmentation methods, including adversarial and automatic approaches, in generating synthetic data that better represents time series patterns, building upon Wen et al.'s [10] foundational taxonomy of time-domain, frequency-domain, and advanced decomposition-based methods. Lee et al. [11] introduced Temporal Adversarial Data Augmentation (TADA), leveraging time warping to better simulate real-world variations, while Victor et al. [12] provided a comprehensive framework for data augmentation across multiple data types, demonstrating effectiveness in various machine learning tasks through detailed case studies. Domain-Adaptive Designable Data Augmentation (DADDA) [13] integrates inverse generation with domain adaptation to facilitate rapid design solutions for advanced EV systems. However, accurately modeling dynamic responses across diverse driving conditions remains a significant challenge.
Generative Adversarial Networks (GANs) have revolutionized data synthesis, enabling the creation of realistic images, audio, videos, and more [14]. These models are widely applied in fields such as cybersecurity for intrusion and anomaly detection [15], medical imaging for data augmentation and disease diagnosis [16], and healthcare for synthesizing patient time-series data [17]. GANs excel at generating synthetic data that closely resembles real-world distributions, providing scalable solutions when collecting real data is costly, hazardous, or ethically challenging [18,19]. The framework consists of two neural networks: a generator that produces synthetic data by mapping random noise to the target data distribution, and a discriminator that evaluates whether the input data is real or synthetic. These networks compete in a minimax game where the generator aims to fool the discriminator, and the discriminator seeks to distinguish real data from synthetic. This adversarial training allows GANs to model complex data distributions without explicit density estimation. Time-series GANs have demonstrated significant utility in improving energy storage predictions by integrating physical and digital systems [20]. Advanced architectures such as Progressive GANs and StyleGANs have enabled high-resolution image generation and fine-grained control over synthetic outputs [21]. Despite challenges like training instability and mode collapse [22], GANs continue to evolve, incorporating techniques like reinforcement learning and convolutional neural networks to enhance their capabilities [23]. Their ability to generate high-quality synthetic data has made GANs a cornerstone of unsupervised learning, driving innovations across various domains.
Researchers have made significant strides in generating battery time-series data to improve SOC estimation for LIBs. Wong et al. [24] combined a generative GAN (gGAN) with a SOC estimator, generating realistic battery features like voltage, current, and temperature essential for accurate SOC calculations. However, ensuring the synthetic data accurately reflects real-world conditions remains challenging, as discrepancies can impact model performance. The TS-DCGAN model [25] generates synthetic battery data to enhance SOC estimator training. While this approach addresses the scarcity of high-quality datasets, it requires significant computational resources and expertise for integration into existing frameworks. Similarly, TimeGAN [26] generates synthetic time-series data while maintaining realistic temporal dependencies and feature correlations, though generating long sequences with complex temporal relationships remains difficult.
Recent developments in GAN architecture have focused on addressing specific challenges in battery system applications. Wasserstein GAN (WGAN) [27] adapts to the sequential nature of SOC data, preserving long-term dependencies and improving the accuracy of SOC estimation models. However, synthetic data may still struggle to replicate rare or edge cases, limiting its effectiveness under variable operating conditions. Soo et al. [28] introduced a modified TimeGAN that generates virtual battery datasets to enhance model training with limited real data, though such synthetic data may not fully represent real-world scenarios. ITF-GAN [29] combines a deep autoencoder with GANs to generate synthetic data, while Zhang et al. [30] developed the TimesNet model, a deep learning framework enhanced with Gaussian noise-based data augmentation to simulate diverse operating conditions.
GANs were initially developed for generating static images. The Pix2Pix architecture [31] extended this concept to image-to-image translation tasks, such as converting sketches into photorealistic images. Building on this foundation, HR-Pix2Pix [32] advanced the framework for high-resolution image synthesis up to 1024 × 1024 pixels, with applications in cityscape generation, face editing, and interactive content creation. Despite these advances, challenges in training stability and model generalization persisted. Subsequently, Ambient-Pix2PixGAN [33] adapted the Pix2Pix framework for medical imaging, focusing on noisy or degraded inputs like low-dose CT scans and blurry MRI images. Although this approach addressed data scarcity by enhancing image quality with limited noisy-clean image pairs, models trained on synthetic data often struggled with real clinical datasets due to biases. Similarly, Li et al. [34] explored Pix2Pix for generating synthetic ground truth data across domains like medical imaging, remote sensing, and autonomous driving. While synthetic data improved dataset diversity and model training, these models faced consistent difficulties generalizing to real-world scenarios.
In the context of LIBs, voltage characteristics during charge and discharge cycles reveal distinctive plateau regions that are critical for understanding battery performance and state-of-charge (SOC) estimation. These plateaus represent electrochemical equilibrium during lithium-ion transfer between electrodes, indicating stable reaction potentials and high coulombic efficiency. However, accurately estimating SOC from voltage waveforms in real-world applications, such as electric vehicles (EVs), remains a significant challenge. Unlike controlled laboratory settings with fixed initial SOC levels and constant loads, real-world conditions involve variable initial SOCs, temperature fluctuations, unpredictable load variations, and diverse driving patterns. These factors distort voltage signals, making conventional SOC estimation methods unreliable. Many studies address simplified scenarios with constant loads or predetermined SOC levels, which work well in controlled environments but fail with diverse real-world datasets. Addressing these challenges requires advanced approaches, such as machine learning models that integrate multivariate data like battery current, temperature, trip history, and charge-discharge characteristics. By leveraging such data, these methods can provide robust and accurate SOC estimations across various driving conditions.
To adapt Pix2Pix for time-series data, we developed TS-p2pGAN, a novel framework for augmenting time-series data, specifically targeting EV and battery SOC scenarios. This model synthesizes dynamic multivariate data for real-world driving, supporting effective deep-learning training. TS-p2pGAN integrates environmental, vehicle, battery, and heating system variables, concatenating them with time-series features to generate synthetic SOC and motion data. It ensures robust temporal dependencies among variables and accommodates varying sequence lengths, offering efficient representations of complex time-series data. By training on historical time-series data, TS-p2pGAN captures temporal patterns and generates plausible future trajectories, enhancing dataset diversity and machine learning model performance, especially when real-world data collection is challenging. This capability makes TS-p2pGAN suitable for a wide range of time-series analysis and prediction tasks.
The key contributions of this study are:
- Novel Data Augmentation Framework: We introduce a GAN-based framework for synthesizing multivariate time-series data in EV driving scenarios, addressing a critical gap in synthetic data generation. This enables cost-effective, scalable, and diverse dataset creation.
- Advanced Model Architecture: TS-p2pGAN incorporates an integrated transformation network and multiscale discriminator to handle high-dimensional, extended time sequences. By redefining time-series regeneration as a data generation task, it produces high-quality synthetic data that enriches existing datasets.
- Comprehensive Evaluation: We implement a robust evaluation protocol using multiple quantitative and qualitative tools, providing in-depth insights into synthetic data quality and supporting iterative improvements in generative models.
- Real-World Validation: The model is rigorously validated using 38 real-world driving trips, demonstrating strong generalization capabilities and confirming its practical applicability in realistic driving scenarios.
The remainder of this paper is organized as follows: Section 2 introduces the dataset and provides details of the TS-p2pGAN architecture and training methodology. Section 3 covers the experimental setup, evaluation metrics, and both quantitative and qualitative results. Finally, Section 4 concludes with a summary of the findings and potential directions for future research.
2. Materials and Methods
2.1. Dataset
The study utilizes a publicly available dataset from IEEE DataPort [35] containing comprehensive measurements of high-voltage battery performance and vehicle behavior for a BMW i3 (60 Ah) EV. The dataset comprises 72 trips conducted during summer (Group A) and winter (Group B), capturing both powertrain and heating circuit data under real-world driving conditions. While the battery loads showed significant fluctuations throughout operation, auxiliary system consumption—particularly from heating and air-conditioning systems—maintained stable patterns but substantially impacted vehicle range. Due to measurement system limitations in Group A, this study focuses exclusively on Group B winter data, which provides consistent measurements across all variables.
While the original dataset includes 30 variables per trip, this study focuses on key parameters essential for the TS-p2pGAN model implementation:
- Vehicle dynamics: speed, altitude, throttle position, motor torque, and longitudinal acceleration
- Battery metrics: power battery voltage, current, temperature, actual SOC, and displayed SOC
- Climate control: heater wattage demand, air conditioner power consumption, heater voltage, and current
- Environmental conditions: ambient temperature and related parameters
The data were used to train the TS-p2pGAN model, as illustrated in Figure 1. The generator's inputs include ten features, shown in Figure 1(a). Figure 1(b) and 1(c) present the real signals and the synthetic signals generated by the model, respectively. All parameters were normalized to the range of [−1, 1].
2.2 Time-Series Synthesis with pix2pix GAN
While pix2pix GAN [31] was originally developed for image-to-image translation tasks, we have extended its framework to handle multivariate one-dimensional (1D) time series transformations. Unlike conventional GANs that generate data solely from random noise vectors, pix2pix GAN employs a conditional framework where the network learns direct mappings between input and output data pairs. This conditioning approach enables more realistic and controlled data generation, making it particularly suitable for time series translation tasks.
The proposed TS-p2pGAN model, illustrated in Figure 2, functions as a two-player adversarial game between a generator (G) and discriminator (D). The core objective is to learn a mapping function that transforms an observed time series x and a random noise vector z into a corresponding output time series y, expressed mathematically as G:{x, z} → y. The generator accepts two inputs: random noise sampled from a Gaussian distribution and conditioning information from time-series data. Through training, the generator learns to approximate the underlying probability distribution of real data and produces synthetic data samples guided by the conditioning constraints. Meanwhile, the discriminator evaluates both real and generated data samples, incorporating conditioning information in its assessment as it learns to distinguish between authentic and synthetic time series.
The conditioning mechanism provides crucial constraints for the generation process, allowing specific characteristics to be targeted in the output time series. This approach ensures that the generated data maintains meaningful relationships with the input time series while exhibiting natural variations and realistic features. By leveraging this conditional framework, TS-p2pGAN can effectively translate between different time series domains while preserving the essential characteristics and temporal dependencies of the data.
The framework is a supervised learning algorithm, with its training dataset comprising pairs of time series {(x, y)}, where x is a conditioning time series and y is a corresponding real time series. The objective function of TS-p2pGAN can be formulated as follows:
The generator G seeks to minimize this objective, and the discriminator endeavors to maximize it as expressed in (2).
The generator’s objective is to not only deceive the discriminator but also closely approximate the ground truth output in terms of the L1 distance.
The final objective is thus expressed as follows:
Noise (z) may be incorporated in accordance with the specific application and desired characteristics of the generated data; noise can introduce randomness and enhance sample diversity. However, noise is unnecessary for TS-p2pGAN because it receives both input data and conditioning information to generate output data and can learn the mapping between x and y without noise [32]. In our model, noise is introduced exclusively through dropout, which is applied to multiple generator layers during the training and testing phases. Despite the presence of dropout noise, only minor stochasticity was observed in our model.
2.2.1. Architecture of the Transformation Net Model in the Generator Framework:
The 1D generator in the TS-p2pGAN architecture builds upon the foundational image translation framework [31,32], adapting it for time-series applications. This generator performs domain-to-domain translation of temporal data sequences through three primary components: a convolutional front-end encoder (GF), a sequence of residual blocks (GR) for feature processing, and a transposed convolutional back-end decoder (GB). The detailed specifications of each component are presented in Table 1.
The front-end encoder begins with an input layer that processes batches of 256 samples, each containing 10 features. A 1D reflective padding layer (Reflect_1, padding size: 3) preserves boundary information for subsequent convolutions. The initial convolutional layer (Conv_1) employs a kernel size of 7 and stride of 1 to generate 64 features while maintaining the 256-dimensional structure. Following this, Conv_2 through Conv_5 perform progressive downsampling using kernels of size 3, stride 2, and padding 1, reducing dimensions from 128 to 16 while enriching feature representations. Each convolution incorporates BatchNorm1d for training stability and ReLU activation for nonlinear feature transformation.
The intermediate stage consists of nine residual blocks (ResnetBlock_1 to ResnetBlock_9) that preserve feature dimensionality while preventing gradient vanishing. Each block contains two Conv1d layers (kernel size: 3, stride: 1, padding: 1) with BatchNorm1d and ReLU activation functions. A skip connection bridges the input and output of each block, facilitating gradient flow and enabling efficient residual learning instead of direct input-output mapping.
The back-end decoder employs four transposed convolution layers (ConvTran_1 to ConvTran_4) to restore spatial resolution. Each layer operates with a kernel size of 3, stride of 2, and padding of 1, progressively doubling spatial dimensions while preserving detailed features. BatchNorm1d and ReLU activations follow each transposed convolution. The architecture concludes with a final convolution layer (Conv_6, kernel size: 7, no padding) that produces 4 features at 256 dimensions. A hyperbolic tangent activation function (Tanh_1) normalizes the output to the range [–1,1], completing the time-series translation process.
2.2.2. Multiscale Discriminators
The TS-p2pGAN framework incorporates a multiscale discriminator architecture to evaluate the authenticity of generated time-series data across different temporal scales. This architecture employs two parallel discriminators (D1 and D2) that process input data at different resolutions while sharing the same structural design. The system creates a two-scale time-series pyramid by downsampling the input data by a factor of 2, enabling the evaluation of both fine-grained details and broader temporal patterns. The coarse-scale discriminator operates with an expanded receptive field to ensure global consistency, while the fine-scale discriminator focuses on local detail refinement. This dual-scale approach provides comprehensive feedback to the generator for producing realistic time-series outputs.
The detailed architecture of both discriminator branches is specified in Table 2. The fine discriminator (D1) processes input data with 256 time steps and 14 features through five convolutional layers (Conv_1 to Conv_5). The initial three layers employ a kernel size of 4, stride of 2, and padding of 2, with the first layer expanding the feature dimension to 64 while reducing temporal dimensions to 129. The coarse discriminator (D2) begins with an average pooling operation (Pool1D_1, kernel size: 3, stride: 2, no padding) that downsamples the input to 128 temporal dimensions while preserving the 14 feature channels. This pooled input then passes through a parallel set of convolutional layers (Conv_6 to Conv_10) with specifications matching those of the fine discriminator branch, adjusted for the reduced input dimensions.
Both discriminator branches utilize Leaky ReLU activation (Conv1dR) after each convolutional layer, with BatchNorm1d normalization added in specific layers (Conv1dN+R). The final layer in each branch implements a sigmoid activation function, producing probability outputs suitable for cross-entropy loss calculation during training.
3. Experiments and Results
3.1. Data Preprocessing
The dataset comprises 38 trips from Group B, with measurements recorded at 100 ms intervals. A 1-second moving average filter (ten-point window) was applied to reduce noise and emphasize underlying trends. The smoothed data were then segmented into overlapping sequences of 256 consecutive samples with a stride of 1, ensuring comprehensive temporal coverage while preserving sequential relationships. All input features were normalized to the range [-1, 1], resulting in a total of 49,885 segmented sequences for analysis.
The preprocessed sequences were used to train the TS-p2pGAN model. The generator, depicted in Figure 1(a), accepts ten input features and produces four target signals: SOC, battery voltage, motor torque, and longitudinal acceleration [Figure 1(b)]. Visual analysis of the synthetic data generated by the model [Figure 1(c)] reveals a remarkable alignment with the original signals, demonstrating the TS-p2pGAN's capability to generate highly realistic and accurate time-series representations
All implementations were performed using Python and the PyTorch library. Experiments were conducted on a system equipped with an Intel Core i7-10700K CPU and an NVIDIA GeForce RTX 4090 GPU with 24GB VRAM. The Adam optimizer was employed for loss minimization, with the discriminator and generator initialized at a learning rate of 0.0006. The learning rate followed a gradual decay schedule, tapering to 0 during the final 200 epochs of the total 800-epoch training process. A batch size of 256 was used, with the dataset fully reshuffled between epochs to ensure training stability and mitigate overfitting in both networks
3.2. Quantitative and Qualitative Performance Metrics
The TS-p2pGAN model's performance was evaluated through both quantitative and qualitative metrics to assess the fidelity of synthetic time-series data. Two quantitative metrics, root mean square error (RMSE) and mean absolute error (MAE), were employed to measure the deviation between real and synthetic data.
RMSE quantifies the average magnitude of prediction errors by calculating the square root of the mean squared differences:
where n represents the number of data points, yi demotes the actual value, and represents the predicted value.
MAE measures the average absolute difference between predicted and actual values::
These metrics provide objective measures of how accurately the model reproduces the statistical properties and temporal dependencies of the original dataset.
For qualitative assessment, we visualized the generated samples using two dimensionality reduction techniques: t-distributed stochastic neighbor embedding (t-SNE) [36] and principal component analysis (PCA) [37]. While PCA identifies linear projections that maximize explained variance, t-SNE specializes in preserving both local and global topological relationships when mapping high-dimensional data to lower dimensions. The visualizations from both techniques revealed that the synthetic data distributions closely aligned with those of the real observations, suggesting successful replication of the underlying data.
3.3.1. Real and Synthetic Data
A detailed comparison between synthetic and actual waveforms for four key parameters (SOC, battery voltage, motor torque, and longitudinal acceleration) during trip 1 is presented in Figure 3. The green line indicates the deviation between synthetic and actual values, with detailed views highlighting model performance during rapid state changes across two specific time intervals: [648, 904] and [1942, 2198] in the lower left and right plots. The TS-p2pGAN model demonstrated exceptional reliability, particularly in SOC prediction, maintaining deviations within a narrow range of [-0.7, 0.1]. While the synthetic waveforms for motor torque and longitudinal acceleration closely tracked actual patterns, minor magnitude discrepancies were observed.
Figure 4 presents comparative results generated by the TimeGAN model [26] for identical parameters. TimeGAN's synthetic data exhibited notably more volatile behavior. Although it captured some fundamental parameter characteristics, the model struggled to accurately reproduce both local trends and broader temporal dynamics of the time series data. The TS-p2pGAN model consistently achieved superior accuracy across all four parameters compared to TimeGAN.
Table 3 compares the performance metrics of TS-p2pGAN and TimeGAN across 38 trips, revealing significant differences in model performance. The TS-p2pGAN model, trained on the complete Group B dataset, consistently outperformed TimeGAN, achieving RMSE values predominantly below 3% and MAE values under 1.5%. In contrast, TimeGAN faced substantial computational limitations, requiring individual training on smaller subsets of trips (trips 1-16) rather than the entire dataset, which resulted in significantly higher error rates, particularly evident in trips 4 and 9 where RMSE values exceeded 20%. While both models can generate SOC waveforms for single-trip scenarios, TimeGAN encounters significant challenges when dealing with multi-trip datasets featuring diverse driving conditions and drifting SOC values caused by varying initial SOC levels. These limitations result in higher error rates and reduced adaptability.
The performance disparity becomes most pronounced in complex scenarios with multiple start-stop conditions, as evidenced in trip 1 (Figure 3 and Figure 4) where TS-p2pGAN achieved an RMSE of 1.833% and MAE of 1.005%, substantially outperforming TimeGAN's higher error rates of 3.666% and 2.599%. While TimeGAN struggled with complex trip characteristics, TS-p2pGAN maintained remarkable consistency, keeping RMSE values below 2% even during challenging trip segments. The comprehensive metrics in Table 3 provide conclusive evidence of TS-p2pGAN's superior capabilities, demonstrating consistently lower error rates across all evaluated trips and underscoring its effectiveness in handling complex, real-world EV driving data scenarios.
Error distribution analysis across 38 trips is visualized in Figure 5 through violin plots for four key features generated by TS-p2pGAN. The plot width indicates data density, with broader sections representing higher concentrations of data points. Error margins remained predominantly within ±1% for SOC and battery voltage, while motor torque and longitudinal acceleration showed wider variations up to ±5%. Most error distributions centered around zero, suggesting balanced positive and negative deviations. However, trips 19, 29, and 35 (highlighted in red boxes) showed notable deviations from the expected bell-shaped distribution, indicating varying model accuracy across different driving scenarios.
Figure 6 presents a comprehensive comparison of synthetic data generation for trip 1, utilizing both PCA (top) and t-SNE (bottom) visualization techniques. The visualization distinguishes between real data, represented by larger red dots, and synthetic data, shown as smaller blue dots. In the PCA plots, TS-p2pGAN exhibits superior performance through tighter clustering and enhanced overlap with real data, demonstrating better preservation of global structures. While TimeGAN successfully captures overall trends, it produces more dispersed distributions, particularly around core areas, indicating less precise replication of the original data patterns.
The t-SNE visualizations in Figure 6 provide deeper insights into local structure preservation capabilities. TS-p2pGAN shows remarkable accuracy in reproducing complex curvatures and density variations, while TimeGAN displays some limitations in capturing fine-grained details, particularly in regions of high data density. Although both models exhibit broader scatter patterns in t-SNE compared to PCA visualization, TS-p2pGAN maintains denser and more coherent clustering, highlighting its superior ability to capture both global and local structural elements.
Figure 7 extends the analysis scope by examining synthetic data generation across all trips. The PCA plot (Figure 7a) reveals a distinctive diagonal distribution pattern of both real and synthetic data, ranging from -6 to 10 on PC1 and -4 to 6 on PC2. TS-p2pGAN achieves substantial overlap with real data, showing only minor scatter at the distribution edges, which suggests slight challenges in capturing extreme scenarios. The t-SNE visualization (Figure 7b) particularly showcases TS-p2pGAN's exceptional capability in replicating complex patterns. The intricate, circular, web-like structure, spanning from -150 to 150 on both axes, demonstrates remarkable alignment between real and synthetic data points.
The overall results conclusively establish TS-p2pGAN's superiority over TimeGAN in key aspects of synthetic data generation, including distribution matching, pattern preservation, and structural fidelity. This advantage is consistently maintained across both single-trip and multi-trip scenarios, underlining TS-p2pGAN's effectiveness in capturing the inherent complexities of real-world driving data. The dual visualization approach, combining PCA and t-SNE analyses, validates the model's robust capability in maintaining fidelity at both global and local structural levels, positioning TS-p2pGAN as a highly promising tool for generating high-quality synthetic driving data.
4. Conclusions
The challenge of limited access to real-world data significantly impacts machine learning applications in EV and power battery dynamics analysis, as traditional time-series data augmentation methods often struggle to maintain essential signal characteristics while expanding datasets. To address this challenge, we introduced TS-p2pGAN, a novel model designed for generating variable-length synthetic time-series data while preserving original signal properties. The model's architecture uniquely incorporates a transformation net generator for point-to-point translation, utilizing gradient flow from multiple discriminators to a single generator across various scales to effectively capture complex EV parameter influences, including SOC and motor output torque.
Our validation process, conducted using an open dataset of 38 EV driving trips with comprehensive battery condition data, demonstrated TS-p2pGAN's superior performance compared to TimeGAN in generating realistic and accurate time-series data. The model particularly excelled in preserving temporal dynamics, crucial for maintaining inter-variable relationships across time sequences. Quantitative analysis revealed impressive results, with RMSE values consistently below 3% and MAE values under 1.5% across all trips. Qualitative assessments through t-SNE and PCA visualizations further confirmed the high fidelity of generated data, while discriminative and predictive capability tests highlighted TS-p2pGAN's advantages over TimeGAN in time-series generation.
The practical implications of TS-p2pGAN extend beyond data generation, offering significant potential for enhancing SOC and motor torque estimation, ultimately contributing to EV energy consumption optimization. The model's ability to effectively leverage both spatial and temporal features surpasses traditional methods in learning complex time-series patterns while maintaining data integrity.
Despite these achievements, TS-p2pGAN's reliance on paired datasets presents a notable limitation in diverse real-world environments where such data is often scarce. Future research could enhance the model's versatility by exploring integration with unpaired learning approaches, particularly through CycleGAN architectures augmented with physics-informed constraints. While this limitation exists, the model demonstrates remarkable robustness through its ability to generate synthetic parameters that maintain consistency with both physical constraints and vehicle dynamics across various driving conditions. Ultimately, TS-p2pGAN marks a breakthrough in synthetic time-series generation for electric vehicle applications, delivering a framework that successfully balances high fidelity, practical utility, and real-world applicability.
Author Contributions
Conceptualization, S. L. Jeng; methodology, S. L. Jeng; software, S. L. Jeng; validation, S. L. Jeng; formal analysis, S. L. Jeng.; investigation, S. L. Jeng; writing—original draft preparation, S. L. Jeng; writing—review and editing, S. L. Jeng; visualization, S. L. Jeng; supervision, S. L. Jeng. All authors have read and agreed to the published version of the manuscript.
Funding
This research was funded by the National Science Council of Taiwan, R.O.C., under Contract: NSTC 113-2622-E-262-001 -
Institutional Review Board Statement
Not applicable.
Informed Consent Statement
Not applicable.
Data Availability Statement
Data available upon request.
Conflicts of Interest
The authors declare that they have no conflict of interest.
References
- Chen, Z.; He, T.; Mao, Y.; Zhu, W.; Xiong, Y.; Wang, S.; Zeng, J.; Xu, Q.; Niu, Y. State of Charge Estimation Method of Energy Storage Battery Based on Multiple Incremental Features. J. Electrochem. Soc. 2024, 171, 070522. [CrossRef]
- Zhou, W.; Zheng, Y.; Pan, Z.; Lu, Q. Review on the Battery Model and SOC Estimation Method. Processes 2021, 9, 1685. [CrossRef]
- Meng, J.; Ricco, M.; Luo, G.; Swierczynski, M.; Stroe, D.-I.; Stroe, A.-I.; Teodorescu, R. An Overview and Comparison of Online Implementable SOC Estimation Methods for Lithium-Ion Battery. IEEE Trans. Ind. Appl. 2017, 54, 1583–1591. [CrossRef]
- Yu, Q.; Xiong, R.; Lin, C. Online Estimation of State-of-charge Based on the H infinity and Unscented Kalman Filters for Lithium Ion Batteries. Energy Procedia 2017, 105, 2791–2796. [CrossRef]
- Sarda, J.; Patel, H.; Popat, Y.; Hui, K.L.; Sain, M. Review of Management System and State-of-Charge Estimation Methods for Electric Vehicles. World Electr. Veh. J. 2023, 14, 325. [CrossRef]
- D., O.P.; Babu, P.S.; V., I.; B., A.; S., V.; C., K. Enhanced SOC estimation of lithium ion batteries with RealTime data using machine learning algorithms. Sci. Rep. 2024, 14, 1–17. [CrossRef]
- Khan, U.; Kirmani, S.; Rafat, Y.; Rehman, M.U.; Alam, M.S. Improved deep learning based state of charge estimation of lithium ion battery for electrified transportation. J. Energy Storage 2024, 91. [CrossRef]
- Selvaraj, V.; Vairavasundaram, I. A Bayesian optimized machine learning approach for accurate state of charge estimation of lithium ion batteries used for electric vehicle application. J. Energy Storage 2024, 86. [CrossRef]
- Iglesias, G.; Talavera, E.; González-Prieto, .; Mozo, A.; Gómez-Canaval, S. Data Augmentation techniques in time series domain: a survey and taxonomy. Neural Comput. Appl. 2023, 35, 10123–10145. [CrossRef]
- Wen, Q.; Sun, L.; Yang, F.; Song, X.; Gao, J.; Wang, X.; Xu, H. Time Series Data Augmentation for Deep Learning: A Survey. Thirtieth International Joint Conference on Artificial Intelligence {IJCAI-21}. LOCATION OF CONFERENCE, CanadaDATE OF CONFERENCE; pp. 4653–4660.
- Lee, B. T.; Kwon, J. M.; Jo, Y. Y. TADA: Temporal Adversarial Data Augmentation for Time Series Data. arXiv 2024, arXiv:2407.15174.
- Victor, A.O.; Ali, M.I. Enhancing Time Series Data Predictions: A Survey of Augmentation Techniques and Model Performances. ACSW 2024: 2024 Australasian Computer Science Week. Australia; pp. 1–13.
- Yoo, Y.; Lee, J. Designable Data Augmentation-based Domain-adaptive Design of Electric Vehicle Considering Dynamic Responses. Int. J. Precis. Eng. Manuf. Technol. 2024, 2, 23–32. [CrossRef]
- Chakraborty, T.; S, U.R.K.; Naik, S.M.; Panja, M.; Manvitha, B. Ten years of generative adversarial nets (GANs): a survey of the state-of-the-art. Mach. Learn. Sci. Technol. 2024, 5, 011001. [CrossRef]
- Rayavarapu, S.M.; Tammineni, S.P.; Gottapu, S.R.; Singam, A. A REVIEW OF GENERATIVE ADVERSARIAL NETWORKS FOR SECURITY APPLICATIONS. Informatics, Control. Meas. Econ. Environ. Prot. 2024, 14, 66–70. [CrossRef]
- Sabnam, S.; Rajagopal, S. Application of generative adversarial networks in image, face reconstruction and medical imaging: challenges and the current progress. Comput. Methods Biomech. Biomed. Eng. Imaging Vis. 2024, 12. [CrossRef]
- He, R.Y.; Sarwal, V.; Qiu, X.; Zhuang, Y.; Zhang, L.; Liu, Y.; Chiang, J.N. Generative AI models in time varying biomedical data: a systematic review (Preprint). J. Med Internet Res. 2024. [CrossRef]
- Gui, J.; Sun, Z.; Wen, Y.; Tao, D.; Ye, J. A Review on Generative Adversarial Networks: Algorithms, Theory, and Applications. IEEE Trans. Knowl. Data Eng. 2021, 35, 3313–3332. [CrossRef]
- Brophy, E.; Wang, Z.; She, Q.; Ward, T. Generative Adversarial Networks in Time Series: A Systematic Literature Review. ACM Comput. Surv. 2023, 55, 1–31. [CrossRef]
- Pooyandeh, M.; Sohn, I. Smart Lithium-Ion Battery Monitoring in Electric Vehicles: An AI-Empowered Digital Twin Approach. Mathematics 2023, 11, 4865. [CrossRef]
- Pawar, D. R.; Yannawar, P. Advancements and Applications of Generative Adversarial Networks: A Comprehensive Review. Int. J. Res. Appl. Sci. Eng. Technol. 2024. Available online:. [CrossRef]
- Megahed, M.; Mohammed, A. A comprehensive review of generative adversarial networks: Fundamentals, applications, and challenges. WIREs Comput. Stat. 2023, 16. [CrossRef]
- Srivastava, P.; Yadav, U.; Ranjan, R.; Kumar, J.D. Emerging Trends in Generative Adversarial Networks: An Analysis of Recent Advances and Future Directions. International Conference on Cutting-Edge Developments in Engineering Technology and Science.
- Wong, K.L.; Chou, K.S.; Tse, R.; Tang, S.-K.; Pau, G. A Novel Fusion Approach Consisting of GAN and State-of-Charge Estimator for Synthetic Battery Operation Data Generation. Electronics 2023, 12, 657. [CrossRef]
- Hu, C.; Cheng, F.; Zhao, Y.; Guo, S.; Ma, L. State of charge estimation for lithium-ion batteries based on data augmentation with generative adversarial network. J. Energy Storage 2024, 80. [CrossRef]
- Juneja, T.; Bajaj, S. B.; Sethi, N. Synthetic Time Series Data Generation Using Time GAN with Synthetic and Real-Time Data Analysis. In Proceedings of the International Conference on Recent Innovations in Computing; Springer Nature: Singapore, 2022; pp. 657–667.
- Gu, X.; See, K.; Liu, Y.; Arshad, B.; Zhao, L.; Wang, Y. A time-series Wasserstein GAN method for state-of-charge estimation of lithium-ion batteries. J. Power Sources 2023, 581. [CrossRef]
- Soo, Y. Y.; Wang, Y.; Xiang, H.; Chen, Z. A Data Augmentation Method for Lithium-Ion Battery Capacity Estimation Based on Wasserstein Time Generative Adversarial Network. Energy Technol. 2024, 2400488.
- Klopries, H.; Schwung, A. ITF-GAN: Synthetic time series dataset generation and manipulation by interpretable features. Knowledge-Based Syst. 2023, 283. [CrossRef]
- Zhang, C.; Zhang, Y.; Li, Z.; Zhang, Z.; Nazir, M.S.; Peng, T. Enhancing state of charge and state of energy estimation in Lithium-ion batteries based on a TimesNet model with Gaussian data augmentation and error correction. Appl. Energy 2024, 359. [CrossRef]
- Isola, P.; Zhu, J. Y.; Zhou, T.; Efros, A. A. Image-to-Image Translation with Conditional Adversarial Networks. In Proceedings of the IEEE Conference on Computer Vision and Pattern Recognition; IEEE: 2017; pp. 1125–1134.
- Wang, T. C.; Liu, M. Y.; Zhu, J. Y.; Tao, A.; Kautz, J.; Catanzaro, B. High-Resolution Image Synthesis and Semantic Manipulation with Conditional GANs. In Proceedings of the IEEE Conference on Computer Vision and Pattern Recognition; IEEE: 2018; pp. 8798–8807.
- Chen, W.; Xu, X.; Luo, J.; Zhou, W. Ambient-Pix2PixGAN for translating medical images from noisy data. Image Perception, Observer Performance, and Technology Assessment. United States; pp. 83–89.
- Li, Z.; Guan, B.; Wei, Y.; Zhou, Y.; Zhang, J.; Xu, J. Mapping New Realities: Ground Truth Image Creation with Pix2Pix Image-to-Image Translation. arXiv 2024, arXiv:2404.19265.
- Battery and Heating Data for Real Driving Cycles. IEEE DataPort 2022. Available online: https://ieee-dataport.org/open-access/battery-and-heating-data-real-driving-cycles (accessed on 17 November 2024).
- Van der Maaten, L.; Hinton, G. Visualizing Data Using t-SNE. J. Mach. Learn. Res. 2008, 9, 2579–2605.
- Abdi, H.; Williams, L. J. Principal Component Analysis. Wiley Interdiscip. Rev. Comput. Stat. 2010, 2, 433–459.
Figure 1.
Multivariate time series illustrating the input and output data of the first strip for the TS-p2pGAN model. (a) Time-series input data comprising ten features (b) Ground truth (real) time series comprising four features (c) Synthetic time series comprising four features
Figure 1.
Multivariate time series illustrating the input and output data of the first strip for the TS-p2pGAN model. (a) Time-series input data comprising ten features (b) Ground truth (real) time series comprising four features (c) Synthetic time series comprising four features
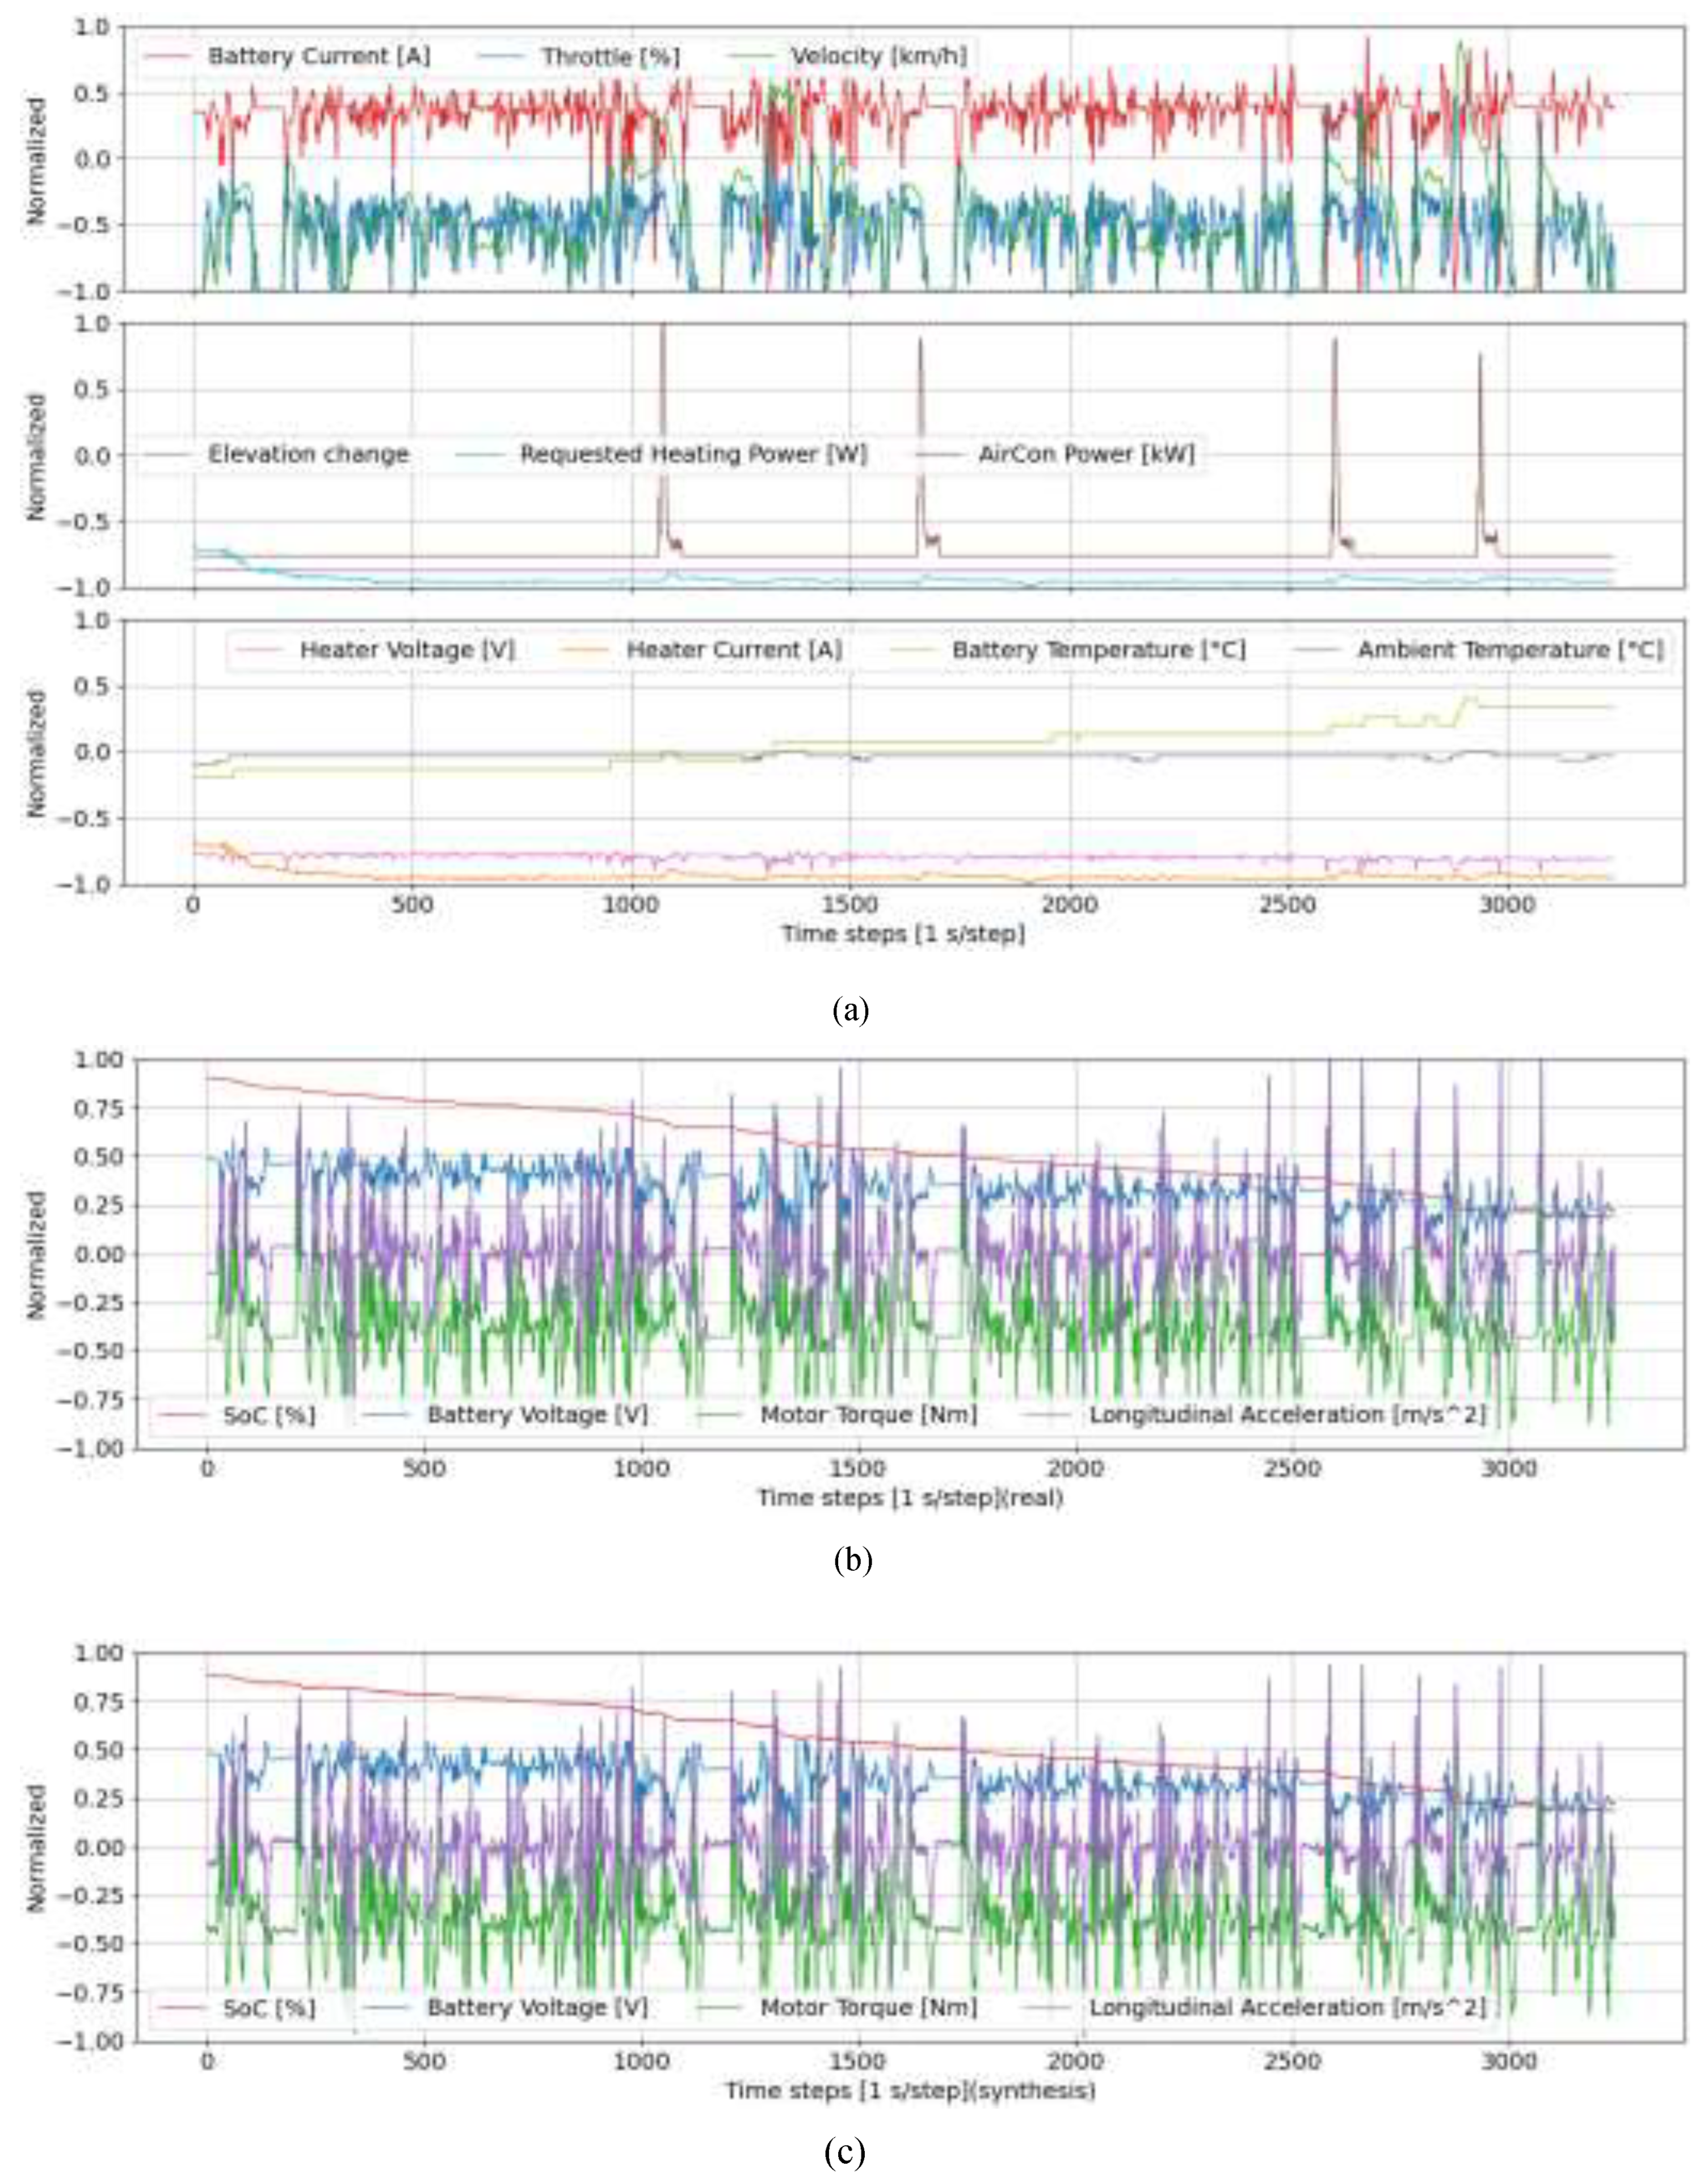
Figure 2.
Framework of TS-p2pGAN.
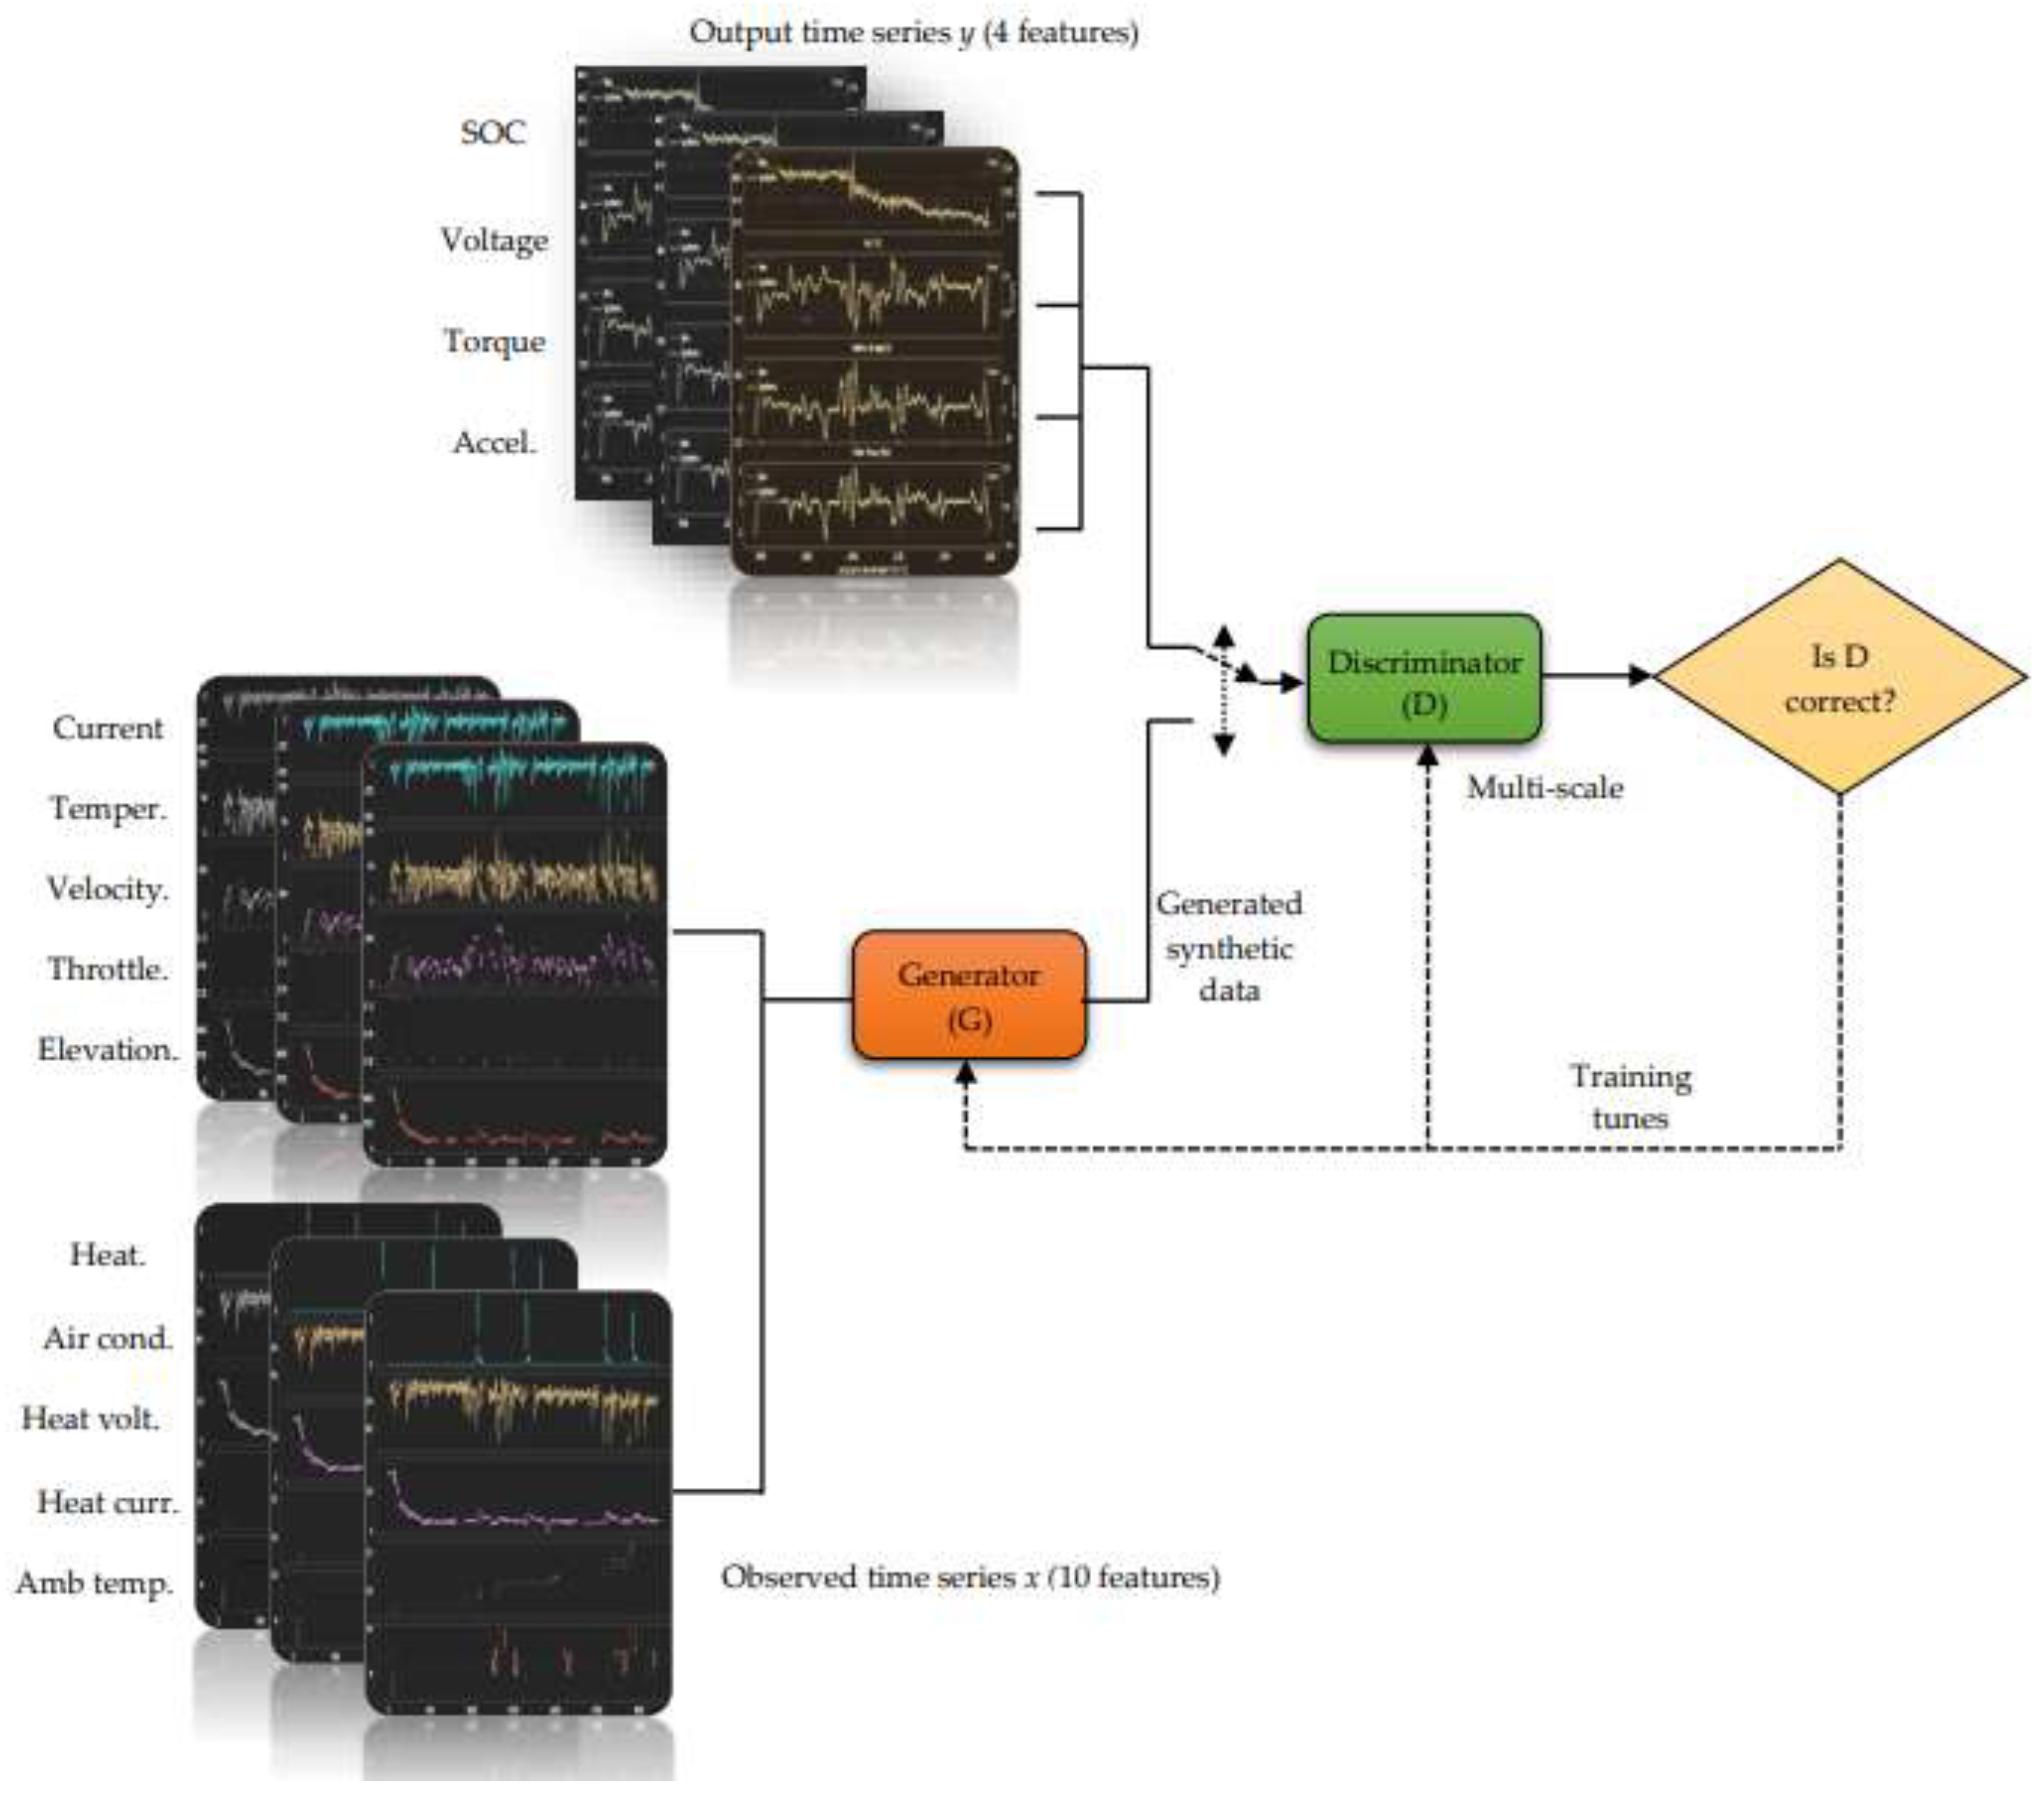
Figure 3.
Real values and synthetic data generated by TS-p2pGAN for the first trip.
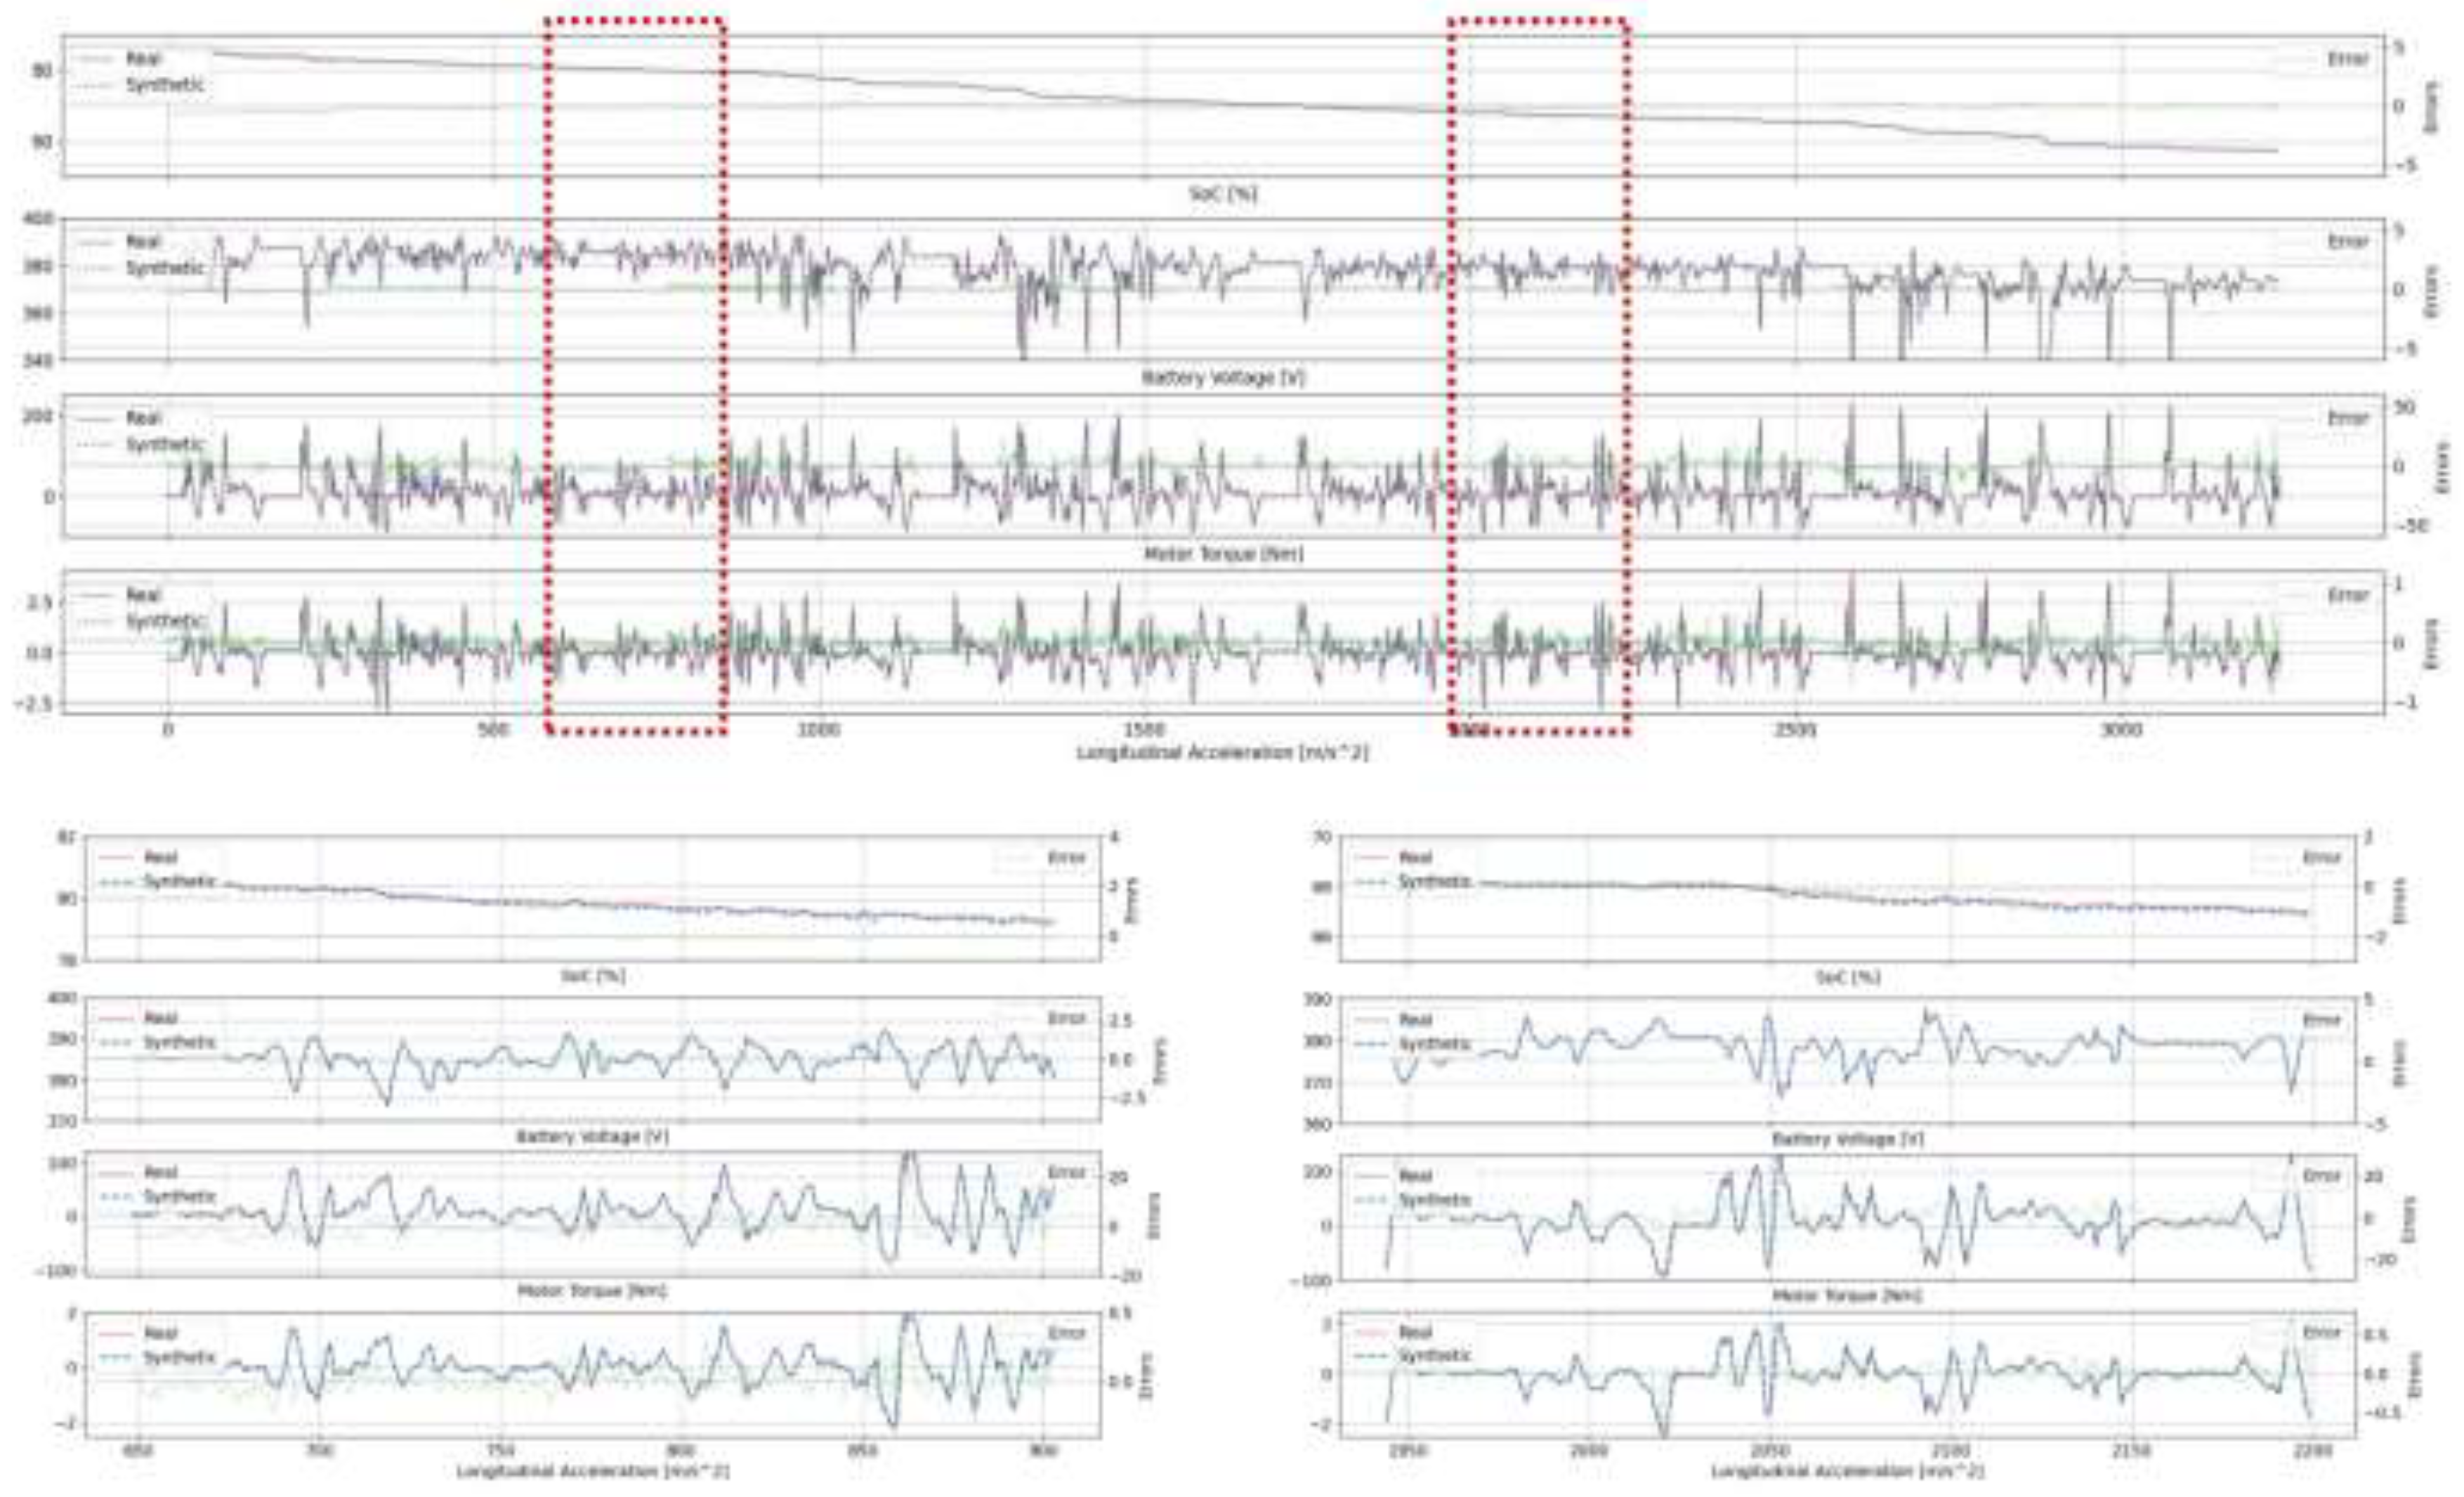
Figure 4.
Real values and synthetic data generated by the TimeGAN model [26] for the first trip.
Figure 4.
Real values and synthetic data generated by the TimeGAN model [26] for the first trip.
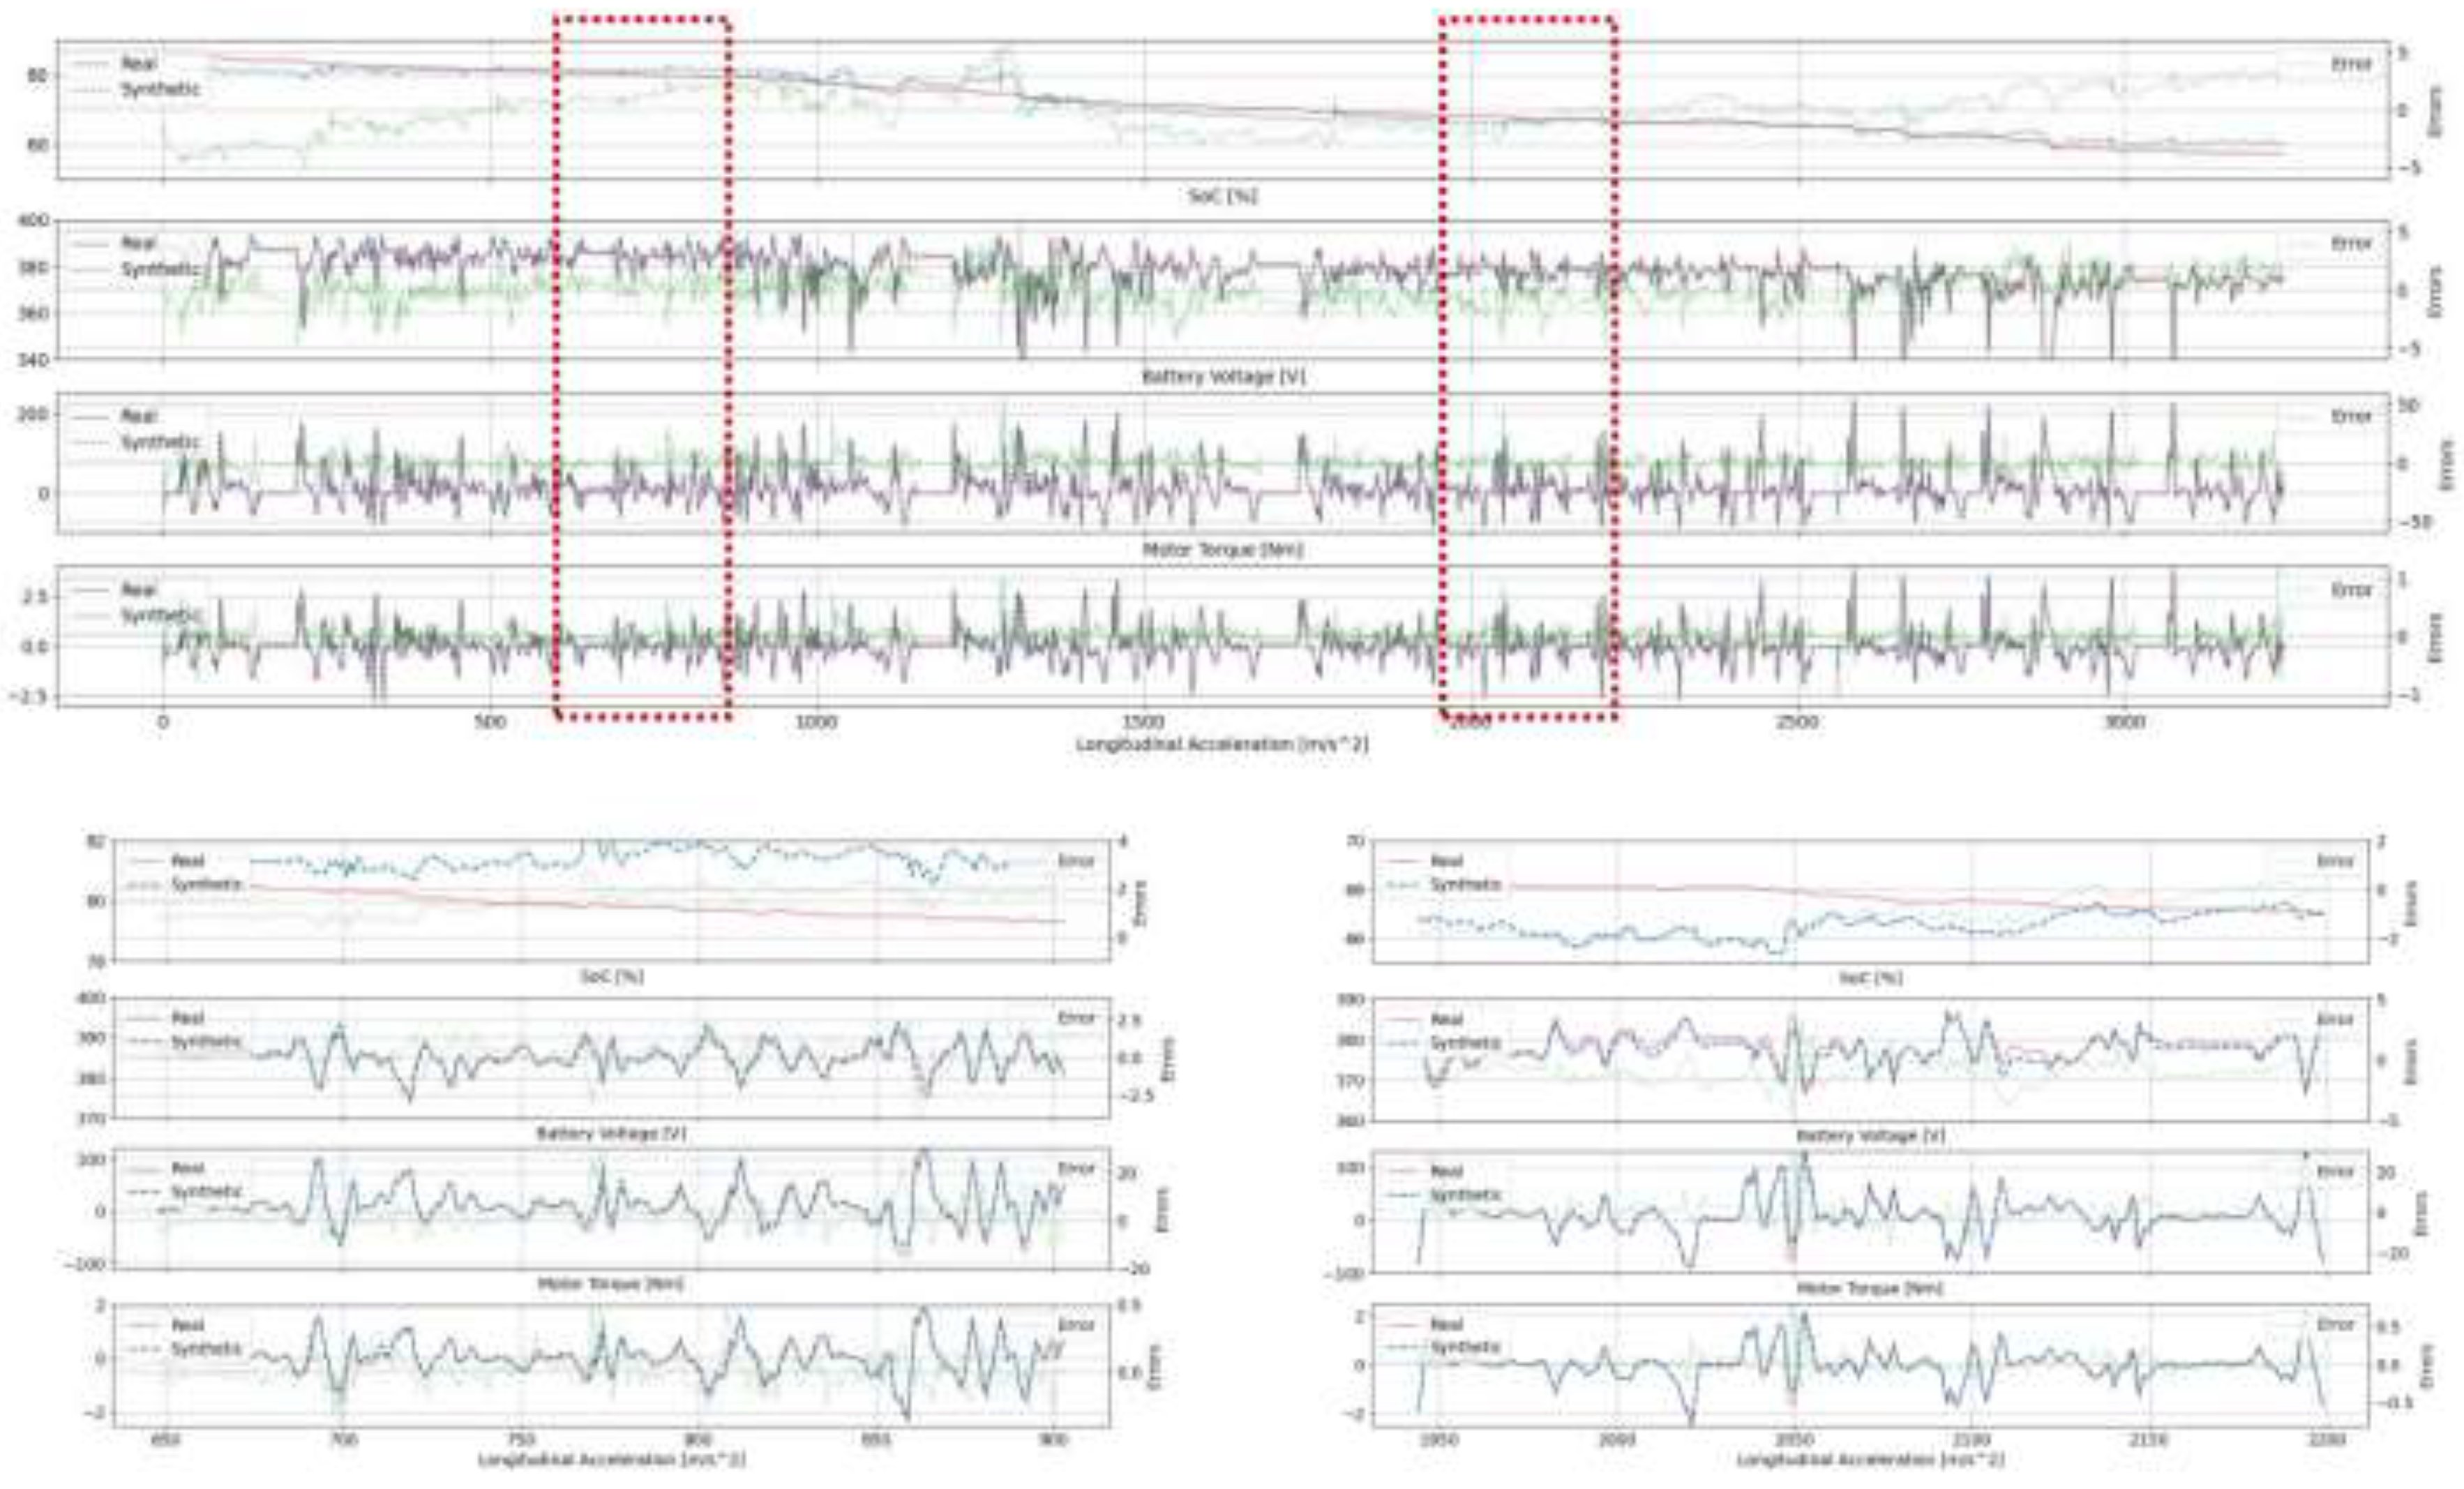
Figure 5.
Violin plots depict error distributions for four features across 38 trips.
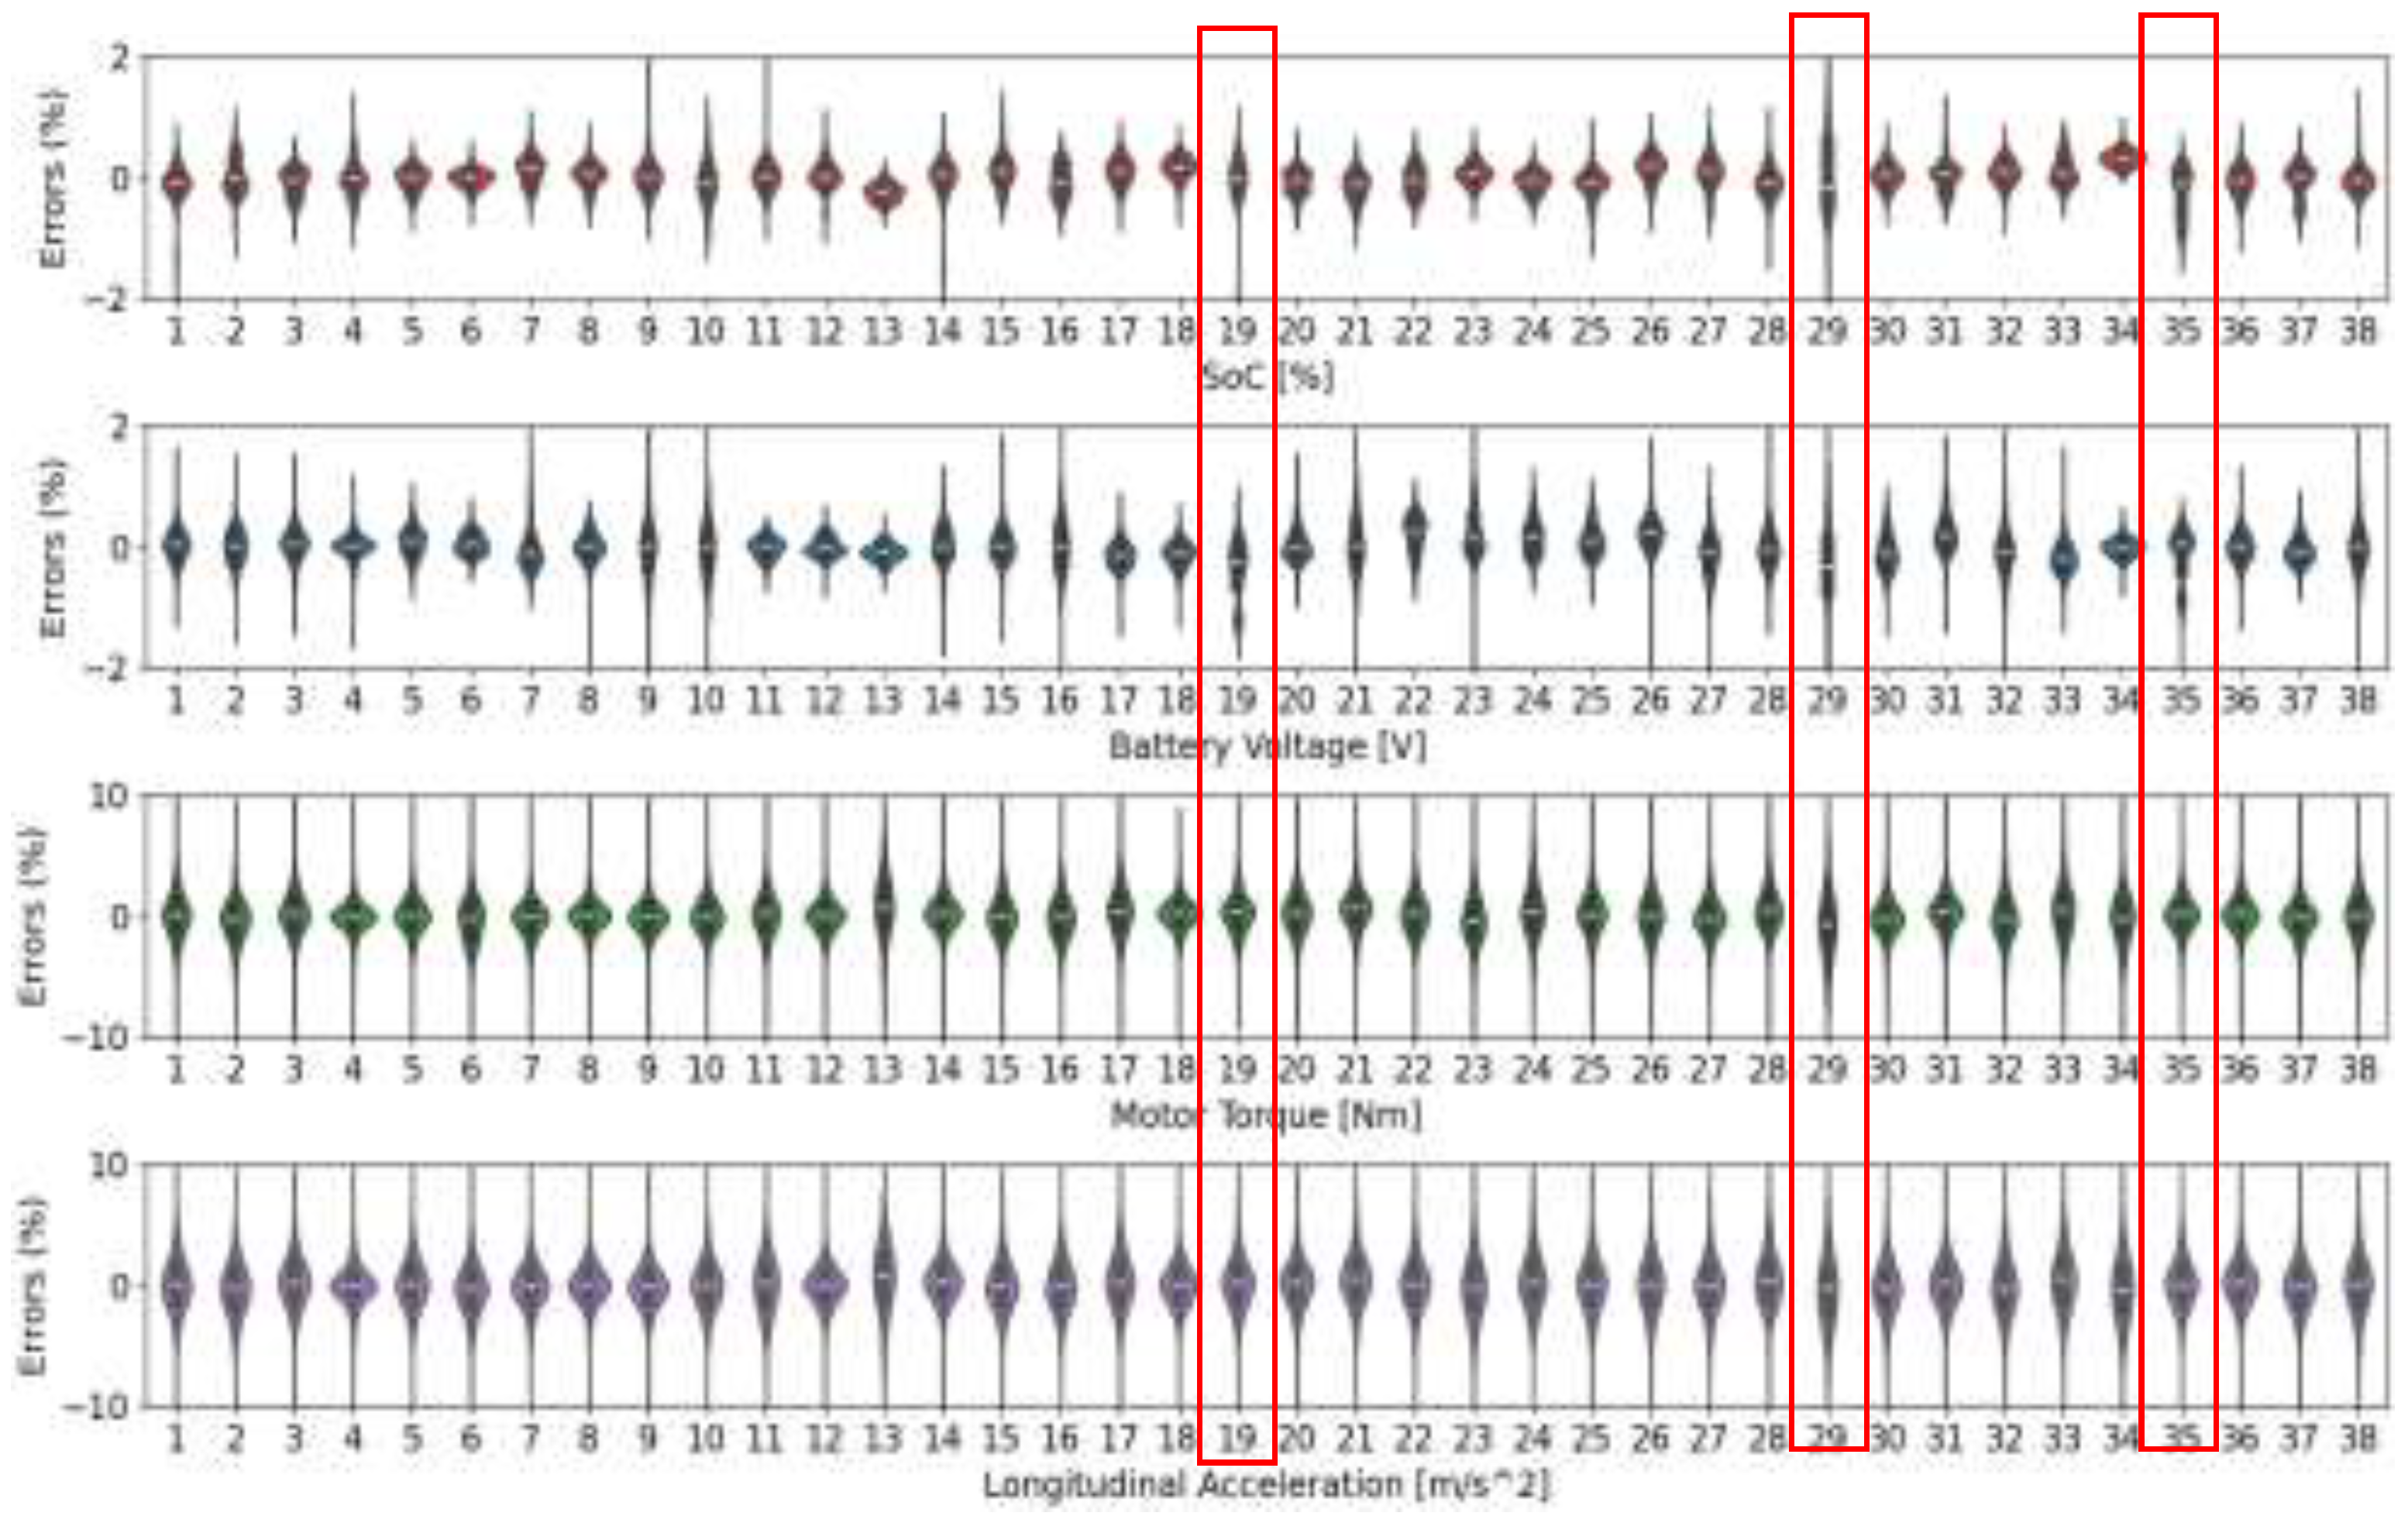
Figure 6.
Results exhibited by the TS-p2pGAN and TimeGAN models for trip 1. (a) PCA plots (b).t-SNE plots.
Figure 6.
Results exhibited by the TS-p2pGAN and TimeGAN models for trip 1. (a) PCA plots (b).t-SNE plots.
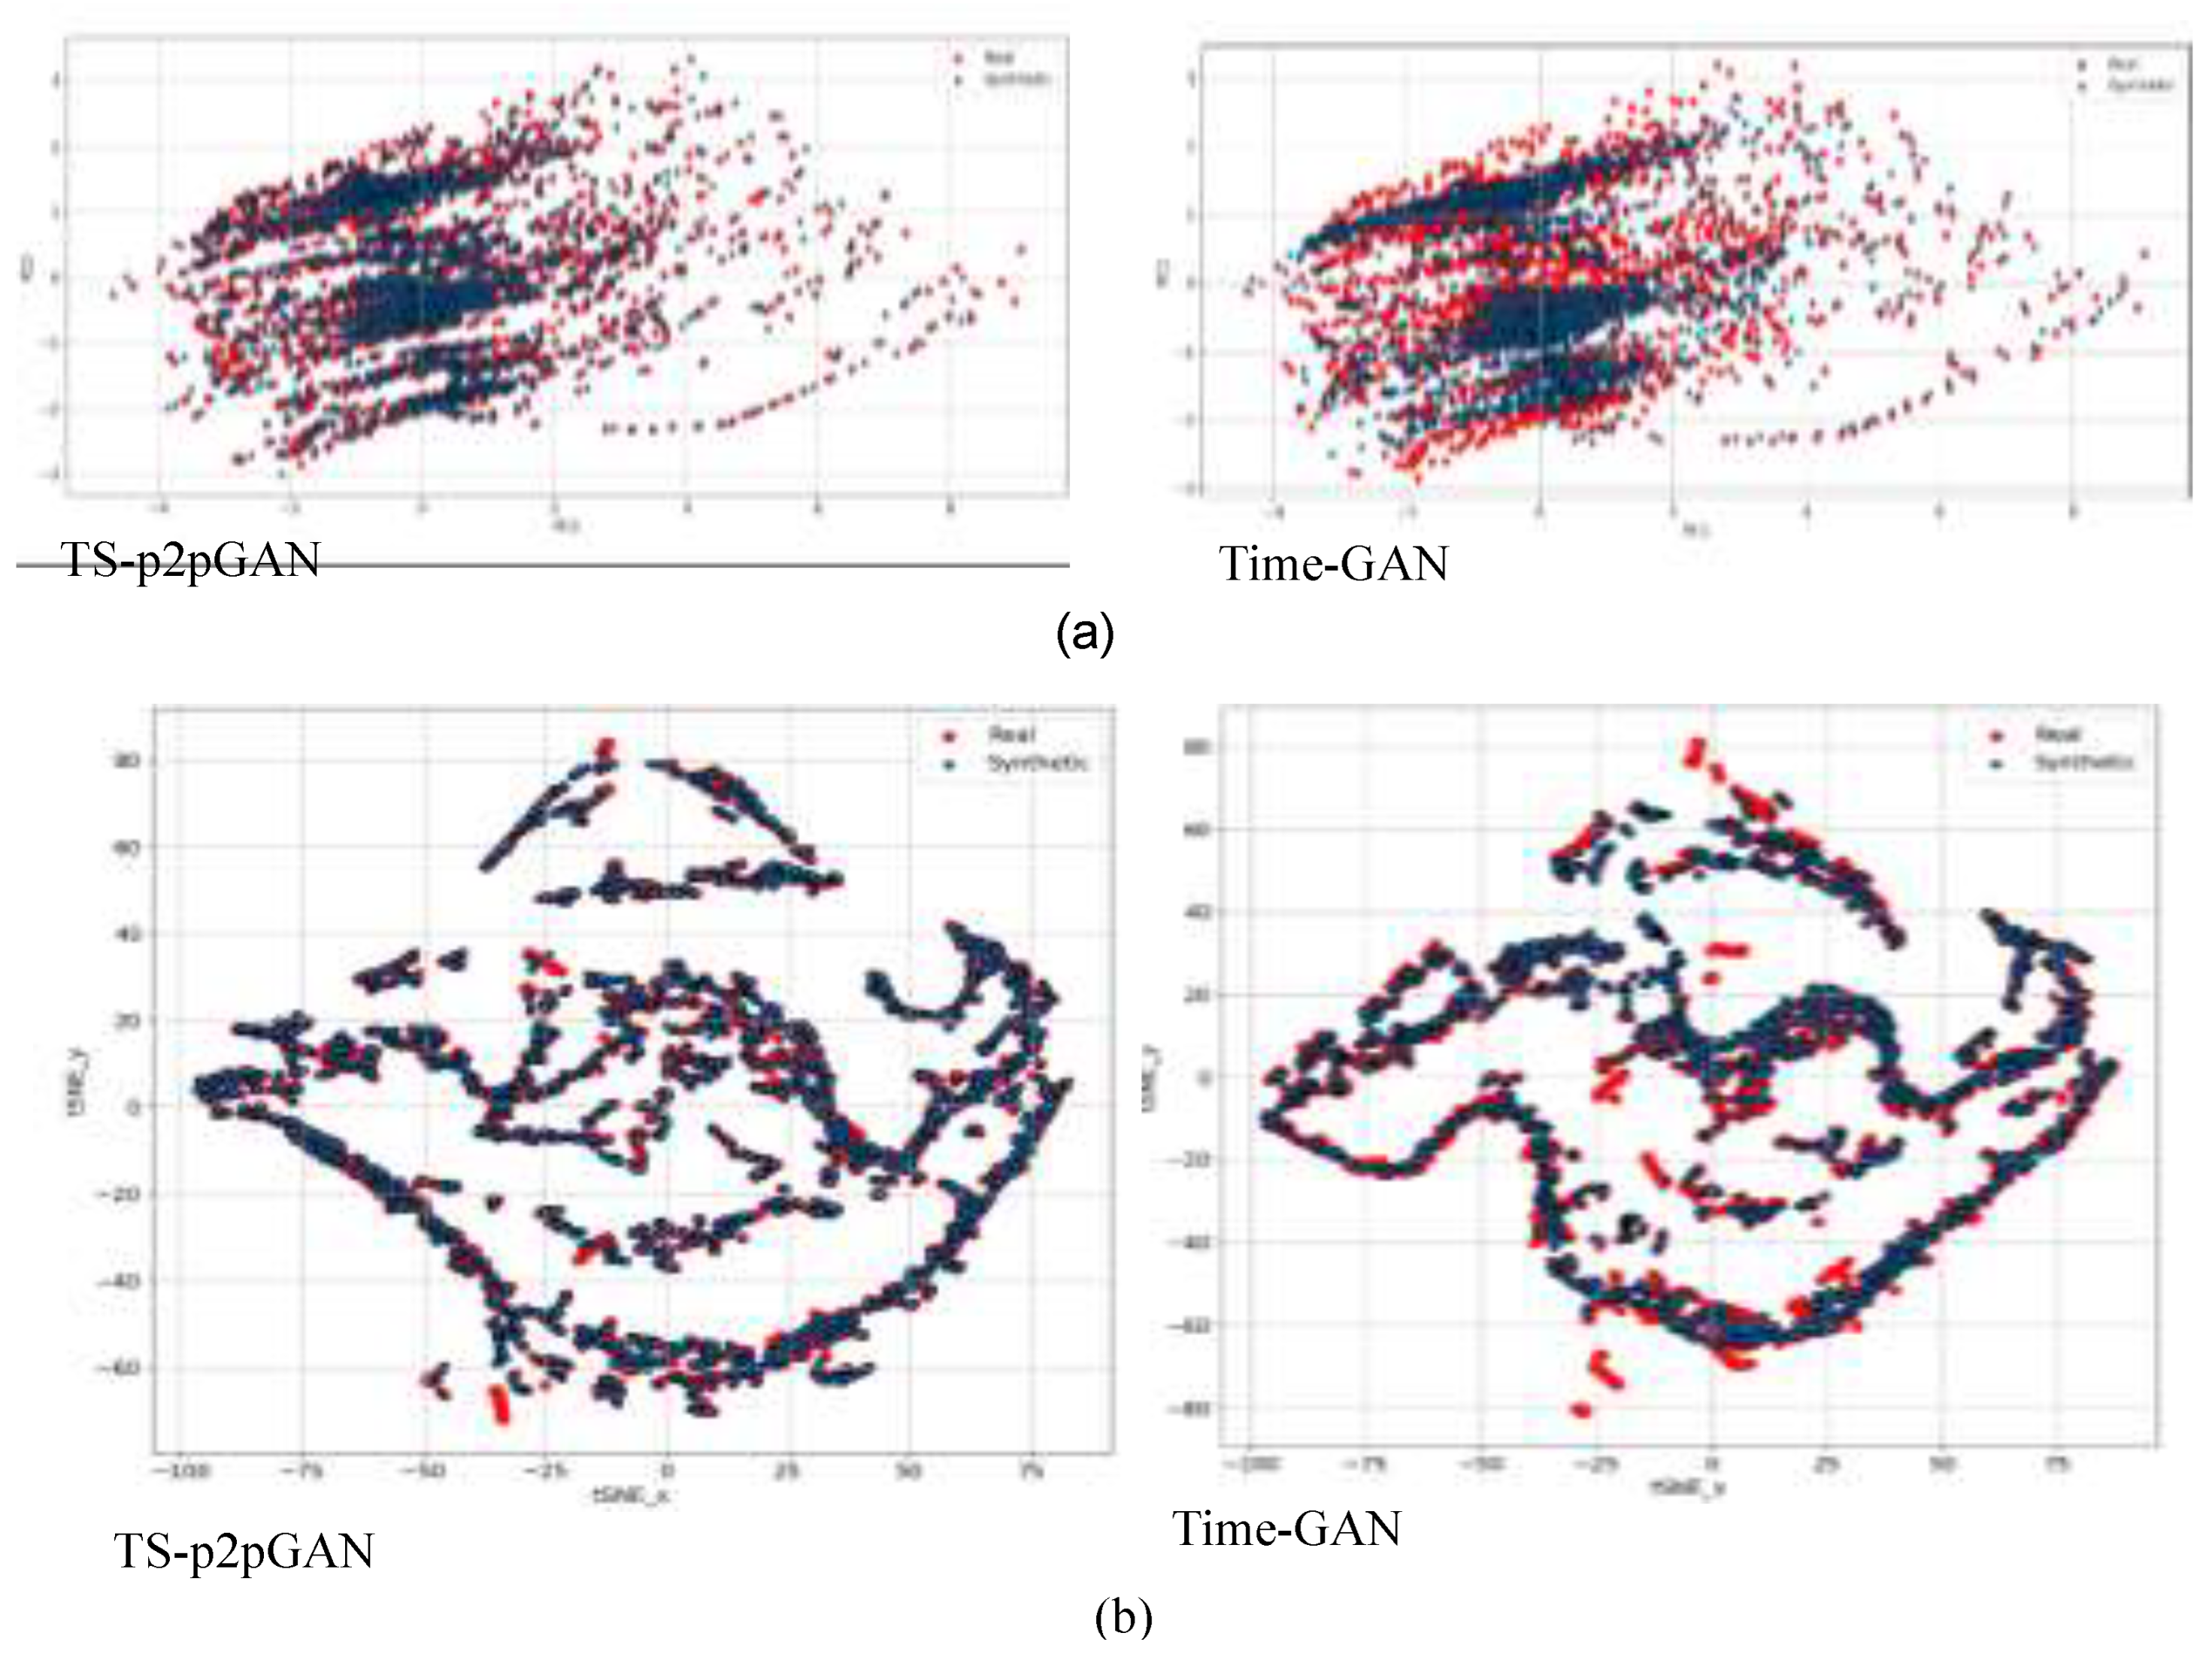
Figure 7.
Visualization results generated by TS-p2pGAN across all trips. (a) PCA plot (b) t-SNE plot.
Figure 7.
Visualization results generated by TS-p2pGAN across all trips. (a) PCA plot (b) t-SNE plot.
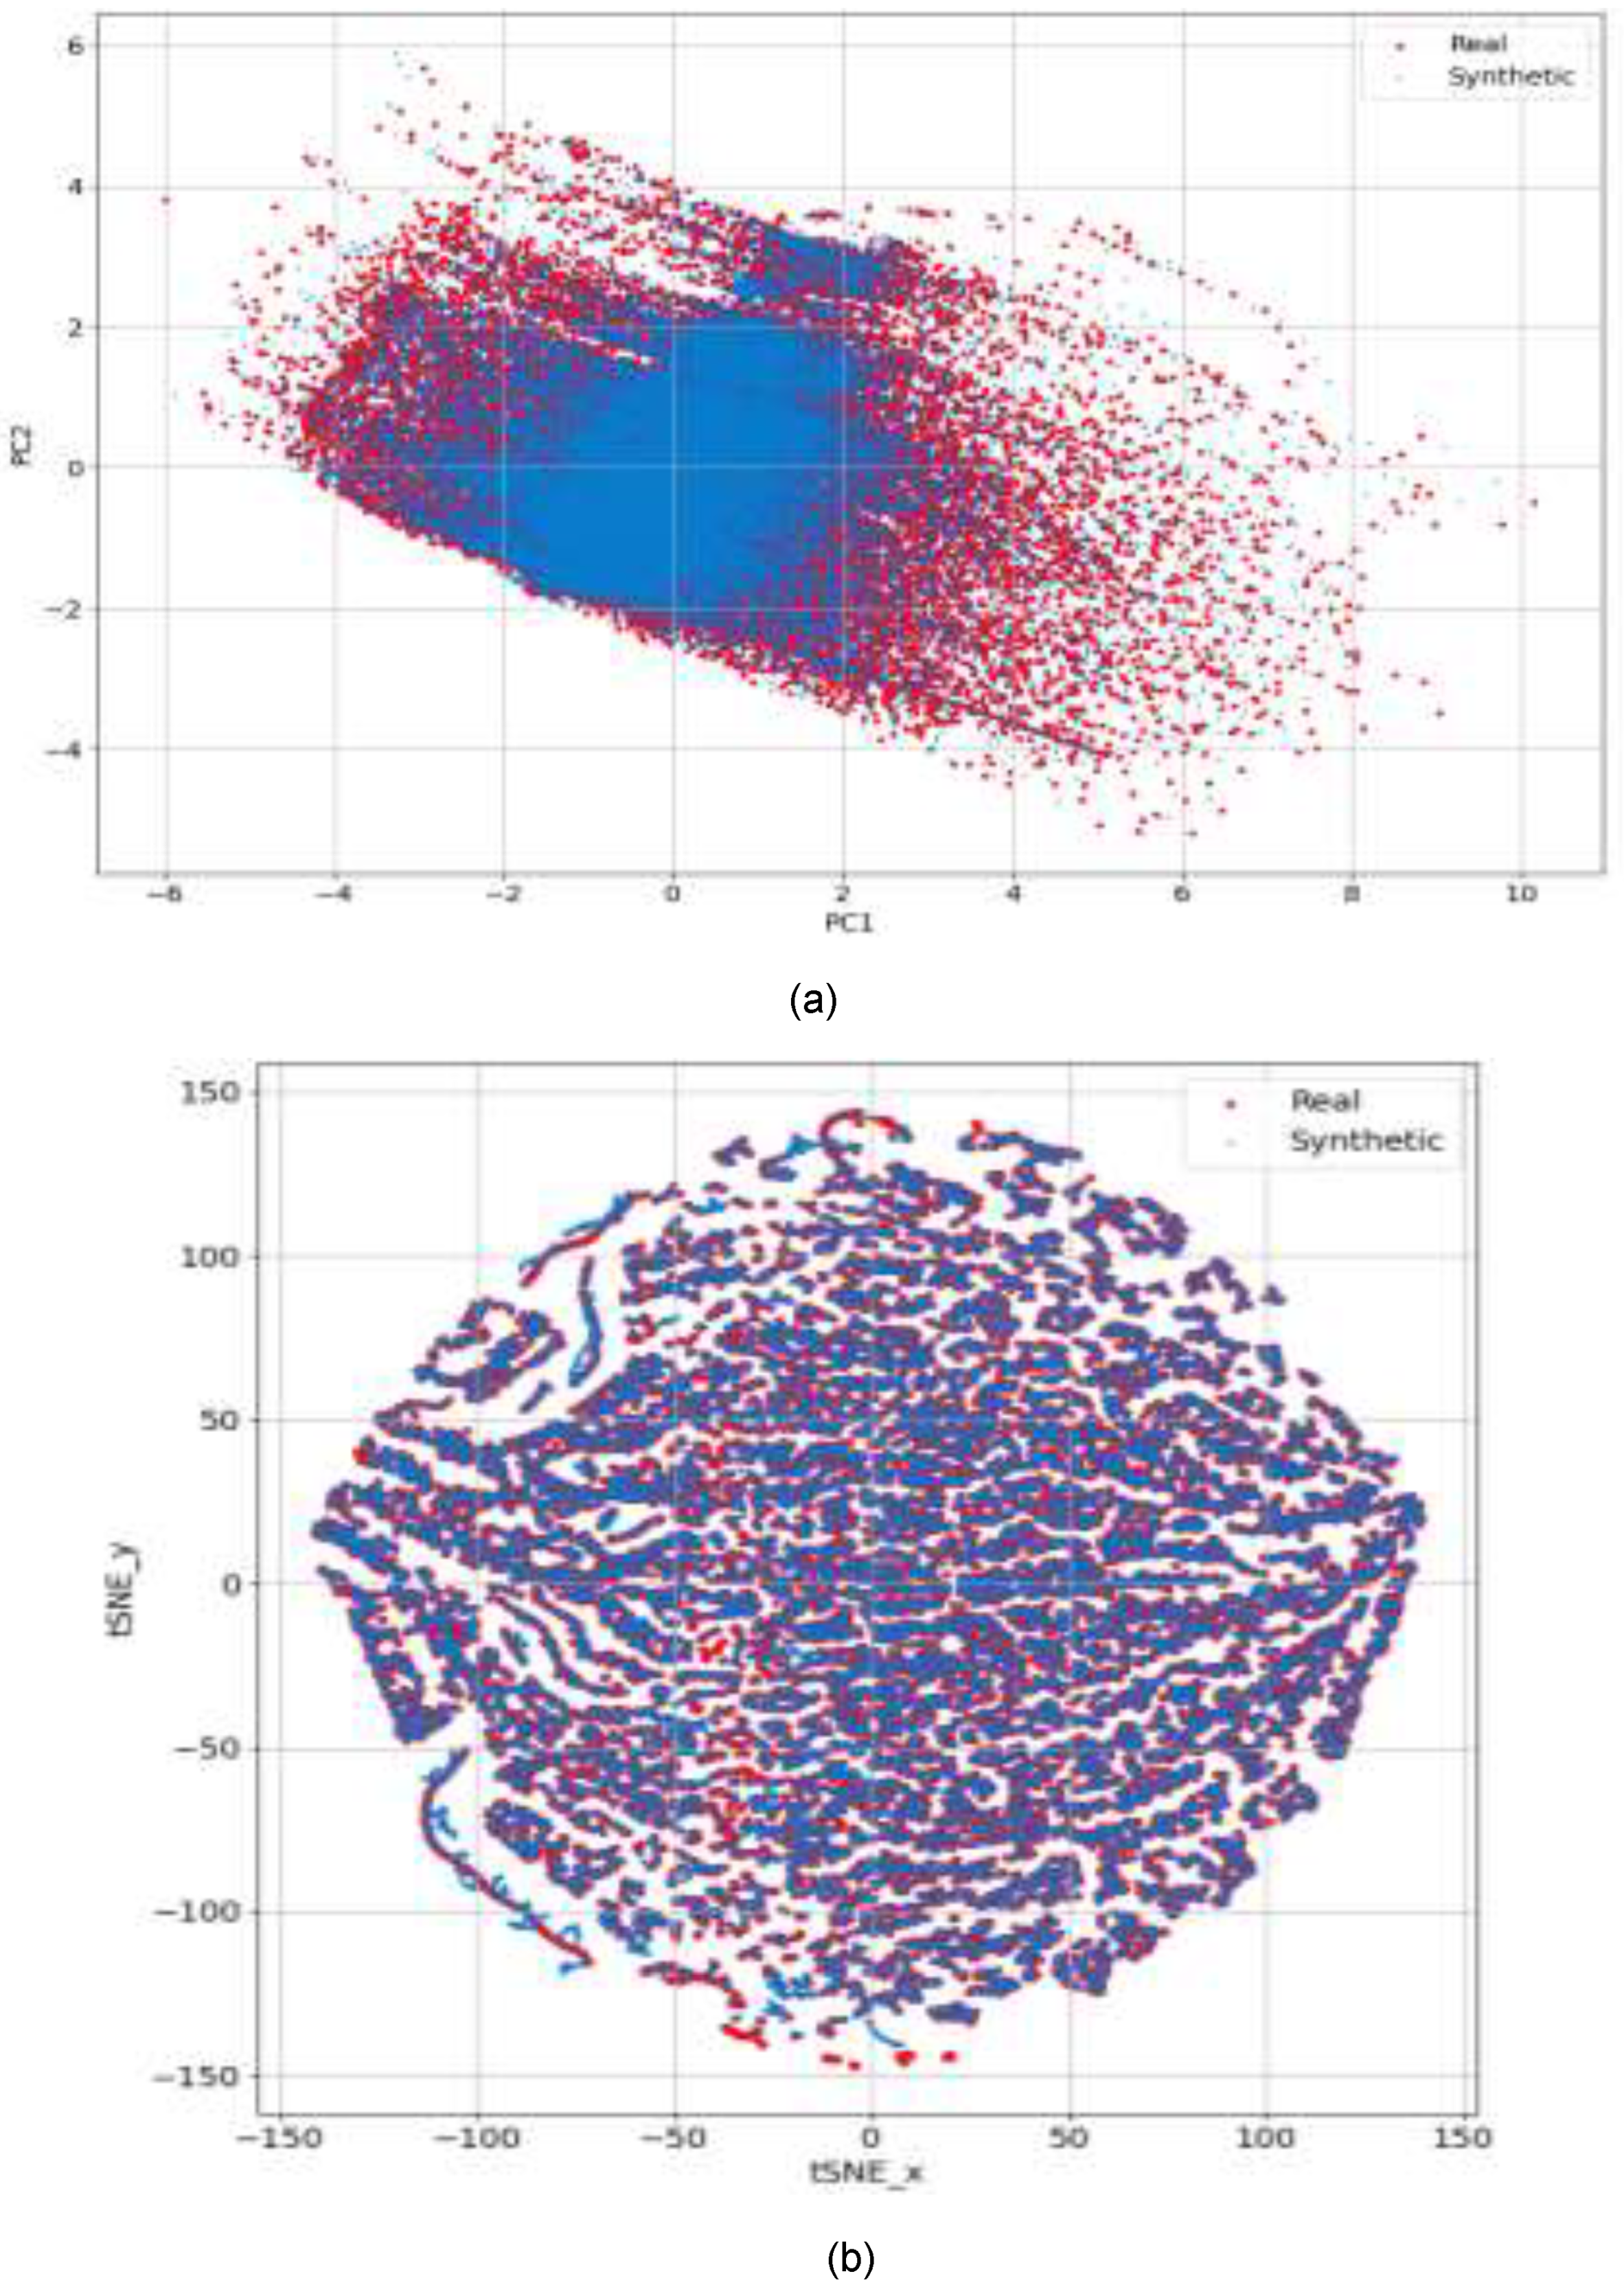

Table 1.
Hyperparameters of the multiscale generator model.
| Name | Layer | (k, s, p) | f | d | Module |
| Input | 10 | 256 | Front-end () Down-sampling operations |
||
| Reflect_1 | Pad1d | (-, -, 3) | 10 | 262 | |
| Conv_1 | Conv1dN+R | (7, 1, 0) | 64 | 256 | |
| Conv_2 | Conv1dN+R | (3, 2, 1) | 128 | 128 | |
| Conv_3 | Conv1dN+R | (3, 2, 1) | 256 | 64 | |
| Conv_4 | Conv1dN+R | (3, 2, 1) | 512 | 32 | |
| Conv_5 | Conv1dN+R | (3, 2, 1) | 1024 | 16 | |
| ResnetBlock_1 | Pad1d Conv1dN+R Pad1d Conv1dN+R |
(-, -, 1) (3, 1, 1) (-, -, 1) (3, 1, 1) |
1024 1024 1024 1024 |
16 18 16 16 |
Residual blocks () |
| ResnetBlock_2 | Pad1d Conv1dN+R Pad1d Conv1dN+R |
(-, -, 1) (3, 1, 1) (-, -, 1) (3, 1, 1) |
1024 1024 1024 1024 |
16 18 16 16 |
|
| ResnetBlock_3 | Pad1d Conv1dN+R Pad1d Conv1dN+R |
(-, -, 1) (3, 1, 1) (-, -, 1) (3, 1, 1) |
1024 1024 1024 1024 |
16 18 16 16 |
|
| ResnetBlock_4 | Pad1d Conv1dN+R Pad1d Conv1dN+R |
(-, -, 1) (3, 1, 1) (-, -, 1) (3, 1, 1) |
1024 1024 1024 1024 |
16 18 16 16 |
|
| ResnetBlock_5 | Pad1d Conv1dN+R Pad1d Conv1dN+R |
(-, -, 1) (3, 1, 1) (-, -, 1) (3, 1, 1) |
1024 1024 1024 1024 |
16 18 16 16 |
|
| ResnetBlock_6 | Pad1d Conv1dN+R Pad1d Conv1dN+R |
(-, -, 1) (3, 1, 1) (-, -, 1) (3, 1, 1) |
1024 1024 1024 1024 |
16 18 16 16 |
|
| ResnetBlock_7 | Pad1d Conv1dN+R Pad1d Conv1dN+R |
(-, -, 1) (3, 1, 1) (-, -, 1) (3, 1, 1) |
1024 1024 1024 1024 |
16 18 16 16 |
|
| ResnetBlock_8 | Pad1d Conv1dN+R Pad1d Conv1dN+R |
(-, -, 1) (3, 1, 1) (-, -, 1) (3, 1, 1) |
1024 1024 1024 1024 |
16 18 16 16 |
|
| ResnetBlock_9 | Pad1d Conv1dN+R Pad1d Conv1dN+R |
(-, -, 1) (3, 1, 1) (-, -, 1) (3, 1, 1) |
1024 1024 1024 1024 |
16 18 16 16 |
|
| ConvTran_1 | ConvTranspose1dN+R | (3, 2, 1) | 512 | 32 | Back-end (). Up-sampling operations |
| ConvTran_2 | ConvTranspose1dN+R | (3, 2, 1) | 256 | 64 | |
| ConvTran_3 | ConvTranspose1dN+R | (3, 2, 1) | 128 | 128 | |
| ConvTran_4 | ConvTranspose1dN+R | (3, 2, 1) | 64 | 256 | |
| Reflect_2 | Pad1D | (-, -, 3) | 64 | 262 | |
| Conv_6 | Conv1D | (7, 1, 0) | 4 | 256 | |
| Tanh_1 | Tanh | 4 | 256 |
Note: k: kernel, s; stride, p: padding, f: feature, d: dimension; Conv1dN+R: Conv1d + BatchNorm1d + ReLU; ConvTranspose1dN+R: ConvTranspose1d + BatchNorm1d + ReLU.
Table 2.
Hyperparameters of the multiscale discriminator model.
| Name | Layer | (k, s, p) | f | d | Scale |
| Input | 14 | 256 | scale 1 | ||
| Conv_1 | Conv1dR | (4, 2, 2) | 64 | 129 | |
| Conv_2 | Conv1dN+R | (4, 2, 2) | 128 | 65 | |
| Conv_3 | Conv1dN+R | (4, 2, 2) | 256 | 33 | |
| Conv_4 | Conv1dN+R | (4, 1, 2) | 512 | 34 | |
| Conv_5 | Conv1d | (4, 1, 2) | 1 | 35 | |
| Sigmoid_1 | Sigmoid | 1 | 35 | ||
| Input | 14 | 256 | scale 2 | ||
| Pool1D_1 | AvgPool1D | (3, 2, 1) | 14 | 128 | |
| Conv_6 | Conv1dR | (4, 2, 2) | 64 | 65 | |
| Conv_7 | Conv1dN+R | (4, 2, 2) | 128 | 33 | |
| Conv_8 | Conv1dN+R | (4, 2, 2) | 256 | 17 | |
| Conv_9 | Conv1dN+R | (4, 1, 2) | 512 | 18 | |
| Conv_10 | Conv1d | (4, 1, 2) | 1 | 19 | |
| Sigmoid_2 | Sigmoid | 1 | 35 |
Note: k: kernel, s; stride, p: padding, f: feature, d: dimension; Conv1dR: Conv1d + Leaky ReLU; Conv1dN+R: Conv1d + BatchNorm1d + Leaky ReLU.
Table 3.
RMSE and MAE values for trips 1–38.
| Trip no | RMSE(%) | MAE (%) | Trip no | RMSE(%) | MAE (%) |
| 1 | 1.833 (3.666) | 1.005 (2.599) | 2 | 1.792 (3.942) | 0.980 (2.813) |
| 3 | 1.584 (5.353) | 0.899 (3.827) | 4 | 1.903 (31.478) | 0.783 (18.560) |
| 5 | 1.931 (7.450) | 0.863 (5.339) | 6 | 1.664 (7.935) | 0.905 (5.798) |
| 7 | 1.591 (4.788) | 0.845 (3.444) | 8 | 1.330 (5.812) | 0.699 (4.099) |
| 9 | 1.603 (25.776) | 0.821 (15.632) | 10 | 1.887 (6.890) | 0.979 (5.181) |
| 11 | 2.775 (7.943) | 1.085 (6.119) | 12 | 1.277 (11.272) | 0.696 (8.178) |
| 13 | 2.715 (6.361) | 1.411 (3.888) | 14 | 1.439 (6.962) | 0.808 (4.947) |
| 15 | 1.688 (7.298) | 0.933 (5.006) | 16 | 1.764 (6.756) | 0.987 (4.982) |
| 17 | 1.980 | 1.050 | 18 | 1.449 | 0.749 |
| 19 | 1.828 | 1.063 | 20 | 1.825 | 0.918 |
| 21 | 1.819 | 1.019 | 22 | 2.069 | 1.035 |
| 23 | 2.544 | 1.223 | 24 | 2.131 | 1.133 |
| 25 | 2.076 | 1.020 | 26 | 2.965 | 1.235 |
| 27 | 1.895 | 1.008 | 28 | 2.100 | 1.118 |
| 29 | 3.183 | 1.739 | 30 | 2.300 | 1.023 |
| 31 | 1.789 | 0.887 | 32 | 2.394 | 1.185 |
| 33 | 2.177 | 1.184 | 34 | 2.910 | 1.241 |
| 35 | 1.944 | 0.977 | 36 | 1.744 | 0.841 |
| 37 | 1.609 | 0.851 | 38 | 2.256 | 1.091 |
Note: Data within parentheses were generated by TimeGAN; all other data were produced by TS-p2pGAN.
Disclaimer/Publisher’s Note: The statements, opinions and data contained in all publications are solely those of the individual author(s) and contributor(s) and not of MDPI and/or the editor(s). MDPI and/or the editor(s) disclaim responsibility for any injury to people or property resulting from any ideas, methods, instructions or products referred to in the content. |
© 2024 by the authors. Licensee MDPI, Basel, Switzerland. This article is an open access article distributed under the terms and conditions of the Creative Commons Attribution (CC BY) license (http://creativecommons.org/licenses/by/4.0/).
Copyright: This open access article is published under a Creative Commons CC BY 4.0 license, which permit the free download, distribution, and reuse, provided that the author and preprint are cited in any reuse.


