
Submitted:
28 November 2024
Posted:
29 November 2024
You are already at the latest version
Abstract
This paper explores the intricate relationship between environmental management and decarbonization, demonstrating how these two areas can be effectively integrated to produce a wide-ranging framework for sustainability. The paper discusses the environmental management and decarbonization nexus towards sustainable futures in the energy sector through the conversion to green technologies, energy efficiency, and carbon capture, storage and utilization (CCSU) innovative technologies and infrastructures. In doing so circular economy principles, low GHGs emissions production processes, and CCSU strategies are emphasized. The outcomes of the paper include identifying actionable steps and policy recommendations that support environmental management and decarbonization nexus in the energy sector. By illustrating the benefits of this nexus, the paper provides insights into how governments, industries, and communities can collaborate to implement decarbonization measures that not only reduce GHGs emissions but also support environmental sustainability and social welfare.
Keywords:
Green energy technologies
; energy efficiency
; sustainable infrastructure
; circular economy
; technological innovations
; social equity
; public policy
; sustainable management
1. Introduction
The global shift towards a low-greenhouse gases (GHGs) emissions economy has put decarbonization at the forefront of environmental management strategies. Decarbonization, the process of reducing carbon dioxide (CO₂) emissions, encompasses a broad spectrum of initiatives aimed at mitigating the adverse impacts of climate change. As the international community increasingly embraces the UN sustainable development goals (UN SDGs), the intersection of environmental management and decarbonization presents a critical nexus to address problems associated with climate change, resource depletion, and ecosystem degradation. The environmental management and decarbonization nexus underscore the interconnectedness between reducing carbon footprints (CFP) and safeguarding natural ecosystems, human health and economic stability.
The global drive to fight climate change has positioned decarbonization— reducing GHGs emissions— at the heart of sustainability strategies. To highlight the scale of the problem, the total carbon dioxide (CO2) emissions as well as emissions per capita in various countries and regions from different worldwide locations (i.e., the US, Latin America and the Caribbean (LAC), European Union (EU), Africa, Middle East, Eurasia (the Caspian region and the Russian Federation), China, India, Japan and Korea, and Southeast Asia) are shown in Figure 1 (data from IEA, 2024a). The figure indicates that China is the largest worldwide emitter; whilst Africa and LAC have the lowest CO2 emissions intensities. In view of CO2 emission per capita, the US is the highest and Africa is the lowest. With these CO2 emissions, quality of air became a major problem considering: (i) each year more than 4.5 million babies are lost worldwide due to outdoor air pollution (Mohamed et al., 2021a); and (ii) nearly 3 million premature deaths due to indoor air pollution (Mohamed et al., 2021b; Paleologos et al., 2021; IEA, 2024a).
The intersection of environmental management and decarbonization, referred to as the decarbonization nexus, offers a comprehensive approach to mitigating the adverse effects of climate change while promoting ecological preservation and sustainable development. This nexus highlights the need to balance carbon reduction initiatives with the broader goals of resource conservation, biodiversity protection, and long-term economic resilience. Environmental management provides a structured approach to overseeing the sustainable use of natural resources, ensuring that economic activities align with environmental conservation goals (Mohamed and Paleologos, 2018; Roque et al., 2022; Mohamed et al., 2024a; Paleologos et al., 2024a&b). For example, using renewable technologies, such as wind and solar PV, to replace traditional thermal energy would result in hefty decrease in water consumption in energy sector, which stands at about 240 billion m3 in 2023 (IEA, 2024a). In addition, the disposition of renewable energy contributes to a net increase in workforce due to employment demand in areas such as civil works and industrial manufacturing activities, retrofitting of buildings, infrastructure maintenance, and environmental remediation. Notably, in 2023, the energy sector jobs stand at about 47 million people (IEA, 2024a). Moreover, developing a skilled workers are important to enhance competitiveness and social equity (i.e., increasing female representation in new renewable technology industries); considering in 2023, female workforce accounted for about 15% of the energy employment (IEA, 2024a).
Integrating decarbonization within the environmental management framework involves deploying strategies such as carbon capture, utilization and storage (CCUS), renewable energy implementation, energy efficiency enhancements, and waste minimization. These strategies not only reduce emissions but also ensure responsible ecosystems management practices and better quality of air. For example, as per IEA (2024a), about 45 CCUS facilities are active with an estimated storage capacity of about 615 Mt of CO2 per year, which is 61.5% of the estimated 1 Gt CO2 per year for achieving the NZE (i.e., Net Zero Emissions) pledge by 2050.
Policy frameworks and governance structures are essential to realizing the potential of the environmental management and decarbonization nexus. National and international climate commitments, carbon pricing, and regulations that incentivize carbon reduction are necessary to drive progress (IEA, 2024a; Zhu et al., 2024). Ultimately, the nexus emphasizes the need for an integrated, cross-sectoral approach to achieving a sustainable low-GHGs emissions future. By aligning decarbonization efforts with environmental management principles, societies can mitigate climate change adverse effects while fostering global economic resilience and ecological integrity.
The primary objective of this paper is to highlight the interconnectedness of environmental management and decarbonization, providing strategic pathways that mitigate climate change effects and environmental sustainability concurrently. By examining this integration, the paper aims to: (i) demonstrate how decarbonization efforts can complement broader environmental management goals in the energy sector, including resource efficiency, and pollution control; (ii) demonstrate where decarbonization and environmental management strategies can be aligned to maximize sustainability impacts; (iii) offer actionable recommendations for policymakers, industries, and communities to implement integrated approaches for reducing GHGs emissions while preserving the environmental ecosystems; and (iv) highlight the benefits of a decarbonization-focused environmental management frameworks for achieving long-term sustainability and climate resilience.
2. Conceptual Design of the Environmental Management Decarbonization Nexus
The conceptual design (Figure 2) consists of (i) the central nexus (environmental management and decarbonization); (ii) the supporting elements around the nexus (energy transition (ET), sustainable infrastructure (SI), circular economy (CE), social equity (SE), technological innovations (TI), and public policy (PP)); and (iii) the pathways leading to sustainable futures (clean energy, resource efficiency, and GHGs emissions reduction). These components are discussed below.
2.1. Central Nexus
The core of this design (the central nexus, Figure 2) has two interconnected concepts: environmental management and decarbonation. Environmental management is a set of strategies and processes aimed at protecting natural ecosystems, managing resources sustainably, and preventing pollution. This includes activities like sustainable waste management, conservation of biodiversity, and ensuring that natural resources are used efficiently without degrading the environment. Decarbonization through the reduction of GHGs emissions, via cleaner energy sources, energy efficiency, and CCSU technologies, is essential for limiting global warming, and reducing the CFP of industrial processes, energy production, and electrification. The two central elements are mutually reinforcing (Figure 3). Decarbonization is crucial to protecting ecosystems from adverse impacts of climate change, while effective environmental management provides a healthier and more sustainable context for low-GHGs developments.
2.2. Supporting Elements and Interactions
The six supporting elements of the environmental management and decarbonization nexus (Figure 2 and Figure 4a) and their interactions (Figure 4b) are discussed below.
- (1)
- Energy transition (ET): The conversion from oil and gas-based fuels to renewable energy is a cornerstone of decarbonization. This includes shifting to wind, solar PV, hydro, nuclear, and geothermal energy and electrifying sectors such as transportation and heating. The energy transition also involves improving energy efficiency and modernizing energy infrastructure, such as grids and storage systems. The energy transition is closely linked with technological innovations, which provide the required clean energy technologies (Figure 4b). Public policy plays a key role by mandating emissions targets and incentivizing renewable energy adoption. The energy transition also drives the development of sustainable infrastructures and helps reduce GHGs emissions across multiple sectors.
- (2)
- Sustainable infrastructure (SI): It refers to constructing of facilities and utilizing systems that support low-GHGs emissions and resource-efficient economies. This includes renewable energy grids, and electric vehicle charging stations. Infrastructures are essential for both decarbonization (by reducing emissions from energy) and environmental management (by improving resource use and waste management practices). Sustainable infrastructures depend on public policy support and are fueled by technological innovations (Figure 4b). For example, modernized electricity grids are needed to handle renewable energy sources. Infrastructures also support the circular economy by facilitating resource recycling and waste management.
- (3)
- Circular economy (CE): It minimizes waste and encourages the continuous use of resources by promoting recycling, reusing, and refurbishing products. This reduces the need for new resource extraction, lowers GHGs emissions, and helps achieve sustainable resource management. The circular economy aligns with environmental management by reducing waste and conserving natural resources. It also supports decarbonization by cutting emissions from resource extraction, processing, and waste disposal. Public policy can drive the adoption of circular economy models through regulations on waste management, product design, and recycling initiatives.
- (4)
- Social equity (SE): It ensures that the benefits of decarbonization and environmental management are distributed fairly, and that vulnerable populations are not disproportionately burdened by the transition to a sustainable economy. Equity considerations include access to clean energy, green jobs, and protection from the adverse impacts of climate change and environmental degradation. Social equity is a cross-cutting component that influences and is influenced by all other elements (Figure 4b). For example, public policies should ensure that marginalized communities benefit from green jobs and have access to affordable clean energy technologies. The just transition framework within decarbonization efforts helps ensure that workers in carbon-intensive industries are supported through retraining programs and social safety nets.
- (5)
- Technological innovations (TI): It drive progress in both decarbonization and environmental management. Innovations like renewable energy technologies (solar PV, wind, hydropower, nuclear), CCSU, energy storage solutions, and smart grids are critical for reducing GHGs emissions. In environmental management, technologies such as artificial intelligence (AI) for ecosystem monitoring, and internet of things (IoT)-enabled devices for resource management improve the efficiency and effectiveness of sustainability efforts. In addition, technological innovations directly support decarbonization by making clean energy more viable and accessible (Figure 4b). Simultaneously, these technologies enhance environmental management by providing tools for monitoring environmental impacts and reducing waste.
- (6)
- Public policy (PP): Policy frameworks guide and regulate the actions required to achieve decarbonization and environmental protection. Governments can set GHGs emissions reduction targets, enforce environmental regulations, and create incentives (such as carbon taxes or renewable energy subsidies) that encourage industries and individuals to adopt sustainable practices. For example, it is estimated that presently under one-quarter of global GHGs emissions are covered by carbon taxes and/or emissions trading systems (IEA, 2024a). Aggregate revenues from carbon prices initiatives rose to more than 100 billion USD in 2023, a record high. Half of these revenues were generated by the European Union Emissions Trading Scheme (EU ETS) (IEA, 2024a). Public policies interact with all other components (Figure 4b). Strong regulations and incentives encourage technological innovation, shape energy transitions, and influence sustainable infrastructure development. Policies can also ensure that decarbonization efforts are socially inclusive and equitable, addressing potential disparities in access to clean technologies and green jobs.
The supporting elements’ interactions (Figure 4b) can briefly emphasized as follow: (i) public policy influences technological innovations, energy transition, sustainable infrastructure, and social equity through regulations, incentives, and climate goals; (ii) technological innovations feed into decarbonization by enabling clean energy and sustainable practices, and into environmental management by providing tools for ecosystem protection and resource efficiency; (iii) sustainable infrastructure supports decarbonization by reducing emissions and aligns with environmental management by promoting resource efficiency and waste reduction; (iv) circular economy promotes resource efficiency, reduces emissions, and aligns with environmental goals; and (v) social equity ensures that decarbonization and environmental policies are fair and inclusive, addressing the needs of vulnerable populations.
2.3. Pathways Leading to Sustainable Futures
There are several key pathways leading from the central nexus of environmental management and decarbonization toward the overarching goal of sustainable futures, such as clean energy, resource efficiency, GHGs emissions reduction, biodiversity protection, social equity and economic prosperity (Figure 5).
These pathways, which are highlighted below, represent the desired outcomes of integrating decarbonization and environmental management:
- (1)
- Social equity ensures fair access to green energy, addressing energy poverty, and supporting affected communities through just transition initiatives. Inclusive policies, workforce reskilling, and equitable resource distribution are vital to balancing economic, environmental, and social needs for sustainable development.
- (2)
- Resource efficiency refers to optimizing the use of natural resources by reducing waste, improving recycling, and promoting sustainable consumption and production. This helps conserve ecosystems and reduce emissions associated with resource extraction and waste management. The basic resource efficiency components involve circular economy, environmental management, and sustainable infrastructure.
- (3)
- Clean energy is a fully renewable and low-carbon energy system such as solar PV, wind, hydropower, and nuclear. This pathway is critical to reducing the global CFP and moving away from oil and gas-based fuels. The clean energy components involve technological innovations (renewable energy), energy transition, and sustainable infrastructure (smart grids, storage).
- (4)
- Emission reduction addresses the reduction of GHGs emissions through cleaner energy production, CCSU, energy efficiency, and sustainable industrial practices. This is central to mitigating climate change adverse effects. The emission reduction techniques involve decarbonization, technological innovations, public policy, and energy transition.
- (5)
- Biodiversity protection ensures that ecosystems and species are preserved and restored. Biodiversity is vital for ecological health and adaptation in combating climate change adverse effects. The biodiversity protection components involve environmental management, sustainable infrastructure, and public policy.
- (6)
- Economic prosperity means fostering green innovation, creating sustainable jobs, and reducing dependency on fossil fuels. These processes attract investments in renewable technologies, improve resource efficiency, and mitigate climate-related risks, ultimately enhancing energy security, boosting gross domestic product (GDP), and ensuring long-term economic resilience.
The preceding discussion highlights the complex yet interconnected nature of the environmental management and decarbonization nexus. By addressing each of the elements and their relationships, societies can build a pathway to sustainable futures that promotes clean energy, efficient resource use, GHGs emissions reduction, and biodiversity protection while ensuring energy transition is equitable for all.
3. Technical Aspects of the Energy Transition
3.1. Energy Demand
The energy sector, which is a key contributor to global emissions, plays a vital role in this nexus. The energy demand in various countries and regions from different worldwide locations (i.e., the US, LAC, EU, Africa, Middle East, Eurasia, China, India, Japan and Korea, and Southeast Asia) is shown in Figure 6 (data from IEA, 2024a). Electricity demand in the US increased by 4.4% from 2011 to 2023 (IEA, 2024a). Notably, over the last 10 years, USA has increased its production by about 80% and became a major energy producers. In 2023, Brazil has contributed about 20 GW out of the 27 GW (from solar PV and wind) that produced by the LAC region (IEA, 2024a). Also, in LAC, energy is produced from different nonrenewable sources, such as oil (60%), natural gas (34%) and coal (6%). In the Middle East, in 2023, energy from nonrenewable resources (oil and natural gas) accounts for about 98% of the 36 EJ of energy requirement (IEA, 2024a); whilst, renewable resources (solar PV and wind) accounts for about 30 TWh only. In Eurasia, in 2023, 90% of the required energy was produced from nonrenewable sources (oil and gas). Similarly, in Southeast Asia, energy demand was supplied from nonrenewable sources, such as oil and gas (75%) and coal (25%). In the EU, the picture is completely different since 10% only of the energy demand was supplied by the nonrenewable sources (oil and gas) and the remaining by renewables (IEA, 2024a).
3.2. Mitigation of Energy Related GHGs Emissions
The declining of the energy related GHGs emissions in the EU and the US is shown in Figure 7 (data from UN Climate Change, 2024) indicating that during the period from 1990 to 2021, the EU reduced its energy related GHGs emissions by 40.72%; whilst the US by 3.3% only. The declining energy-related CO2 emissions in the EU were due to an increase in utilizing renewable sources, such as hydro and nuclear power, and restrict environmental regulation for GHGs emissions reduction.
Transitioning from nonrenewable (oil, gas, coal) resources to renewables, such as solar PV, wind, and hydropower, is a cornerstone of decarbonization efforts. The participation of various energy sources in the global energy mix (i.e., nonrenewable sources (oil, coal, natural gas) and renewables) is shown in Figure 8a; whilst, Figure 8b shows the source of energy consumption in selected sectors in 2023 (data from IEA, 2024a). Since 2000, the supply of oil, coal and natural gas has stabilized; but renewable energy supply continued to increase (Figure 8a). The global energy consumption in building, industry and transport sectors in 2023 is about 445 exajoules (EJ), out of which the renewal energy contribution is about 6% (Figure 8b).
3.3. Green Technology Contribution to Energy Demand
As per IEA (2024a), over the past 10 years (2013 to 2023), energy demand increased by 15%, of which 40% was supplied by renewables. In 2023, the EU introduced more than 60 GW of solar PV, which is double the amount produced in 2021, and 15 GW of wind capacity, which is about 40% more than that supplied in 2021. In 2023, China produced over 75 GW of wind energy and 260 GW of solar PV. However, in 2023, China contributed by about 50 GW from newly installed coal-fired power plants. It is to be noted that globally, China has (i) 40% share of the installed wind and solar PV, and about 50% of the produced EVs; and (ii) 80% share of the manufactured solar PV modules and EV battery cells. Moreover, during the period from 2019 to 2023, electricity demand increased by about 860 TWh, of which about 23% was in renewable energy manufacturing.
3.4. Green Technology Contribution to Decarbonization
Clean energy contribution to decarbonization in 2023 is shown in Figure 9 (data from IEA, 2024a). Global investment in clean energy rose on average by 10% annually since 2019 and is anticipated to be about 2 trillion USD in 2024 (IEA, 2024a). The use of several clean technologies (i.e., wind power, solar PV, nuclear, EVs, hydrogen, heat pumps, and CCUS) is estimated to contribute by almost three-quarters of energy decarbonation between 2023 and 2035 (IEA, 2024a) . The current, year 2023, contributions of different energy sources are shown in Figure 9 (data from IEA, 2024a). In the case of solar PV, China is dominating the market with contribution of about 63%; while, the EU, the US and the rest of the world contributed by about 14, 7 and 16%, respectively. Similarly, for wind power, China is dominating the market with 66% contribution; while, the EU and the US contributed by about 13 and 5%, respectively (IEA, 2024a). In 2023, 6.3 GW of nuclear power were generated by five countries (US, China, Slovak Republic, Belarus, and Korea). Notably, in 2024, new nuclear power energy of 4.5 GW has been linked to current grid systems in the US, UAE, China, and India (IEA, 2024a).
Simultaneously, energy efficiency, electrification of transportation, and the embracing of low-GHGs emission technologies in various industrial sectors are essential to reducing the CFP of high-emission sectors. For example, in 2023, 14 million EVs were sold worldwide, out of which 4.8 million EVs were sold in China (IEA, 2024a). It is worth noting that in 2023, globally (IEA, 2024a): (i) about 2.2 TWh of EVs battery capacity was manufactured; whilst, the demand was about 750 gigawatt-hours (GWh); (ii) hydrogen production reached 97 Mt, from coal (at 21.25%), natural gas (58.06%), fossil fuels with CCUS (8.6%), and by-product (11.84%), and about 1.4 GW from water electrolysis, of which 80% is contributed by China.
Also, technical efficiency improvements (i.e., new vehicle fuel technologies) have contributed to lower expenses due to lower energy consumption. Notably, in 2023, more than 390 billion USD was invested in energy efficiency, an increase of about 30% from that in 2020 (IEA, 2024a), and several governments introduced policy measures geared towards energy efficiency, such as: the “Inflation Reduction Act” in the US; the “Energy Efficiency Directive” in the EU; the revised Act on “Rationalizing Energy Use” in Japan; and the most recent cycle of the “Perform, Achieve and Trade Scheme” in India. Circular economy principles, which prioritize recycling and resource efficiency, complement these efforts by reducing waste and minimizing emissions throughout product life cycles.
3.5. Strategic Alignment of the Nexus
Decarbonizing the energy sector is essential to meet global GHGs emissions targets, and environmental management plays an important role in guiding this conversion. The following strategies exemplify how the nexus can be aligned to serve the energy sector:
3.5.1. Renewable Energy Transition
Conversion from nonrenewable (oi, gas, and coal) to renewable energy sources (solar PV, wind, and hydropower), is a cornerstone of decarbonization. This shift reduces CFP and lessens the environmental impacts of energy extraction. Environmental management frameworks guarantee that renewable energy projects are established in a manner that minimizes ecosystem disruption. As per IEA (2024a), in 2023, new renewable energy sources of more than 560 GW were introduced with an annual investment of about 2 trillion USD, which is about double the invested amount on new nonrenewable energy (oil, gas and coal) projects. During this transition, China is the leading contributor with almost 60% of the added global new renewable energy capacity. The estimated invested amounts on renewables, in 2024, are shown in Figure 10 (data from IEA, 2024a). The developed countries and China are contributing by about 85% of the global investment.
3.5.2. Energy Efficiency and Electrification
Increasing energy efficiency across industrial processes reduces overall energy demand and emissions. Electrification of sectors like transportation, where EVs replace internal combustion engines, plays a key role in decarbonization. Environmental management ensures that the expansion of EVs infrastructures (i.e., batteries and grid modernization) adheres to sustainability principles. Currently, 20% of the global new car sales is from the EVs, and it is expected to increase to 50% by 2030, as per the “Stated Policies Scenario” (IEA, 2024a). Notably, the transportation sector is accountable for a quarter of global CO₂ emissions, with urbanization intensifying these impacts. Figure 11 (data from UN Climate Change, 2024) shows that road transportation system is a major contributor to the GHGs emissions. Also, both EU and the US have increased their GHGs emissions by 14.02, and 6.48%, respectively, during the period from 1990 to 2021.
Electrification in road transport covers both passenger cars and heavy-duty buses. As per IEA (2024a), in 2023, the energy required in the transportation sector has increased by about 4%. Also, 28% of the new passenger cars sold were EVs (12% electric batteries and 16% hybrids). The share of the passenger electric battery cars is expected to increase to 20% by 2024. For the zero-emission heavy-duty trucks, in 2023, China has a share of 10% of the global sale (BNEF, 2024); whilst, the EU has 16% share of the electric buses sold, in the first 6-month of 2024 (ACEA, 2024).
3.5.3. Carbon Capture, Storage and Utilization
CCSU technologies capture carbon dioxide emitted from a variety of industrial processes and store them underground or repurpose them for other industrial applications (Mohamed et al., 2022). Environmental management practices ensure that CCSU operations are carried out safely, with minimal environmental risks such as groundwater contamination or environmental ecosystem disruption. Momentum behind CCSU has been growing as shown in Figure 12 (data from IEA, 2024a). For example, CCSU technologies captured about 11.3 Gt of carbon dioxide from coal-fired power plants, in 2023; which is about 30% of the global carbon dioxide emissions from energy sector (IEA, 2024a).
3.5.4. Circular Economy Integration
Circular economy aligns with decarbonization by promoting closed-loop systems, whereby materials are reused and repurposed; hence minimizing resource extraction and reducing emissions throughout product life cycles (Balbuena and Wang, 2004; Speirs and Contestabile, 2018; Wrålsen, et al., 2021; Yang et al., 2021). Environmental management supports the circular economy by ensuring that waste is processed safely and efficiently, with minimal environmental impact. Figure 13 illustrates the relationship between the circular economy and decarbonization, supported by environmental management. At the center is a large circular loop representing the circular economy, showing key stages such as resource extraction, production, consumption, and recycling. Arrows flow between these stages, emphasizing material reuse and repurposing, which minimizes waste and resource extraction. Surrounding the loop are smaller arrows representing environmental management processes, including waste reprocessing, recycling, emission reduction, and reuse of materials. The green and blue color scheme emphasizes sustainability and the interconnectedness between decarbonization efforts and sustainable environmental management strategies.
Circularity strategies (i.e., material use reduction, recycling, adaptive reuse, resource efficiency, and waste management) with their circular economy approach (MacArthur, 2019; Oyejobi, 2024) for the case of wind turbine blades, as an example, are shown Table 1. Notably, at present, solar panels and electrical batteries have been treated to extract valuable raw materials. It has been reported that currently about 65-70% by mass have been recycled and by 2030 the value of extracted raw materials could reach a value of 450 million USD (IRENA, 2016). For example, in a study by Umicore (2019), 90% of the cobalt and nickel present in the high-voltage batteries of the “Audi e-tron all-electric SUV” can be extracted and used to make new batteries. Similarly, circular business models for lithium-ion batteries that have been discarded from EVs have been reported (Merli and Preziosi, 2018; Nuβholz, 2018; Vermunt et al., 2019; Wrålsen et al., 2021).
It is important to note that conversion to renewable technologies is prompting enormous request for the critical minerals, such as lithium, cobalt and rare earth metals, that are needed for manufacturing of renewable energy components (World Economic Forum, 2022; Mohamed, 2024; Paleologos et al., 2024c). Achieving Net-Zero by 2040 requires an increase of critical mineral’s demand by about 60 times. Specifically, the demand for lithium could reach 40 times, and nickel and cobalt by 200 times. Mining of these minerals poses challenges in terms of process sustainability and environmental risks (World Economic Forum, 2022). However, implementation of circular economy via treatment and recycling from E-waste could help in alleviating this problem (Mohamed 2024c).
4. Policy and Governance Frameworks
4.1. Current Policies
4.1.1. Energy and Climate Policies
Several governments have introduced policies related to energy and GHGs emissions. For emissions, countries and regions such as the US and the EU have introduced new standards on limiting methane emissions, transboundary carbon adjustment mechanism, GHGs emissions from fossil fuel-fired power plants, and transportations systems. For energy related aspects, number of countries have introduced schemes for investments in the nonrenewable energy (oil and gas) sectors, such as Argentina, South Africa; whilst, others have introduced legislation for investment in renewable energy projects, such as UK, Korea, Indonesia, UAE, and Viet Nam. Also, policies to support electrification have been introduced in Australia, as well as investments in CCUS projects has been the focus of various countries such as Australia, Indonesia, Japan and Korea. To enhance energy consumption in buildings and air quality in cities (i.e., promoting the concept of sustainable cities), Canada, China and UAE have introduced various strategies with sizable investments.
4.1.2. Manufacturing Support for Renewable Energy Policies
Examples of domestic direct manufacturing incentive schemes, for support of renewable energy in selected governments enacted since 2020, are shown in Table 2 (IEA, 2024a).
4.1.3. Carbon Capture, Storage and Utilization Policies
Specific policies related to CCSU in number of countries are shown in Table 3.
4.1.4. Electrification Policies
Table 4 (data from IEA, 2024a) shows samples of government plans for adoption of EVs. It is anticipated by 2024, EVs will be contributing by about 5% of the total global car sales. Notably, in this environment, China contributes by about 80%; whilst other countries and regions have contribution ranging from 3% for the EU to 10% for the US and to 15% for the UK. Moreover, the IEA (2024a) report highlighted the noticeable increase of EVs in the Middle Eastern countries as well as in Brazil, Indonesia, Mexico and the Caspian region.
4.2. Policy Development Strategies
For policy development of an effective clean energy innovation systems, governments must consider the following four main pillars (IEA, 2020): development of skilled workforce and research infrastructure, knowledge transfer and management, increase of the market value to mitigate the research and development risks, and develop a broad socio-political support for the new product or service. These pillars are highlighted in Figure 14 (IEA, 2020).
For example, the policy instruments used to support the “Ultra-high-voltage electricity transmission technology” in China from 2014 to 2021 are shown in Figure 15 (data from IEA, 2024b). In 2014, the introduced policies were related to knowledge management and market pull; however, in 2016, policies addressed three pillars (i.e., resources push, knowledge management and market pull). However, all the four pillars were induced in 2018 policies. Moreover, in 2018, policies covered only three pillars (i.e., resources push, knowledge management, and market pull). Finally, in 2021, policies related to resources push and market pull were introduced. The total investments increased from about 1.75 trillion USD in 2014 to about 6.750 trillion USD in 2021 (IEA, 2024b).
Similarly, the policy instruments used to support solar PV technology and production in China from 2014 to 2021 are shown in Figure 16 (data from IEA, 2024b). Most of the policies were issued to support market pull of the solar PV technology. The solar PV production rate increased from about 37.5 GW in 2014 to about 182.5 GW in 2021 and the percent contribution of China to the total global production is marked at about 75% within the period from 2016 to 2021. Notably, among the top 20 solar PV manufacturing companies in 2022, 17 of them were from China and many of these have operations around the world (IEA, 2024b).
Therefore, the successful integration of environmental management and decarbonization requires strong policy and governance frameworks that support emission reduction at multiple levels:
- (a)
- Carbon pricing and incentives: Instruments, such as “carbon taxes” or “cap-and-trade”, incentivize companies and organizations to reduce GHGs emissions. Also, governments can also offer supports and financial enticements for renewables, electrification, and low-GHGs emissions technologies.
- (b)
- Regulatory standards: Environmental regulations that limit GHGs emissions from industrial processes, road, air and marine transport, and energy production systems are essential for achieving decarbonization goals. These regulations should be aligned with broader environmental management objectives, such as clean air, water and land, biodiversity conservation and resource efficiency.
- (c)
- Cross-sector collaboration: Governments, industries, and civil society must collaborate to achieve decarbonization targets. Public-private partnerships can drive innovation and investment in low-GHGs emissions technologies, while community engagement ensures that decarbonization strategies are inclusive and equitable.
5. Technological Innovations
Technological innovation is a key enabler of the environmental management decarbonization nexus, driving transformative change across various sectors. As the world strives to meet ambitious climate goals, advancements in technology provide the tools to reduce emissions, improve resource efficiency, and enable better environmental management.
5.1. Renewable Energy Technologies
The government spending on energy research and development is shown in Figure 17 (data from IEA 2024b) whereby in 2023, the government spending was estimated at approximately 38% (China), 24% (North America), 30% (EU), and 7.6% (remaining countries). Also, in 2023, the venture capital funding for energy-related start-ups (data not shown) was estimated at 32 billion USD distributed as 27% from China, 66% from developed countries, and 6.5% from developing countries (IEA, 2024b). Equally important are outreach programs that build awareness, drive consumer behavior change, and foster collaboration among stakeholders. Together, these two elements play a crucial role in achieving sustainable futures.
As per IEA (2024a), investments in renewable energy have reached about 3 trillion USD in 2024. Also, it was estimated that about 1.9 trillion USD is marked for support to renewable energy technologies, such as low-emission power, energy efficiency and end-use and CCSU infrastructures, and 1.1 trillion USD on other nonrenewable sources of energy supply (i.e., coal, oil and natural gas) (Figure 18; data from IEA, 2024a). In 2024, about 85% of the total renewable energy investments came from developed countries and China; whilst the remaining 15% came from the developing countries (Figure 19; data from IEA, 2024a), that currently invest heavily in nonrenewable energy and suffer from the high initial capital cost to support renewable energy technologies.
Financing of clean technologies can be characterized into the following three categories (Figure 20; data from IEA, 2024a): (i) Capital structure (equity and debt) with a share of about 33% of current energy investment; (ii) Investors (household, corporate and government) with about 34%; and (iii) Financiers (commercial and public) with the remaining 33%. Basically, in 2023, investment in clean technologies is almost shared equally between capital structure, investors and financiers.
Breakthroughs in solar, wind, geothermal, and hydropower technologies are making renewable energy more cost-effective and accessible. Also, new technologies in storing energy through batteries and grid-scale enhance the consistency of energy supply from renewables by mitigating intermittency challenges. Also, smart charging processes could enhance grid flexibility, optimize grid load, and supply power to buildings (IEA, 2024b). These innovations allow energy systems to reduce their CFP while ensuring energy security. The government support for renewable energy manufacturing processes, from 2020 to 2024, is shown in Figure 21 (data from IEA, 2024a). The support for EVs (electric, hydrogen and batteries) marked at 72.57%, for solar PV and wind at 17.39%, mineral resources at 8.7%, and for heat pumps at 1.34% of the total investments.
5.2. Smart Grids and IoT
The amalgamation of smart grids and the Internet of Things (IoT) enables more efficient energy use by optimizing electricity distribution and consumption (Katuri et al., 2023; Folgado et al., 2023; Dewri et al., 2023; Jia et al., 2024). Smart grids can assimilate variety of renewable technology sources, balance supply and demand, and reduce energy losses. Moreover, they can be installed for different purposes and functions, for example, microgrids installed at educational institutional campuses enhanced sustainability and reliability of power supply (Arzani et al., 2018); whilst, those installed at residential areas they improved energy supply and enhanced implementation of new renewable energy projects (Che et al., 2015). Microgrids installed at industrial sites safeguarded nonstop power supply, optimized energy expenses, and improved circularity through the integration of sustainable environmental management systems with sustainable renewable energy technology sources (Tran et al., 2023).
The IoT technologies, such as smart meters, have been in use in smart grids, in the US and the EU countries, for monitoring and transmitting real-time electricity consumption to consumers as well as utility companies (Barai et al., 2015). Also, in Germany and Denmark, the IoT technologies are used to improve the efficiency of the electricity distribution systems (Amiri et al., 2021); whilst, in the US and Australia, they are used to regulate the power demand and alarming consumers of the peak periods to minimize electricity usage (Dewri et al., 2023). Moreover, in Japan and South Korea, the IoT devices are used to preserve optimum levels of voltage and frequency across the grid and ensure reliable quality of power supply (Repnikov et al., 2023). The IoT was further used in Energy Management Systems (EMSs), in the US, Germany and China, for monitoring, controlling, and optimizing electricity from generation to distribution to consumption and finally to storage (Zeda et al., 2021). Also, the IoT was used, in the US, Netherlands and Norway, for vehicle-to-grid integration to permit EVs to transfer stored energy to the grid system and incentivize the owners of the EVs (Ravikumar et al., 2023).
5.3. Carbon Capture, Utilization, and Storage
CCUS technologies adsorb CO₂ from exhaust gases; hence stopping them from polluting the atmosphere. Captured CO₂ is used to produce valuable products, such as fuels, chemicals, and building materials, creating economic opportunities while reducing emissions. CCUS plays an important role in industries that are difficult to decarbonize, such as cement, steel, and petrochemicals. Examples of innovative solutions include (IEA, 2024b): (i) The 50 MW natural gas power plant operated by NET Power produces clean energy using CO2 in its oxy-combustion process technology; and (ii) The Taizhou coal power plant, China, has a capability to capture 0.5 Mt CO2 per year. However, higher CO2 capture rates are vital for CCUS systems to be part of the technological processes that contribute to the low-GHGs emissions futures. Notably, new CO2 adsorption systems with 99% capture rates have been reported by IEAGHG (2019).
5.4. Digital and Decision Support Systems
Digital and decision support systems, such as artificial intelligence (AI) and machine learning (ML) technologies, enable more efficient resource management by analyzing large datasets to optimize energy use, predict environmental risks, and guide policy decisions (Bressanelli et al., 2018; Cagno et al., 2021; Mohamed, 2024a&b). AI-driven models help optimize supply chains, improve crop yields in agriculture, and enhance circular economy processes by identifying new ways to reduce waste and recycle materials. Table 5 shows examples of digital systems that embrace circular economy through resource conservation, real-time monitoring of material use, process control, and on-time communication with stakeholders to enhance decision making (modified after Oyejobi et al., 2024).
6. Outreach Programs and Public Engagement
Technological advancements alone are not enough to drive meaningful decarbonization and environmental outcomes. Outreach programs and public engagement are critical for fostering widespread support, driving behavioral change, and ensuring equitable implementation of decarbonization initiatives (Cattino and Reckien, 2021; IEA, 2022; Hilser et al., 2024). These programs serve as catalysts for levitation of the public consciousness towards the benefits of having sustainable environmental management systems and decarbonization strategies for transitioning to sustainable futures.
6.1. Public Education and Awareness Campaigns
Providing educational programs for the public about the impacts of GHGs emissions and the importance of decarbonization is essential for creating a groundswell of support for sustainability initiatives. Awareness campaigns can communicate the benefits of an efficient energy use, waste reduction and sustainable practices, encourage individuals and communities to adopt low-GHGs emissions behaviors. Educational programs in schools and communities can inspire the next generation of environmental leaders. For example, homes with digital control systems (IoT and sensors), that control temperature at a comfort level, emit 22.4% less carbon than those without digital systems (Asopa et al., 2021). In addition, as per Mckinsey Company’s report (2013), in the US, approximately 20% of the required energy at homes could be set aside through implementation of educational programs that lead to consumer behavior changes towards energy use in homes. Also, in an Indian study by Sachar et al. (2019), it was estimated that 3.4 to 10.2 TWh per year by 2030 could be saved due to the efficient use of energy as a result of consumer behavior change. Moreover, as per IEA (2021), Ireland estimated that energy saving of about 2.4 and 6.5 TWh per year in residential, and commercial and public buildings, respectively, could be saved by simply adjusting room temperature, leading to an overall lower energy consumption by 5% across the country.
Outreach programs, which are implemented in the US, compared between (i) the “Behavioral Efficacy” (BE) programs that accounted for the use of issued home energy reports, alerts for consumers with high monthly energy bills, and regular energy audits at homes; and (ii) the “Climate Damage Avoided Cost” ($CDA) modelling that accounted for in-depth evaluation of both performance and incentives of various installed home energy systems, such as retrofitting, efficient heating and cooling, and reported that depending on the State, both BE and $CDA varied. For example, State of Illinois has a BE of 0.43 and a $CDA of 2.04; State of Maryland has a BE of 2.03 and $CDA of 9.75, and State of Massachusetts has a BE of 5.42 and a $CDA of 22.82.
Moreover, as per IEA (2021& 2022), constructive educational programs could lead to a widespread range of influences towards energy savings. Examples are: (i) 2.2% reduction in household electricity usage and 1.6% reduction in natural gas consumption, overall; (ii) 14% reduction in electricity usage and 10% reduction in gas usage through implementing educational programs that lead to consumer behavior change; (iii) A reduction of about 1.5% of natural gas usage and 2.2% of electricity usage due to use of IoTs in households; (iv) 3.6 to 6.9% of saving in electricity usage resulted from New Zealand’s nationwide educational programs; and (v) Electricity saving of about 2% as a result to Korea’s national campaign in 2011.
6.2. Community Engagement and Participation
Successful decarbonization and environmental management strategies rely on active participation from local communities. Outreach programs that engage communities in co-developing solutions—such as local green energy and infrastructure projects, or conservation programs—ensure that strategies are designed to meet the actual requirements of individual communities. Cooperative decision-making builds trust and ensures that sustainability efforts are inclusive and equitable. Examples are (IEA, 2021): (i) BC Hydro, Canada, established a customer participation program combining regular consumer advice with other behavioral engagements attracted more than 91 thousand households, over a period of 4 years, resulting in a reduction of 25.6 GWh in electricity consumption in comparison with the control group; and (ii) The Jemena Electricity Network, Australia, introduced a “demand-response challenges” for reducing energy consumption during peak periods as well as during hot and cold weather trials, resulting in about 26 to 42% reduction in energy consumption during a specified 3-h periods.
Moreover, in 2016, the US Department of Energy evaluated the consumer behavior studies impact (US DOE, 2016) and reported that for customer response to pricing: (i) 20% reductions of APD (average peak demand) for CPP (critical peak pricing); (ii) 6% reductions of APD for CPR (critical peak rebates); and (iii) 35% reductions for CPP with automated control devices; and (iv) 26% reductions for CPR with automated control devices. Moreover, for customer use of PCTs (Personnel Control Technologies), the APDs were reduced by 22% for CPP and by 45% for CPR.
Furthermore, policies that geared towards increasing investments in energy efficiency at homes (i.e., building with insulation systems and appliances with energy efficient technologies) could largely benefit from community engagement and participation programs (SEAI, 2020).
6.3. Industry Collaboration and Knowledge Sharing
Industry-specific outreach programs are critical for disseminating successful case studies and programs that clearly demonstrate the environmental and economic benefits of decarbonization. Cross-industry collaboration platforms and knowledge-sharing initiatives can accelerate the implementation of technologies with low-GHGs emissions and sustainable environmental management programs and strategies. These collaborations also foster innovation by bringing together diverse expertise from different sectors.
- (a)
- Government and Policy Advocacy: Outreach programs that target policymakers are essential for shaping effective environmental and emission policies. Advocacy campaigns can help build political support for ambitious emission targets, carbon pricing, renewable energy incentives, and regulatory frameworks that promote decarbonization. Public engagement in policy discussions ensures that diverse voices are heard, leading to more democratic and inclusive climate action. Moreover, a solid understanding of behavioral drivers of energy consumption and barriers to sustainable energy use is necessary to design people-centered energy policies for the transition (IEA, 2024a).
- (b)
- Corporate Social Responsibility (CSR) Initiatives: Companies play a crucial role in advancing decarbonization and environmental sustainability through their CSR programs (Araña and León, 2009; Chen et al., 2019). By aligning their business practices with sustainability goals, corporations can reduce their CFP, support conservation efforts, and promote responsible resource management. Corporate outreach programs that engage employees, customers, and suppliers in sustainability initiatives amplify the impact of these efforts. In a study by Yan, et al. (2022), 224 Chinese A-share businesses in the heavy pollution industry that listed between 2016 and 2020 were analyzed and the results concluded that there is a clear evidence that CSR is positively associated with sustainable innovation in regions with better macroeconomic conditions, and more strong in state-owned firms than in non-state enterprises. In another study by Chen et al. (2019), the effects of GHGs emissions restriction on firms' outputs, price, profits and social welfare were theoretically modelled, and the results indicated that: high social concern reduces both social welfare and firms' profits when the CSR firm's GHGs emissions restriction is not binding, and low social concern increases both social welfare and CSR firm's profits when profit maximizing firm is subject to GHGs emissions restriction (i.e., binding to emission reduction). Notably, the study conclusion for the case of high social concern is consistent with Kopel and Brand (2012) and is contrary to Goering (2008) and Benabou and Tirole (2010). In a recent study by Zhou et al. (2023), the Stackelberg game model was used to examine optimal GHGs emissions reduction and its influence under different decision-making modes. The results showed that (i) increased consumer green preferences and trust can improve the manufacturing enterprises’ GHGs emissions reduction rate; (ii) increased green innovation costs decrease GHGs emissions reduction rate; (iii) for constant green technology innovation costs, GHGs emissions reduction rate increases with an increase in capacity of the market; and (iv) to achieve decarbonation production, the market capacity must be small. These findings are relevant to governments and enterprises in low-GHGs emissions subsidies and supply chain management.
- (c)
- International Cooperation and Global Outreach: GHGs emissions and environmental degradation are global challenges that require international cooperation. Outreach programs that facilitate dialogue and collaboration between countries, regions, and international organizations are vital for scaling up decarbonization efforts and sharing successful strategies. International platforms, such as the United Nations Framework Convention on Climate Change (UNFCCC), provide opportunities for global knowledge exchange and collective action.
7. Expected Outcomes and Benefits
By integrating environmental management and decarbonization, several key outcomes can be achieved. A systematic approach to decarbonization across key sectors will significantly lower GHGs emissions, contributing to the achievement of the projected zero emission targets set in the UN Paris Agreement. In 2023, the global workforce in the clean energy technologies is about 68 million workers shared by supply (9%), power (43%), vehicles (28%) and efficiency (20%) sectors (Figure 22; data from IEA, 2024a) that expected to increase by about 15 million for meeting the net zero emission scenario (IEA, 2024a).
Decarbonization strategies that incorporate circular economy principles will promote efficiency of natural resources utilization, and minimization of generated waste from industrial processes and their impact of human health and the environment. Decarbonizing transportation, reducing urban emissions, and improving waste management will lead to cleaner air, healthier ecosystems, and more livable urban environments, enhancing public health and overall quality of life.
Outreach programs will foster a greater sense of environmental responsibility among individuals, communities, and industries, resulting in more widespread support for sustainability initiatives and greater participation in low-GHGs emissions practices. Also, outreach efforts that engage marginalized communities and ensure their voices are heard will lead to more just energy transition and decarbonization strategies. This will help address social inequalities that intensified due to global climate change and ensure that the benefits of the low-GHGs emissions transition are shared by all. Moreover, cross-sectoral and international collaboration will drive innovation in both technology and policy, enabling the development of more effective and scalable solutions for global warming mitigation and environmental management. The combination of technological innovations and public engagement will result in more resilient ecosystems, sustainable resource management, and reduced emissions, paving the way for a sustainable future that balances the environmental ecosystems health, global economic growth, and social welfare.
8. Challenges
While the integration of environmental management and decarbonization is critical to building sustainable futures, several challenges must be addressed to achieve widespread success (Rizos et al., 2015; Kirchherr et al., 2018; Ormazabal et al., 2018; Garces-Ayerbe et al., 2019; Vermunt et al., 2019; Yang et al., 2021). These challenges span from technology to economic to social, and finally to political domains, each posing a unique barrier to effective implementation.
8.1. Technological Barriers
The technological and infrastructure limitations include (de Sousa Jabbour et al., 2018a,b; Tura et al., 2019; Donner and de Vries, 2021; Kumar et al., 2021; Hina et al., 2022): (i) Many decarbonization technologies, such as CCUS, advanced battery storage, and smart grid systems, require significant upfront investment. In developing countries and regions with limited resources, the cost barrier can hinder the widespread adoption of these technologies. Also, the differential manufacturing cost between countries is another problem. For example, in a study by IEA (2024a), the capital and operating costs required to establish a green energy manufacturing facility in developed countries are 70-130% more than that required in China for the same output capacity (Figure 23); (ii) The successful conversion to renewable energy sources and low-GHGs emissions systems relies on modern infrastructure, such as updated grids, storage facilities, and electric vehicle charging networks. Inadequate infrastructure, especially in rural or underserved regions, impedes placement of green energy technologies and electrification; and (iii) While many innovative technologies hold great potential for decarbonization, some innovative technologies are still at early stage of technology readiness levels (TRLs) of one-to-four. Scaling these technologies to the global level will require further research, development, and investment.
8.2. Economic Barriers
The economic and market barriers include (Linder and Williander, 2017; Hopkinson et al., 2018; Kirchherr et al., 2018; Olsson et al., 2018; Agyemang et al., 2019; Kumar et al., 2019; Upadhyay et al., 2021): (i) Many economies remain heavily dependent on nonrenewable sources, not only for energy production but also as a source of revenue, particularly in oil and gas-producing countries (Figure 24; data from IEA, 2024a). The transition to renewable energy could result in economic disruptions and job losses in these industries, creating resistance to change; (ii) In many regions, there are insufficient economic incentives to adopt low-GHGs emissions technologies and sustainable practices. Market structures often favor nonrenewable sources due to subsidies; hence implementation of renewable energy sources and green technologies is difficult; and (iii) Private sector finance to renewable energy technologies is often hindered by perceived risks, regulatory uncertainty, and long payback periods. These factors can limit the flow of capital needed to finance large-scale decarbonization projects.
8.3. Social Barriers
The anticipated social barriers include (Sousa-Zomer et al., 2018; Bocken et al., 2016; De Angelis et al., 2018; Oghazi and Mostaghel, 2018; Jabbour et al., 2019; Narimissa et al., 2020; Kazancoglu et al., 2020; Tura et al., 2019): (i) Public understanding of decarbonization strategies and their environmental benefits remains limited in many areas. Resistance to change can arise due to concerns over the cost, inconvenience, or perceived threats to jobs and industries; and (ii) Climate change and environmental degradation disproportionately affect marginalized and vulnerable populations. Decarbonization efforts, if not designed with equity in mind, risk exacerbating existing social inequalities, as vulnerable groups may lack access to clean technologies or face greater economic burdens from the transition.
8.4. Governance Barriers
The main policy and governance gaps are (Flores et al., 2018; Kumar et al., 2019; Shao et al., 2019; Brunnhofer et al., 2020; Kazancoglu et al., 2020&2021; Patwa et al., 2021): (i) In many countries, environmental and climate policies are fragmented or insufficiently ambitious to drive the necessary level of decarbonization. The absence of long-term, coherent policies limits the ability of governments to effectively manage the conversion to a low GHGs emissions economy; and (ii) Climate change is a global challenge, yet international cooperation is often limited by conflicting national interests, political priorities, and economic competition. The lack of binding international agreements and enforcement mechanisms undermines global efforts to reduce emissions and protect ecosystems.
9. Conclusions and Way Forward
The integration of environmental management and decarbonization offers a transformative opportunity to mitigate global warming and protect ecosystems simultaneously. However, the path to a sustainable low GHGs emissions future is fraught with challenges, including technological limitations, economic barriers, social equity concerns, and governance gaps. To overcome these obstacles, a coordinated and multi-dimensional approach is required. By investing in innovation, modernizing infrastructure, creating strong market incentives, and ensuring inclusive policies, governments and industries can accelerate decarbonization while safeguarding environmental health. Public outreach and international cooperation are critical to scaling solutions and building a collective vision for a sustainable future.
As we move forward, the environmental management decarbonization nexus will be crucial for reshaping the economies, protecting the planet, and ensuring a just and equitable conversion to a low-GHGs emissions world. Through collaboration, innovation, and leadership, a resilient future that meets the challenges of climate change while promoting economic growth and social welfare can be built. The pathways to advance the integration of environmental management and decarbonization are:
- (1)
- Invest in research, development, and innovation: This can be achieved via (i) Governments and private sectors must increase investment in research and development to scale emerging technologies in areas of energy storage, green hydrogen production, and CCUS infrastructures. Collaborative public-private partnerships can help reduce costs, improve scalability, and bring these technologies to market more rapidly; and (ii) International cooperation should prioritize technology transfer to ensure that low-carbon innovations are accessible to developing countries. This will enable these countries to overcome oil and gas fuel dependency and adopt sustainable energy and industrial systems.
- (2)
- Build sustainable infrastructure: This can be realized by: (i) Governments need to invest in modernizing and expanding energy infrastructures to enhance the conversion to renewable energy systems. This includes upgrading electricity grids, developing energy storage solutions, and building widespread charging networks for electric vehicles; and (ii) Infrastructure for recycling, waste-to-energy technologies, and resource recovery must be expanded to support a circular economy. This will reduce emissions from waste while enhancing resource efficiency and promoting economic resilience.
- (3)
- Enhance market mechanisms: It can be accomplished through (i) Realizing mechanisms for carbon pricing, such as “carbon taxes” or “cap-and-trade” systems, can co-opt the cost of emissions and create strong economic motivations for businesses and industries to adopt low-carbon technologies. Financial support, such as “tax credits” and subsidies, can also encourage investments in renewable energy and sustainable practices; and (ii) Governments and financial institutions can help de-risk clean energy projects by offering guarantees, green bonds, or concessional financing. These measures will attract private investment and facilitate large-scale deployment of low-carbon technologies.
- (4)
- Address social and equity concerns: It can be attained through (i) Decarbonization policies must be designed with equity and inclusion in mind. Governments should implement just transition frameworks that provide support for workers in carbon-intensive industries, including retraining programs, social protection measures, and job creation in clean energy sectors; and (ii) Public awareness campaigns and community outreach programs are essential to foster a culture of sustainability. Educational initiatives that demonstrate the economic and social benefits of decarbonization can increase public acceptance and encourage behavioral change at the individual, community, and corporate levels.
- (5)
- Strengthen policy and governance frameworks: It can be attained through (i) Governments must commit to more ambitious climate targets and develop comprehensive policy frameworks that integrate environmental management with decarbonization efforts. These policies should include legally binding emissions reduction targets, strong environmental regulations, and clear incentives for industries to reduce their carbon footprints; and (ii) Addressing global climate change requires strong international collaboration. Countries must work together to strengthen global climate agreements, share technological innovations, and align their policies to ensure that decarbonization efforts are mutually reinforcing.
- (6)
- Empower technological innovation: It can be accomplished through (i) Digital technologies such as AI, big data analytics, and the IoT can revolutionize environmental management by providing real-time insights into resource use, energy efficiency, and ecosystem health. Governments and industries should invest in digital solutions to optimize energy use, track emissions, and improve environmental decision-making; and (ii) Cities are at the forefront of decarbonization efforts, and smart city initiatives offer a way to integrate digital technologies with sustainability goals. By using IoT sensors, AI, and data analytics, cities can reduce energy consumption, manage waste efficiently, and optimize transportation systems, thereby lowering their carbon footprints.
References
- ACEA (European Automobile Manufacturers Association) (2024), New commercial vehicle registrations: vans +15%, trucks +3%, buses +28.6% in H1 2024. https://www.acea.auto/cv-registrations/new-commercial-vehicle-registrations-vans-15-trucks-3-buses-28-6-in-h1-2024/.
- Agyemang, M., Kusi-Sarpong, S., Khan, S.A., Mani, V., Rehman, S.T., and Kusi-Sarpong, H., (2019). Drivers and barriers to circular economy implementation. Manag. Decis. [CrossRef]
- Amiri, S.S.; Rahmani, M.; McDonald, J.D. (2021). An Updated Review on Distribution Management Systems within a Smart Grid Structure. In Proceedings of the 2021 11th Smart Grid Conference (SGC), Tabriz, Iran, 7–9 December 2021; pp. 1–5.
- Araña, J.E., and León, C.J. (2009). The role of environmental management in consumers preferences for corporate social responsibility, Environ. Resour. Econ. 44 (2009) 495–506.
- Arzani, A.; Boshoff, S.; Arunagirinathan, P.; Maigha; Enslin, J.H. (2018). System Design, Economic Analysis and Operation Strategy of a Campus Microgrid. In Proceedings of the 2018 9th IEEE International Symposium on Power Electronics for Distributed Generation Systems (PEDG), Charlotte, NC, USA, 25–28 June 2018; pp. 1–7.
- Asopa, P.; Purohit, P.; Nadikattu, R.R.; Whig, P. Reducing carbon footprint for sustainable development of smart cities using IoT. In Proceedings of the 3rd International Conference on Intelligent Communication Technologies and Virtual Mobile Networks, ICICV 2021, Tirunelveli, India, 4–6 February 2021; Institute of Electrical and Electronics Engineers Inc.: Piscataway, PA, USA, 2021; pp. 361–367.
- Balbuena, P.B., and Wang, Y. (2004). Lithium-ion batteries, Solid-Electrolyte Interphase. lithium-ion batteries. Pages: 424; Edited by: P.B. Balbuena and Y. Wang. [CrossRef]
- Barai, G.R.; Krishnan, S.; Venkatesh, B. (2015). Smart Metering and Functionalities of Smart Meters in Smart Grid—A Review. In Proceedings of the 2015 IEEE Electrical Power and Energy Conference (EPEC), London, ON, Canada, 26–28 October 2015; pp. 138–145.
- Benabou, R., and Tirole, J. (2010). Individual and corporate social responsibility, Economica 77 (1) (2010) 1–19.
- BNEF (Bloomberg New Energy Finance) (2024), China’s Clean Truck Surprise Defies the EV Slowdown Narrative. https://about.bnef.com/blog/chinas-clean-truck-surprise-defies-theev-slowdown-narrative/.
- Bocken, N.M., De Pauw, I., Bakker, C., and Van Der Grinten, B. (2016). Product design and business model strategies for a circular economy. J. Ind. Production Eng 33 (5), 308–320. [CrossRef]
- Bressanelli, G., Adrodegari, F., Perona, M., and Saccani, N. (2018). The role of digital technologies to overcome Circular Economy challenges in PSS Business Models: an exploratory case study, Procedia Cirp 73 (2018) 216–221.
- Brunnhofer, M., Gabriella, N., Schoggl, ¨ J.-P., Stern, T., and Posch, A., (2020). The biorefinery transition in the European pulp and paper industry—a three-phase Delphi study including a SWOT-AHP analysis. For. Pol. Econ. 110, 101882. [CrossRef]
- Cagno, E., Neri, A., Negri, M., Bassani, C.A., and Lampertico, T. (2021). The role of digital technologies in operationalizing the circular economy transition: a systematic literature review, Appl. Sci. 11 (8) (2021) 3328.
- Cattino, M., and Reckien, D. (2021). Does public participation lead to more ambitious and transformative local climate change planning? Current Opinion in Environmental Sustainability, Volume 52, 2021, Pages 100-110, ISSN 1877-3435, . [CrossRef]
- Che, L.; Shahidehpour, M.; Alabdulwahab, A.; Al-Turki, Y. (2015). Hierarchical Coordination of a Community Microgrid with AC and DC Microgrids. IEEE Trans. Smart Grid 2015, 6, 3042–3051.
- Chen, Y-H., Nie, P-Y., Wang, C., and Meng, Y. (2019). Effects of corporate social responsibility considering emission restrictions. Energy Strategy Reviews 24 (2019) 121–131; [CrossRef]
- De Angelis, R., Howard, M., and Miemczyk, J. (2018). Supply chain management and the circular economy: towards the circular supply chain. Prod. Plann. Control 29 (6), 425–437. [CrossRef]
- de Sousa Jabbour, A.B.L., Jabbour, C.J.C., Foropon, C., and Godinho Filho, M. (2018a). When titans meet–Can industry 4.0 revolutionize the environmentally-sustainable manufacturing wave? The role of critical success factors. Technol. Forecast. Soc. Change 132, 18–25. [CrossRef]
- de Sousa Jabbour, A.B.L., Jabbour, C.J.C., Godinho Filho, M., and Roubaud, D. (2018b). Industry 4.0 and the circular economy: a proposed research agenda and original roadmap for sustainable operations. Ann. Oper. Res. 270 (1), 273–286. [CrossRef]
- Dewri, K.; Hasan, M.; Uddin, M.R. (2023). IoT-based Energy Optimization and Demand Response System for Renewable Energy Integration. In Proceedings of the 2023 10th IEEE International Conference on Power Systems (ICPS), Cox’s Bazar, Bangladesh, 13–15 December 2023; pp. 1–5.
- Dewri, K.; Hasan, M.; Uddin, M.R. (2023). IoT-based Energy Optimization and Demand Response System for Renewable Energy Integration. In Proceedings of the 2023 10th IEEE International Conference on Power Systems (ICPS), Cox’s Bazar, Bangladesh, 13–15 December 2023; pp. 1–5.
- Donner, M., and de Vries, H. (2021). How to innovate business models for a circular bioeconomy? Bus. Strat. Environ. 30 (4), 1932–1947. [CrossRef]
- Flores, C.C., Bressers, H., Gutierrez, C., and de Boer, C. (2018). Towards circular economy—a wastewater treatment perspective, the Presa Guadalupe case. Manag. Res. Rev. [CrossRef]
- Folgado, F.J.; González, I.; Calderón, A.J. (2023). Data Acquisition and Monitoring System Framed in Industrial Internet of Things for PEM Hydrogen Generators. Internet Things 2023, 22, 100795.
- Garces-Ayerbe, C., Rivera-Torres, P., Su´ arez-Perales, I., and Hiz La, D.I.L.D. (2019). Is it possible to change from a linear to a circular economy? An overview of opportunities and barriers for European small and medium-sized enterprise companies. Int. J. Environ. Res. Publ. Health 16. [CrossRef]
- Goering, G.E. (2008). Welfare impacts of a non-profit firm in mixed commercial markets, Econ. Syst. 32 (4) (2008) 326–334.
- Hilser, H., Hiraldo, L., Moreau, C., Draiby, A., Cox, E., Andrews, M.G., Winks, L., and Walworth, N.G. (2024) Public engagement and collaboration for carbon dioxide removal: lessons from a project in the Dominican Republic. Front. Clim. 6:1290999. [CrossRef]
- Hina, M., Chauhan, C., Kaur, P., Kraus, S., and Dhiret, A. (2022). Drivers and barriers of circular economy business models: Where we are now, and where we are heading Journal of Cleaner Production 333 (2022) 130049; [CrossRef]
- Hopkinson, P., Zils, M., Hawkins, P., and Roper, S. (2018). Managing a complex global circular economy business model: opportunities and challenges. Calif. Manag. Rev. 60 (3), 71–94. [CrossRef]
- IEA (2020), Energy Technology Perspectives 2020 – Special Report on Clean Energy Innovation. Directorate of Sustainability, Technology and Outlooks, International Energy Agency, 9, rue de la Fédération, 75739 Paris Cedex 15, France; https://www.iea.org/reports/clean-energy-innovation.
- IEA (2021). The potential of behavioural interventions for optimising energy use at home. https://www.iea.org/articles/the-potential-of-behavioural-interventions-for-optimising-energy-use-at-home (accessed 02 November 204).
- IEA (2022), Empowering people to act: How awareness and behaviour campaigns can enable citizens to save energy during and beyond today’s energy crisis, IEA, Paris https://www.iea.org/commentaries/empowering-people-to-act-how-awareness-and-behaviour-campaigns-can-enable-citizens-to-save-energy-during-and-beyond-today-s-energy-crisis (accessed 04 November 2024).
- IEA (2024b). Clean Energy Innovation Policies in Emerging and Developing Economies. International Energy Agency; Directorate of Sustainability, Technology and Outlooks, International Energy Agency, 9, rue de la Fédération, 75739 Paris Cedex 15, France; Website: www.iea.org.
- IEA, International Energy Agency, (2024a). World Energy Outlook. Directorate of Sustainability, Technology and Outlooks, International Energy Agency, 9, rue de la Fédération, 75739 Paris Cedex 15, France; Website: www.iea.org/weo. https://www.iea.org/energy-system/carbon-capture-utilisation-and-storage (accessed 16 October 2024).
- IRENA, 2106. The International Renewable Energy Agency and the International Energy Agency Photovoltaic Power Systems Programme, End-of-Life Management: Solar Photovoltaic Panels, 2016: https://www.irena .org/-/media/Files/IRENA/Agency/Publication/2016/ IRENA_IEAPVPS_End-of-Life_Solar_PV_Panels_2016.pdf.
- Jabbour, C.J.C., de Sousa Jabbour, A.B.L., Sarkis, J., and Godinho Filho, M. (2019). Unlocking the circular economy through new business models based on large-scale data: an integrative framework and research agenda. Technol. Forecast. Soc. Change 144, 546–552. [CrossRef]
- Jia, L., Li, Z., and Hu, Z. (2024). Applications of the Internet of Things in Renewable Power Systems: A Survey. August 2024. Energies 17(16):4160. [CrossRef]
- Katuri, K.; Somalal, J.; Kumar, R.S.; Kumar, B.H.; Chandrika, V.S.; Kishore, Y.K. (2023). Monitoring and Controlling of Solar Driven Real Time Smart Energy Management System Integrated with IoT Devices. In Proceedings of the 2023 Second International Conference on Trends in Electrical, Electronics, and Computer Engineering (TEECCON), Bangalore, India, 23–24 August 2023; pp. 347–352.
- Kazancoglu, I., Kazancoglu, Y., Yarimoglu, E., and Kahraman, A. (2020). A conceptual framework for barriers of circular supply chains for sustainability in the textile industry. Sustain. Dev. 28 (5), 1477–1492. [CrossRef]
- Kazancoglu, I., Kazancoglu, Y., Yarimoglu, E., and Kahraman, A. (2020). A conceptual framework for barriers of circular supply chains for sustainability in the textile industry. Sustain. Dev. 28 (5), 1477–1492. [CrossRef]
- Kazancoglu, I., Sagnak, M., Kumar Mangla, S., and Kazancoglu, Y. (2021). Circular economy and the policy: a framework for improving the corporate environmental management in supply chains. Bus. Strat. Environ. 30 (1), 590–608. [CrossRef]
- Kirchherr, J., Piscicelli, L., Bour, R., Kostense-Smit, E., Muller, J., HuibrechtseTruijens, A., and Hekkert, M. (2018). Barriers to the circular economy: evidence from the European union (EU). Ecol. Econ. 150, 264–272. [CrossRef]
- Kirchherr, J., Piscicelli, L., Bour, R., Kostense-Smit, E., Muller, J., HuibrechtseTruijens, A., and Hekkert, M. (2018). Barriers to the circular economy: evidence from the European union (EU). Ecol. Econ. 150, 264–272. [CrossRef]
- Kopel, M., and Brand, B. (2012). Socially Responsible Firms and Endogenous Choice of Strategic Incentives (January 11, 2012). Economic Modelling, Vol. 29, 2012, Available at SSRN: https://ssrn.com/abstract=2034207.
- Kumar, S., Raut, R.D., Nayal, K., Kraus, S., Yadav, V.S., and Narkhede, B.E. (2021). To identify industry 4.0 and circular economy adoption barriers in the agriculture supply chain by using ISM-ANP. J. Clean. Prod. 293, 126023. [CrossRef]
- Kumar, V., Sezersan, I., Garza-Reyes, J.A., Gonzalez, E.D., and Moh’d Anwer, A.-S. (2019). Circular economy in the manufacturing sector: benefits, opportunities and barriers. Manag. Decis. [CrossRef]
- Kumar, V., Sezersan, I., Garza-Reyes, J.A., Gonzalez, E.D., and Moh’d Anwer, A.-S. (2019). Circular economy in the manufacturing sector: benefits, opportunities and barriers. Manag. Decis. [CrossRef]
- Linder, M., and Williander, M. (2017). Circular business model innovation: inherent uncertainties. Bus. Strat. Environ. 26 (2), 182–196. [CrossRef]
- MacArthur Ellen, How the Circular Economy Tackles Climate Change, vol. 1, 2019, pp. 1–71.
- Mckinsey Company (2013). https://www.mckinsey.de/~/media/mckinsey/industries/electric%20power%20and%20natural%20gas/our%20insights/giving%20us%20energy%20efficiency%20a%20jolt/sizing%20the%20potential%20of%20behavioral%20energy%20efficiency%20initiatives%20in%20the%20us%20residential%20market.pdf (accessed 02 November 2024).
- Merli, R., and Preziosi, M. (2018). The EMAS impasse: factors influencing Italian organizations to withdraw or renew the registration. J. Clean. Prod. 172, 4532–4543. [CrossRef]
- Mohamed, A.M.O. (2024b) Enhancing radioactive waste management with cutting-edge digital technologies. Academia Engineering 2024;1. [CrossRef]
- Mohamed, A.M.O. (2024c) Sustainable recovery of silver nanoparticles from electronic waste: Applications and safety concerns. Review Article. Academia Engineering, 1(3), 1-17. [CrossRef]
- Mohamed, A.M.O., El Gamal, M.M., and Hameedi, S. (2022) Sustainable Utilization of Carbon Dioxide in Waste Management: Moving Toward Reducing Environmental Impact. Elsevier; ISBN 9780128234181, 606p.https://www.elsevier.com/books/sustainable-utilization-of-carbon-dioxide-in-waste-management/mohamed/978-0-12-823418-1.
- Mohamed, A.M.O., Maraqa, M., Howari, F.M., and Paleologos, E.K. (2021a) Outdoor Air Pollutants: Sources, Characteristics, and Impacts on Human Health and the Environment. Chapter 9. In Mohamed, A.M.O., Paleologos, E., and Howari, F. (2021) Pollution Assessment for Sustainable Practices in Applied Sciences and Engineering. [CrossRef]
- Mohamed, A.M.O., Paleologos, E., and Howari, F. (2021b) Pollution Assessment for Sustainable Practices in Applied Sciences and Engineering. Elsevier, 1138p., ISBN: 978-0-12-809582-9.
- Mohamed, A.M.O., Paleologos, E.K. (2018) Fundamentals of Geo-environmental Engineering: Understanding Soil, Water, and Pollutant Interaction and Transport. Elsevier, USA, imprint: Butterworth- Heinemann, eBook ISBN: 9780128051450; Paperback ISBN: 9780128048306; 708p.
- Mohamed, A.-M.O.; Mohamed, D.; Fayad, A.; Al Nahyan, M.T. (2024a) Enhancing decision making and decarbonation in environmental management: A review on the role of digital technologies. Sustainability 2024, 16, 7156. [CrossRef]
- Narimissa, O., Kangarani-Farahani, A., and Molla-Alizadeh-Zavardehi, S. (2020). Drivers and barriers for implementation and improvement of sustainable supply chain management. Sustain. Dev. 28 (1), 247–258. [CrossRef]
- Nußholz, J.L.K. (2018). A circular business model mapping tool for creating value from prolonged product lifetime and closed material loops. J. Clean. Prod. 197 . [CrossRef]
- Oghazi, P., and Mostaghel, R. (2018). Circular business model challenges and lessons learned—an industrial perspective. Sustainability 10 (3), 739. [CrossRef]
- Olsson, L., Fallahi, S., Schnurr, M., Diener, D., and Van Loon, P. (2018). Circular business models for extended EV battery life. Batteries 4 (4), 57. [CrossRef]
- Ormazabal, M., Prieto-Sandoval, V., Puga-Leal, R., and Jaca, C. (2018). Circular economy in Spanish SMEs: challenges and opportunities. J. Clean. Prod. 185, 157–167. [CrossRef]
- Oyejobi, D.O., Firoozi, A.A., Fernandez, D.B., and Avudaiappan, S. (2024). Integrating circular economy principles into concrete technology: Enhancing sustainability through industrial waste utilization. Results in Engineering 24 (2024) 102846; [CrossRef]
- Paleologos, E.K., Mohamed, A.M.O., Mohamed, D. , Fayad, A., Al Nahayan, M., and Singh, D.N. (2024b) “Decarbonization Advances and Challenges in the Waste Industry and Soil Remediation” submitted to Environmental Geotechnics J., Submitted July 2024.
- Paleologos, E.K., Mohamed, A.M.O., Mohamed, D., Al Nahayan, M., Farouk, S., and Singh, D.N. (2024a) “Decarbonization of the Waste Industry in U.S.A. and the European Union” Sustainability J., Preprint. [CrossRef]
- Paleologos, E.K., Mohamed, A.M.O., Singh, D.N., O’Kelly, B.C., El Gamal, M., Mohammad, a., Singh, p., Goli, V.S.N.S Roque, A.J., Oke, J.A., Abuel-Naga, H., and Leong, E-C (2024c) Sustainability Challenges of Critical Minerals for Clean Energy Technologies: Copper and Rare Earths. Environmental Geotechnics J. [CrossRef]
- Paleologos, K.E., Selim, M.Y.E., and Mohamed, A.M.O., (2021) Indoor Air Quality: Pollutants, Health Effects, and Regulations. Chapter 8. In Mohamed, A.M.O., Paleologos, E., and Howari, F. (2021) Pollution Assessment for Sustainable Practices in Applied Sciences and Engineering. [CrossRef]
- Patwa, N., Sivarajah, U., Seetharaman, A., Sarkar, S., Maiti, K., and Hingorani, K. (2021). Towards a circular economy: an emerging economies context. J. Bus. Res. 122, 725–735. [CrossRef]
- Ravikumar, N.V.A.; Nuvvula, R.S.S.; Kumar, P.P.; Haroon, N.H.; Butkar, U.D.; Siddiqui, A. (2023). Integration of Electric Vehicles, Renewable Energy Sources, and IoT for Sustainable Transportation and Energy Management: A Comprehensive Review and Future Prospects. In Proceedings of the 2023 12th International Conference on Renewable Energy Research and Applications (ICRERA), Oshawa, ON, Canada, 29 August–1 September 2023; pp. 505–511.
- Repnikov, A.; Yakovlev, A.; Kukhtik, M. (2023). Development of an Automated Control System for Supply and Exhaust Ventilation of the High-Voltage Frequency Converter Room. In Proceedings of the 2023 International Conference on Industrial Engineering, Applications and Manufacturing (ICIEAM), Sochi, Russia, 15–19 May 2023; pp. 780–784.
- Rizos, V., Behrens, A., Van der Gaast, W., Hofman, E., Ioannou, A., Kafyeke, T., Flamos, A., Rinaldi, R., Papadelis, S., Hirschnitz-Garbers, M., and Topi, C. (2016). Implementation of circular economy business models by small and medium-sized enterprises (SMEs): Barriers and enablers. Sustainability, 8(11), p.1212; [CrossRef]
- Roque, A.J, Paleologos, E.K., O’ Kelly, B.C., Tang, A.M., Reddy, K.R., Vitone, C., Mohamed, A.M.O., Koda, E., Goli, V.S.N.S., Vieira, C.S., Fei, X., Sollecito, F., Vaverková, M.D., Plötze, M., Petti, R., Podlasek, A., Puzrin, A.M., Cotecchia, F., Osiński, P., Mohammad, A., Singh, P., El-Gamal, M.M., Farouk, S., Al Nahyan, M.T., Mickovski, S.B., Singh, D.N. (2022) “Sustainable Environmental Geotechnics Practices for Green Economy,” Environmental Geotechnics 9(2): 68–84, . [CrossRef]
- Sachar, S., Das, S., Emhoff, K., Goenka, A., Haig, K., Pattanaik, S., Uchin, M. (2019). “White Paper on Behavioural Energy Efficiency Potential for India.” New Delhi: Alliance for an Energy Efficient Economy (AEEE). https://www.oracle.com/a/ocom/docs/industries/utilities/behavioural-energy-efficiency-wp.pdf (accessed 02 November 2024).
- SEAI, Sustainable Energy Authority of Ireland (2020). Home Energy Events Leveraging peer effects to increase the installation of energy efficiency measures in Ireland. https://www.seai.ie/sites/default/files/publications/SEAI-Home-Energy-Events-Evaluation-Report.pdf (accessed 04 November 2024).
- Shao, J., Huang, S., Lemus-Aguilar, I., and Ünal, E. (2019). Circular business models generation for automobile remanufacturing industry in China: barriers and opportunities. J. Manuf. Technol. Manag. [CrossRef]
- Sousa-Zomer, T.T., Magalh˜ aes, L., Zancul, E., and Cauchick-Miguel, P.A. (2018). Exploring the challenges for circular business implementation in manufacturing companies: an empirical investigation of a pay-per-use service provider. Resour. Conserv. Recycl. 135, 3–13. [CrossRef]
- Speirs, J., and Contestabile, M. (2018). The Future of Lithium Availability for Electric Vehicle Batteries. In: Pistoia, G., Liaw, B. (eds) Behaviour of Lithium-Ion Batteries in Electric Vehicles. Green Energy and Technology. Springer, Cham. [CrossRef]
- Tran, Q.T.; Roose, L.; Nguyen, N.Q.; Van, B.D.; Zizzo, G.; Sanseverino, E.R. (2023). The Possibility of Applying Combined Heat and Power Microgrid Model for Industrial Parks. A Case Study for Dong Nam Industrial Park in Vietnam. In Proceedings of the 2023 IEEE/IAS 59th Industrial and Commercial Power Systems Technical Conference (I&CPS), Las Vegas, NV, USA, 21–25 May 2023; pp. 1–5.
- Tura et al., 2019; Tura, N., Hanski, J., Ahola, T., Ståhle, M., Piiparinen, S., and Valkokari, P. (2019). Unlocking circular business: a framework of barriers and drivers. J. Clean. Prod. 212, 90–98. [CrossRef]
- Tura, N., Hanski, J., Ahola, T., Ståhle, M., Piiparinen, S., and Valkokari, P. (2019). Unlocking circular business: a framework of barriers and drivers. J. Clean. Prod. 212, 90–98. [CrossRef]
- Umicore (2019). Battery recycling: Audi and Umicore start closed loop for cobalt and nickel. https://www.umicore.com/en/media/press/battery-recycling-audi-and-umicore-start-closed-loop-for-cobalt-and-nickel (accessed 19 November 2024).
- UN Climate Change (2024). Greenhouse Gas Inventory Data - Comparison by Category. https://di.unfccc.int/comparison_by_category?_gl=1*1iql32j*_ga*NTcwNjExMjA1LjE3Mjk2NjI5MjA.*_ga_7ZZWT14N79*MTcyOTY2MjkyMS4xLjEuMTcyOTY2Mjk3Mi4wLjAuMA accessed 05 November 2024).
- Upadhyay, A., Kumar, A., and Akter, S. (2021). An analysis of UK retailers’ initiatives towards circular economy transition and policy-driven directions. Clean Technol. Environ. Policy 1–9. [CrossRef]
- US DOE (Department of Energy) (2016). Customer Acceptance, Retention, and Response to Time-Based Rates from the Consumer Behavior Studies. https://www.energy.gov/sites/prod/files/2016/12/f34/CBS_Final_Program_Impact_Report_Draft_20161101_0.pdf (accessed 04 November 2024).
- Vermunt, D.A., Negro, S.O., Verweij, P.A., Kuppens, D.V., and Hekkert, M.P. (2019). Exploring barriers to implementing different circular business models. J. Clean. Prod. 222, 891–902.
- Vermunt, D.A., Negro, S.O., Verweij, P.A., Kuppens, D.V., and Hekkert, M.P. (2019). Exploring barriers to implementing different circular business models. J. Clean. Prod. 222, 891–902.
- World Economic Forum (2022). 3 ways the circular economy is vital for the energy transition https://www.weforum.org/stories/2022/02/3-ways-circular-economy-renewables-energy-transition/.
- Wrålsen, B., Prieto-Sandoval, V., Mejia-Villa, A., O’Born, R., Hellstrom, M., and Faessler, B. (2021). Circular business models for lithium-ion batteries - Stakeholders, barriers, and drivers. Journal of Cleaner Production 317 (2021) 128393; [CrossRef]
- Yan, R. , X., and Zhu, X. (2022). The Impact of Corporate Social Responsibility on Sustainable Innovation: A Case in China’s Heavy Pollution Industry. Front. Psychol., 04 July 2022; Volume 13 – 2022. [CrossRef]
- Yang, Y., Okonkwo, E.G., Huang, G., Xu, S., Sun, W., and He, Y. (2021). On the sustainability of lithium ion battery industry – a review and perspective. Energy Storage Mater 36, 186–212. [CrossRef]
- Zedak, C.; Belfqih, A.; Boukherouaa, J.; Lekbich, A.; El Mariami, F. (2021). Photovoltaic and Battery Systems Control and Monitoring for Energy Management using IoT. In Proceedings of the 2021 9th International Renewable and Sustainable Energy Conference (IRSEC), Tetouan, Morocco, 23–27 November 2021; pp. 1–6.
- Zhou, W., Zhu, J., and Zhang, C. (2023). Impact of corporate social responsibility on carbon emission reduction in supply chains. Chinese Management Studies, 18(7); https://www.emerald.com/insight/1750-614X.htm. [CrossRef]
- Zhu, X., Li, D., Zhu, S., and Ting, S.A. (2024). Is smart city low-carbon? Evidence from China. Heliyon 10 (2024) e35569; [CrossRef]
Figure 1.
Total carbon dioxide emissions and per capita in various countries and regions from different worldwide locations, 2023.
Figure 1.
Total carbon dioxide emissions and per capita in various countries and regions from different worldwide locations, 2023.
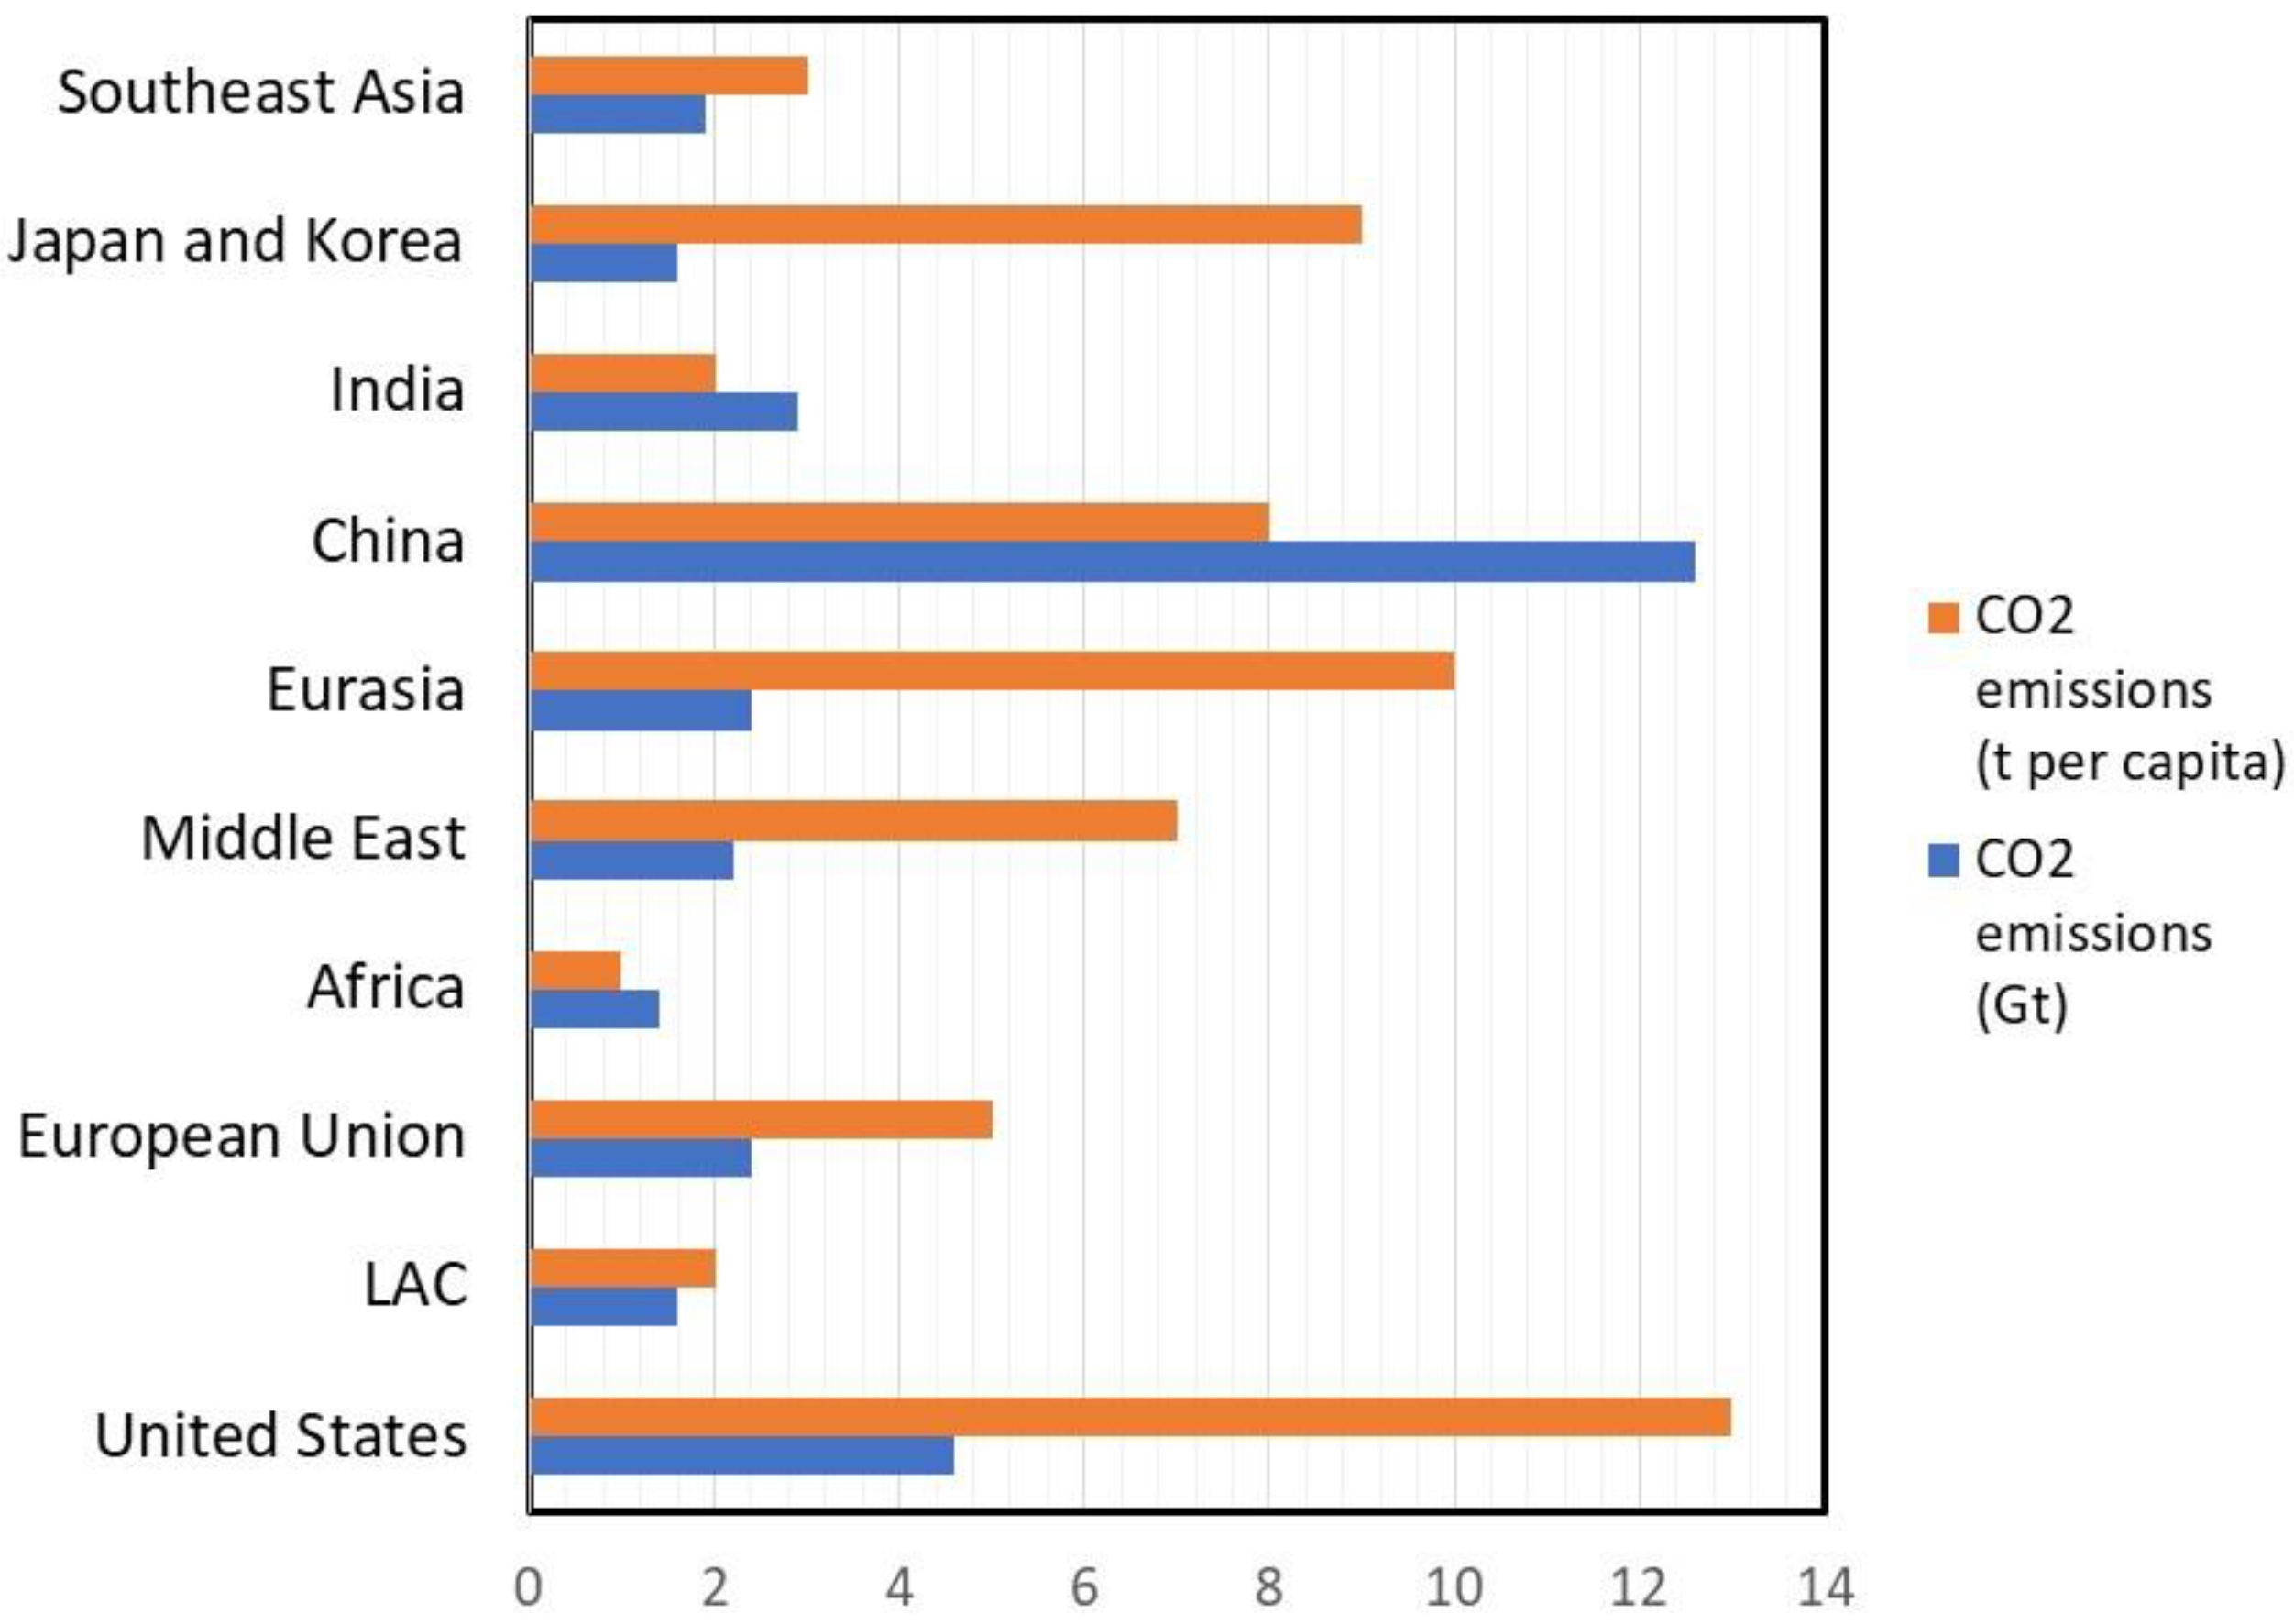
Figure 2.
Conceptual design of the environmental management and decarbonization nexus.
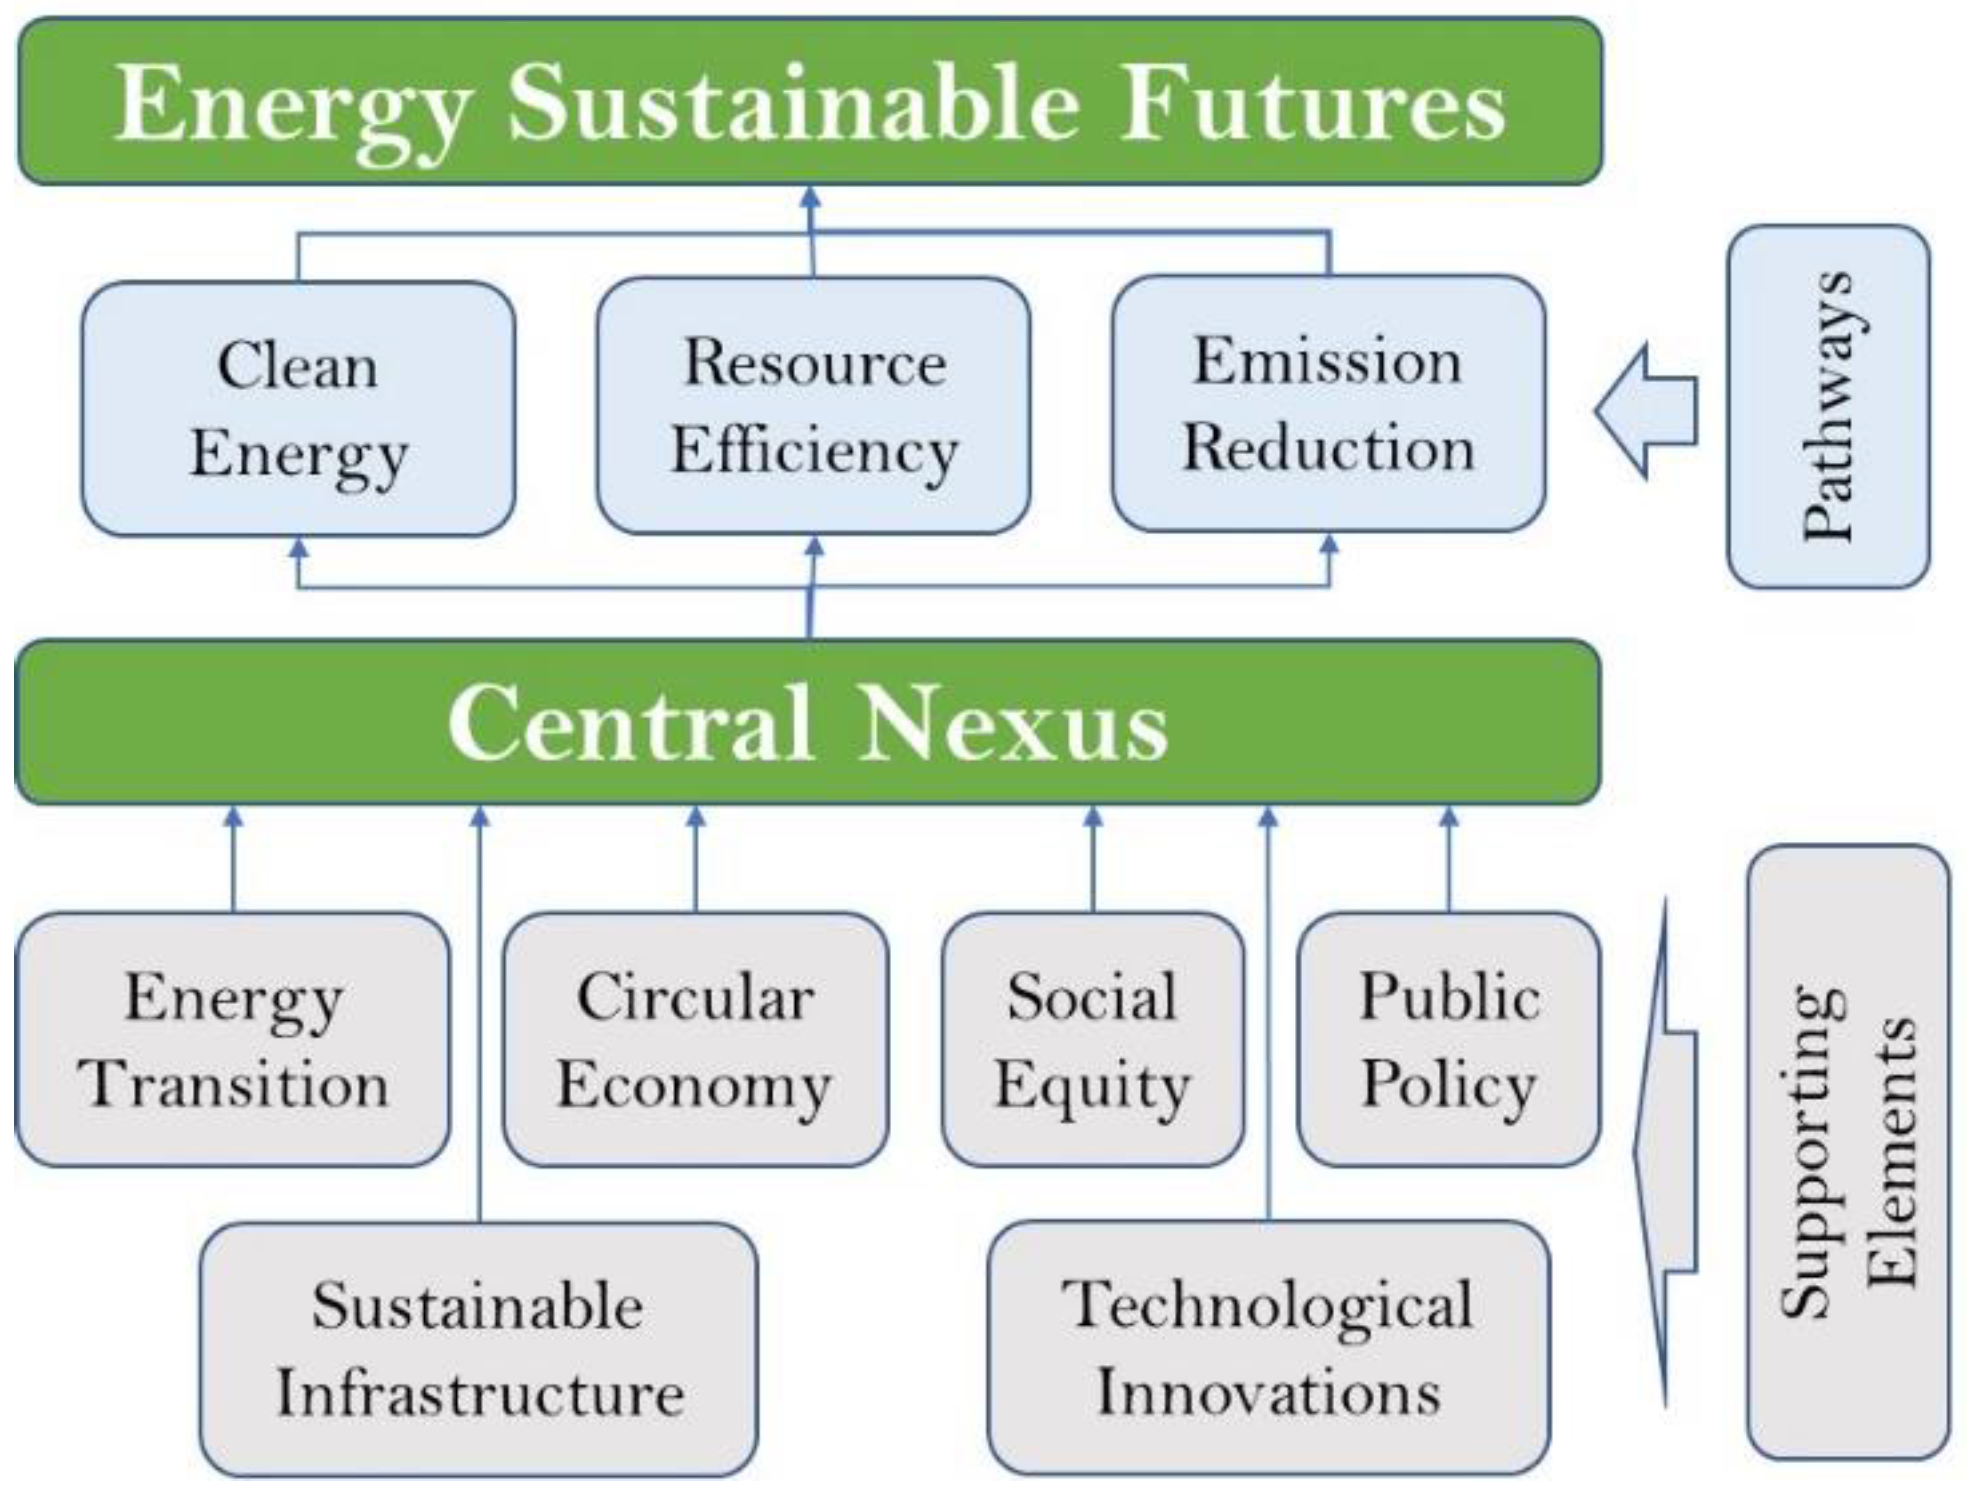
Figure 3.
Interaction between environmental management and decarbonation.
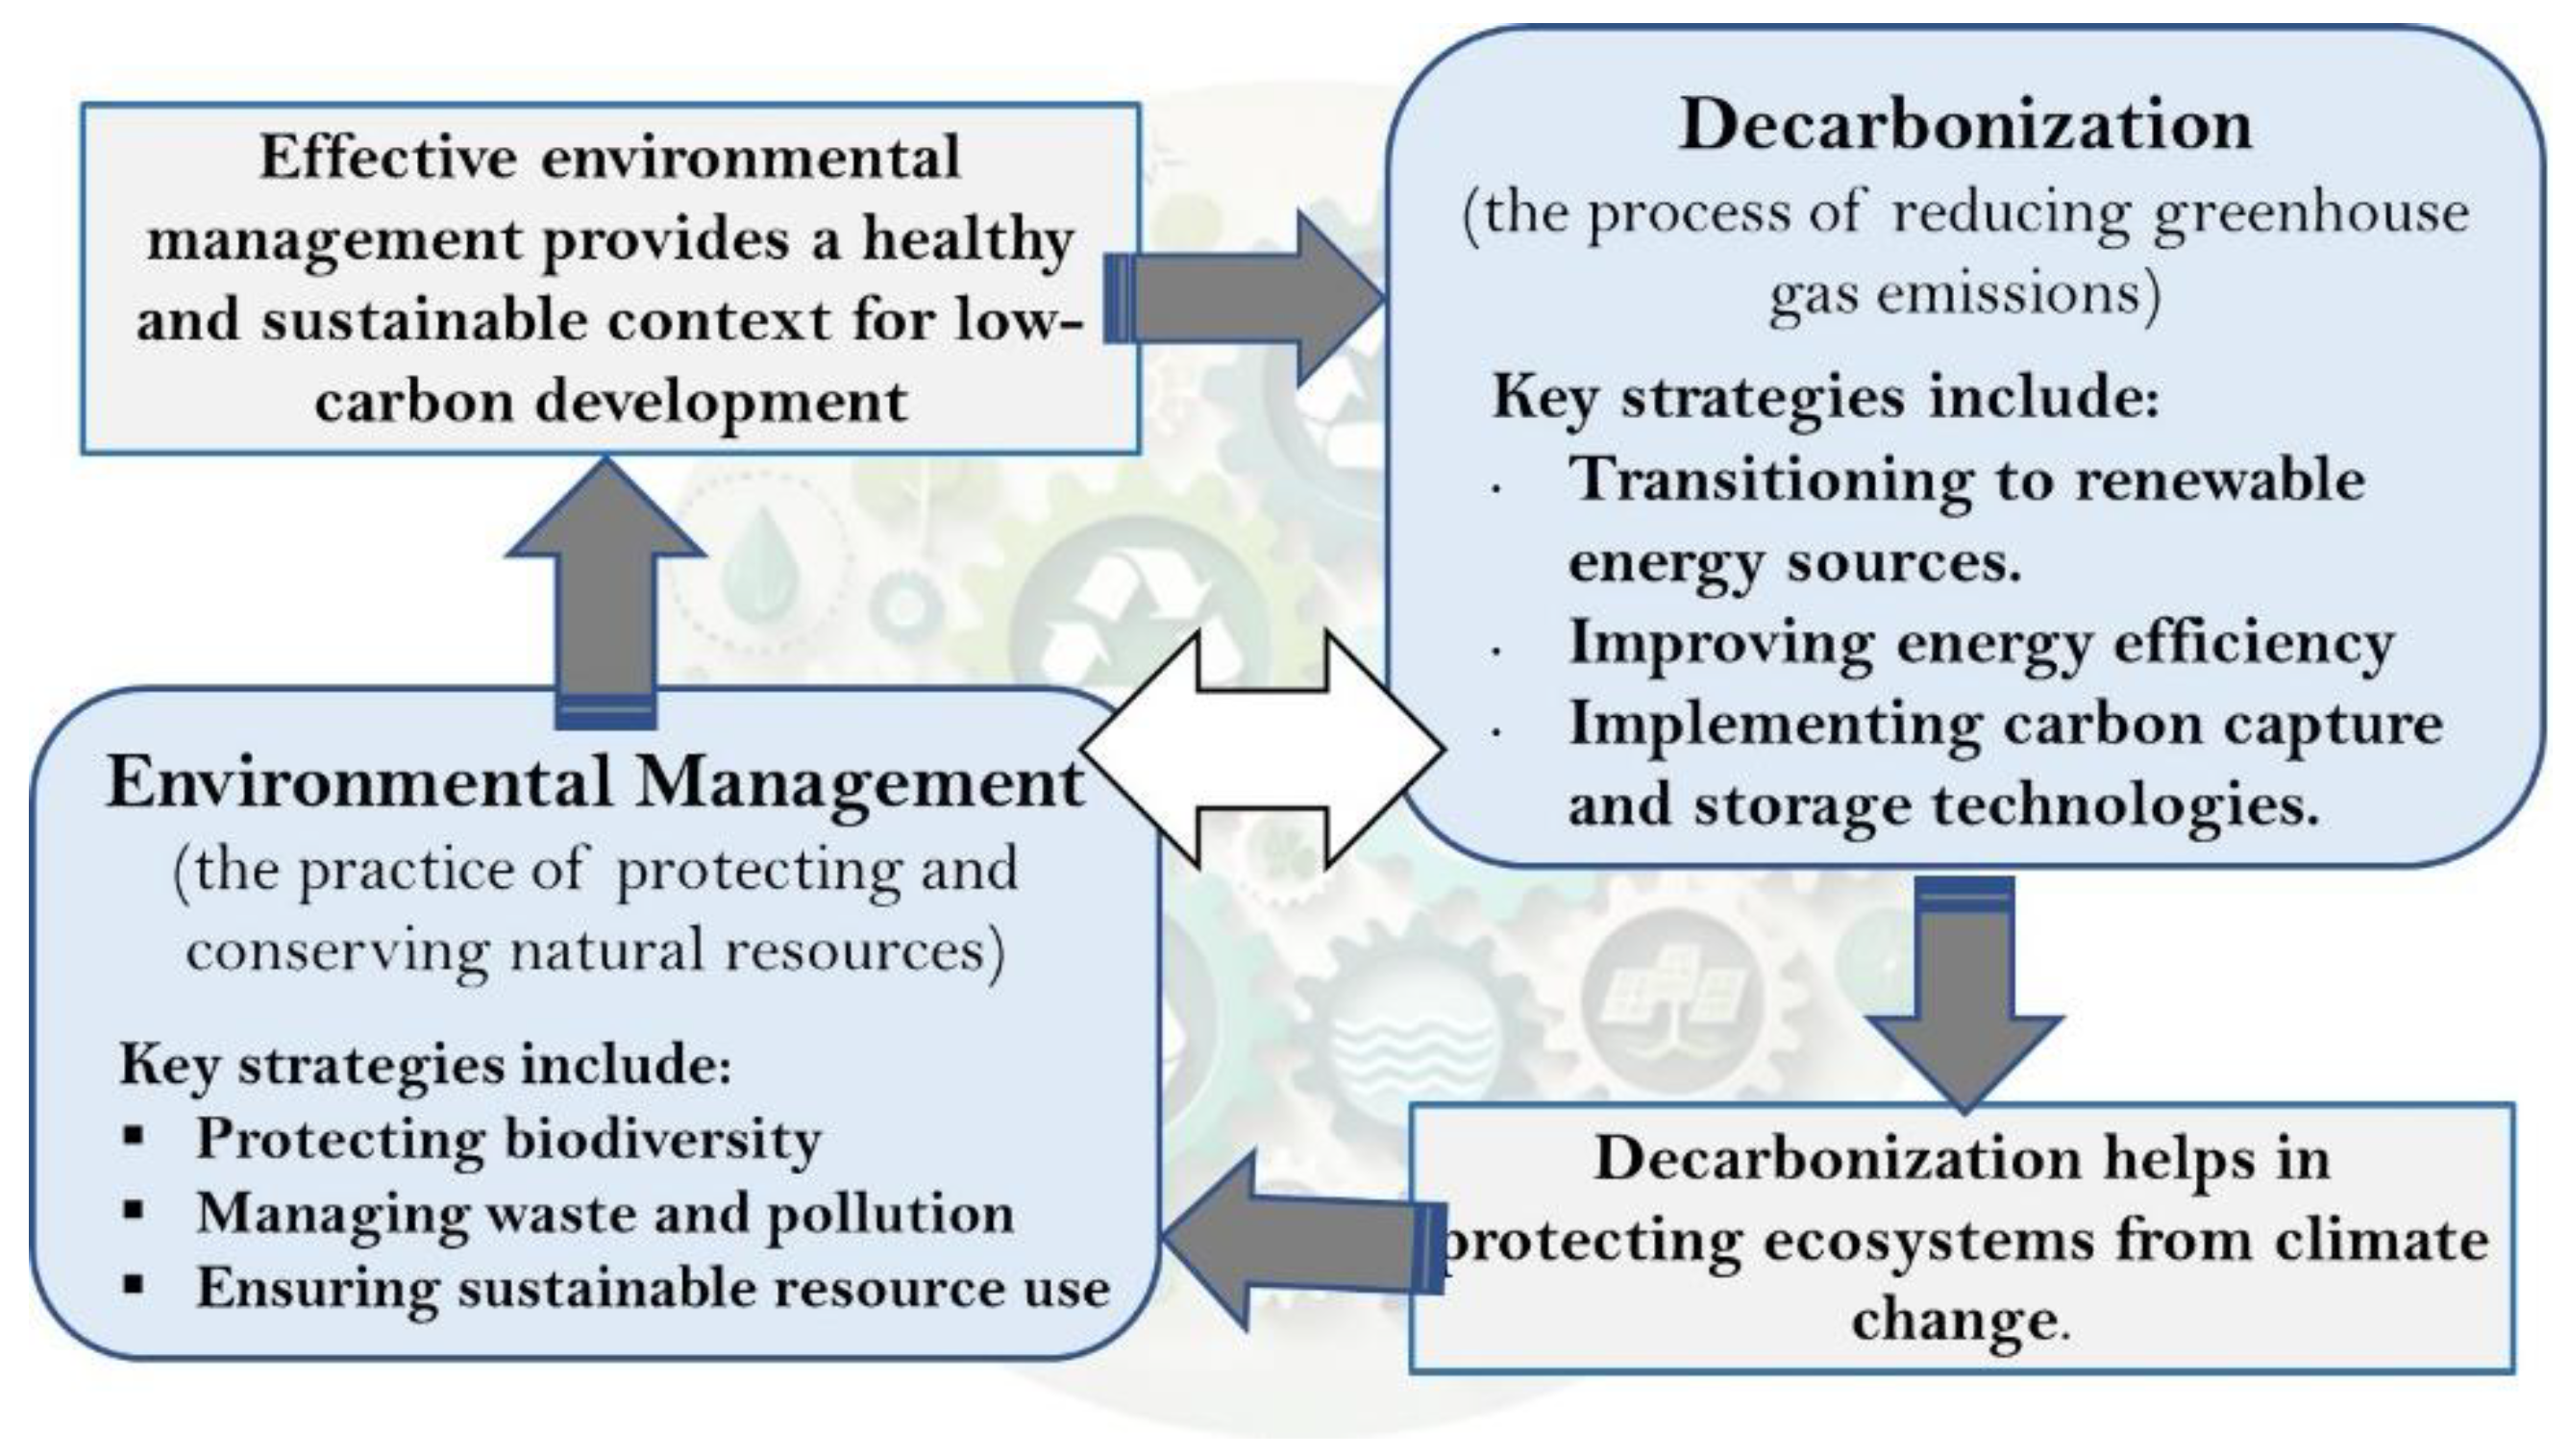
Figure 4.
Environmental management decarbonation nexus.
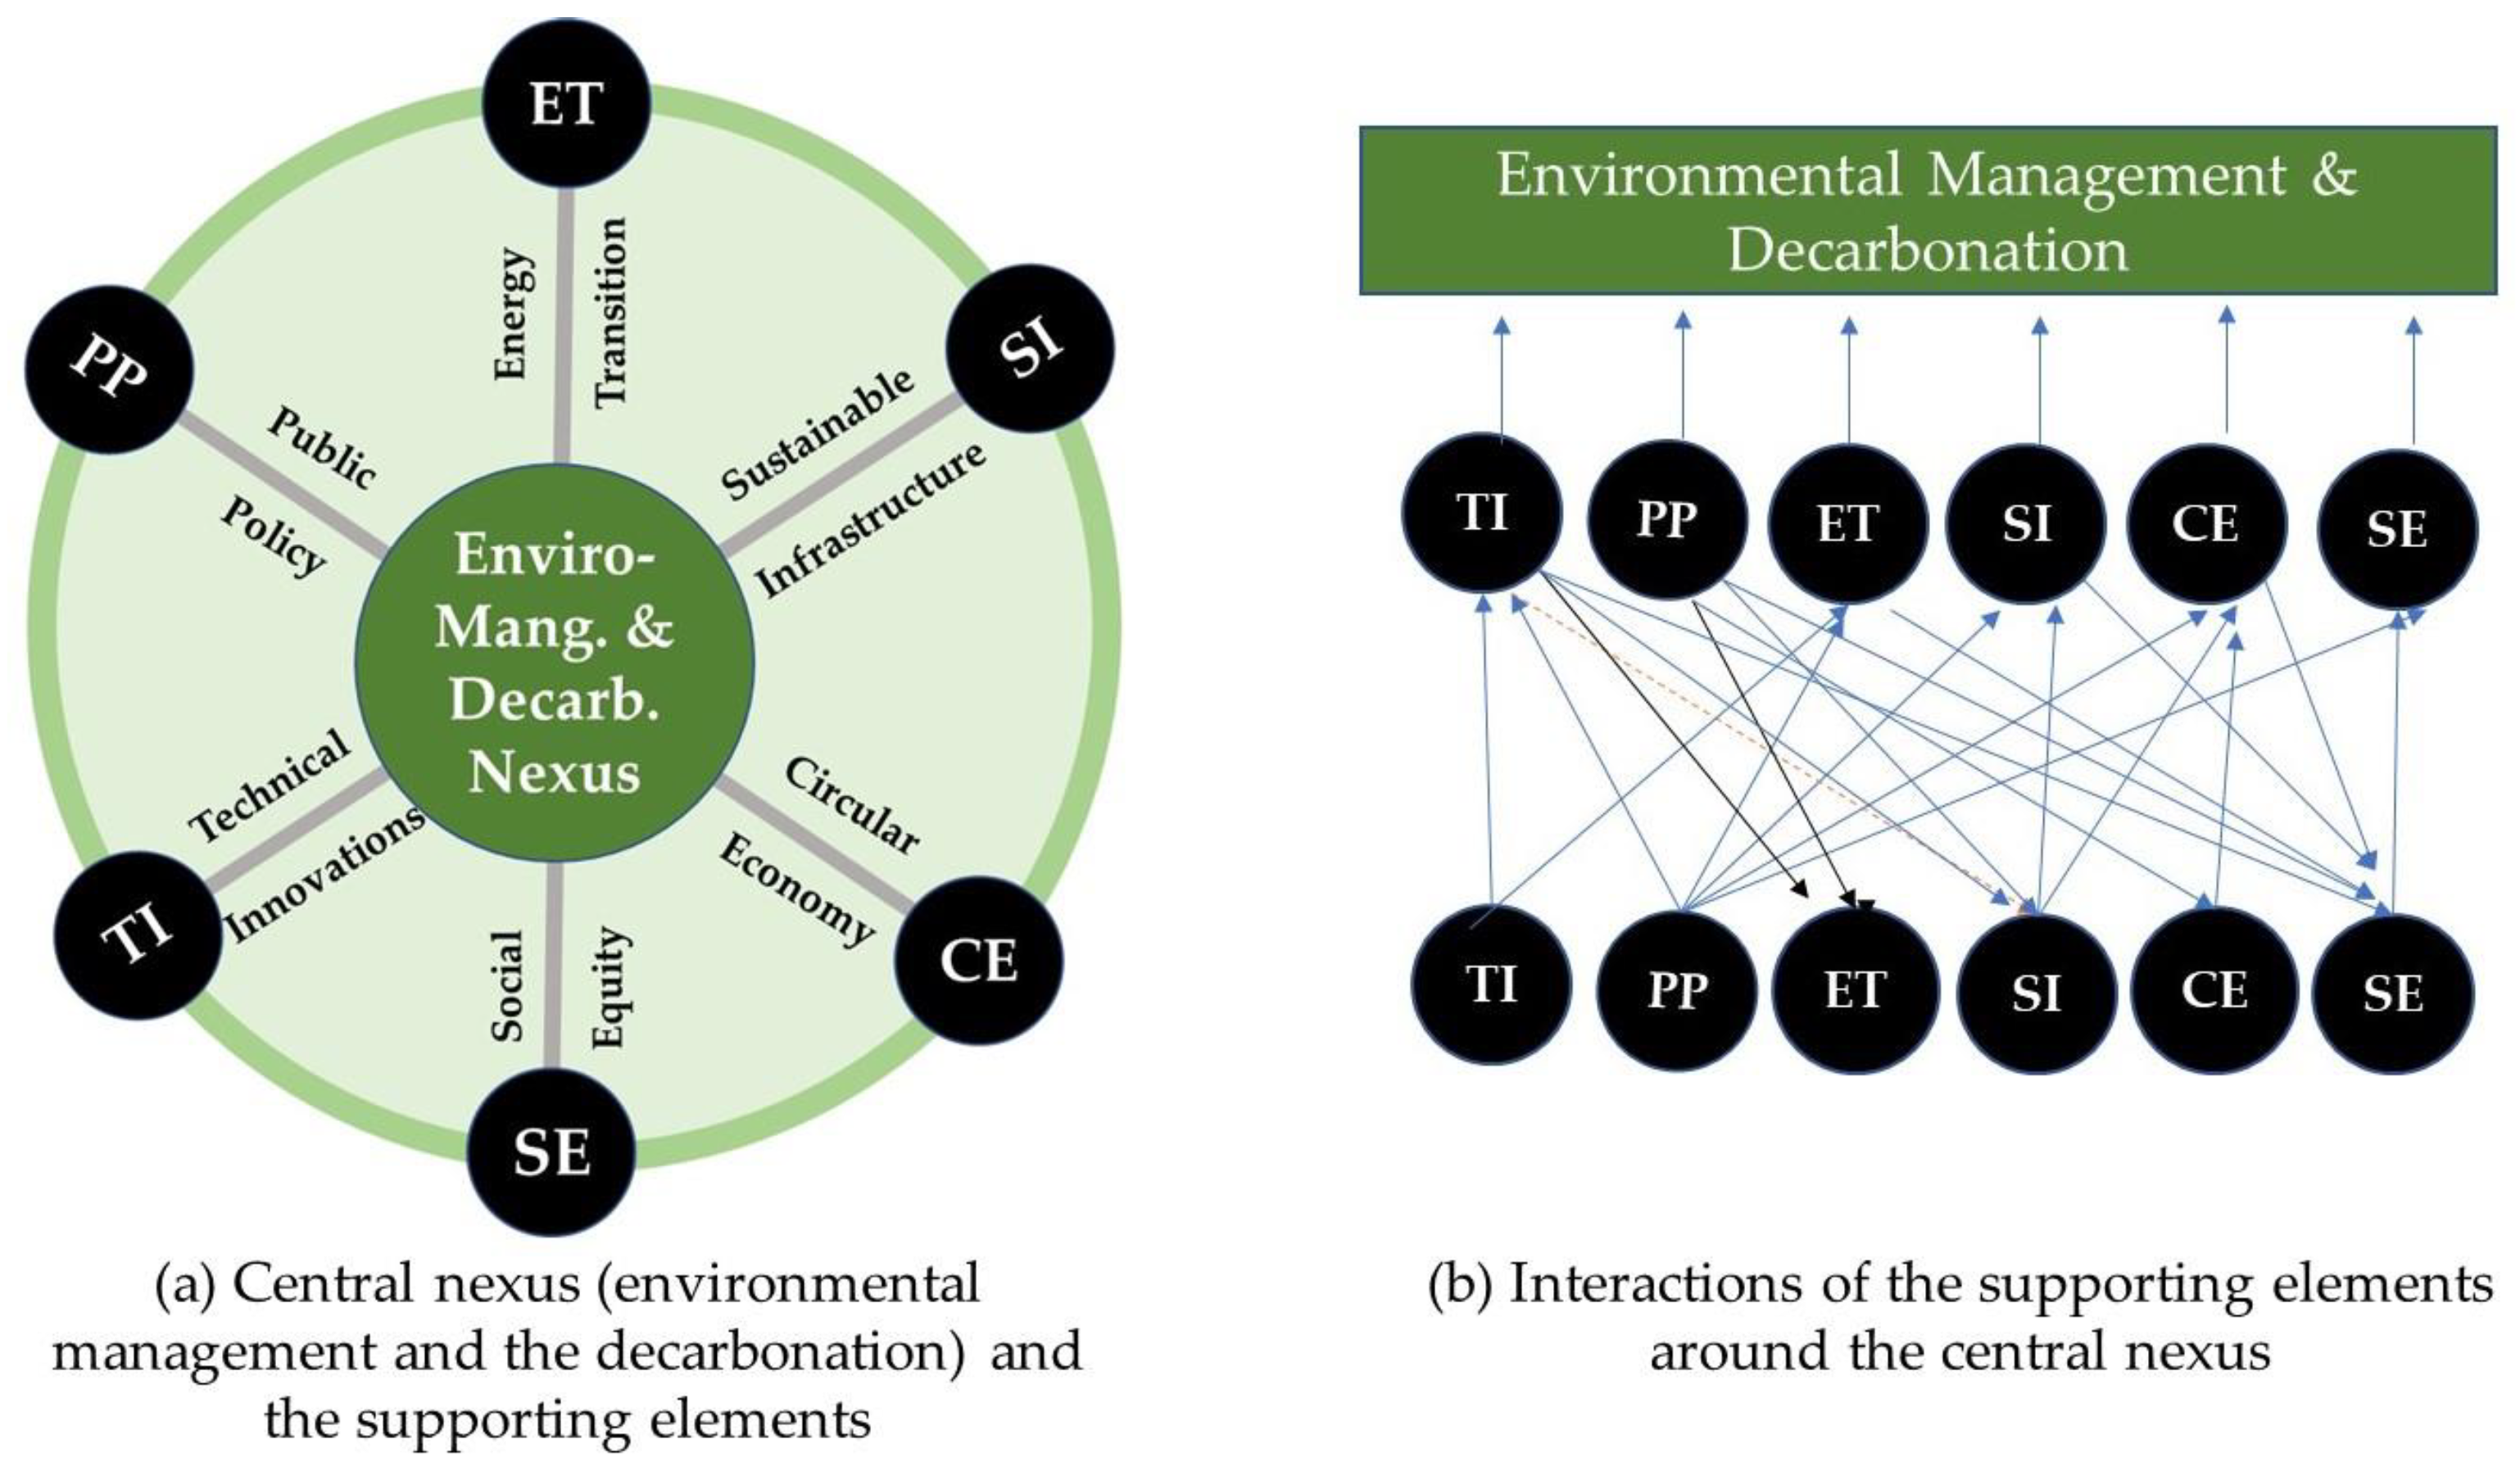
Figure 5.
Key pathways from the central nexus toward the sustainable futures.
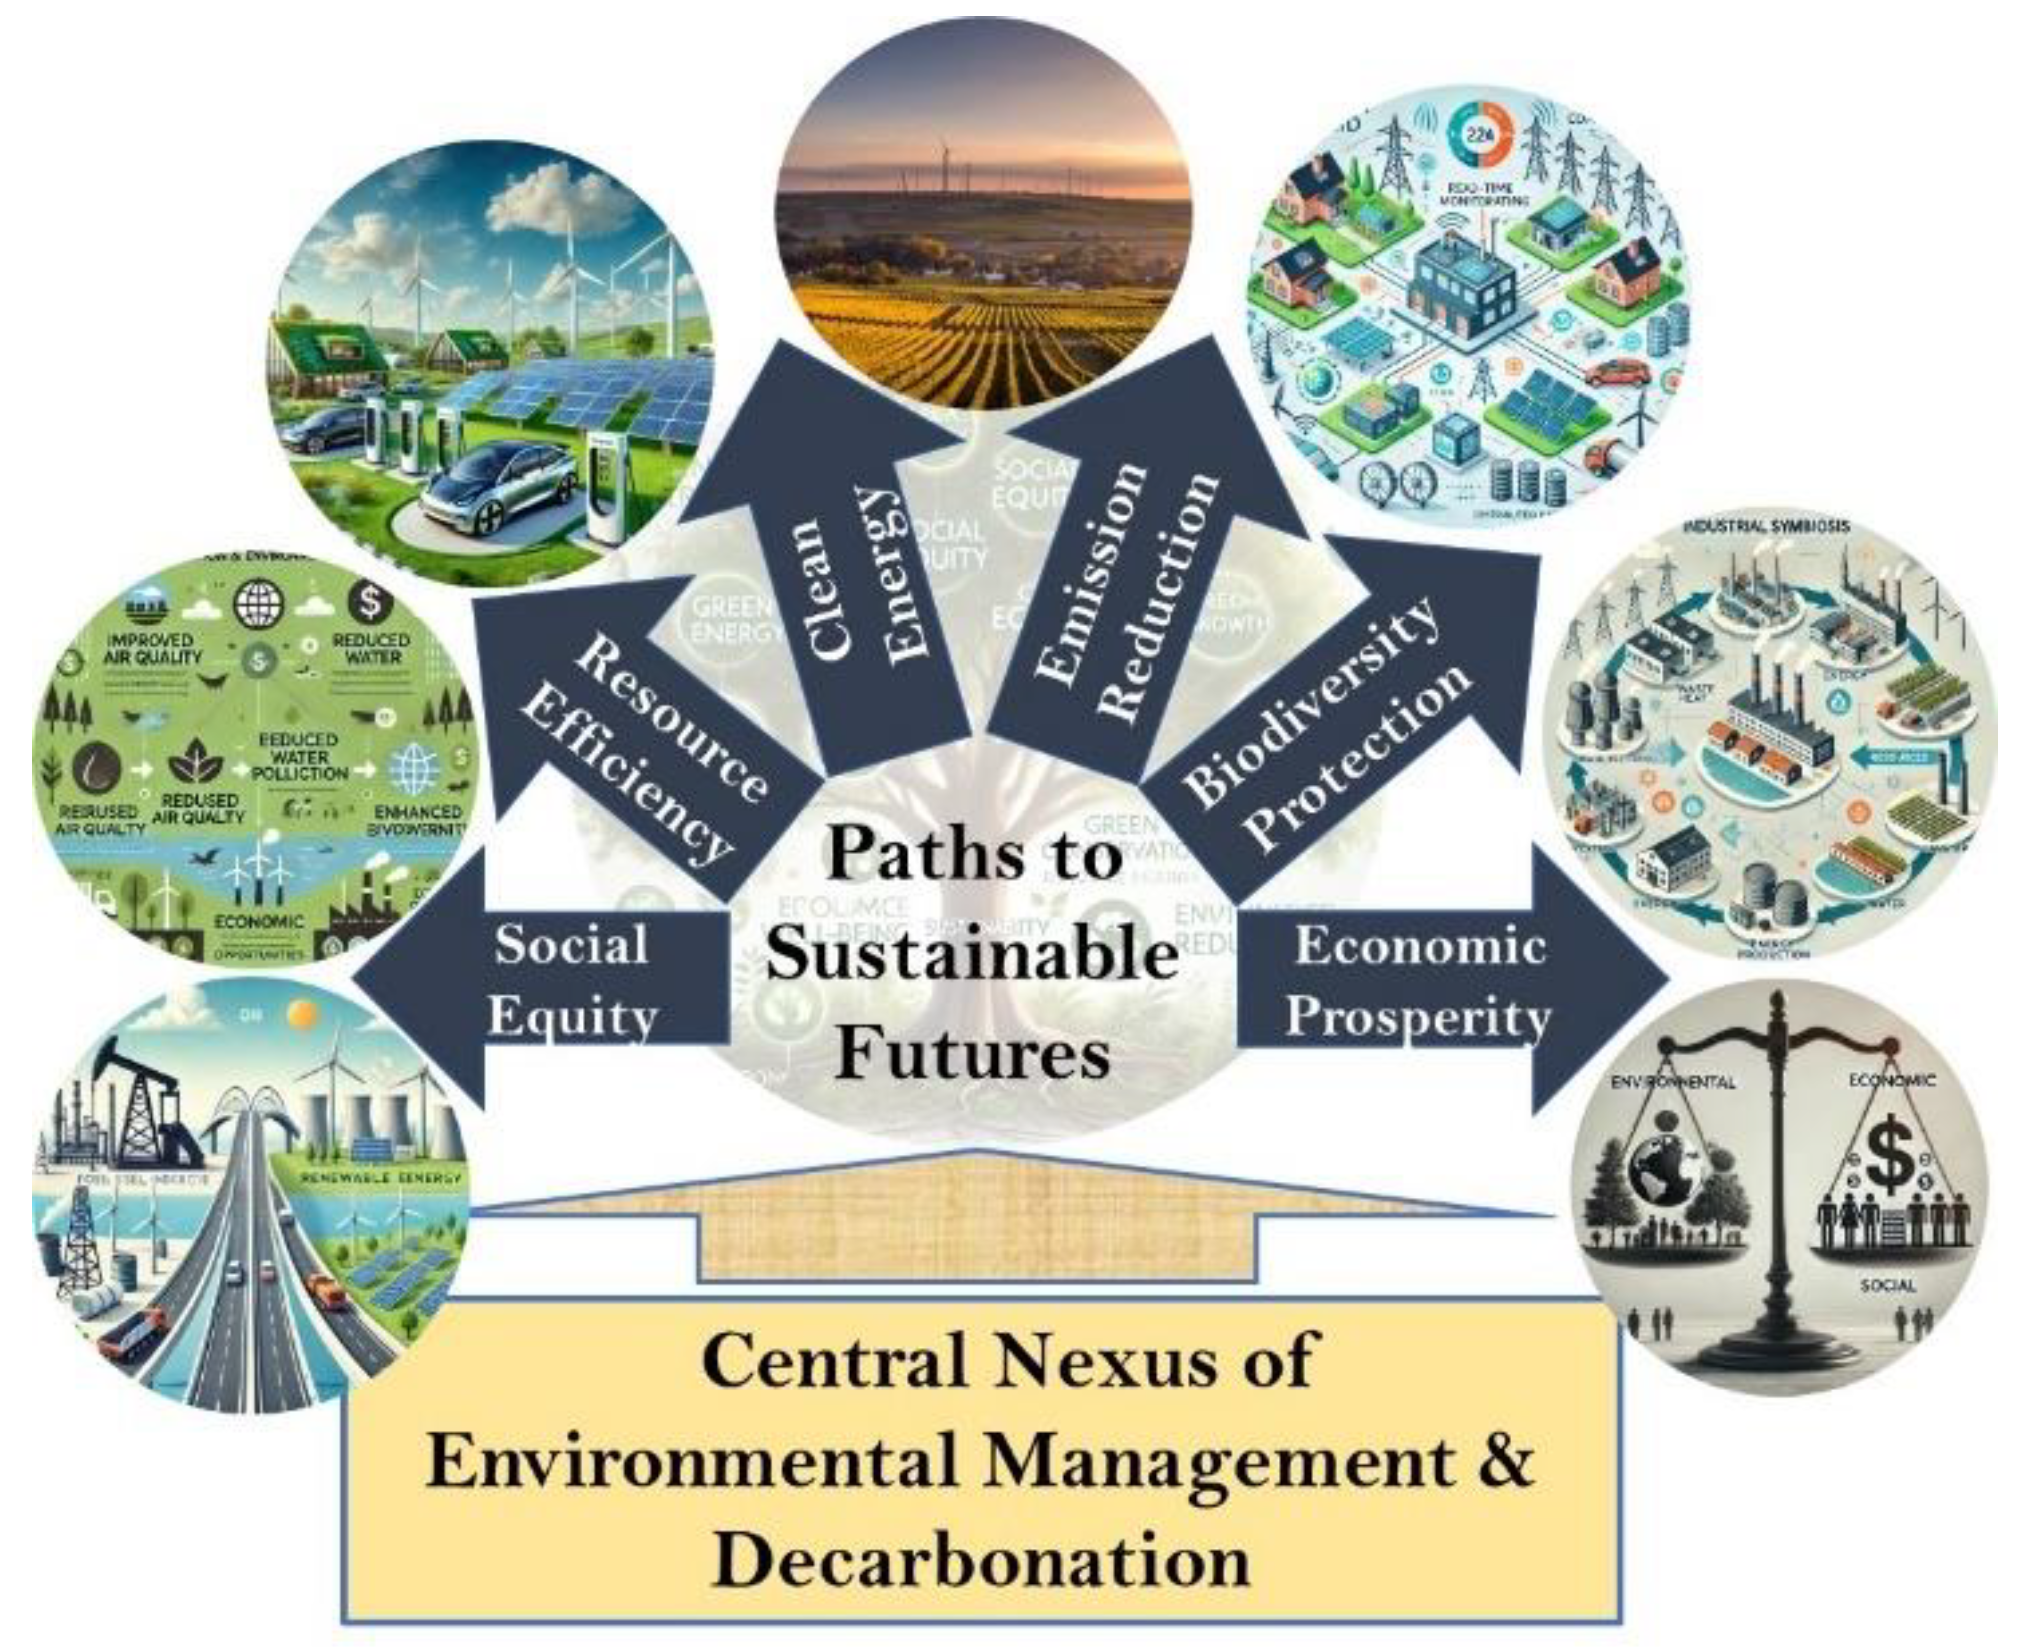
Figure 6.
Energy demand in various countries and regions from different worldwide locations, 2023.
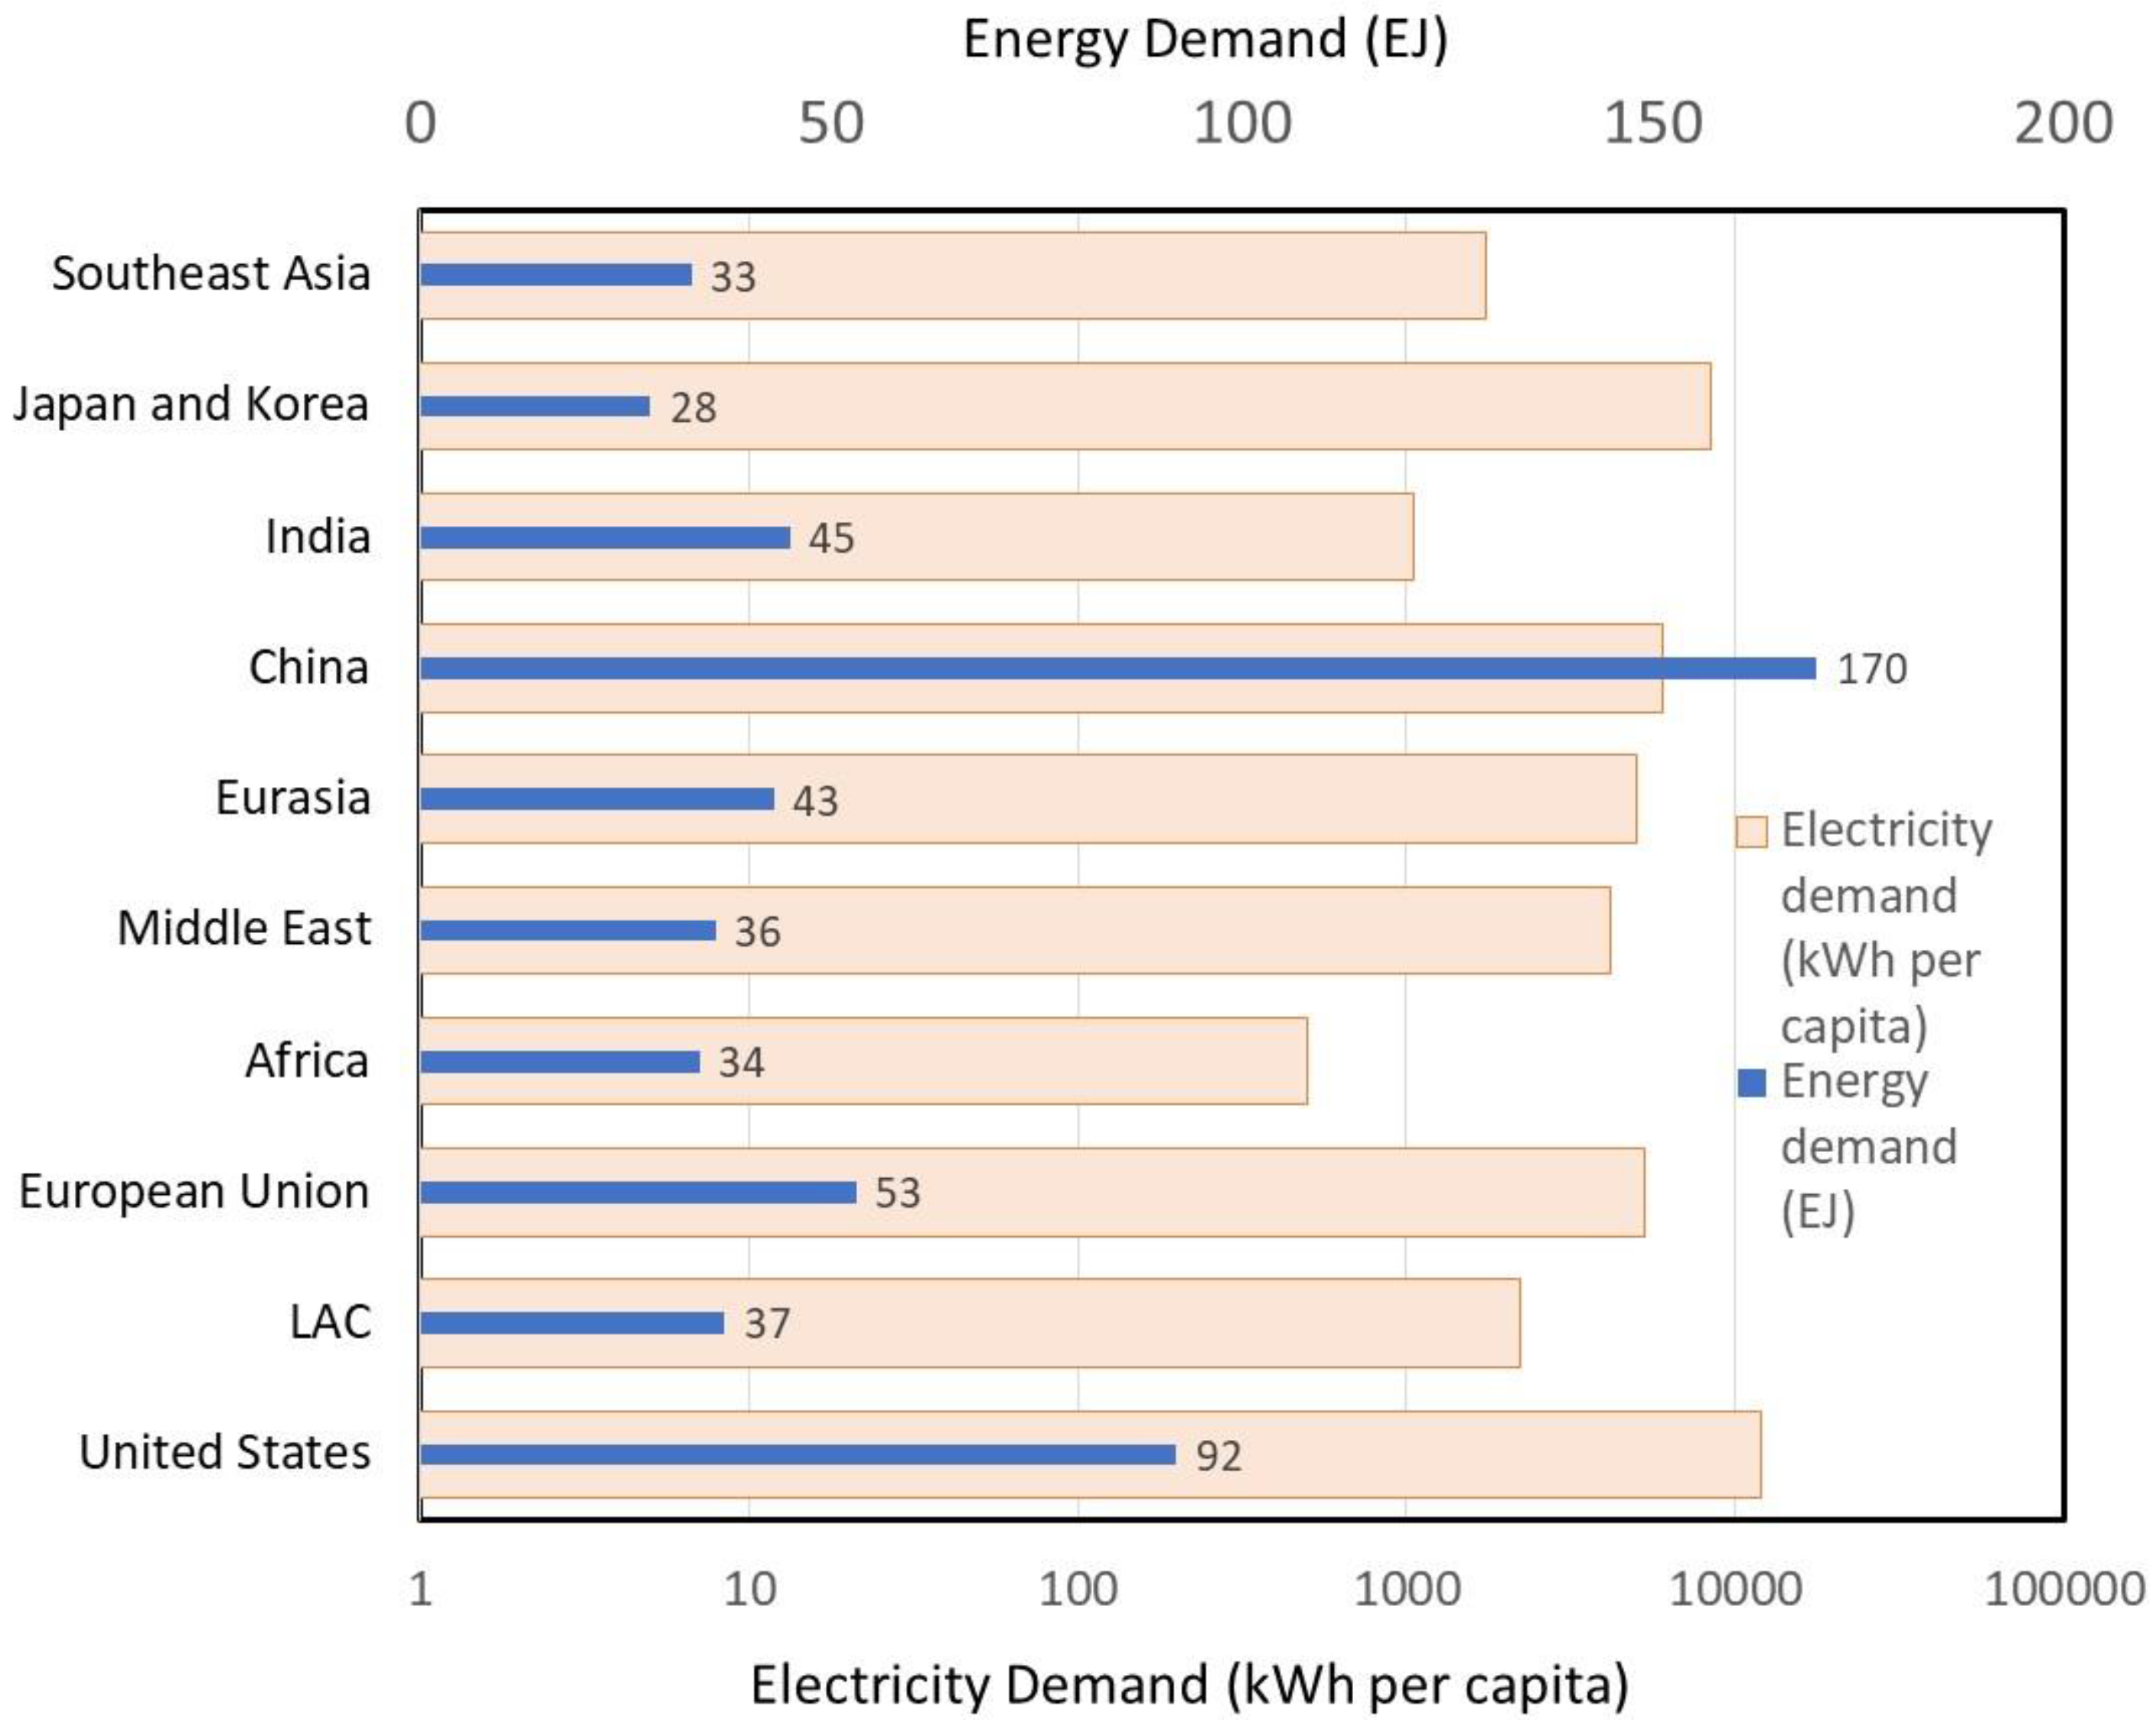
Figure 7.
GHGs emissions from the energy sector.
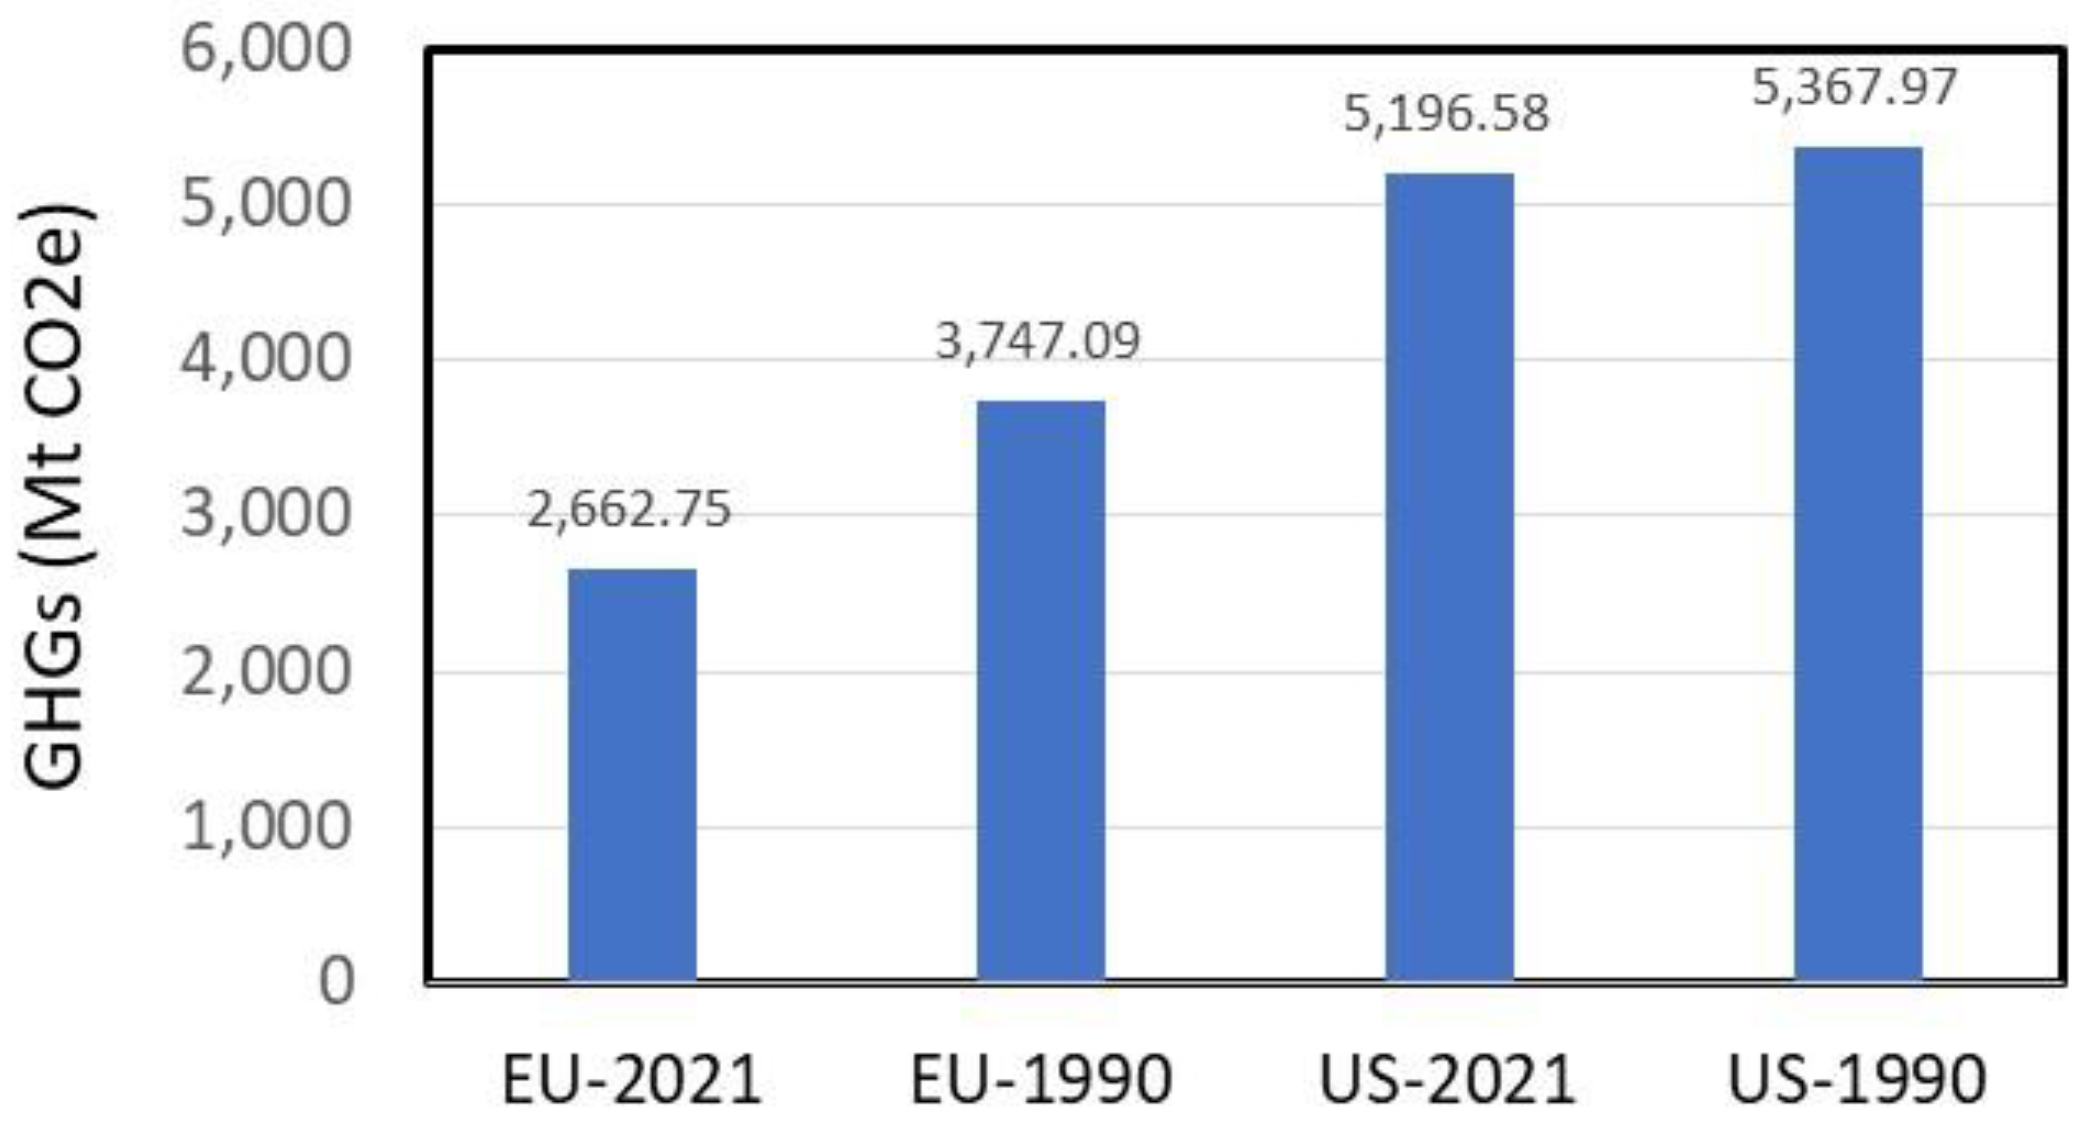
Figure 8.
Global energy mix and consumption in selected sectors.
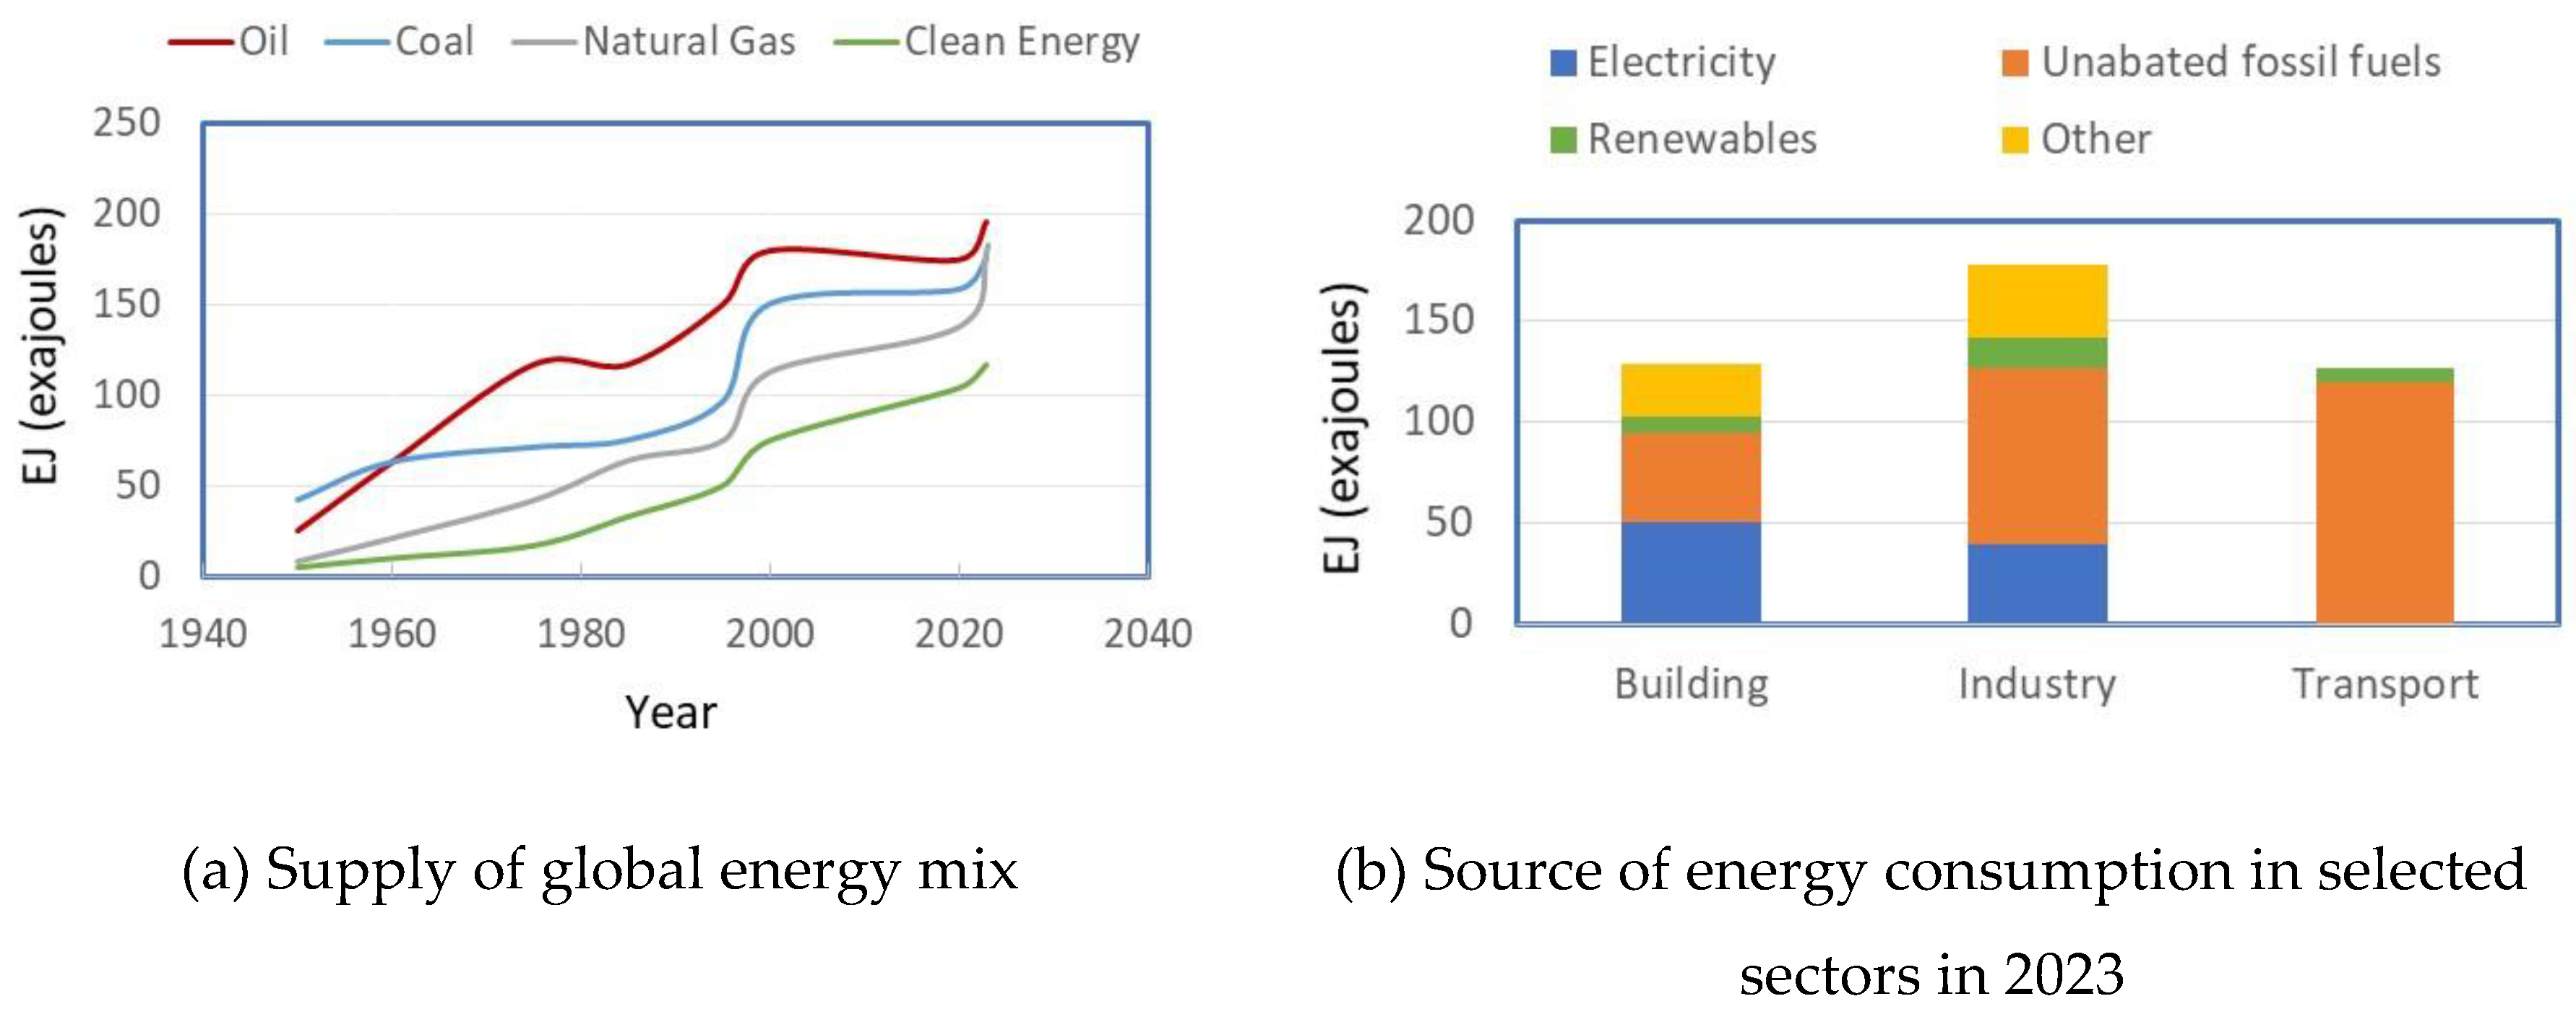
Figure 9.
Percent contribution of clean energy technologies to decarbonation in 2023.
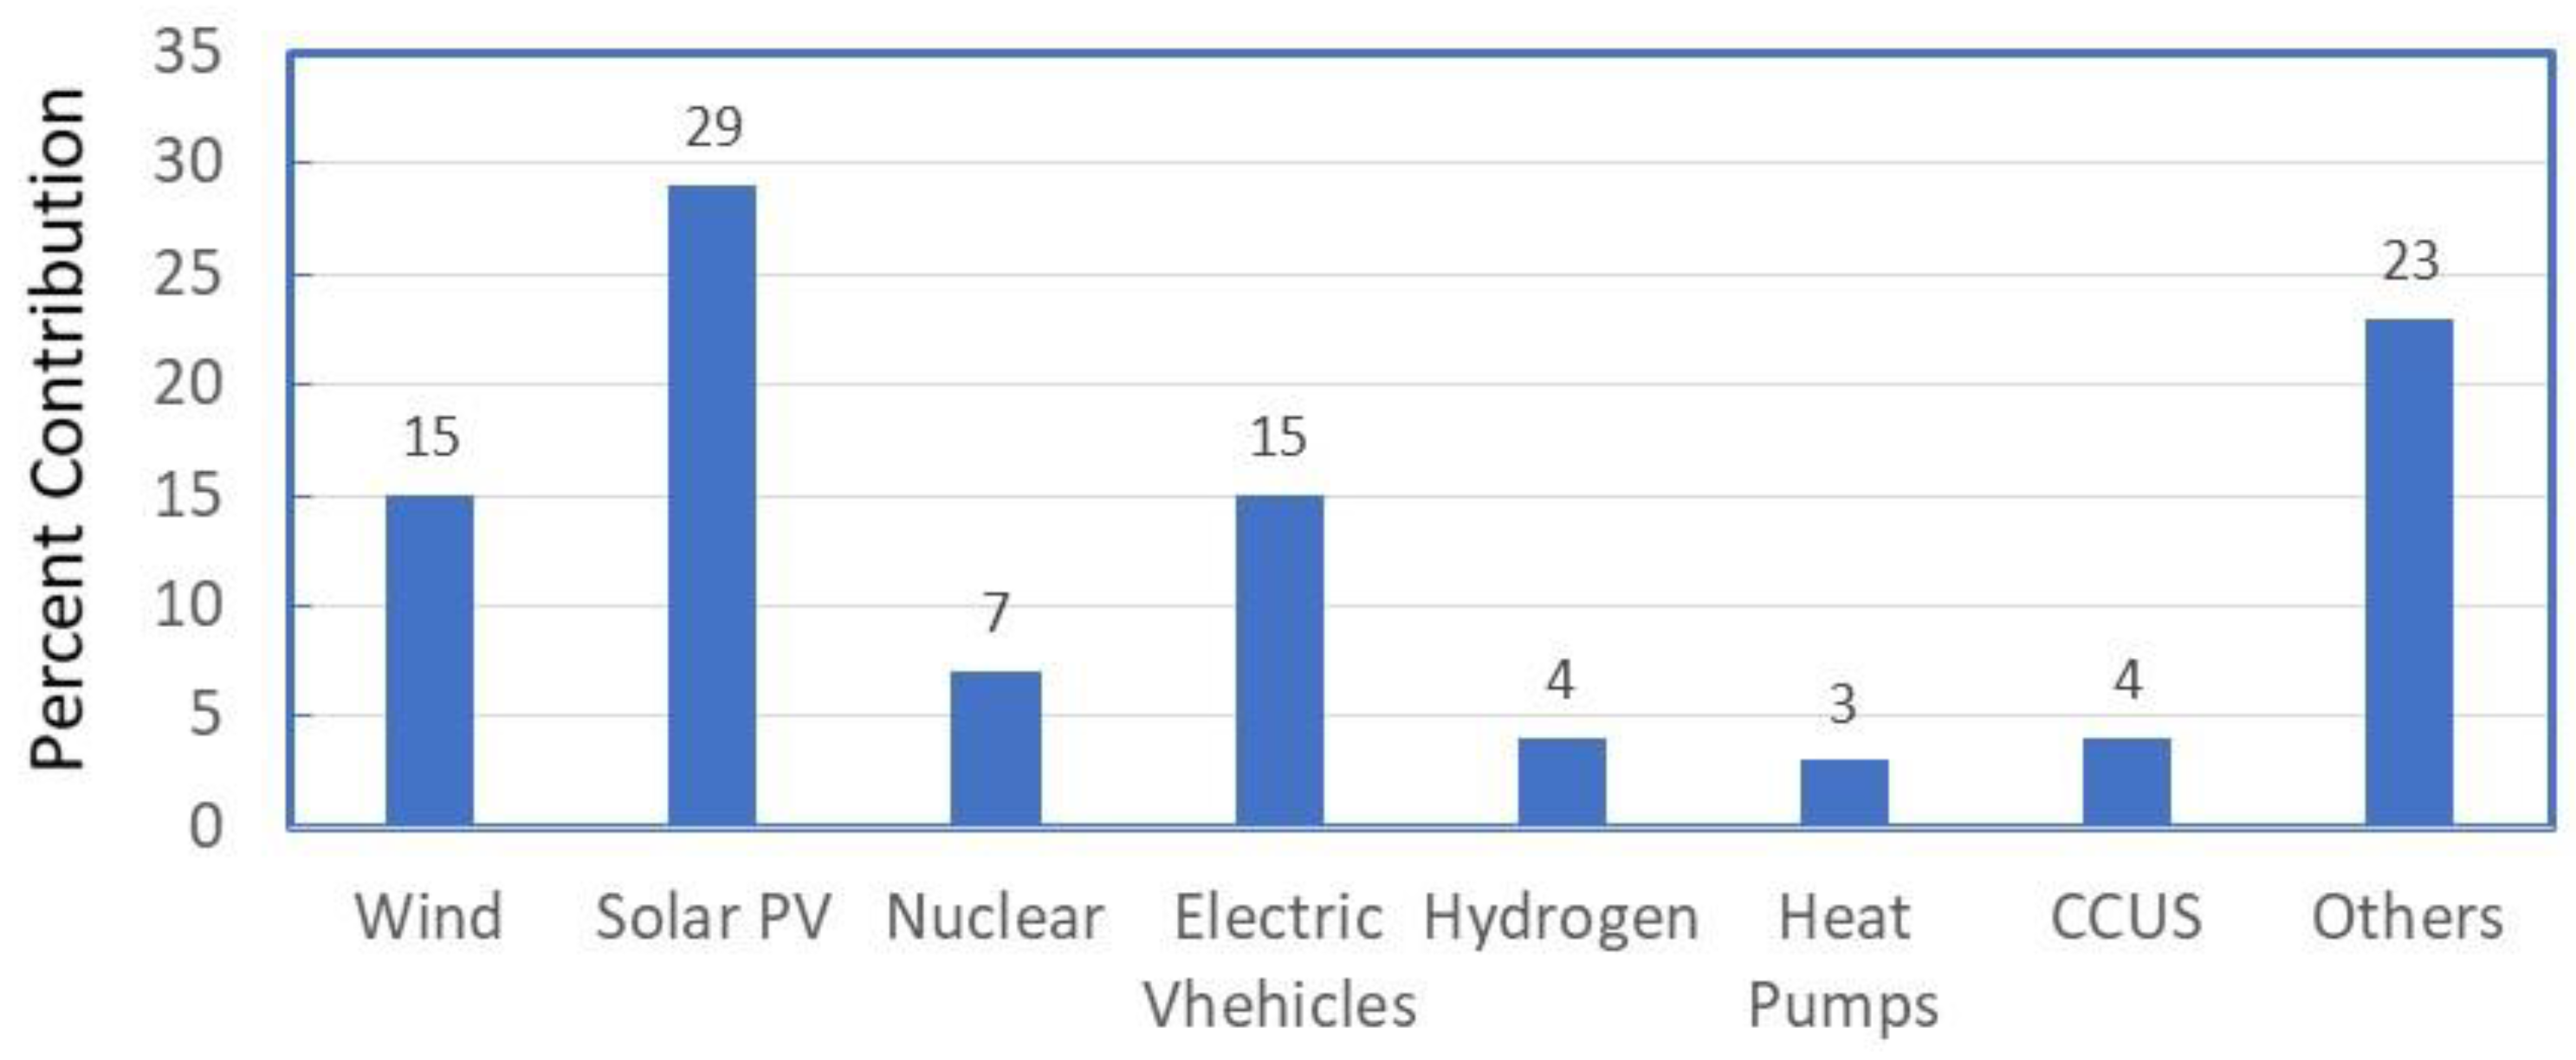
Figure 10.
Estimated energy investment, 2024.
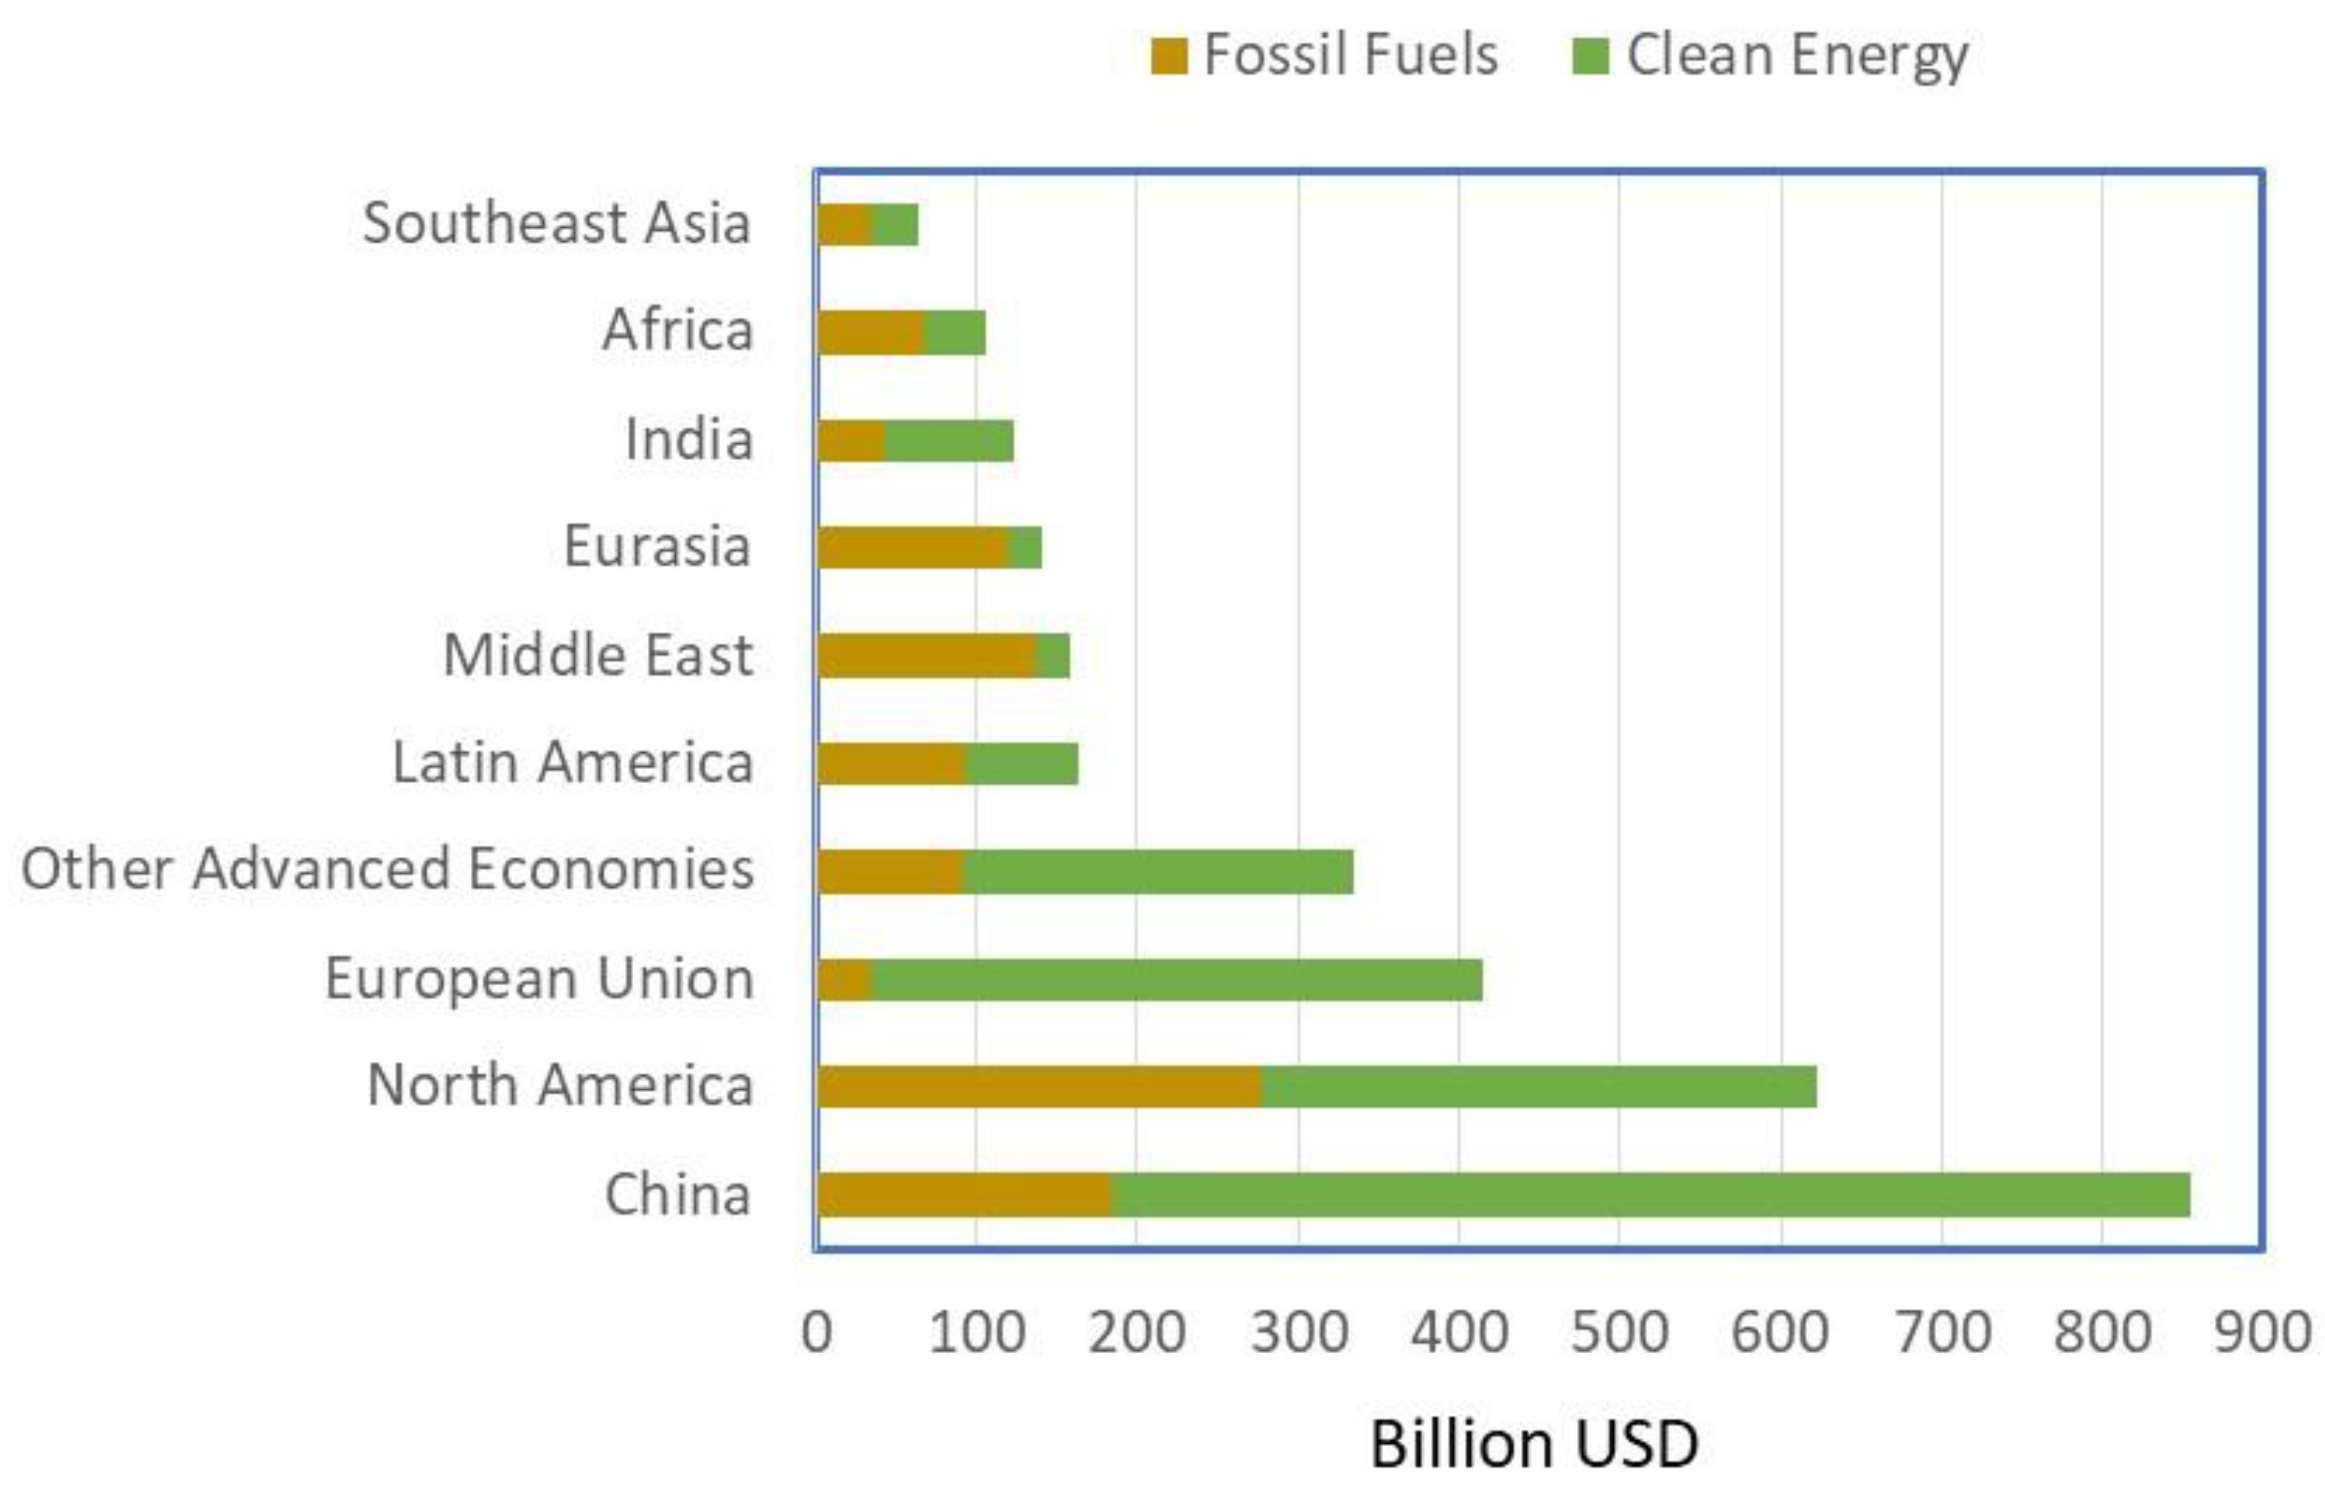
Figure 11.
GHGs emissions from various transportation systems.
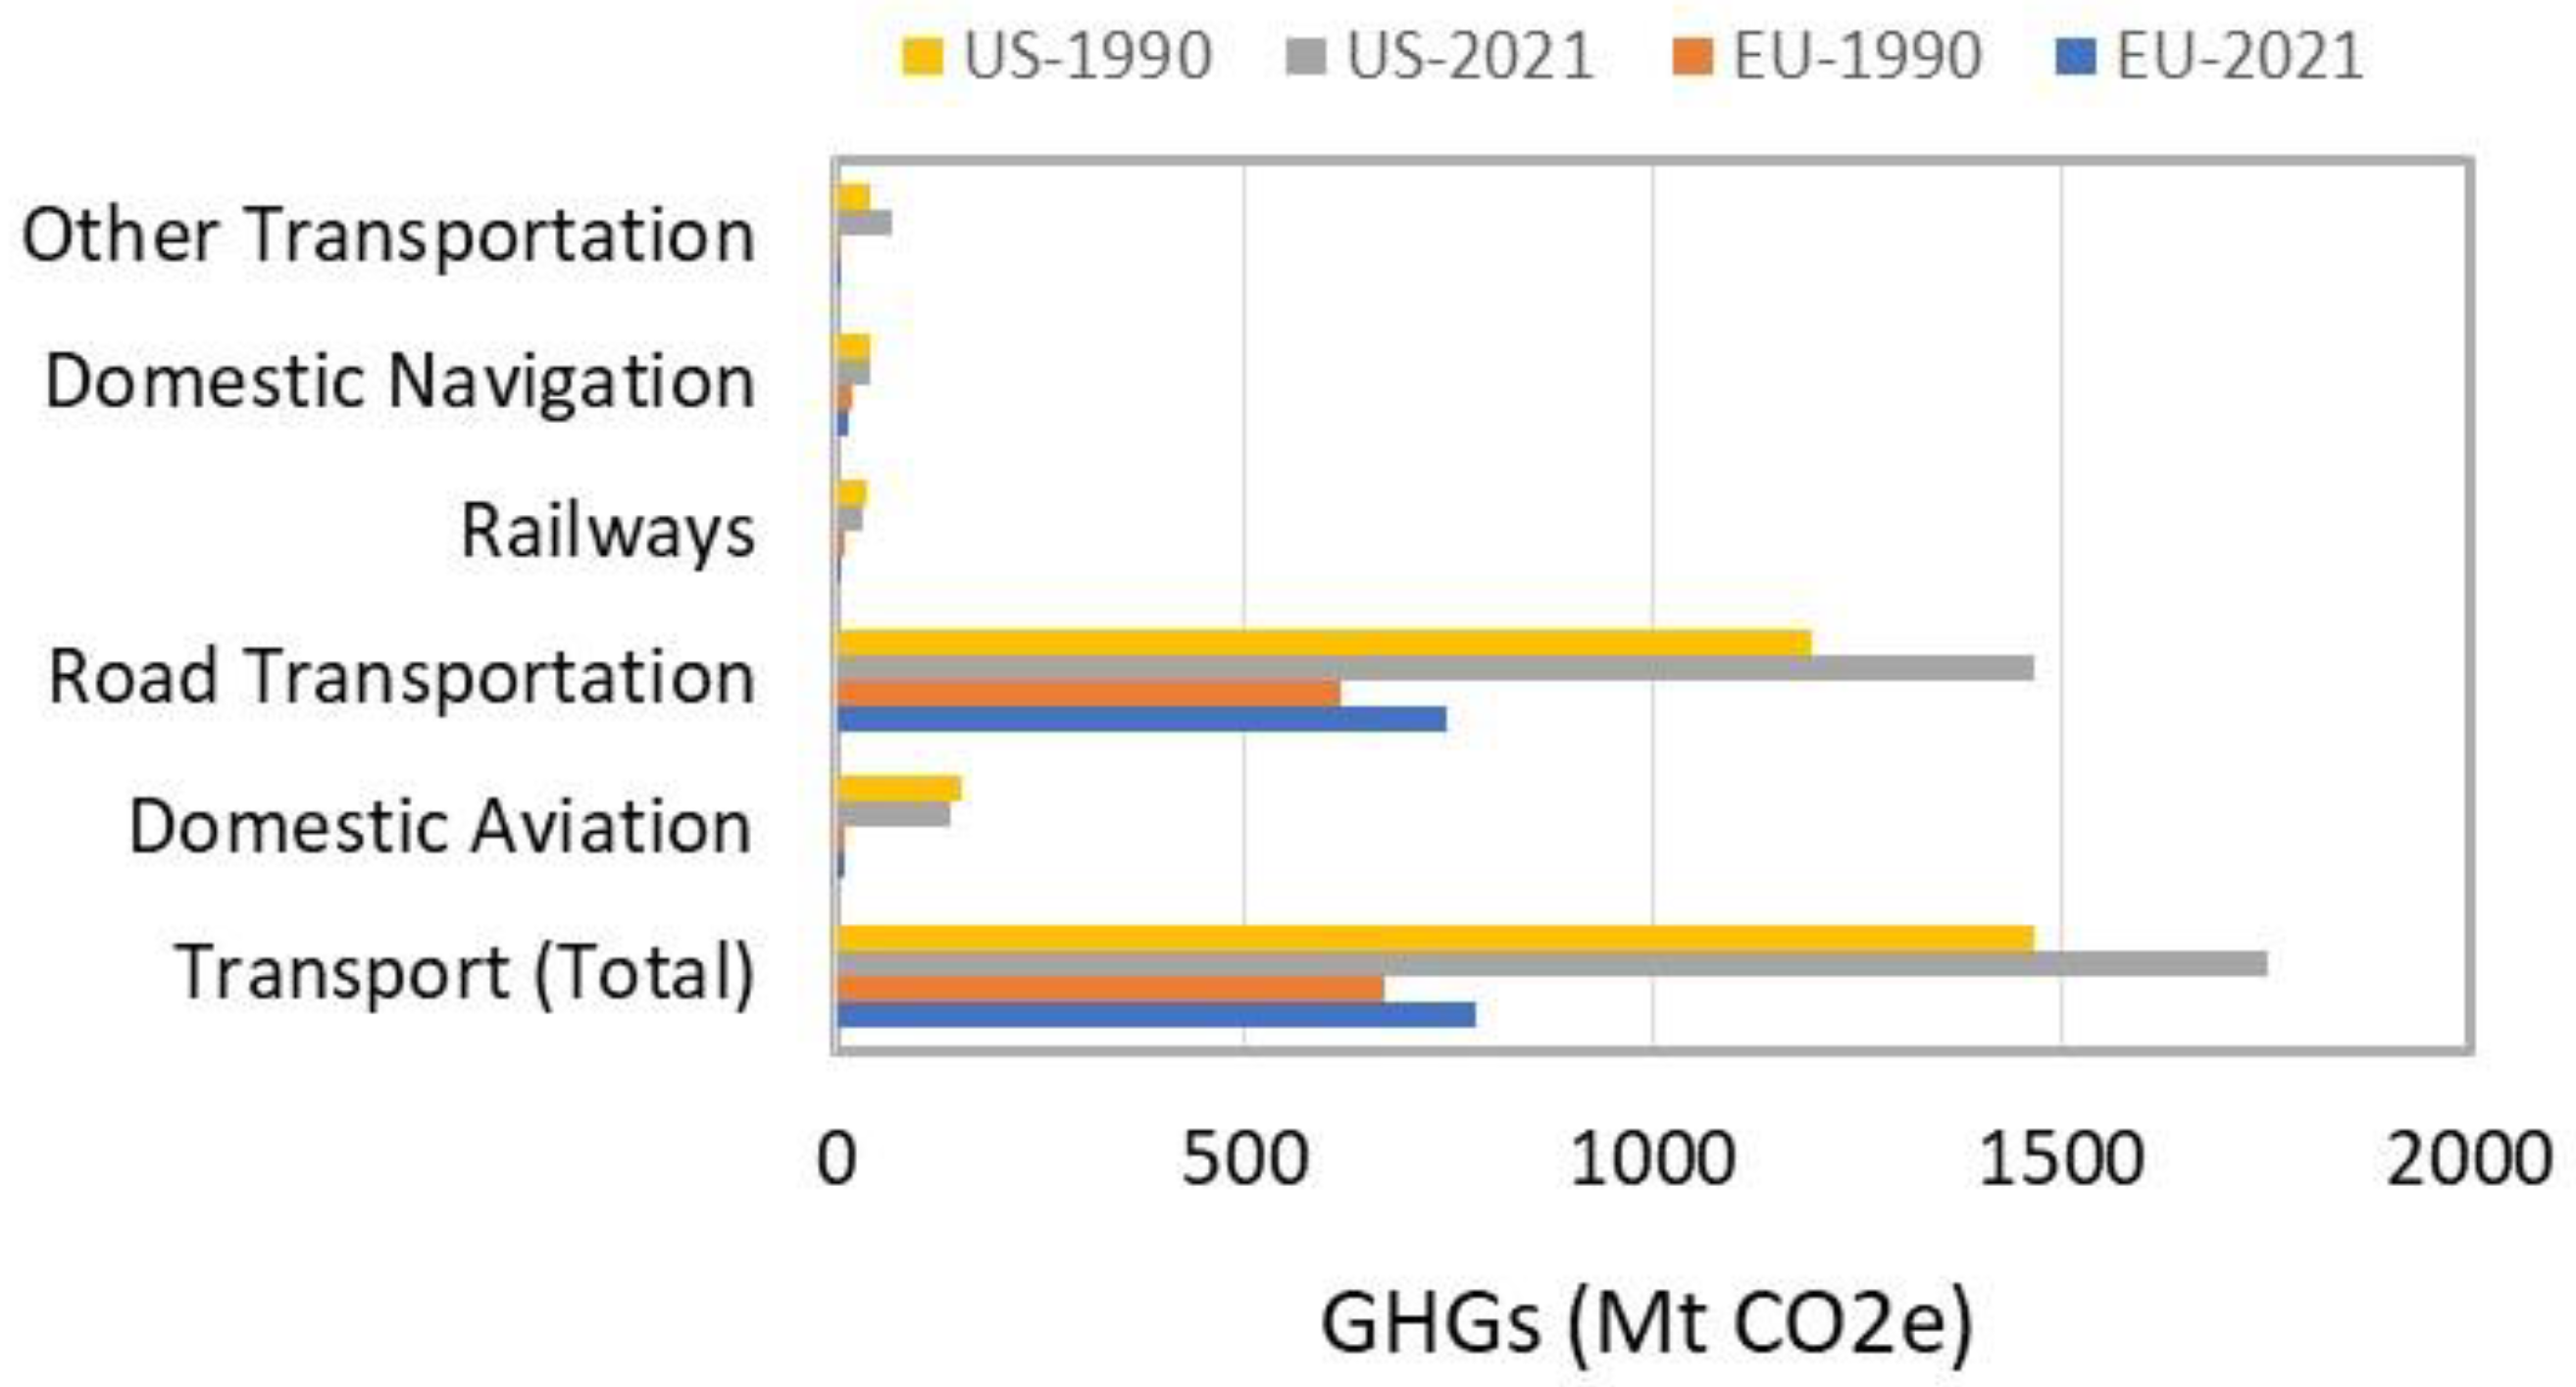
Figure 12.
Status of the carbon capture, utilization and storage (CCUS) facilities and distribution.
Figure 12.
Status of the carbon capture, utilization and storage (CCUS) facilities and distribution.
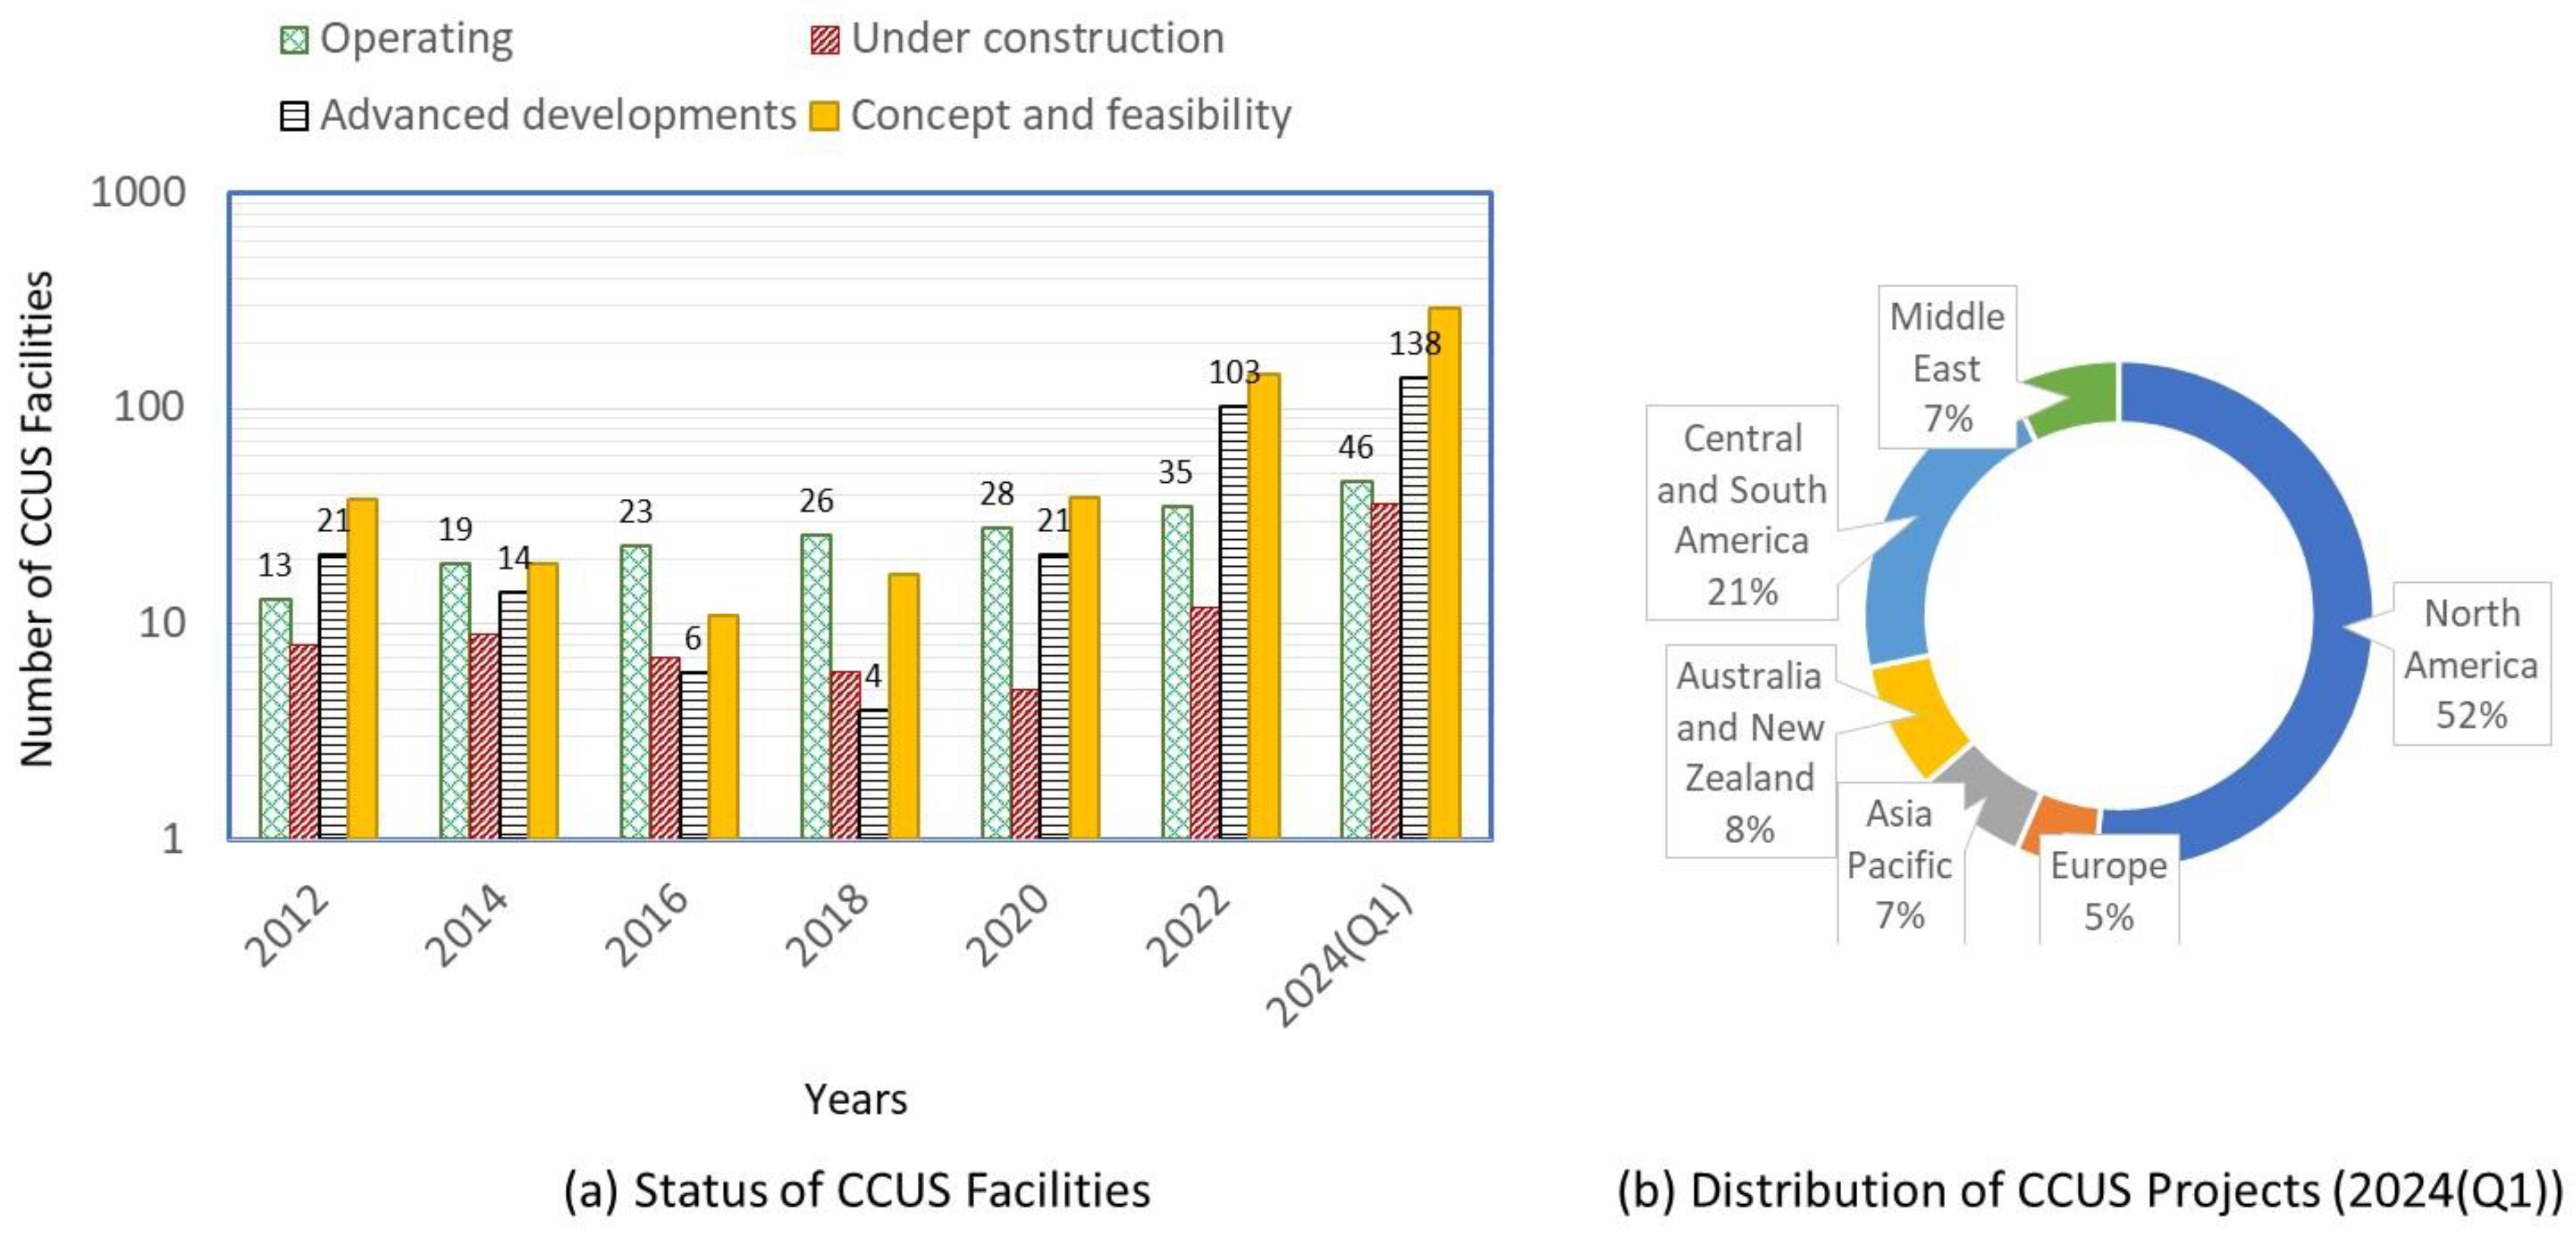
Figure 13.
Relationship between the circular economy and decarbonization, supported by environmental management.
Figure 13.
Relationship between the circular economy and decarbonization, supported by environmental management.
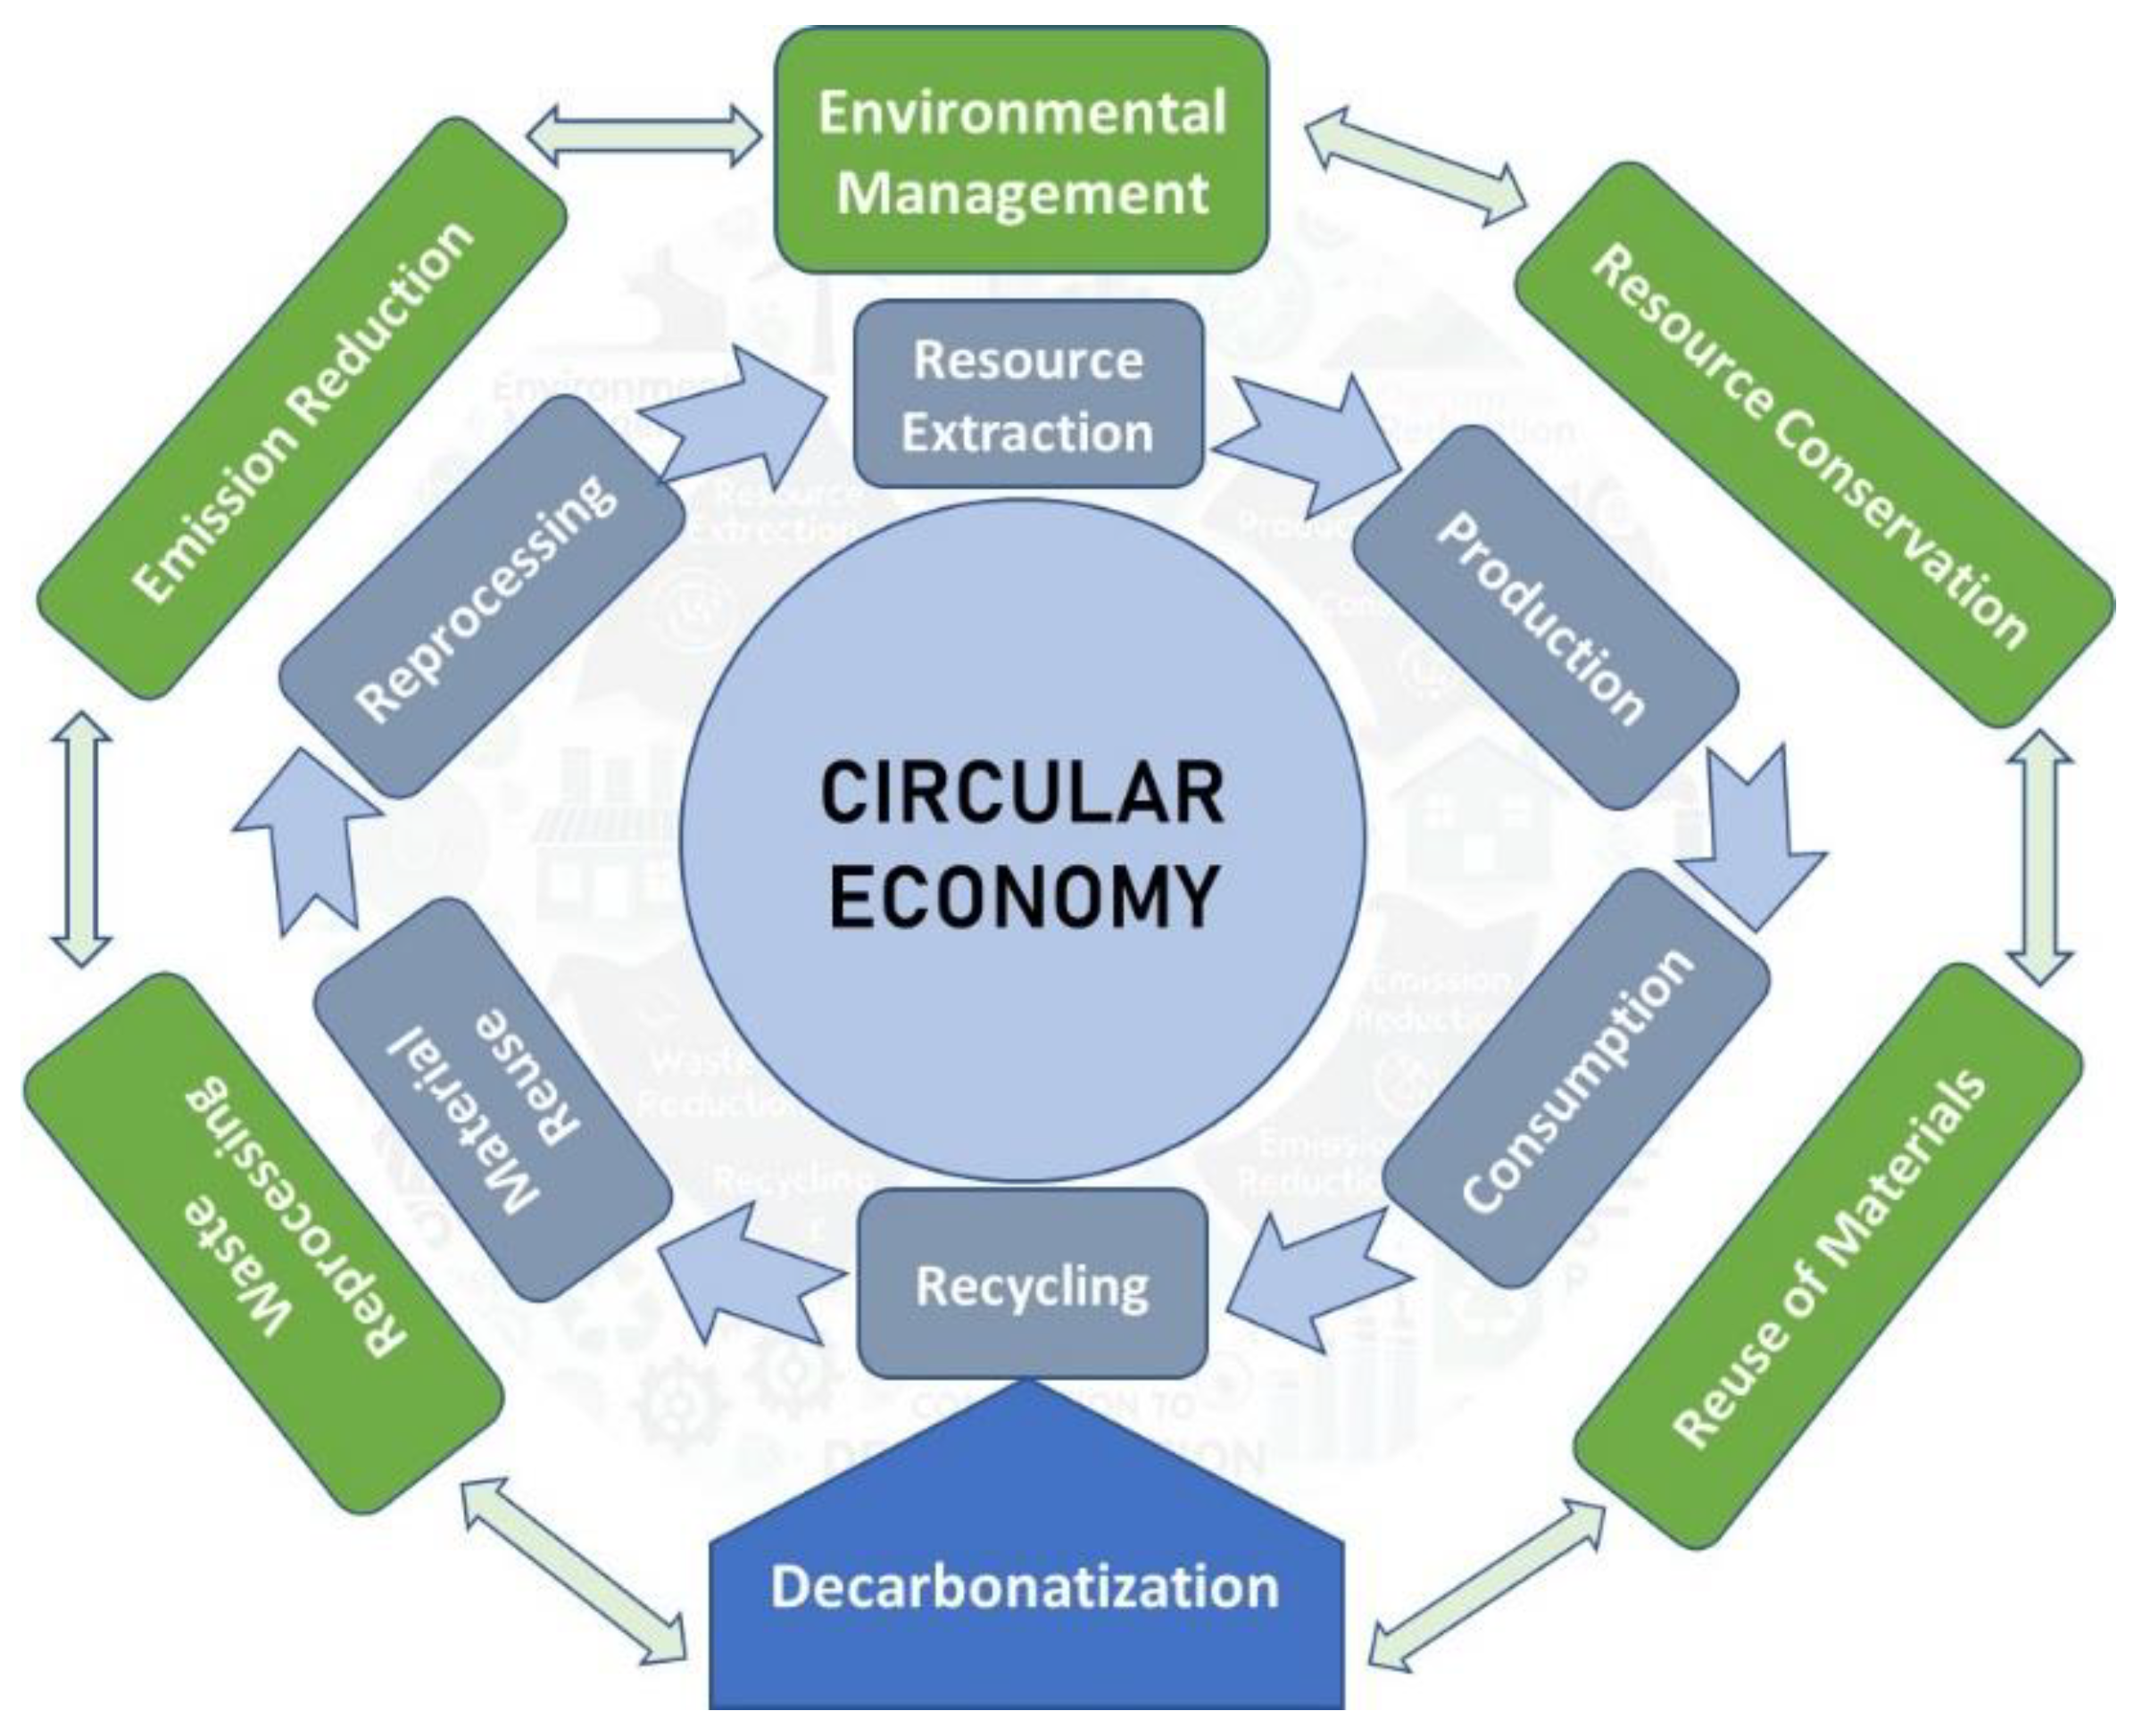
Figure 14.
Pillars of an effective clean energy innovation systems.
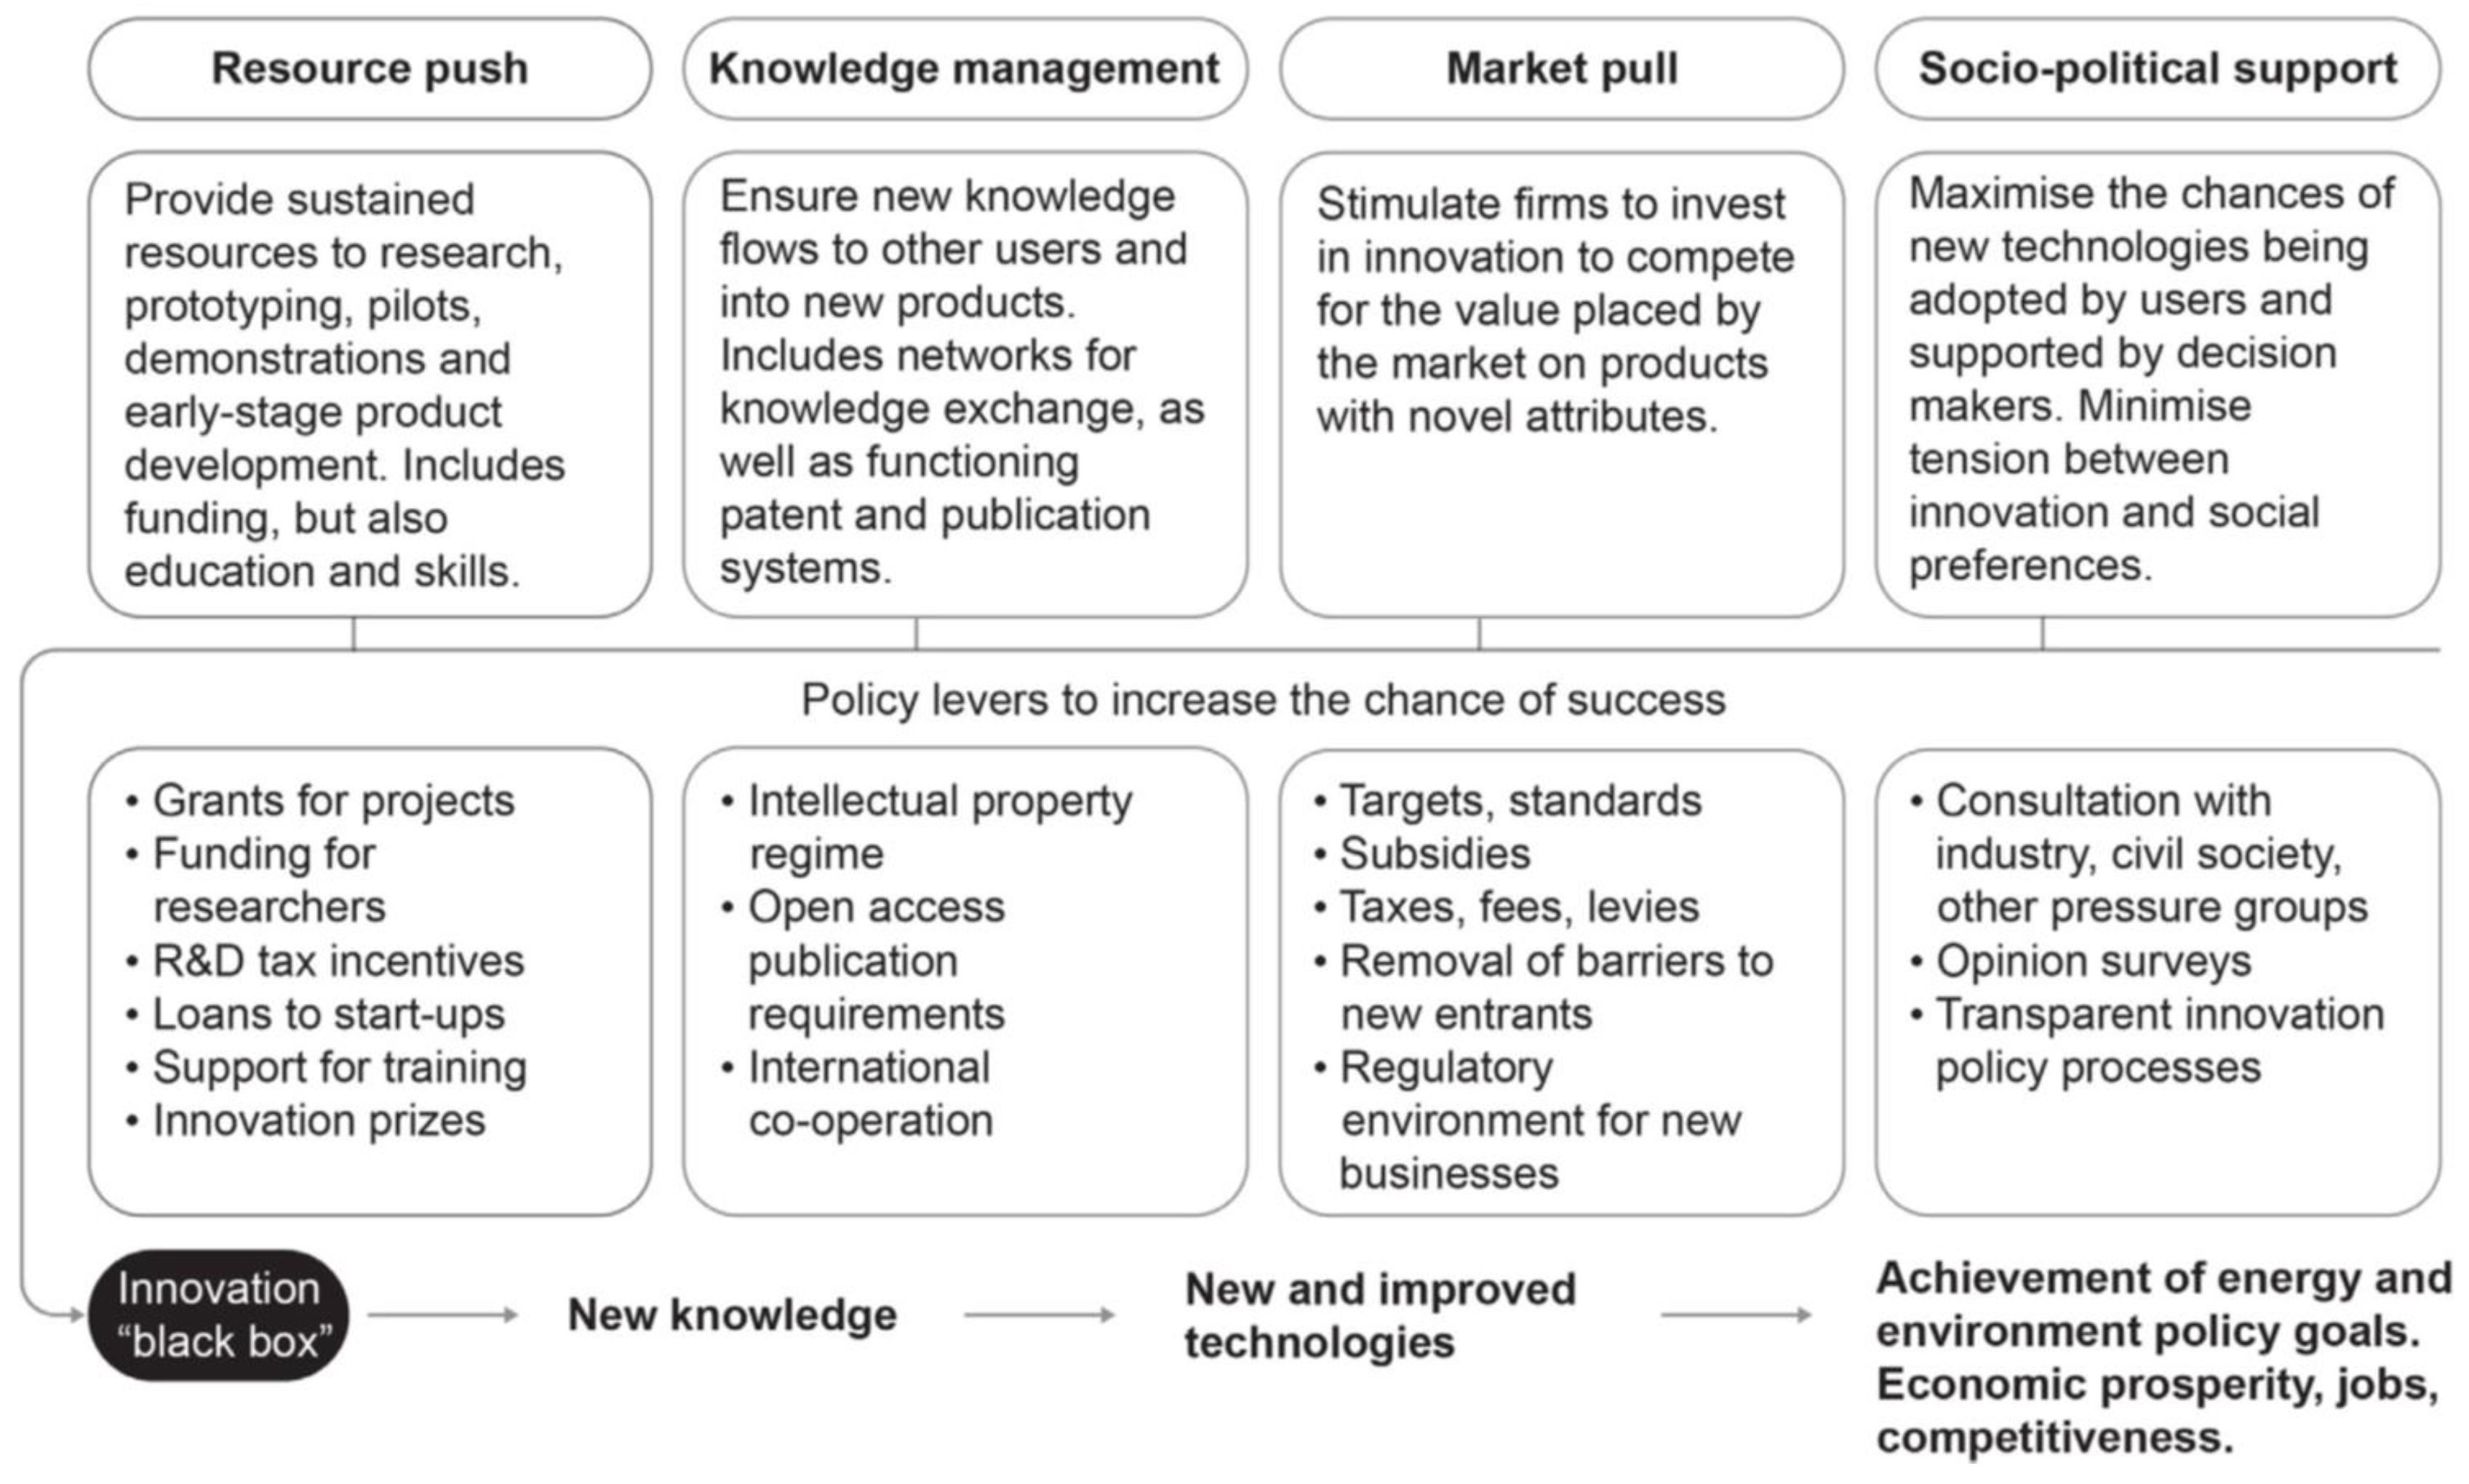
Figure 15.
Policy instruments and investment used to support the Ultra-high-voltage (UHV) electricity transmission technology in China from 2014 to 2021.
Figure 15.
Policy instruments and investment used to support the Ultra-high-voltage (UHV) electricity transmission technology in China from 2014 to 2021.
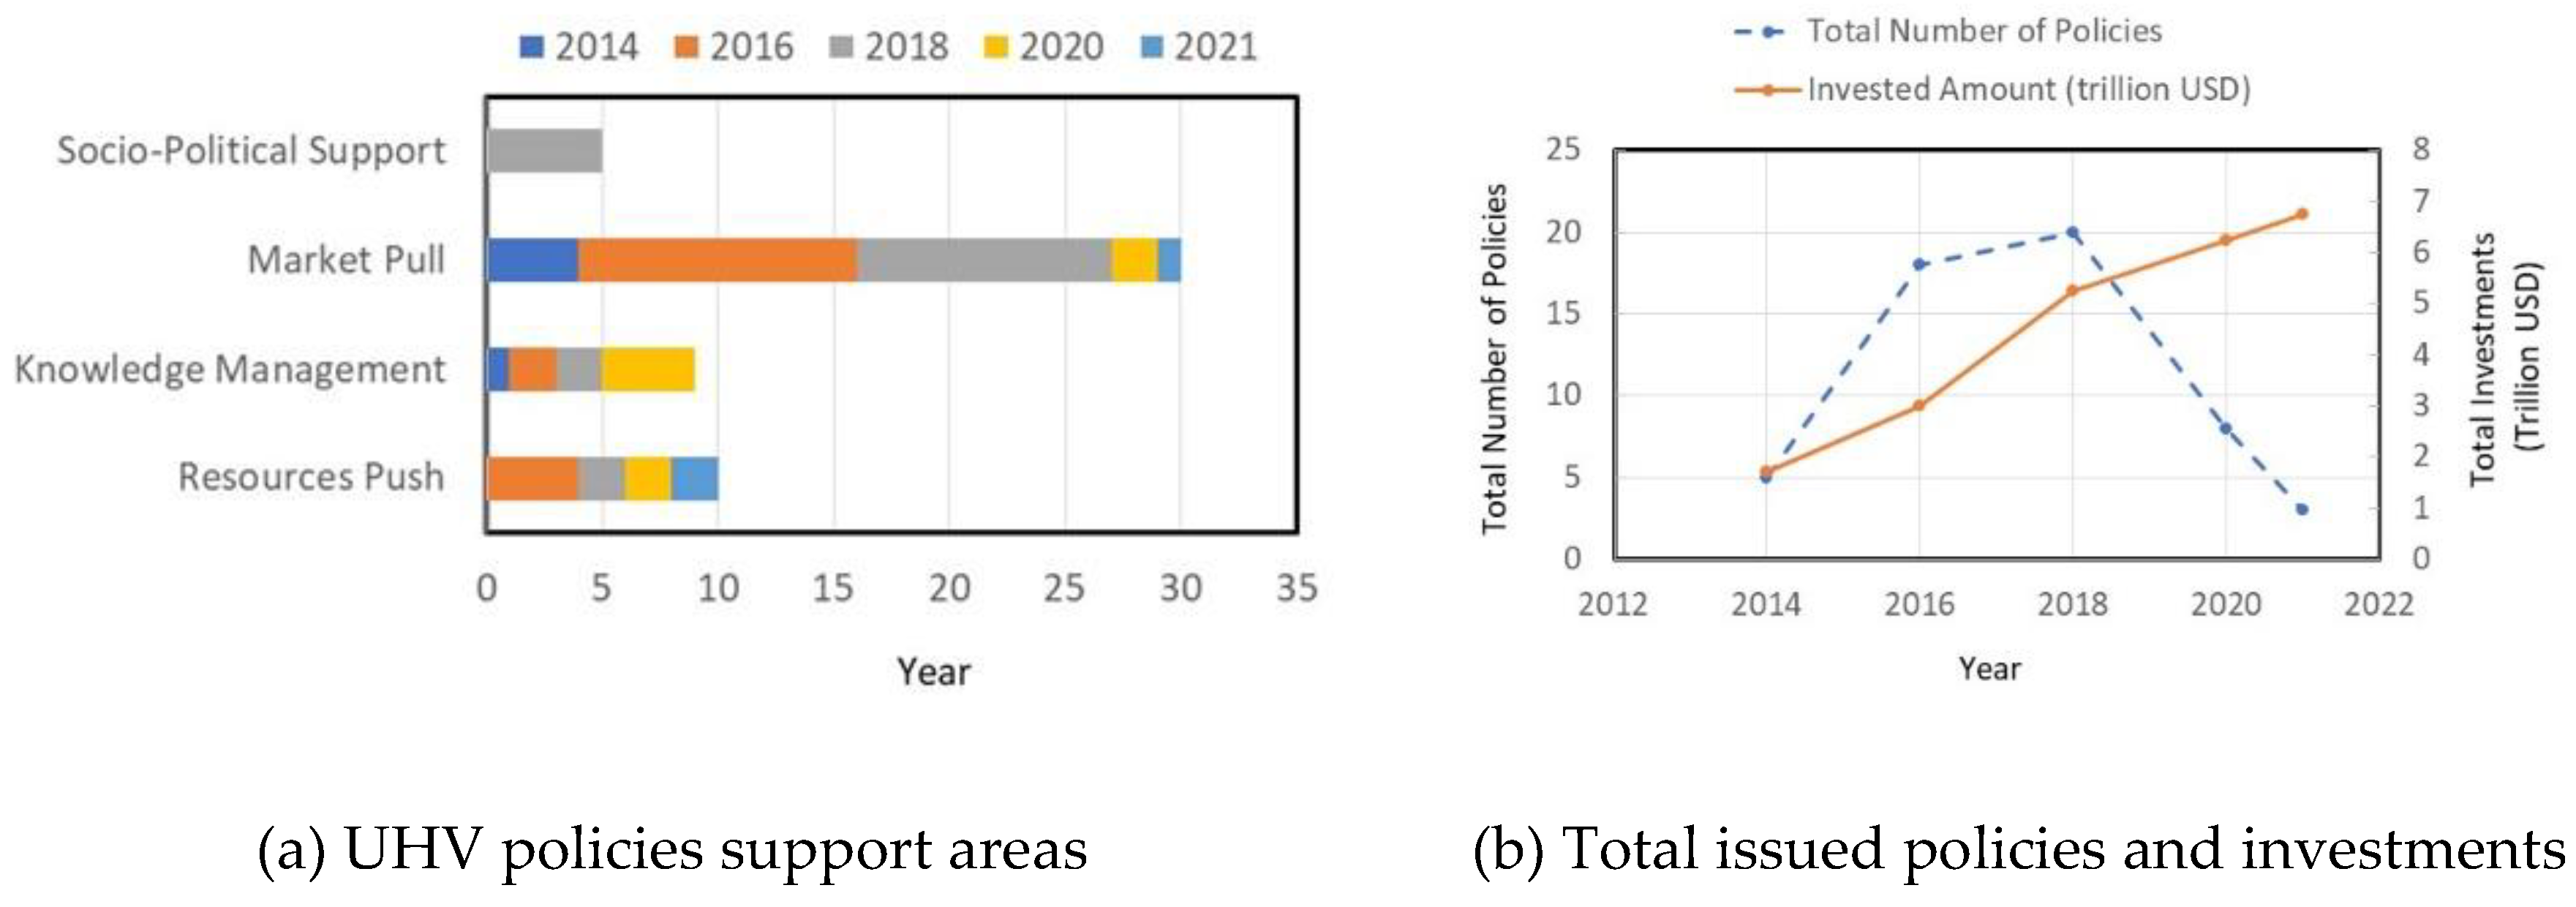
Figure 16.
Policy instruments used to support PV technology and production in China from 2014 to 2021.
Figure 16.
Policy instruments used to support PV technology and production in China from 2014 to 2021.
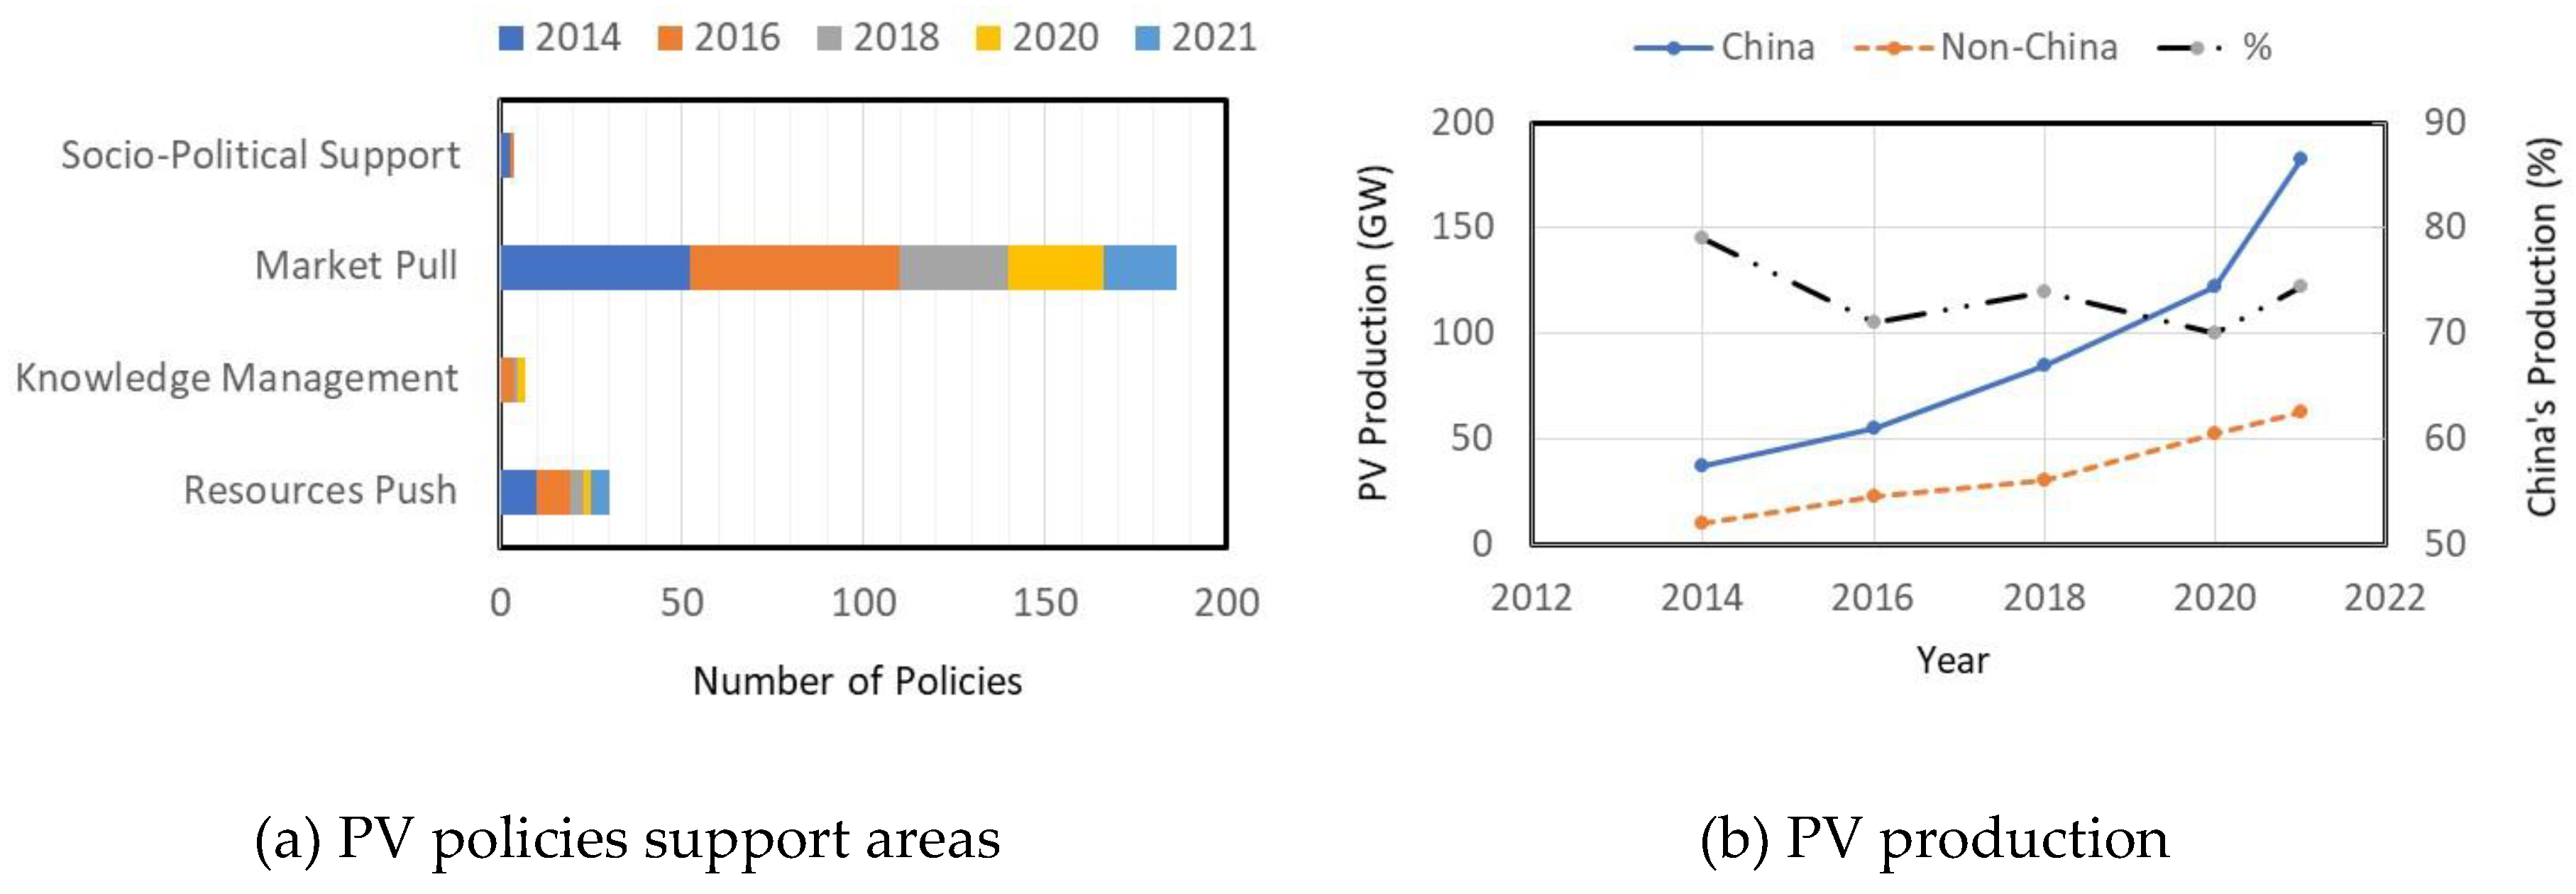
Figure 17.
Government spending on energy research and development by region.
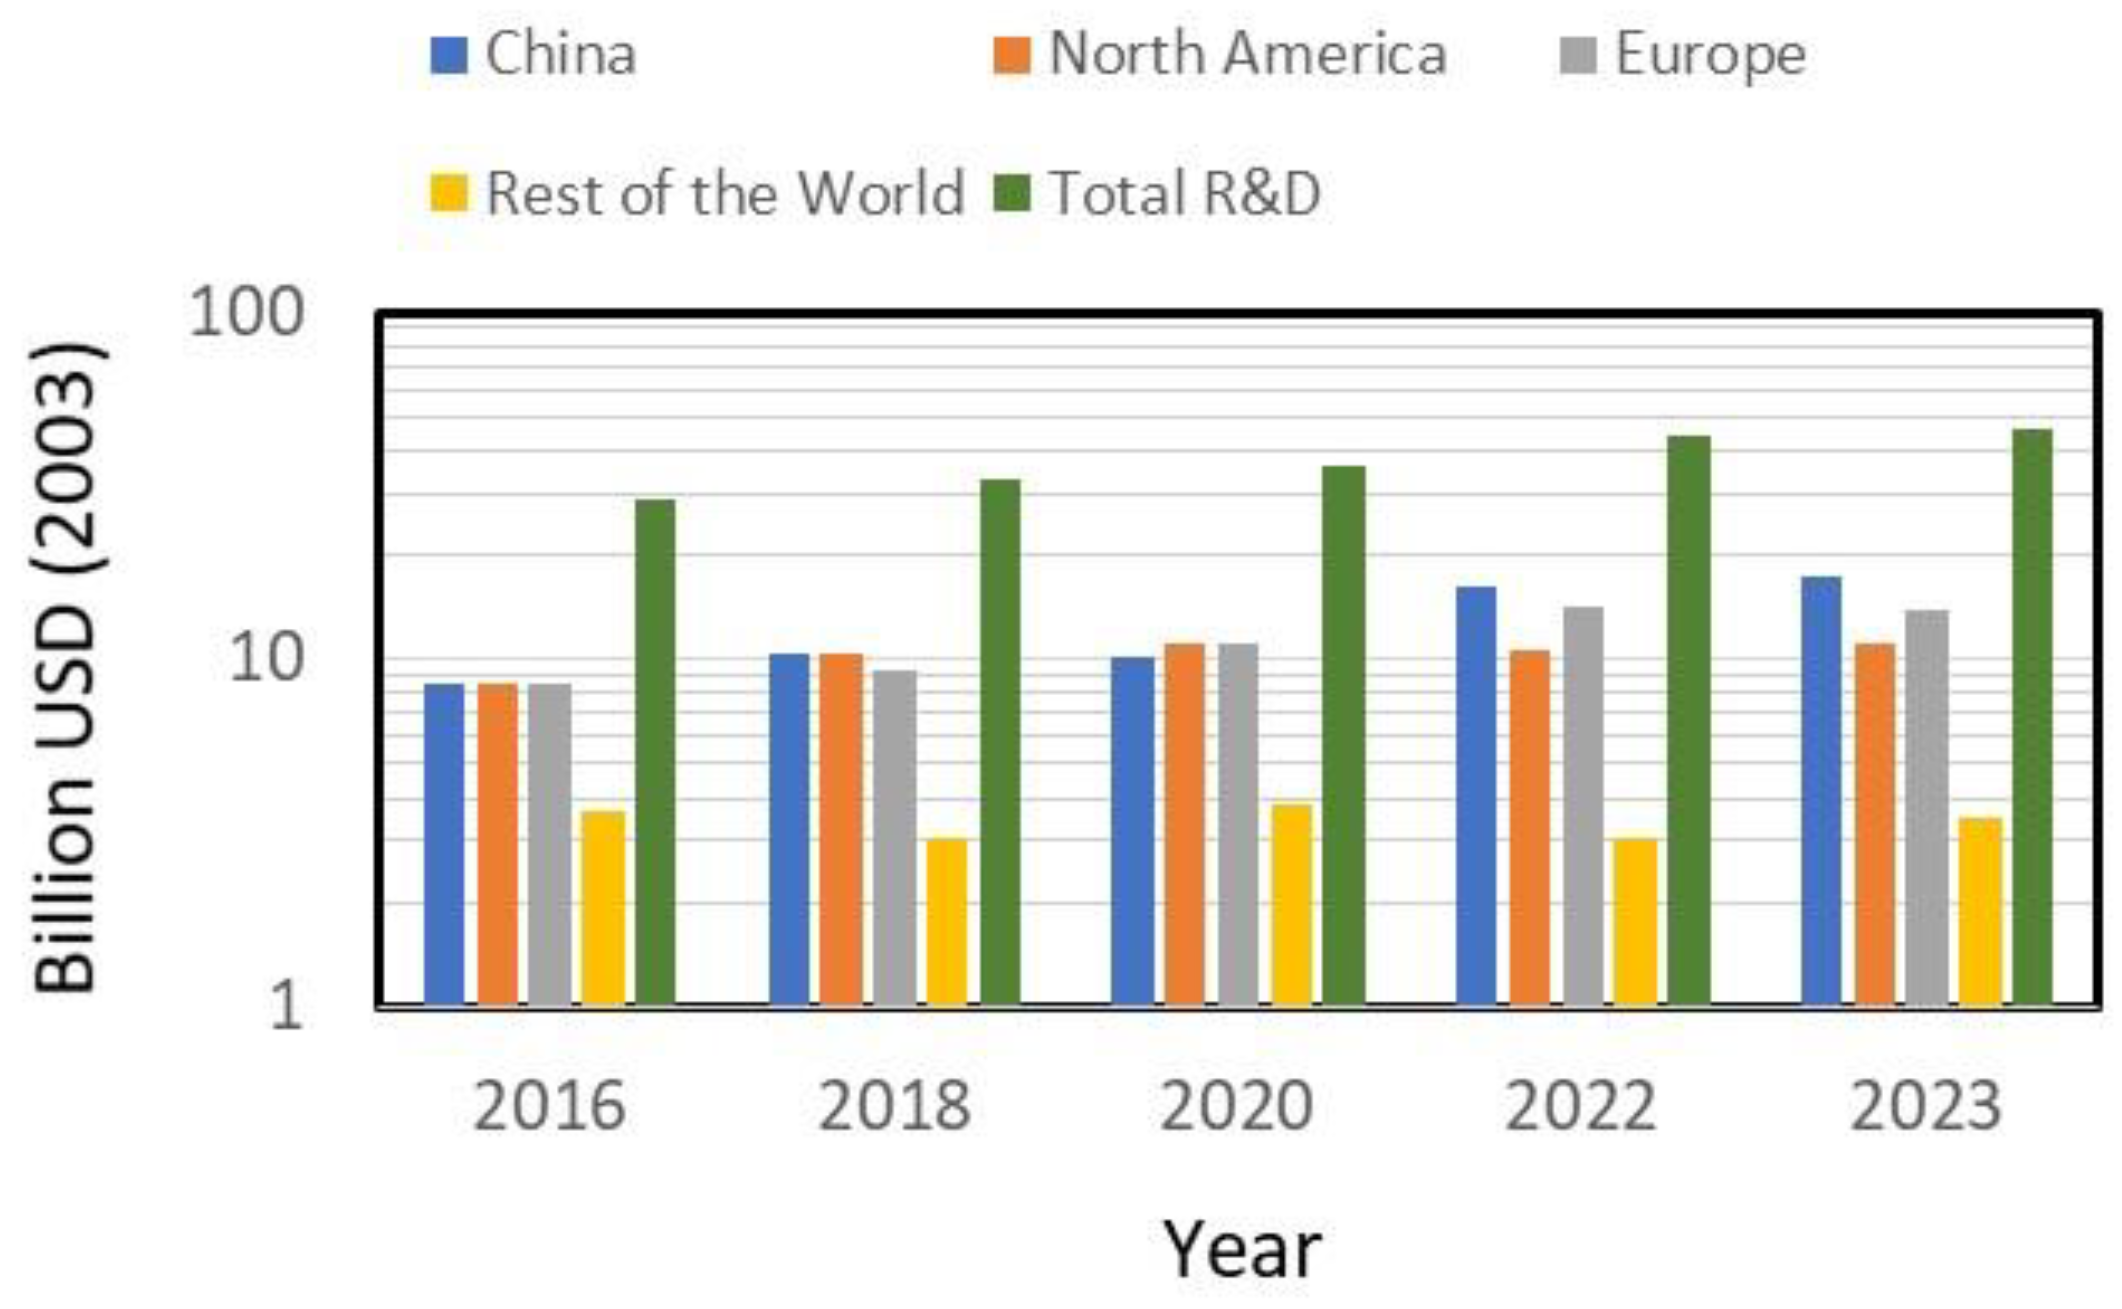
Figure 18.
Annual energy sector investment by sector, 2024.
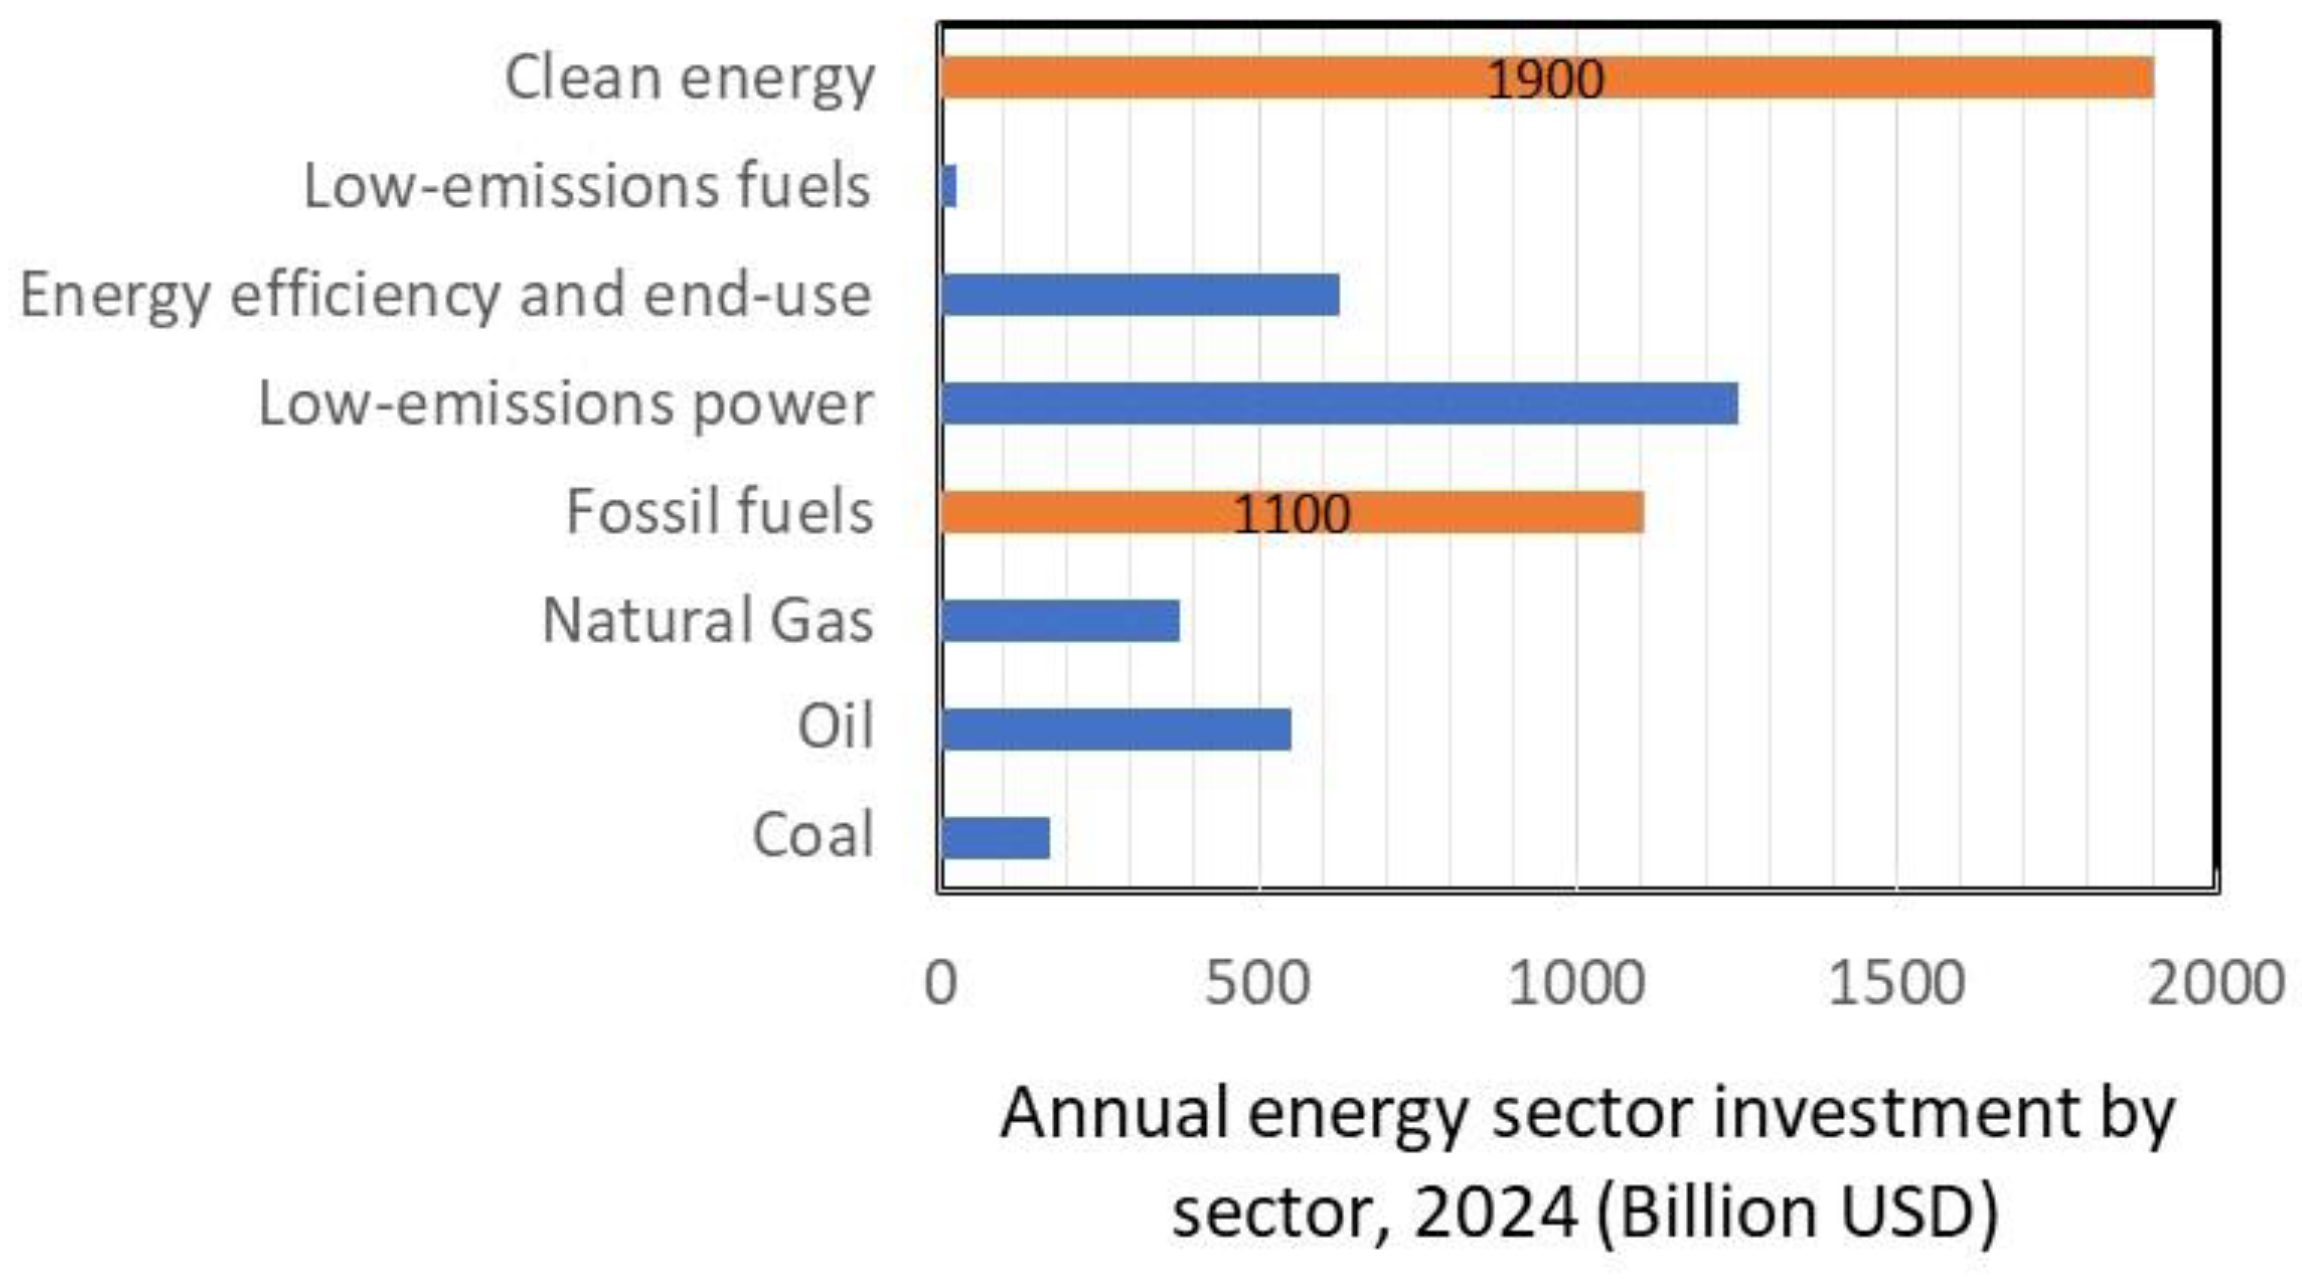
Figure 19.
Annual energy sector investment in 2023 by various countries and regions.
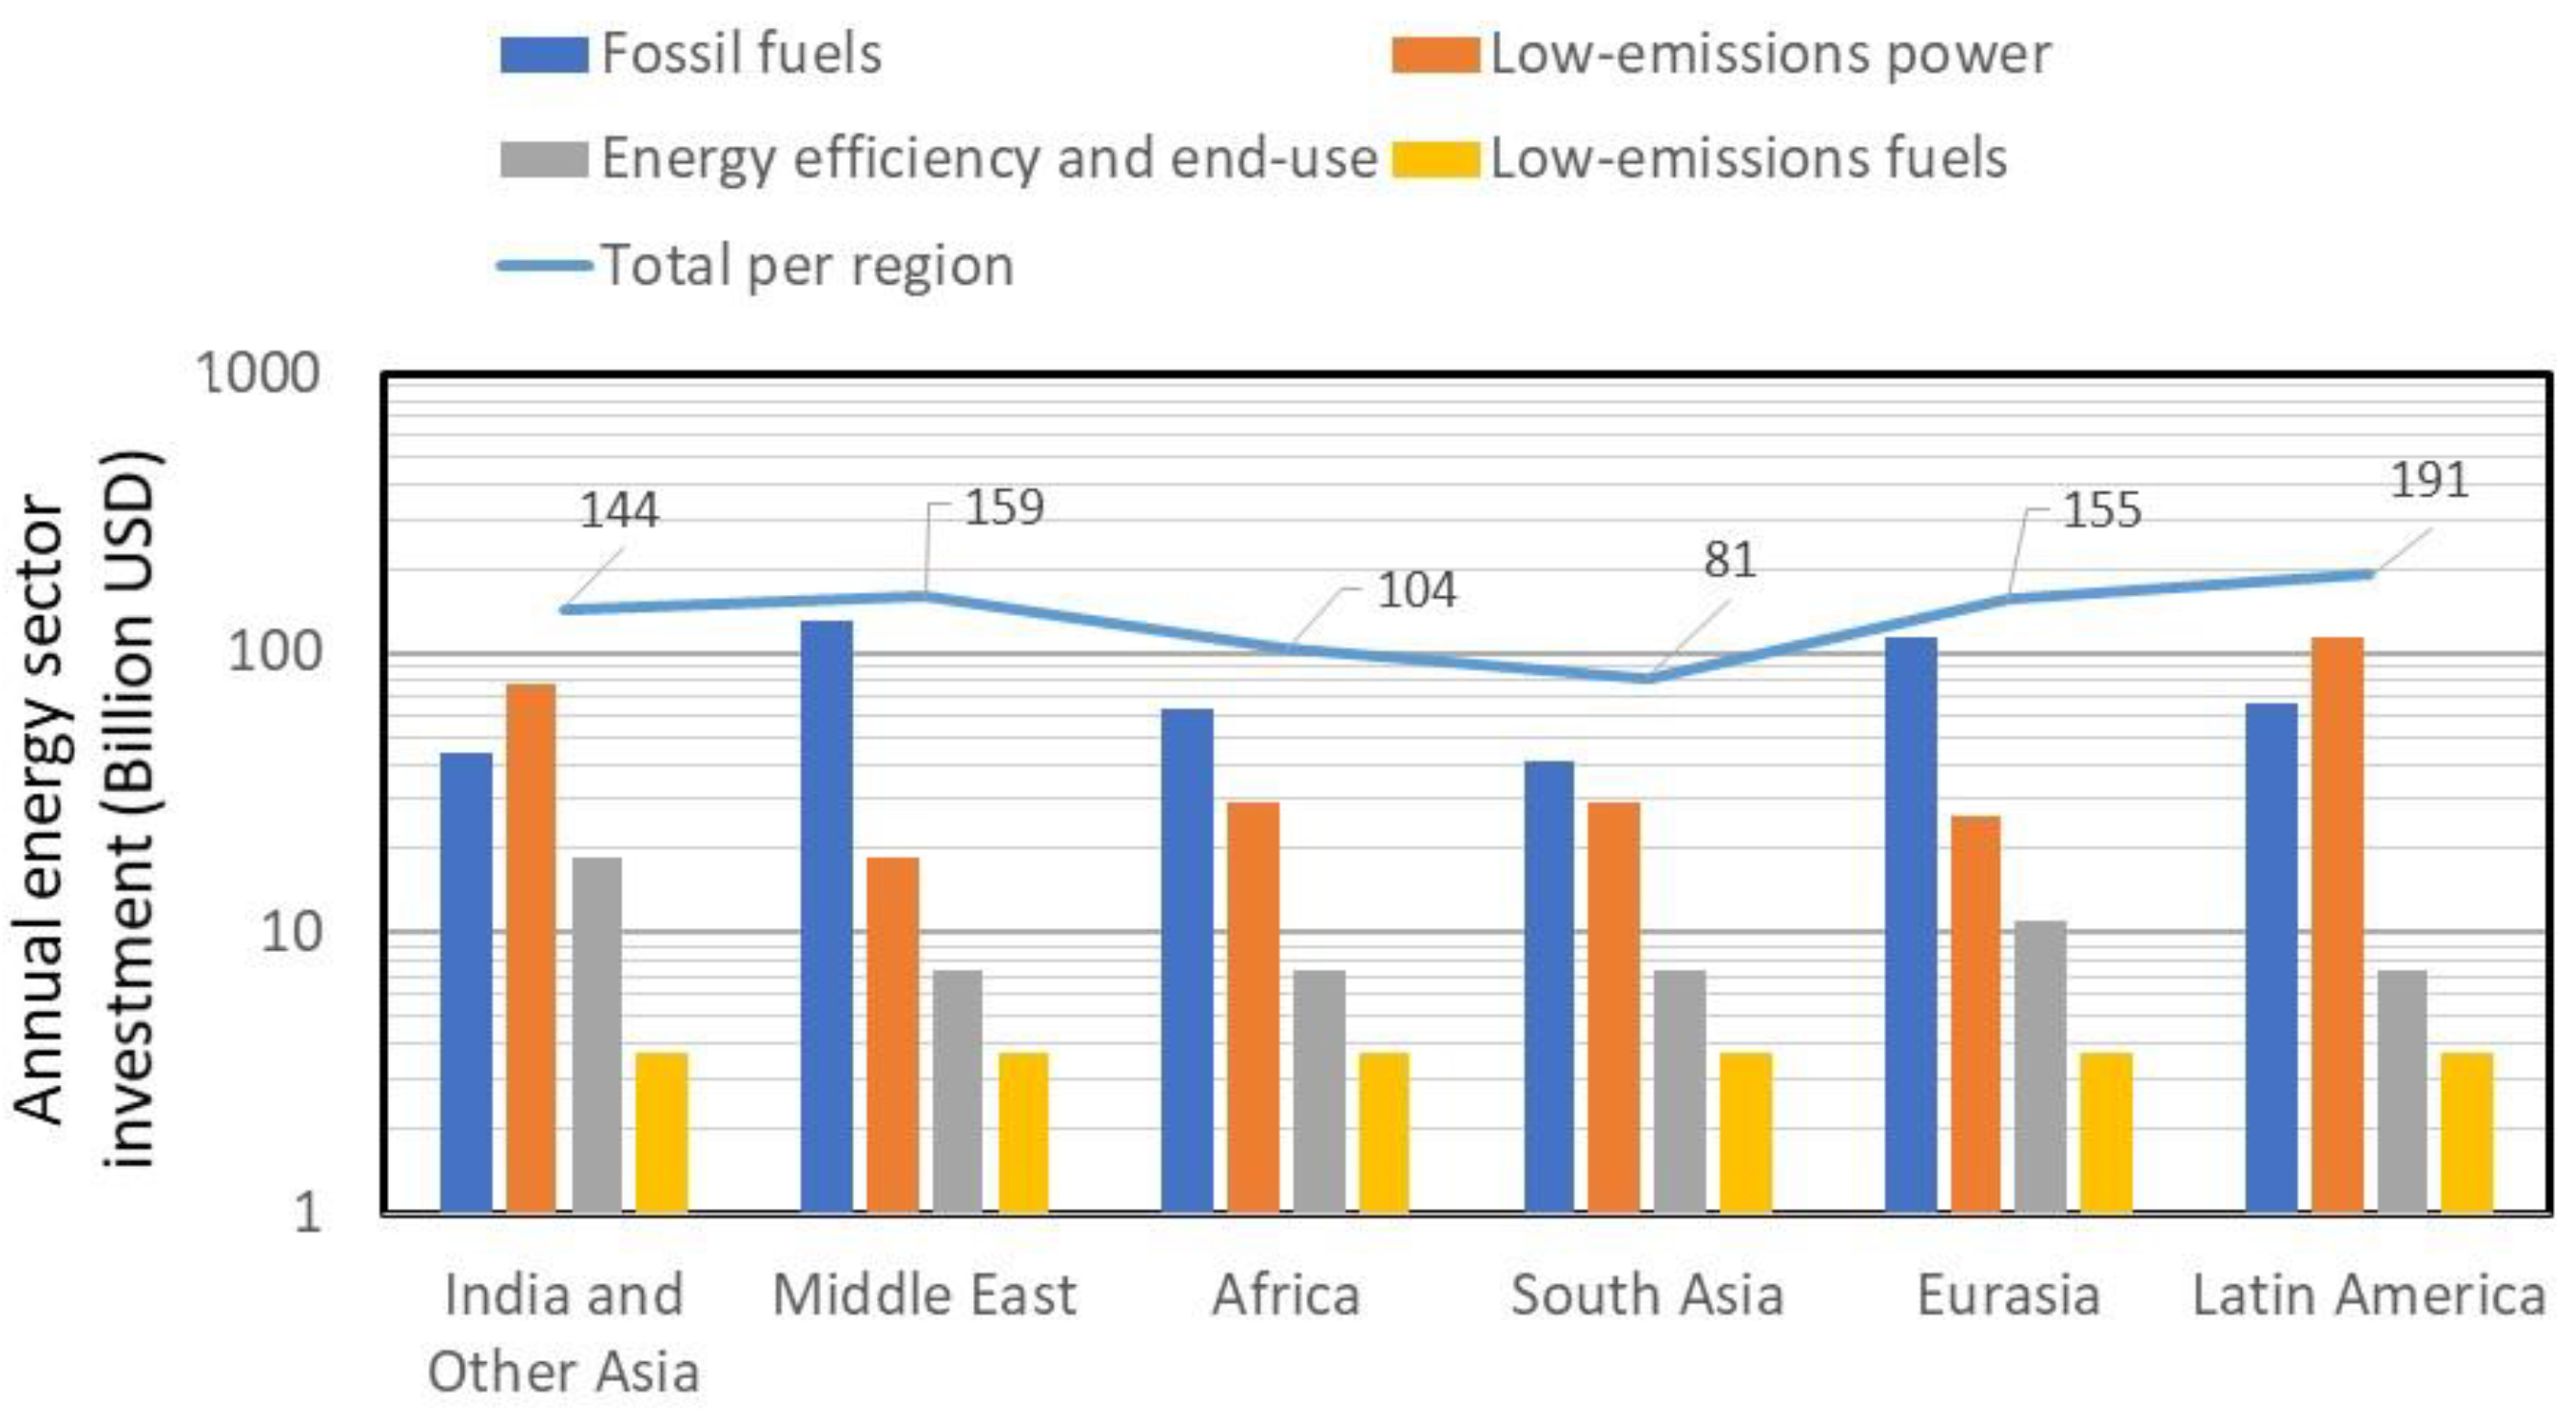
Figure 20.
Characteristics of energy sector financing, 2023.

Figure 21.
Worldwide renewable energy manufacturing investments, 2020-2024.
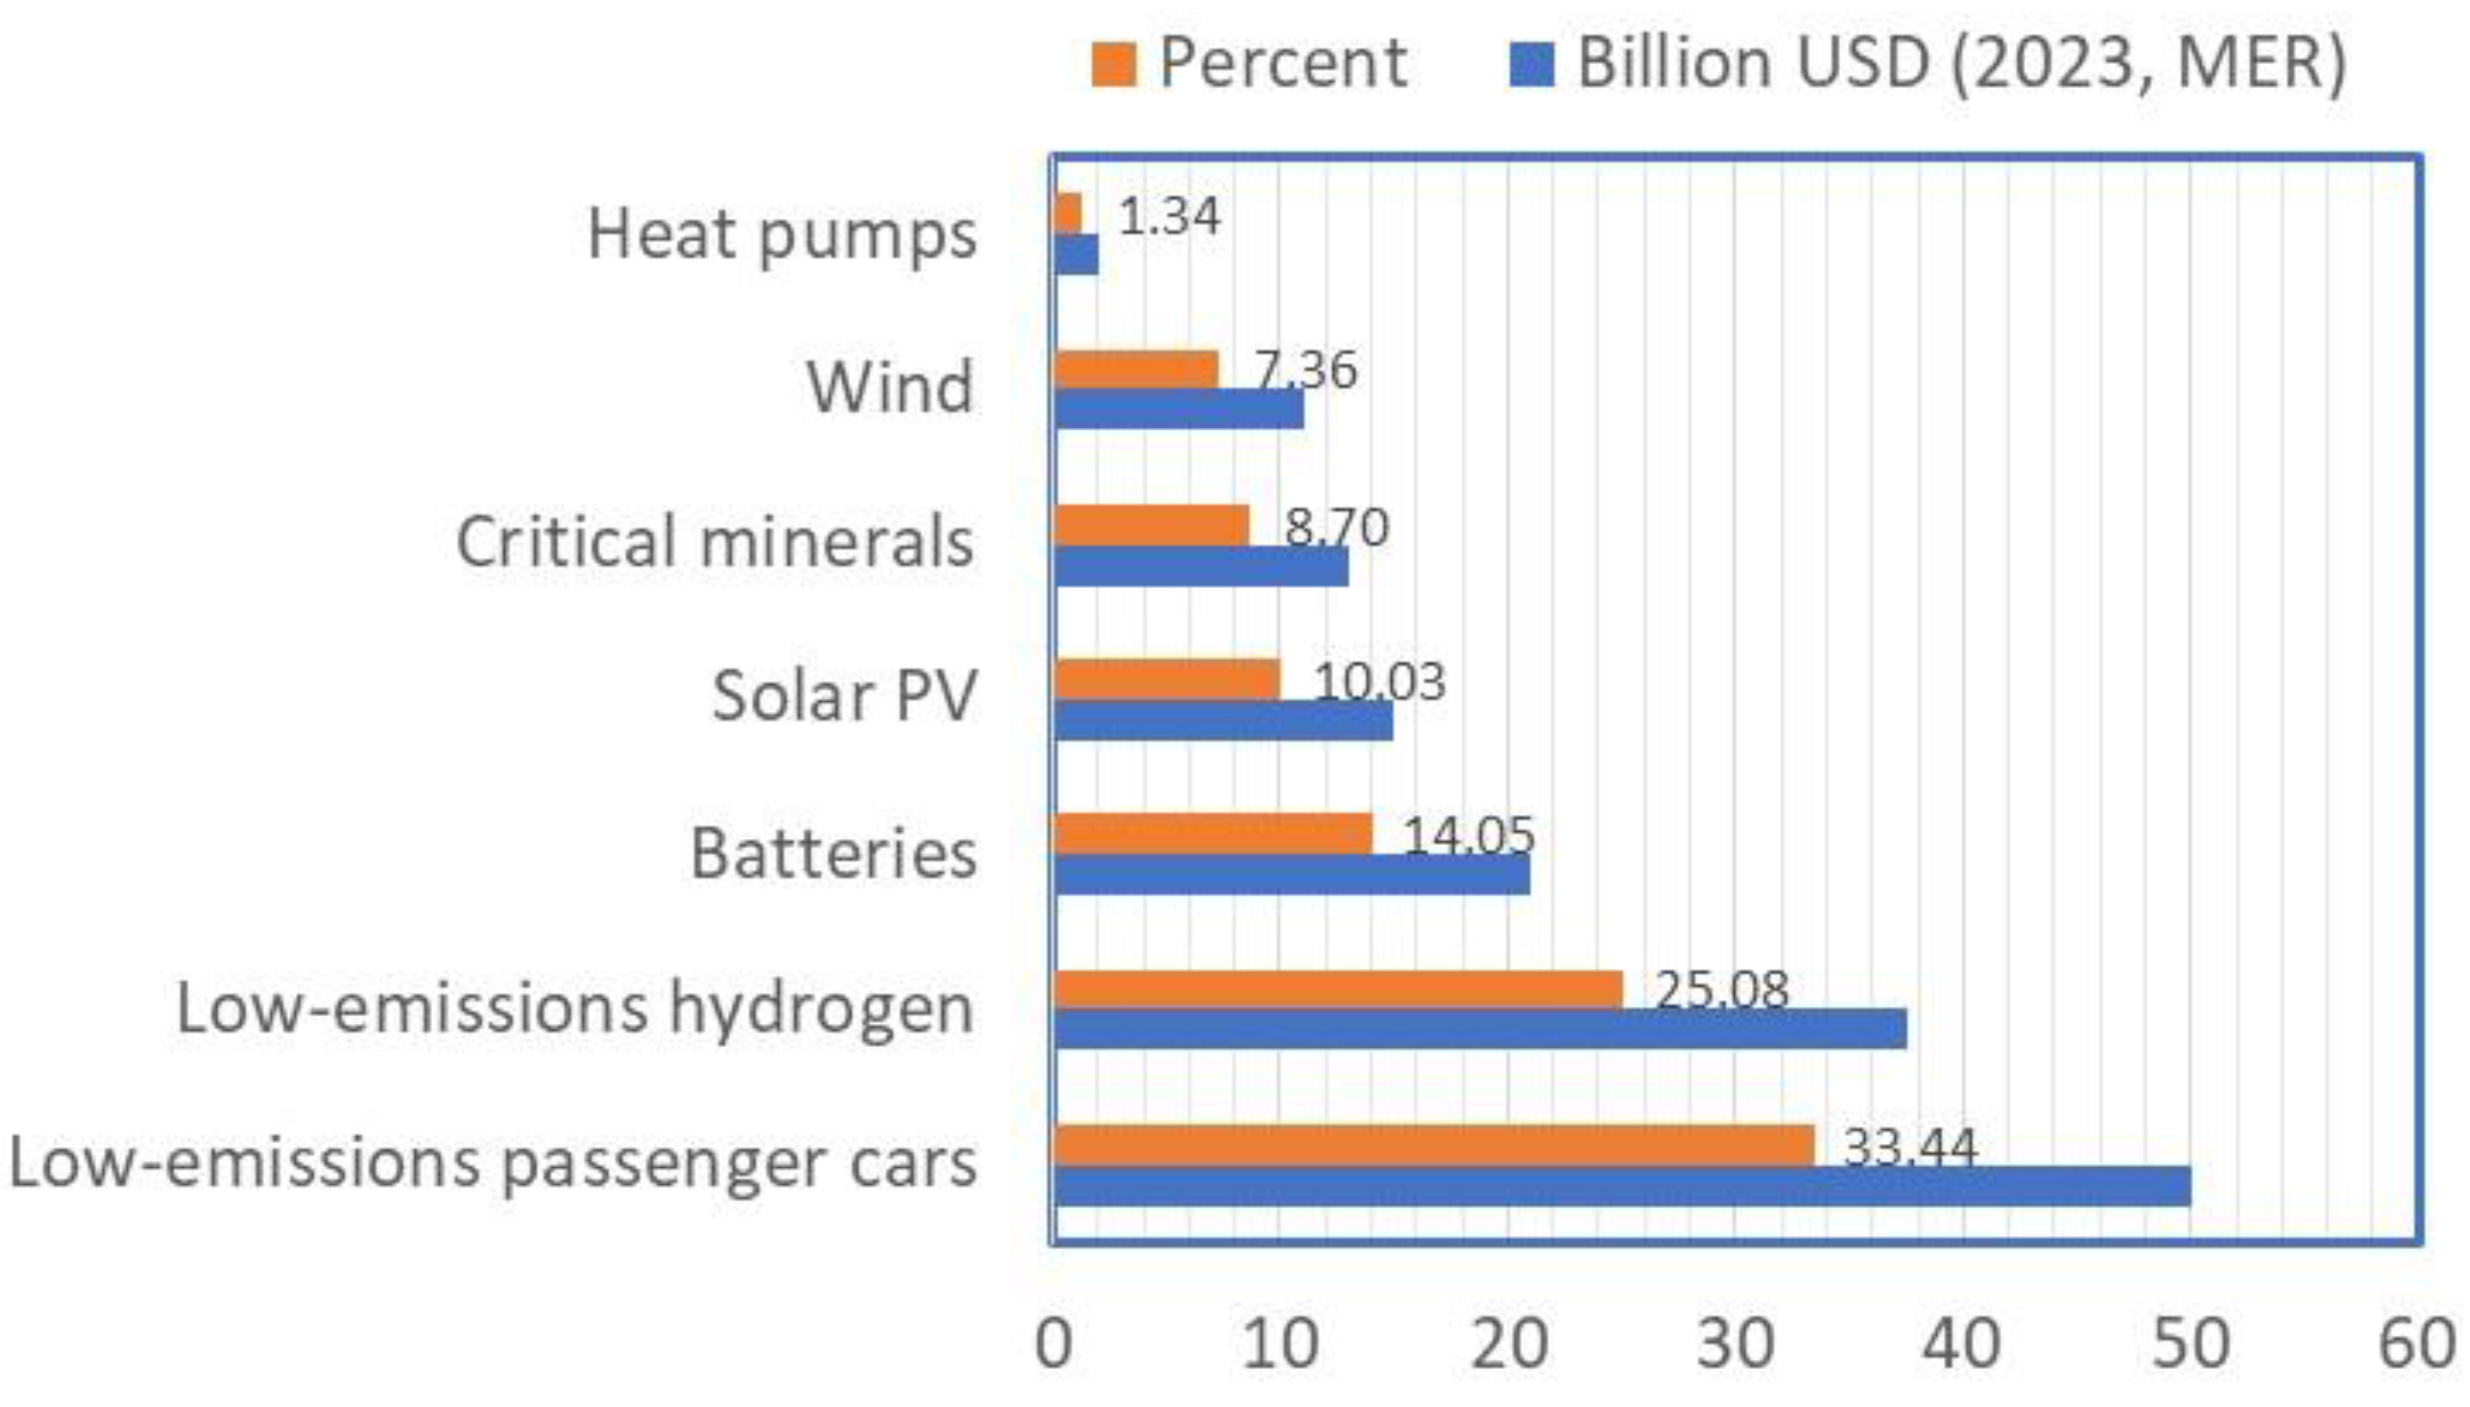
Figure 22.
Energy employment by technology, 2023.
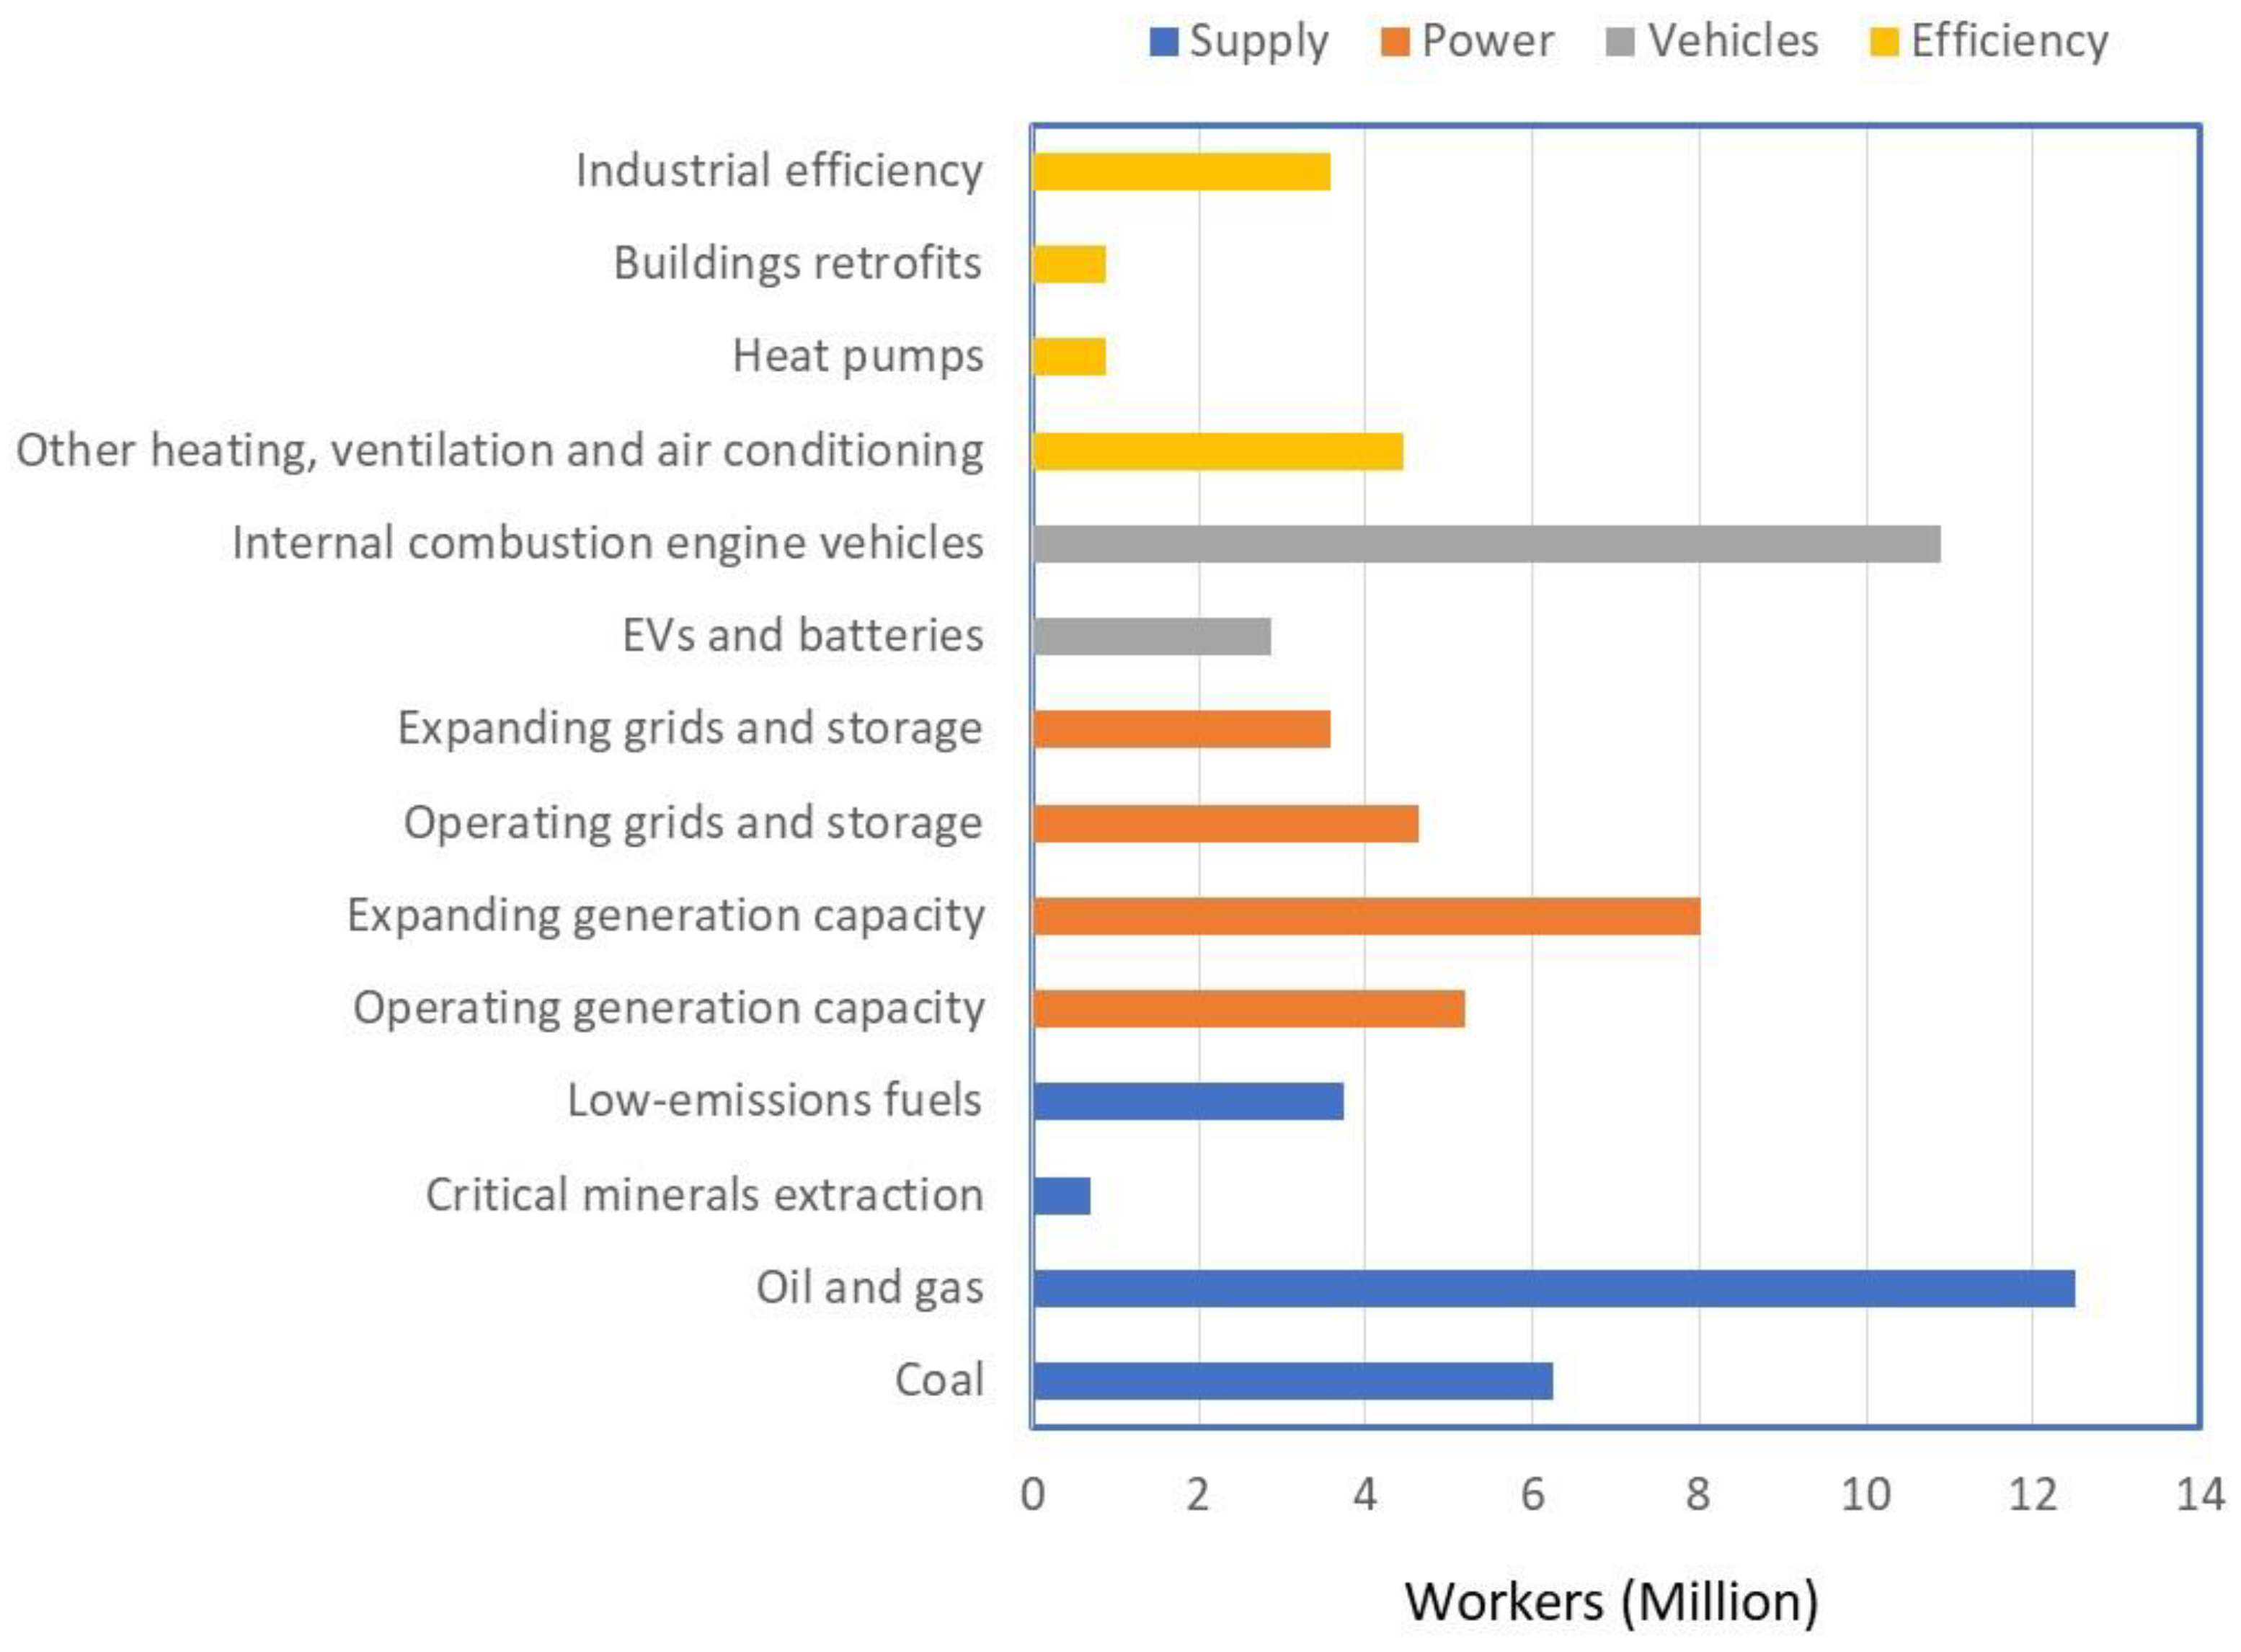
Figure 23.
Estimated manufacturing costs of clean energy technologies in different countries.
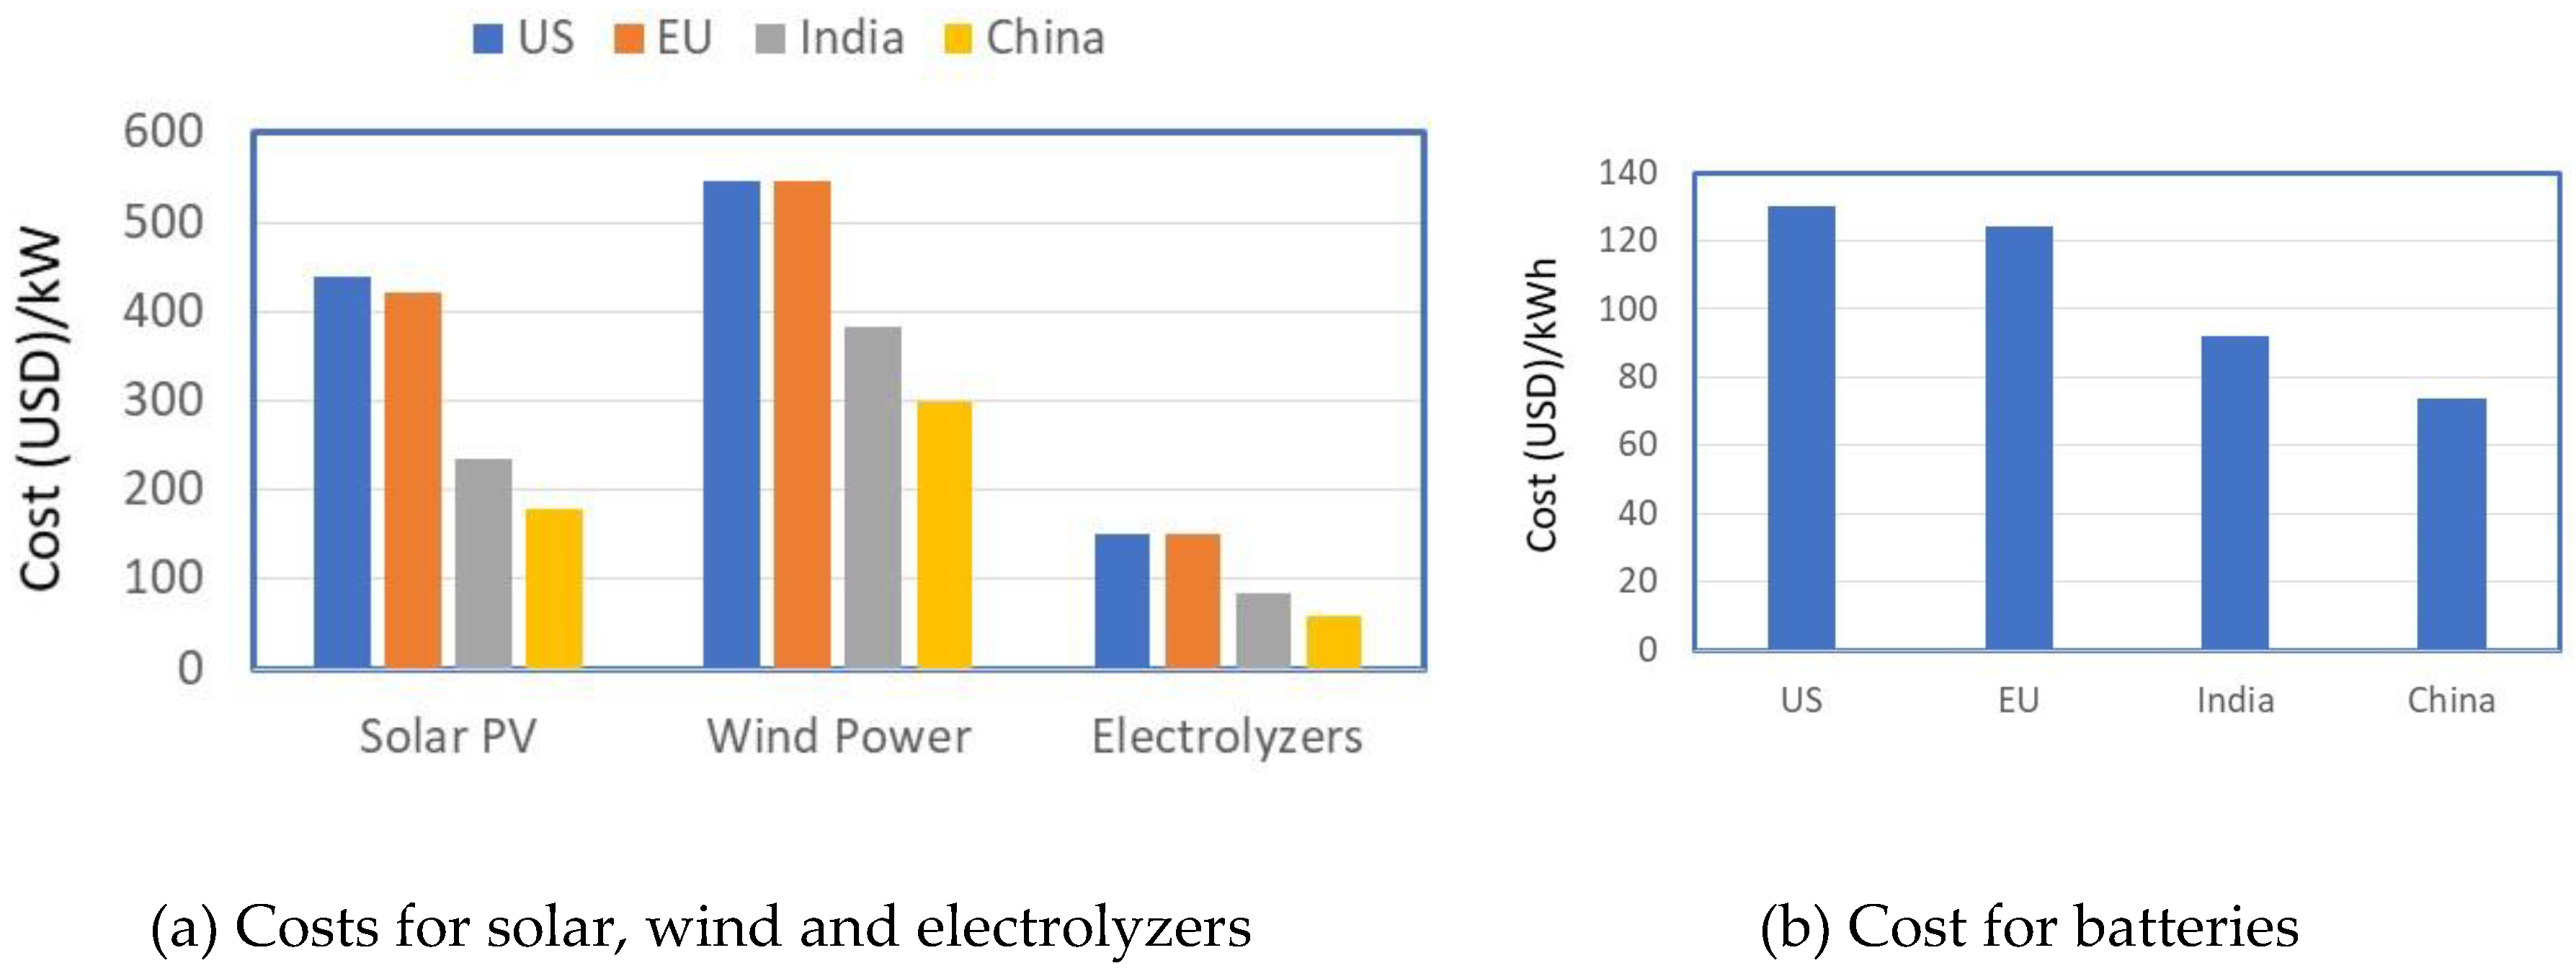
Figure 24.
Import status of oil and gas, 2023.
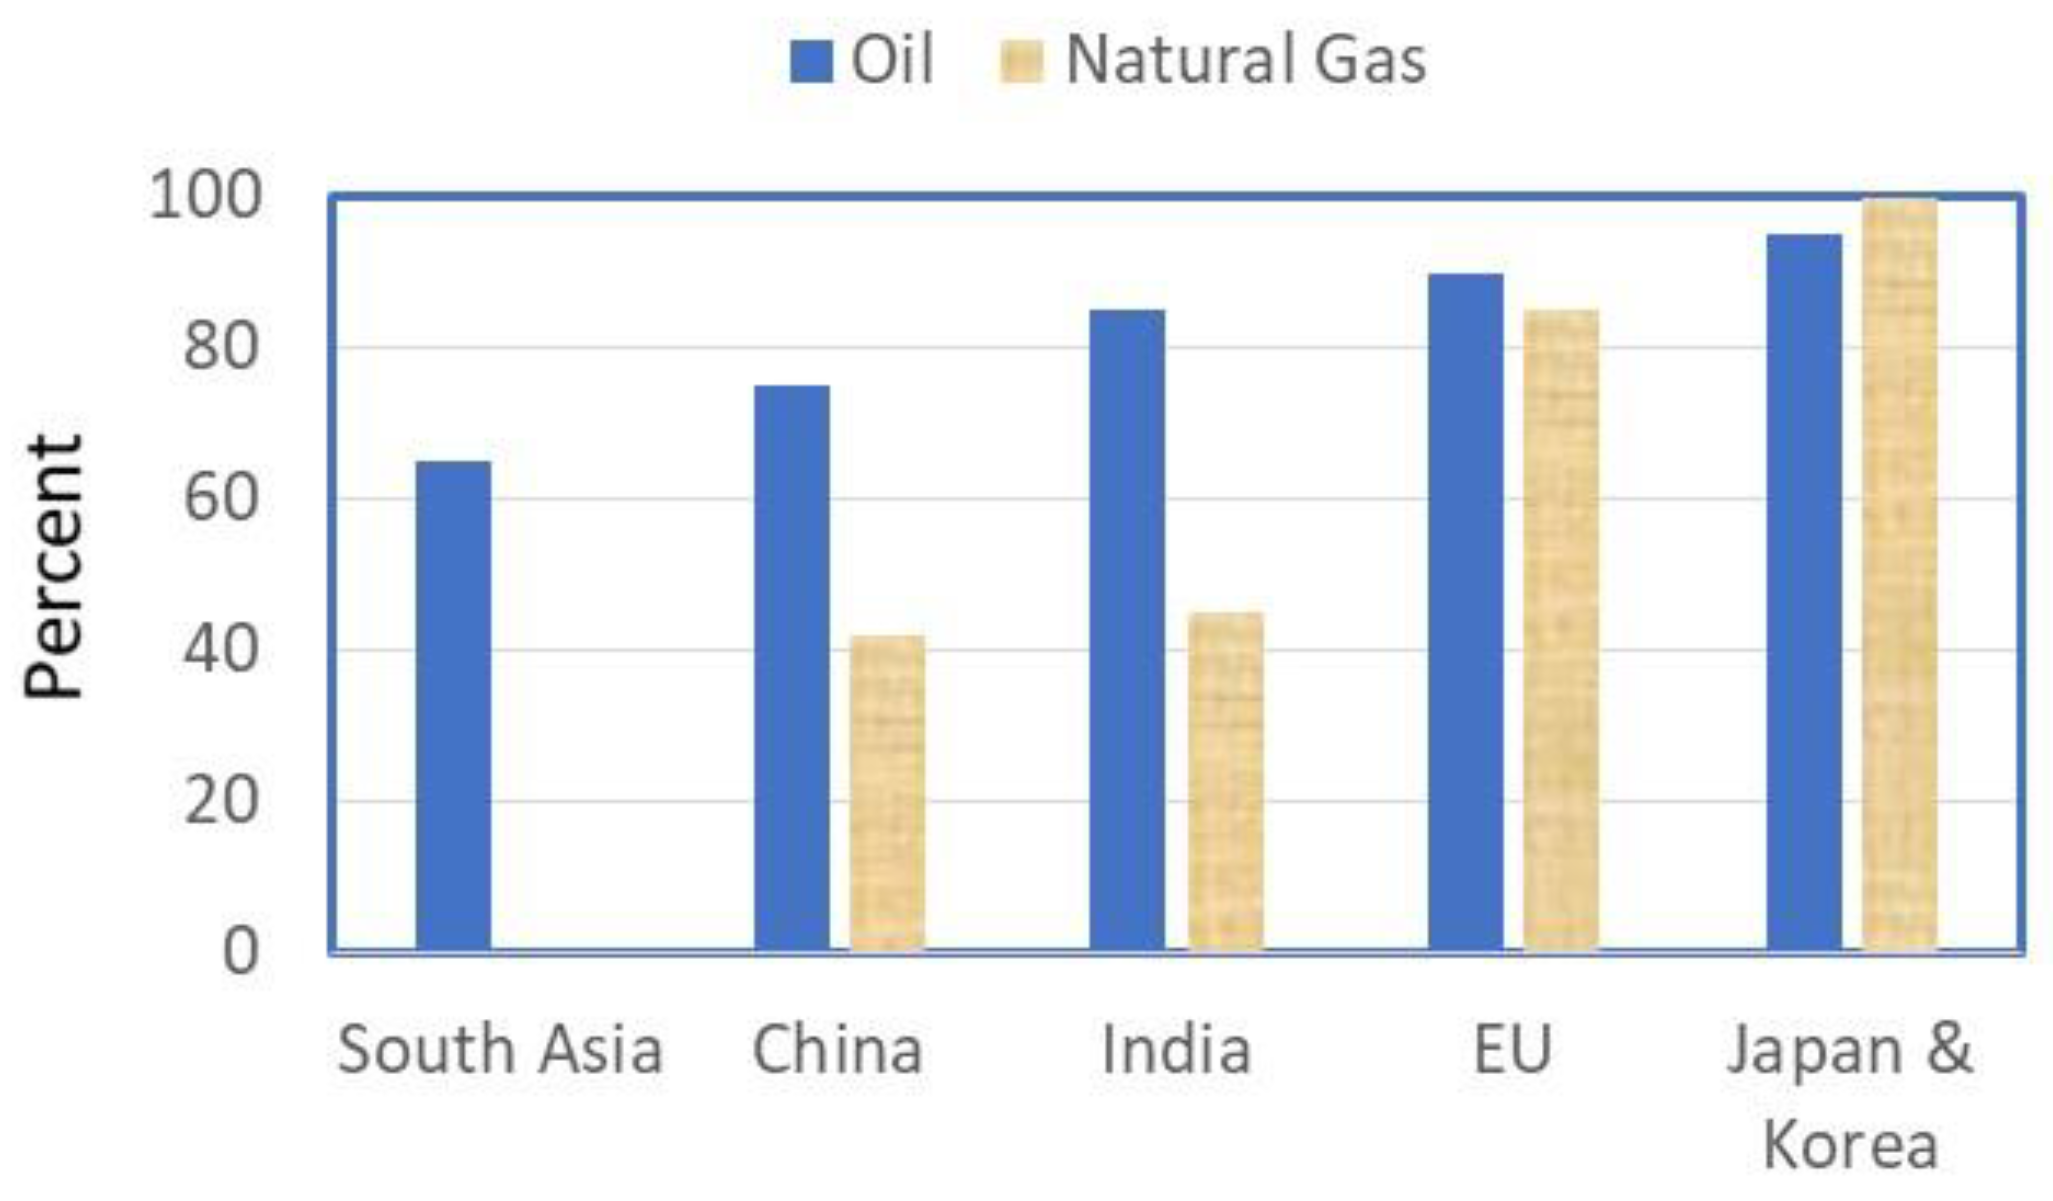

Table 1.
Linear and circular economy strategies.
| Strategy | Traditional approach | Circular economy approach |
|---|---|---|
| Material reduction | Each project uses its virgin materials | Optimal use of materials with circular design for durability, reuse, remanufacturing. For example, carbon fiber recovery through pyrolysis from wind turbine blades can minimize the use of raw carbon materials. |
| Recycling | Minimum recycling efforts with final disposal of waste in landfills | Full recycling potential of both materials and waste. For example, wind turbine blades are repurposed and reused as raw materials in construction projects. Also, critical minerals are recovered and reused in manufacturing of renewable energy projects. |
| Adaptive reuse | Generated waste is disposed of after each processing cycle | Circular design aspects for reconstruction for easy reworking and reuse after the lifecycle. For example, wind turbine blades can be reused as structural elements in civil works. |
| Resource efficiency | Minimum efficiency with maximum utilization of natural resources | Effective use of virgin materials with optimal recovery and reuse techniques. For example, clean carbon fibers from wind turbine blades can be recovered through thermal decomposition processes. |
| Waste management | Generated waste is disposed of in landfills | Environmental management strategies for recovery of valuable materials and minimization of waste quantities sent to landfills. |
Table 2.
Schemes for support of renewable energy manufacturing projects.
| Country | Direct incentive schemes | Technologies covered | Assigned Budget (Billion USD) |
|---|---|---|---|
| United States |
|
Mineral resources; renewables; electrification | 51 |
| Canada |
|
Renewables; electrification; mineral resources; CCUS infrastructures; | 34 |
| China |
|
Renewables; electrification | 26 |
| European Union |
|
Renewables; electrification | 24 |
| Australia |
|
Mineral resources; renewables; electrification | 13 |
| India |
|
Renewables; electrification | 12 |
| Japan |
|
Renewables, electrification | 3 |
| South Korea |
|
Renewables; electrification | 1 |
Table 3.
Sample of CCSU support policies.
| Country. | Year | Policy Name | Areas of Policy Coverage |
|---|---|---|---|
| Norway | 2023 |
|
Permitting processes |
| Germany | 2021 |
|
Payment, finance and taxation; Grants; Payments and transfer |
| Norway | 1991 |
|
Payment, finance and taxation; Carbon tax; GHG taxation; Taxes, fees and charges; Carbon capture, utilization and storage; Renewable energy; Industry sector processes and technology |
| United States | 2021 |
|
Energy efficiency; Technology, research and development, and innovation; Industry sector processes and technology; Aluminum; Iron and steel |
| Thailand | 2016 |
|
Energy efficiency; Road Vehicle; Transport technology; Battery electric; Drive train and engine; Plug-in-hybrid |
| Malaysia | 2011 |
|
Energy efficiency; Road Vehicle; Transport technology; Battery electric; Drive train and engine; Plug-in-hybrid |
| China |
|
Energy efficiency; Electrification; Road Vehicle; Transport technology | |
| Norway | 2022 |
|
Energy poverty; Energy security; Heating |
Table 4.
Samples of EVs supported policies.
| Country/region | Policy type | Description | Year |
|---|---|---|---|
| Canada | Enacted | By 2035, zero emissions. | 2023 |
| China | Enacted | Replacement strategies of oil and gas vehicles with EVs | 2024 |
| European Union | Enacted | By 2035, zero emissions of all operated cars | 2023 |
| India | Enacted | Replacement scheme for EVs | 2024 |
| United Kingdom | Enacted | By 2030, 80% of new cars and 70% of new vans must be electric; by 2035, all must be electric | 2024 |
| United States | Enacted | Funding for EVs infrastructures | 2021 |
| Australia | Goal | EVs sales and incentives. | 2023 |
| Indonesia | Goal | Specified targets for EVs passenger light-duty vehicle and electric motorcycles by 2030. | 2023 |
| Japan | Goal | All operated passenger cars must be EV by 2035, and by 2040 for all light commercial ones. | 2021 |
| Korea | Goal | By 2025, more than half of the car fleet must be EVs and by 2030 the percent increased to 83%. | 2021 |
| Mexico | Goal | By 2020 all operated passenger cars and buses must be EVs. | 2023 |
| New Zealand | Goal | By 2035, all new cars and van sales must be electric and 30% of the light-duty vehicle fleet. | 2021 |
| Pakistan | Goal | By 2030, 30% of passenger cars and 50% of two/three-wheeler sales must be electric; by 2040, 90% of truck sales to be electric. | 2019 |
| Viet Nam | Goal | By 2050, zero emissions in road operated vehicles. | 2022 |
Table 5.
Samples of digital systems that embrace circular economy.
| Digital systems name | Purpose | Expected benefits | Potential use |
|---|---|---|---|
| “Circulytics” | Circular economy monitoring system | Measuring circularity score | Assessing and enhancing the efficient use of resources |
| “Reath” | Data management system for reusable materials for packaging | Lifecycle tracking of material used in packaging | Reduction of packaging waste |
| “Globechain” | Reusable items marketplace | Community engagement for reusing of materials | Donation platform for unused materials |
| “Material Mapper” | Surplus building materials geolocation system | Redistribution mechanism for unused materials | Reduction of material waste |
| “Agraloop” | Digital system used in bio-refineries | Transforming of waste generated from crops to biodegradable fiber for use to manufacture cloth | In fashion industry to enhance sustainability and low carbon futures |
Disclaimer/Publisher’s Note: The statements, opinions and data contained in all publications are solely those of the individual author(s) and contributor(s) and not of MDPI and/or the editor(s). MDPI and/or the editor(s) disclaim responsibility for any injury to people or property resulting from any ideas, methods, instructions or products referred to in the content. |
© 2024 by the authors. Licensee MDPI, Basel, Switzerland. This article is an open access article distributed under the terms and conditions of the Creative Commons Attribution (CC BY) license (http://creativecommons.org/licenses/by/4.0/).
Copyright: This open access article is published under a Creative Commons CC BY 4.0 license, which permit the free download, distribution, and reuse, provided that the author and preprint are cited in any reuse.


