
Submitted:
28 November 2024
Posted:
29 November 2024
You are already at the latest version
Preprints on COVID-19 and SARS-CoV-2
Abstract
Background: The global rise in obesity and related comorbidities has been significantly influenced by shifts in dietary habits, exacerbated by external factors such as the COVID-19 pandemic. This study aims to analyze the trends in Romanian dietary habits from 2015 to 2023, focusing on the impact of the COVID-19 pandemic and the role of socio-economic factors, seasonality, and cultural practices. Methods: We used nationally representative data from the Romanian Household Budget Survey, which includes 30,000 households annually. The analysis is adjusted for seasonality and regional factors, ensuring a comprehensive understanding of the changes in dietary behavior. Results: During the COVID-19 pandemic, daily calorie consumption surged to over 3,000 calories per person, representing a 20% increase compared to the pre-pandemic period. Post-pandemic, food consumption remains elevated, averaging 2,500-2,600 calories per person daily. The pandemic also led to a shift in dietary composition, with a significant increase in fat and carbohydrate intake, while protein consumption decreased. Conclusions: The COVID-19 pandemic has had a lasting impact on Romanian dietary habits, reinforcing unhealthy eating patterns that were already prevalent. The sustained increase in calorie consumption, particularly of nutrient-poor, energy-dense foods, poses a significant public health challenge. The study also highlights significant seasonal variations, with a marked increase in food intake during the last quarter of the year, driven by cultural and religious traditions. These findings underscore the need for targeted public health interventions and policies that address economic factors and cultural and regional influences to promote healthier dietary behaviors in Romania.
Keywords:
dietary habits
; food choice
; COVID-19
; panel regression
; Romania
Ștefan Strilciuc 2,3,*
Bogdan-Vasile Ileanu 1,4
1 Center for Health Outcomes & Evaluation, Splaiul Unirii 45, 030126 Bucharest, Romania
2 Department of Genomics, MEDFUTURE Institute for Biomedical Research, Iuliu Hațieganu University of Medicine and Pharmacy, 400337 Cluj-Napoca, Romania
3 RoNeuro Institute for Neurological Research and Diagnostic, 400364 Cluj-Napoca, Romania
4 Department of Statistics and Econometrics, Bucharest University of Economic Studies, 010552 Bucharest, Romania
1. Introduction
The global prevalence of overweight and obesity has reached alarming levels, with the World Health Organization (WHO) reporting in 2022 that nearly 60% of adults and one-third of children are now classified as overweight or obese [1]. This surge in unhealthy weight has become a critical public health issue, driven by a complex interplay of dietary habits, lifestyle factors, and socio-economic conditions. Over the last decade, the rise in obesity and its associated comorbidities has been linked to increased consumption of calorie-dense foods, particularly those rich in refined sugars, fats, and processed meats [2]. Modern sedentary lifestyles have exacerbated these dietary trends, characterized by decreased physical activity and prolonged periods of inactivity.
The situation mirrors global trends in Romania but is further compounded by specific local factors, such as traditional dietary patterns and socio-economic disparities. Romania has one of the highest rates of overweight and alcohol consumption in Europe [3,4]. The country’s dietary habits are heavily influenced by cultural practices, religious traditions, and seasonal variations, contributing to significant fluctuations in food intake throughout the year.
The COVID-19 pandemic introduced unprecedented challenges that further altered dietary behaviors on a global scale. In response to the pandemic, many countries, including Romania, implemented strict measures to curb the spread of the virus. These measures included lockdowns, social distancing, and the closure of various cultural, social, and economic activities, many closely associated with food consumption. Mobility restrictions within and between countries disrupted daily routines, leading to a sharp decline in physical activity as sports facilities closed and many jobs transitioned to remote work [5]. The pandemic also caused significant disruptions in supply chains, affecting the availability and variety of food products and influencing consumption patterns [6]. These disruptions, coupled with heightened levels of stress, anxiety, and depression, led to a shift toward unhealthy eating habits characterized by increased consumption of comfort foods high in fats, sugars, and carbohydrates.
While the literature provides ample evidence of changes in dietary habits during the COVID-19 pandemic, the findings are mixed. Some studies report positive nutritional changes, such as an increase in the consumption of fruits and vegetables, as individuals seek to boost their immunity [7,8,9]. Other studies present a more nuanced picture, indicating positive and negative dietary shifts or no significant changes [10,11]. However, a substantial body of research suggests a general trend toward unhealthy eating behaviors during the pandemic, with a marked increase in the consumption of calorie-dense, nutrient-poor foods, including sugary snacks, processed meats, and fast food [12,13,14,15,16,17,18].
In Romania, the impact of the COVID-19 pandemic on dietary habits still needs to be explored, particularly in long-standing cultural practices and seasonal nutritional patterns. Given the country’s high prevalence of overweight and other diet-related health issues, it is crucial to understand how the pandemic may have exacerbated these trends. This study aims to fill this gap by analyzing the evolution of dietary habits in Romania from 2015 to 2023, specifically focusing on the effects of the COVID-19 pandemic and the subsequent recovery period. By utilizing nationally representative data from the Household Budget Survey (HBS) provided by the Romanian National Institute of Statistics (NIS), this study offers a comprehensive overview of how Romanian dietary patterns have evolved and the socioeconomic, seasonal, and regional factors that have influenced these changes.
This study is particularly timely given the ongoing public health challenges associated with obesity and diet-related chronic diseases. The findings are expected to contribute to the development of targeted public health interventions and policies aimed at improving dietary habits and reducing the burden of obesity in Romania. Furthermore, the insights gained from this study may have broader implications for understanding the long-term impact of global crises, such as the COVID-19 pandemic, on dietary behaviors and public health.
2. Materials and Methods
The primary dataset includes the average monthly per capita consumption for the eight Romanian NUTS 2 regions, covering 19 major food items or groups. This dataset spans 33 quarters, from Q1 2015 to Q1 2023. The Romanian National Institute of Statistics (NIS) provides nationally representative data through the Household Budget Survey (HBS), available via the TEMPO online database [19,20,21], following Eurostat regulations [22]. Additionally, TEMPO offers data on monthly income [23], the consumer price index (CPI) [24], and the unemployment rate (UR) [25].
Local data are reported in calories only by main product groups. To achieve more detailed product-level data, we utilized information from the United States Department of Agriculture [26], converting all average values from physical units per person per month to calories per person per day.
Our approach is grounded in Keynesian consumption theory [27,28], which is well-recognized [29] and widely applied in numerous studies [30]. This theory posits income as the primary driver of consumption. We augment this basic model with additional variables, such as the consumer price index (CPI) and unemployment rate (UR). Regional factors specific to Romania are also incorporated into the models through intercepts.
Initially, descriptive statistics are used to assess the state and dynamics of monthly consumption. Following methodologies from similar studies [17], we define two types of panel models for each product category:
- (a)
- The static fixed effects panel model (FE) has the following form:
- (b)
- Dynamic panel models, with the form:
We applied several statistical tests, including the HEGY panel unit root test [31], the panel Durbin-Watson test (pDW) for residual autocorrelation, and Fisher and R-squared statistics, to assess the validity of the OLS model assumptions. The Sargan-Hansen (S-H) test validated the instruments in the GMM models [32]. A p-value of 0.05 was used as the threshold for statistical significance. All computations and econometric analyses were conducted using Microsoft Excel (2018) [33] and R-Studio (R Core Team 2024) [34].
3. Results
3.1. Main Aspects Related to Food Consumption
2015 Romania’s average daily food consumption was approximately 2,400 calories per person. This level remained relatively stable until 2019 when the mean daily intake rose to 2,505 calories. However, during the COVID-19 pandemic, daily food intake surged to over 3,000 calories per person. By 2021-2023, consumption had decreased to around 2,500-2,600 calories per day, varying across seasons and regions. In the northeastern and southeastern regions, intake gradually increased, peaking in the last quarter of 2020. Conversely, in the western, northwestern, and central regions, consumption spiked early in 2020 before declining through Q1 2023.
Figure 1.
Trends of total food consumption by NUTS 2 region.
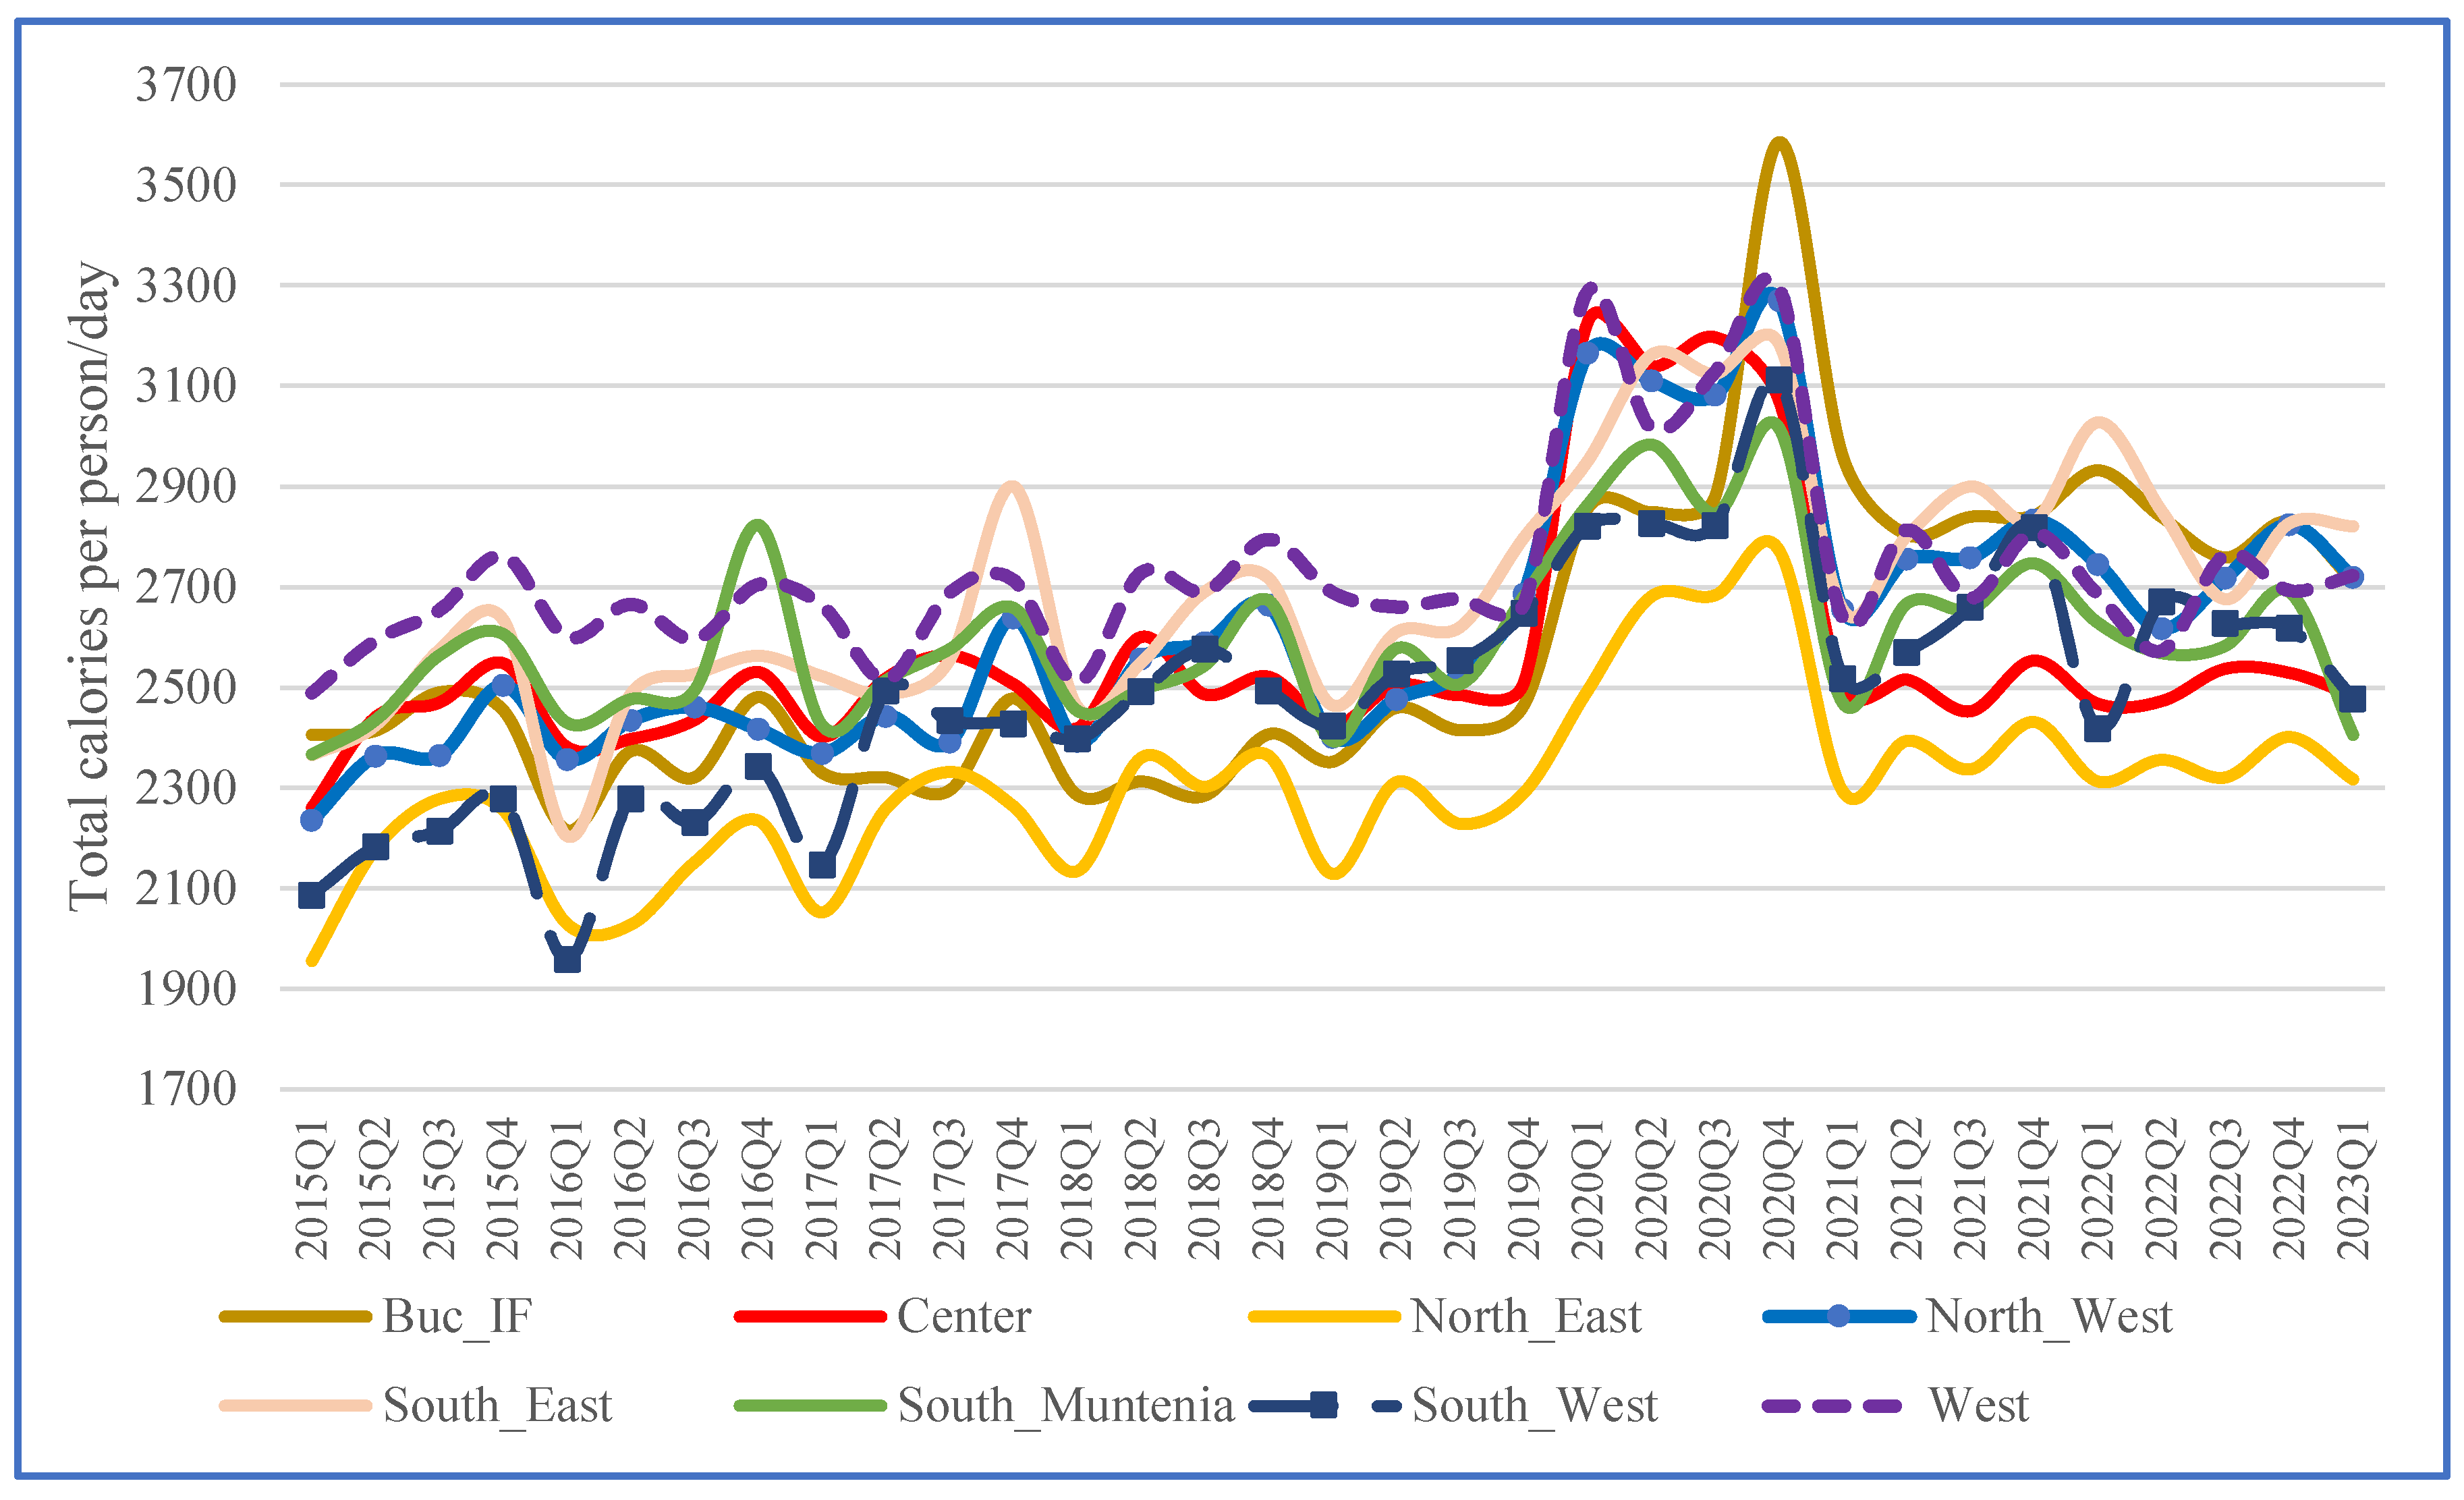
The Bucharest-Ilfov (BIF) region, Romania’s most developed area, experienced the most significant changes. By 2021-2023, calorie consumption in most regions had returned to pre-pandemic levels, with notable exceptions in the southeast (SE) and southwest (SW) regions. In SE, average consumption remained slightly higher than in the preceding five years. In contrast, the SW region exhibited a pronounced overall increase, with consumption rising from nearly 2,100 calories per day to over 3,300 calories during the peak of the COVID-19 pandemic and stabilizing above 2,500 calories per day by the end of the study period.
The analysis of major food groups at the national level between 2015 and 2019 revealed that carbohydrates made up 70-75% of daily intake. Regional dietary patterns showed that in the West (W), North-West (NW), North-East (NE), and Bucharest-Ilfov (BIF) regions, the proportion of carbohydrates was lower.
In contrast, in the other regions, it converged toward 75% (Figure 2). Protein consumption generally remained below 10% of daily intake, except Bucharest-Ilfov, which reached 11% before the COVID-19 pandemic.
Fats accounted for the remaining 20% of daily intake. Across all regions and throughout 2020, the share of fat intake increased significantly, with a surge ranging from 5 to 15 percentage points (p.p.) compared to the average of the previous five years. The most minor change occurred in the South-West (SW) region, with an increase of 5 p.p., while the most significant rise of nearly 15 p.p. was observed in the Bucharest-Ilfov area. Consequently, the share of proteins and carbohydrates decreased across all regions. The study further examined changes in food expenditures by core categories—fats, carbohydrates, and proteins.
As shown in Figure 3, the lockdown period saw a significant increase in the consumption of cheese and cream, raw fats, eggs, non-alcoholic drinks, and jams in the Bucharest-Ilfov region. While other regions also experienced increases in certain products, particularly eggs, the growth was less pronounced than in the capital. The econometric analysis highlights these regional variations.
3.2. Econometric Modeling and Main Outcomes
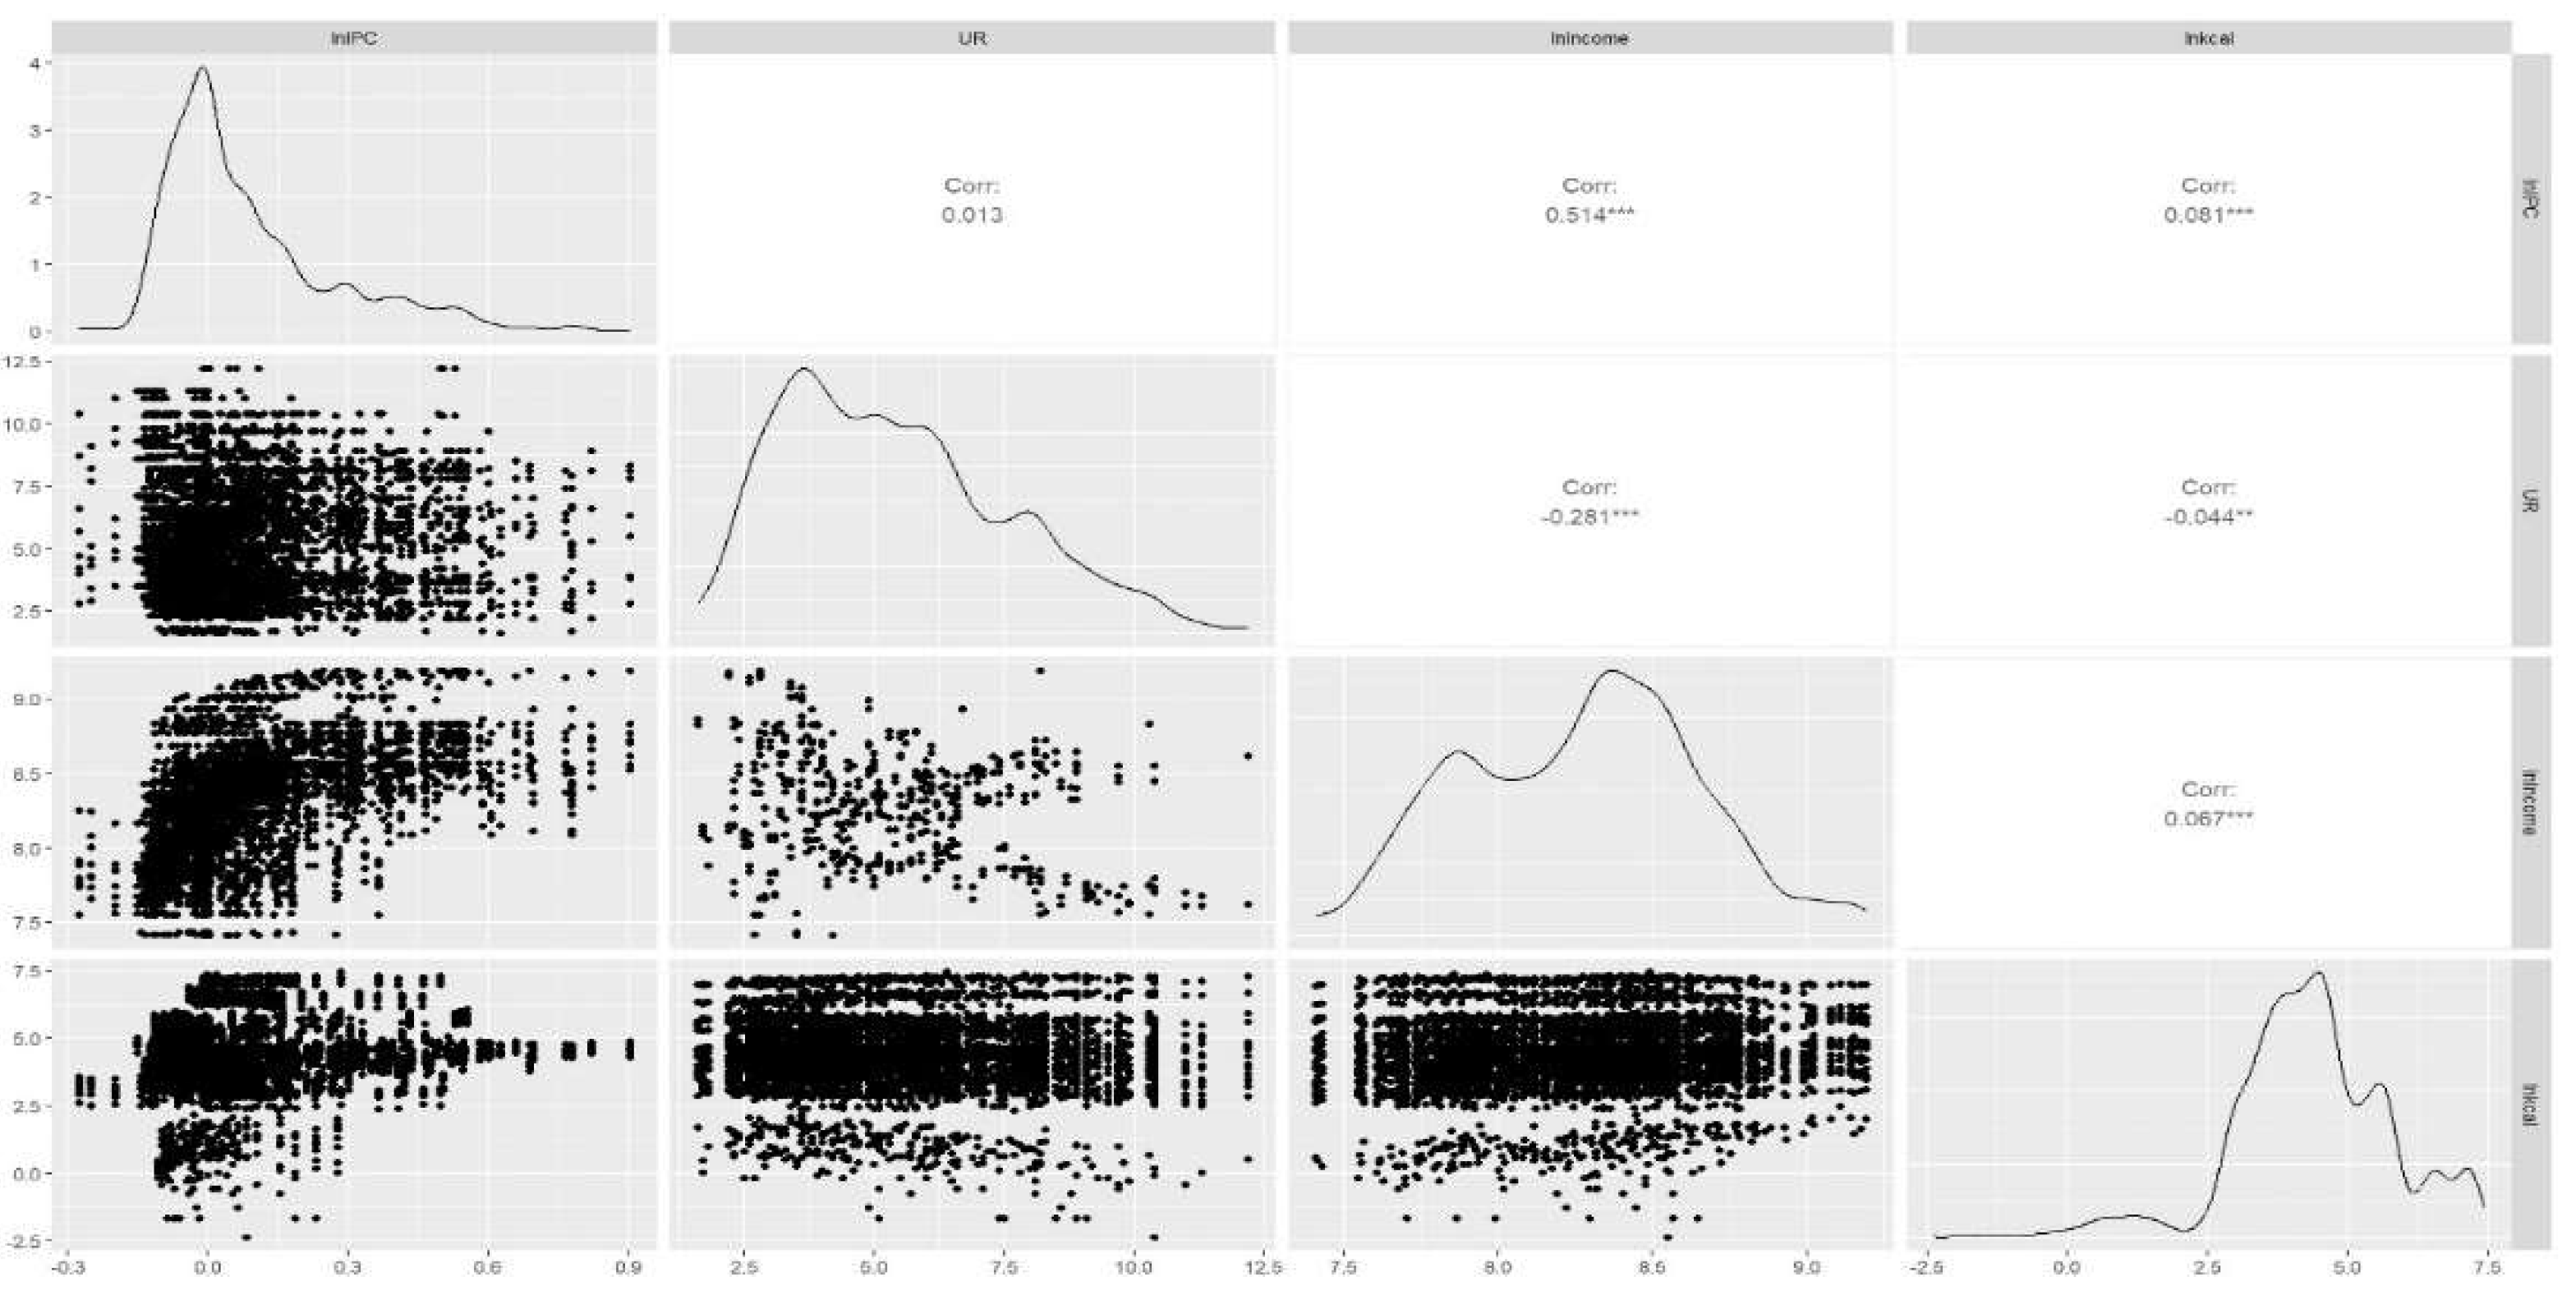
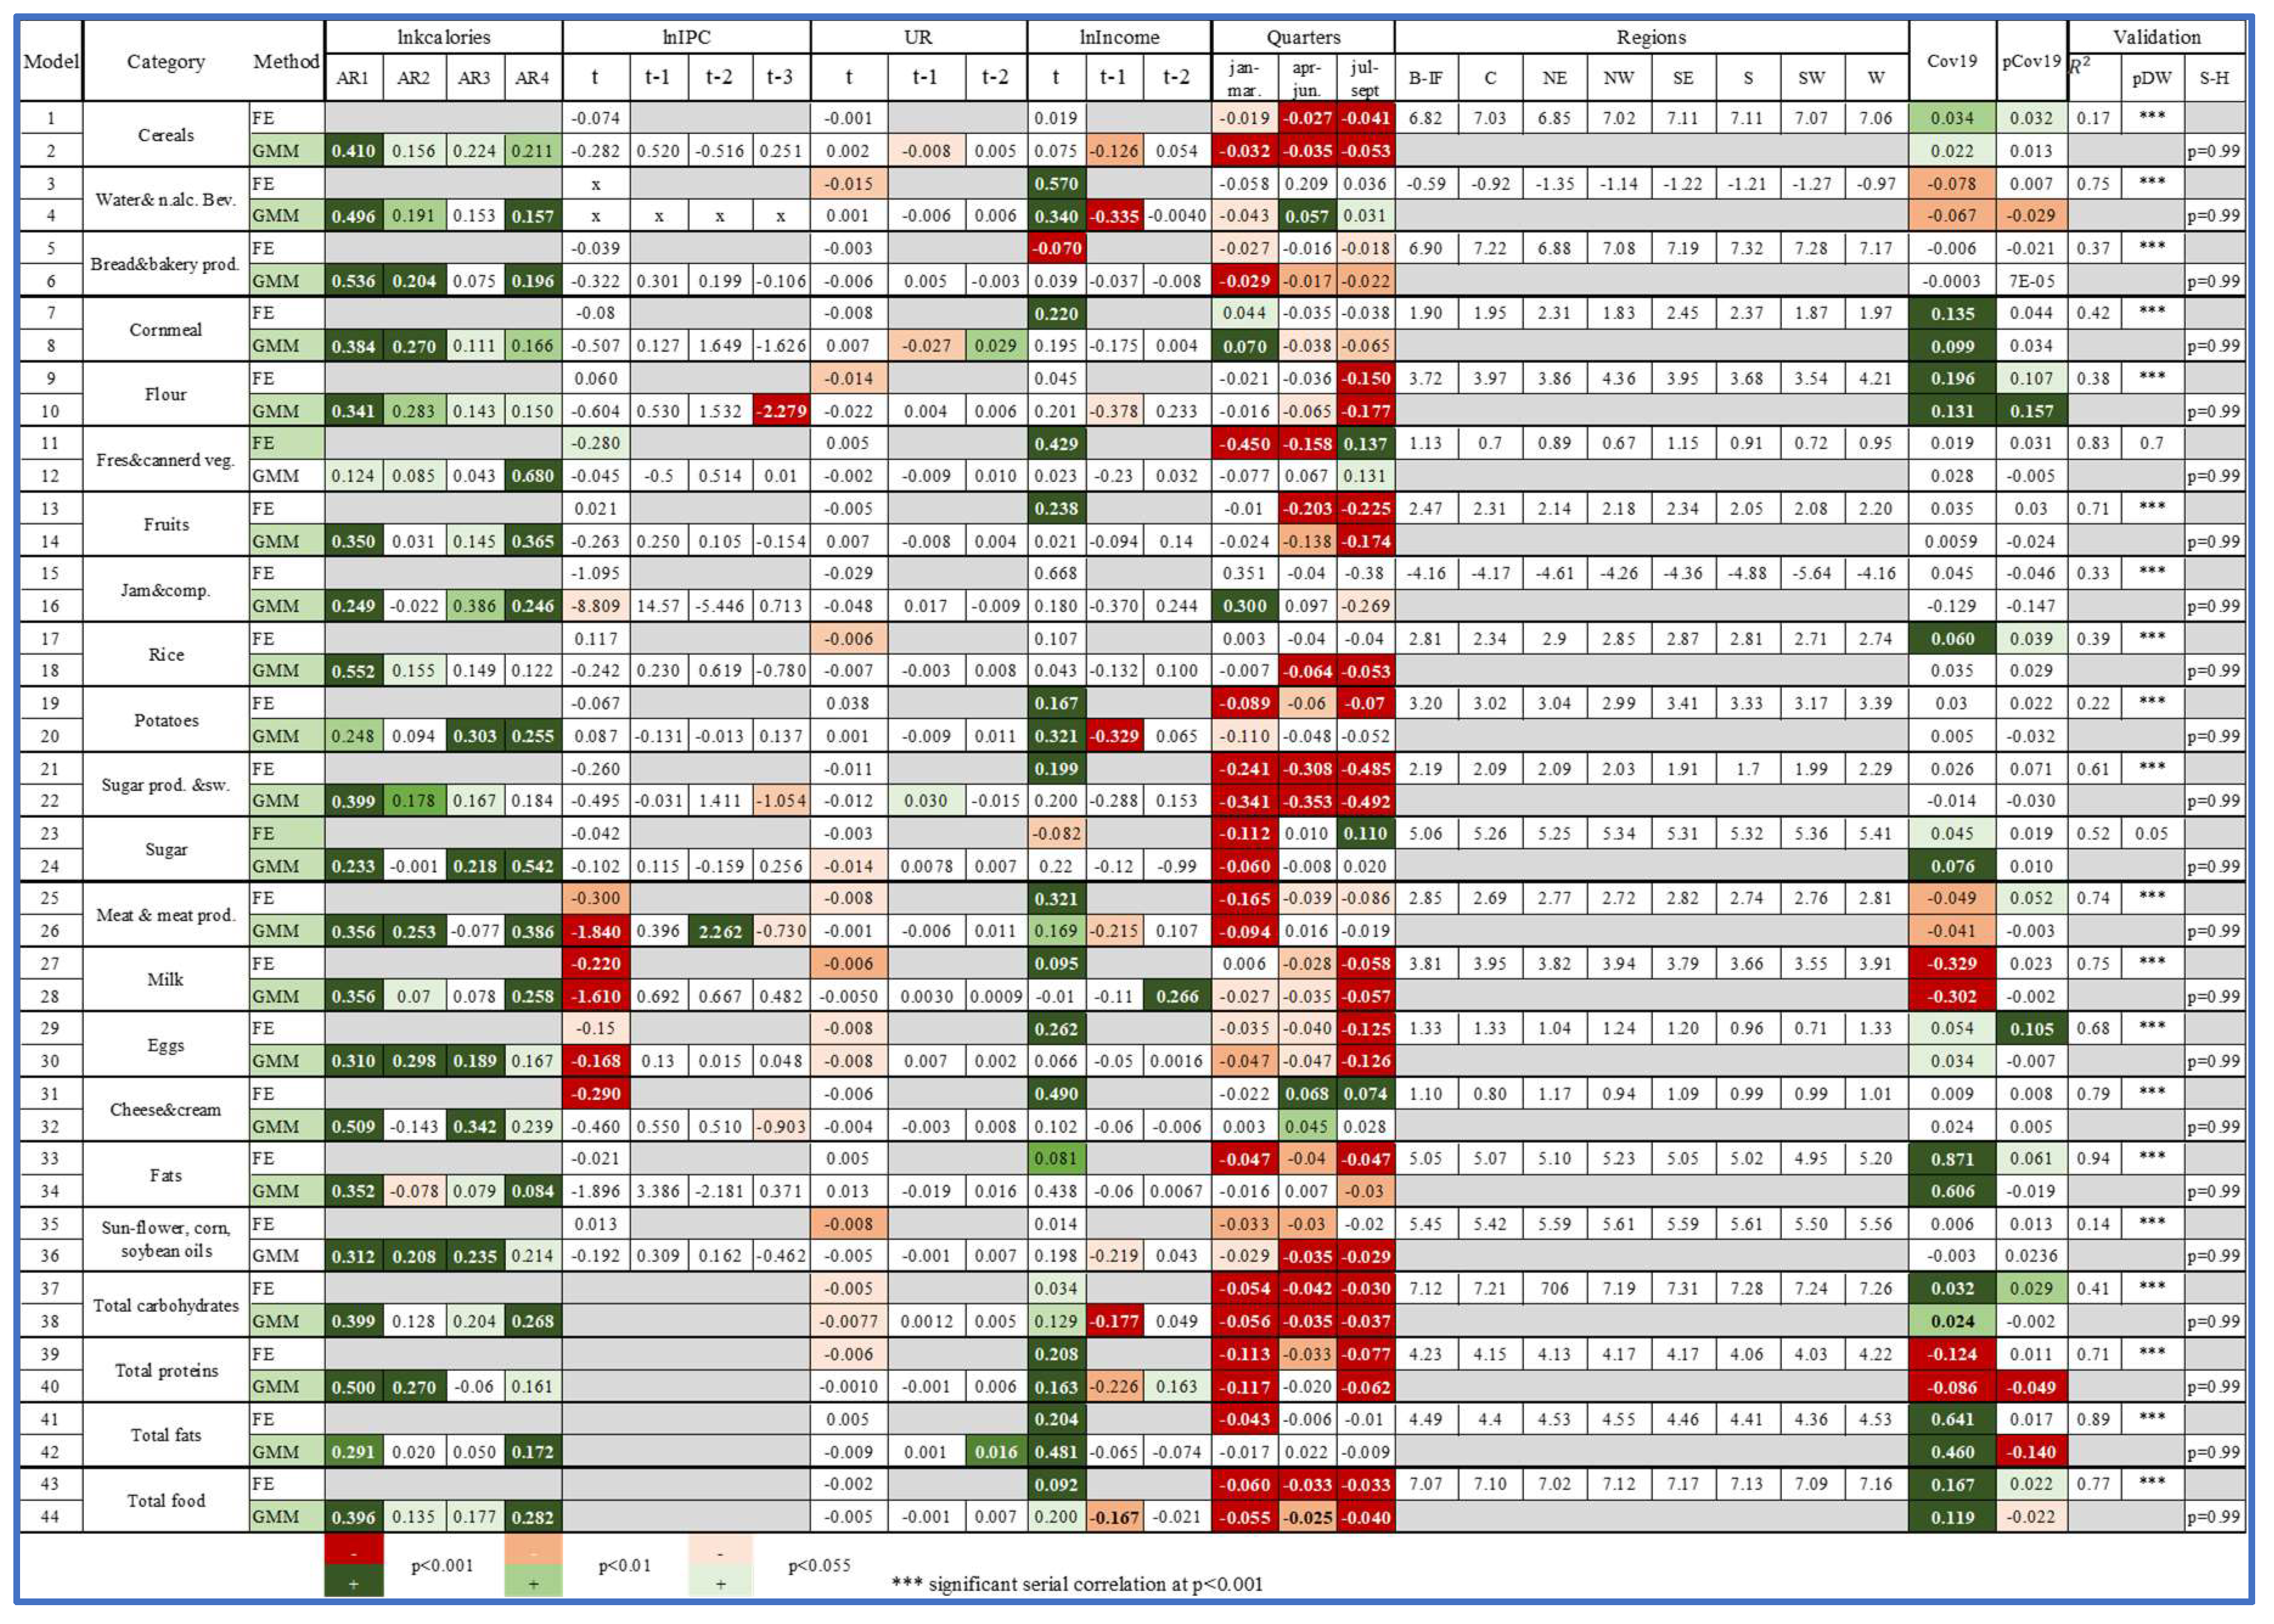
We observed a moderate positive and statistically significant correlation (p<0.001) between CPI and income, while the relationship between UR and CPI was weakly linear. The econometric tests discussed in the methods section produced mixed results. Nonetheless, the stationarity of food consumption, income, and UR was generally accepted. Residual autocorrelation and the validity of GMM instruments led us to place greater confidence in the Panel GMM results over the Fixed Effects (FE) model. Except for a few instances, there were no substantial discrepancies between the outcomes of the two modeling approaches (Table 1).
CPI and UR occasionally impacted food consumption. The analysis confirmed that income is a crucial driver of consumption, consistent with Keynesian theory for most goods. Additionally, the Fixed-Effects models revealed minimal disparities among Romanian regions, suggesting that specific regional factors had a limited influence on food consumption patterns during the period studied.
The outcomes presented in Table 1 highlight various shifts in food demand. Cereal consumption typically increases by 1-5% during the cold season, and during the pandemic, this rise reached 2-3%, a trend that continued beyond 2020. Similarly, bread and bakery products exhibited seasonal variation, with no significant change attributable to the pandemic. In contrast, cornmeal and flour demand surged by 15-17% in the last quarter due to seasonality, and the COVID-19 period further boosted this demand by 20%. Water and non-alcoholic beverage consumption increased by 3-5% in the warmer months compared to winter. Despite Romania’s ample supply of local fruits, demand for fruits was 17-20% lower during peak availability compared to periods of scarcity. The data also indicate that the use of rice, potatoes, sweets, and sugar products decreased in the warmer seasons, and milk consumption exhibited only a modest seasonal rise of 3-5% during the colder months.
Viral shocks had minimal impact on most of these products, except for rice, which saw a notable shift. In line with findings from France [35] and Spain [17], raw sugar demand increased by 5-7% during the pandemic. Among the 18 product categories analyzed, raw fats saw the most dramatic increase, with demand skyrocketing by 60-90% during the pandemic’s peak compared to regular periods. Conversely, milk demand surged 30% during the pandemic’s stress wave before returning to its usual trend.
For large food categories, carbohydrates slightly increased by 2-3%, fats experienced a substantial rise of 30-40%, and protein demand dropped by nearly 10%. The final quarter of the year saw an average growth of 5-10% in carbohydrate, protein, and fat consumption compared to earlier quarters, leading to a 38% increase in total calorie intake by year-end relative to July-September, and a 2-5% increase compared to the first half of the year. Overall, COVID-19 led to a nearly 10% rise in total calorie demand compared to the pre-pandemic period. However, this elevated pattern did not persist into the post-pandemic period.
4. Discussion
The outcomes of this study provide a comprehensive analysis of the changes in Romanian dietary habits from 2015 to 2023, with a particular focus on the impact of the COVID-19 pandemic and the subsequent recovery period. The findings underscore the significant role of income, seasonality, and socio-economic factors in shaping food consumption patterns, consistent with Keynesian consumption theory [28]. Additionally, this study highlights the marked influence of cultural and religious traditions on dietary behaviors, particularly during the last quarter of the year, when significant Orthodox Christian holidays lead to increased consumption of high-calorie foods.
The COVID-19 pandemic substantially disrupted daily life, resulting in short-term and long-term dietary habit changes. The initial phase of the pandemic saw a dramatic increase in calorie intake, with daily consumption exceeding 3,000 calories per person during the crisis. This surge was driven by several factors, including heightened stress levels, reduced physical activity due to lockdown measures, and changes in food availability and purchasing behaviors. The increase in the consumption of comfort foods, rich in fats and sugars, is consistent with global trends observed during the pandemic, where many individuals turned to calorie-dense foods as a coping mechanism [2,6].
Our analysis further reveals significant regional disparities in how these dietary changes manifested. For example, the Bucharest-Ilfov region, Romania’s most developed area, exhibited the most pronounced shifts in consumption patterns. Calorie intake rapidly increased during the early months of the pandemic, followed by a gradual return to pre-pandemic levels. In contrast, the southeastern and southwestern regions experienced more sustained increases in calorie consumption, suggesting that socioeconomic factors and regional differences in food accessibility and cultural practices may have contributed to these divergent trends.
The pandemic also intensified unhealthy dietary patterns, particularly the overconsumption of carbohydrates and fats, constituting most of the daily caloric intake [9]. While protein consumption decreased during the pandemic, likely due to supply chain disruptions and consumer preference shifts, the overall increase in calorie consumption suggests a move toward more energy-dense but nutritionally poor diets [27]. This shift is concerning, given the already high prevalence of obesity in Romania, and suggests that the pandemic may have exacerbated the risk of diet-related chronic diseases in the population [7].
Despite the return to more typical consumption patterns in the post-pandemic period, with daily caloric intake decreasing to around 2,500-2,600 calories per person, the lingering effects of the pandemic on dietary habits remain evident [5]. The continued preference for high-calorie foods, particularly during culturally significant periods, indicates that the pandemic may have had a lasting impact on Romanian food culture, reinforcing unhealthy eating behaviors that were already prevalent [2].
Moreover, the findings highlight the importance of considering the broader socio-economic and cultural context when analyzing dietary habits. While income remains a critical determinant of food consumption, as evidenced by our study’s strong correlation between income and calorie intake, other factors such as seasonality, cultural traditions, and regional disparities also play significant roles. These findings suggest that public health interventions aimed at improving dietary habits in Romania must take a multifaceted approach, addressing not only economic factors but also cultural and regional influences [36].
Our analysis reveals several critical insights into the evolution of Romanian dietary habits from 2015 to 2023, particularly emphasizing the effects of the COVID-19 pandemic. The findings confirm that income, seasonality, and cultural factors are key drivers of food consumption patterns in Romania. The pandemic exacerbated unhealthy dietary behaviors, leading to a significant increase in the consumption of high-calorie, nutrient-poor foods, particularly during periods of cultural and religious significance.
The COVID-19 pandemic serves as a stark reminder of the vulnerability of dietary habits to external shocks, such as global health crises. The increased calorie intake during the pandemic and the continued preference for high-calorie foods post-pandemic suggest that Romania faces significant challenges in addressing diet-related health issues [12]. The pandemic’s impact on dietary habits has likely contributed to the growing prevalence of obesity and other chronic diseases, further straining an already overburdened healthcare system [4].
To mitigate the long-term effects of the pandemic on public health, it is essential to develop targeted interventions that address the specific dietary challenges faced by different regions and socio-economic groups in Romania. These interventions should prioritize improving access to healthy foods, particularly in regions that have shown more sustained increases in calorie consumption, and promoting cultural shifts toward healthier eating behaviors [18]. Public health campaigns should also focus on reducing the consumption of energy-dense, nutrient-poor foods, especially during periods of cultural and religious significance [15].
Furthermore, the findings underscore the need for comprehensive policies that address the broader determinants of dietary habits, including income inequality, food accessibility, and cultural practices. Such policies should promote healthier eating habits across all population segments, with particular attention to vulnerable groups at greater risk of diet-related health issues [16].
In conclusion, while the COVID-19 pandemic appears to have been a temporary anomaly in terms of its immediate impact on dietary habits, its long-term effects on public health in Romania are likely to be profound. Addressing these challenges will require coordinated efforts at the national and regional levels, involving public health authorities and community stakeholders, to promote healthier dietary behaviors and reduce the burden of diet-related diseases in the post-pandemic era [37].
Author Contributions
Conceptualization, A.P., S.S. and B.V.I.; methodology, A.P, S.S. and B.V.I.; software, B.V.I.; validation, A.P., S.S. and B.V.I.; formal analysis, A.P, B.V.I.; resources, A.P.; data curation, A.P, B.V.I.; writing—original draft preparation, A.P., B.V.I.; writing—review and editing, S.S.; visualization, B.V.I.; All authors have read and agreed to the published version of the manuscript.
Funding
This research received no external funding.
Institutional Review Board Statement
Not applicable.
Informed Consent Statement
Not applicable.
Data Availability Statement
Data is available upon reasonable request from the corresponding author.
Conflicts of Interest
The authors declare no conflicts of interest.
Appendix A
The master dataset, formed by a multidimensional structure, includes the average monthly expenditure per person in the eight Romanian NUTS 2 regions for 19 main foods or groups of food products in 33 quarters between 2015Q1 and 2023Q1. The Romanian National Institute of Statistics (NIS) provides such data in the online database TEMPO [19], and the values are available in physical units, liters for beverages, and kilograms for solid food. According to Romanian National Institute of Statistics metadata, the Household Budget Survey (HBS) is a national representative sample applied to over 3000 independent dwellings/month, or over 30,000 independent units/ year, from all Romanian counties [20,21]. It follows the Eurostat regulations (Eurostat HBS 2003). The classification of consumed products and the questionnaire used to collect data is available on the Eurostat methodology [22].
Local data are available on calories only for the leading group of products. Therefore, we used data from the United States Department of Agriculture (USDA 2021), and we converted all average values from physical units/person/month to calories/person/day to improve the comparability among product categories and regions. Furthermore, standardization of quantities allows us to sum the values for broader categories such as carbohydrates, proteins, or fats. We collected information about the monthly consumer price index, CPI [24] by reference to December 2014; monthly gross income, Income, in Lei/household [23] and unemployment rate, UR [25]. The CPI is available for almost every one of the 19 product categories, but without other information, it is assumed to be the same for each region. UR and income are available for each Romanian region but do not vary by product class. Additionally, we computed geometrical means to achieve monthly mean CPI in a particular trimester.
The current study aimed to evaluate the impact of the recent pandemic based on the aggregated data described in Section 2.1 but controlled for the contributions of other factors. The current approach commences from the unanimously accepted theory of Keynes [38], which considers income the primary driver of consumption. In the nearly nine decades of the available theory of consumption, many studies, including Serletis [28], Kearney [29], the European Central Bank [27], and Salo et al. [30], have investigated subjects related to drivers of consumption from different perspectives. Because the current objective is to evaluate the impact of the crucial disruptor of COVID-19, we border the basic model of Keynes with other components, such as the consumer price index (CPI), unemployment level, or seasonality. Other sociocultural factors specific to the Romanian NUTS2 region are jointly captured by intercepts in the applied regression models.
First, we apply descriptive statistics methods to characterize the state of monthly consumption within the analyzed period. The time series points to the dynamic behavior and possible sub-annual oscillations. Then, in line with other works, like Mora et al. [17], for each class and subclass of products, we specify two types of panel models:
The static fixed effects panel model (FE) has the following form:
Dynamic panel models, with the form:
where represents the monthly consumption/person in calories, is the consumption price index, UR is the unemployment rate, and is a seasonal dummy variable, with reference categories of winter and AR being the autoregressive consumption component. Five indices, k=1 to 19, i=1 to 8, s=1 to 3, l=1 to max=4, and t=1 to 33, account for the class and subclass of products, region, season, time lag, and time, respectively. COVID-19 has a binary form with a value of 1 for all seasons of 2020, and pCOVID is a post-COVID-19 dummy variable with a value of 1 for all available seasons starting with the first quarter of 2021 (2021:Q1) to 2023:Q1. The reference period for COVID-19 and pCOVID-19 was pre-COVID-19, defined from the first quarter of 2015 to 2019:Q4. In both models, the variable is the disturbance, and it tries to capture the influence of unknown factors. It is assumed to be normal, independent, and identically distributed.
Models from the (a) category also try to capture fixed effects such as religion, urbanization degree, or specific cultural propensity for some products, mainly linked to regional characteristics. Several assumptions, such as stationarity, exogeneity of covariates, and time-serial and cross-sectional independence of residuals, must be made to discuss the quantitative results of the models further. Accordingly, specific tests such as the seasonal HEGY panel unit root [31], Durbin-Watson statistics, and R-squared statistics are computed and analyzed to test this hypothesis. Then, the ordinary least squares (OLS) method is applied for parameter estimation.
The second category of models, (b), considers a probable invalidation of exogeneity and non-autocorrelation and homoskedasticity hypotheses from (a). The (b) class models then use a general method of moments (GMM) estimation. In addition, we capture via autoregressive (AR) components a potentially stable long-term consumption model based on an intrinsic cause associated with lifestyle factors that cannot be individualized with the current data.
We present only the most relevant among multiple sets of estimated equations, with various lag lengths (l) and one-step vs. two-step estimations. The Sargan-Hansen (S-H) test, described in Arelano [32], applied for the validity of instruments, accompanies the results of each model. When the series has the unit root and high serial autocorrelation is present in FE models, we consider that the dynamic panel with GMM outperforms the static analysis. A p-value less than 0.05 marks the cut-off for statistical significance for each test. Microsoft Excel [33] and R-Studio [34] were used to perform all the computational aspects and graphical representation. The reader may find the results, discussion, and conclusions in sections three and four.
Figure A1.
Descriptive statistics and correlations among consumption and its drivers.
According to Hylleberg et al. (1990) and following Otero et al. (2007), the HEGY test has the following equation:
where , with =1 in quarters 1…3, , and . The authors propose the following hypotheses:
- H0: pi1<0=0; the unit root is present
- H1: pi2<0; no unit root
- H034: pi3=pi4=0; the seasonal unit root is present
- H134: at least pi3 or pi4<0; no seasonal unit root

Table A1.
HEGY panel unit root outputs, * reject unit root presence at p-value=0.05.
| Dependent variable |
HEGY Statistics | ||||||
| lncalories | Consumer Price Index(CPI) | ||||||
| Class | Category | t1 | t2 | F34 | t1 | t2 | F34 |
| Carbohydrates | Cereals | -2.44 | -2.58* | 7.3* | 1.39 | 0.06 | 1.68 |
| Water & non alc. Bev | -2.13 | -2.50* | 5.8* | - | - | - | |
| Bread and bakery prod. | -2.50 | -3.02* | 7.8* | 1.14 | -1.12 | 3.16 | |
| Cornmeal | -2.97* | -3.12* | 8.1* | 2.76 | 2.10 | 0.24 | |
| Flour | -3.80* | -3.25* | 11.8* | 1.60 | -1.20 | 0.15 | |
| Fresh &canned veg. | -2.79 * | -2.71* | 8.5* | -2.82 | -2.26 | 2.79 | |
| Fruits | -3.13 * | -3.09* | 9.0* | -1.19 | -0.74 | 3.63 | |
| Jam&compots | -2.71* | -2.96* | 7.4* | 2.88 | -0.22 | 1.29 | |
| Rice | - | - | - | 1.39 | 0.06 | 1.68 | |
| Potatoes | -2.12 | -2.06 | 4.9 | -3.16 | -1.28 | 3.22 | |
| Sugar prod.&sw. | -2.39 | -2.72* | 5.6* | 3.34 | 2.84 | 4.86 | |
| Sugar | -2.50 | -2.91* | 8.5* | 2.41 | 1.31 | 7.46 | |
| Proteins | Meat&meat prod. | -1.80 | -2.38* | 6.5* | 0.36 | -0.48 | 1.26 |
| Milk | -4.96* | -3.34* | 11.0* | -2.01 | -1.31 | 2.29 | |
| Eggs | -3.18 * | -2.30* | 9.4* | -1.16 | -2.06 | 1.48 | |
| Fats | Cheese &cream | -2.57* | -2.19* | 5.4 | 1.55 | 1.67 | 0.87 |
| Fats | -25.6 * | -12.9* | 195.7* | -4.84 | -5.41 | 1.29 | |
| Sunflower, corn& soybean oils | -2.96* | -3.35* | 11.5* | -4.85 | -5.41 | 1.29 | |
| Variable | HEGY Statistics | ||||||
| t1 | t2 | F34 | |||||
| Income | -2.78* | -1.78 | 7.93* | ||||
| UR | -3.65* | -2.37* | 5.23 | ||||
| Derived critical values at p-value=0.05 | -2.52 | -2.07 | 5.47 | ||||
| Model: constant+trend+seasonal dummies | |||||||
References
- World Health Organization. European Regional Obesity Report 2022. Available online: https://www.who.int (accessed on 13 August 2024).
- Malik, V.S.; Willet, W.C.; Hu, F.B. Nearly a decade on—trends, risk factors, and policy implications in global obesity. Nat. Rev. Endocrinol. 2020, 16, 615–616. [Google Scholar] [CrossRef]
- Eurostat. Overweight and obesity—BMI statistics. Available online: https://ec.europa.eu/eurostat (accessed on 13 August 2024).
- OECD; European Union. Health at a Glance: Europe 2022: State of Health in the EU Cycle; OECD Publishing: Paris, France, 2022. [Google Scholar] [CrossRef]
- Virmasalo, I.; Hasanen, E.; Pyykonen, J.; et al. Closed due to COVID-19: Effects of indoor sports restrictions on suburban adults’ physical activity behaviours. Int. J. Sport Policy Politics 2023, 15, 249–269. [Google Scholar] [CrossRef]
- Moosavi, J.; Fathollahi-Fard, A.; Dulebenets, M.A. Supply chain disruption during the COVID-19 pandemic: Recognizing potential disruption management strategies. Int. J. Disaster Risk Reduct. 2022, 75, 102983. [Google Scholar] [CrossRef] [PubMed]
- Lombardo, M.; Guseva, E.; Perrone, M.A.; Müller, A.; et al. Changes in eating habits and physical activity after COVID-19 pandemic lockdowns in Italy. Nutrients 2021, 13, 4522. [Google Scholar] [CrossRef]
- Cagla, A.; Celep, A.G.S. Assessment of dietary habits and use of nutritional supplements in COVID-19: A cross-sectional study. PharmaNutrition 2022, 22, 100309. [Google Scholar] [CrossRef]
- Năstăsescu, V.; Mititelu, M.; Stanciu, T.I.; et al. Food habits and lifestyle of Romanians in the context of the COVID-19 pandemic. Nutrients 2022, 14, 504. [Google Scholar] [CrossRef] [PubMed]
- Dumitraș, D.E.; Harun, R.; Arion, F.H.; et al. Food consumption patterns in Romania during the COVID-19 pandemic. Foods 2021, 10, 2712. [Google Scholar] [CrossRef]
- Kinoshita, K.; Ozato, N.; Yamaguchi, T.; et al. Association of the COVID-19 pandemic with changes in objectively measured sedentary behavior and adiposity. Int. J. Obes. 2023, 47, 375–381. [Google Scholar] [CrossRef]
- Voinea, L.; Vrânceanu, D.M.; Filip, A.; et al. Research on food behavior in Romania from the perspective of supporting healthy eating habits. Sustainability 2019, 11, 5255. [Google Scholar] [CrossRef]
- Branley-Bell, D.; Talbot, C.V. Exploring the impact of the COVID-19 pandemic and UK lockdown on individuals with experience of eating disorders. J. Eat. Disord. 2020, 8, 44. [Google Scholar] [CrossRef] [PubMed]
- Philippe, K.; Chabanet, C.; Issanchou, S.; Monnery-Patris, S. Child eating behaviors, parental feeding practices, and food shopping motivations during the COVID-19 lockdown in France: (How) did they change? Appetite 2021, 161, 105132. [Google Scholar] [CrossRef]
- Lamy, E.; Viegas, C.; Rocha, A.; et al. Changes in food behavior during the first lockdown of the COVID-19 pandemic: A multi-country study about changes in eating habits, motivations, and food-related behaviors. Food Qual. Prefer. 2022, 99, 104559. [Google Scholar] [CrossRef]
- Pouget, M.; Clinchamps, M.; Lambert, C.; et al. Impact of COVID-19 lockdown on food consumption and behavior in France (COVISTRESS study). Nutrients 2022, 14, 3739. [Google Scholar] [CrossRef]
- Mora, T.; Fichera, E.; Lopez-Varcarcel, B. How has the strict lockdown during the SARS-CoV-2 outbreak changed the diet of Spaniards? SSM Popul. Health 2023, 17, 101512. [Google Scholar] [CrossRef] [PubMed]
- Parker, J.; Kaur, S.; Medalla, J.M.; et al. Dietary trends among young adults during the COVID-19 lockdown: Socioeconomic and gender disparities. BMC Nutr. 2023, 9, 107. [Google Scholar] [CrossRef]
- National Institute of Statistics. Tempo-Online, HBS Monthly Average Agro-Food Consumption per Person by Main Social Categories, Macroregions, and Development Regions. Available online: http://statistici.insse.ro:8077/tempo-online/#/pages/tables/insse-table (accessed on 20 April 2024).
- National Institute of Statistics. Household Budgets Survey. Available online: http://80.96.186.4:81/metadata/viewStatisticalResearch.htm?researchId=5352 (accessed on 20 April 2024).
- National Institute of Statistics. Household Budgets Survey, Coordonate ale Nivelului de Trai în România, 2022. Available online: https://insse.ro/cms/sites/default/files/field/publicatii/coordonate_ale_nivelului_de_trai_in_romania_2022_0.pdf (accessed on 20 April 2024).
- Eurostat. Household Budget Surveys in the EU: Methodology and Recommendations for Harmonization. Available online: https://ec.europa.eu/eurostat/documents/3859598/5875361/KS-BF-03-003-EN.PDF.pdf (accessed on 20 April 2024).
- National Institute of Statistics. Tempo-Online, HBS Monthly Averages of Total Income per Household, by Income Sources and Main Social Categories by Macroregions and Development Regions. Available online: http://statistici.insse.ro:8077/tempo-online/#/pages/tables/insse-table (accessed on 20 April 2024).
- National Institute of Statistics. Tempo-Online, Consumer Price Indices by Main Goods and Services—Monthly Evolution as Against Previous Month. Available online: http://statistici.insse.ro:8077/tempo-online/#/pages/tables/insse-table (accessed on 20 April 2024).
- National Institute of Statistics. Tempo-Online, ILO Unemployment Rate by Age Group and Urban/Rural. Available online: http://statistici.insse.ro:8077/tempo-online/#/pages/tables/insse-table (accessed on 20 April 2024).
- United States Department of Agriculture (USDA). Available online: https://insse.ro/cms/sites/default/files/field/publicatii/consumul_de_bauturi_in_anul_2021.pdf (accessed on 20 April 2024).
- European Central Bank (ECB). Private Consumption and Its Drivers in the Current Economic Expansion. ECB Economic Bulletin 2018, 5. Available online: https://www.ecb.europa.eu/pub/economic-bulletin/articles/2018/html/ecb.ebart201805_03.en.html (accessed on 20 April 2024).
- Serletis, A. Keynesian Macroeconomic Theory. In The Demand for Money; Springer: Boston, MA, USA, 2001. [Google Scholar] [CrossRef]
- Kearney, J. Food consumption trends and drivers. Philos. Trans. R. Soc. Lond. B Biol. Sci. 2010, 365, 2793–2807. [Google Scholar] [CrossRef]
- Salo, M.; Savolainen, H.; Karhinen, S.; Nissinen, A. Drivers of household consumption expenditure and carbon footprints in Finland. J. Clean. Prod. 2021, 289, 125607. [Google Scholar] [CrossRef]
- Hylleberg, S.; Engle, R.F.; Granger, C.W.J.; Yoo, B.S. Seasonal integration and cointegration. J. Econom. 1990, 44(1–2), 450–459. [Google Scholar] [CrossRef]
- Arellano, M. Sargan’s Instrumental Variables Estimation and the Generalized Method of Moments. J. Bus. Econ. Stat. 2002, 20(4), 450–459. Available online: https://www.jstor.org/stable/1392415 (accessed on 20 April 2024). [CrossRef]
- Microsoft Corporation Microsoft Excel, 2018. Available at: https://office.microsoft.
- R Core Team R: A Language and Environment for Statistical Computing. R Foundation for Statistical Computing, Vienna, Austria. 2024. R: The R Project for Statistical Computing.
- Pouget, M.; Clinchamps, M.; Lambert, C.; Pereira, B.; et al. Impact of COVID-19 Lockdown on Food Consumption and Behavior in France (COVISTRESS Study). Nutrients 2022, 14. [Google Scholar] [CrossRef] [PubMed]
- Mureșan, I.C.; Harun, R.; Brata, A.M.; Brata, V.D.; et al. Factors affecting food consumers’ behavior during COVID-19 in Romania. Foods 2022, 11, 2275. [Google Scholar] [CrossRef] [PubMed]
- Petre, I.; Barna, F.; Gurgus, D.; Tomescu, L.C.; et al. Analysis of the Healthcare System in Romania: A Brief Review. Healthcare 2023, 11, 2069. [Google Scholar] [CrossRef]
- Keynes, J.M. The General Theory of Employment, Interest and Money; Macmillan Cambridge University Press: London, UK, 1936. [Google Scholar]
Figure 2.
Share of calorie consumption by main class of goods, quarter, and region.
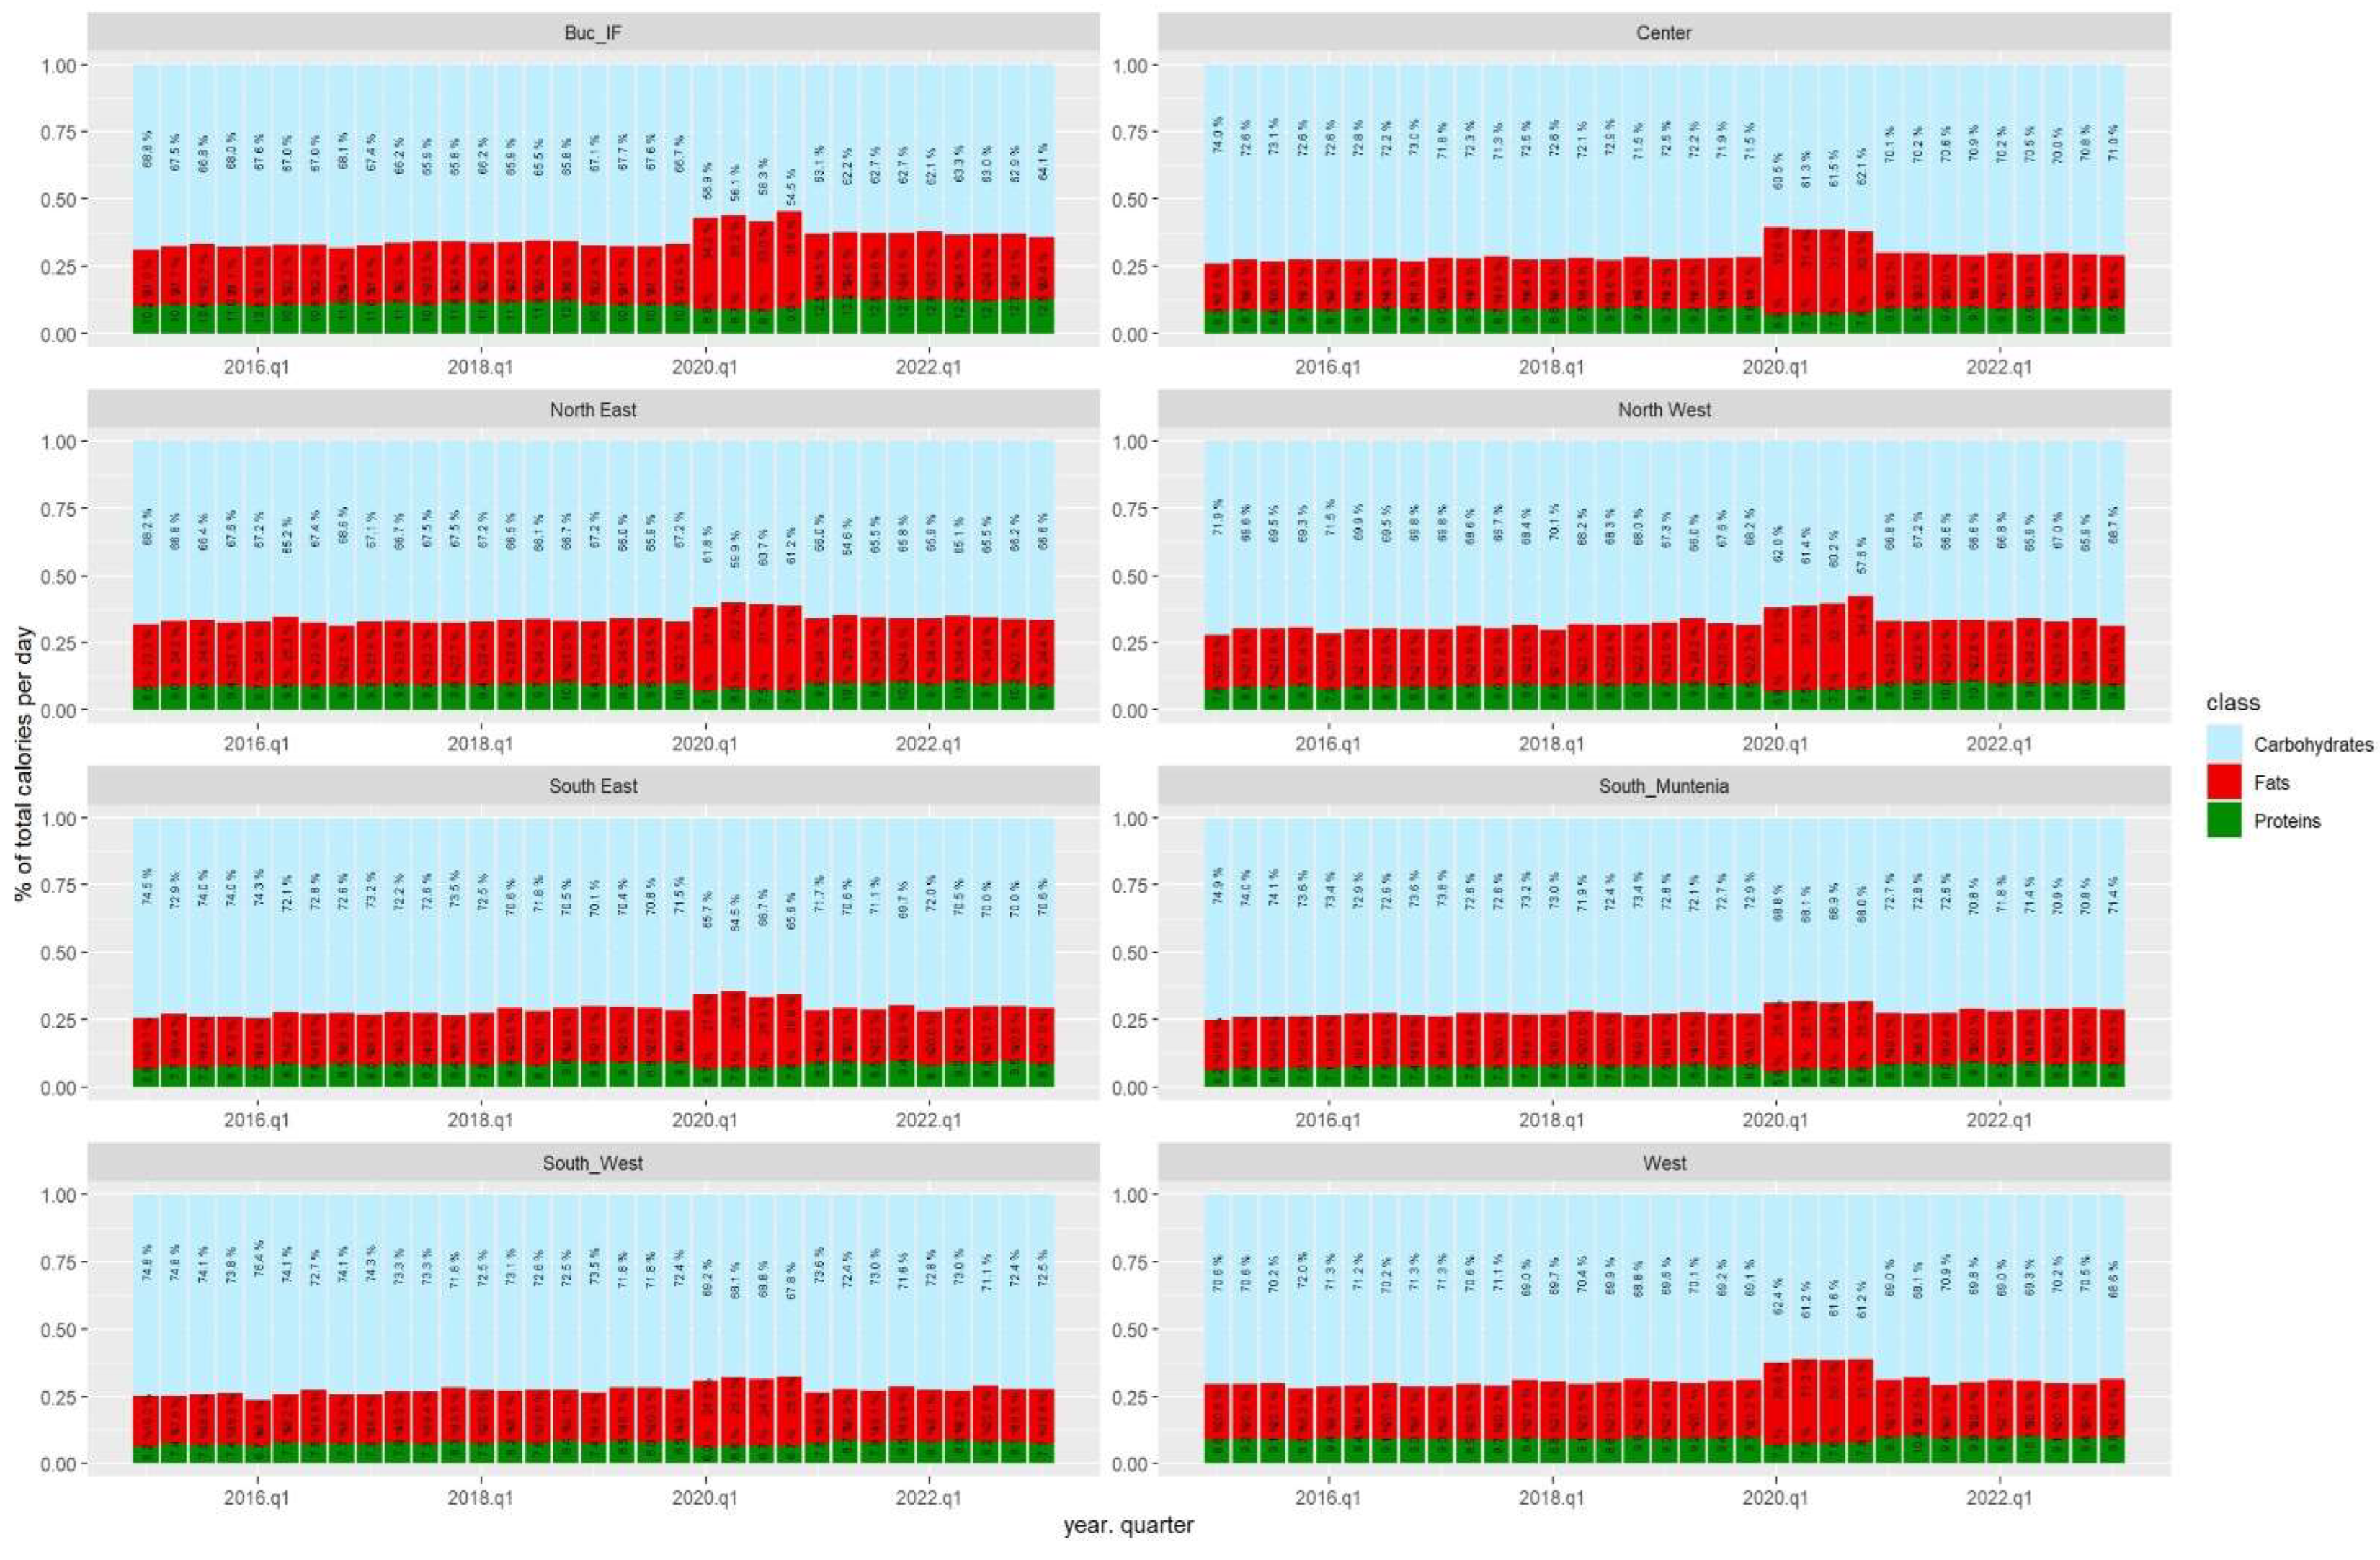
Figure 3.
Trends of calorie consumption by category, quarter, and regions.
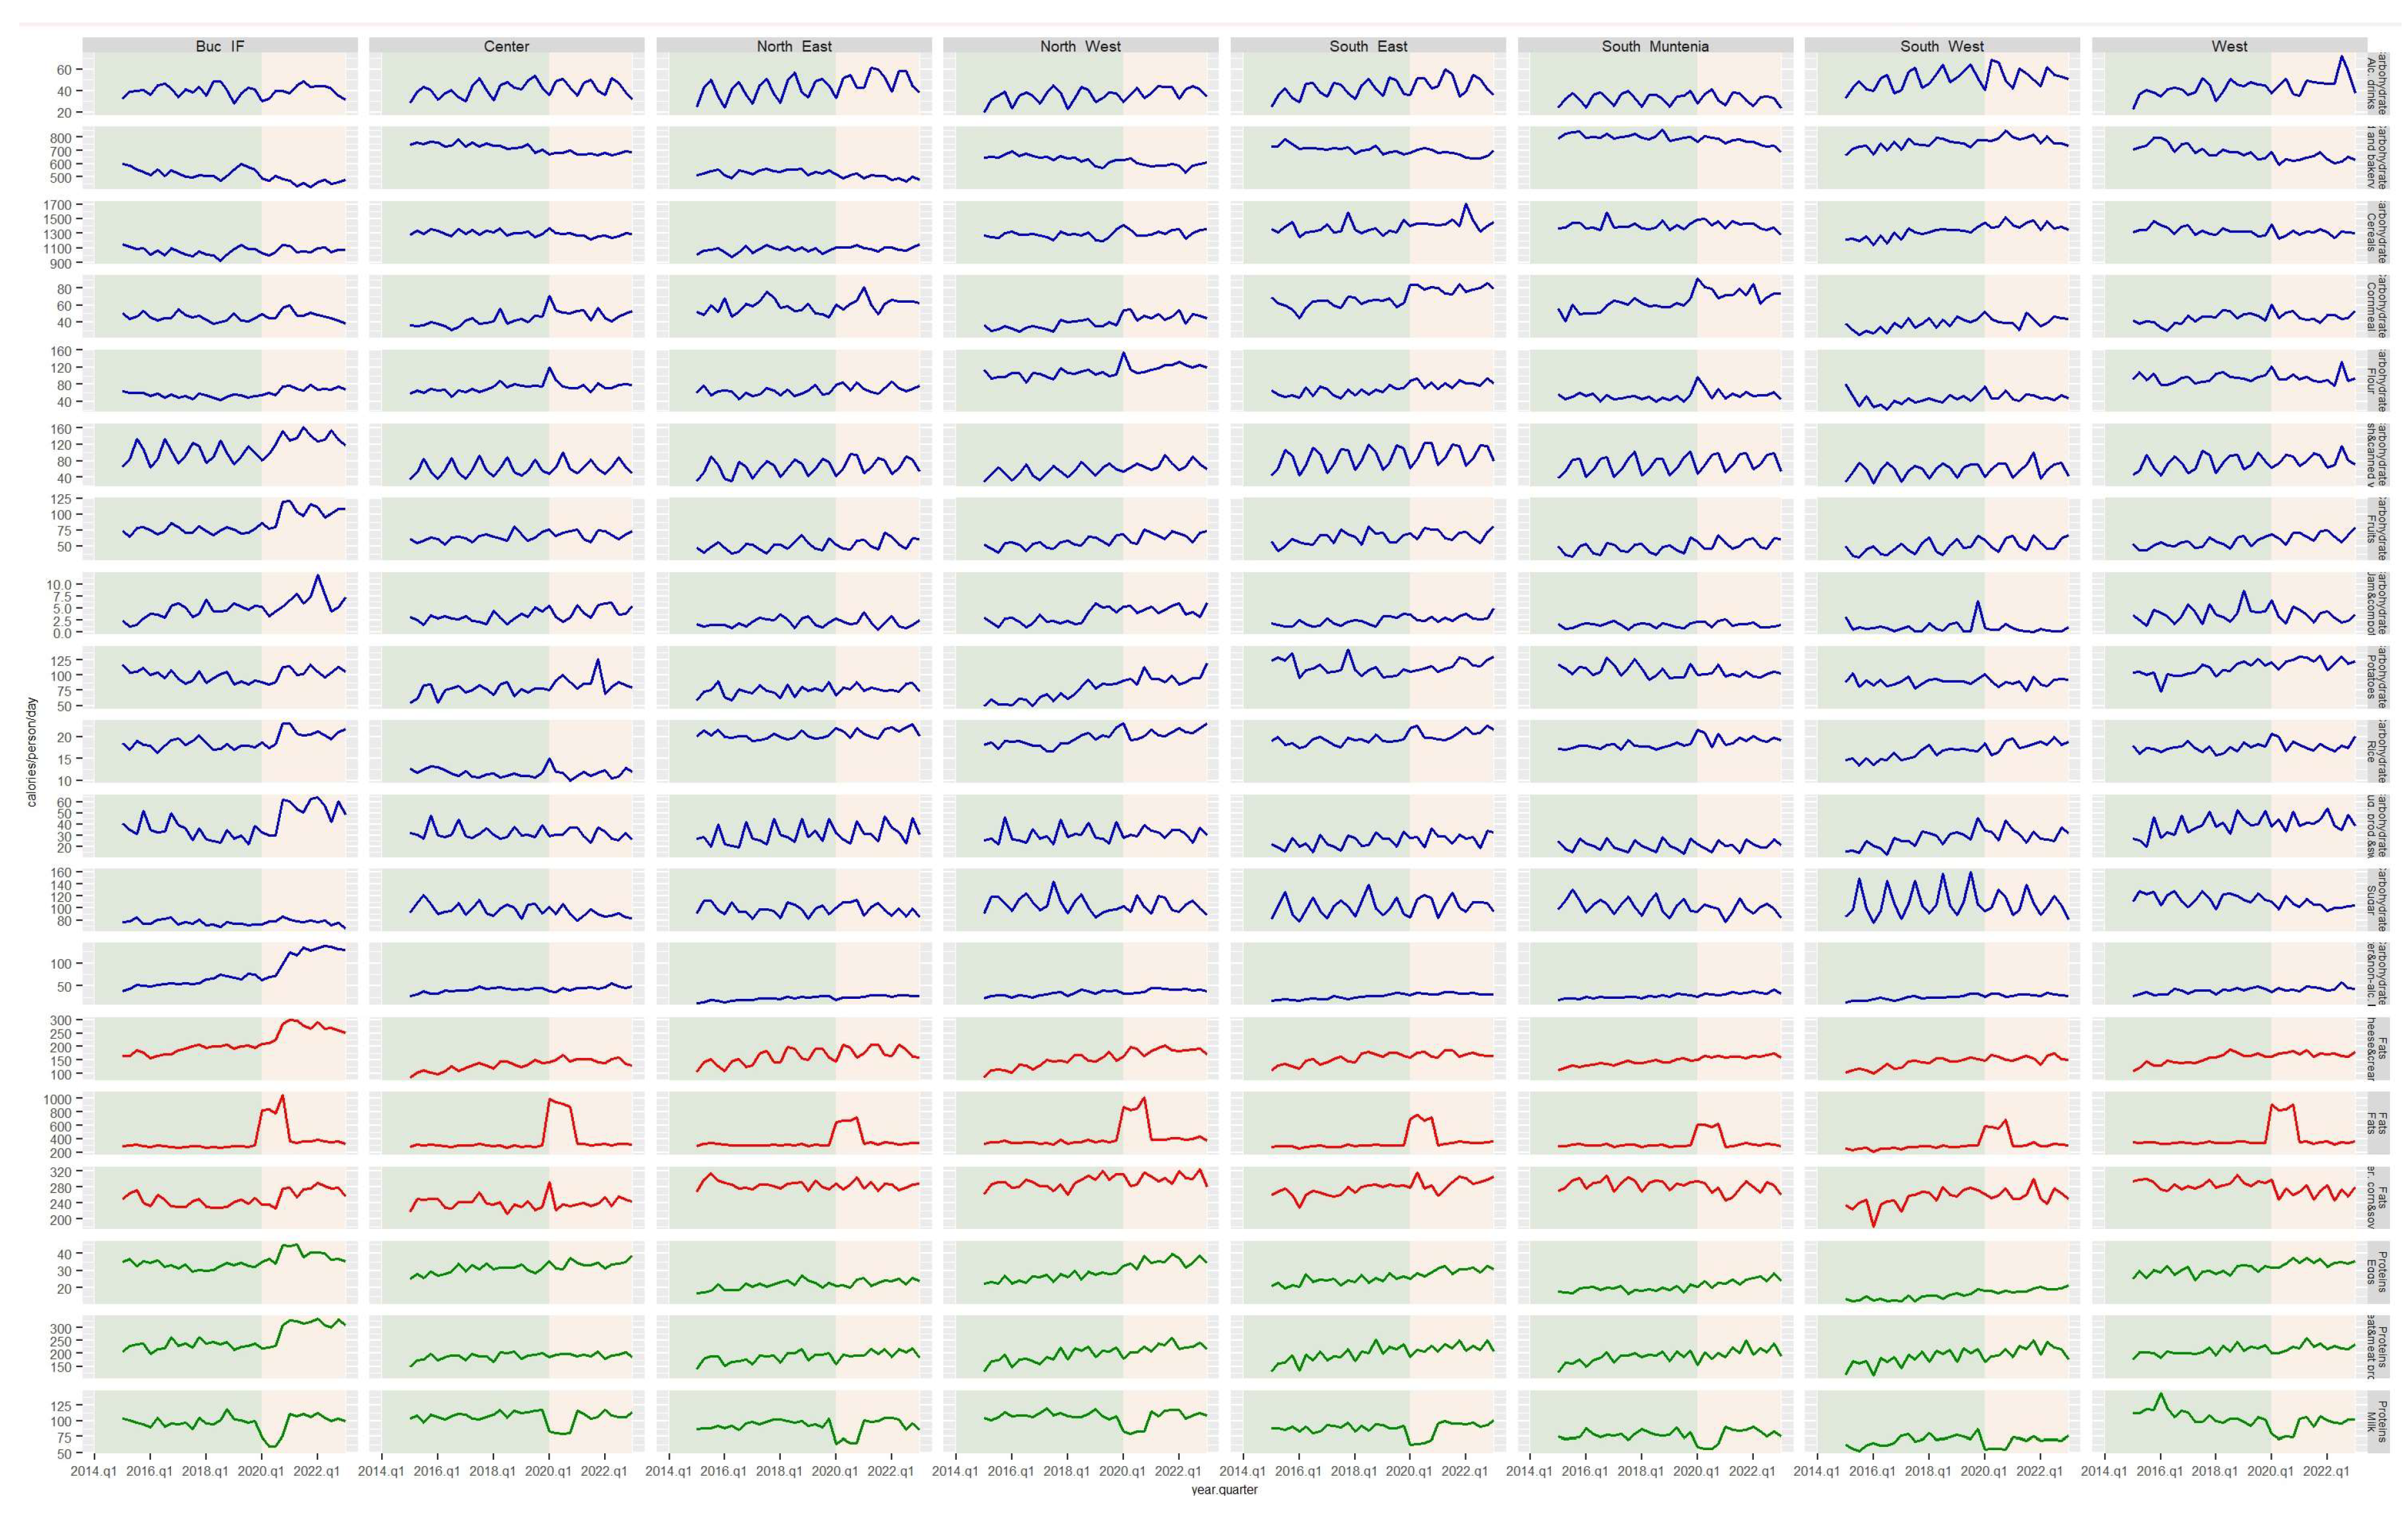
Table 1.
Outcomes of primary regression analysis across model iterations.
Disclaimer/Publisher’s Note: The statements, opinions and data contained in all publications are solely those of the individual author(s) and contributor(s) and not of MDPI and/or the editor(s). MDPI and/or the editor(s) disclaim responsibility for any injury to people or property resulting from any ideas, methods, instructions or products referred to in the content. |
© 2024 by the authors. Licensee MDPI, Basel, Switzerland. This article is an open access article distributed under the terms and conditions of the Creative Commons Attribution (CC BY) license (http://creativecommons.org/licenses/by/4.0/).
Copyright: This open access article is published under a Creative Commons CC BY 4.0 license, which permit the free download, distribution, and reuse, provided that the author and preprint are cited in any reuse.


