
Submitted:
28 November 2024
Posted:
29 November 2024
You are already at the latest version
Abstract
The integration of disease severity with real-time meteorological variables and advanced machine learning techniques has given valuable predictive insights for assessing disease severity in wheat. This study emphasizes the potential of machine learning models, particularly artificial neural networks (ANN), in predicting wheat disease severity with high accuracy. Field experiment was conducted over two consecutive rabi growing seasons (2023 and 2024), using randomized block design with four sowing dates to investigate critical weather-disease relations for two key wheat pathogens: Puccinia striiformis f. sp. tritici (yellow rust) and Blumeria graminis f. sp. tritici (powdery mildew). Weekly assessments of disease severity were combined with meteorological data and analyzed using ANN and regularized regression models. The ANN model demonstrated superior predictive accuracy for both yellow rust and powdery mildew, achieving R-squared value (R2) of 0.96 and 0.98 for calibration, and 0.93 and 0.95 for validation, respectively. Random Forest (RF) models also exhibited robust performance with R2 values of 0.97 and 0.98 for calibration and 0.93 and 0.90 for validation for yellow rust and powdery mildew respectively, while Elastic Net, Lasso, and Ridge regression models showed comparatively moderate predictive capabilities. Principal component analysis (PCA) explained the key meteorological variables influencing disease incidence, with evapotranspiration, temperature, wind speed and humidity emerging as critical factors. Disease prediction is an important aspect to develop decision support system and make farmers to take informed decision to optimize production.
Keywords:
yellow rust
; powdery mildew
; crop weather-disease modelling
; machine learning
; crop management
1. Introduction
Wheat is an important food crop globally, as it ranks the third most-produced cereal after rice and maize, and the second most-produced primarily for human consumption [1]. Wheat consumption is projected to rise by 11% by 2031, while the production area will expand by only 3% [2]. The Food and Agriculture Organization (FAO) estimated that 20-40% crops are lost globally due to pests and disease incidence every year [3]. However, actual loss in wheat yield is about 13% mainly caused by pests and diseases [4]. Wheat yield loss is a global concern as new races of rust and powdery mildews pathogens are more virulence and continue to evolve radially [5,6,7,8] The yield loss caused by powdery mildew in Warsaw and Holland is 1-50% and 1-54%, respectively, in 50 cultivars [9]. In China, wheat yield loss from pests and pathogen is ranging from 4.84–16.29% [10]. Spring wheat was reported to be susceptible to powdery mildew which reduced the yield by 2.06-26.68 percent of 23 Egyptian cultivars [11]. However, under optimal climatic conditions, stripe rust and stem rust can lead to complete yield loss, while leaf rust may result in crop losses ranging from 45 to 50%. To overcome yield loss with disease and pest resistant varieties takes many years typically depending on crop, disease causing pathogen and available technology [12]. Agriculture faces many challenges because of growing environmental concerns related to water use and temperature fluctuations [13,14]. It is projected that 22 metric tonnes of food grains will be deficient in South Asia by 2030. A recent freeze, followed by hot and dry weather, has adversely affected the winter wheat crop in the region [15,16,17]. Historical temperature trends indicate that wheat yield declined by 5.5% from 1980 to 2010, correlating with a 0.13 °C increase in decadal temperatures [18]. Meteorological data shows that mean annual temperatures in regions where wheat, rice, maize, and soybean are cultivated have risen by approximately 1 °C over the last century and are projected to continue rising in the coming future [19,20]. Temperature increase is associated with an estimated global wheat yield loss of 6.0 ± 2.9% per degree Celsius. However, the spatial impacts of temperature increases are highly heterogeneous. Estimated wheat yield losses per degree Celsius is similar to the global average in the United States (5.5 ± 4.4%) and France (6.0 ± 4.2%), whereas in India (9.1 ± 5.4%) and Russia (7.8 ± 6.3%) are more susceptible to temperature increases [21,22,23].
Powdery mildew is a critical foliar disease of wheat, prevalent in most wheat-growing regions. Infection with powdery mildew can lead to yield reductions of up to 40%, especially under humid rainfed and irrigated conditions [24,25]. Moreover, wheat blast, caused by the fungal pathogen, poses a significant risk to wheat production in warm and humid regions [26]. Climate change projections for 2040–2070 indicate that wheat blast will primarily spread in the tropics and southern hemisphere as temperatures and relative humidity rise, potentially leading to a 13% annual global loss in wheat production. Moreover, the presence of wheat blast is expected to increase in the USA and Mexico and can impact previously unaffected countries, including Uruguay, Japan, Italy, Spain, and New Zealand, among others [27,28,29]. Leaf rust is a major cause of significant wheat yield losses, with occurrence and severity increasing in recent years, due to a warmer climate [30]. The global rise in leaf rust severity across all winter wheat production regions has been a concern [31]. Leaf rust, a prevalent disease can occur under diverse climatic conditions leads to substantial yield losses across large geographic areas [32]. Over the past decades, leaf rust is the second most frequently reported disease following by powdery mildew in Asia, western and southern Europe and South America [33,34]. A positive correlation between erratic rainfall pattern and higher temperatures in between wheat growing seasons affected the severity of leaf rust in wheat producing region globally [35,36,37].
The severity assessments of wheat stripe rust and powdery mildew are primarily conducted through visual observation [38]. However, it is challenging to accurate estimate and predict the percentage of lesion areas on individual diseased wheat leaves based on the severity grading standard for wheat stripe rust. Forecasting models for predicting plant diseases using meteorological data have been recognized as an information and communication technology (ICT) tool similar to modern extension programs [39,40]. To inform farmers about upcoming disease on the integration of weather forecast and crop-disease severity in a particular region using machine learning models is vital to ensure and take effective crop protection practices [41,42]. Disease prediction modeling techniques utilize deep data mining and probability tools with weather forecasting, serving as early warning systems for predicting disease and inform farmers in advance through mobile app and farmers call centres to take effective measures [43]. Machine learning (ML) encompasses statistical methods are concentrated to identify patterns in complex datasets. Wheat crop is critically important to drive global economy and food security, thus ML techniques are useful to predict disease on the basis of regional basis [44,45]
Globally, climate change significantly contributed in wheat yield reduction and is influenced by diseases and pests. Moreover, changes in plant host environment system caused diseases and pests incidence in unaffected region globally [46]. Therefore, integrating meteorological data such as temperature, humidity, and rainfall into current predictive models, farmers can anticipate disease outbreaks and implement timely interventions [47,48,49]. However, microclimate-based pest and disease management is an important aspect to develop decision support systems (DSS) to forecast the likelihood of disease occurrence [50] enabling farmers to apply fungicides more judiciously and reduce unnecessary applications [51]. This practice not only minimizes the economic burden but also mitigates environmental impact [52,53]. This study aims to evaluate the effectiveness of ANN and regularized regression models in explicate critical weather-disease correlations and predict most suitable multiple regression model to predict disease. Wheat yield loss ascribed by yellow rust and powdery mildew is a global concern. Thus, machine learning algorithms or digital technology offers a strategic approach allows for timely interventions for weather related disease [54]. Disease prediction minimise crop losses and optimizing resource use [55]. The disease prediction using weather data is an approach not only enhances disease management but also supports sustainable agricultural practices, ensuring long-term productivity and food security. Therefore, our research objective is to develop quantification of relationship between meteorological variables and the rust and powdery mildew epidemics in wheat crop.
2. Material and Methodology
2.1. Study Area
The study was carried out in two consecutive rabi growing seasons in 2023 and 2024 at the Crop Research Center of Govind Ballabh Pant University of Agriculture and Technology, Pantnagar. Geographically, located at longitude of 29.0222oE and latitude 79.4908oN at an altitude of 243.86 above mean sea level above mean seal level in the Shivalik Himalayan foothills of Terai region of in the foothills of Siwalik region of Uttarakhand, India (Figure 1). The region is weakly developed under the catena of mollic epipedons and grouped under Mollisols order. Parent material is characterized by loamy alluvial sediments with moderately coarse textures [56,57]. The area is characterised by humid sub-tropical climate with hot and dry summers from first week March to June end, May being the hottest month, and cold season occur from November to February. Maximum temperatures reach about 45±1.5°C and 46±1.5°C during summer during Kharif season while minimum temperature of 2.0±0.5°C is usually occur in Rabi season. Frost generally occurs from December to February. The average annual precipitation is about 1574.2 mm, maximum rainfall of 1450 mm (80-90 %) occurs during monsoon season (July to September).
2.2. Experimental Design and Data Curation
The field experiment followed a randomized block design with PBW-343 variety was utilized with four distinct sowing dates: November 22nd, November 29th, December 6th, and December 13th, across the 2022-23 and 2023-24 growing seasons. The sowing dates were replicated in both growing seasons to provide a diverse range of environmental conditions for disease progress evaluation and prediction. The study focused on two important wheat diseases: yellow rust and powdery mildew. Disease severity assessments were conducted on a weekly basis by visual appearance starting from the first appearance of the diseases until maximum severity was observed. Standard rating scales developed for yellow rust (Figure 2) and powdery mildew (Table 3) was employed to quantify disease severity. Meteorological data includes maximum temperature (Tmax), minimum temperature (Tmin), maximum relative humidity (RHI), minimum relative humidity (RHII), sunshine hours (SSH), rainfall, wind speed (WV), and evaporation (Eva), were obtained from the Department of Agrometeorology at Pantnagar under the IMD recognition. Meteorological variables were categorized on a weekly basis using daily data to correspond with the disease severity observation dates over the two growing seasons. The incorporation of four different sowing dates in the experimental design aimed to represent the wheat crop has diverse range of environmental conditions, thus it vital to observe the influence of meteorological variables on disease progress. This approach facilitated a comprehensive evaluation of the relationships between prevailing meteorological factors and the development of yellow rust and powdery mildew diseases in wheat under the climatic conditions (Figure 3).
The average weather conditions during both growing seasons of wheat from the onset of disease incidence (Table 1 and Table 2). The standard deviation ascribed larger than the mean, indicating that the high degree of variability in the severity of yellow rust disease. Wide range of disease severity was observed throughout both growing periods for yellow rust and powdery mildew

Table 1.
Meteorological condition during yellow rust progression during both growing season.
| Met. Var. | Mean | Std (±) | Median | Min. | Max. | Skew | Kurtosis | SE(±) |
| DS | 31.27 | 32.91 | 15.00 | 0.00 | 100.00 | 0.58 | -1.21 | 3.51 |
| Tmax | 20.79 | 5.04 | 21.31 | 10.97 | 30.00 | -0.19 | -0.83 | 0.54 |
| Tmin | 8.16 | 1.90 | 8.09 | 5.06 | 12.09 | 0.32 | -0.94 | 0.20 |
| RHI | 91.55 | 3.01 | 92.29 | 85.43 | 96.71 | -0.58 | -0.53 | 0.32 |
| RHII | 57.39 | 17.14 | 59.29 | 29.00 | 86.29 | 0.01 | -1.37 | 1.83 |
| Rainfall | 4.59 | 12.60 | 0.00 | 0.00 | 60.00 | 3.85 | 14.03 | 1.34 |
| SSH | 4.80 | 2.83 | 5.53 | 0.46 | 9.09 | -0.11 | -1.51 | 0.30 |
| WV | 3.11 | 1.32 | 2.91 | 1.17 | 5.75 | 0.59 | -0.67 | 0.14 |
| Eva | 17.98 | 10.29 | 16.35 | 4.60 | 54.00 | 1.18 | 1.64 | 1.10 |
Table 2.
Meteorological condition during powdery mildew progression during both growing season.
| Met. Var. | Mean | Std (±) | Median | Min. | Max. | Skew | Kurtosis | SE(±) |
| DS | 29.35 | 33.55 | 12.50 | 0.00 | 95.00 | 0.66 | -1.21 | 3.62 |
| Tmax | 26.67 | 4.58 | 26.59 | 12.66 | 35.24 | -0.42 | 0.25 | 0.49 |
| Tmin | 11.05 | 2.79 | 10.97 | 4.71 | 16.19 | -0.30 | -0.60 | 0.30 |
| RHI | 87.10 | 6.06 | 87.86 | 70.57 | 96.14 | -1.33 | 1.48 | 0.65 |
| RHII | 42.23 | 14.25 | 40.86 | 15.29 | 84.00 | 0.58 | 0.21 | 1.54 |
| Rainfall | 9.33 | 20.07 | 0.00 | 0.00 | 68.80 | 2.12 | 2.94 | 2.16 |
| SSH | 7.31 | 2.09 | 7.81 | 0.96 | 10.31 | -0.95 | 0.24 | 0.22 |
| WV | 3.52 | 1.09 | 3.50 | 1.00 | 5.31 | -0.21 | -0.82 | 0.12 |
| Eva | 25.86 | 6.88 | 26.70 | 4.80 | 37.00 | -0.70 | 0.55 | 0.74 |
Table 3.
Wheat powdery mildew infection type (IT) according to a (0-9) scale [59].
Table 3.
Wheat powdery mildew infection type (IT) according to a (0-9) scale [59].
| IT | Host response | Symptoms |
| 0 | Immune (I) | No visible signs or symptoms. |
| 1 | Highly resistant (HR) | Small spots only. |
| 2 | Resistant (R) | Chlorosis spots evident. |
| 3 | Moderately resistant (MR) | Large spots with chlorosis and necrosis |
| 4 | Low intermediate (LI) | Mycelium and conidia detectable. |
| 5 | Intermediate (I) | Small to moderate sized colony and conidia present. |
| 6 | High intermediate (HI) | Predominance of moderate sized colony and conidia present. |
| 7 | Moderately susceptible (MS) | At the least 50% of the large colony and conidia are visual. |
| 8 | Susceptible (S) | 75 to 80% of the leaf segment was covered with large colony and conidia. |
| 9 | Highly susceptible (HS) | 100% of the leaf segment covered with large colony and conidia. |
2.3. Model Development
2.3.1. Artificial Neural Network (ANN)
The ANN model was developed using the ‘nnet’ package in R. The dataset was split into 70% training and 30% testing sets. The model used 3-fold cross-validation for hyperparameter tuning. Input features were ‘preprocessed’ by ‘centering’ and ‘scaling’. The model architecture was tuned using a grid search over different combinations of hidden layer sizes (1, 3, 5 neurons) and weight decay values (0.1, 0.5, 1). The final model used a linear output layer for regression. Training was performed using the ‘train’ function from the caret package, with the method set to “nnet” (Table 4).
2.3.2. Ridge Regression
Ridge regression [60] was implemented using the ‘glmnet’ package. The data was split into 70:30 for training and testing. The model used 3-fold cross-validation for ‘lambda’ tuning. Features were ‘centered’ and ‘scaled’. A lambda vector was created using 500 values ranging from 105 to 10-5. The alpha parameter was set to 0 for ridge regression. The ‘train’ function from caret was used with the method set to “glmnet”. The model was trained on the training set, using the predefined lambda vector for tuning (Table 4).
2.3.3. Elastic Net (ENET)
The Elastic Net model [61] also used the ‘glmnet’ package. Data splitting and preprocessing were similar to the Ridge model. The key difference was setting alpha to 0.5, balancing between ridge and lasso penalties. The same lambda vector (500 values from 105 to 10-5) was used for tuning. The model was trained using caret’s ‘train’ function with method “glmnet”, incorporating both L1 and L2 regularization (Table 4).
2.3.4. Gradient Boosting Machine (GBM)
The GBM model [62] was developed using the ‘gbm’ package. After the 70-30 data split, features were ‘centered’ and ‘scaled’. The model was configured with 1000 decision trees, an interaction depth of 3, and a learning rate (shrinkage) of 0.01. Five-fold cross-validation was used within the GBM training process. The distribution was set to “gaussian” for regression tasks. The model was trained directly using the ‘gbm’ function, allowing for parallel processing across available cores (Table 4).
2.3.5. Lasso Regression
Lasso regression [63] was implemented similarly to Ridge regression, using the ‘glmnet’ package. The key difference was setting the alpha parameter to 1, which applies L1 regularization. Data splitting, preprocessing, and lambda vector creation were identical to the Ridge model. The ‘train’ function from caret was used with method “glmnet”, tuning over the same lambda vector but with alpha fixed at 1 (Table 4).
2.3.6. Random Forest
The Random Forest model was developed using the ‘randomForest’ package [64,65]. After the 70-30 data split, 3-fold cross-validation was used for model evaluation. Unlike the other models, explicit feature scaling wasn’t necessary due to the nature of random forests. The model was trained using caret’s ‘train’ function with method “rf”. Default parameters were used for the number of trees and variables considered at each split, allowing the algorithm to optimize these based on the data (Table 4).
2.4. Principle Component Analysis
The Principal Component Analysis was conducted in this study to reduce the dimensionality of the dataset and to explore the underlying patterns and relationships between wheat disease severity variables. By reducing the number of variables, PCA simplifies the interpretation of the data and helps identify the most important features driving the variation. Scaling was applied to the data before performing PCA to ensure that all variables were on a similar scale and to prevent variables with larger magnitudes from dominating the analysis. In this study, standard scaling (z-score normalization) was used, which subtracts the mean and divides by the standard deviation of each variable. This standardization ensures that all variables have a mean of 0 and a standard deviation of 1, making them directly comparable in terms of their influence on the principal components.
Numeric columns were selected for PCA using the ‘sapply’ function, and the PCA was performed using the ‘prcomp’ function with scaling. The ‘fviz_pca_biplot’ function from the ‘factoextra’ package was used to create the biplot, which visually represents the relationships between the variables and observations. The biplot was customized to include ellipses for each disease type, making it easier to visualize the separation between rust and powdery mildew.
2.5. Evaluation Matrix
The performances of the different models were evaluated using a number of statistical criteria: coefficient of determination (), Root Mean Squared Error , normalized root mean square (), mean absolute error () and model efficiency (). Values of evaluation metrics corresponding to a given variable for yellow rust and powdery mildew were computed in R. values nearer to 1 and values close to 0 indicate better model performance. The developed model is usually considered as excellent, good, fair or poor if the value lies in the range of <10%, 10%–20%, 20%–30% or >30%, respectively [66].
Where,
- = predicted value of y, = mean value of y, n= number of predictors, N= total sample size
3. Result
3.1. Yellow Rust Prediction
The performance metrics of six different ML models: ANN, LASSO, Ridge regression, ENET, GBR and RF, to evaluate the impact of meteorological variables on disease severity of yellow rust in wheat are presented in Table 5. The metrics used for assessment include Training RMSE, Training Mean Absolute Error (MAE), Training R-squared (r2) and Training Efficiency (EF), Testing RMSE, Testing MAE, Testing R-squared, and Testing EF.
The results showed R2 between weather parameter and disease severity are strongly correlated with values of 0.96 and 0.93 respectively obtained in calibration and for validation sets. Moreover, the lowest RMSE with 6.38 and 10.96 was obtained during calibration and validation, respectively. The MAE value of 4.77 for calibration and 6.92 for validation envisaged that ANN showed robustness in disease prediction accuracy. Similarly, the RF model also demonstrates excellent performance with R2 values of 0.96 for calibration and 0.92 for validation, and RMSE (5.91 for calibration and 10.93 for validation) and MAE (4.48 for calibration and 7.58 for validation), confirming the RF reliability in disease prediction using climatic variables. Moreover, the Elastic Net, Lasso and Ridge models exhibited moderate to lower predictive performance with lower R2 values and higher RMSE and MAE, revealing lesser accuracy among the models. The GBM model revealed high R2 of 0.94 shows overfitting potential but showed least R2 of 0.88. The EF values further validate these findings, highlighting ANN and RF are efficient models with EF values of 0.96 and 0.97 for calibration, and 0.88 and 0.88 for validation, respectively. The ANN and RF models is most effective and accurate for predicting yellow rust in wheat, while ANN is slightly outperforming than RF in overall evaluation metrics.
The feature importance for predicting yellow rust in wheat using various machine learning models presented in Figure 4. For the Ridge model, evapotranspiration and wind velocity are identified as the most significant predictors, followed by rainfall and relative humidity. The Random Forest model highlights evapotranspiration as the dominant predictor with a substantial margin, followed by Tmax and SSH. The Lasso model also underscores the importance of evapotranspiration and wind velocity, with RHII and rainfall being moderately important. The Elastic Net model aligns closely with Lasso, showing a strong emphasis on evapotranspiration, followed by wind velocity and RHII. In the ANN model, evapotranspiration and wind velocity are most important, with minimum temperature, SSH, and rainfall contributing significantly as well. Finally, the GBM model, represented by relative influence (rel.inf), places the highest importance on evapotranspiration, followed by Tmax and Tmin, indicating a similar pattern of critical features. Across all models, evapotranspiration consistently emerges as the most critical feature, highlighting its pivotal role in predicting yellow rust in wheat. Wind velocity and temperature variables (Tmax and Tmin) also appear prominently across different models, suggesting their relevance in influencing the disease prediction. This comprehensive analysis of feature importance across diverse models underscores the critical environmental variables that need to be monitored for effective yellow rust prediction in wheat.
3.2. Powdery Mildew Prediction
The Table 6 presents the performance of various machine learning models in predicting powdery mildew of wheat. The ANN model demonstrated exceptional performance, with an R-squared value of 0.98 and 0.95 for the calibration and validation sets, respectively. It exhibited relatively low RMSE values of 4.98 and 6.98, along with nRMSE values of 5.24 and 7.35, and MAE values of 3.32 and 4.98 for the calibration and validation sets, respectively. The EF values were also high at 0.98 and 0.95, indicating excellent model efficiency. The GBM model also showed promising results, with an R-squared of 0.98 and 0.90, RMSE of 0.15 and 0.30, nRMSE of 5.28 and 10.86, MAE of 0.10 and 0.22, and EF of 0.98 and 0.89 for the calibration and validation sets, respectively. The RF model performed similarly well, with an R-squared of 0.98 and 0.90, RMSE of 4.52 and 10.60, nRMSE of 4.75 and 11.16, MAE of 2.82 and 6.85, and EF of 0.98 and 0.89 for the calibration and validation sets, respectively.
On the other hand, the Elastic Net, Lasso, and Ridge Regression models exhibited relatively lower performance. The Elastic Net model had an R-squared of 0.77 and 0.95, RMSE of 16.35 and 6.98, nRMSE of 17.21 and 7.35, MAE of 13.46 and 4.98, and EF of 0.77 and 0.95 for the calibration and validation sets, respectively. The Lasso model showed consistent performance with an R-squared of 0.77 and 0.74, RMSE of 16.38 and 16.36, nRMSE of 17.24 and 17.22, MAE of 13.54 and 14.55, and EF of 0.77 and 0.73 for the calibration and validation sets, respectively. The Ridge Regression model had an R-squared of 0.74 and 0.73, RMSE of 17.41 and 16.69, nRMSE of 18.32 and 17.57, MAE of 14.66 and 14.24, and EF of 0.74 and 0.72 for the calibration and validation sets, respectively.
The variable importance plot (Figure 5) provide valuable insights into the relative importance of various meteorological factors in modeling powdery mildew in wheat, allowing for better understanding and potential improvements in the prediction models. For the Ridge Regression, the most important variables are relative humidity, Tmin, rainfall, SSH, and Tmax. The Random Forest model assigns high importance to Tmin, Tmax, relative humidity, Eva, and SSH. The Lasso Regression model highlights Tmax, Tmin, relative humidity, SSH, and rainfall as the top influential variables. The Elastic Net model also identifies Tmin, relative humidity, SSH, rainfall, and Eva as the most critical factors.
The ANN model reveals that Tmin, SSH, WV, relative humidity, rainfall, Eva, and Tmax are the most significant variables for predicting powdery mildew. The variable importance plot indicates, GBM model assign importance to Tmin, relative humidity, Tmax, SSH, and Eva as crucial predictors of powdery mildew based on the collective importance assigned by multiple machine learning models, the key factors that appear to be most influential for predicting powdery mildew in wheat are Tmin, relative humidity, rainfall and sunshine hours.
The density distributions of predicted values for yellow rust and powdery mildew disease severity in wheat, obtained from various machine learning models (Figure 6). Density distributions plot for yellow rust showed multiple peaks signifying that the models predict varying levels of disease severity. The ANN and Ridge models exhibited distinct dense peaks at certain severity values, while other models such as Elastic Net, GBM, Lasso, and RF showed more dispersed distributions with several local peaks. For powdery mildew density distribution pattern is concentrated with higher peaks indicating that the models tend to predict specific severity levels more frequently. The ANN and Ridge models revealed sharper peaks are indicating more consistent predictions, while the other models show slightly broader distributions with multiple local maxima. The multi-modal distributions indicate that most models predict a range of severity levels, with some models exhibiting a tendency to predict specific severity levels more frequently than others.
The figure (Figure 7) presents a scatter plot comparison between the observed and predicted values of disease severity for yellow rust and powdery mildew in wheat, obtained from various machine learning models. For yellow rust disease severity, the scatter points align closely along the diagonal line, indicating a good agreement between the observed and predicted values across the different models. The points are evenly distributed, suggesting that the models can accurately predict disease severity levels across the entire range of observed values. However, there are a few outliers where the predicted values deviate from the observed ones.
In the case of powdery mildew disease severity, the scatter points also follow the diagonal line reasonably well, implying that the models can capture the observed disease severity levels to a good extent. Nevertheless, there appears to be slightly more deviation from the diagonal, particularly at higher severity levels, where some models tend to overpredict or underpredict the observed values. Additionally, there are more scattered outliers compared to the yellow rust plot, indicating instances where the models struggle to accurately predict the powdery mildew severity.
Overall, the scatter plots provide a visual assessment of the model performance, allowing for the identification of potential biases or discrepancies between the observed and predicted values. While both diseases exhibit a satisfactory agreement, the powdery mildew plot suggests slightly more challenges in predicting disease severity accurately, especially at higher severity levels, compared to yellow rust.
Regression Models
The regression equations (Table 7) provide insights into the relationships between meteorological factors and the severity of yellow rust disease, enabling better understanding and potential improvements in disease prediction and management strategies.
Regression equation obtained from ENET suggests that the severity of yellow rust is positively influenced by Eva, WV, rainfall, and sunshine hours, while it is negatively affected by maximum relative humidity (RHII). Similar to the Elastic Net equation, the Lasso regression equation shows a positive relationship between disease severity and Eva, WV, and rainfall, while relative humidity has a negative impact. The Ridge regression equation also exhibits positive coefficients for Eva, WV, rainfall, and Tmax, suggesting that higher values of these variables are associated with increased yellow rust severity.
The regression equations obtained from different machine learning models for predicting the severity of powdery mildew disease in wheat is presented in Table 8. Regression equation obtained for ENET suggest that the severity of powdery mildew is negatively influenced by maximum temperature and relative humidity (RHI and RHII), while it is positively related to Tmin and sunshine hours. Similar to the Elastic Net equation, the Lasso regression equation shows a negative relationship between disease severity and Tmax and relative humidity, while Tmin and sunshine hours have a positive impact. Additionally, the Lasso model includes rainfall as a significant predictor, with a positive coefficient indicating that higher rainfall is associated with increased powdery mildew severity. The Ridge regression equation also exhibits a negative coefficient for maximum relative humidity (RHI) and Tmax. On the other hand, Tmin, rainfall, and sunshine hours have positive coefficients.
Based on the regression equations and variable importance plots, there are some notable differences in the influential variables for predicting yellow rust and powdery mildew severity in wheat. Eva and WV emerge as significant positive predictors across the Elastic Net, Lasso, and Ridge regression equations, rainfall also has a positive coefficient. On the other hand, for powdery mildew prediction temperature variables (Tmax and Tmin) play a crucial role. This suggests that higher maximum temperatures may suppress powdery mildew development, while higher minimum temperatures could promote disease severity. Additionally, the variable importance plots further highlight the differences in influential factors for the two diseases. For yellow rust, variables like Eva, WV, and rainfall appear to be more important, whereas for powdery mildew, temperature variables (minimum and maximum temperatures), relative humidity, and sunshine hours are among the top influential factors. These differences in the significant predictors and their relationships with disease severity suggest that the environmental conditions favoring the development and spread of yellow rust and powdery mildew may differ. This insight can be valuable for targeted disease management strategies and for understanding the unique environmental requirements of each disease.
Taylor diagram obtained for yellow rust predictions, the ANN and Lasso models demonstrate the highest correlation with the observed data, followed by the ENET, RF, Ridge, and GBM models. The ANN model again exhibits the lowest centered root mean square error (CRMSE), suggesting superior performance in predicting yellow rust severity compared to the other models. In the case of powdery mildew predictions, the ANN and RF models show the highest correlation with the observed data, followed by the Lasso, ENET, Ridge, and GBM models. The ANN model exhibits the lowest CRMSE, indicating the best overall performance among the evaluated models (Figure 8).
3.3. Principle Component Analysis
3.3.1. PCA for Yellow Rust
Factor analysis was conducted to cluster the originally recognized eight weather parameters into statistical factors based on their correlation patterns. Using the Cumulative Variance Explained approach, three principal components (PCs) with eigenvalues greater than 0.5 were selected (Table 9), collectively accounting for 87.18% of the cumulative variance. The first principal component (PC1) has a significant contribution from several variables, with Tmax (-0.4395), SSH (-0.4262), RHII (0.4137), and Eva (-0.4009) showing the highest loadings, indicating these variables strongly influence PC1. This component explains the largest proportion of variance, 59.43%, with an eigenvalue of approximately 4.75, suggesting it captures a substantial portion of the data’s variability. The second principal component (PC2) has significant loadings from Rainfall (-0.5893), WV (-0.5702), and Tmin (-0.3141), explaining 20.35% of the variance with an eigenvalue of around 1.63. This suggests that these variables are primarily associated with PC2, indicating a distinct underlying pattern in the weather data. The third principal component (PC3) has the highest contributions from Rainfall (-0.7448), WV (0.4560), and Tmin (0.4025), explaining 7.41% of the variance with an eigenvalue of approximately 0.59. This component captures additional variability not explained by the first two components. Collectively, these three principal components explain 87.18% of the total variance in the weather data, with each component highlighting specific weather parameters that contribute most significantly to the observed patterns. PC1 is dominated by temperature-related variables and sunshine hours, PC2 is influenced mainly by rainfall and wind velocity, and PC3 highlights the variability due to rainfall, wind velocity, and Tmin (Figure 9).
3.3.2. PCA for Powdery Mildew
Similarly factor analysis was conducted to cluster the originally recognized eight weather parameters into statistical factors based on their correlation patterns. Using the Cumulative Variance Explained approach, three principal components (PCs) with eigenvalues greater than 0.5 were selected (Table 10), collectively accounting for 88.36% of the cumulative variance. The first principal component (PC1) has significant contributions from Tmax (0.4528), SSH (0.4056), Eva (0.4120), and RHII (-0.4097), indicating these variables strongly influence PC1. This component explains the largest proportion of variance, 58.22%, with an eigenvalue of approximately 4.66, suggesting it captures a substantial portion of the data’s variability. The second principal component (PC2) has significant loadings from Rainfall (0.6912), WV (0.5991), and Tmin (0.2284), explaining 19.55% of the variance with an eigenvalue of around 1.56. This suggests that these variables are primarily associated with PC2, indicating a distinct underlying pattern in the weather data. The third principal component (PC3) has the highest contributions from Tmin (0.4773), Rainfall (0.3258), and RHII (0.3063), explaining 10.59% of the variance with an eigenvalue of approximately 0.85. This component captures additional variability not explained by the first two components. Collectively, these three principal components explain 88.36% of the total variance in the weather data, with each component highlighting specific weather parameters that contribute most significantly to the observed patterns. PC1 is dominated by temperature-related variables and sunshine hours, PC2 is influenced mainly by rainfall and wind velocity, and PC3 highlights the variability due to minimum temperature, rainfall, and relative humidity (Figure 10).
The PCA biplot for yellow rust disease of wheat reveals that relative humidity indices (RHI and RHII) and rainfall are closely associated with the disease incidence, indicating a positive correlation. Conversely, factors like Tmin, SSH, and Eva exhibit a negative correlation.
In the case of powdery mildew disease, the biplot shows that sunshine hours (SSH), Tmax, and evaporation are positively correlated with the disease incidence. These environmental factors likely create conditions conducive to the growth and proliferation of the powdery mildew pathogen. On the other hand, relative humidity indices (RHI and RHII) and wind velocity exhibit a negative correlation (Figure 11).
4. Discussion
Region wise prediction of rust and powdery mildew based on meteorological data is crucial for effective disease management and optimizing crop yields [67,68,69]. These fungal diseases are influenced by specific weather conditions, meteorological data is crucial for forecasting outbreaks [49]. The results of the study indicate that rust and powdery mildew infestation increases with average temperature and humidity. Similarly, previous studies also reported that powdery mildew flourishes in conditions of high humidity and moderate temperatures (15-20°C), while rust is favored by warm temperatures (20-25°C) and prolonged leaf wetness [70,71]. A strong correlation between disease incidence and severity of winter wheat rust with weather data (r = 0.89 and r = 0.87, respectively) was reported using CART or decision tree analysis [72]. However, in our study, the coefficient of determination between weather parameter and disease severity are strongly correlated with values of 0.96 and 0.93 during calibration and for validation, respectively. Hence, it is best to described the relationship between weather variables and winter wheat rust epidemics while some differences in weather variables [73,74]. Stepwise regression analysis for wheat rust showed that maximum relative humidity positively correlated with rust severity, while solar radiation and minimum relative humidity were negatively correlated in disease prection [75]. Temperature-related variables are the most crucial for explaining and forecasting the occurrence of leaf rust, whereas stripe rust is better explained by a humid and warm environment. However, evapotranspiration is primarily a function of maximum air temperature [76,77], whereas, wind velocity and temperature also appear as important variables across different models [78]. Similarly, our results aligning with these findings as the most critical feature across all machine learning models.
Linear regression analysis by relating leaf rust severity to maximum air temperature and humidity thermal ratio showed r2 value of 0.68 and 0.71, respectively [79]. The relationship between wheat leaf rust and weather variables was analysed by [80] using stochastic approach including Dennis model and Monte Carlo simulation. This approach emphasized to study the combined effects of temperature, relative humidity, and rainfall on the infection of wheat by P. striiformis during continuous hours over the critical period for the development of stripe rust incidence and severity in wheat. The results indicated that optimal conditions for the development of wheat stripe rust included a combination of relative humidity greater than 92%, temperatures between 4°C and 16°C for at least 4 continuous hours, and rainfall of 0.1 mm or less. Shrinkage regression and machine-learning approaches envisaged that the ANN model is outperformed in calibration and validation to derive models for the prediction of epidemiological characteristics of white rust in mustard crop [81]. Decision tree classifier is utilized to predict stripe rust in wheat using limited weather variable and achieved a training and test accuracy of 75.70%, however, stem rust developed prediction accuracy of 90.05% using 10-fold cross-validation [82]. In present study, a six linear regression model showed highest accuracy of r2 = 90.60 and revealed that WV and relative humidity are important variables to predict disease [83]. Similarly features importance by our best performing model ANN gives the high importance/weightage to WV for predicting yellow rust severity, whereas regression analysis by Lasso and Ridge shows that minimum relative humidity is negatively align with the prediction of yellow rust.
Empirical model study [83] shows that wind is the main weather factor influencing the powdery mildew epidemic followed by sunshine and radiation. However, temperature is the main weather factor influencing disease severity [84]. Clam weather conditions create a humid environment, that favors the development of powdery mildew severity [85,86]. The effect of wind on humidity is stronger than the effect of wind on dispersal. Low wind runs may still be sufficient to move initial inoculum between fields. Our best performing model ANN also shows the importance of minimum temperature and sun shine hours for prediction of powdery mildew.
Stepwise selection method in logistic regression revealed that weekly mean temperature, relative humidity and sunshine are the key predictor variables for powdery mildew assessment at the high risk [87]. Odds ratio point estimates indicates that increasing weekly temperature (from 11.5 to 21.9 °C) and decreasing weekly relative humidity (from 65.6% to 41.8%) and sunshine hours (from 8.7 to 5.4 h) were key drivers for high powdery mildew severity. Cumulative logit models relating development of wheat powdery mildew to six weather variables produced R2 of 84.1%. Rainfall and vapor pressure deficit were statistically significantly related to the disease score. A best model with temperature and humidity-related produced a generalized R2 of 72.4%. Greater average wind speed has positive impact on mildew epidemic [88,89]. Hence, positive effect of wind in spore dispersal outweighs its negative effect on reducing humidity [86,90]. However, precipitation has a negative effect on spore survival due to leaching of spores into deep soil.
Accurate disease prediction aids in the implementation of integrated pest management (IPM) strategies, combining cultural practices, resistant varieties, and targeted chemical applications [91,92]. Early warnings on disease incidence allow for proactive measures, such as adjusting irrigation schedules to reduce leaf wetness or optimizing planting dates to avoid peak disease periods [93,94]. Leveraging meteorological data for predicting wheat powdery mildew and rust is vital for enhancing disease management strategies [95,96]. It empowers farmers to make informed decisions, safeguarding crop health, ensuring food security, and promoting sustainable agricultural practices.
PCA conducted by [74] to associate wheat leaf rust with weather and planting date revealed a tripartite structure in the leaf rust progress curves, collectively explaining 73% of the total variance. The first principal component (PC1) accounted for 33.8% of the variability, PC2, explaining 21.6% of the total variance, was predominantly associated with the mean monthly temperature and the frequency of days characterized by minimum temperatures ranging from 5°C to 25°C, coupled with maximum relative humidity exceeding 60%. The third principal component (PC3) elucidated 17.9% of the total variance and demonstrated a moderate positive relation for the mean monthly temperature.
Conclusion
The integration of ANN and regularized regression models with meteorological data demonstrates a powerful approach to predicting the severity of wheat diseases. The ANN model emerged as the most effective. Results indicate superior predictive accuracy and robustness, with low RMSE and MAE values for both diseases. The RF model also showed strong predictive performance, although slightly less accurate than the ANN model. The principal component analysis (PCA) identified evapotranspiration, temperature, and maximum relative humidity as the most critical variables influencing disease incidence, accounting for a significant portion of the variance in the data (87.18% for yellow rust and 88.36% for powdery mildew). The findings emphasize the importance of monitoring key meteorological variables, particularly evapotranspiration, temperature, and humidity, for effective disease prediction and management in wheat. The ANN and RF models provide valuable tools for farmers and researchers, enabling more accurate and timely predictions of disease outbreaks, which can inform proactive management strategies to mitigate the impact of these diseases on wheat production. Future research could explore the integration of additional environmental factors and the application of these models to other crops and regions to further enhance their predictive capabilities and generalizability.
Author Contributions
Conceptualization, A.B. and R.R.; methodology, A.B. and R.R.; software, A.B.; validation, A.B., R.R., M.S., R.P., and S.C.; formal analysis, A.B., M.S. and R.P.; investigation, R.R. and A.B; resources, A.B., R.R. and S.C.; data curation, A.B. and R.P.; writing—original draft preparation, A.B., M.S.; writing—review and editing, A.B., M.S.; S.C.; visualization, A.B., ; supervision, R.R; project administration, R.R.
Funding
This research did not receive any specific grant from funding agencies in the public, commercial, or not-for-profit sectors.
Data Availability Statement
Data will be made available on request.
Conflicts of Interest
The authors declare the there is no financial interests/personal relationships which may be considered as potential competing interests that could have appeared to influence the work reported in this paper.
References
- Giraldo, P.; Benavente, E.; Manzano-Agugliaro, F.; Gimenez, E. Worldwide Research Trends on Wheat and Barley: A Bibliometric Comparative Analysis. Agronomy. 2019, 9, 352. [CrossRef]
- OECD-FAO. Agricultural Outlook 2022–2031. 2022, Paris.
- Zhang, D.; Chen, G.; Zhang, H.; Jin, N.; Gu, C.; Weng, S.; Wang, Q.; Chen, Y. Integration of spectroscopy and image for identifying fusarium damage in wheat kernels. Spectrochim Acta A Mol Biomol Spectrosc. 2020, 236, 118344. [CrossRef]
- Randhawa, M.S.; Bhavani, S.; Singh, P.K.; Huerta-Espino, J.; Singh, R.P. Disease Resistance in Wheat: Present Status and Future Prospects, in: Disease Resistance in Crop Plants. Springer International Publishing, Cham, 2019, pp. 61–81. [CrossRef]
- Liu, T.; Wan, A.; Liu, D.; Chen, X. Changes of Races and Virulence Genes in Puccinia striiformis f. sp. tritici , the Wheat Stripe Rust Pathogen, in the United States from 1968 to 2009. Plant Dis. 2017, 101, 1522–1532. [CrossRef]
- Cat, A.; Tekin, M.; Akan, K.; Akar, T., Catal, M. Virulence characterization of the wheat stripe rust pathogen, Puccinia striiformis f. sp. tritici , in Turkey from 2018 to 2020. Can. J. Plant Pathol. 2023, 45, 158–167. [CrossRef]
- Kusch, S.; Qian, J.; Loos, A.; Kümmel, F.; Spanu, P.D.; Panstruga, R. Long-term and rapid evolution in powdery mildew fungi. Mol Ecol. 2024, 33. [CrossRef]
- Zhang, G.; Sun, M.; Ma, X.; Liu, W.; Du, Z.; Kang, Z.; Zhao, J. Yr5-virulent races of Puccinia striiformis f. sp. tritici possess relative parasitic fitness higher than current main predominant races and potential risk. J Integr Agric. 2024, 23, 2674–2685. [CrossRef]
- Green, A.J.; Berger, G.; Griffey, C.A.; Pitman, R.; Thomason, W.; Balota, M. Genetic resistance to and effect of leaf rust and powdery mildew on yield and its components in 50 soft red winter wheat cultivars. Crop Protection. 2014, 64, 177–186. [CrossRef]
- Zhang, Q.; Men, X.; Hui, C.; Ge, F.; Ouyang, F. Wheat yield losses from pests and pathogens in China. Agric Ecosyst Environ. 2022, 326, 107821. [CrossRef]
- Draz, I.S.; Esmail, S.M.; Abou-Zeid, M.A.E.-H.; Essa, T.A.E.-M. Powdery mildew susceptibility of spring wheat cultivars as a major constraint on grain yield. Annals of Agricultural Sciences. 2019, 64, 39–45. [CrossRef]
- Dwivedi, S.L.; Scheben, A.; Edwards, D.; Spillane, C.; Ortiz, R. Assessing and Exploiting Functional Diversity in Germplasm Pools to Enhance Abiotic Stress Adaptation and Yield in Cereals and Food Legumes. Front Plant Sci. 2017, 8. [CrossRef]
- Hatfield, J.L.; Dold, C. Water-Use Efficiency: Advances and Challenges in a Changing Climate. Front Plant Sci. 2019, 10. [CrossRef]
- Zulfikri, A.; Ningsih, E.M.N.; Harsono, I.; Susanto, H. Agricultural Adaptation Strategies to Weather Fluctuations for Improved Agribusiness Sustainability in West Java. West Science Nature and Technology. 2024, 2, 17–23. [CrossRef]
- USDA. Grain and Feed Annual - 2022. 2024, United States.
- Rosenzweig, C.; Parry, M.L. Potential impact of climate change on world food supply. Nature. 1994, 367, 133–138. [CrossRef]
- Fan, M.; Shen, J.; Yuan, L.; Jiang, R.; Chen, X.; Davies, W.J.; Zhang, F. Improving crop productivity and resource use efficiency to ensure food security and environmental quality in China. J Exp Bot. 2012, 63, 13–24. [CrossRef]
- Lobell, D.B.; Schlenker, W.; Costa-Roberts, J. Climate Trends and Global Crop Production Since 1980. Science. 2011, 333, 616–620. [CrossRef]
- Fei, L.; Meijun, Z.; Jiaqi, S.; Zehui, C.; Xiaoli, W.; Jiuchun, Y. Maize, wheat and rice production potential changes in China under the background of climate change. Agric Syst. 2020, 182, 102853. [CrossRef]
- Hou, P.; Liu, Yuee, Liu, W.; Yang, H.; Xie, R.; Wang, K.; Ming, B.; Liu, G.; Xue, Jun, Wang, Yonghong, Zhao, R.; Zhang, W.; Wang, Yongjun, Bian, S.; Ren, H.; Zhao, X.; Liu, P.; Chang, J.; Zhang, G.; Liu, J.; Yuan, L.; Zhao, H.; Shi, L.; Zhang, L.; Yu, L.; Gao, J.; Yu, X.; Wang, Z.; Shen, L.; Ji, P.; Yang, S.; Zhang, Z.; Xue, Jiquan, Ma, X.; Wang, X.; Lu, T.; Dong, B.; Li, G.; Ma, B.; Li, J.; Deng, X.; Liu, Yonghong, Yang, Q.; Jia, C.; Chen, X.; Fu, H.; Li, S. Quantifying maize grain yield losses caused by climate change based on extensive field data across China. Resour Conserv Recycl. 2021, 174, 105811. [CrossRef]
- Challinor, A.J.; Watson, J.; Lobell, D.B.; Howden, S.M.; Smith, D.R.; Chhetri, N. A meta-analysis of crop yield under climate change and adaptation. Nat Clim Chang. 2014, 4, 287–291. [CrossRef]
- Zhang, H.; Tang, Y.; Chandio, A.A.; Sargani, G.R.; Ankrah Twumasi, M. Measuring the Effects of Climate Change on Wheat Production: Evidence from Northern China. Int J Environ Res Public Health. 2022, 19, 12341. [CrossRef]
- J.; Ruane, A.C.; Wallach, D.; Wang, T.; Wu, D.; Liu, Z.; Zhu, Y.; Zhu, Z.; Asseng, S. Temperature increase reduces global yields of major crops in four independent estimates. Proceedings of the National Academy of Sciences. 2017, 114, 9326–9331. [CrossRef]
- Singh, J.; Chhabra, B.; Raza, A.; Yang, S.H.; Sandhu, K.S. Important wheat diseases in the US and their management in the 21st century. Front Plant Sci. 2023, 13. [CrossRef]
- Kaur, B.; Sandhu, K.S.; Kamal, R.; Kaur, K.; Singh, J.; Röder, M.S.; Muqaddasi, Q.H. Omics for the Improvement of Abiotic, Biotic, and Agronomic Traits in Major Cereal Crops: Applications, Challenges, and Prospects. Plants. 2021, 10, 1989. [CrossRef]
- Saharan, M.S.; Bhardwaj, S.C.; Chatrath, R.; Sharma, P.; Choudhary, A.K.; Gupta, R.K. Wheat blast disease—an overview. . Journal of Wheat Research. 2016, 8(1), 1-5.
- Pequeno, D.N.L.; Ferreira, T.B.; Fernandes, J.M.C.; Singh, P.K.; Pavan, W.; Sonder, K.; Robertson, R.; Krupnik, T.J.; Erenstein, O., Asseng, S. Production vulnerability to wheat blast disease under climate change. Nat Clim Chang. 2024. 14, 178–183. [CrossRef]
- Islam, M.T.; Gupta, D.R.; Hossain, A.; Roy, K.K.; He, X.; Kabir, M.R.; Singh, P.K.; Khan, Md.A.R.; Rahman, M.; Wang, G.-L. Wheat blast: a new threat to food security. Phytopathology Research. 2020, 2, 28. [CrossRef]
- Shizhen, W.; Jiaoyu, W.; Zhen, Z.; Zhongna, H.; Xueming, Z.; Rongyao, C.; Haiping, Q.; Yanli, W.; Fucheng, L.; Guochang, S. The Risk of Wheat Blast in Rice–Wheat Co-Planting Regions in China: MoO Strains of Pyricularia oryzae Cause Typical Symptom and Host Reaction on Both Wheat Leaves and Spikes. Phytopathology. 2021, 111, 1393–1400. [CrossRef]
- Meyer, M.; Bacha, N.; Tesfaye, T.; Alemayehu, Y.; Abera, E.; Hundie, B.; Woldeab, G.; Girma, B.; Gemechu, A.; Negash, T.; Mideksa, T.; Smith, J.; Jaleta, M.; Hodson, D.; Gilligan, C.A. Wheat rust epidemics damage Ethiopian wheat production: A decade of field disease surveillance reveals national-scale trends in past outbreaks. PLoS One. 2021, 16, e0245697. [CrossRef]
- Singh, R.P.; Hodson, D.P.; Huerta-Espino, J.; Jin, Y.; Bhavani, S.; Njau, P.; Herrera-Foessel, S.; Singh, P.K.; Singh, S.; Govindan, V. The Emergence of Ug99 Races of the Stem Rust Fungus is a Threat to World Wheat Production. Annu Rev Phytopathol. 2011, 49, 465–481. [CrossRef]
- Jevtić, R.; Župunski, V. The challenge of managing yellow rust (Puccinia striiformis f.sp. tritici) in winter wheat: how combined climate and pathogen stressors impact variability in genotype reactions. Front Plant Sci. 2023, 14. [CrossRef]
- Castrillo-Sequeira, D.; Jiménez-Robles, R.; Granados-Montero, M. Current situation of viticulture in Costa Rica and management strategies for downy mildew (Plasmopara viticola). Revista Mexicana de Fitopatología, Mexican Journal of Phytopathology. 2023, 42. [CrossRef]
- Ullah, A.; Arif, A.R.; Yasin, M.H.; Zubair, M.M.; Salman, M.; Mustafa, M.G.; Usman, M. Worldwide Wheat Diseases their Current Status and Mode of Resistance: A Review. . Asian Journal of Biotechnology and Genetic Engineering. 2024, 7, 139–149.
- Aoun, M.; Breiland, M.; Kathryn Turner, M.; Loladze, A.; Chao, S.; Xu, S.S.; Ammar, K.; Anderson, J.A.; Kolmer, J.A.; Acevedo, M. Genome-Wide Association Mapping of Leaf Rust Response in a Durum Wheat Worldwide Germplasm Collection. Plant Genome. 2016, 9. [CrossRef]
- Morgounov, A.; Tufan, H.A.; Sharma, R.; Akin, B.; Bagci, A.; Braun, H.-J.; Kaya, Y.; Keser, M.; Payne, T.S.; Sonder, K.; McIntosh, R. Global incidence of wheat rusts and powdery mildew during 1969–2010 and durability of resistance of winter wheat variety Bezostaya 1. Eur J Plant Pathol. 2012, 132, 323–340. [CrossRef]
- Figueroa, M.; Hammond-Kosack, K.E.; Solomon, P.S. A review of wheat diseases—a field perspective. Mol Plant Pathol. 2018, 19, 1523–1536. [CrossRef]
- Yao, Z.; Lei, Y.; He, D. Early Visual Detection of Wheat Stripe Rust Using Visible/Near-Infrared Hyperspectral Imaging. Sensors. 2019, 19, 952. [CrossRef]
- Wang, A.; Jiang, R.; Zhang, M.; Shao, H.; Xu, F.; Liu, K.; Gao, H.; Fan, J.; Liu, W.; Hu, X.; Zhou, Y.; Xu, X. A rapid tool for quantification of latent infection of wheat leaves by powdery mildew1. J Integr Agric. 2024. [CrossRef]
- An, L.; Liu, Y.; Wang, N.; Liu, G.; Liu, M.; Tang, W.; Sun, H.; Li, M. Classification of wheat powdery mildew based on hyperspectral: From leaves to canopy. Crop Protection. 2024, 177, 106559. [CrossRef]
- Gaurav, S.; Chaudhary, V. Do farmers care about basis risk? Evidence from a field experiment in India. Clim Risk Manag. 2020, 27, 100201. [CrossRef]
- Fenu, G.; Malloci, F.M. Forecasting Plant and Crop Disease: An Explorative Study on Current Algorithms. BDCC. 2021, 5, 2. [CrossRef]
- Gouache, D.; Léon, M.S.; Duyme, F.; Braun, P. A novel solution to the variable selection problem in Window Pane approaches of plant pathogen – Climate models: Development, evaluation and application of a climatological model for brown rust of wheat. Agric For Meteorol. 2015, 205, 51–59. [CrossRef]
- Hayıt, T.; Erbay, H.; Varçın, F.; Hayıt, F.; Akci, N. The classification of wheat yellow rust disease based on a combination of textural and deep features. Multimed Tools Appl. 2023, 82, 47405–47423. [CrossRef]
- Sperschneider, J. Machine learning in plant–pathogen interactions: empowering biological predictions from field scale to genome scale. New Phytologist. 2020, 228, 35–41. [CrossRef]
- Huerta-Espino, J.; Singh, R.P.; Germán, S.; McCallum, B.D.; Park, R.F.; Chen, W.Q.; Bhardwaj, S.C.; Goyeau, H. Global status of wheat leaf rust caused by Puccinia triticina. Euphytica. 2011, 179, 143–160. [CrossRef]
- Girotto, C.D.; Piadeh, F.; Bkhtiari, V.; Behzadian, K.; Chen, A.S.; Campos, L.C.; Zolgharni, M. A critical review of digital technology innovations for early warning of water-related disease outbreaks associated with climatic hazards. Int. J. Disaster Risk Reduct. 2024, 100, 104151. [CrossRef]
- Delfani, P.; Thuraga, V.; Banerjee, B.; Chawade, A. Integrative approaches in modern agriculture: IoT, ML and AI for disease forecasting amidst climate change. Precis Agric. 2024. [CrossRef]
- González-Domínguez, E.; Caffi, T.; Rossi, V.; Salotti, I.; Fedele, G. Plant Disease Models and Forecasting: Changes in Principles and Applications over the Last 50 Years. Phytopathology. 2023, 113, 678–693. [CrossRef]
- Lindell, C.A.; Irish-Brown, A.; Rothwell, N.L.; Wallis, A.E. Pest and disease risk and management in high-density perennial crops: Current knowledge and areas of future research. Crop Prot. 2023 165, 106150. [CrossRef]
- Wakhungu, C. Loss of soil biodiversity through judicious use of synthetic pesticides; A case study of Trans Nzoia county Kenya. . Scientific Reports in Life Sciences. 2023, 3.
- Venugopal, E.; Krishna, S.B.N.; Golla, N.; Patil, S.J. Nanofungicides: A Promising Solution for Climate-Resilient Plant Disease Management, in: Plant Quarantine Challenges under Climate Change Anxiety. Springer Nature Switzerland, Cham, 2024, pp. 513–532. [CrossRef]
- Boonupara, T.; Udomkun, P.; Khan, E.; Kajitvichyanukul, P. Airborne Pesticides from Agricultural Practices: A Critical Review of Pathways, Influencing Factors, and Human Health Implications. Toxics. 2023. 11, 858. [CrossRef]
- Iqbal, N.; Shahzad, M.U.; Sherif, E.-S.M.; Tariq, M.U.; Rashid, J.; Le, T.-V.; Ghani, A. Analysis of Wheat-Yield Prediction Using Machine Learning Models under Climate Change Scenarios. Sustainability. 2024, 16, 6976. [CrossRef]
- Jain, H.; Dhupper, R.; Shrivastava, A.; Kumar, D.; Kumari, M. Leveraging machine learning algorithms for improved disaster preparedness and response through accurate weather pattern and natural disaster prediction. Front Environ Sci. 2023, 11. [CrossRef]
- Singh, M.; Singh, V.; Kumar, A.; Tewari, S.K.; Sah, V.K.; Singh, R.; Das, S.; Tewari, T. Growth, yield and economic evaluation of early mint technology under poplar based silvi-medicinal system in the foothills of Himalaya. Agroforestry Systems. 2022, 96, 205–219. [CrossRef]
- Deshpande, S.B.; Fehrenbacher, J.B.; Ray, B.W. Mollisols of Tarai region of Uttar Pradesh, northern India, 2. Genesis and classification. Geoderma. 1971, 6, 195–201.
- Loegering, W.Q. Methods for Recording Cereal Rust Data in International Spring Wheat Rust Nursery (IRN). 1959 Washington, DC., USA.
- Saari, E.E.; Prescott, J.M. A scale for appraising the foliar intensity of wheat diseases. , 5th ed. Plant disease reporter. 1975.
- Hoerl, A.E.; Kennard, R.W. Ridge Regression: Biased Estimation for Nonorthogonal Problems. Technometrics. 1970, 12, 55–67. [CrossRef]
- Zou, H.; Hastie, T. Regularization and Variable Selection Via the Elastic Net. J R Stat Soc Series B Stat Methodol. 2005, 67, 301–320. [CrossRef]
- Friedman, J.H. Greedy function approximation: a gradient boosting machine. Ann Stat. 2001, 1189–1232.
- Tibshirani, R. Regression Shrinkage and Selection Via the Lasso. J R Stat Soc Series B Stat Methodol. 1996, 58, 267–288. [CrossRef]
- Breiman, L. Random Forests. Mach Learn. 2001, 45, 5–32. [CrossRef]
- Liaw, A., Wiener, M. Breiman and Cutler’s random forests for classification and regression. R package version, (4.6). 2015.
- Jamieson, P.D.; Porter, J.R.; Wilson, D.R. A test of the computer simulation model ARCWHEAT1 on wheat crops grown in New Zealand. Field Crops Res. 1991, 27, 337–350. [CrossRef]
- Verreet, J.A.; Klink, H.; Hoffmann, G.M. Regional Monitoring for Disease Prediction and Optimization of Plant Protection Measuares: The IPM Wheat Model. Plant Dis. 2000, 84, 816–826. [CrossRef]
- Ali, Y.; Iqbal, S.; Aatif, H.M.; Naveed, K.; Khan, A.A.; Ijaz, M.; Magsi, M.M.; Ahmad, S.; Syed, A.U.A.; Magsi, M.A.; Iqbal, R.K.; Bukhari, N.A.; Hatamleh, A.A.; Raza, A. Predicting Stripe Rust Severity in Wheat Using Meteorological Data with Environmental Response Modeling. J King Saud Univ Sci. 2023, 35, 102591. [CrossRef]
- Singh, R.; Krishnan, P.; Singh, V.K.; Das, B. Estimation of yellow rust severity in wheat using visible and thermal imaging coupled with machine learning models. Geocarto Int. 2023, 38. [CrossRef]
- Ahlawat Y.S. PLANT PATHOLOGY: Crop Diseases and their Management. Division of Plant Pathology Indian Agricultural Research Institute, 2008, New Delhi-110012.
- Rana, V.; Batheja, A.; Sharma, R.; Rana, A. Priyanka. Powdery Mildew of Wheat: Research Progress, Opportunities, and Challenges, in: New Horizons in Wheat and Barley Research. Springer Nature Singapore, Singapore, 2022. pp. 133–178. [CrossRef]
- Rodríguez-Moreno, V.M.; Jiménez-Lagunes, A.; Estrada-Avalos, J.; Mauricio-Ruvalcaba, J.E.; Padilla-Ramírez, J.S. Weather-data-based model: an approach for forecasting leaf and stripe rust on winter wheat. Meteorological Applications. 2020, 27. [CrossRef]
- El-Orabey, W.M., Elkot, A.F. Prediction of leaf rust severity and yield loss in wheat based on environmental factors. Journal of Plant Diseases and Protection. 2020, 127, 507–519. [CrossRef]
- Naseri, B.; Sasani, S. Cultivar, planting date and weather linked to wheat leaf rust development. Cereal Res Commun. 2020, 48, 203–210. [CrossRef]
- El Jarroudi, Moussa, Lahlali, R.; Kouadio, L.; Denis, A.; Belleflamme, A.; El Jarroudi, Mustapha, Boulif, M., Mahyou, H.; Tychon, B. Weather-Based Predictive Modeling of Wheat Stripe Rust Infection in Morocco. Agronomy. 2020, 10, 280. [CrossRef]
- Tan, Z.-H.; Zhao, J.-F.; Wang, G.-Z.; Chen, M.-P.; Yang, L.-Y.; He, C.-S.; Restrepo-Coupe, N.; Peng, S.-S.; Liu, X.-Y.; da Rocha, H.R.; Kosugi, Y.; Hirano, T.; Saleska, S.R.; Goulden, M.L.; Zeng, J.; Ding, F.-J.; Gao, F.; Song, L. Surface conductance for evapotranspiration of tropical forests: Calculations, variations, and controls. Agric For Meteorol. 2019, 275, 317–328. [CrossRef]
- Valipour, M., Guzmán, S.M. Identification of the Meteorological Variables Influencing Evapotranspiration Variability Over Florida. Environ. Monit. Assess. 2022, 27, 645–663. [CrossRef]
- Venter, Z.S.; Brousse, O.; Esau, I.; Meier, F. Hyperlocal mapping of urban air temperature using remote sensing and crowdsourced weather data. Remote Sens Environ. 2020, 242, 111791. [CrossRef]
- Vijaya Kumar, P. Development of weather-based prediction models for leaf rust in wheat in the Indo-Gangetic plains of India. Eur J Plant Pathol. 2014, 140, 429–440. [CrossRef]
- El, Jarroudi.; Moussa, Kouadio, L.; Bock, C.H.; El Jarroudi, Mustapha, Junk, J.; Pasquali, M.; Maraite, H.; Delfosse, P. A Threshold-Based Weather Model for Predicting Stripe Rust Infection in Winter Wheat. Plant Dis. 2017, 101, 693–703. [CrossRef]
- Singh, M.; Savary, S.; Setiya, P.; Tewari, A.K.; Nain, A.S. Multivariate analysis of the effects of weather variables on white rust epidemics and yield reduction of mustard over multiple growing seasons. Plant Pathol. 2024, 73, 791–809. [CrossRef]
- Mulatu, W.B.; Bedasa, M.F.; Terefa, G.K. Prediction of Wheat Rust Diseases Using Data Mining Application. OAlib. 2020, 07, 1–27. [CrossRef]
- Te Beest, D.E.; Paveley, N.D.; Shaw, M.W.; van den Bosch, F. Disease–Weather Relationships for Powdery Mildew and Yellow Rust on Winter Wheat. Phytopathology. 2008, 98, 609–617. [CrossRef]
- Garrett, K.A.; Nita, M.; De Wolf, E.D.; Esker, P.D.; Gomez-Montano, L.; Sparks, A.H. Plant pathogens as indicators of climate change, in: Climate Change. 2021, Elsevier, pp. 499–513. [CrossRef]
- Friedrich, S. “Modelling infection probability of powdery mildew in winter wheat by meteorological input variables.” 1995, 354–365.
- Wiese, Maurice Victor. Compendium of wheat diseases. . American Phytopathological Society. 1987.
- Bhardwaj, N.R., Banyal, D.K., Roy, A.K. Prediction model for assessing powdery mildew disease in common Oat (Avena sativa L.). Crop Prot. 2021, 146, 105677. [CrossRef]
- Naseri B., Sheykholeslami M. Powdery mildew development is highly associated with a combination of sowing date, weather, wheat cultivar, and maturity. JAST. 2021, 23, 1367–1378.
- Misra, A.K.; Yadav, S.B.; Mishra, S.K.; Tripathi, M.K. Impact of Meteorological Variables and Climate Change on Plant Diseases, in: Plant Pathogens. Apple Academic Press, Includes bibliographical references and index. 2020, pp. 313–327. [CrossRef]
- Janowski, D.; Leski, T. Factors in the Distribution of Mycorrhizal and Soil Fungi. Diversity (Basel). 2022, 14, 1122. [CrossRef]
- Ahmad, A.; Saraswat, D.; El Gamal, A. A survey on using deep learning techniques for plant disease diagnosis and recommendations for development of appropriate tools. SAT. 2023, 3, 100083. [CrossRef]
- Tonle, F.B.N.; Niassy, S.; Ndadji, M.M.Z.; Tchendji, M.T.; Nzeukou, A.; Mudereri, B.T.; Senagi, K.; Tonnang, H.E.Z. A road map for developing novel decision support system (DSS) for disseminating integrated pest management (IPM) technologies. Comput Electron Agric. 2024, 217, 108526. [CrossRef]
- Valleggi, L.; Stefanini, F.M. A mini-review on data science approaches in crop yield and disease detection. fagro. 2024, 6. [CrossRef]
- Araújo, S.O.; Peres, R.S.; Ramalho, J.C.; Lidon, F.; Barata, J. Machine Learning Applications in Agriculture: Current Trends, Challenges, and Future Perspectives. Agronomy. 2023, 13, 2976. [CrossRef]
- Nguyen, C.; Sagan, V.; Skobalski, J.; Severo, J.I. Early Detection of Wheat Yellow Rust Disease and Its Impact on Terminal Yield with Multi-Spectral UAV-Imagery. Remote Sens (Basel). 2023, 15, 3301. [CrossRef]
- Gao, R.; Jin, F.; Ji, M.; Zuo, Y. Research on the Method of Identifying the Severity of Wheat Stripe Rust Based on Machine Vision. Agriculture. 2023, 13, 2187. [CrossRef]
Figure 1.
Spatial layout map of the study area.
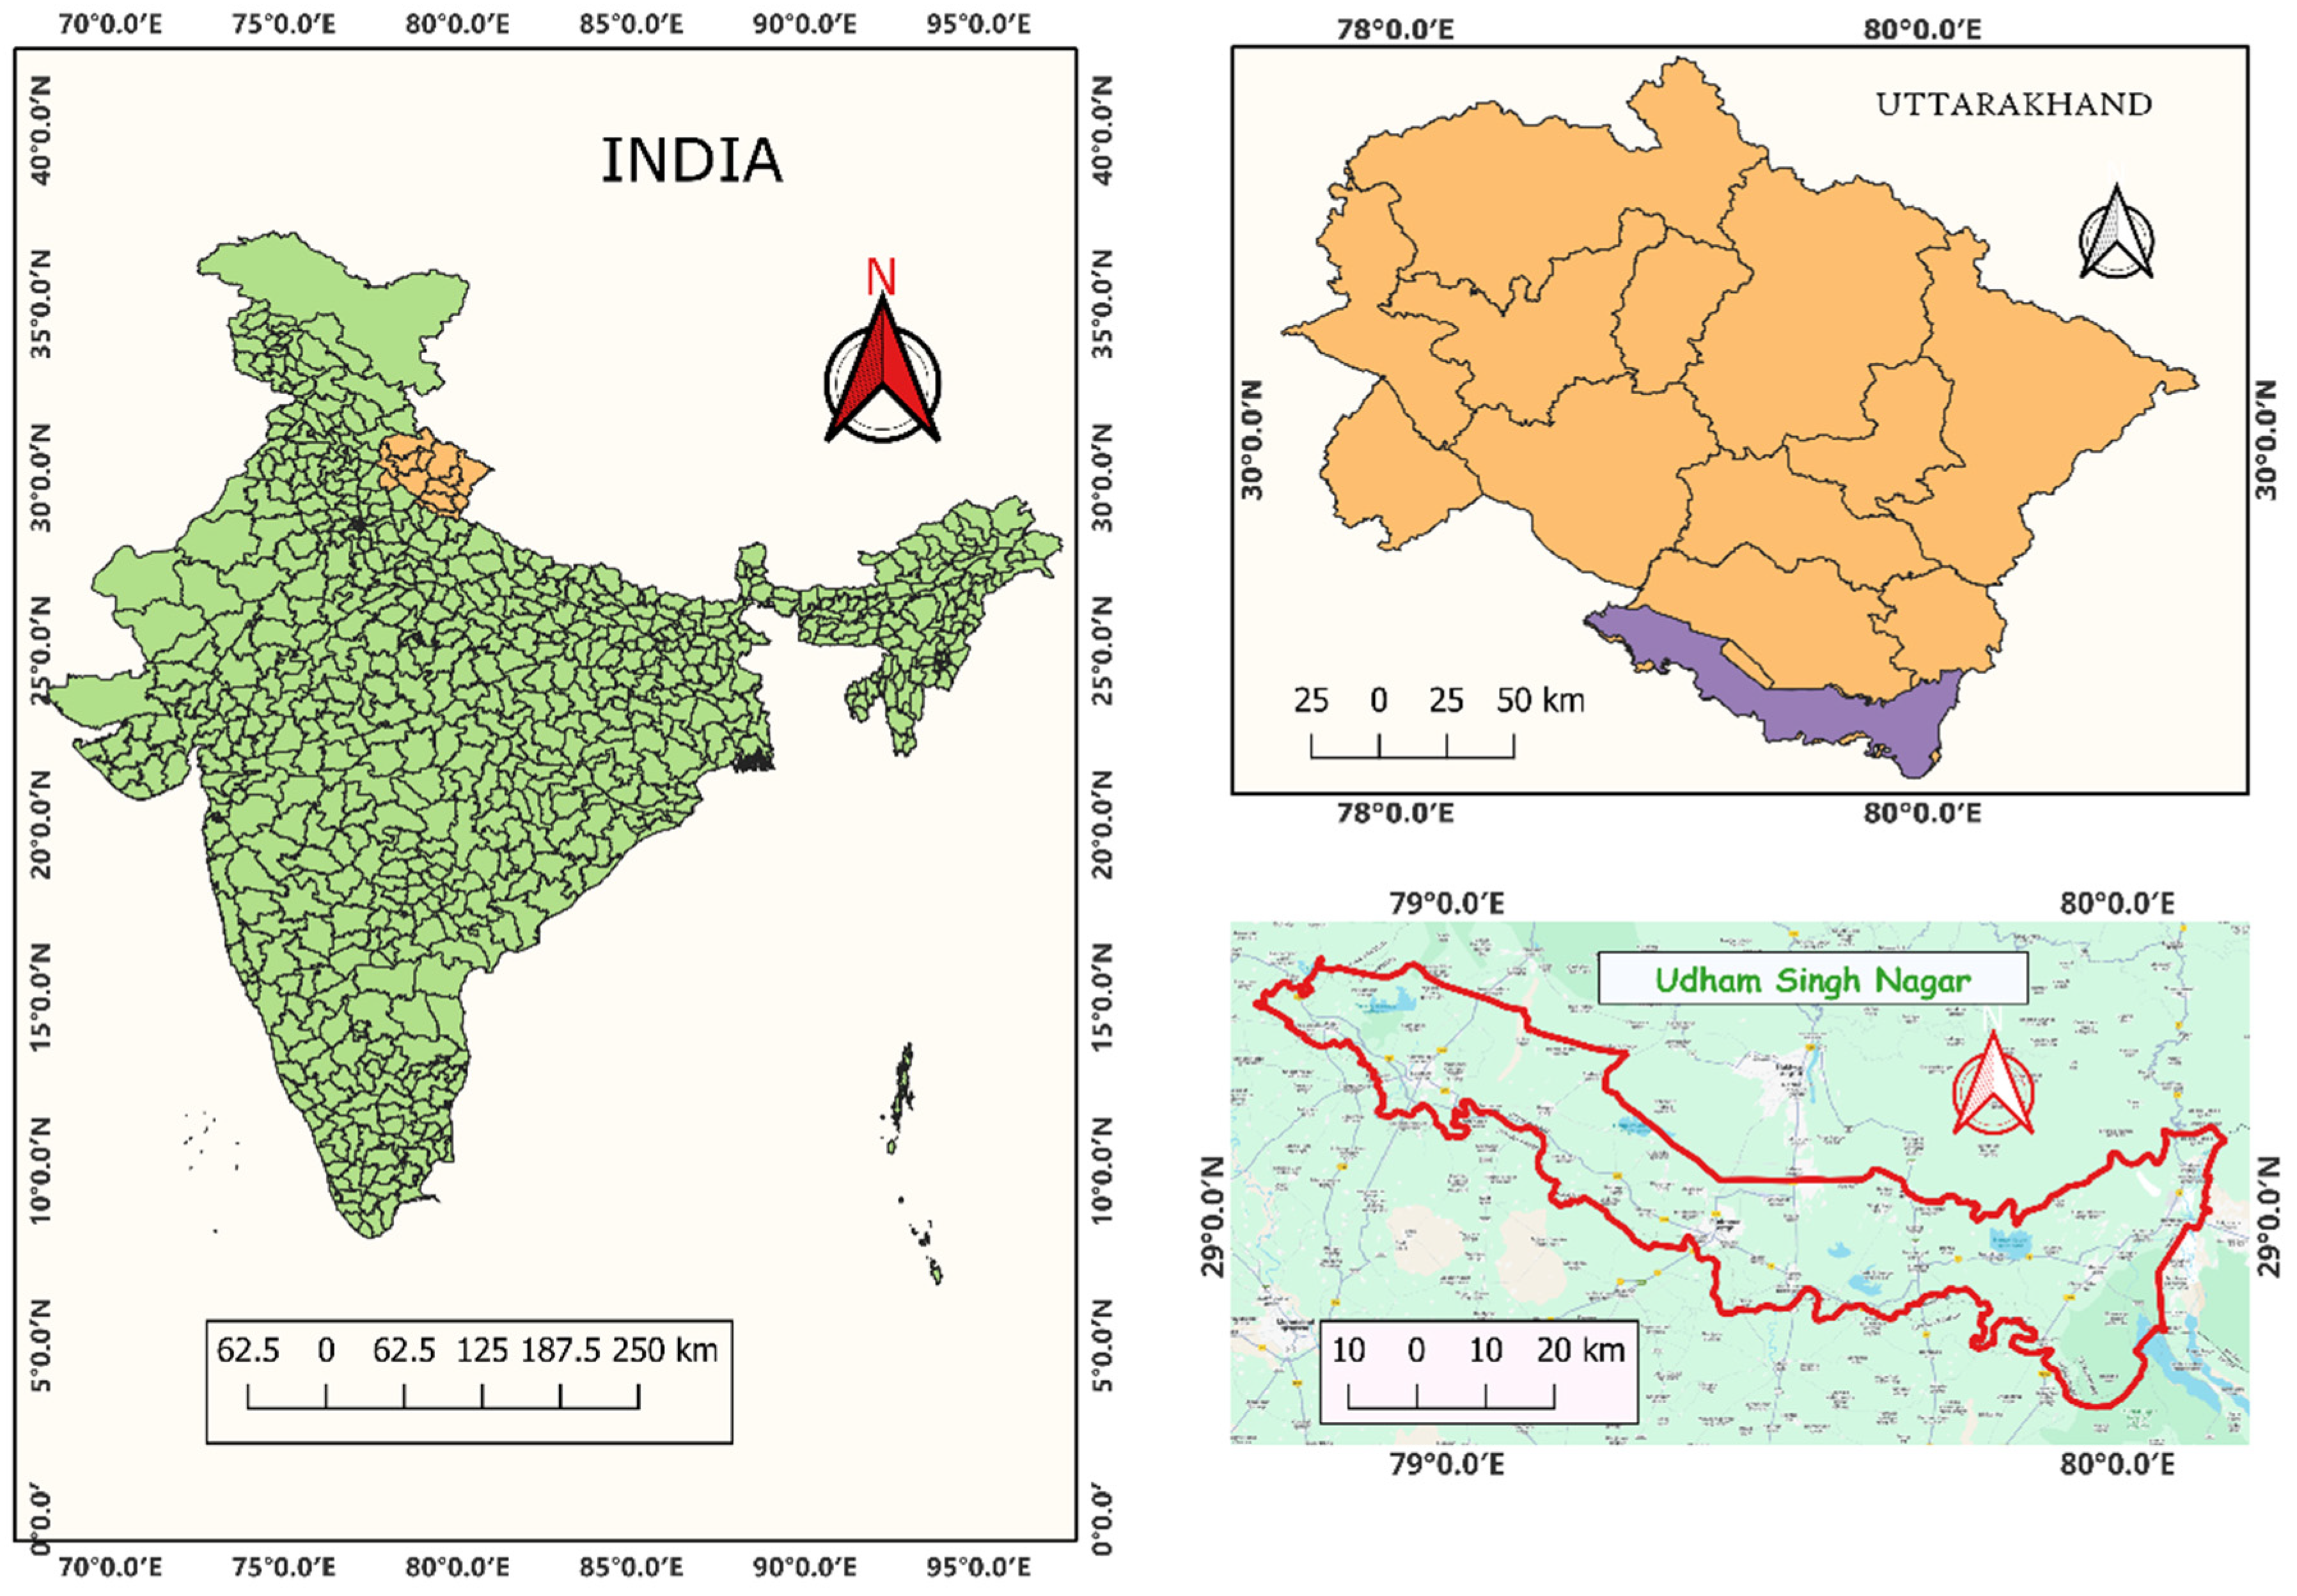
Figure 2.
Scale of rust severity (percent of leaf area infected) [58].
Figure 2.
Scale of rust severity (percent of leaf area infected) [58].
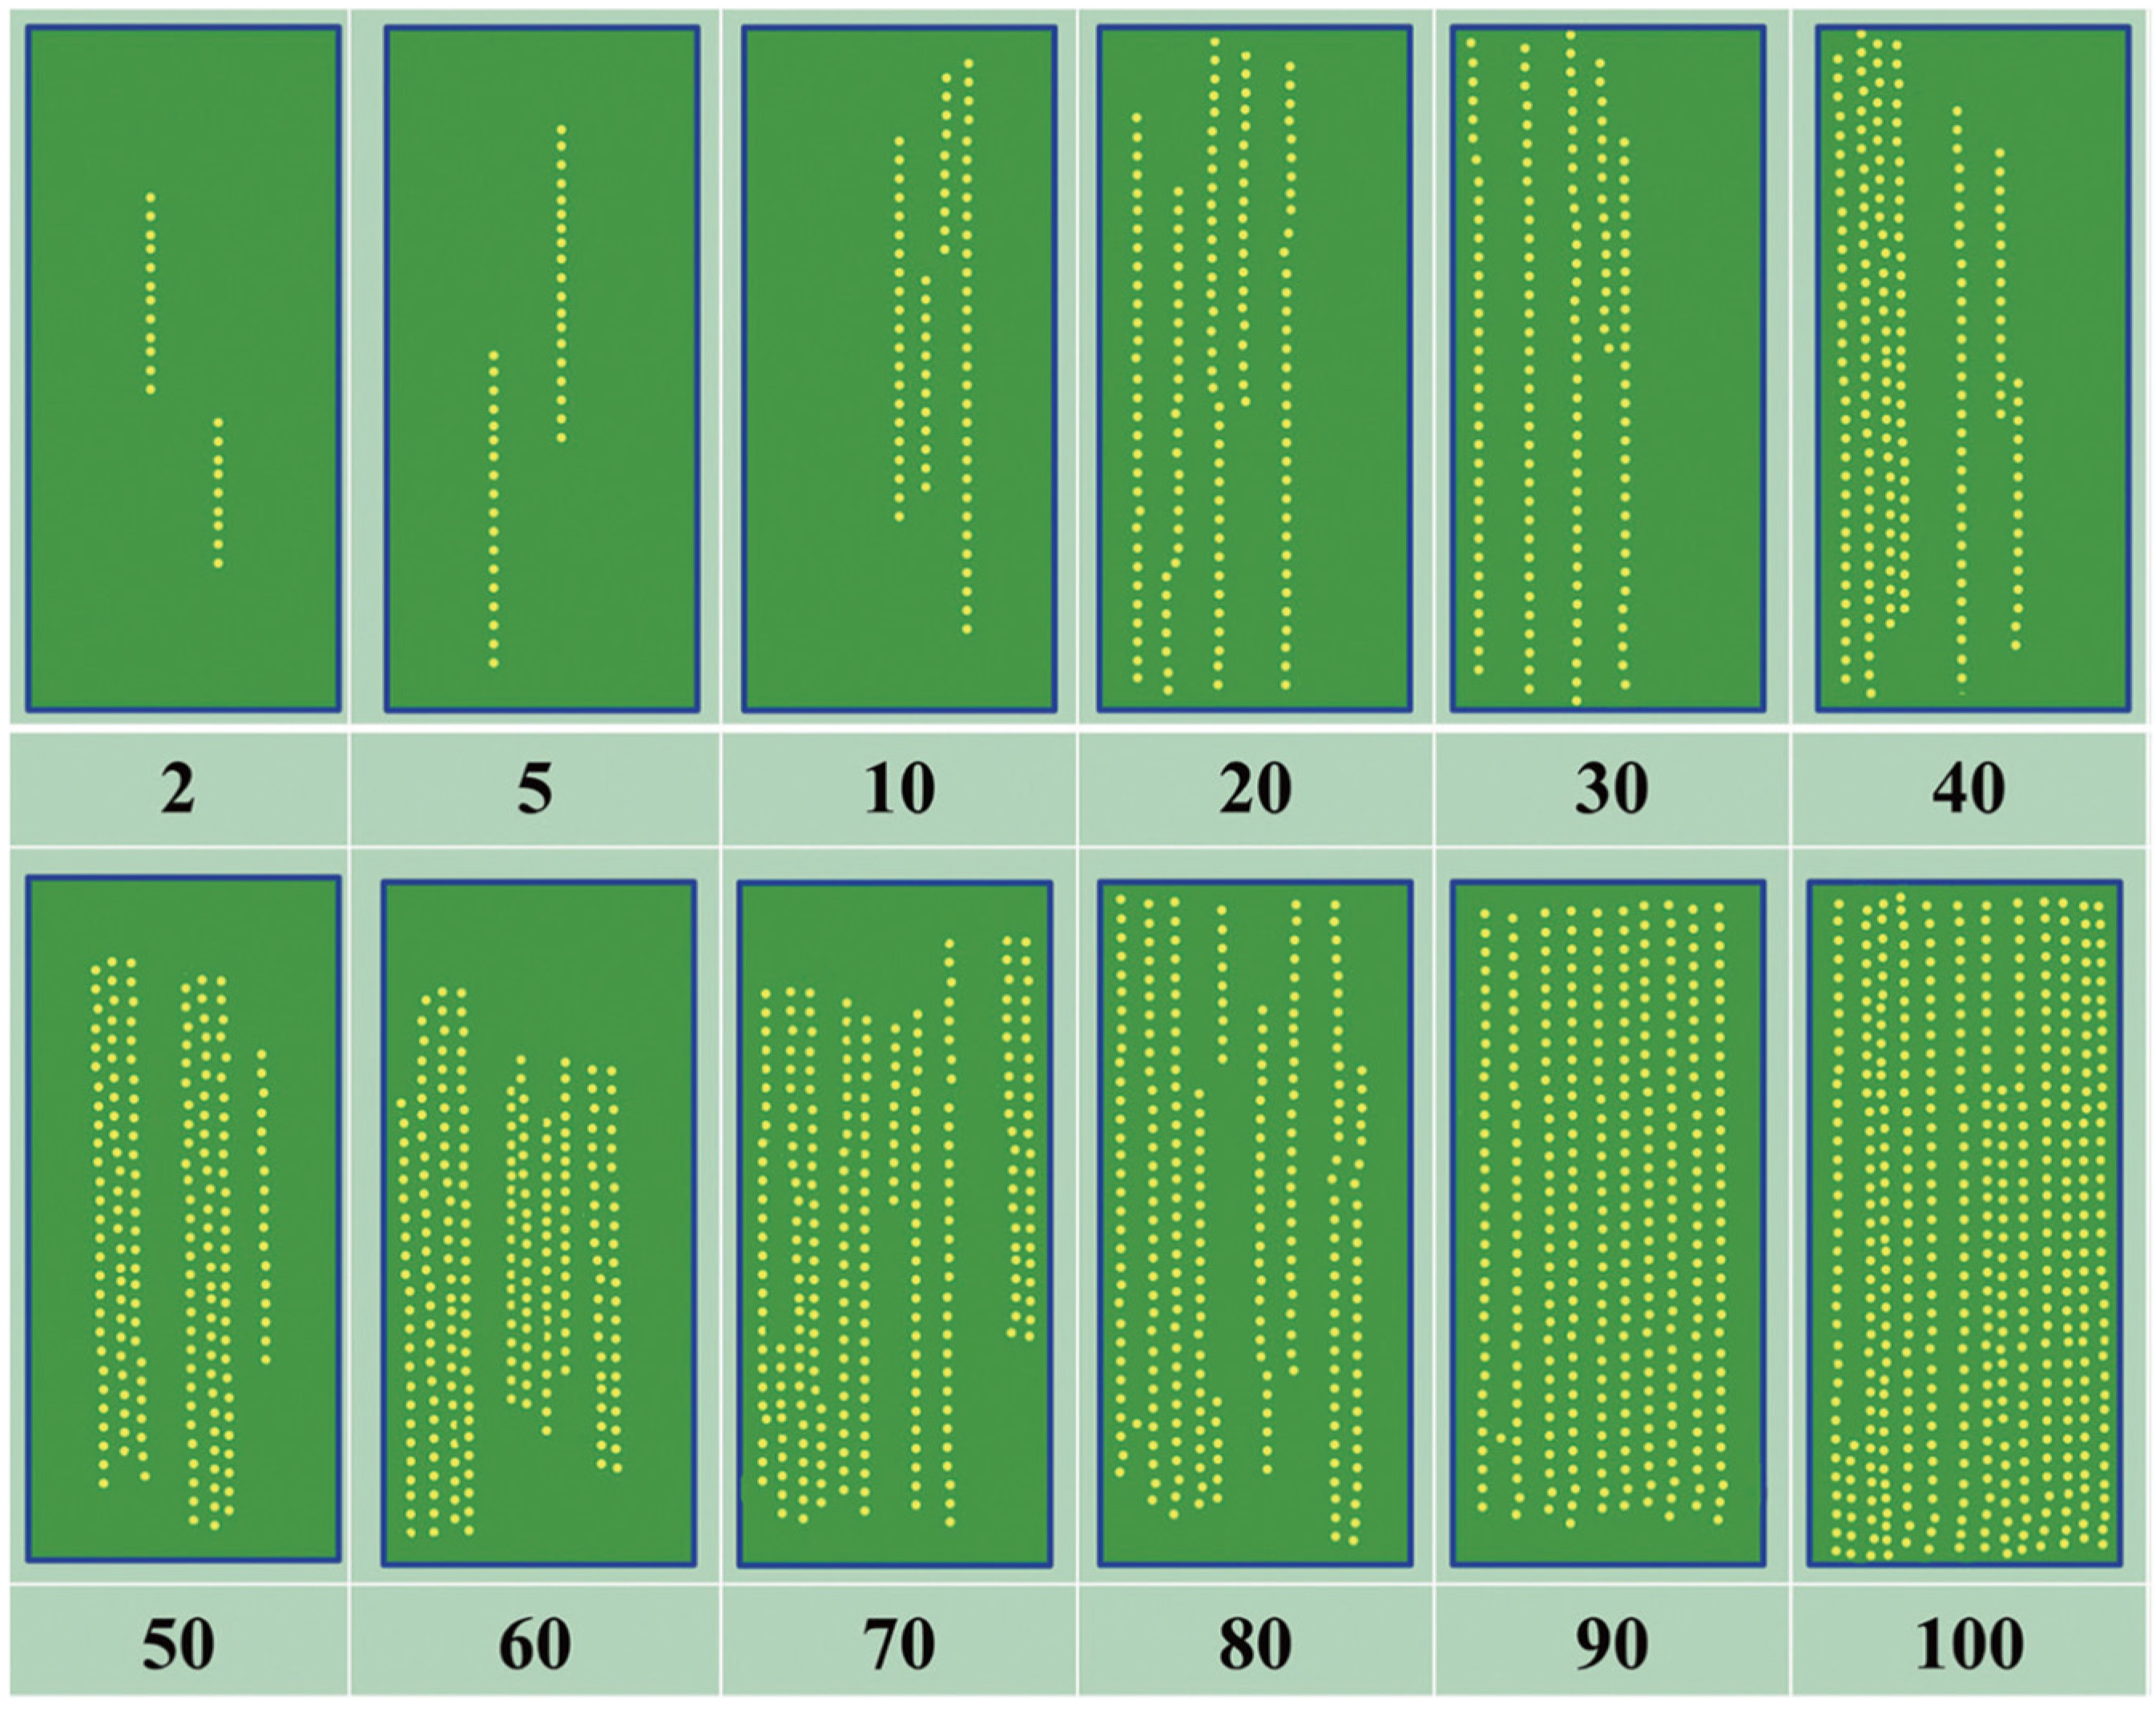
Figure 3.
Flow Chart for yellow rust and powdery mildew disease severity prediction in wheat.
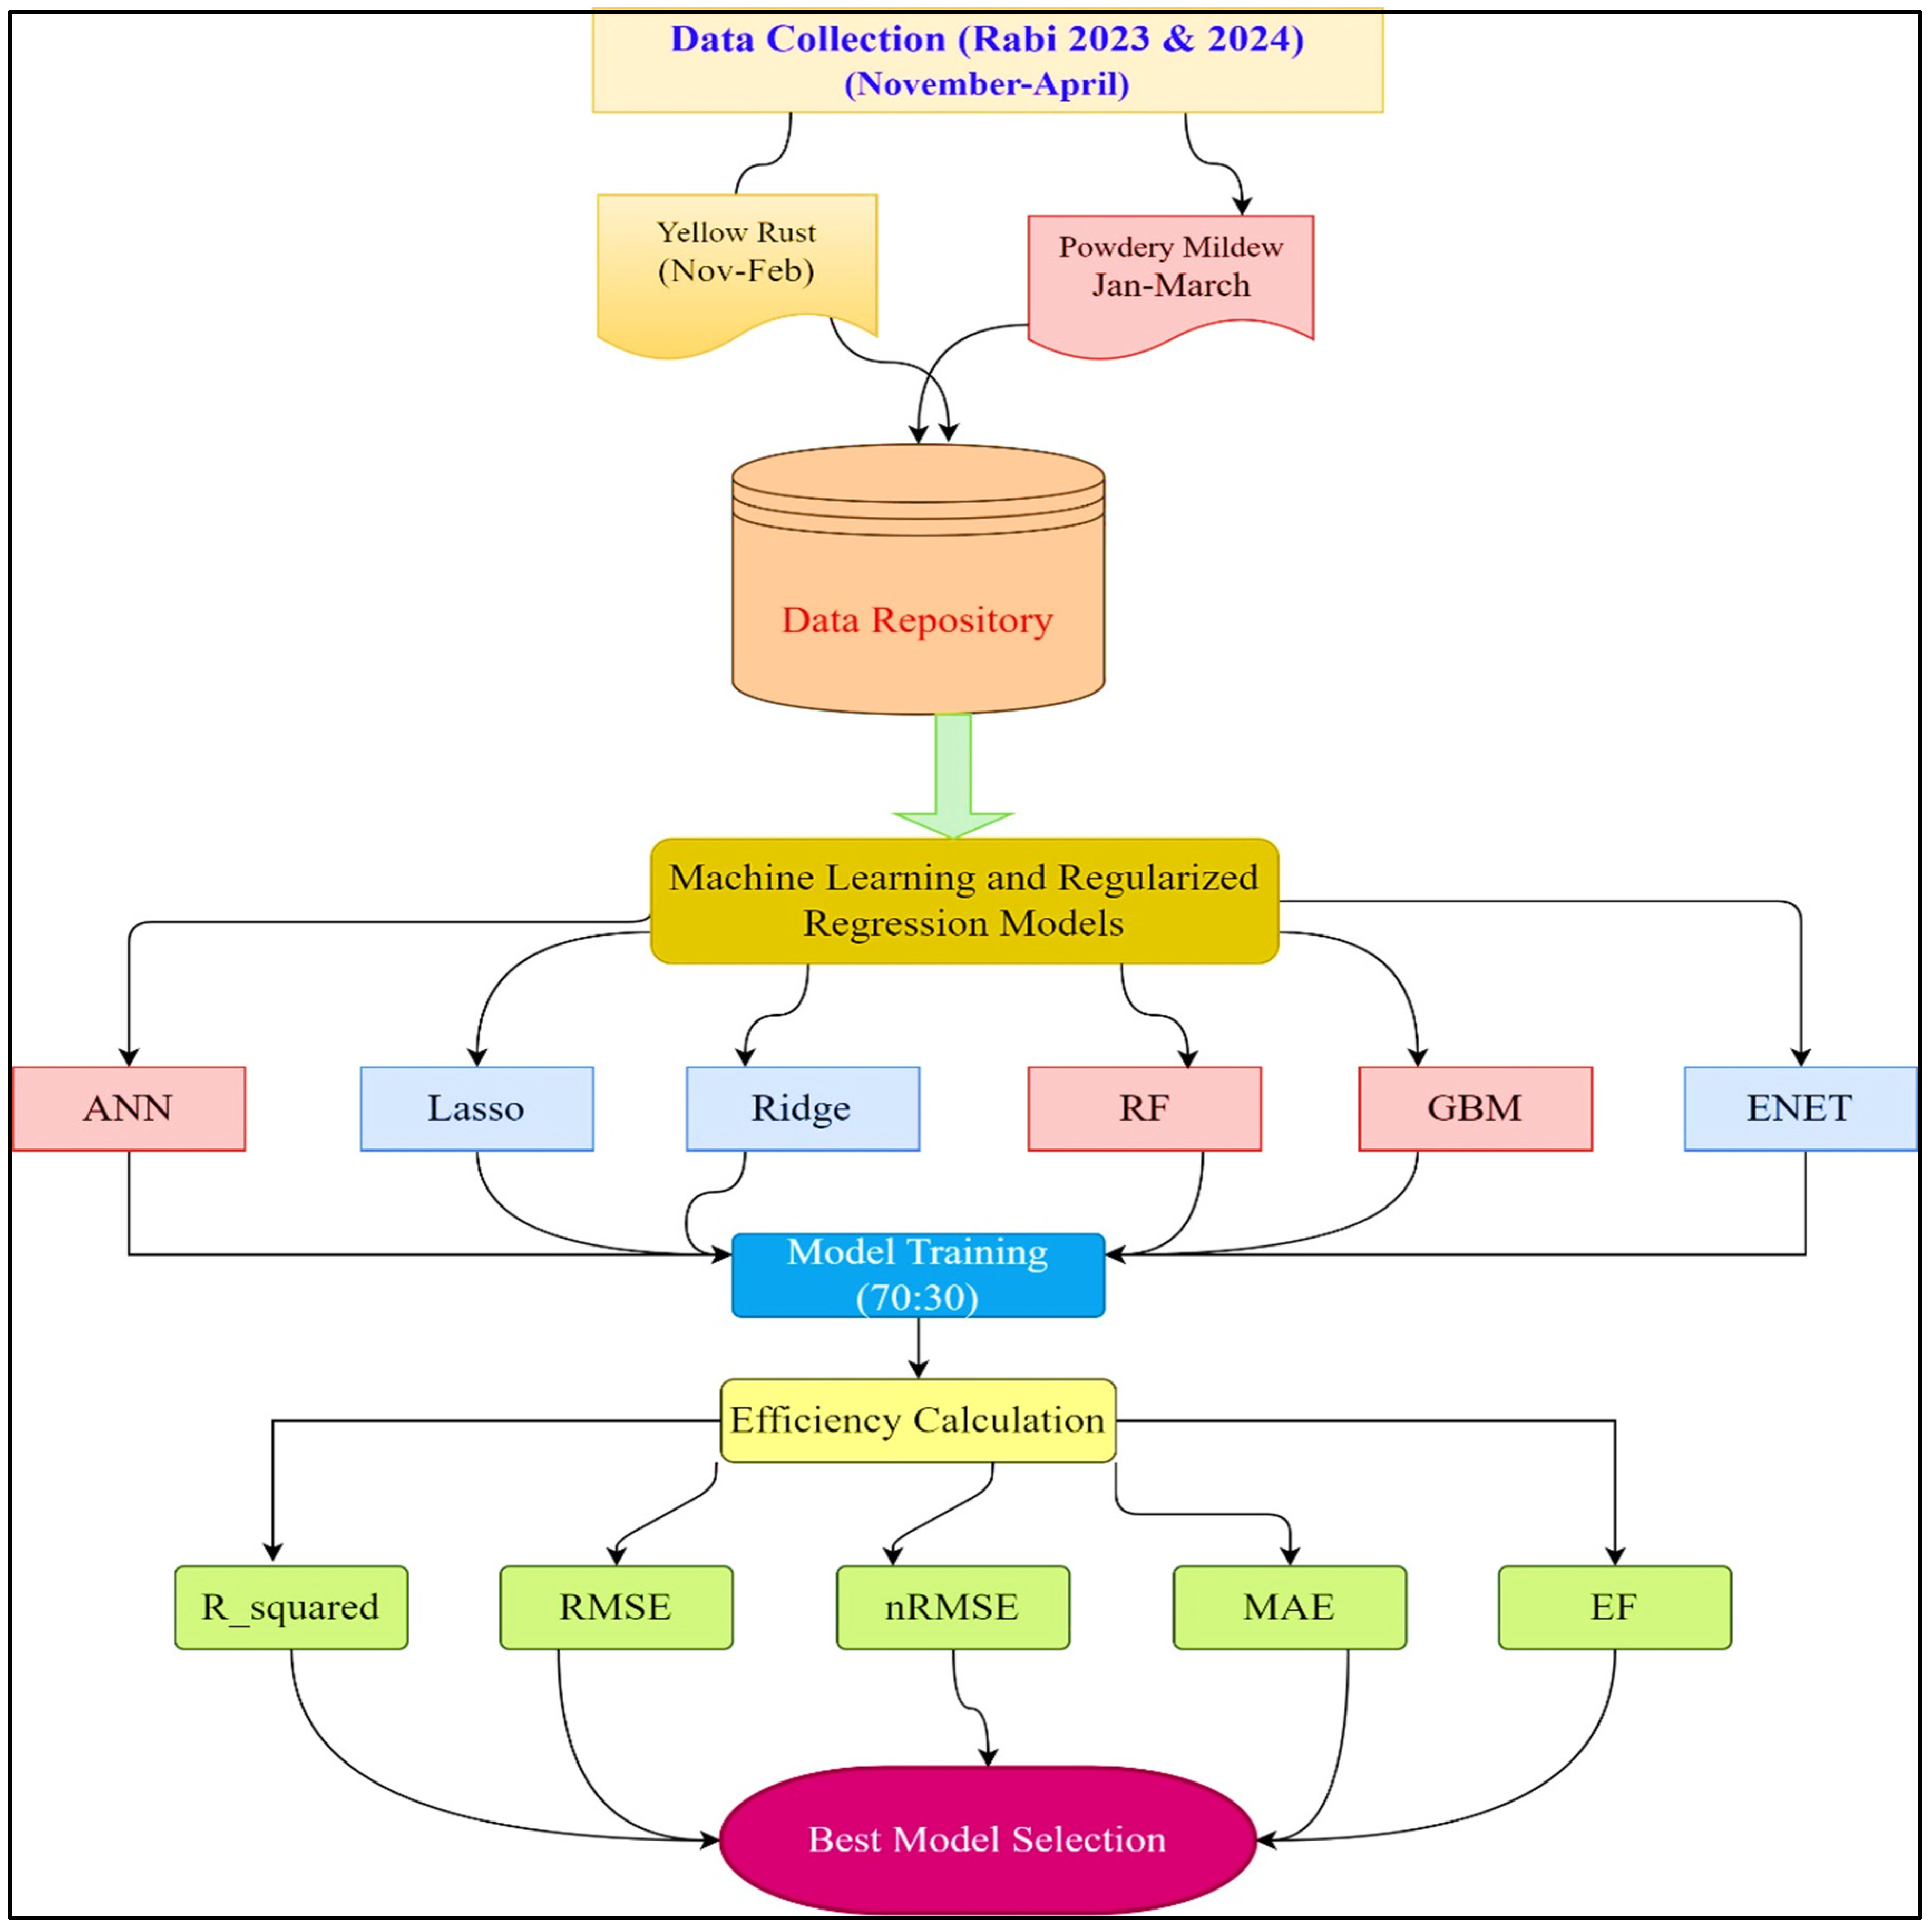
Figure 4.
Variable importance unit for different models for yellow rust severity assessment.
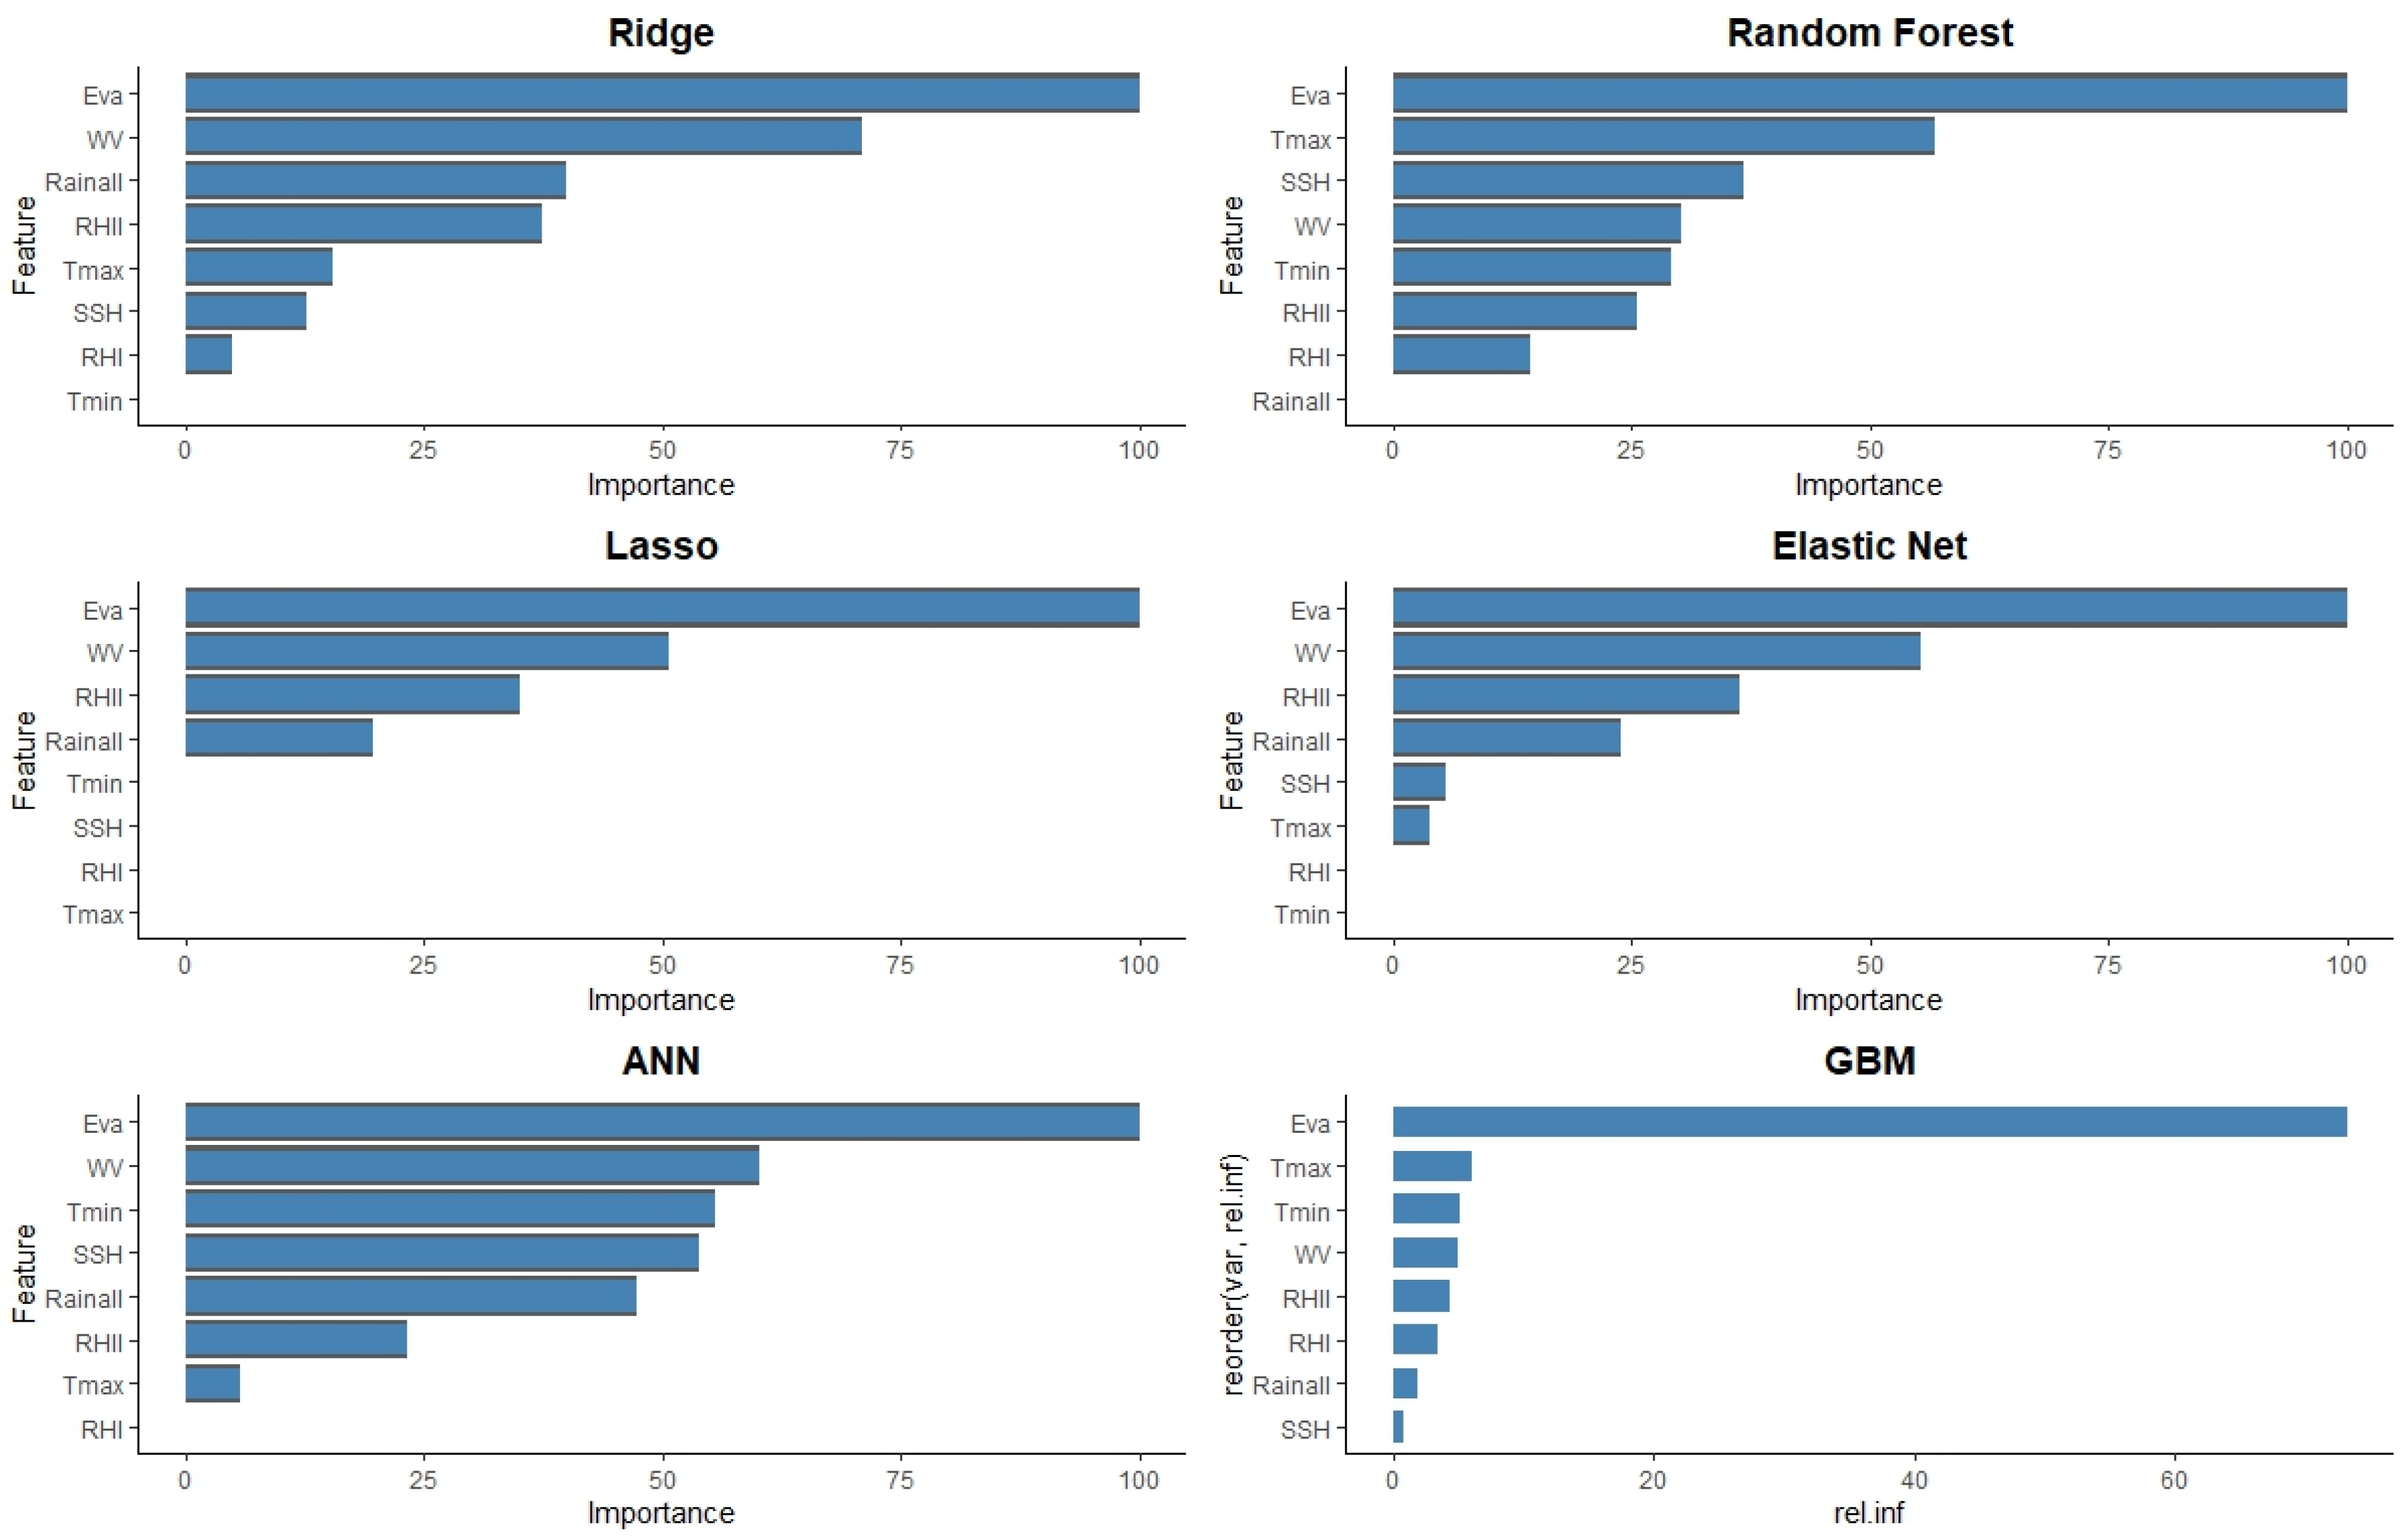
Figure 5.
Variable importance unit for different models for Powdery Mildew severity assessment.
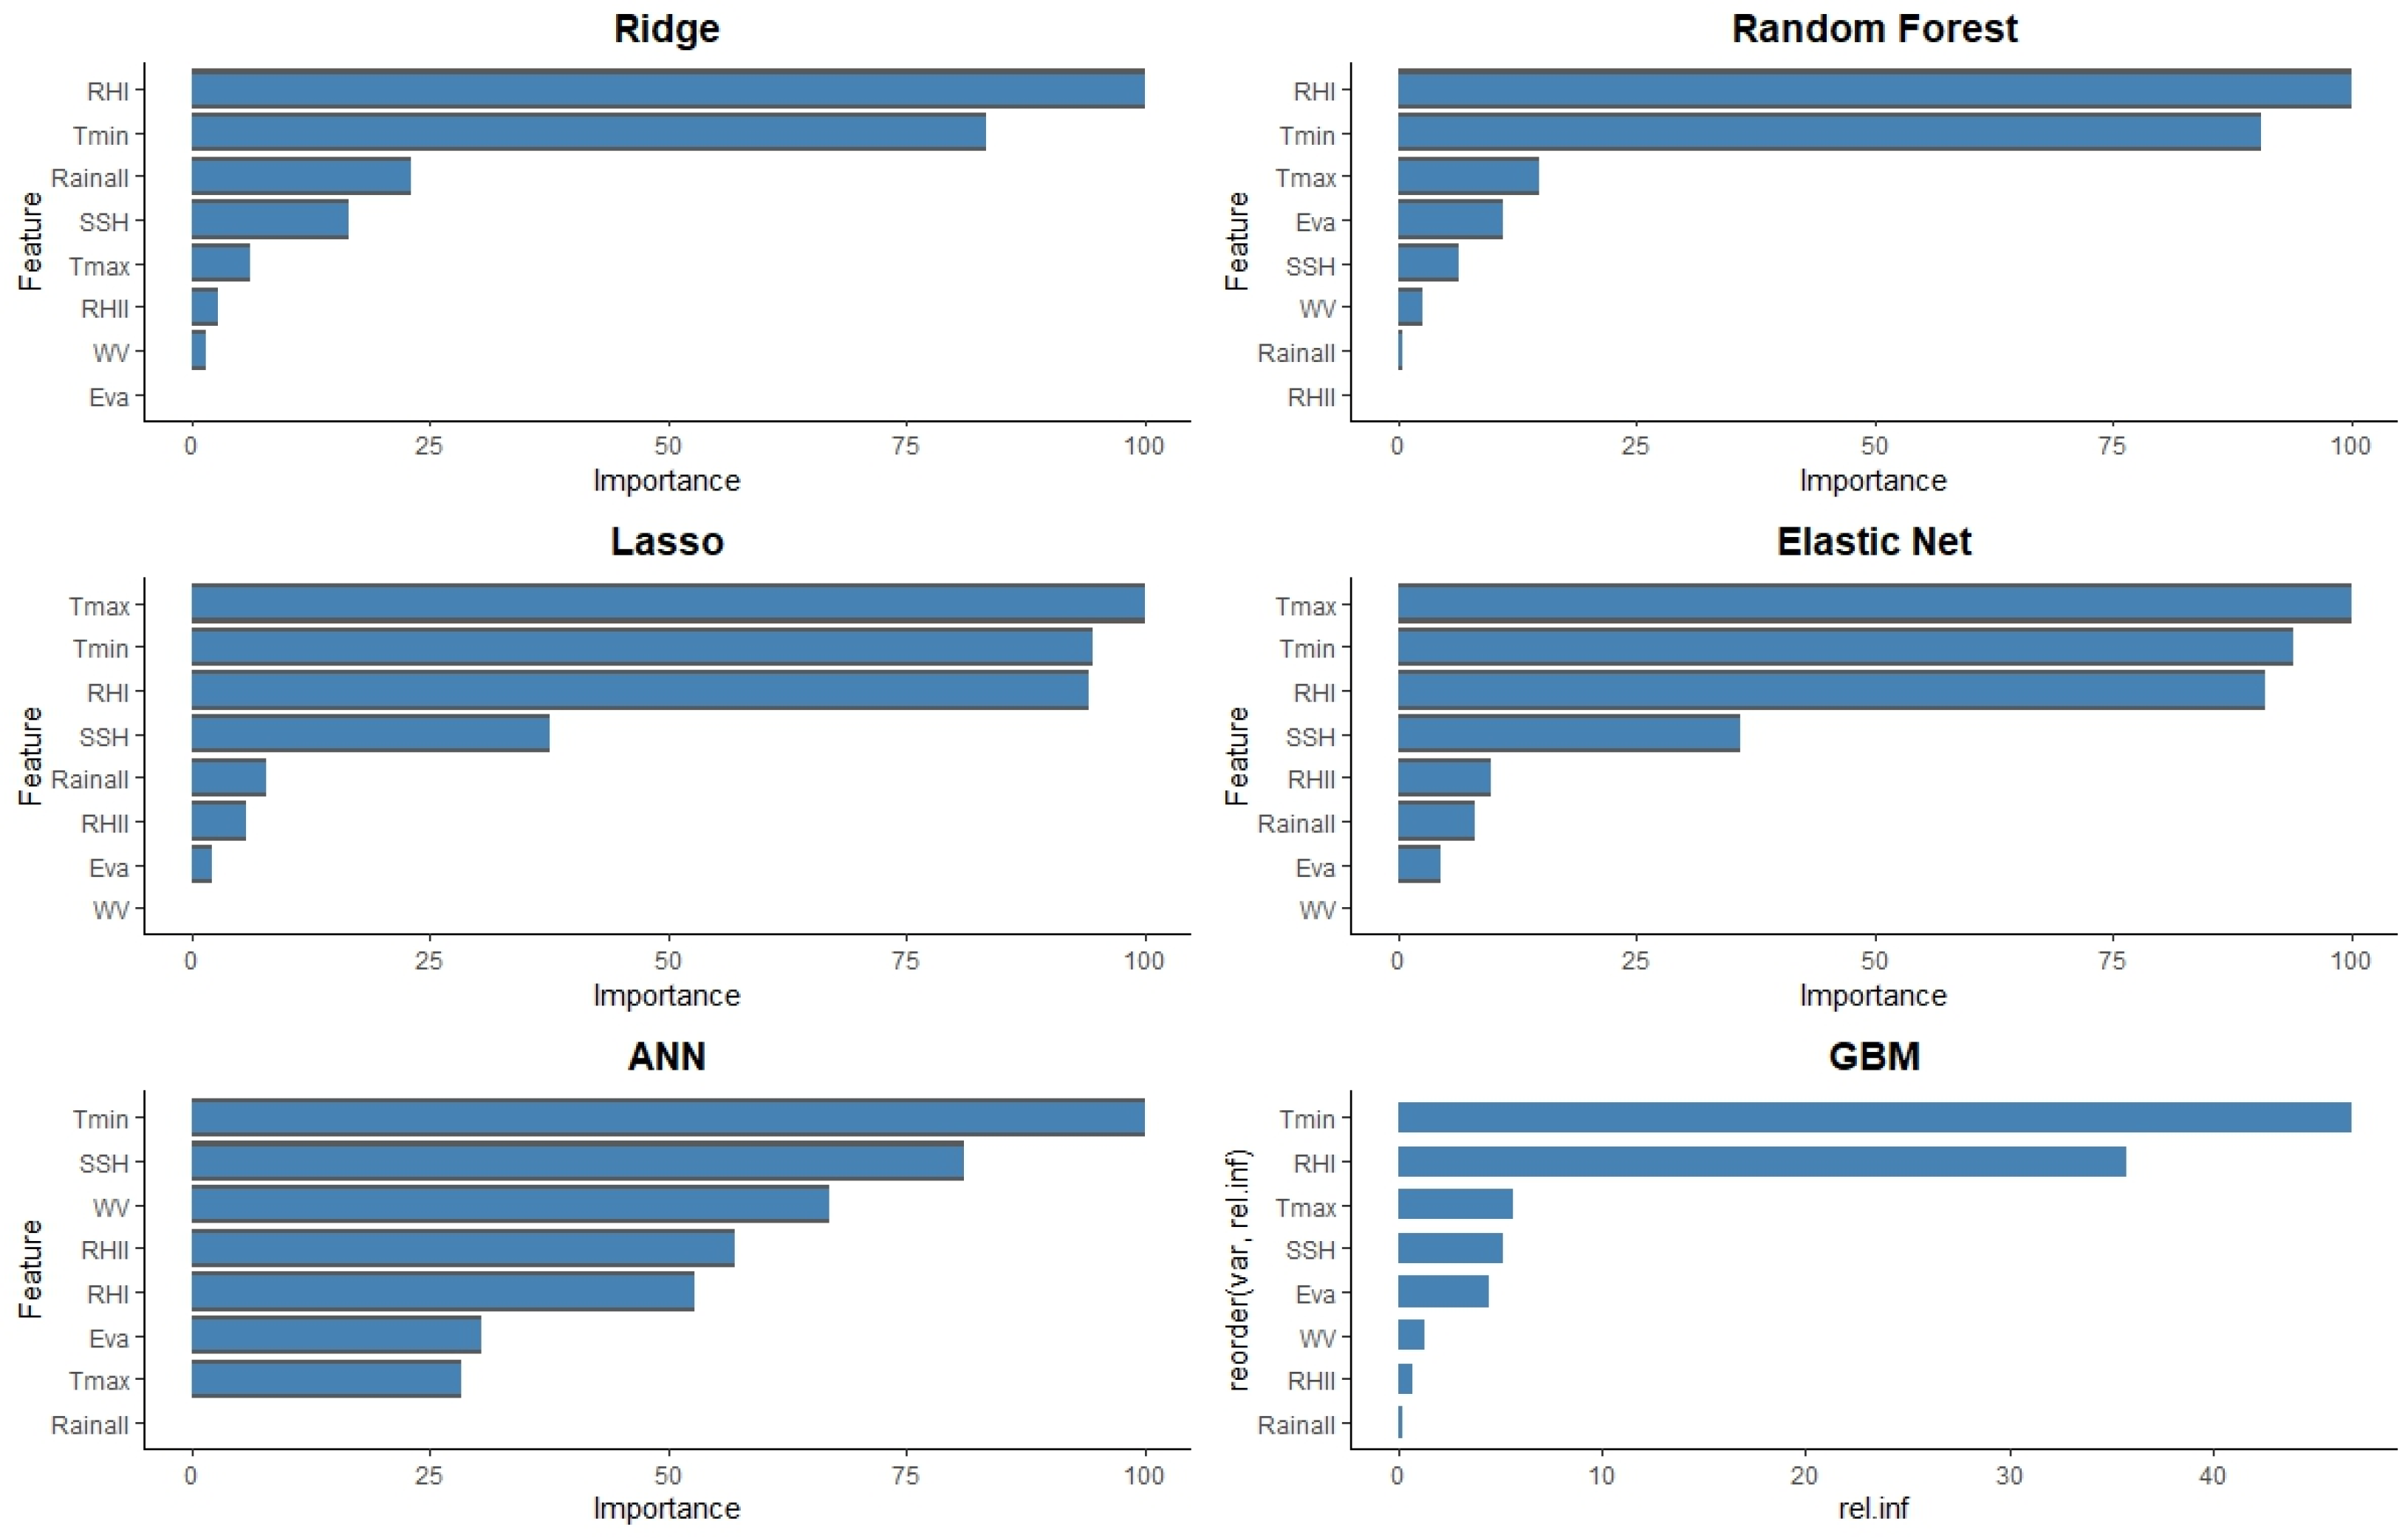
Figure 6.
Density distributions of predicted values for two different diseases affecting wheat yellow rust and powdery mildew disease.
Figure 6.
Density distributions of predicted values for two different diseases affecting wheat yellow rust and powdery mildew disease.
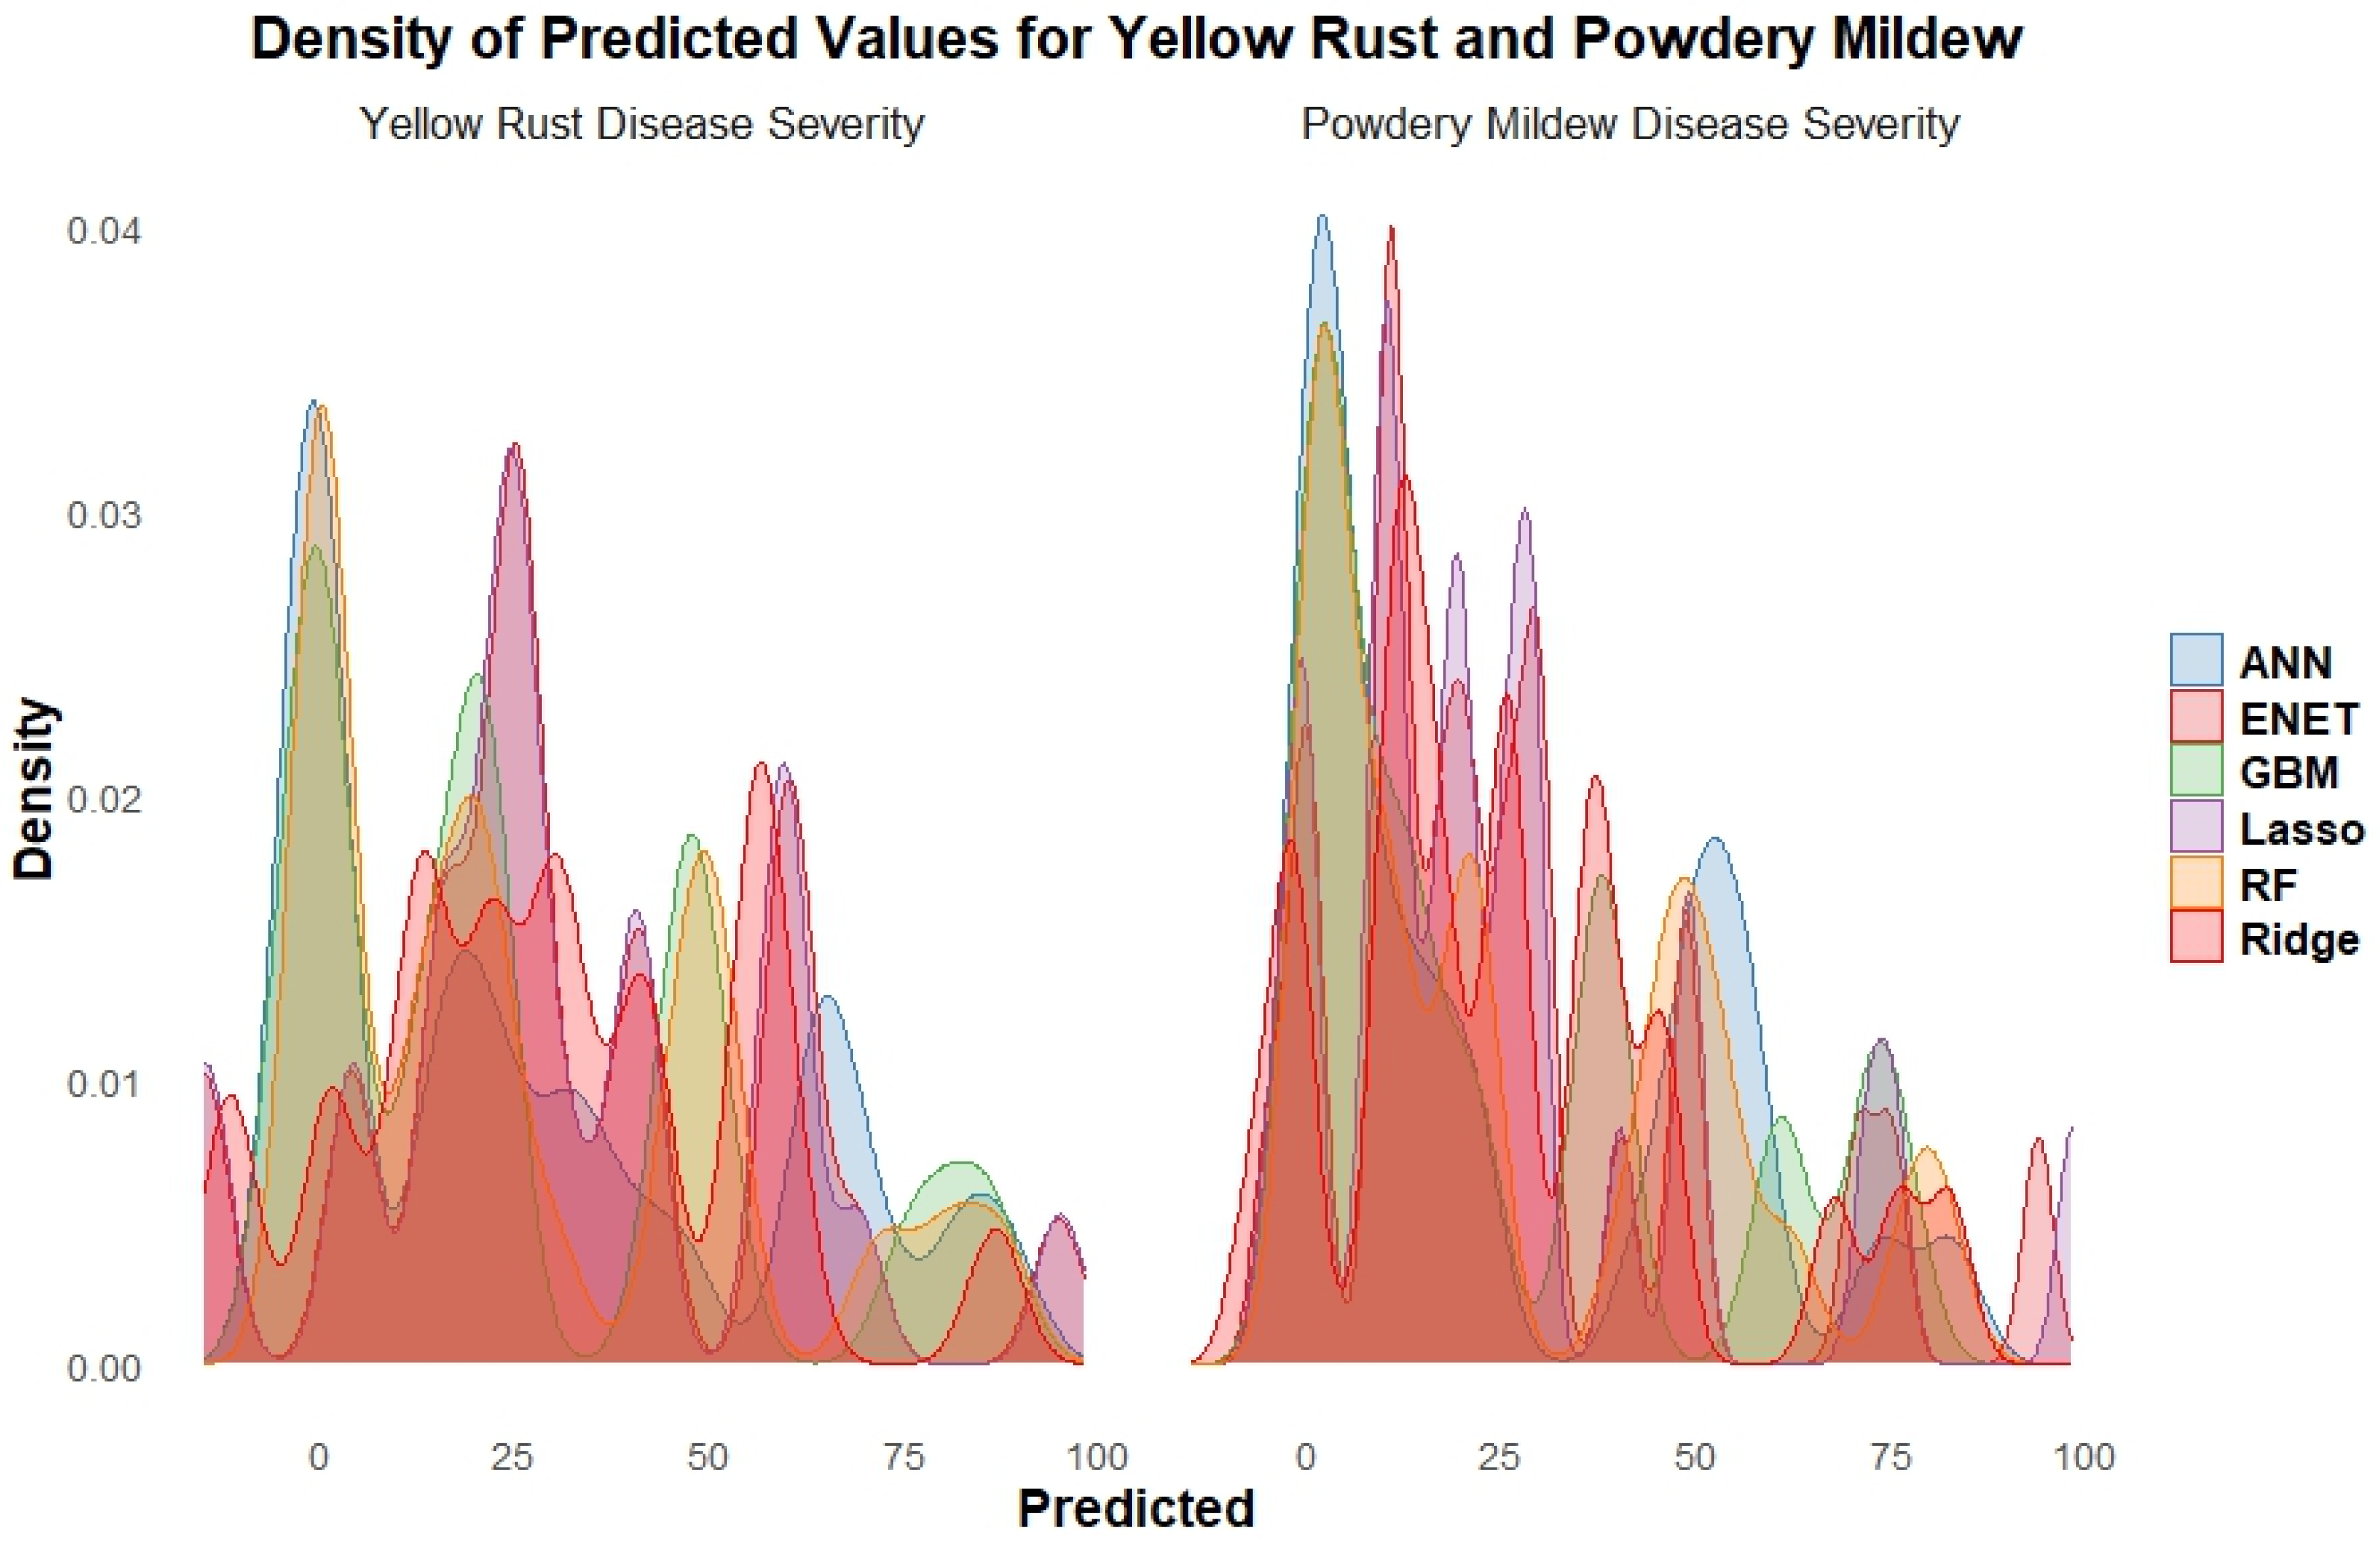
Figure 7.
Comparison between the observed and predicted values for the severity of two crop diseases: Yellow Rust and Powdery Mildew.
Figure 7.
Comparison between the observed and predicted values for the severity of two crop diseases: Yellow Rust and Powdery Mildew.
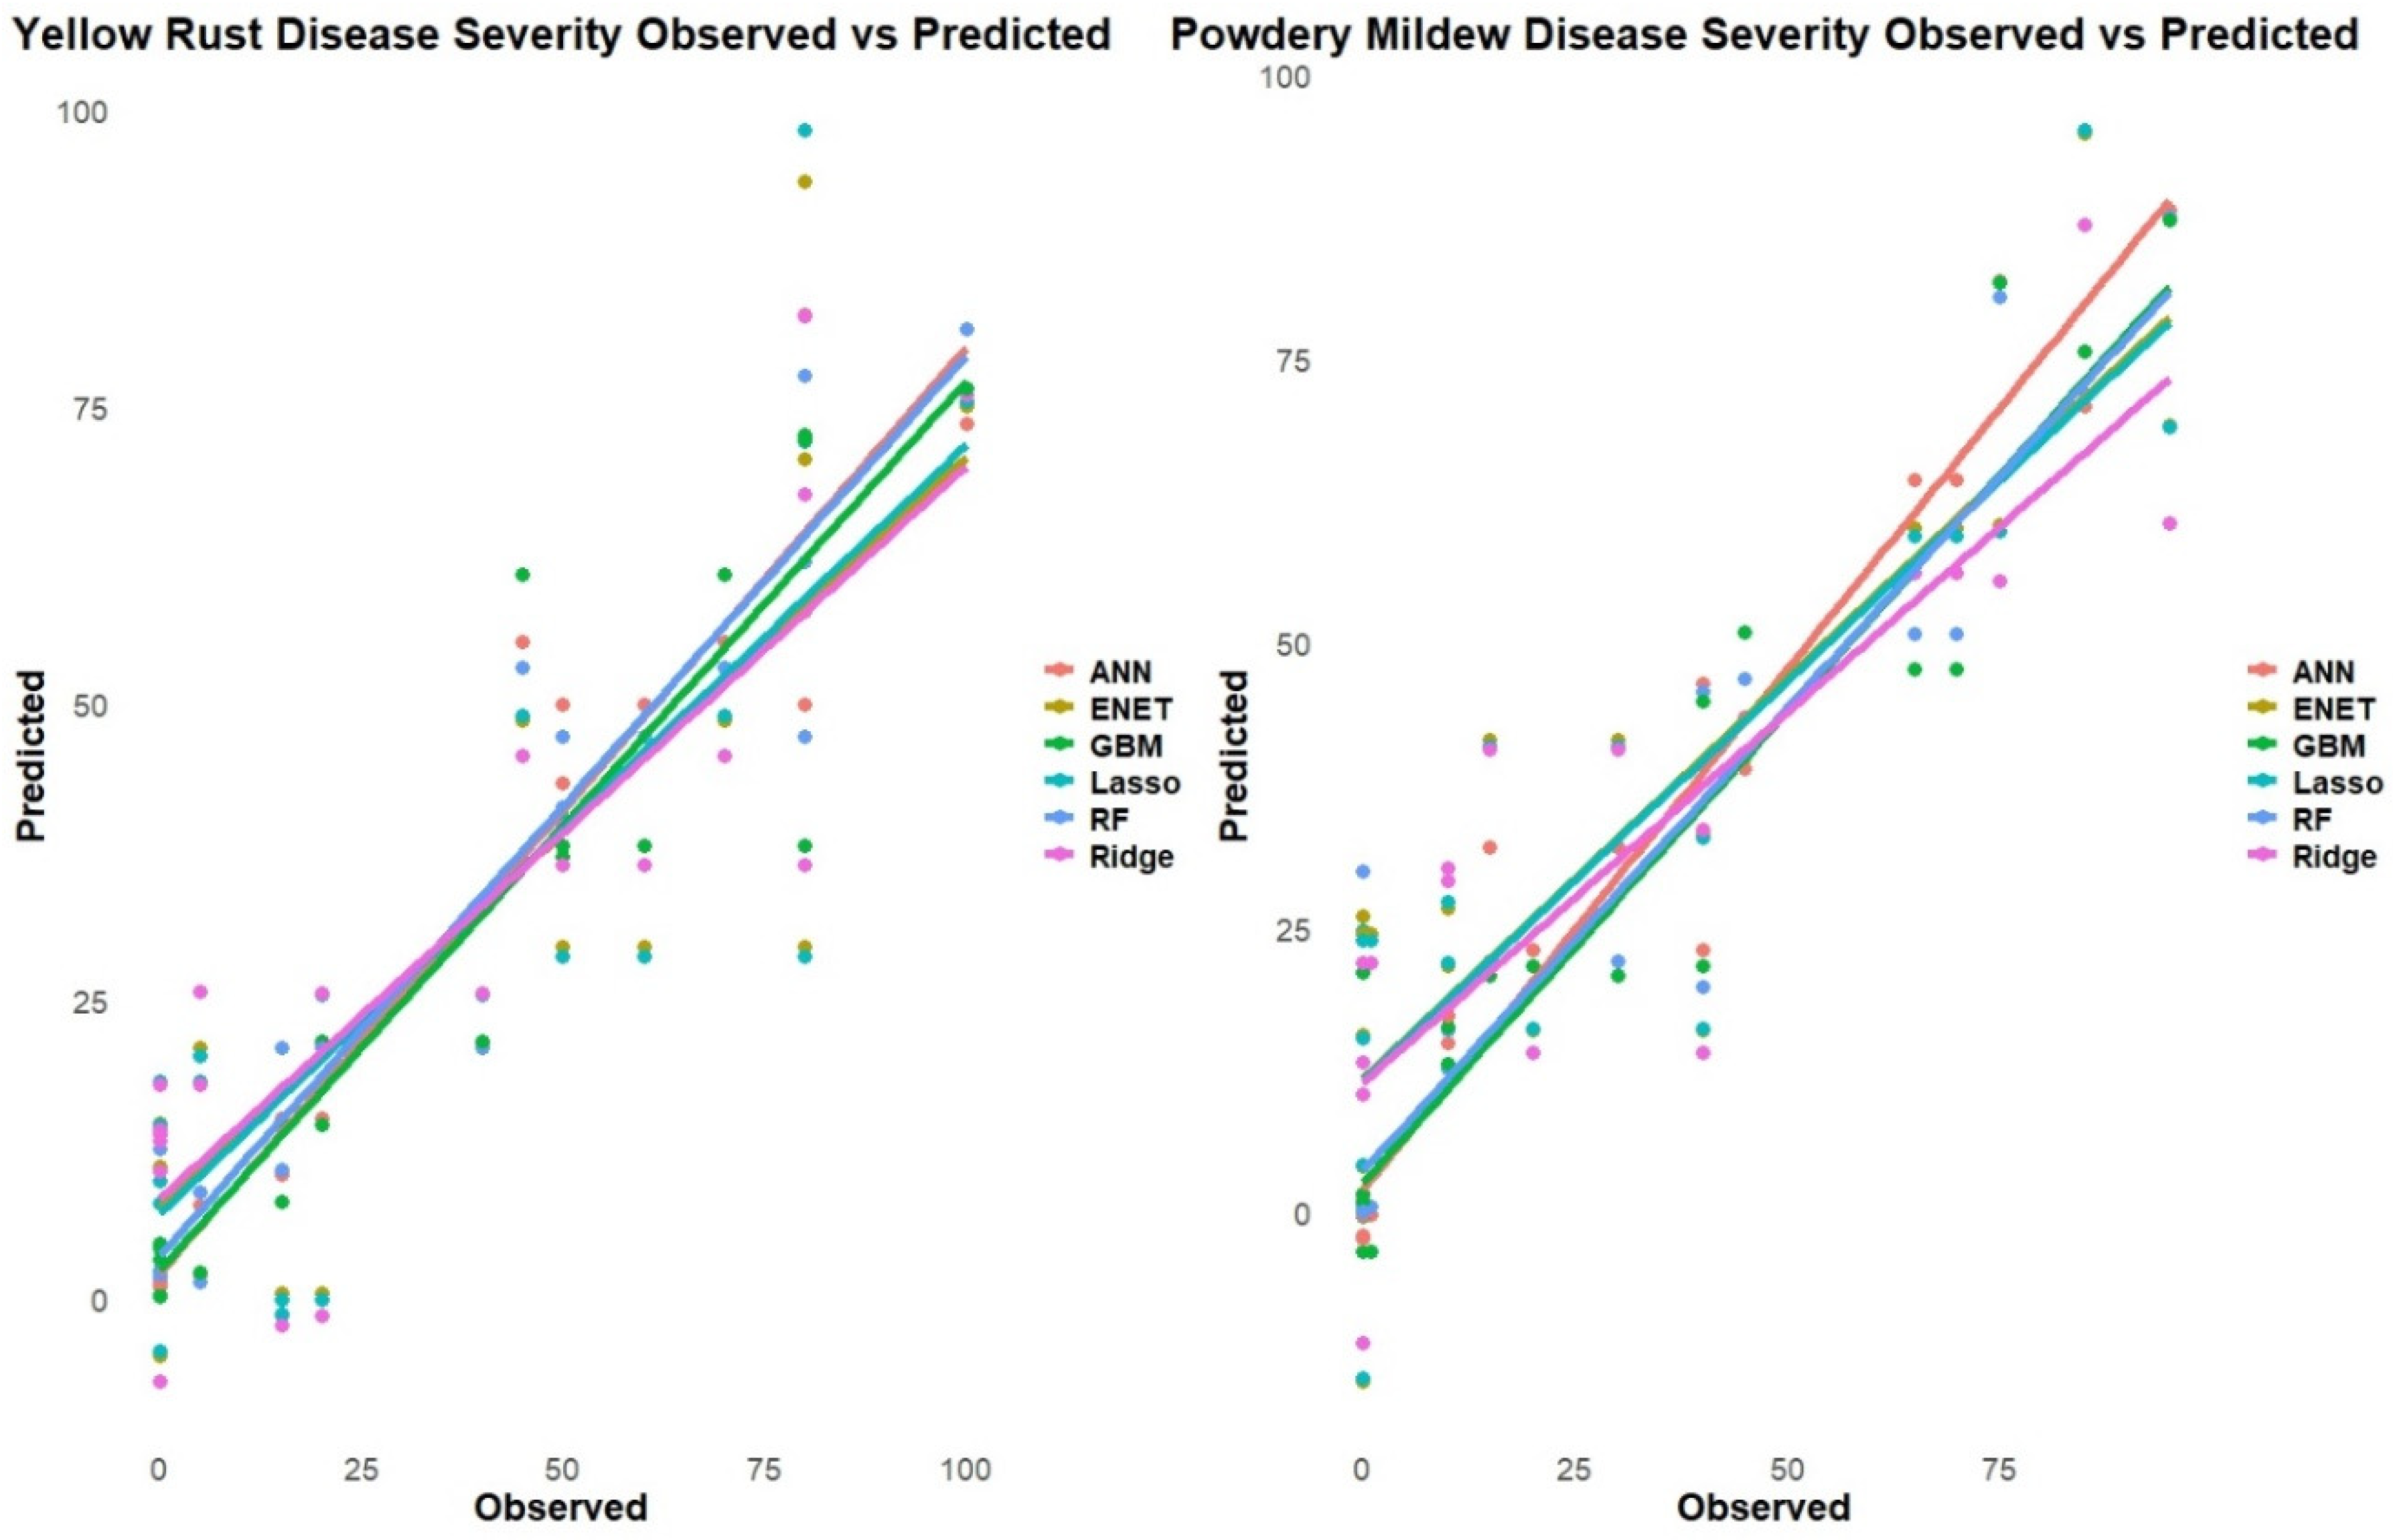
Figure 8.
Taylor diagram for performance of different machine learning models for predicting Yellow Rust and Powdery Mildew in Wheat.
Figure 8.
Taylor diagram for performance of different machine learning models for predicting Yellow Rust and Powdery Mildew in Wheat.
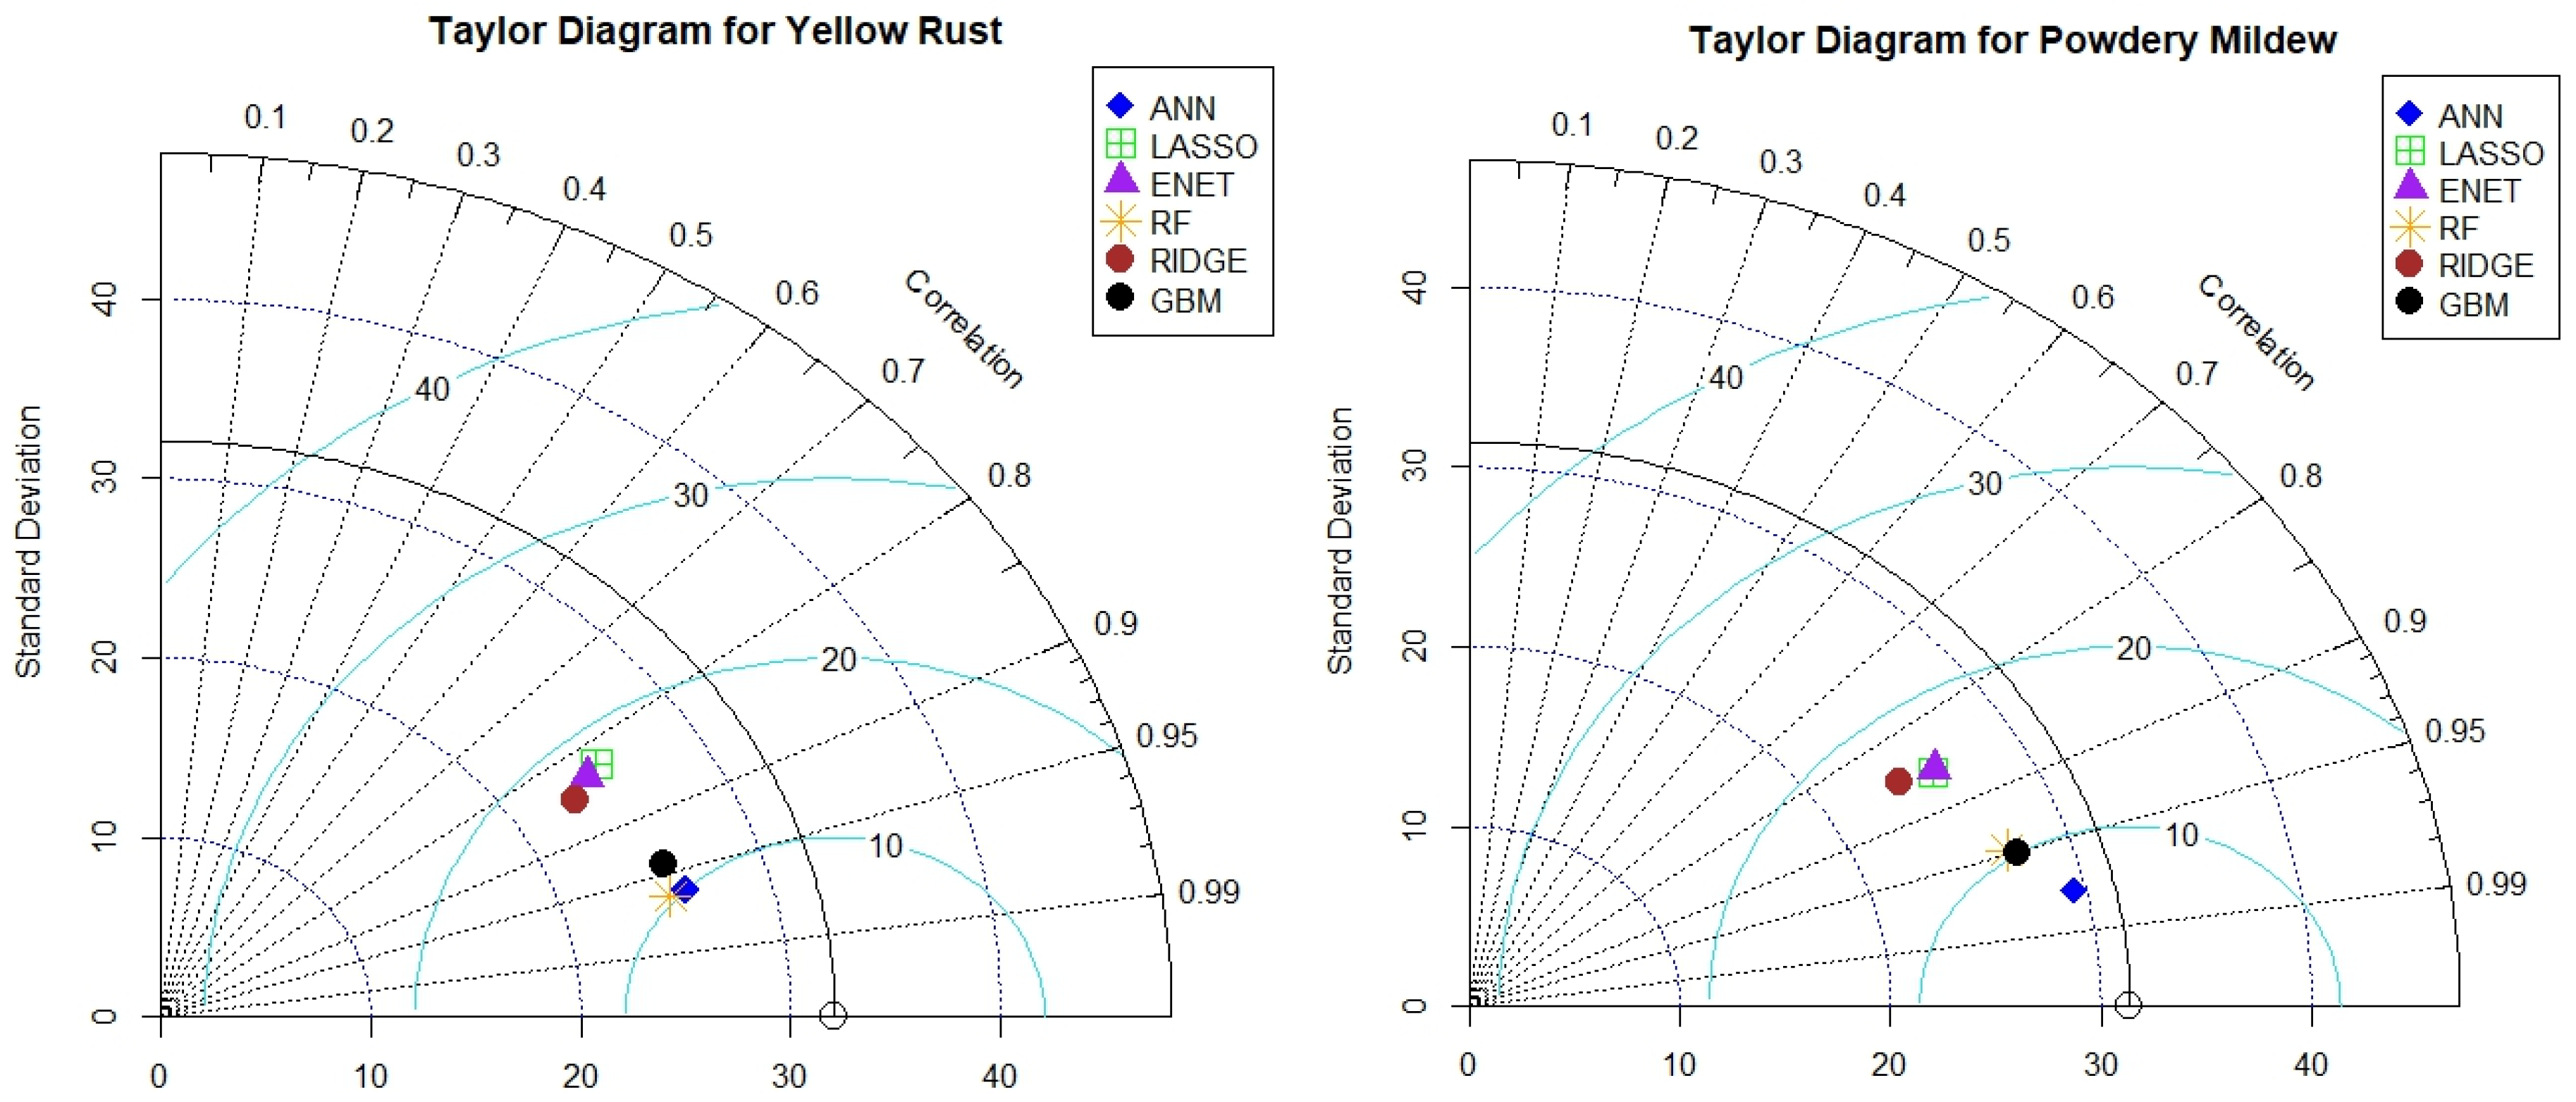
Figure 9.
Scree Plot of Principal Component Analysis for Yellow Rust.
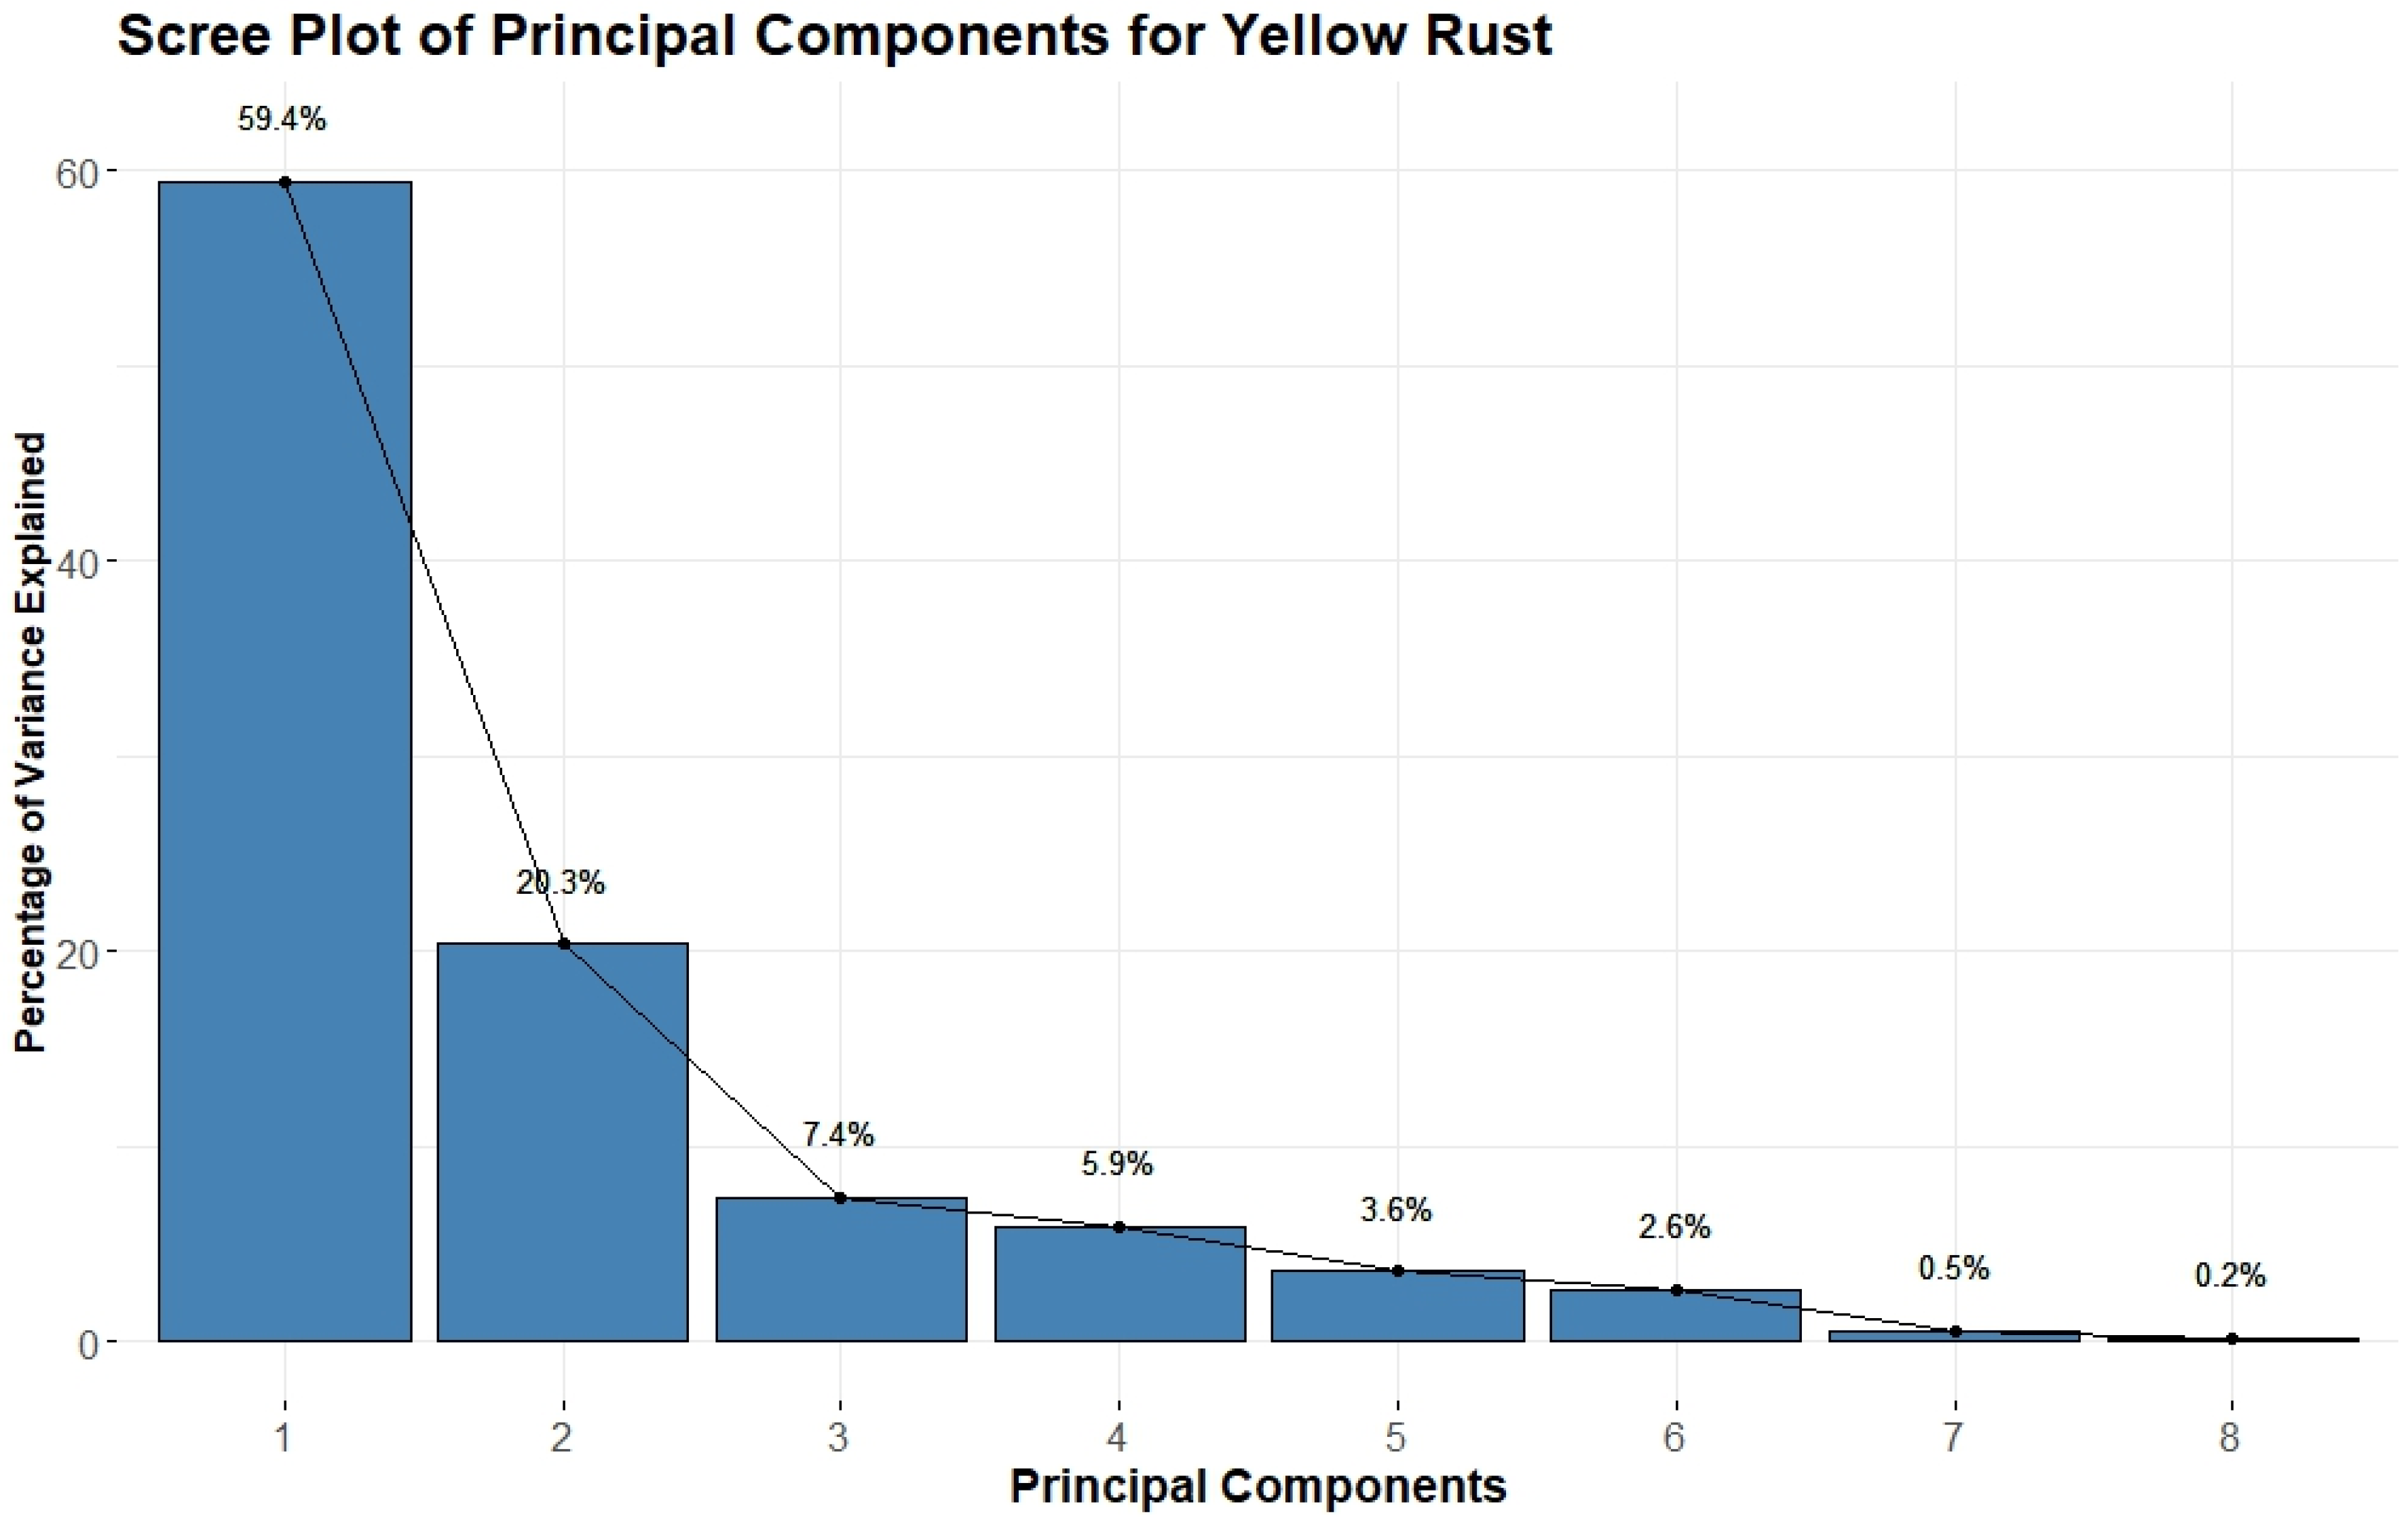
Figure 10.
Scree Plot of Principal Component Analysis for Powdery Mildew.
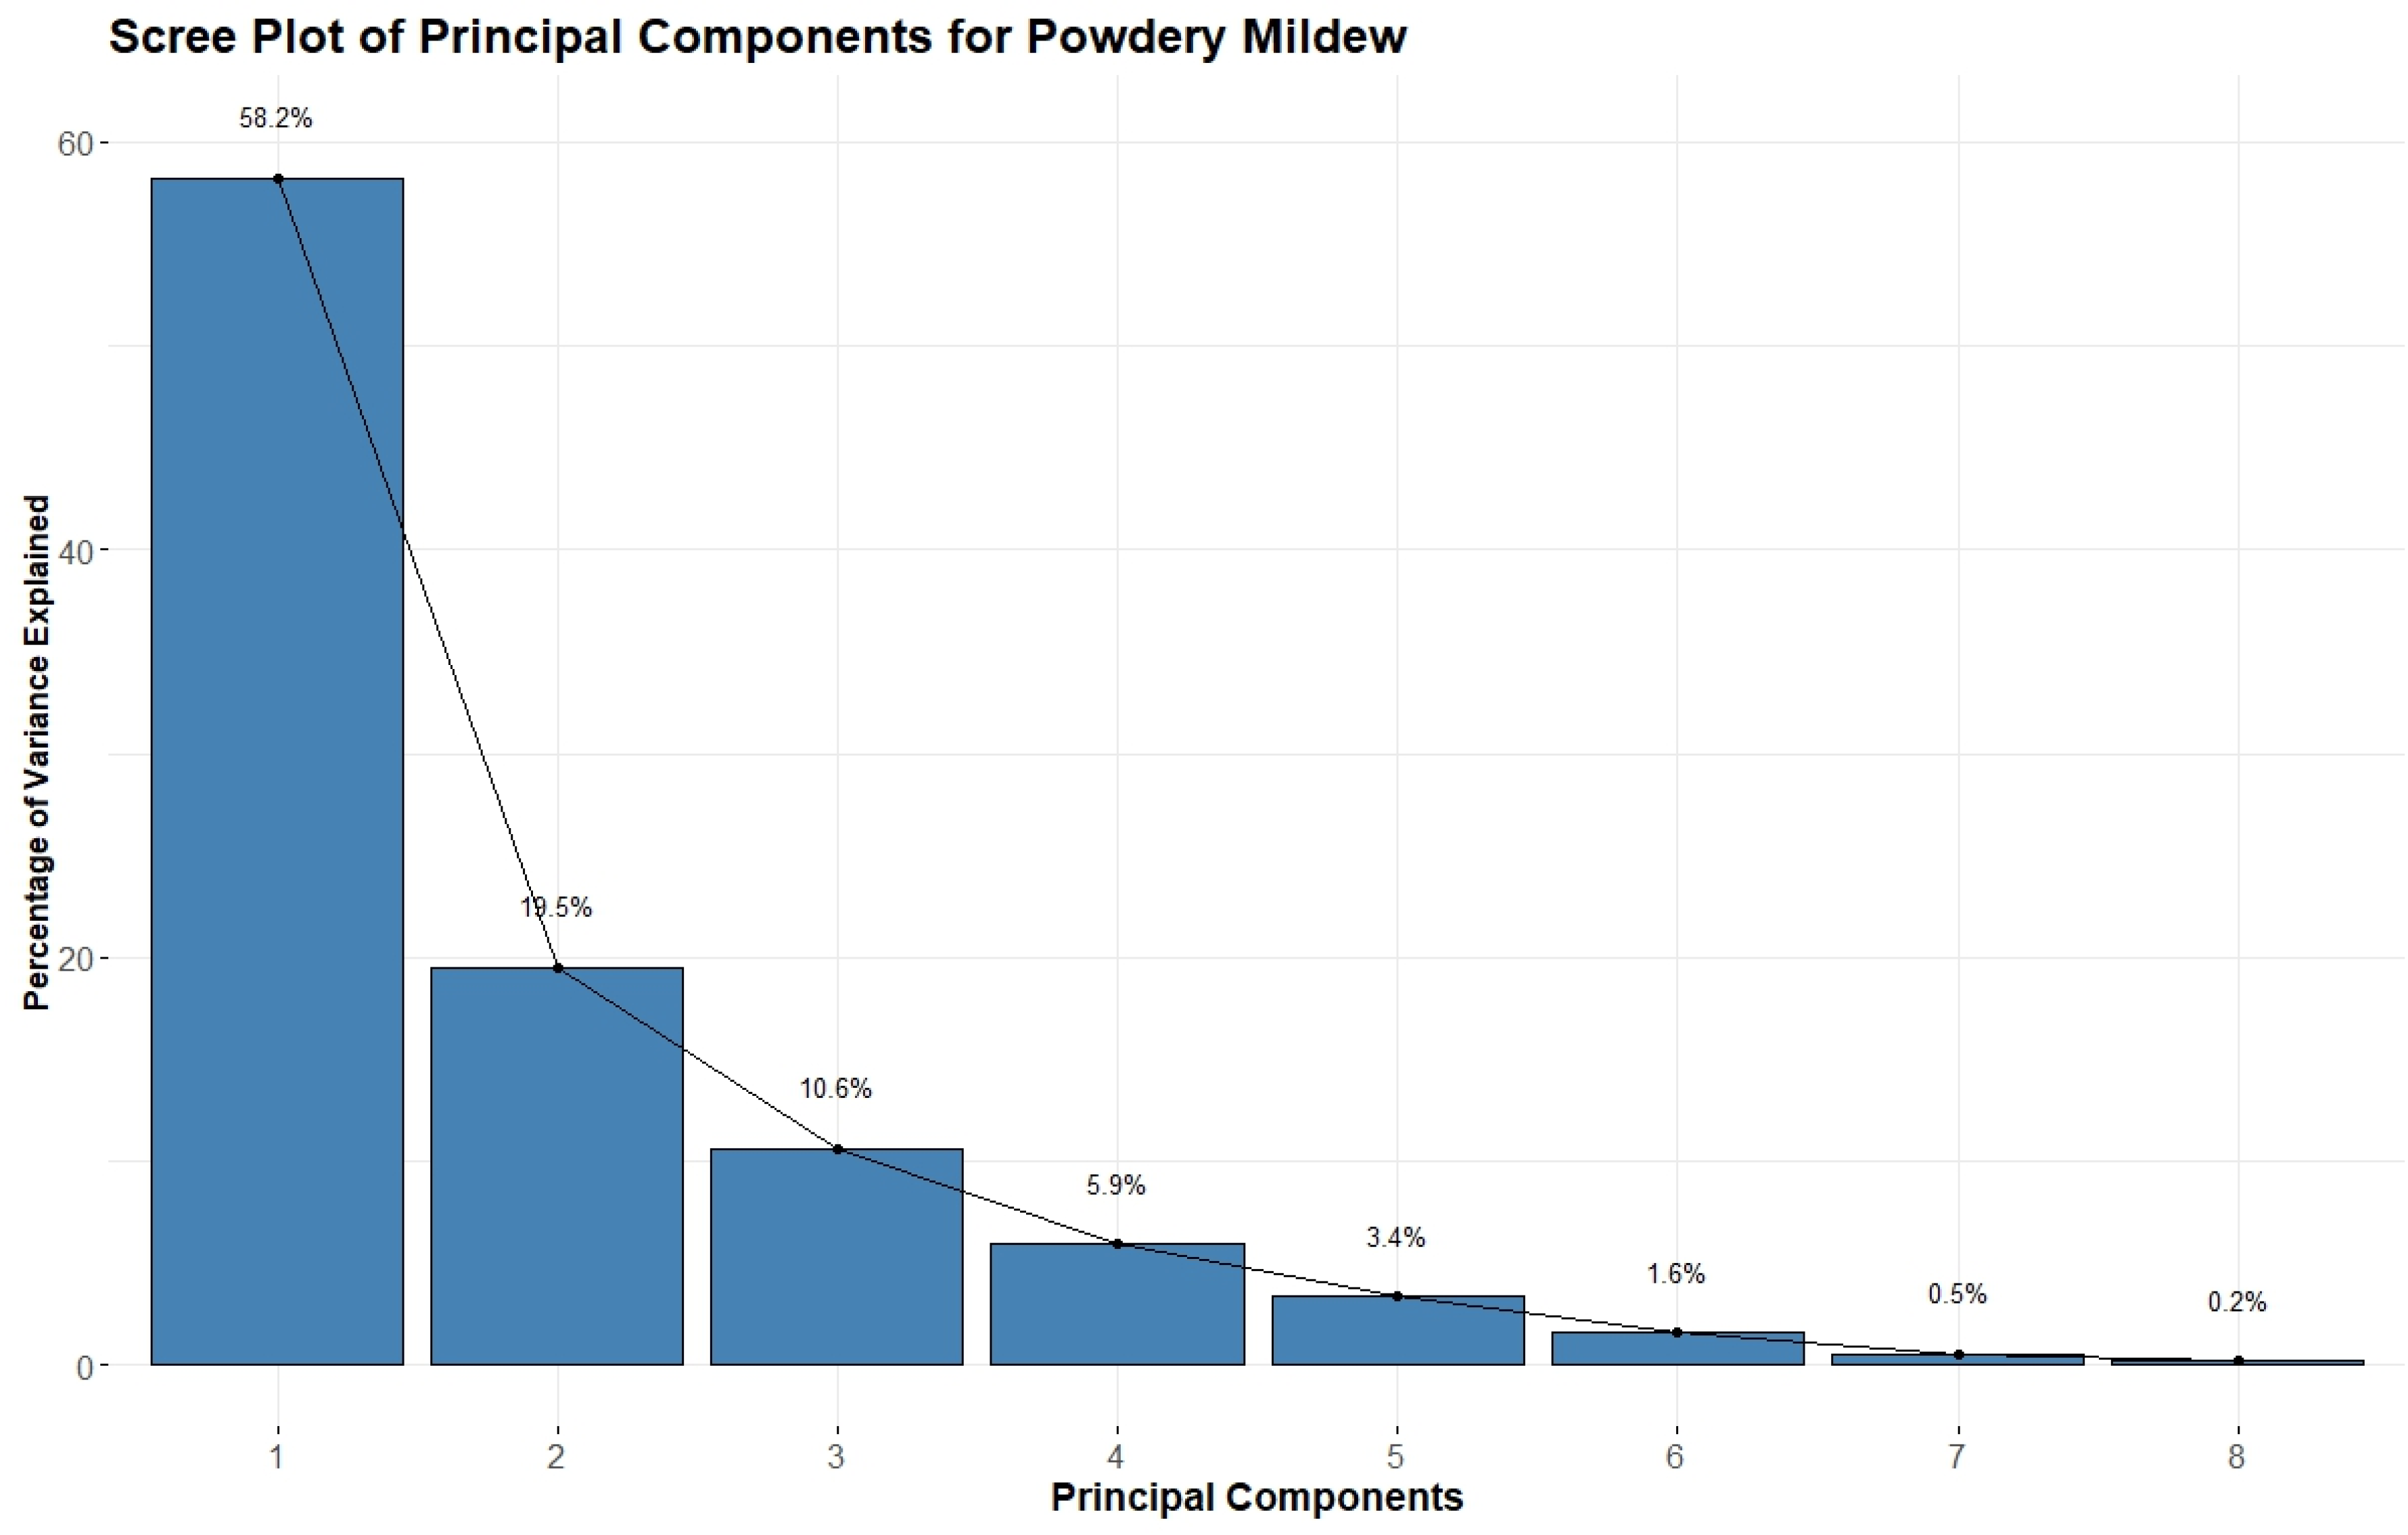
Figure 11.
Biplot of principal component analysis for Yellow Rust and Powdery Mildew.
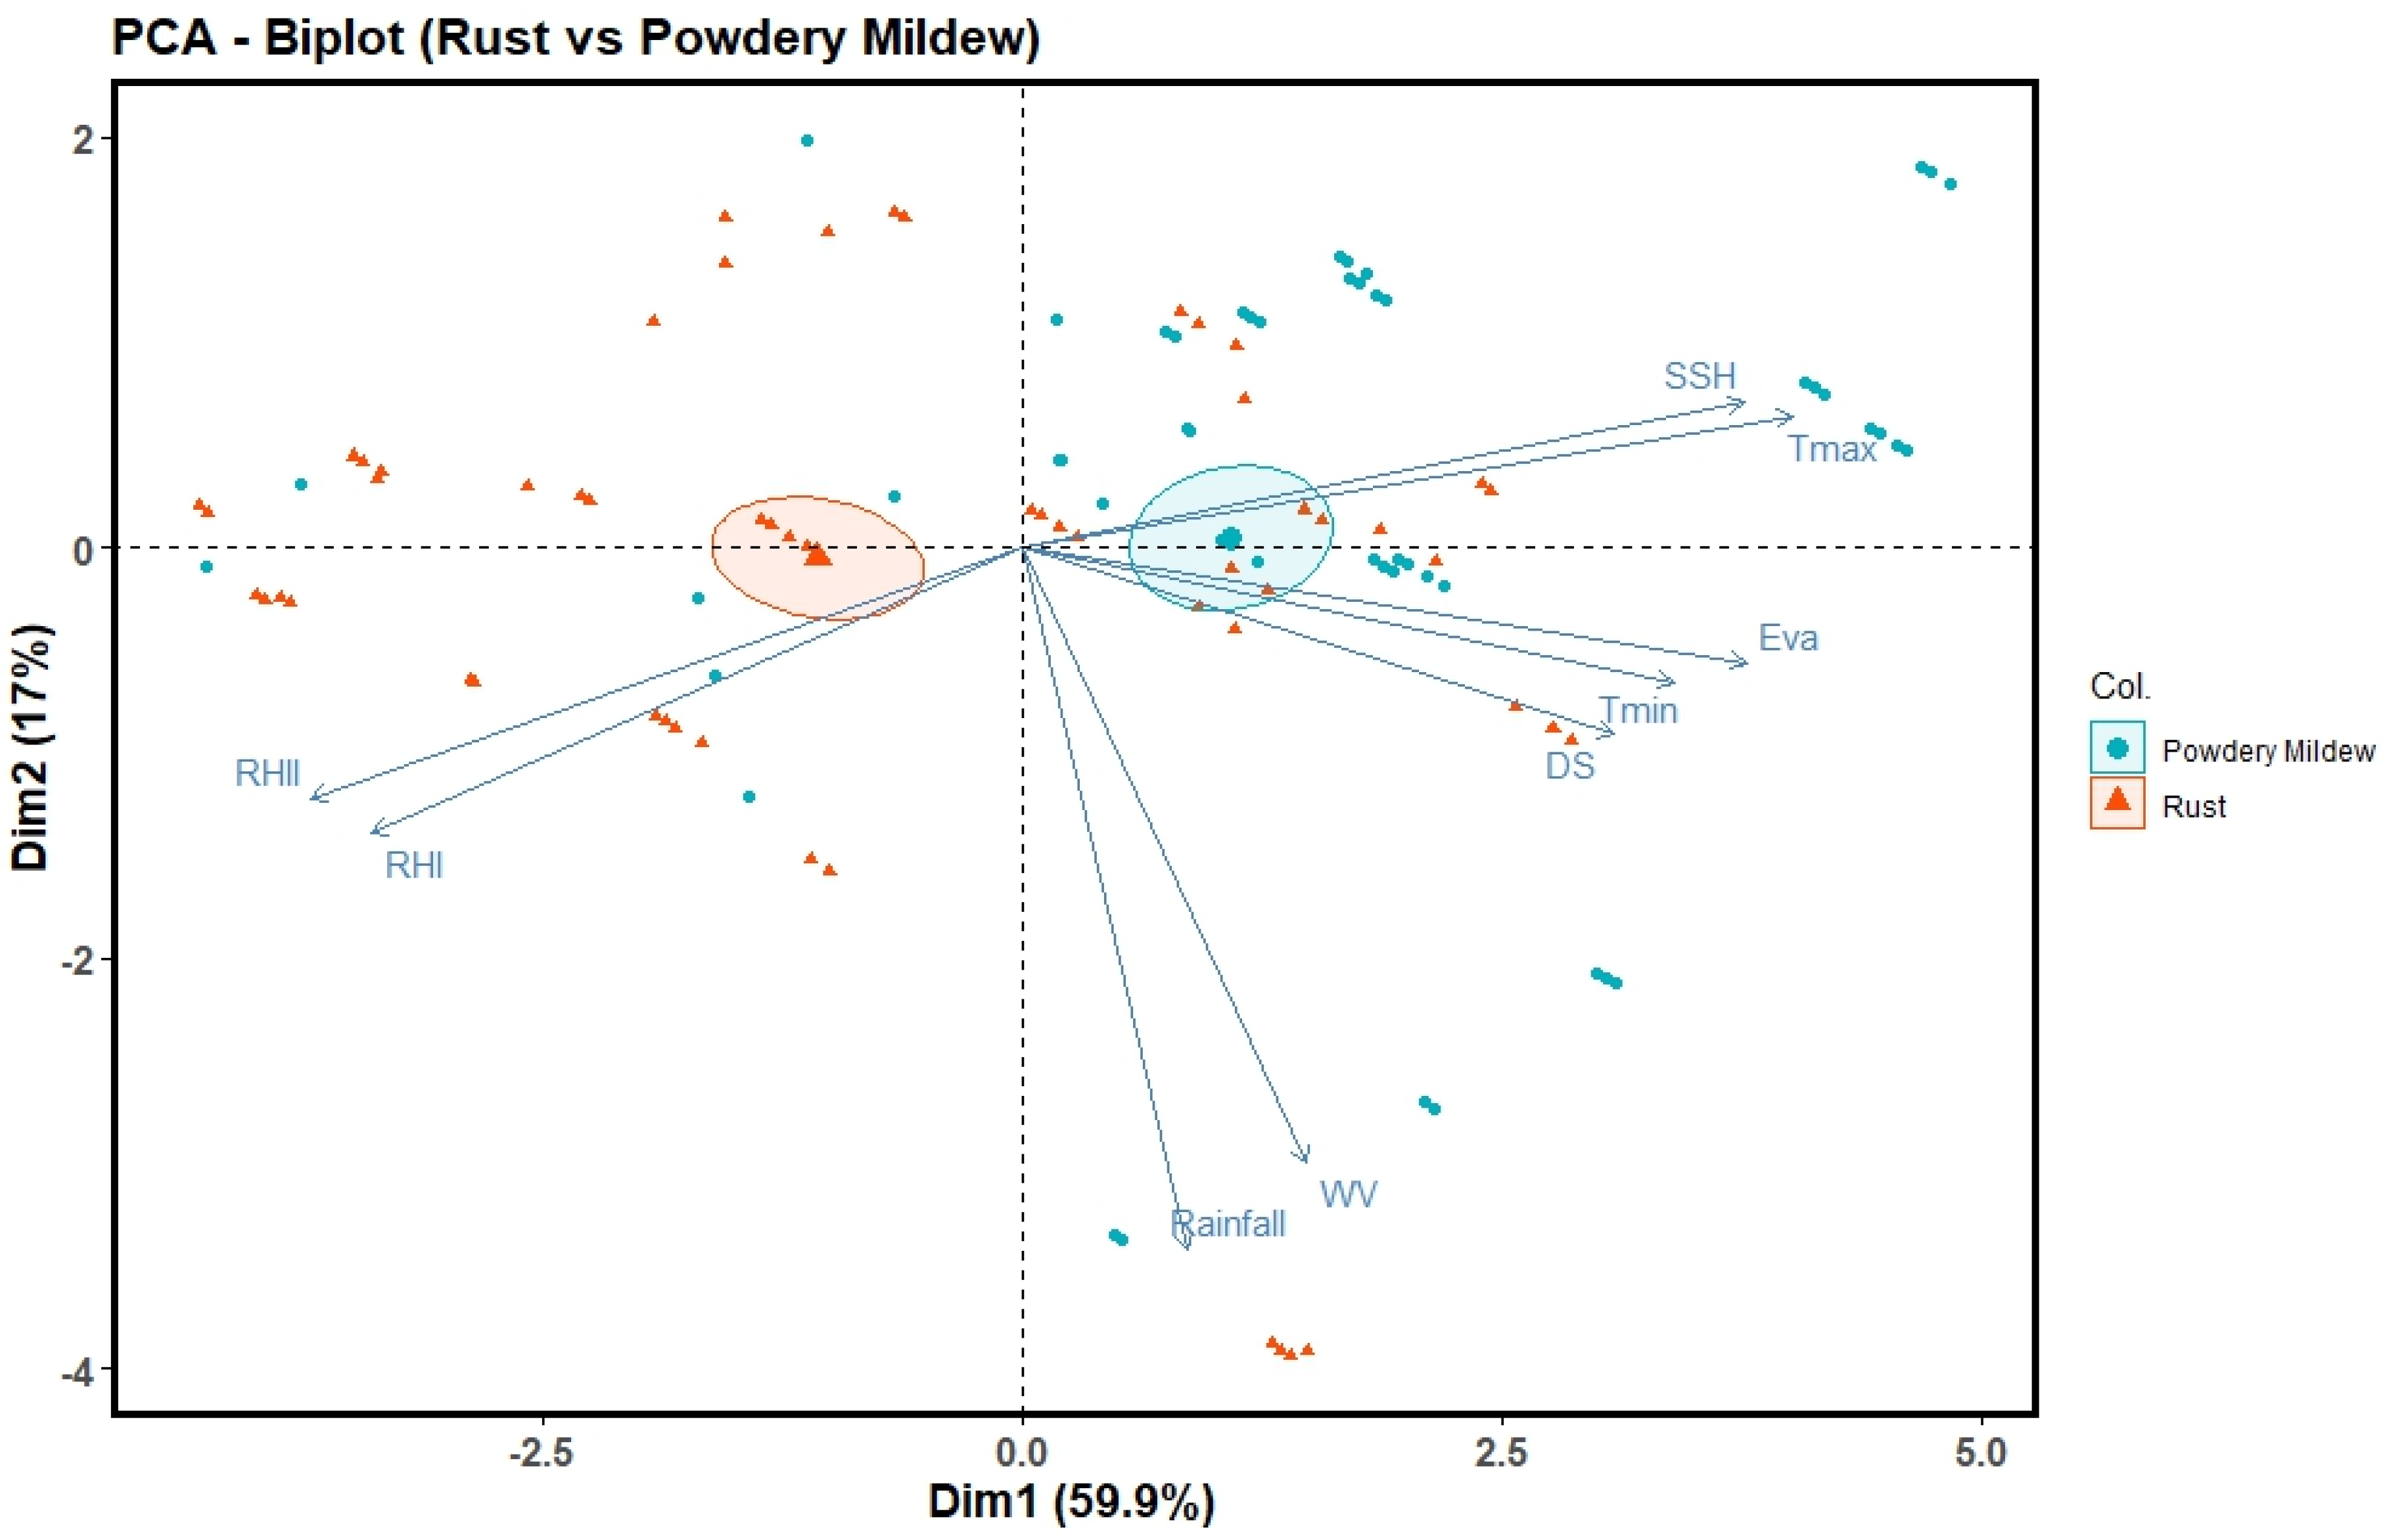
Table 4.
Hyperparameter tuning for machine learning model.
| Model | Hyperparameters Tuned | Values/Ranges |
| ANN | Hidden layer size (size) | 1, 3, 5 |
| Weight decay (decay) | 0.1, 0.5, 1 | |
| Ridge | Lambda | 500 values from 105 to 10-5 |
| Alpha | Fixed at 0 | |
| ENET | Lambda | 500 values from 105 to 10-5 |
| Alpha | Fixed at 0.5 | |
| GBM | Number of trees | 1000 |
| Interaction depth | 3 | |
| Learning rate (shrinkage) | 0.01 | |
| Lasso | Lambda | 500 values from 105 to 10-5 |
| Alpha | Fixed at 1 | |
| Random Forest | mtry (variables per split) | Default (auto-tuned) |
| ntree (number of trees) | Default |
Table 5.
Evaluation matrix of disease severity of yellow rust using machine learning models.
| Model | Calibration | Validation | ||||||||
| R2 | RMSE | nRMSE | MAE | EF | R2 | RMSE | nRMSE | MAE | EF | |
| ANN | 0.96 | 6.38 | 6.72 | 4.77 | 0.96 | 0.93 | 10.97 | 10.97 | 6.92 | 0.88 |
| ENET | 0.80 | 14.72 | 15.49 | 12.21 | 0.80 | 0.70 | 18.17 | 18.17 | 15.61 | 0.68 |
| GBM | 0.95 | 0.23 | 8.01 | 0.18 | 0.95 | 0.89 | 0.38 | 12.79 | 0.26 | 0.84 |
| Lasso | 0.80 | 14.68 | 15.45 | 12.11 | 0.80 | 0.68 | 18.40 | 18.40 | 15.68 | 0.67 |
| RF | 0.97 | 5.91 | 6.22 | 4.48 | 0.97 | 0.93 | 10.93 | 10.93 | 7.58 | 0.88 |
| Ridge | 0.80 | 14.99 | 15.78 | 12.46 | 0.79 | 0.73 | 17.50 | 17.50 | 15.32 | 0.70 |
Table 6.
Evaluation Matrix for Disease severity of Powdery Mildew for machine learning models.
| Model | Calibration | Validation | ||||||||
| R2 | RMSE | nRMSE | MAE | EF | R2 | RMSE | nRMSE | MAE | EF | |
| ANN | 0.98 | 4.98 | 5.24 | 3.32 | 0.98 | 0.95 | 6.98 | 7.35 | 4.98 | 0.95 |
| ENET | 0.77 | 16.35 | 17.21 | 13.46 | 0.77 | 0.95 | 6.98 | 7.35 | 4.98 | 0.95 |
| GBM | 0.98 | 0.15 | 5.28 | 0.10 | 0.98 | 0.90 | 0.30 | 10.86 | 0.22 | 0.89 |
| Lasso | 0.77 | 16.38 | 17.24 | 13.54 | 0.77 | 0.74 | 16.36 | 17.22 | 14.55 | 0.73 |
| RF | 0.98 | 4.52 | 4.75 | 2.82 | 0.98 | 0.90 | 10.60 | 11.16 | 6.85 | 0.89 |
| Ridge | 0.74 | 17.41 | 18.32 | 14.66 | 0.74 | 0.73 | 16.69 | 17.57 | 14.24 | 0.72 |
Table 7.
Regression Equations obtained for Disease severity prediction using different Machine Learning approach for yellow rust.
Table 7.
Regression Equations obtained for Disease severity prediction using different Machine Learning approach for yellow rust.
| Model | Regression Equation |
|---|---|
| Elastic Net | DS = 31.937 + 15.215 × Eva + 8.423 × WV - 5.534 × RHII + 3.645 × Rainfall + 0.829 × SSH |
| Lasso | DS = 31.937 + 16.681 × Eva + 8.471 × WV - 5.849 × RHII + 3.3 × Rainfall + 0 × Tmax |
| Ridge | DS = 31.937 + 10.999 × Eva + 8.071 × WV + 4.964 × Rainfall - 4.711 × RHII + 2.495 × Tmax |
Table 8.
Regression Equations obtained for Disease severity prediction using different Machine Learning approach for powdery mildew.
Table 8.
Regression Equations obtained for Disease severity prediction using different Machine Learning approach for powdery mildew.
| Model | Regression Equation |
| Elastic Net | DS = 29.726 - 27.312 × Tmax + 25.748 × Tmin - 24.939 × RHI + 10.553 × SSH - 3.673 × RHII |
| Lasso | DS = 29.726 - 26.375 × Tmax + 25.032 × Tmin - 24.927 × RHI + 10.582 × SSH + 3.075 × Rainfall |
| Ridge | DS = 29.726 - 16.601 × RHI + 13.925 × Tmin + 4.192 × Rainfall + 3.114 × SSH - 1.46 × Tmax |
Table 9.
Component matrix for the first three principal components for yellow rust.
| Variables | PC1 | PC2 | PC3 |
| Maximum Temperature | -0.439 | 0.103 | 0.100 |
| Minimum Temperature | -0.332 | -0.314 | 0.402 |
| Relative Humidity (I) | 0.340 | -0.338 | 0.151 |
| Relative Humidity (II) | 0.413 | -0.263 | 0.026 |
| Rainfall | -0.134 | -0.589 | -0.744 |
| Sunshine Hours | -0.426 | 0.167 | -0.109 |
| Wind Speed | -0.219 | -0.570 | 0.456 |
| Evaporation | -0.400 | -0.080 | -0.171 |
| Eigenvalue | 4.75 | 1.62 | 0.59 |
| Cumulative (%) | 59.43 | 79.77 | 87.18 |
| Standard deviation | 2.18 | 1.27 | 0.77 |
Table 10.
Component matrix for the first three principal components for powdery mildew.
| Variables | PC1 | PC2 | PC3 |
| Maximum Temperature | 0.452 | -0.034 | 0.092 |
| Minimum Temperature | 0.355 | 0.228 | 0.477 |
| Relative Humidity (I) | -0.407 | 0.115 | -0.206 |
| Relative Humidity (II) | -0.409 | 0.184 | 0.306 |
| Rainfall | -0.023 | 0.691 | 0.325 |
| Sunshine Hours | 0.405 | -0.060 | -0.359 |
| Wind Speed | -0.003 | 0.599 | -0.624 |
| Evaporation | 0.411 | 0.243 | -0.044 |
| Eigenvalue | 4.65 | 1.56 | 0.84 |
| Cumulative (%) | 58.22 | 77.77 | 88.36 |
| Standard deviation | 2.15 | 1.25 | 0.92 |
Disclaimer/Publisher’s Note: The statements, opinions and data contained in all publications are solely those of the individual author(s) and contributor(s) and not of MDPI and/or the editor(s). MDPI and/or the editor(s) disclaim responsibility for any injury to people or property resulting from any ideas, methods, instructions or products referred to in the content. |
© 2024 by the authors. Licensee MDPI, Basel, Switzerland. This article is an open access article distributed under the terms and conditions of the Creative Commons Attribution (CC BY) license (http://creativecommons.org/licenses/by/4.0/).
Copyright: This open access article is published under a Creative Commons CC BY 4.0 license, which permit the free download, distribution, and reuse, provided that the author and preprint are cited in any reuse.


