Submitted:
27 November 2024
Posted:
28 November 2024
You are already at the latest version
Abstract
This paper describes the Weather On Demand (WOD) forecasting framework which is a software stack used to run operational and on-demand weather forecasts.
The WOD framework is a distributed system for:
Running the WRF weather model for data-assimilation and forecasts by triggering either scheduled or on-demand jobs.
Gathering upstream weather forecasts and observations from a wide variety of sources.
Processing data for long to medium-term storage.
Making results available through APIs.
Making data files available to custom post-processors.
Much effort is put into starting processing as soon as the required data becomes available, and in parallel where possible.
In addition to being able to create short- to medium-range weather forecasts for any location on the globe, users are granted access to a plethora of both global and regional weather forecasts and observations, as well as seasonal outlooks from the National Oceanic and Atmospheric Admin-istration (NOAA) in the USA through WOD integrated APIs. All this information can be inte-grated with third party software solutions via the WOD APIs.
The software is maintained in Git and can be installed on suitable hardware, bringing the full flexibility and power of the WRF modelling system to the user in a matter of hours.
Keywords:
Numerical weather forecasting framework
1. Introduction
In this paper we will describe the Weather On Demand (WOD) forecasting framework, which has been developed by the Icelandic private entity Belgingur Ltd. At Belgingur we focus on research and development in meteorology and have during the past 15 years gradually been improving our software stack used to run operational and on-demand weather forecasts.
The WOD system has its roots in the long history of Belgingur’s contributions to Search and Rescue operations through our collaboration with the Icelandic Urban Search and Rescue (SAR) Team and the UN Global Disaster Alerts and Coordination System (GDACS)[1]. In the aftermath of the horrific earthquake that devastated Haiti in January 2010 the Icelandic team were the first international SAR team to arrive in Haiti[2],[3], and asked Belgingur to set up and run high-resolution weather forecasts, in operational mode, for the region. This request was fulfilled in less than two hours with the forecasts being updated four times per day over the next six months. This paved the way for Belgingur to become a certified service provider for GDACS through the SARWeather [1] forecasting system[4]. In 2015 Belgingur provided services to the United Nations Economic Commission for Africa[5] via provision of the operational and on demand WOD weather forecasting systems for the NMHS’s of the Seychelles and Cabo Verde [2]. The operational forecasting system was installed on in-house hardware at these NMHS’s in 2016 and 2017, respectively. In 2022 the system was installed at the Faroe Islands meteorological agency, again on in-house hardware.
The backbone of the WOD weather forecasting system is the WRF-Chem atmospheric model [3], with several in-house customizations. Initial and boundary data can be taken from the Climate Forecasting System (CFS), Global Forecasting System (GFS), Global Ensemble Forecasting System (GEFS) and the RAPid refresh forecasting system (RAP), all operated by the National Oceanic and Atmospheric Administration[6] (NOAA) in USA. Operational forecasts use cycling of chosen parameters, mainly deep soil, and surface fields. This is done to minimise spin-up effects and to ensure proper book-keeping of hydrological fields such as snow accumulation and runoff, as well as the constituents of various chemical parameters.
With access to a wide variety of input data, the WOD system can be used to create conventional short- to medium-range weather forecasts for any location on the globe, as well as regional climate outlooks and ensemble forecasts. In addition to be able to create forecasts and climate outlooks, users are granted access to both global and regional weather forecasts, as well as seasonal outlooks from NOAA through WOD integrated APIs[7]. Open access global forecasts from the ECMWF and regional forecasts from the Deutscher Wetterdienst and Danish Meteorological Institute can further be accessed via the APIs. Through the WOD API system users can also access weather observations from over 30.000 locations world-wide. All this information can be integrated with third party software solutions via the WOD APIs.
The WOD system can be used for air quality purposes (e.g., dispersion forecasts from volcanic eruptions, see e.g. [4]) and as a tool to provide input to other modelling systems, such as hydrological models. A wide variety of post-processing options are available, making WOD an ideal tool for creating highly customised output that can be tailored to the specific needs of individual end-users. One option worth mentioning is the ability to create output files that are compliant with the Verif verification tool [5], developed at the Norwegian Meteorological Institute and the University of British Columbia. Through this, users can compare, not only forecasts created by the WOD system itself but also forecasts from a wide range of providers, to observations.
The task of installing and running an atmospheric modelling system, like e.g. WRF-ARW [3], can be a daunting one. Not only is it a question of configuring and compiling a large and complex modelling system, but also to correctly configure and compile a plethora of underlying libraries, necessary for the seamless operation of the atmospheric model. Luckily, one can now find guidelines on how to run the model in the cloud[8] or even access pre-compiled binary stacks to run on one’s own in-house hardware (see e.g. [6]). Considering the complexity involved in installing and running an atmospheric model from the bottom up, the concept of an on-demand forecasting system is indeed tempting. The idea of such a system is also not a new one; back in 2004 Warner et al. [7] described a system where users could, through a graphical user interface, rapidly configure and deploy the MM5 [8] atmospheric model. In 2007 Stauffer et al. [9] described a now-casting system, again based on the MM5 model, that could be deployed in the field on computers that were physically located in e.g. army vehicles. To our best of knowledge neither of these systems were ever made available to the public as both projects were either funded by, or designed for, various branches of the US military. In 2010 Belgingur launched the SARWeather on-demand forecasting solution and more recently the US based company TempoQuest offered their cloud-based wrf-on-demand[9] forecasting services to the public.
There are several differences between WOD and the above-mentioned solutions. The biggest one is perhaps the notion that the user can be given the rights to install the whole software stack on his/her own in-house, or cloud-based, hardware. Secondly, the WOD framework offers the potential to use data assimilation to improve forecast accuracy. Thirdly, users are granted access to a wide range of both global and regional forecasts from a plethora of third-party providers through a uniform API. This is done in such a way that data is made available on the fly, which can be quite valuable for time-critical downstream solutions such as energy trading and search and rescue operations.
According to [10] only half of the world's countries had access to a multi-hazard early warning system (MHEWS) at the end of 2023. It is our belief that the WOD system can play an important role in two of four pillars that make up a successful MHEWS, especially in infrastructure sparse regions. These are observations and forecasting, and dissemination and communication. (The remaining two pillars are disaster risk knowledge and the preparedness to respond, which are outside the scope of the WOD framework.)
In the next section we will describe the current version of the WOD forecasting system, focusing on design philosophy, software architecture and data assimilation capabilities. Following that we will give some examples of applications and finally wrap up with general discussions and thoughts on future developments.
2. System Description
The backbone of the WOD forecasting framework is the WRF-Chem [3] atmospheric model and its accompanying WRFDA [11] data assimilation software suite.
2.1. Design Philosophy
The system is rooted in an open-source design philosophy, allowing for seamless updates, scalability, and deployment without concerns about licensing fees. Predominantly coded in Python, it leverages essential libraries such as NumPy, netcdf4, Flask, and Sqlalchemy. Executed on clusters of Linux machines, the system integrates PostgreSQL as its relational database, while communication is facilitated through RabbitMQ and XML-RPC. Automated deployments are orchestrated through SaltStack, ensuring consistency across environments.
The forecasting system operates on an event-driven model, triggering processing in response to the availability of necessary data. Subsequently, tasks are scheduled to appropriate workers and modelers, rendering the system flexible and easily scalable to accommodate increased workloads.
2.2. Software Architecture
The component at the heart of the WOD system is referred to as the Conductor (cf. Figure 1). The Conductor actively monitors events, such as the availability of upstream data or the initiation of a modelling job via the API. Its core function is to orchestrate the execution of the weather model across a distributed infrastructure. The modelling process is structured as a series of tasks, with each task assigned to a suitable worker (lightweight tasks) or modeler (heavy tasks, such as WRF execution). The resulting forecast files, generated at the conclusion of the modelling process, are stored in a shared file system. Details about the tasks constituting the modelling process are stored in a PostgreSQL database.
Next to the Conductor and the workers/modelers tasked with executing its components, the WOD system comprises a suite of smaller services dedicated to handling weather data.
- Upstream gatherer: Retrieves data from a variety of upstream sources, including NOAA, ECMWF, Icelandic Met Office, and more. It notifies the conductor upon the availability of initial and boundary condition files to initiate modelling. Additionally, the service converts incoming data to our standardized, comprehensive netCDF file format, allowing convenient access to upstream data through our API.
- Post-processing trigger: A service connected to the Conductor via a message broker, receiving notifications about the completion of diverse modelling tasks. Configurable triggers enable the execution of various post-processing actions in response to these events.
- Observation Importer: This module handles surface observation data from different sources, whether pulled from external providers or received from providers with whom we have agreements. The processed data is then stored in a PostgreSQL database.
- ObservationQA: A service responsible for evaluating imported observation data and assigning credibility scores to the observations.
- Weather API: A RESTful API that enables access to the forecasting results and upstream data, starting on-demand forecasts and browsing observations. It is the main gateway for accessing the weather data from outside of the system.
- WeatherArchive Service: A service providing access to historical data.
- Frontend components: Diverse clients designed to visualize both forecasts and observations.
- Forecast Verification: This service enables the comparison of our forecasts and those from upstream sources against observational data.
2.3. Data Assimilation Capabilities
The WRFDA [11] data assimilation system has been integrated with the WOD framework. To date users can take advantage of both the 3D- and 4D-VAR options within WRFDA, as well as the hybrid data assimilation option described in Wang et al. [12, 13]. Examples of observational data that can be used are satellite radiance data in BUFR format and a plethora of observations in PREPBUFR format made available by NOAA[10]. The WOD system further accommodates user-provided surface observations that are converted to the LITTLE_R format required by the OBSPROC pre-processing tool. To create domain specific background error statistics, users need to use a utility program called gen_be [14]. The input data for gen_be are previous WRF forecasts, which are used to generate model perturbations, used as a proxy for estimates of forecast error[11]. The WOD framework allows for the automatic post-processing of WRF forecasts, over a user-defined period, to create the necessary set of data to be used as input to the gen_be software tool.
In addition to the WRFDA data assimilation system, users can take advantage of observation nudging, also called Four Dimensional Data Assimilation (FDDA) [15], of both conventional surface observation and atmospheric profiles. In FDDA, observations are merged into the model simulation to prevent the model solutions from drifting away from observed values. In-situ profiles, from e.g. uncrewed aircraft systems (UAS), have been shown to have beneficial impact on the accuracy of model simulations (see e.g. [16, 17]). Indeed, the World Meteorological Organization (WMO) has organised a global UAS demonstration campaign[12] to investigate the efficacy of UAS to contribute to the WIGOS (WMO Integrated Global Observing System) Global Basic Observing Network (GBON) routinely and operationally. The campaign focused on the near-real time provision of measurement of atmospheric variables required for assimilation in numerical weather prediction systems.
3. Examples of Applications
In lieu of the Icelandic Mt. Eyjafjallajökull eruption in 2010 and Mt. Grímsvötn eruption in 2011 work started to enhance the WOD system so it would be able to forecast the dispersion of volcanic ash and SO2 (see e.g. [18]). This addition [4] came on-line in 2014 when the Holuhraun eruption[13] started and has been used on a regular basis over the past few years now that eruptions are occurring frequently on the Reykjanes peninsula in SW-Iceland (cf. Figure 2).
The use of data assimilation in regional models fosters broader and more collaborative integration among various meteorological stakeholders. For instance, a user with an observation network (cf. Figure 3) can have his/her data assimilated into the meteorological model, resulting in more accurate predictions. The more users provide data, the better the predictions for everyone, fostering a virtuous cycle where the quantity and quality of provided data help drive the precision and accuracy of forecasts, attracting more collaborators and consequently more observational data. section may be divided by subheadings. It should provide a concise and precise description of the experimental results, their interpretation, as well as the experimental conclusions that can be drawn.
In addition to traditional meteorological sector applications, such as media and governments, the WOD system also offers significant commercial and strategic benefits for sectors that maintain observational data networks, such as the electrical sector, agribusiness, and infrastructure (cf. Figure 4).
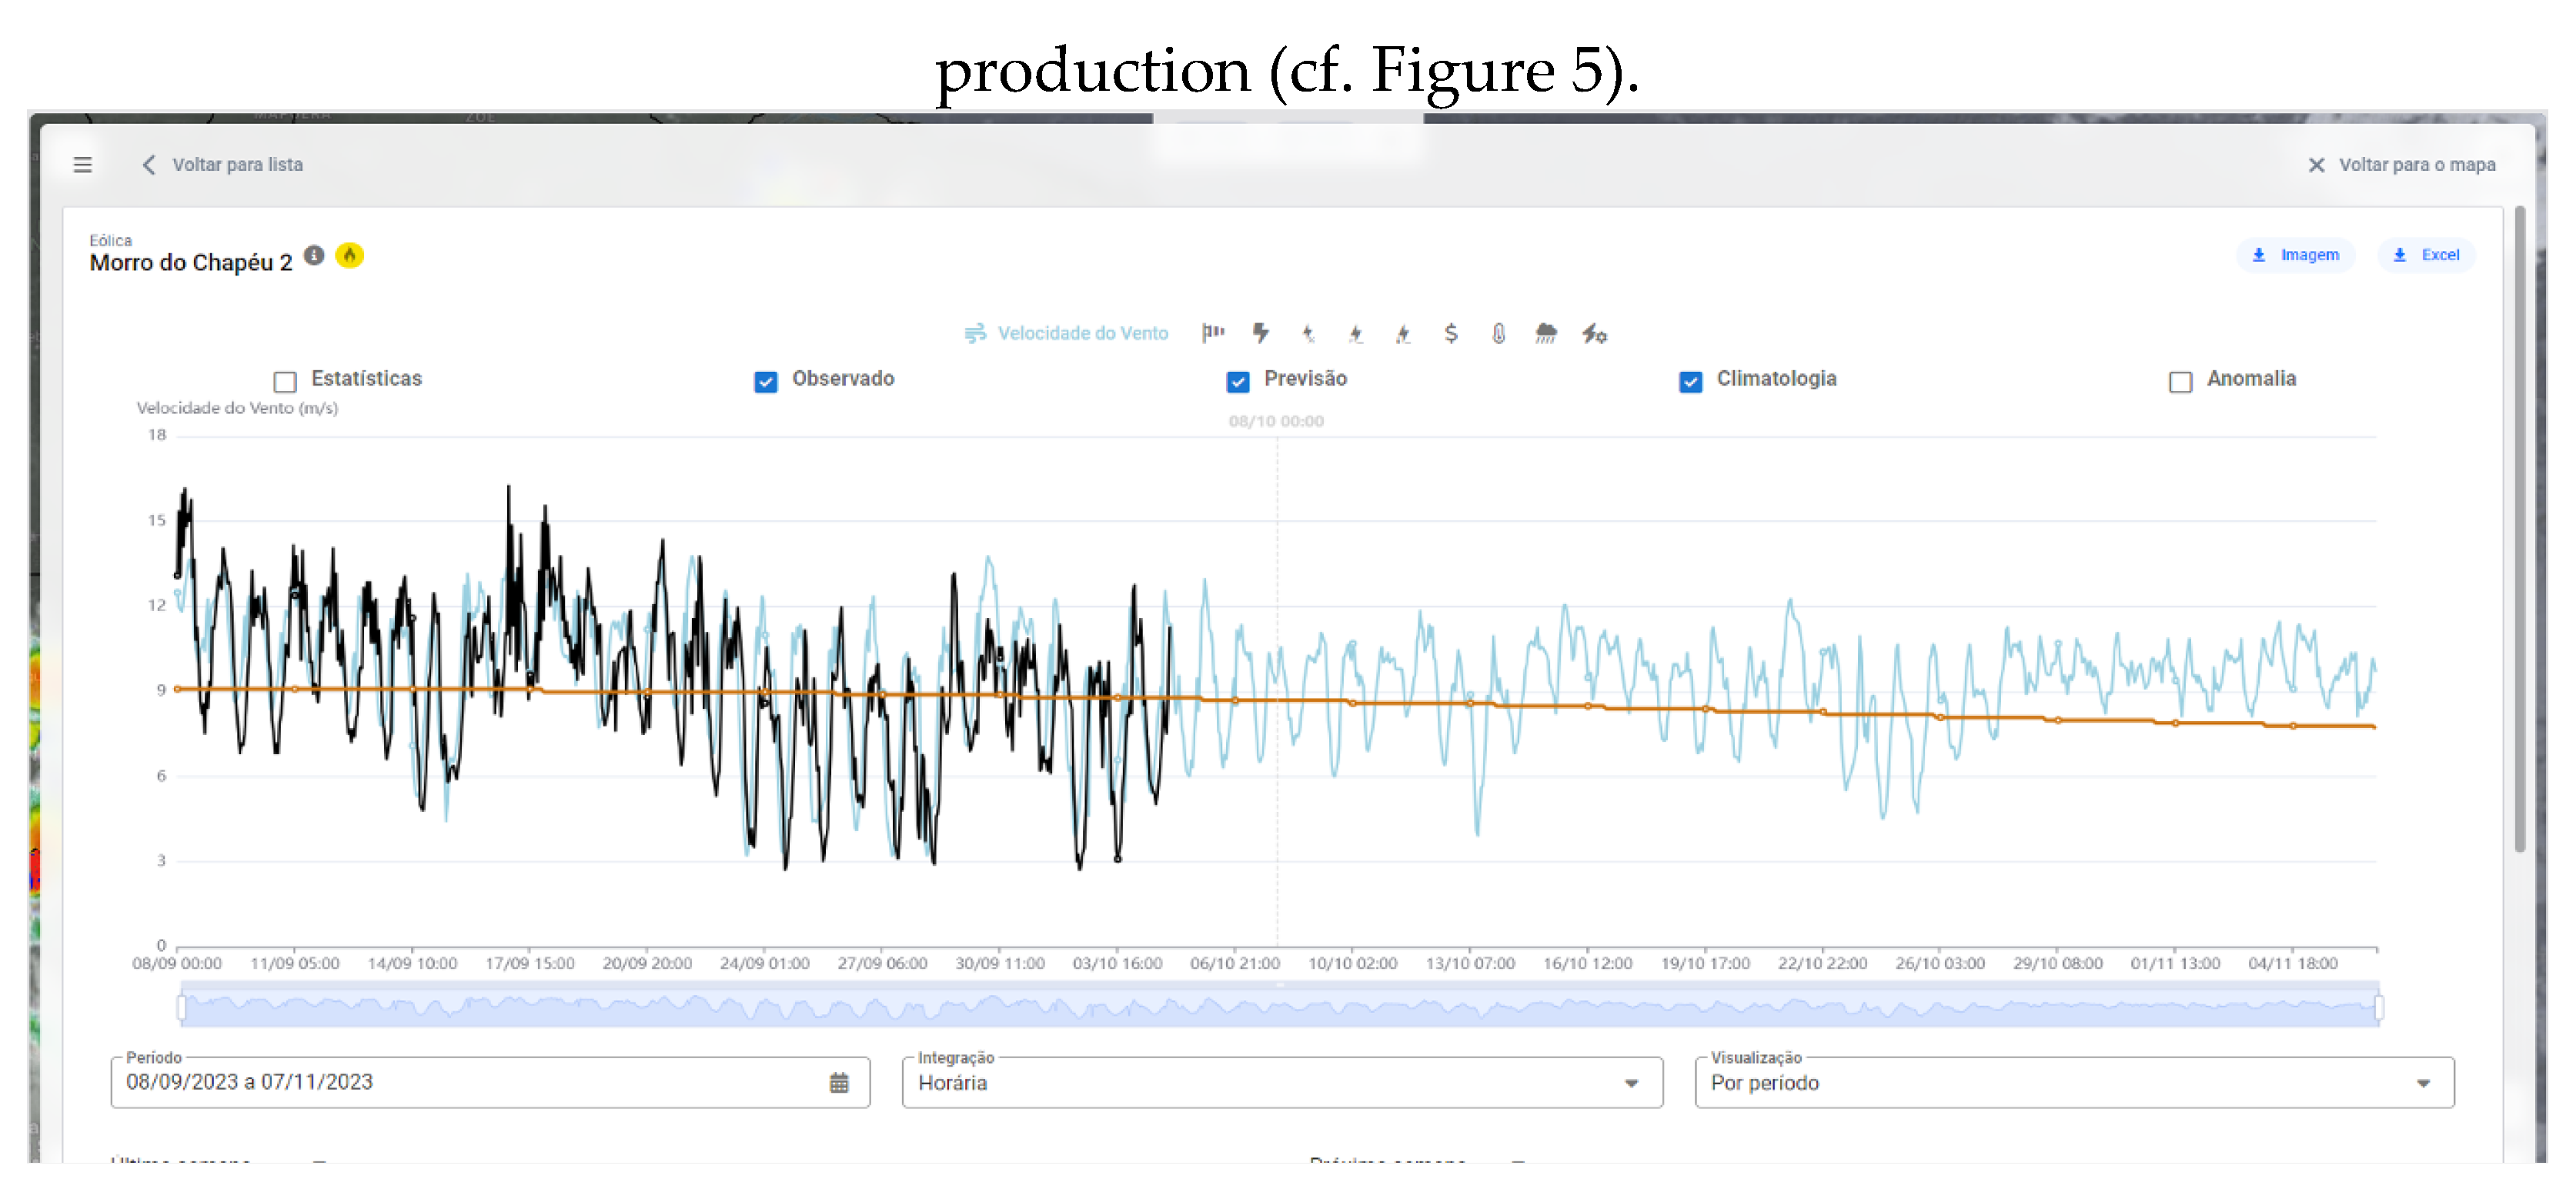
Wind farms, for example, have wind, temperature, and humidity measurements on towers at heights exceeding the first model levels. This data can be directly assimilated into the meteorological model without the need for boundary layer parameterizations to extrapolate information to the correct model level. On the other hand, these entities require accurate forecasts to better plan their operational and maintenance activities, as well as estimate their future power production (cf. Figure 5).
Another example of application lies in precision agriculture, which increasingly employs systems for measuring rainfall, temperature, and humidity in agricultural fields. Agricultural companies with private measurement networks can provide a significant amount of data collected in regions distant from major urban centres, where there is a higher concentration of observational data from the government network. This expanded data coverage for the data assimilation system consequently improves predictions for agricultural management in remote locations. Furthermore, the agrology sector is not only measuring the atmosphere with traditional weather stations, but with UASs as well. Like the towers from wind farms, the UASs can measure atmospheric parameters at heights corresponding to the first model levels and in a vertical profile, and therefore bring more valuable information to the data assimilation system.
Finally, the infrastructure sector, encompassing ports, railways, roads, waterways, and construction projects, has also experienced rapid growth in atmospheric measurements, in line with the Industry 4.0 revolution and the expansion of the Internet of Things (IoT). This sector also heavily depends on accurate weather forecasts to enhance the efficiency and planning of its operational activities.
4. Discussions and Future Development
In this paper, we have described the current status of the Weather On Demand weather forecasting framework, focusing on design philosophy, software architecture, data assimilation capabilities and its field of potential applications.
The possibilities for the application of a regional meteorological model system with data assimilation technology are diverse and, encompassing both the private and governmental sectors, especially in the context of climate change. In these circumstances, where statistical methods often fail to represent phenomena that have rarely been observed in the past, but may become increasingly frequent, this approach stands out by preserving the dynamic characteristics of the atmosphere, akin to any other deterministic model. Therefore, error reduction techniques in post-processing, such as machine learning algorithms, are still recommended to be applied to the forecast results.
As the WOD framework is continuously being improved with new features under development we conclude this paper with a review of ongoing amendments and near future additions to WOD.
4.1. Cloud Deployment
Although the current version of WOD can be deployed in the cloud with relative ease, the control of starting modellers on-demand, as opposed to having a fixed number of High-Performance Computing (HPC) servers always up-and-running, must be done in an ad-hoc manner. Furthermore, the choice of what type of virtual servers should be used for individual modeller groups varies greatly and is both a function of the computing cloud vendor and geographical location of the data centre hosting the instalment in question. For optimal performance, the WRF model source code may also have to be recompiled to take full advantage of the underlying hardware (both CPU and intra-node network fabric).
These issues are by no means a showstopper for a successful cloud-application, but rather emphasise the need to fully understand the pros and cons of available HPC cloud provider solutions.
4.2. Hybrid Options
It is possible, using the current infrastructure, to use data from different upstream sources to create initial and boundary data for WOD forecasts. Notably, using high-resolution sea surface temperature observations from NASA[14] is a straightforward task. It is also possible to use input data from e.g. ECMWF as initial analysis and then data from NOAA for forcing the model at the boundaries. These hybrid forecasts are however not as well supported within the WOD framework as forecasts using conventional data flows, i.e. they are not as fault tolerant.
4.3. Additional DA Options
Currently, the WOD system does neither support the assimilation of radar data nor observations of precipitation. Integration of these data sources has intentionally been given less priority than e.g. radiances and UAS profile data. The reason is mainly that it is quite difficult to gain real time access to high quality doppler radar and gridded precipitation observations.
4.4. Machine Learning Based Forecasting
Over the past couple of years, a plethora of machine learning (ML)-based weather models have taken the Numerical Weather Prediction (NWP) community by storm (pun intended). See e.g. papers on the MetNet2, GraphCast, and ClimaX models (see [19, 20, 21], respectively). Out of these three, ClimaX is the most interesting for us as it is an open-source, general purpose foundation model intended for various weather and climate modelling applications. That means, the model is pre-trained and can be fine-tuned to specific applications such as climate prediction, downscaling and regional modelling.
The potential of being able to run accurate weather forecasts, at the fraction of current computational cost, is very compelling. Machine learning models, contrary to conventional NWP models, are highly resource demanding in the training phase, but require orders of magnitude less resources when the model is applied. Most of the focus in ML-based weather forecasting so far has been put on training machine learning models on global data sets, such as the ERA5 reanalysis (see [22, 23]), which are however usually characterised by low temporal and spatial resolution. As an extension to the WOD framework, work is underway to use Belgingur’s own high resolution reanalysis data for Iceland (called IceBox) to train the ClimaX model to create a high-resolution machine learning weather model for Iceland. If successful, this approach could revolutionise the way regional weather forecasting is done.
Notes
-
[7]URL of WOD restful API: https://wod.belgingur.is/api/v2/ui/ for further information see https://github.com/Belgingur/WOD-Documentation/wiki/Getting-Started-With-WOD-APIs.
-
[10]On 1 March 2024, this data could be accessed from https://nomads.ncep.noaa.gov/pub/data/nccf/com/obsproc/prod/.
-
[13]For general information on the Holuhraun eruption see e.g. https://en.wikipedia.org/wiki/Holuhraun.
-
[14]Data description is available online: https://www.earthdata.nasa.gov/learn/articles/tools-and-technology-articles/mur-sst-in-the-cloud.
Data Availability Statement
The WOD software suite repository is stored on Github - https://github.com/Belgingur/WOD. The software is closed source but interested readers are advised to contact the authors for a user license.
Acknowledgments
Over the years the development of the WOD framework has been supported by Nordisk Atlantsamarbejde (NORA) via grant number 550-025 (Vejrtjeneste for Søberedskab) and by the European Commission under the 7th Community Framework Programme for Research and Technological Development (project GalileoCast). The work has also been supported by the Icelandic Technology Development Fund through grants nr. 110338-0611, 132053-0611, and 1910034-0611. The authors wish to thank Prof. Haraldur Ólafsson and Dr. Örnólfur E. Rögnvaldsson for proofreading the manuscript, improving its readability considerably.
Conflicts of Interest
The authors declare no conflicts of interest.
References
- Rögnvaldsson, Ó. Search and Rescue, weather prediction system assists humanitarian aid. Meteorological Technology International, /: 2011. Available online: http, 20 September 2011. [Google Scholar]
- Stanislawska, K., L. Ragnarsson, and Ó. Rögnvaldsson. WOD – Weather On Demand System Description and User Manual. Prepared for UNECA. Short report. ÍSOR-16022. Project no.: 15-0130, /: Available online: http, 1602. [Google Scholar]
- Skamarock, W. C. , and Coauthors. A Description of the Advanced Research WRF Version 4. NCAR Tech. Note, 2019, 145. Available online, 2019. [Google Scholar] [CrossRef]
- Rögnvaldsson, Ó. , and Coauthors. Modeling of SO2 dispersion from the 2014 Holuhraun eruption in Iceland using WRF-Chem. Geophysical Research Abstracts, /: Available online: https://meetingorganizer.copernicus.org/EGU2015/EGU2015-10113.pdf and http, 1011. [Google Scholar]
- Nipen, T. N., R. B. Stull, C. Lussana, and I. A. Seierstad. Verif: A Weather-Prediction Verification Tool for Effective Product Development. Bull. Amer. Meteor. Soc. 9. Available online. [CrossRef]
- Hatheway, W., H. Snoun, H. ur Rehman, and A. Mwanthi. WRF-MOSIT: a modular and cross-platform tool for configuring and installing the WRF model. Earth Sci. Inform. 4327–4336. Available online, 4327. [Google Scholar] [CrossRef]
- Warner, T. T., J. F. Bowers, S. P. Swerdlin, and B. A. Beitler. A rapidly deployable operational mesoscale modeling system for emergency-response applications. Amer. Meteor. Soc. 2004, 85, 709-716. Available online, 2004; 85. [Google Scholar] [CrossRef]
- Grell, G.A., J. Dudhia and D.R. Stauffe. A description of the fifth-generation Penn State/NCAR mesoscale model (MM5). NCAR Tech. Note.
- Stauffer, D.R., A. Deng, G. K. Hunter, A.M. Gibbs, A.R. Zielonka, K. Tinklepaugh, 18th Conference on Numerical Weather Prediction, Park City, UT, USA, 25-29 June 2007., and J. Dobek. NWP goes to war... Preprints. In Proceedings of the 22nd Conference on Weather Analysis and Forecasting.
- Kumar, A. , and A. Alexieva (coordinating lead authors). Global Status of Multi-Hazard Early Warning Systems. United Nations Office for Disaster Risk Reduction and World Meteorological Organization. Geneva, Switzerland, 2023. Available online: https://www.undrr. 2023. [Google Scholar]
- Barker, D. , and Coauthors. The Weather Research and Forecasting Model's Community Variational/Ensemble Data Assimilation System: WRFDA, Bull. Amer. Meteor. Soc. 2012, 93, 831–843. Available online. [CrossRef]
- Wang, X., D. M. Barker, C. Snyder, and T. M. Hamill. A hybrid ETKF–3DVAR data assimilation scheme for the WRF model. Part I: Observing system simulation experiment. Mon. Wea. Rev. 5116. [Google Scholar]
- Wang, X., D. M. Barker, C. Snyder, and T. M. Hamill. A Hybrid ETKF–3DVAR Data Assimilation Scheme for the WRF Model. Part II: Real Observation Experiments. Mon. Wea. Rev. 5132. [Google Scholar]
- Descombes, G., T. Auligné, F. Vandenberghe, D. M. Barker, and J. Barré. Generalized background error covariance matrix model (GEN_BE v2.0), Geosci. Model Dev. 2015, 8, 669–696. Available online. [CrossRef]
- Stauffer, D. R. , and N. L., Seaman. Multiscale 4-dimensional data assimilation, J. Appl. Meteorol. 1994; 33. [Google Scholar]
- Jonassen, M.O., H. Ólafsson, H. Ágústsson, Ó. Rögnvaldsson, and J. Reuder. Improving high resolution numerical weather simulations by assimilating data from an unmanned aerial system. Mon. Weather Rev. /: 3734– 3756. Available online: http, 3734. [Google Scholar]
- Ágústsson, H., H. Ólafsson, M.O. Jonassen and Ó. Rögnvaldsson. The impact of assimilating data from a remotely piloted aircraft on simulations of weak-wind orographic flow. Tellus A, 25421. Available online, 2542. [Google Scholar] [CrossRef]
- Stuefer, M., S. R. Freitas, G. Grell, P. Webley, S. Peckham, S. A. McKeen, and S. D. Egan. Inclusion of ash and SO2 emissions from volcanic eruptions in WRF-Chem: development and some applications, Geosci. Model Dev. 2013, 6, 457–468. Available online. [CrossRef]
- Espeholt, L. , and Coauthors. Deep learning for twelve hour precipitation forecasts. Nat. Commun. 5145. Available online, 5145. [Google Scholar] [CrossRef]
- Lam, R. , and Coauthors. GraphCast: Learning skillful medium-range global weather forecasting. ArXiv, Available online. [CrossRef]
- Nguyen, T., J. Brandstetter, A. Kapoor, J. K. Gupta, and A Grover. ClimaX: A foundation model for weather and climate. ArXiv, Available online. [CrossRef]
- Copernicus Climate Change Service (C3S). ERA5: Fifth generation of ECMWF atmospheric reanalyses of the global climate. Copernicus Climate Change Service Climate Data Store (CDS), /: Available online: https.
- Hersbach, H. , and Coauthors. The ERA5 global reanalysis, Q. J. Roy. Meteor. Soc. 2020, 146, 1999–2049. Available online. [CrossRef]
Figure 1.
Diagram of essential components of the WOD system and their interconnections. See text for further detail.
Figure 1.
Diagram of essential components of the WOD system and their interconnections. See text for further detail.
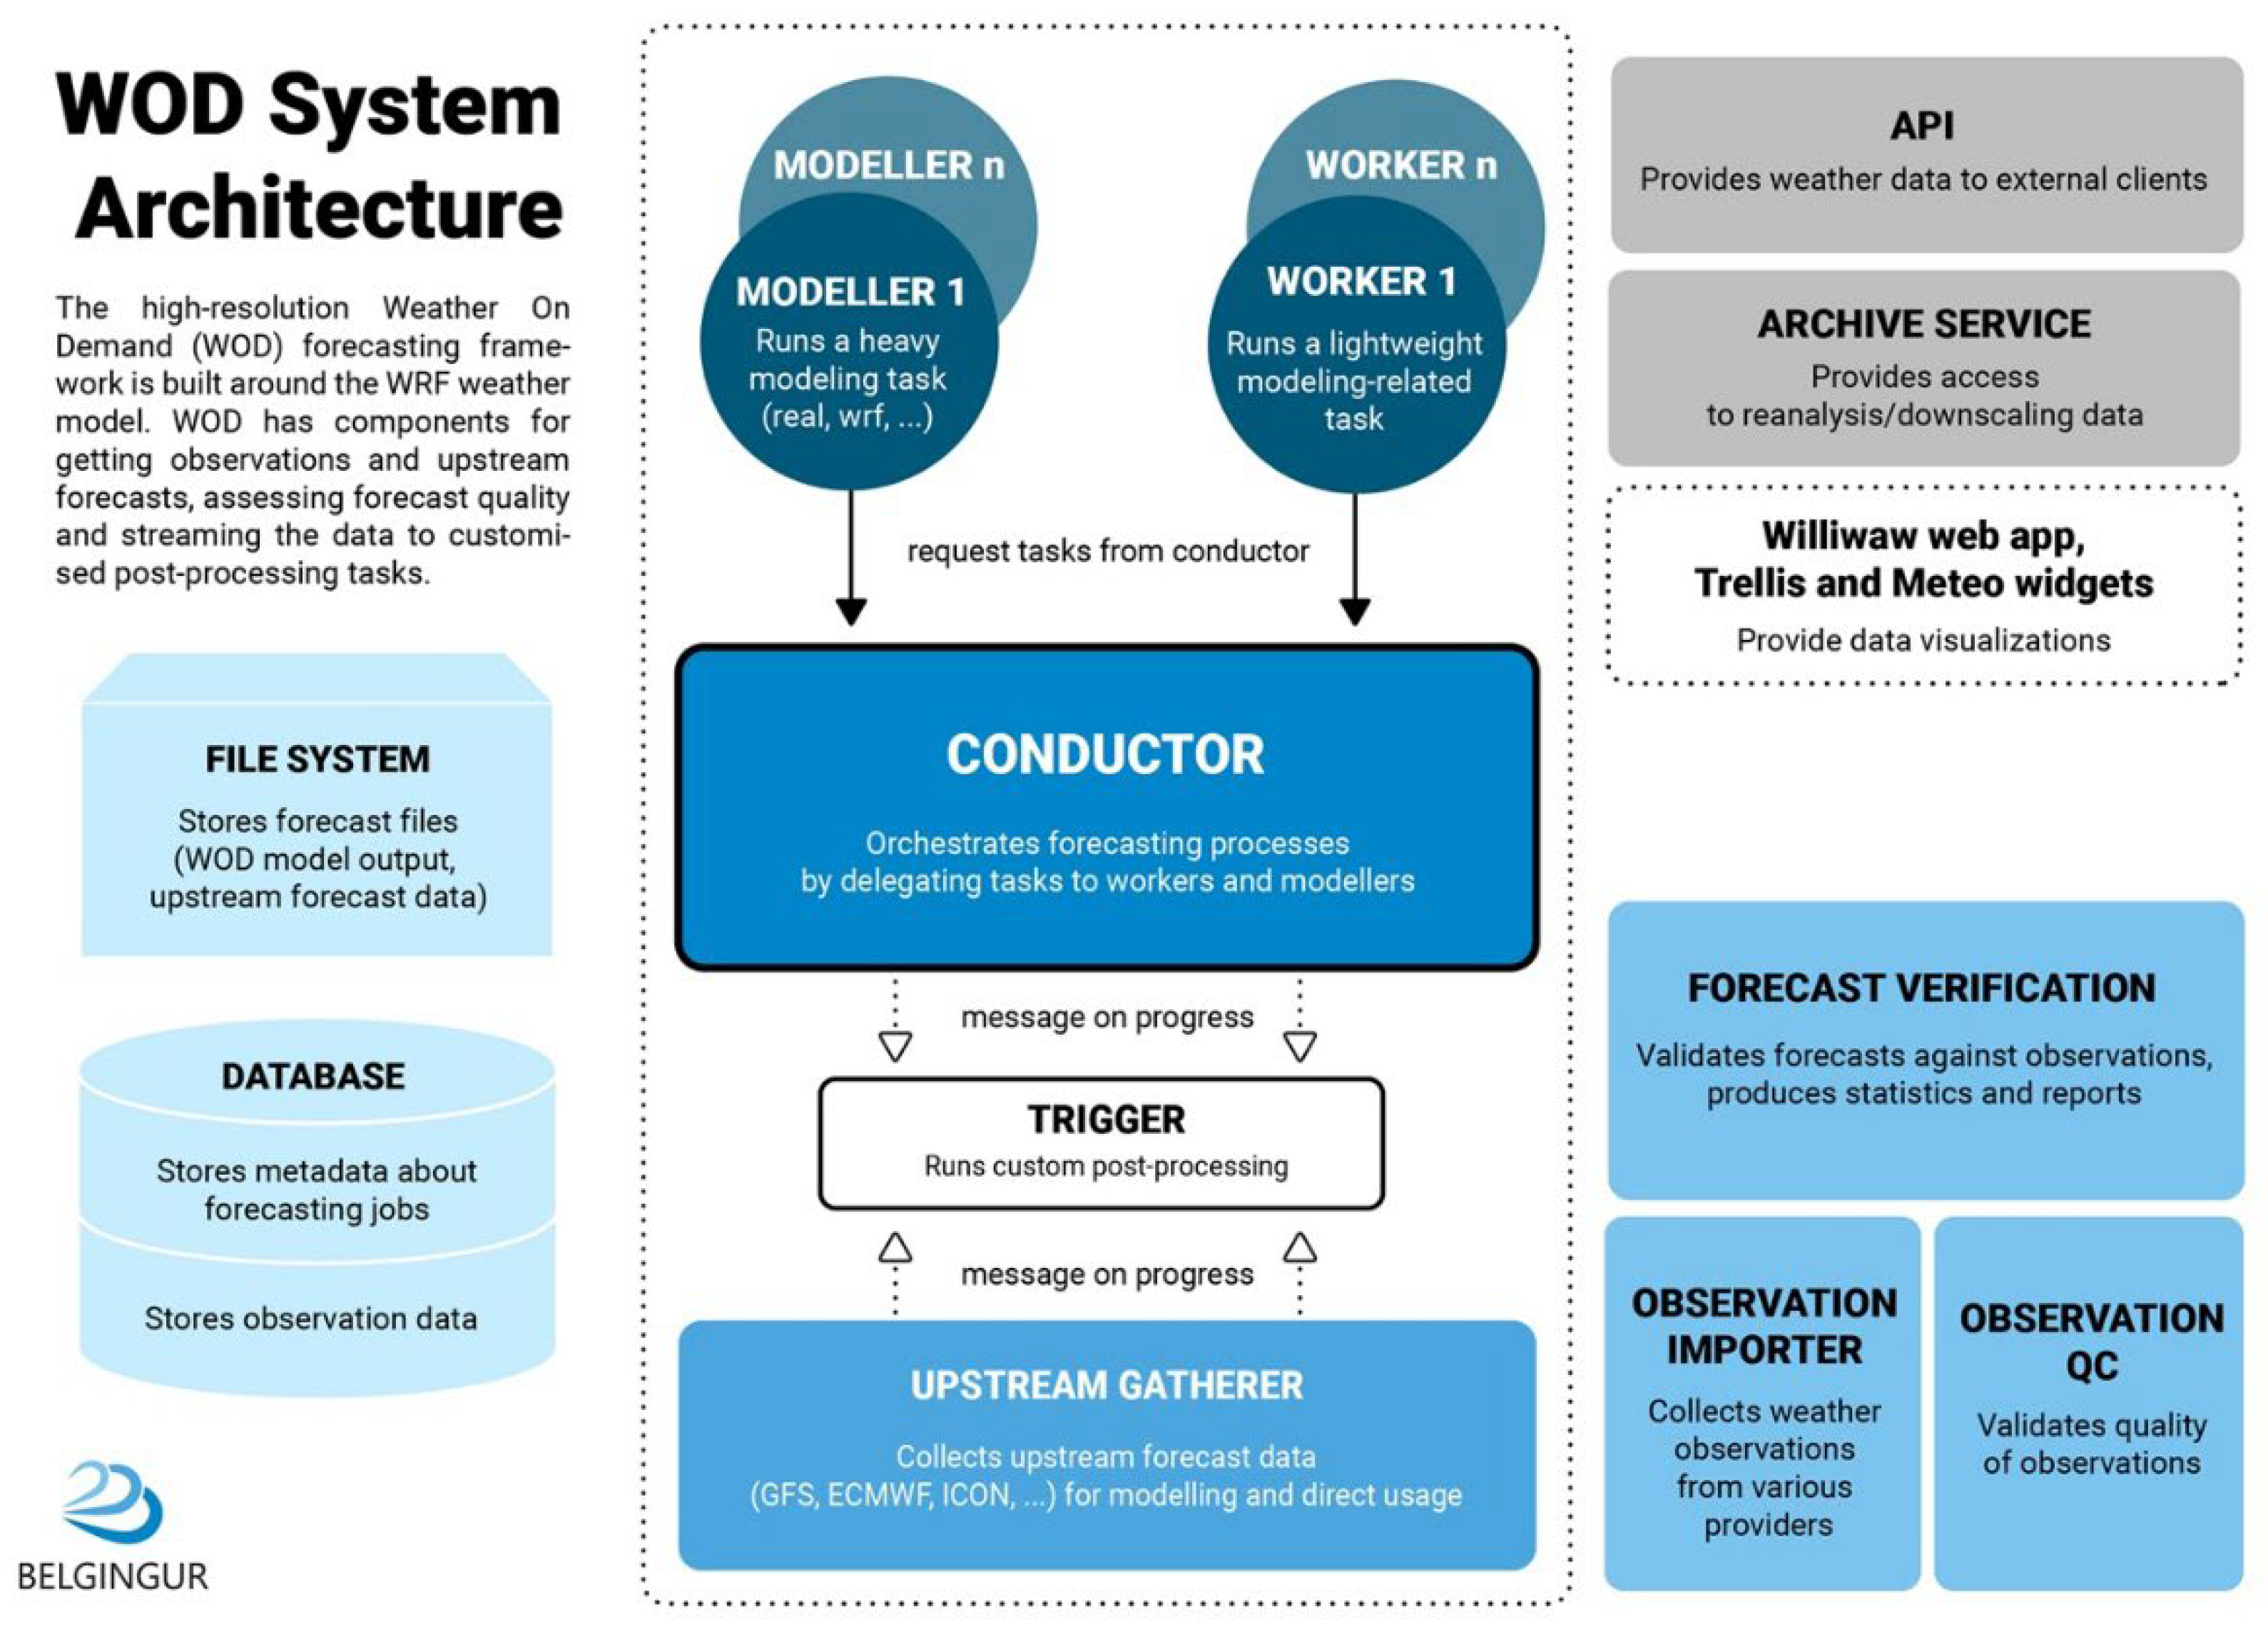
Figure 2.
Volcanic cloud (top panel) emanating from the Mt. Fagradalsfjall eruption, SW-Iceland, on 30 May 2021 (photo courtesy by Kristján Sævald) and a dispersion forecast (bottom panel) of SO2 at 500m AGL, valid at the time of the photoshoot, created by the WOD system. The red star shows the approximate location from where the photo was taken.
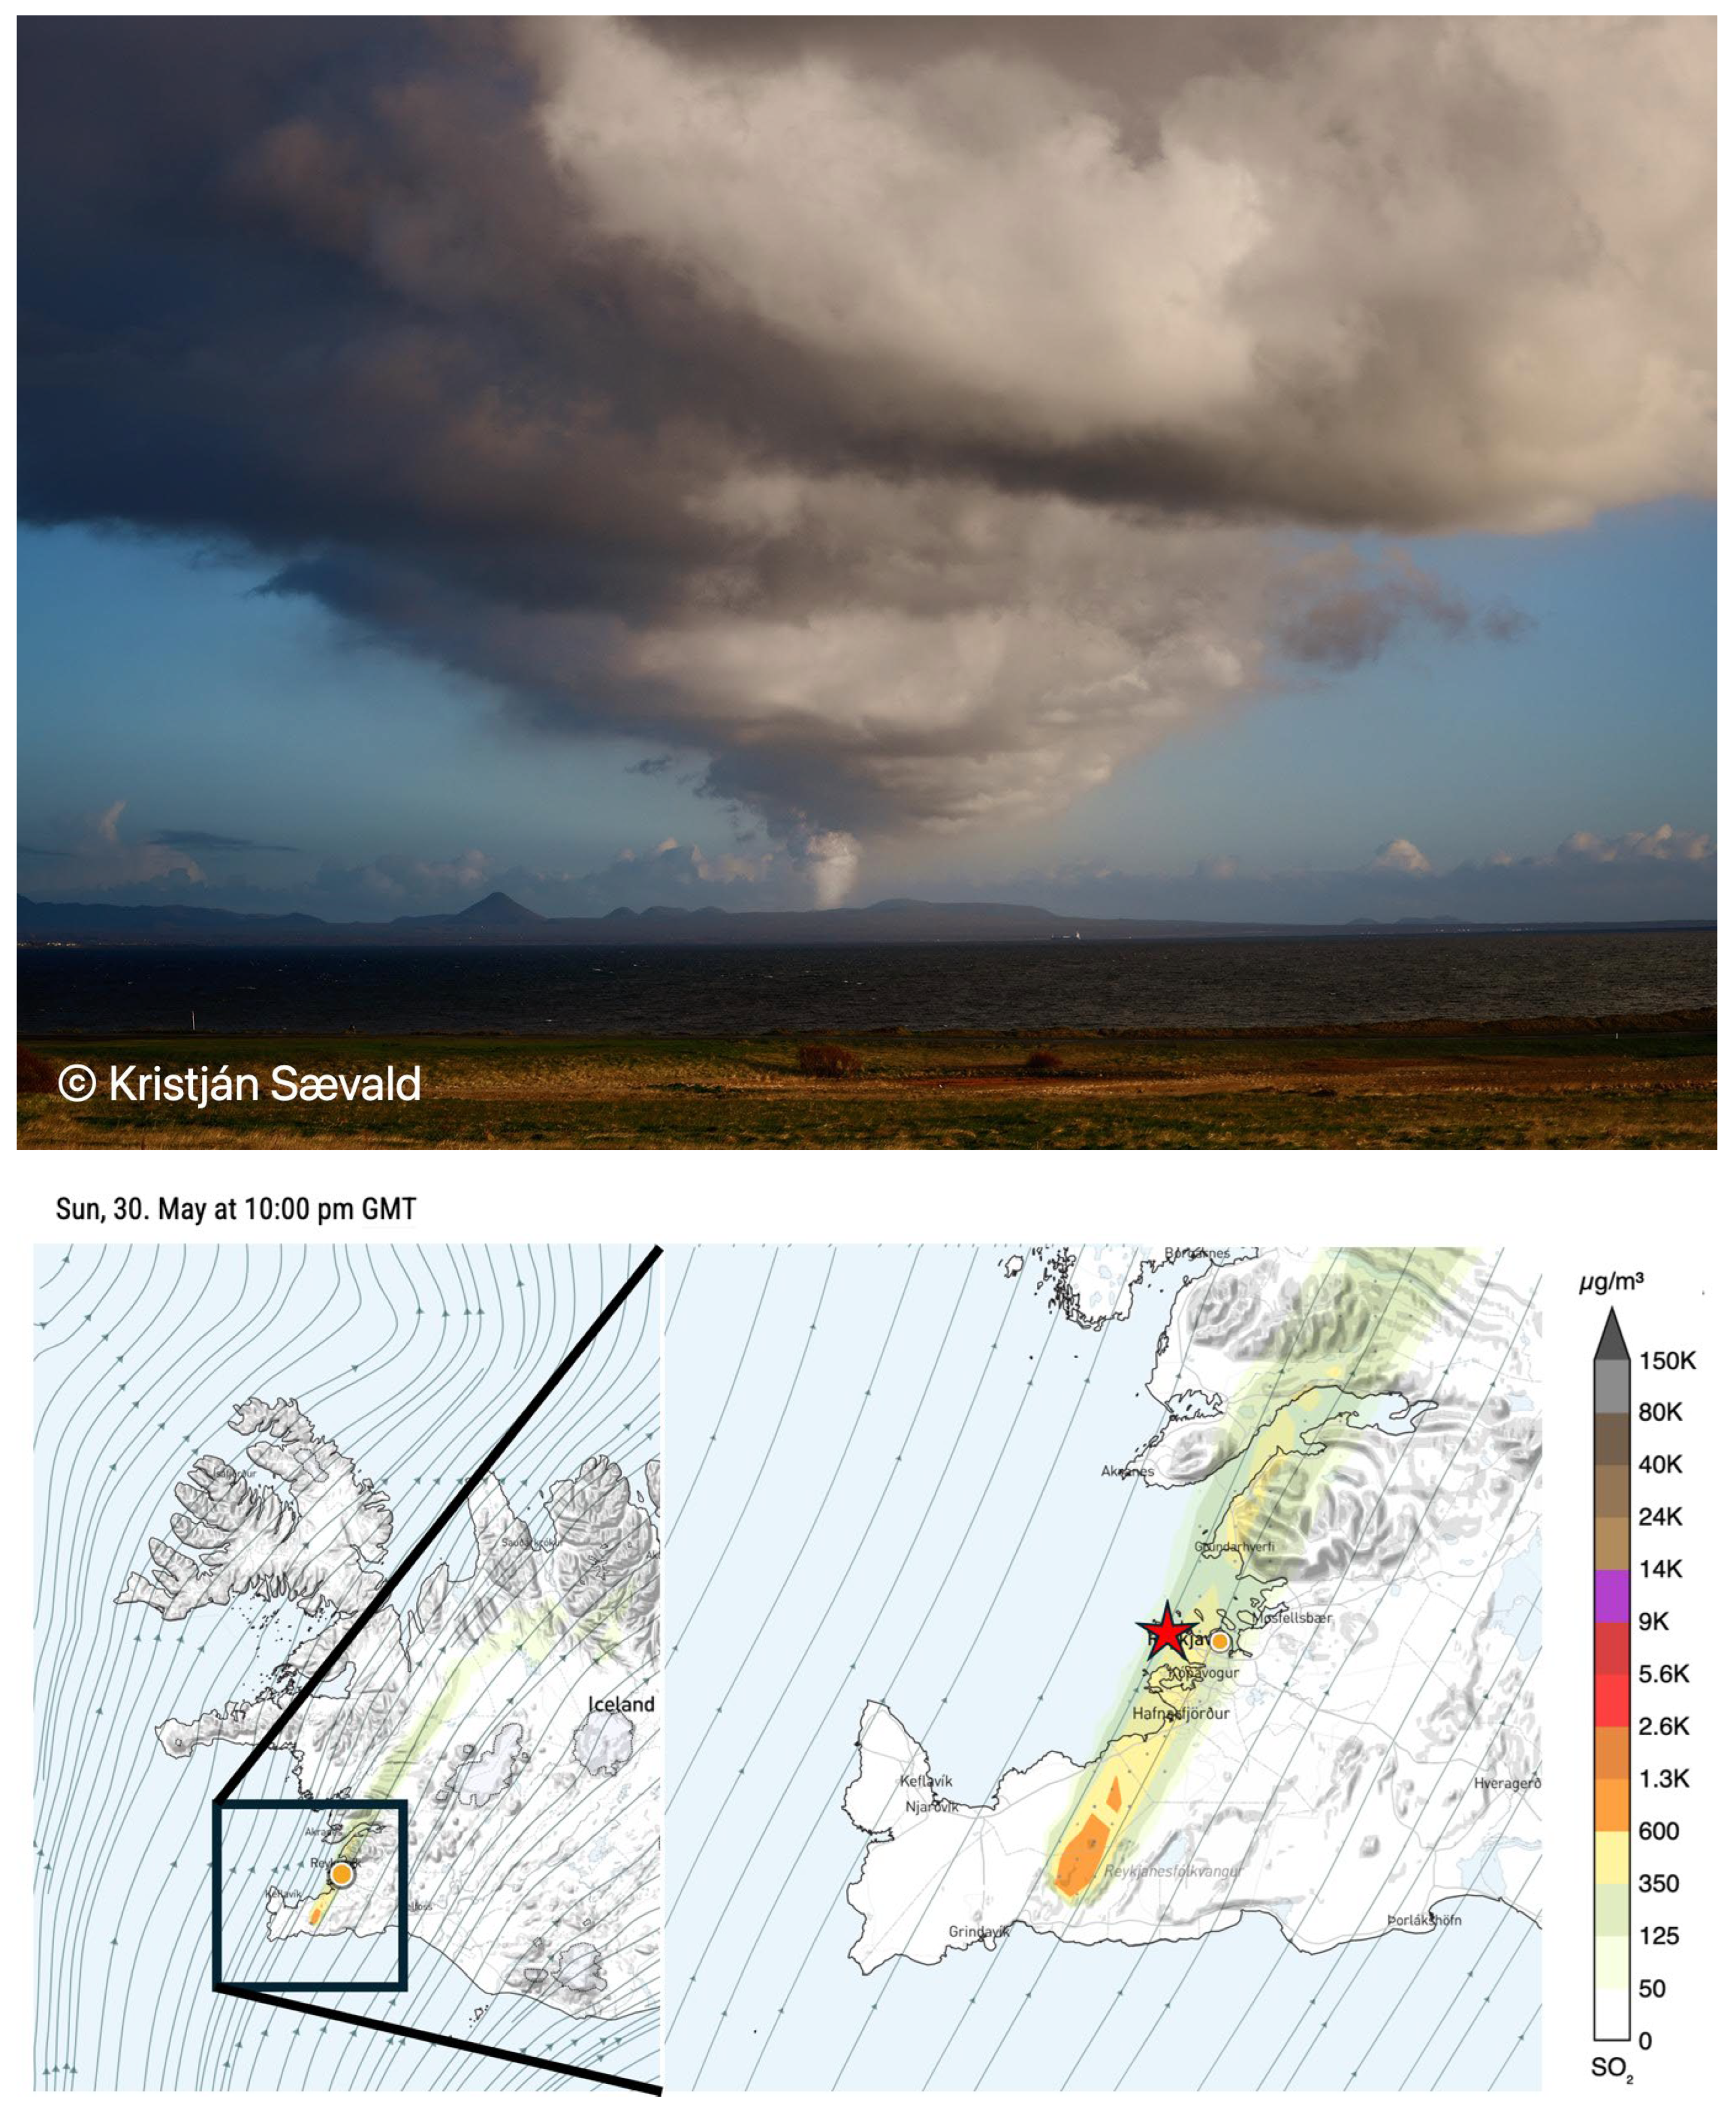
Figure 3.
Example of how the location of observation sides in Iceland, from a wide range of providers can be presented within the WOD framework. Screenshot taken from https://obs.belgingur.is on 11 July 2024.
Figure 3.
Example of how the location of observation sides in Iceland, from a wide range of providers can be presented within the WOD framework. Screenshot taken from https://obs.belgingur.is on 11 July 2024.
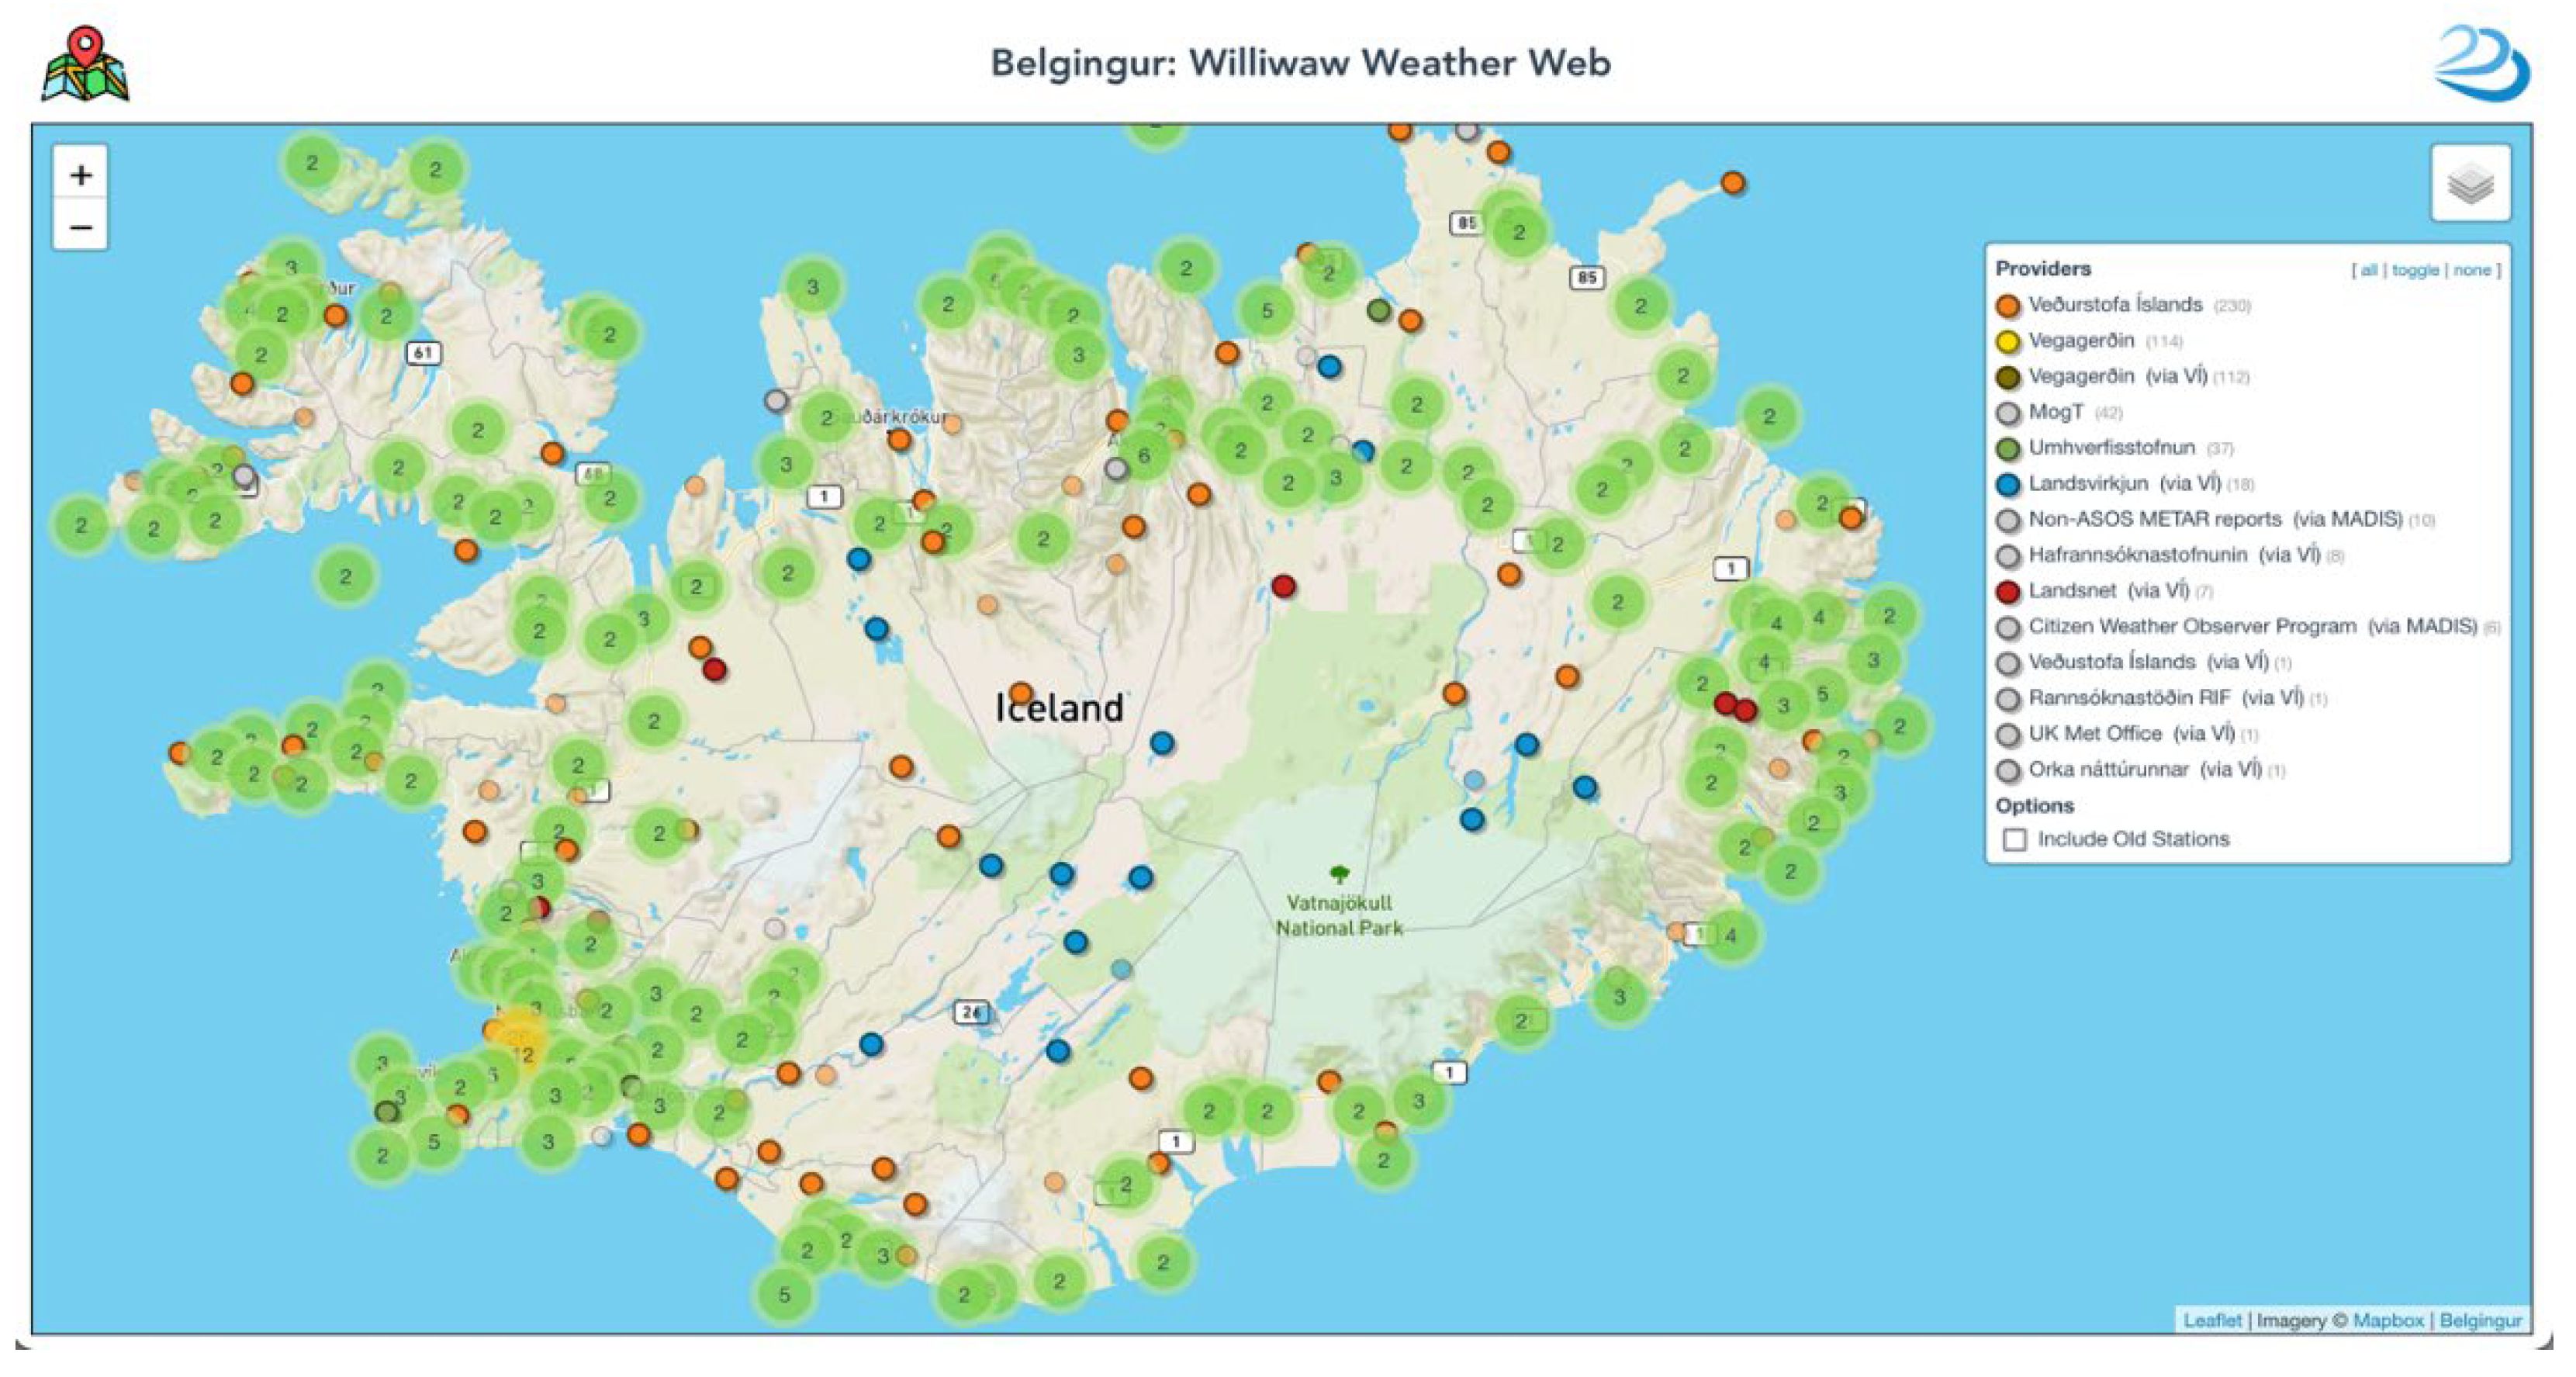
Figure 4.
Comparison between observations (left) of 24 hours rainfall [mm/day] over South America on 19 January 2023 estimated by the MERGE system of the Brazilian Center for Weather Forecast and Climatic Studies (CPTEC in Portuguese), the results of a one day ahead WOD system with Data assimilation (center) and the same results without data assimilation (right). Areas limit the main hydro basins used for hydropower in Brazil, and numbers show the average precipitation over each basin. Numbers in red are precipitation significantly below daily average, while blues are significantly above daily average.
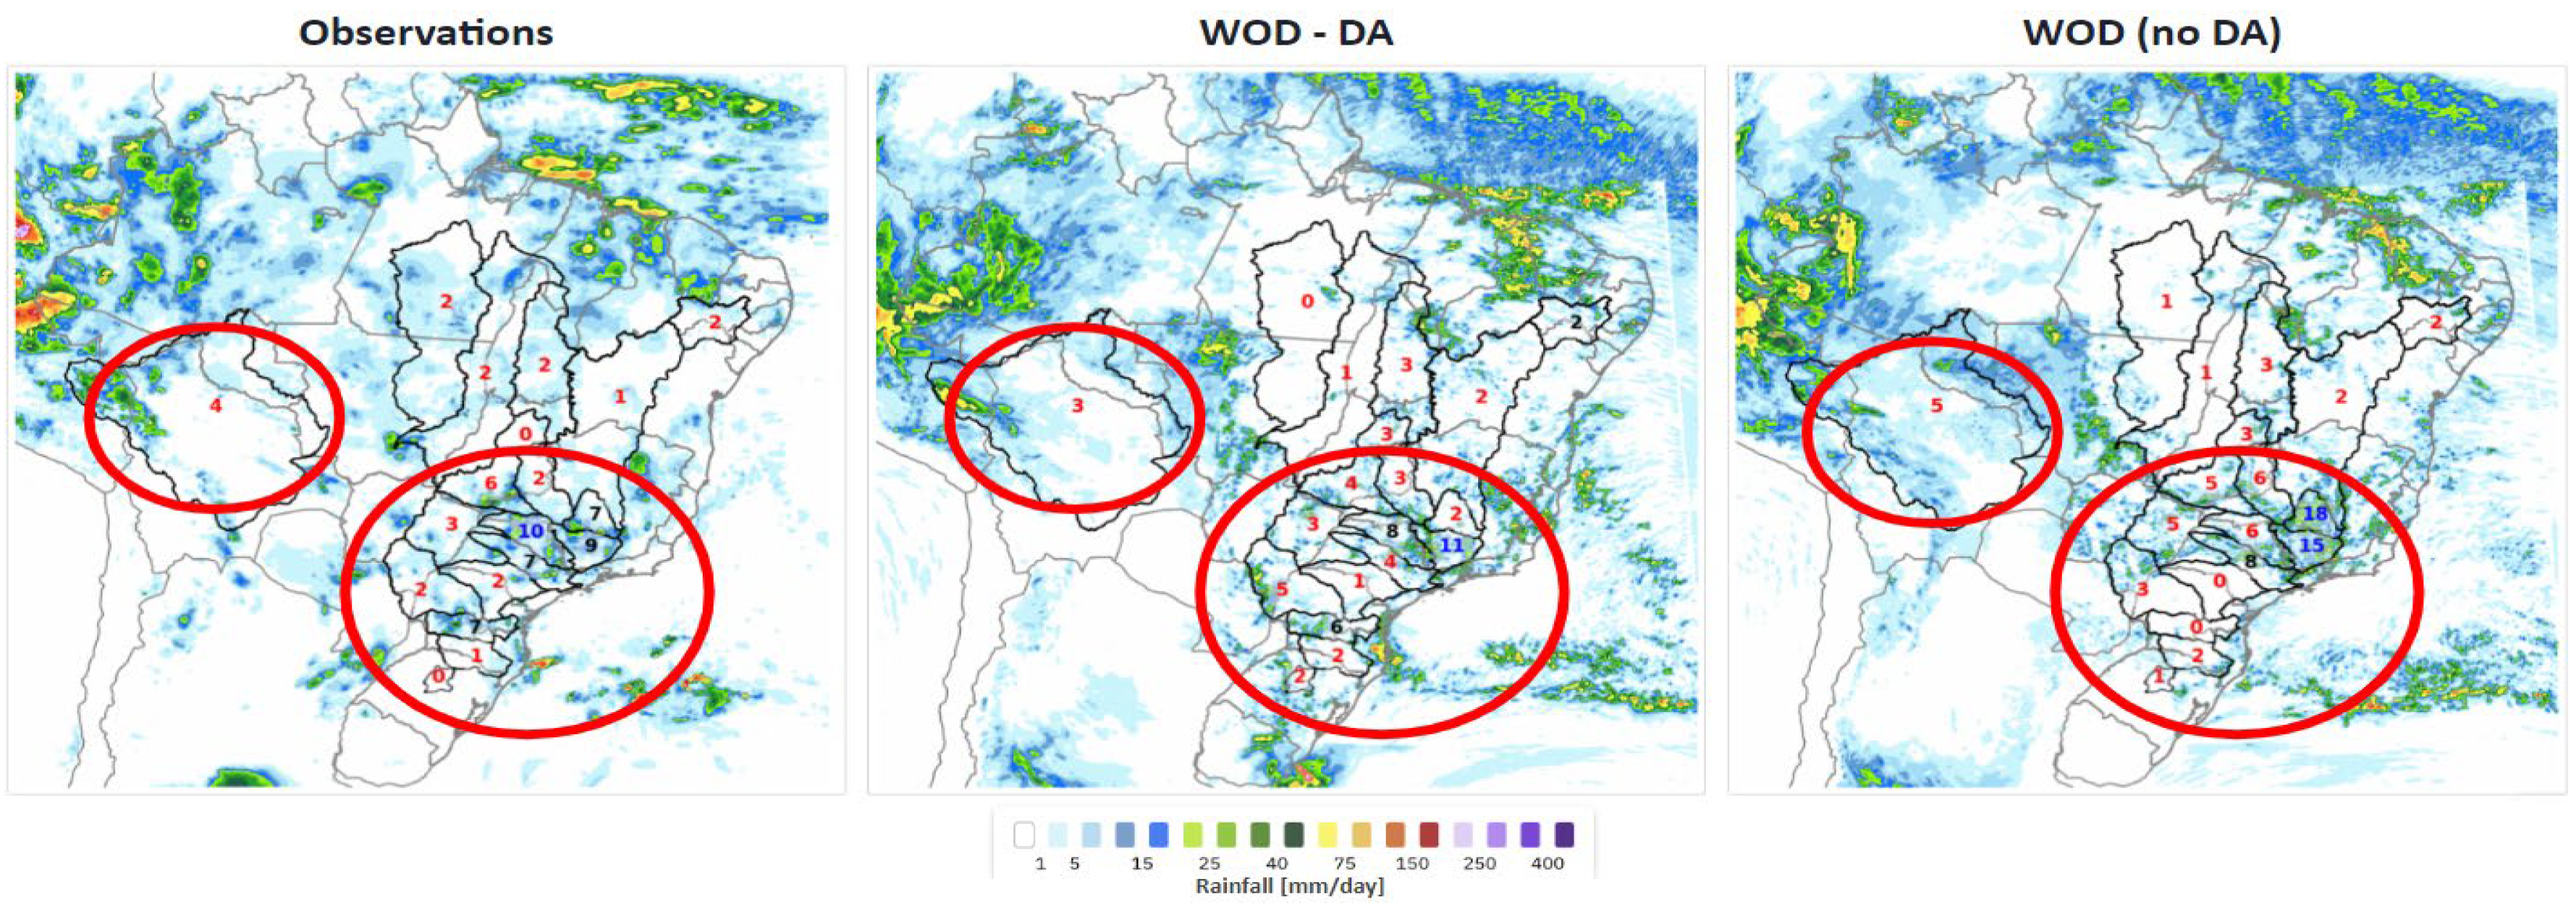
Figure 5.
Example of a power production forecast where WOD model output has been post-processed using a novel machine learning software that takes observed winds and power production, among other factors, into account.
Figure 5.
Example of a power production forecast where WOD model output has been post-processed using a novel machine learning software that takes observed winds and power production, among other factors, into account.
Disclaimer/Publisher’s Note: The statements, opinions and data contained in all publications are solely those of the individual author(s) and contributor(s) and not of MDPI and/or the editor(s). MDPI and/or the editor(s) disclaim responsibility for any injury to people or property resulting from any ideas, methods, instructions or products referred to in the content. |
© 2024 by the authors. Licensee MDPI, Basel, Switzerland. This article is an open access article distributed under the terms and conditions of the Creative Commons Attribution (CC BY) license (http://creativecommons.org/licenses/by/4.0/).
Copyright: This open access article is published under a Creative Commons CC BY 4.0 license, which permit the free download, distribution, and reuse, provided that the author and preprint are cited in any reuse.


