
Submitted:
27 November 2024
Posted:
29 November 2024
You are already at the latest version
Abstract
This work investigates the influence of crystallinity on the mechanical properties of needle punched non-woven flax/polylactic acid (PLA) biocomposites with different flax fiber contents. Biocomposites were fabricated by a compression molding adopting different cooling rates to understand the source of crystallinity and their contribution to the mechanical properties. Image-based analysis of the fiber distribution in non-woven preform indicates the probable origins of the residual porosities and the potential nucleation sites for crystal formation within the composites. The improvement of 25% and 100% in flexural modulus is observed for the composites with 40% and 50% of fiber volume fractions, respectively when subjected to lower cooling rate, which implies the significant influence of the residual void content on the brittleness of composites. The impact properties of the composites decrease about 11% when the cooling rate decreases to 1°C/min, which increases the brittleness of the composites. The induced impact and flexural properties of the composites are compared with those of other composites in the literature to emphasize their applicability to semi-structural applications.
Keywords:
Flax fibre
; Polylactic acid (PLA)
; Crystallinity
; Flexural properties
; Cycle time
; Thermal degradation
Abstract:This work investigates the influence of crystallinity on the mechanical properties of needle punched non-woven flax/polylactic acid (PLA) biocomposites with different flax fiber contents. Biocomposites were fabricated by a compression molding adopting different cooling rates to understand the source of crystallinity and their contribution to the mechanical properties. Image-based analysis of the fiber distribution in non-woven preform indicates the probable origins of the residual porosities and the potential nucleation sites for crystal formation within the composites. The improvement of 25% and 100% in flexural modulus is observed for the composites with 40% and 50% of fiber volume fractions, respectively when subjected to lower cooling rate, which implies the significant influence of the residual void content on the brittleness of composites. The impact properties of the composites decrease about 11% when the cooling rate decreases to 1°C/min, which increases the brittleness of the composites. The induced impact and flexural properties of the composites are compared with those of other composites in the literature to emphasize their applicability to semi-structural applications.
1. Introduction
Flax fibers as reinforcement are of great interest owing to their reasonable cost, low density, and high specific mechanical properties, and they are a replacement for glass fibers in composite materials. In many industrial parts, however, the applicability of flax fiber thermoplastic composites is limited to semi-structural applications or non-structural applications. These composites are manufactured using woven or non-woven (oriented or random) fabrics and mats. Although woven reinforcements are of great interest owing to high mechanical performance and drapability, their cost is also relatively higher when compared to their counterparts, i.e., non-wovens. The non-woven fabric reinforcements are becoming popular in automotive industry for semi-structural or non-structural components since the product cost becomes far less in comparison to woven fabrics parts which is one of the key driving factors in automotive sector. Moreover, these non-woven fabrics are easy to handle and provide greater formability potential. Additionally, the non-wovens with random fiber arrangement provide quasi-isotropic behavior, unlike oriented reinforcements [1], which can be tailored according to the required loading direction and the application. Furthermore, these random non-woven composites exhibit mechanical performance higher than the injection-molded composites [2] and can be molded into large complex shapes without drapability issues.
Thermoplastic flax composites are mostly manufactured using polyolefins matrices [3,4,5,6,7]. Using thermoplastics such as polylactic acid (PLA) or other bio-based thermoplastics can be interesting, owing to their easier end-of-life treatment [3,5]. Several studies investigated the feasibility of flax/PLA composites in the past two decades [8,9,10,11,12,13,14,15,16,17]. Most of these studies employed injection or compression molding to manufacture flax/PLA composites. The limitation of injection molding is that one cannot achieve high fiber volume fractions (Vf), whereas, with compression molding, Vf >30% can easily be achieved. Furthermore, the fiber length can be much shorter in the case of injection molded composites leading to low mechanical performance.
Compression moulding is one of the main manufacturing processes used to produce woven and non-woven polymeric composite laminates. Compression molding of composites can be sub-categorized into several manufacturing routes depending on the state of reinforcements. In the case of prepregs, the process is simple and straightforward: the prepregs are cut to the mold shape and consolidated under pressure and temperature [18]. In the case of film stacking, the influence of through-thickness permeability comes into play which significantly affects the quality of the composites [19,20]. A higher processing temperature can be imposed to avoid impregnation issues and achieve composite parts with low residual void content; however, temperatures higher than 200°C are not advised for flax fibers leading to their thermal degradation [7]. Another solution is using commingled fabrics since they reduce the flow path and shorter cycle times which is a prerequisite for high voluminous production. Commingled fabrics can either be in the form of fabrics with hybrid yarns or needle-punched non-wovens. In the case of hybrid yarns, thermoplastic and natural fiber yarn are twisted to maintain the form and facilitate weaving, but this leads to impregnation and mechanical performance issues. Since the natural fiber yarn is twisted, the resin penetration can be difficult, leading to high residual void content. This arrangement also leads to a significant drop in the mechanical properties of the composites [21,22,23].
Polylactic acid (PLA) is a semi-crystalline polymer whose properties are highly sensitive to cooling rates imposed during composite processing. Rapid cooling results in reduced crystallinity by limiting the time available for crystal growth at nucleation sites, such as flax fiber surfaces, whereas slower cooling promotes crystallization, allowing for the development of more ordered crystal structures [24,25]. Although rapid cooling is often favored to decrease production time, it can impact mechanical properties detrimentally if crystallization is insufficient. This relationship between cooling rate and mechanical performance has been well-characterized for glass fiber-reinforced composites [26], yet remains underexplored for flax fiber-reinforced PLA composites.
The relationship between the degree of crystallinity and flax fiber content in PLA composites has been sparsely studied [25,27]. While several investigations have detailed the crystallization behavior of PLA in the presence of natural fibers [28,29,30], the scope of this current work is specifically limited to flax fibers at high mass fractions. Xia et al. [25] demonstrated that increasing flax fiber content enhances the transcrystallinity of the PLA matrix, attributing this to the nucleating effect of the fibers. Similarly, Aliotta et al. [27] reported that a higher fiber content leads to increased PLA crystallinity, which positively impacts the mechanical properties of the resulting composites. Furthermore, Bayart et al.[24] improved the crystallization and interfacial adhesion of flax/PLA composites by incorporating titanium dioxide. However, these studies lack comprehensive analyses of the interplay between crystallization kinetics, composite quality, and the mechanical performance of flax/PLA systems. This study aims to address these gaps by systematically investigating the contribution of crystallization kinetics to the mechanical properties of non-woven flax/PLA composites with high fiber mass fractions (Mf >30%). The research involves characterizing the mechanical and thermal properties of the composites and comparing the results with existing literature. Furthermore, the crystallization kinetics are modeled using established analytical approaches. The non-woven composites are fabricated under consistent thermal processing conditions to ensure reproducibility, and their microstructures are examined to establish correlations between the process cycle, crystallinity, and resultant mechanical properties.This comprehensive approach provides a deeper understanding of how thermal processing affects the structural integrity and applicability of flax/PLA biocomposites in semi-structural applications.
2. Materials and Methods
2.1. Reinforcement and Matrix Materials
In this study, needle punched non-wovens are prepared using the commercial PLA filaments from Max model, France, and flax fibers from Procotex SA, France. The preparation steps of dry-laid fabrics can be seen in Figure 1. These fibers were delivered in an opening Laroche system using two Laroche feeding rooms. The fibers were weighed to provide an excellent blend to a carding system. The fibers were laid down on a conveying belt and superposed to be fed to the opening system. The feeding system was composed of one pin cylinder that nibbled two layers of fibers and fed a constant and open fiber blend. The fibers were then fed to carding machine (Excelle Andritz) composed of a pre-working unit with three carding groups, the main cylinder with five carding cylinders and two doffers. The veils coming from these cards were then cross-lapped to form non-woven mats that were bonded through needle punching. The target areal weight of the fabrics was set to 175g/m2 with a nominal thickness of 1.8mm. The actual areal weight of the fabric was measured by weighing at least three large fabric samples of dimensions of 500x500mm². Furthermore, to investigate the spatial distribution of flax and PLA fibers within the non-woven, the optical measurements of fiber content were carried out according to the method suggested by Cosson [31]. This approach provides information concerning the distribution of fibers and the fiber orientations within the fabric, which can then be used to predict the degree of anisotropy within the composite properties.
2.2. Fabrication of Composite Laminates
In this study, the composite laminates were manufactured using the compression molding technique. The non-woven fabrics were cut to the mold dimensions, i.e., 250 x 150 mm2, and were stored in a conditioning room (23°C and RH 50%) for at least 24 hours and were not dried before manufacturing. Owing to varied areal weight of fabrics (see Table 1), the number of layers in each composite plate was not maintained constant. Nevertheless, the total weight of the stack was maintained constant for each plate. The weight of the stack was calculated based on the fiber densities of flax and PLA mentioned in section 2.2. The cavity height of the mold was 2mm. The non-woven fabrics were stacked and transferred onto a preheated hydraulic press (PEI, France). For rapid cooling, the mold was immediately transferred to another hydraulic press (Douloets, France) maintained at 23°C. All the composites were demoulded when the mold temperature reached about 40°C. The adopted consolidation cycle is shown in Figure 2. In this study, a stepped consolidation cycle was selected based on the recommendations of a previous study [7,32]. A stepped consolidation cycle is advantageous for two reasons; since the preform is compacted sequentially, the polymer flow will induce lower drag forces on the fibers, avoiding significant movement during the consolidation step. This approach also ensures that the entrapped air to move out easily. Furthermore, if a sudden pressure is applied on a smaller surface area, there could be significant squeeze flow, which would induce defective parts. At least three plates were manufactured for each composition.
2.3. Void Content Measurement
The density of the non-woven composites was measured using the Archimedes principle with ethanol as the test liquid. The samples of dimensions 20x20mm² were cut from the plate randomly to report the average values. Using the apparent density of composites, the residual void content within the composites was estimated according to the CRAG report [33]. The density of flax and PLA were assumed to be around 1.5 g/cm3 [34] and 1.24 g/cm3 [32], respectively.
2.4. Thermal Properties Characterization
2.4.1. Differential Scanning Calorimetry (DSC)
Differential scanning calorimetry (DSC) was used to identify the crystallization kinetics of the pure polymer, i.e., PLA and flax/PLAnon-wovens. The DSC test samples were hermetically sealed in an aluminum crucible and weighed about 6-8mg. The samples were subjected to a sequential heating and cooling cycle. The heating rate for all the tests was maintained constant at 5°C/min. To understand the nonisothermal crystallization, the samples were subjected to three different cooling rates, viz. 1°C/min, 5°C/min and 10°C/min. On the other hand, the isothermal crystallization was investigated at three different temperatures, viz., 90°C, 100°C, and 120°C. The crystallinity (χ) was calculated based on the melting (ΔHm) and cold crystallization enthalpy (ΔHcc) of the polymer using the following equation
where ΔH100%PLA corresponds to the complete melting enthalpy of PLA, equivalent to 93.2J/g, and ϕ corresponds to the weight fraction of the flax fibers. Generally, the mathematical model suggested by Avrami [35] should be used to model the crystallization kinetics of flax/PLA composites. Avrami suggested a mathematical relation between the polymer’s relative crystallinity(χr) and the crystallization time (t). The Avrami equation does not apply to cases with primary and secondary crystallization. This equation only applies to the linear part of the Avrami plot [36,37]. However, owing to the nonlinearity of relative crystallinity with time, a parallel Avrami model that describes both primary and secondary crystallization is considered in this study [35]. Equation 2 describes the primary and secondary crystallization of the polymer and is generally used for PEEK [35]
where χr is the relative crystallinity of the polymer at time t, w1, and w2 are weight factors corresponding to primary and secondary crystallizations, ki=1,2 is the crystallization rate constant, and ni=1,2 is the Avrami exponent. The weight factors are defined as w1+w2=1, indicating that in the absence of secondary crystallization, Equation 2 will transform into the conventional Avrami equation [35]. The coefficients in Equation 2 were identified using curve fitting in Python.
The Avrami equation is applicable for isothermal conditions, and the equation in its current form cannot be used for nonisothermal conditions. Generally, in order to reduce the processing time, the isothermal steps are avoided. Hence the crystallization occurs during the nonisothermal step, i.e., the cooling step of the process cycle. In order to understand the nonisothermal crystallization kinetics, Ozawa [38] suggested a model for the nonisothermal step by dividing it into infinitesimally small isothermal steps. This was further modified by Liu et al.[38] by combining Ozawa and Avrami equations and equivocally called Mo’s model and is written as follows:
where β is the cooling rate, n and m are Avrami and Ozawa coefficients, respectively, K(T) is the crystallinity rate, Z is the rate constant considering both nucleation and growth. Equation 3 was further simplified into Equation 4 where F(T) refers to the value of the cooling rate at a unit crystallization time at a given degree of crystallinity.
2.4.2. Thermogravimetry (TGA) Analysis
To study the thermal stability of the flax/PLA composites, thermogravimetry analysis (TGA) was performed using a Mettler Toledo TGA/DSC1. The test samples had a mass between 6-9mg. The samples were placed in a ceramic crucible and were heated at a constant rate of 10°C/min from 25°C to 500°C under inert atmosphere. At least three samples were tested for each composition to report the average values.
2.5. Mechanical Performance
2.5.1. Flexural Tests
The three point flexural tests was performed at room temperature in a Zwick/Roell Z030 Universal Testing Machine fitted with a 30 kN static load cell. The flexural properties (flexural strength and modulus) of compression-molded materials were retrieved according to sample dimensions and support span set respecting the British standard BS EN ISO 178:2003. Samples were loaded under displacement control at 5mm/min. Flexural strength and moduli were evaluated according to Equations 5 and 6.
where L is the length of the specimen, b and d are the width and thickness of specimen, respectively, m is the ratio between the change in force F and the change in displacement s.
2.5.2. Impact Tests
The impact characteristics of composite samples were determined with a Charpy impact pendulum device type 5102 (Zwick GmbH, Ulm, Germany) according to EN ISO 179: 1997, at a room temperature of 21°C. Flatwise positioning of the compression molded un-notched samples was adopted, and a strike energy of 1 Joule was used to test five specimens (80 mm x 10 mm) for each composite type at a bearing distance of 48 mm.
3. Results and Discussion
3.1. Properties of Flax/PLA Non-Wovens
This section presents the properties of non-wovens, such as the areal weight, thickness, and tensile strength (see Table 1). As mentioned in section 2.1, the target areal weight of the fabrics has been set to 175g/m². However, deviations occurred due to the intrinsic variability of the carding process, which can lead to non-uniform distribution of flax and PLA fibers. Such variability is particularly distinguished in non-woven systems, where the fiber orientation and dispersion directly influence the mechanical performance of the composite, which is a phenomenon previously documented in the literature [14,24,32,39].
These variations can be caused due to the non-uniformity of flax, PLA, or both fibers. An initial trial with unconsolidated preform was made, but the distribution of fibers in thickness direction made it difficult to quantify the variations. For this reason, single-layer preforms of dimensions 250x150mm² were consolidated at 170°C and rapidly cooled to ensure no crystals were formed. These single-layer composites were placed against a light source (a 17-inch LED laptop screen) to capture the images. These images were further processed using MATLAB to report the local variations. The image treatment steps are described elsewhere [31]. In Figure 3, the distribution of flax fibers is presented. The contour plot represents the normalized fiber distributions of the flax fibers within the preform. In the case of F40, the fibers are not well distributed, thus resulting in matrix-rich zones (indicated by dark blue zones), whereas F60 has rather uniform distributions with relatively low matrix-rich zones. These differences in fiber distribution can significantly affect the local impregnation and subsequent mechanical properties. Owing to these fiber clusters, the local rigidity of the preform during compaction can increase, leading to low compaction ratios. This local rigidity can be demonstrated by the void content variations within the composite plate discussed in section 3.3.
3.2.1. Crystallization Kinetics
In order to understand the crystallization kinetics of flax/PLA composites, as discussed in section 2.4.1, Avrami and Mo’s equations were used. For the Avrami model, the relative crystallinity of the material was calculated using Equation 6
where Q(t) is the heat flow at time t and t∞ is the total isothermal duration. The relative crystallinity is then used to understand the different crystallization kinetics of flax/PLA composites.
Table 2 contains the fitting parameters for the parallel Avrami equation, as presented in Section 2.4.2. It can be noticed that the crystallization of PLA occurs in two stages. The primary crystallization refers to the linear part of the curve, which is induced by the growth of crystal lamellas from nucleation sites. In contrast, secondary crystallization is linked to the completion of spherulite formation [40]. The linear part of the Avrami plot can be directly linked to the initial accelerated crystal growth. In works related to the study of PEEK crystallization, it was suggested to use the linear part of the curve to identify the Avrami exponent (n1 and n2) and use them to identify the other unknowns in Equation 2. In this study, we adopted a universal approach, where the model was fit to the whole curve without any presumptions concerning the Avrami exponents. Generally, the crystal growth and the number of crystals are governed by the primary crystallization. The molecular arrangement is more significant at this phase than at the secondary crystallization phase. The crystals would gradually grow in local zones until the maximum extent is reached, and the completion of this crystallization can be classified as secondary crystallization [41]. In Equation 2, the Avrami exponent n provides information concerning the nature of nucleation and growth process of the crystals during the cooling phase. It is generally accepted that if the n value is close to 3, the growth of crystal structures is three dimensional, whereas if the value is between 2-3, the growth is two dimensional, such as circular lamellas. In Table 2, the n1 values indicate that the initial growth of crystals was two dimensional. Since most nucleating sites are on the surface of flax fibers as expected, crystals tend to form 2D structures quickly. The n2 values indicate that the nucleation is sporadic in nature and the crystals grow into 2D or 1D lamellar aggregates. The addition of flax fibers to PLA significantly improved the crystallization kinetics; however, no further improvement in crystallinity can be noticed. It has been previously reported that a threshold of flax content exists after which no significant improvement in crystallinity can be observed [42]. In this study, we can notice a similar phenomenon where the crystallization kinetics seems to be the same for all three flax/PLA non-wovens.
It should also be noted that crystallinity growth depends on the formation of crystals (sporadic or instantaneous growth). This growth can be defined using the Avrami coefficient k in terms of potentially available nuclei N and crystal growth rate G. The crystal growth rate can be defined using the Hoffman-Lauritzen equation as described in Equation 7,
where G0 is an exponential factor, U* is the activation energy, T∞ is the temperature where all activity ceases, and this is assumed to be about 30°C lower than Tg (glass transition temperature) of the material, R is the universal gas constant, Kg is the activation energy of nucleation for a crystal with a critical size, ΔT is the degree of supercooling which is the difference between the equilibrium melting temperature (Tm0) and crystallization temperature (T). Each parameter is described [40], and it is out of this article’s scope to explain its origin. Equation 6 may seem to be complex because it contains several parameters; however, it can be explained as follows; the first part of the equation defines the contribution of the molecular chain diffusion, and the second part defines the contribution of the nucleation. The equilibrium melting temperature (Tm0) was identified using the Hoffman-Weeks approach [43]. Equation 6 estimates the growth rate of a crystal with and without the presence of flax fibers by using the values in Table 3 [44]. In Figure 4, the increase of growth rate with crystallization temperature can be observed. It should be noted that values in Table 4 do not represent the actual PLA used in the current study; nevertheless, a PLA with a similar melting temperature has been taken as a reference. The growth rates for different non-wovens at a given temperature overlap significantly. This overlap can be caused by the identical G0 and Kg used for all three non-wovens. In reality, G0 should be measured optically for each case, and then the values should be used for precise representation of crystal growth. Values from the literature were adopted in this study due to the technical limitations.
Nonisothermal crystallization kinetics (Figure 5) were modeled using the approach of Mo’s model. This model has been identified to be more accurate than conventional Avrami and Ozawa models in representing secondary crystallization kinetics (see Equation 4). F(T) is the cooling rate parameter which can be physically described as the cooling rate required to achieve a relative crystallinity at unit crystallization time. In other words, a higher value of F(T) indicates that it takes a slower cooling rate to achieve crystallization. In Table 4, the coefficients of Equation 4 are presented. The F(T) values for the composites are much smaller than those of pure PLA matrix, indicating that the crystallization process is faster for a given cooling rate. This is expected since fibers act as nucleating sites and enhance the crystallization rate, as observed in the case of isothermal crystallization.
3.2.2. Thermal Degradation Analysis
Figure 6 illustrates the thermograms from thermogravimetric analysis (TGA) of various flax/PLA composites, including pure flax and pure PLA for comparative analysis. These thermograms reveal distinct thermal degradation patterns, showing that the majority of mass loss occurs around 300°C for all specimens, indicative of thermal decomposition stages for both the flax and PLA components. Initial degradation begins at approximately 220°C, aligning with the known thermal instability of flax fibers at elevated temperatures [7]. As flax fiber content increases, the thermal stability of the composites improves slightly, attributed to the higher residual char content which acts as a thermal barrier, slowing down further decomposition. The initial mass reduction below 100°C is likely due to the evaporation of inherent moisture within the specimens, a common characteristic in natural fibers. The mass loss observed between 100°C and 200°C can be linked to the decomposition of organic compounds such as pectin, lignin, and waxes within the flax fibers, contributing to a gradual weight decrease in the flax and its composites [45]. This breakdown of organic matter occurs prior to the onset of main degradation, which involves the degradation of PLA matrix and further breakdown of cellulose. Interestingly, the thermal responses of F50 and F60 composites are nearly identical, implying two possible scenarios: a non-uniform distribution of flax and PLA in the preform, or a threshold beyond which additional flax content no longer significantly impacts thermal stability. Higher flax content may provide enhanced stability by increasing the amount of char, which acts as an insulating layer, slowing the rate of thermal degradation in the composite. Additionally, the increased char residue at high flax contents could imply a protective effect, further enhancing the thermal stability and integrity of the composite materials during prolonged thermal exposure. These findings emphasize the role of flax content in improving composite performance under thermal stress, which is crucial for applications where elevated temperatures or thermal endurance is required.
3.3. Mechanical Properties of flax/PLA Composites
3.3.1. Void content and Crystallinity of Composites
In Figure 7, the residual void content and crystallinity of flax/PLA composites are presented, highlighting critical structural characteristics influenced by the mass fraction of flax fibers within the preforms. As hypothesized in Section 3.1, the void content increases with higher flax fiber loading. This rise in void volume fraction can be attributed to two primary factors: the spatial distribution of flax fibers and the mechanical behavior of the preform under compaction. Firstly, the distribution of fibers within the composite can lead to localized agglomerations of flax fibers, forming a more tortuous path for the PLA melt to penetrate and fully impregnate the matrix. This phenomenon not only hinders uniform PLA distribution but also creates micro-regions within the composite where resin infiltration is incomplete, leading to air entrapment. Secondly, the accumulation of fiber clusters increases the local rigidity of the preform, which restricts compaction and can result in uneven density across the composite. This variability in compaction can further contribute to the development of discrete compaction zones, with varying degrees of fiber packing and air retention. The void content in these composites can be classified into two primary categories: air-entrapment voids and fiber-matrix interfacial voids. Air-entrapment voids are primarily due to the incomplete displacement of air pockets during the impregnation phase. Meanwhile, voids at the fiber-matrix interface arise due to insufficient bonding between flax fibers and PLA. These interfacial voids can significantly influence the composite’s mechanical properties, as they weaken load transfer between the fibers and the polymer matrix, reducing the overall structural integrity [46]. Additionally, the degree of crystallinity in PLA is sensitive to fiber content and distribution. Higher fiber content can increase nucleation sites for crystallization in the PLA matrix, potentially enhancing its thermal stability and stiffness. However, an excess of voids due to poor impregnation and interfacial gaps may disrupt the crystallinity, as air pockets interrupt the molecular alignment needed for uniform crystallite formation.
3.3.1. Flexural Properties
The influence of cooling rate on the flexural properties of flax/PLA composites can be observed in Figure 8. F40 composites with a cooling rate of 5°C/min exhibited significantly higher flexural modulus than composites manufactured with a cooling rate of 1°C/min (see Figure 8). The trend for the other two flax/PLA composites was different. With an increase in the cooling rates, the F60 and F50 composites showed a drop in flexural modulus, which is coherent with the cooling rate and degree of crystallinity. The F60 composites exhibited lower properties than the F50 composites. This can be caused by the lack of impregnation and increased void content within the composites, as suggested in section 2.2. It can thus be inferred that the distribution of PLA and flax fibers with the non-woven fabric was non-uniform, leading to fiber-rich and matrix zones. However, it has been observed that the flexural properties obtained in the current study are slightly higher than the values reported in the literature [47,48].
A global trend in the flexural strengths based on the cooling rate was not observed. The flexural strength of F40 composites decreased with a decrease in the cooling rate, whereas the flexural strength of F60 composites increased with a decrease in the cooling rate. It can be hypothesized that this difference in behavior can be linked to the flax fiber content. With the increase in the content of flax fibers, the probability of availability of nucleating zones increases significantly, enabling easier crystallization of PLA and resulting in a higher degree of crystallization. Similar reasoning can be applied to F50 composites, where the difference in the strengths and moduli can be noticed. The trends are unclear when the cooling rate has been modified to generate composites with higher crystallinity. For F60 composites, the flexural modulus increases with an increase in crystallinity content within the composites, indicating that the transition of the properties of composites into a relatively brittle behavior. A similar trend can also be noticed for F50 composites. In the case of F40 composites, a significant drop in the flexural properties was noticed with an increase in the crystallinity. This can be caused by the poor fiber-matrix interface induced by the crystals. The growth of crystals during slow cooling rates could have induced a high number of nucleation sites around the fiber, thus also affecting the fiber-matrix interface.
3.3.3. Impact Properties
In Figure 9, the results of the impact resistance of flax/PLA composites under varying cooling rates reveal significant differences, highlighting the influence of cooling rate on the material brittleness. The trend of impact resistance trend is consistent with the flexural behavior previously observed in these composites. As crystallinity increases, the composites exhibit a more brittle behavior, leading to reduced impact resistance—a phenomenon well-reported in the literature [8,49]. Specifically, the impact resistance of F40 composites decreased by approximately 11% under a slow cooling rate of 1°C/min, while F60 composites exhibited a more pronounced reduction of 18% at the same cooling rate. Interestingly, F50 composites showed minimal variation in impact resistance across different cooling rates, implying that the fiber and matrix distribution may play a stabilizing role in this configuration. The distribution and concentration of flax fibers likely have a substantial influence on the composite’s toughness. Higher flax content can increase the formation of fiber-rich zones, which may lead to uneven crystallization and localized brittleness, reducing impact performance. Furthermore, the differences in residual void content have a critical influence on the impact resistance. Composites with high void content are less capable of withstanding impact loads due to insufficient energy absorption and accelerated crack propagation. The voids, especially those at the fiber-matrix interface, act as stress concentrators, which weaken the material and lead to faster fracture under impact. Thus, the cooling rate and fiber distribution both play crucial roles in determining the impact properties of flax/PLA composites. A slower cooling rate generally promotes higher crystallinity, which can compromise impact resistance by increasing brittleness, even if it is beneficial to improve the stiffness.
4. Conclusions
This study investigated the crystallization kinetics of flax/PLA non-woven composites and their induced properties. The flax/PLA non-wovens were prepared via dry layup followed by needle punching. The orientation of fibers and their spatial distribution were characterized using the optical technique. It has been identified that fibers were oriented randomly without any preferential direction. The residual void content was highly dependent on the flax content within the non-wovens. The crystallization kinetics of flax/PLA composites were identified according to the two thermal conditions, i.e., isothermal and nonisothermal. An apparent influence of the presence of flax fibers and their content on the crystallization kinetics was noticed for both conditions. It has also been shown that the isothermal crystallization kinetics of flax/PLA should be modeled using a parallel Avrami model rather than a conventional approach to take into account the nonlinearity. It can be concluded that the non-wovens developed in this study can be used to manufacture high-quality semi-structural composite parts, which can replace commercial glass fiber-based composites.
Author Contributions
AP: Conceptualization, Investigation, Methodology, Data curation, Formal analysis, Visualization, Writing- Original draft. MC: Conceptualization, Investigation, Methodology, Resources, Formal analysis, Writing- Original draft. TL: Investigation, Resources, Formal analysis. BC: Formal analysis, Resources, Software, Visualization. CHP: Methodology, Writing-review& editing, Funding acquisition. HND: Methodology, Writing-review & editing, Funding acquisition.
Acknowledgments
The authors would like to thank the European Union (European Regional Development Fund (ERDF) for the financial support to the SEABIOCOMP project within the framework of INTERREG2SEAS under subsidy contract No 2S06-006.
References
- Yan L, Chouw N, Jayaraman K. Flax fibre and its composites - A review. Composites Part B: Engineering 2014;56:296–317. [CrossRef]
- Shah DU. Natural fibre composites: Comprehensive Ashby-type materials selection charts. Materials & Design (1980-2015) 2014;62:21–31. [CrossRef]
- Pantaloni D, Shah D, Baley C, Bourmaud A. Monitoring of mechanical performances of flax non-woven biocomposites during a home compost degradation. Polymer Degradation and Stability 2020;177:109166. [CrossRef]
- Martin N, Davies P, Baley C. Comparison of the properties of scutched flax and flax tow for composite material reinforcement. Industrial Crops & Products 2014;61:284–92. [CrossRef]
- Bourmaud A, Le Duigou A, Baley C. What is the technical and environmental interest in reusing a recycled polypropylene–hemp fibre composite? Polymer Degradation and Stability 2011;96:1732–9. [CrossRef]
- Bar M, Alagirusamy R, Das A, Ouagne P. Low velocity impact response of flax/polypropylene hybrid roving based woven fabric composites: Where does it stand with respect to GRPC? Polymer Testing 2020;89:106565. [CrossRef]
- Kim SH, Park CH. Direct impregnation of thermoplastic melt into flax textile reinforcement for semi-structural composite parts. Industrial Crops and Products 2017;95:651–63. [CrossRef]
- Oksman K, Skrifvars M, Selin JF. Natural fibres as reinforcement in polylactic acid (PLA) composites. Composites Science and Technology 2003;63:1317–24. [CrossRef]
- Bax B, Müssig J. Impact and tensile properties of PLA/Cordenka and PLA/flax composites. Composites Science and Technology 2008;68:1601–7. [CrossRef]
- Bodros E, Pillin I, Montrelay N, Baley C. Could biopolymers reinforced by randomly scattered flax fibre be used in structural applications? Composites Science and Technology 2007;67:462–70. [CrossRef]
- Nassiopoulos E, Njuguna J. Thermo-mechanical performance of poly(lactic acid)/flax fibre-reinforced biocomposites. Materials and Design 2015;66:473–85. [CrossRef]
- Rubio-López A, Artero-Guerrero J, Pernas-Sánchez J, Santiuste C. Compression after impact of flax/PLA biodegradable composites. Polymer Testing 2017;59:127–35. [CrossRef]
- Le Duigou A, Bourmaud A, Davies P, Baley C. Long term immersion in natural seawater of Flax/PLA biocomposite. Ocean Engineering 2014;90:140–8. [CrossRef]
- Gautreau M, Kervoelen A, Barteau G, Delattre F, Colinart T, Pierre F, et al. Fibre individualisation and mechanical properties of a flax-PLA non-woven composite following physical pre-treatments. Coatings 2021;11:846. [CrossRef]
- Xiao-Yun W, Qiu-Hong W, Gu H. Research on Mechanical Behavior of the Flax/Polyactic Acid Composites. Journal of Reinforced Plastics and Composites 2010;29:2561–7. [CrossRef]
- Khanlou HM, Woodfield P, Summerscales J, Hall W. Consolidation process boundaries of the degradation of mechanical properties in compression moulding of natural-fibre bio-polymer composites. Polymer Degradation and Stability 2017;138:115–25. [CrossRef]
- Couture A, Lebrun G, Laperrière L. Mechanical properties of polylactic acid (PLA) composites reinforced with unidirectional flax and flax-paper layers. Composite Structures 2016;154:286–95. [CrossRef]
- Dhakal HN, Zhang ZY, Guthrie R, MacMullen J, Bennett N. Development of flax/carbon fibre hybrid composites for enhanced properties. Carbohydrate Polymers 2013;96:1–8. [CrossRef]
- Woigk W, Fuentes CA, Rion J, Hegemann D, van Vuure AW, Kramer E, et al. Fabrication of flax fibre-reinforced cellulose propionate thermoplastic composites. Composites Science and Technology 2019;183:107791. [CrossRef]
- Ouagne P, Bizet L, Baley C, Bréard J. Analysis of the Film-stacking Processing Parameters for PLLA/Flax Fiber Biocomposites. Journal of Composite Materials 2010;44:1201–15. [CrossRef]
- Bar M, Alagirusamy R, Das A. Properties of flax-polypropylene composites made through hybrid yarn and film stacking methods. Composite Structures 2018;197:63–71. [CrossRef]
- Shah DU, Schubel PJ, Licence P, Clifford MJ. Determining the minimum, critical and maximum fibre content for twisted yarn reinforced plant fibre composites. Composites Science and Technology 2012;77:1909–17.
- Zhang L, Miao M. Commingled natural fibre/polypropylene wrap spun yarns for structured thermoplastic composites. Composites Science and Technology 2010;70:130–5. [CrossRef]
- Bayart M, Foruzanmehr MR, Vuillaume PY, Ovlaque P, Robert M, Elkoun S. Poly(lactic acid)/flax composites: effect of surface modification and thermal treatment on interfacial adhesion, crystallization, microstructure, and mechanical properties. Composite Interfaces 2021;0:1–20. [CrossRef]
- Xia X, Shi X, Liu W, Zhao H, Li H, Zhang Y. Effect of flax fiber content on polylactic acid (PLA) crystallization in PLA/flax fiber composites. Iranian Polymer Journal 2017 26:9 2017;26:693–702. [CrossRef]
- Mahato B, Babarinde VO, Abaimov SG, Lomov S V., Akhatov I. Interface strength of glass fibers in polypropylene: Dependence on the cooling rate and the degree of crystallinity. Polymer Composites 2020;41:1310–22. [CrossRef]
- Aliotta L, Gigante V, Coltelli MB, Cinelli P, Lazzeri A, Seggiani M. Thermo-mechanical properties of PLA/short flax fiber biocomposites. Applied Sciences 2019;9:3797. [CrossRef]
- Jin X, Chen X, Cheng Q, Zhang N, Cai S, Ren J. Non-isothermal crystallization kinetics of ramie fiber-reinforced polylactic acid biocomposite. RSC Advances 2017;7:46014–21. [CrossRef]
- Lee SH, Wang S, Teramoto Y. Isothermal crystallization behavior of hybrid biocomposite consisting of regenerated cellulose fiber, clay, and poly(lactic acid). Journal of Applied Polymer Science 2008;108:870–5. [CrossRef]
- Cai J, Liu M, Wang L, Yao K, Li S, Xiong H. Isothermal crystallization kinetics of thermoplastic starch/poly(lactic acid) composites. Carbohydrate Polymers 2011;86:941–7. [CrossRef]
- Cosson B. Optical measurement of local permeability of flax fiber fabrics before liquid composite molding. Journal of Composite Materials 2018;52:3289–97. [CrossRef]
- Pisupati A, Leroy M, Laurent T, Park CH. Development and investigation of nonwoven preforms for self-reinforced polylactic acid composites. Journal of Reinforced Plastics and Composites 2023:07316844231155805. [CrossRef]
- Kretsis G, He Y, Makeev A, Concrete R, Goh GDL, Dikshit V, et al. CRAG (Composite Research Advisory Group) Test Methods for the Measurement of the Engineering Properties of Fibre Reinforced Plastics. Fifth Conference on Composite Materials: Testing and Design 1988;18:631–738.
- Gall ML, Davies P, Martin N, Baley C. Recommended flax fibre density values for composite property predictions. Industrial Crops and Products 2018;114:52–8. [CrossRef]
- Velisaris CN, Seferis JC. Crystallization kinetics of polyetheretherketone (peek) matrices. Polymer Engineering & Science 1986;26:1574–81. [CrossRef]
- Liao R, Yang B, Yu W, Zhou C. Isothermal cold crystallization kinetics of polylactide/nucleating agents. Journal of Applied Polymer Science 2007;104:310–7. [CrossRef]
- Yu L, Liu H, Dean K, Chen L. Cold crystallization and postmelting crystallization of PLA plasticized by compressed carbon dioxide. Journal of Polymer Science, Part B: Polymer Physics 2008;46:2630–6. [CrossRef]
- Liu T, Mo Z, Wang S, Zhang H. Nonisothermal melt and cold crystallization kinetics of poly(Aryl Ether Ether Ketone Ketone). Polymer Engineering and Science 1997;37:568–75. [CrossRef]
- Pisupati A, Deléglise Lagardère M. Mechanical Performance of Flax Fiber Composites with Waste Glass Fibers as a Core Structure. Materials 2022;15:9017. [CrossRef]
- Saeidlou S, Huneault MA, Li H, Park CB. Poly(lactic acid) crystallization. Progress in Polymer Science 2012;37:1657–77. [CrossRef]
- Gumus S, Ozkoc G, Aytac A. Plasticized and unplasticized PLA/organoclay nanocomposites: Short- and long-term thermal properties, morphology, and nonisothermal crystallization behavior. Journal of Applied Polymer Science 2012;123:2837–48. [CrossRef]
- Pickering KL, Sawpan MA, Jayaraman J, Fernyhough A. Influence of loading rate, alkali fibre treatment and crystallinity on fracture toughness of random short hemp fibre reinforced polylactide bio-composites. Composites Part A: Applied Science and Manufacturing 2011;42:1148–56. [CrossRef]
- Hoffman JD, Weeks JJ. Melting Process and the Equilibrium Melting Temperature of Polychlorotrifluoroethylene. Journal of Research of the National Bureau of Standards-A Physics and Chemistry 1962;66:13–28.
- Tsuji H, Tezuka Y, Saha SK, Suzuki M, Itsuno S. Spherulite growth of l-lactide copolymers: Effects of tacticity and comonomers. Polymer 2005;46:4917–27. [CrossRef]
- Waters CL, Janupala RR, Mallinson RG, Lobban LL. Staged thermal fractionation for segregation of lignin and cellulose pyrolysis products: An experimental study of residence time and temperature effects. Journal of Analytical and Applied Pyrolysis 2017;126:380–9. [CrossRef]
- Pisupati A, Ayadi A, Deléglise-Lagardère M, Park CH. Influence of resin curing cycle on the characterization of the tensile properties of flax fibers by impregnated fiber bundle test. Composites Part A: Applied Science and Manufacturing 2019;126:105572. [CrossRef]
- O’Donnell A, Dweib MA, Wool RP. Natural fiber composites with plant oil-based resin. Composites Science and Technology 2004;64:1135–45. [CrossRef]
- Pervaiz M, Sain MM. Sheet-Molded Polyolefin Natural Fiber Composites for Automotive Applications. Macromolecular Materials and Engineering 2003;288:553–7. [CrossRef]
- Ejaz M, Azad MM, Shah AUR, Afaq SK, Song J il. Mechanical and Biodegradable Properties of Jute/Flax Reinforced PLA Composites. Fibers and Polymers 2020 21:11 2020;21:2635–41. [CrossRef]
Figure 1.
Schematic representation of the carding process.
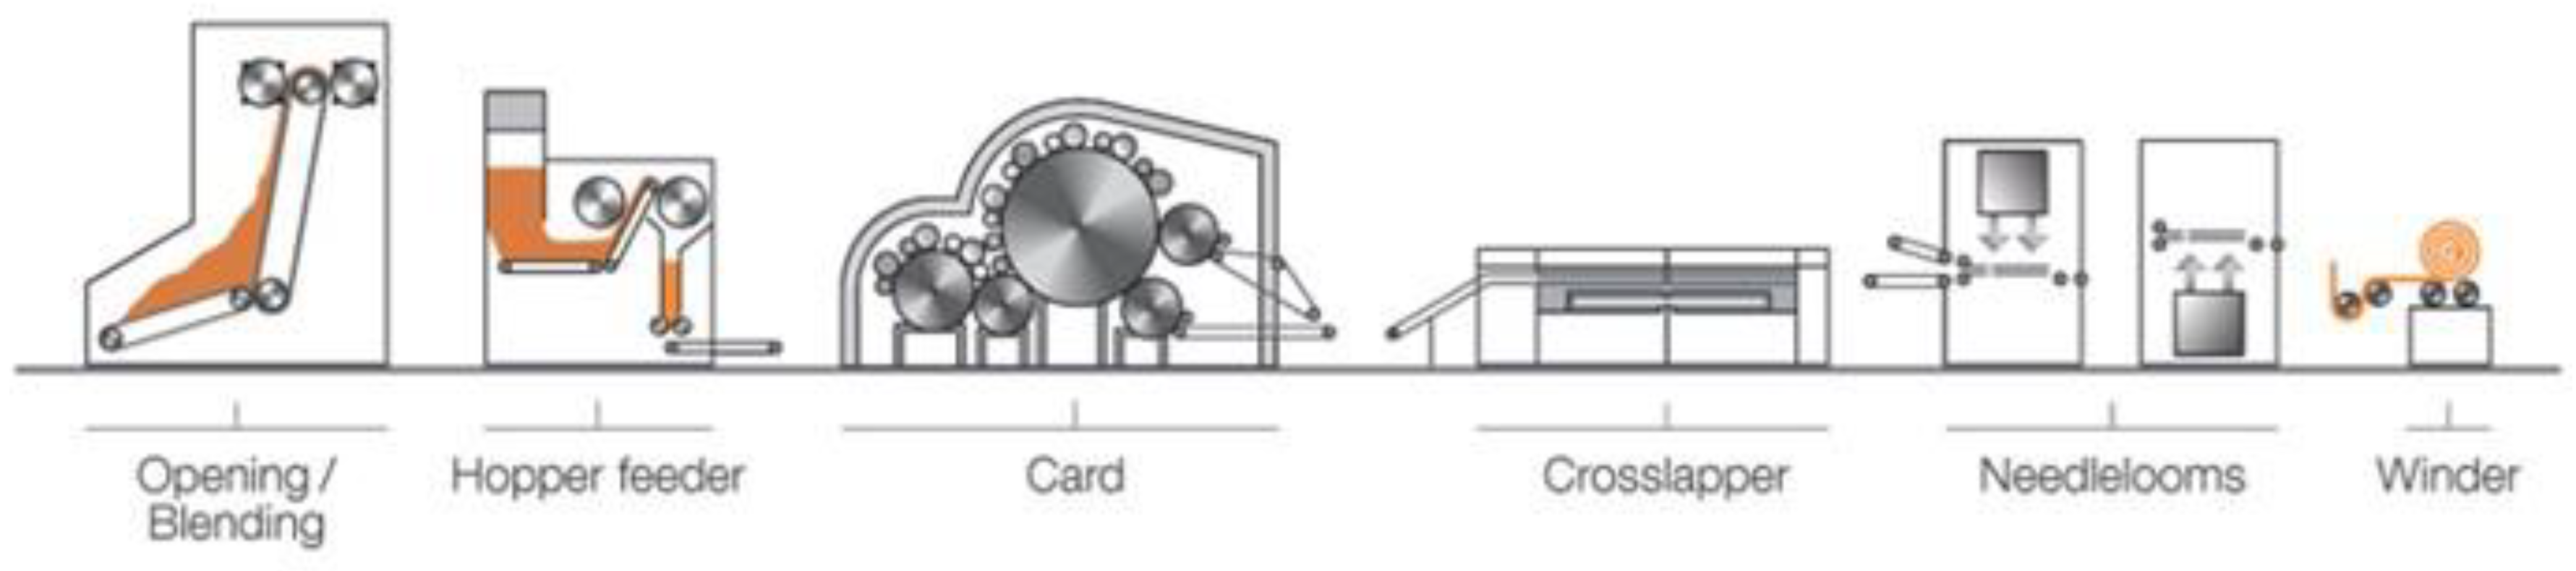
Figure 2.
Stepped consolidation cycle in compression moulding.
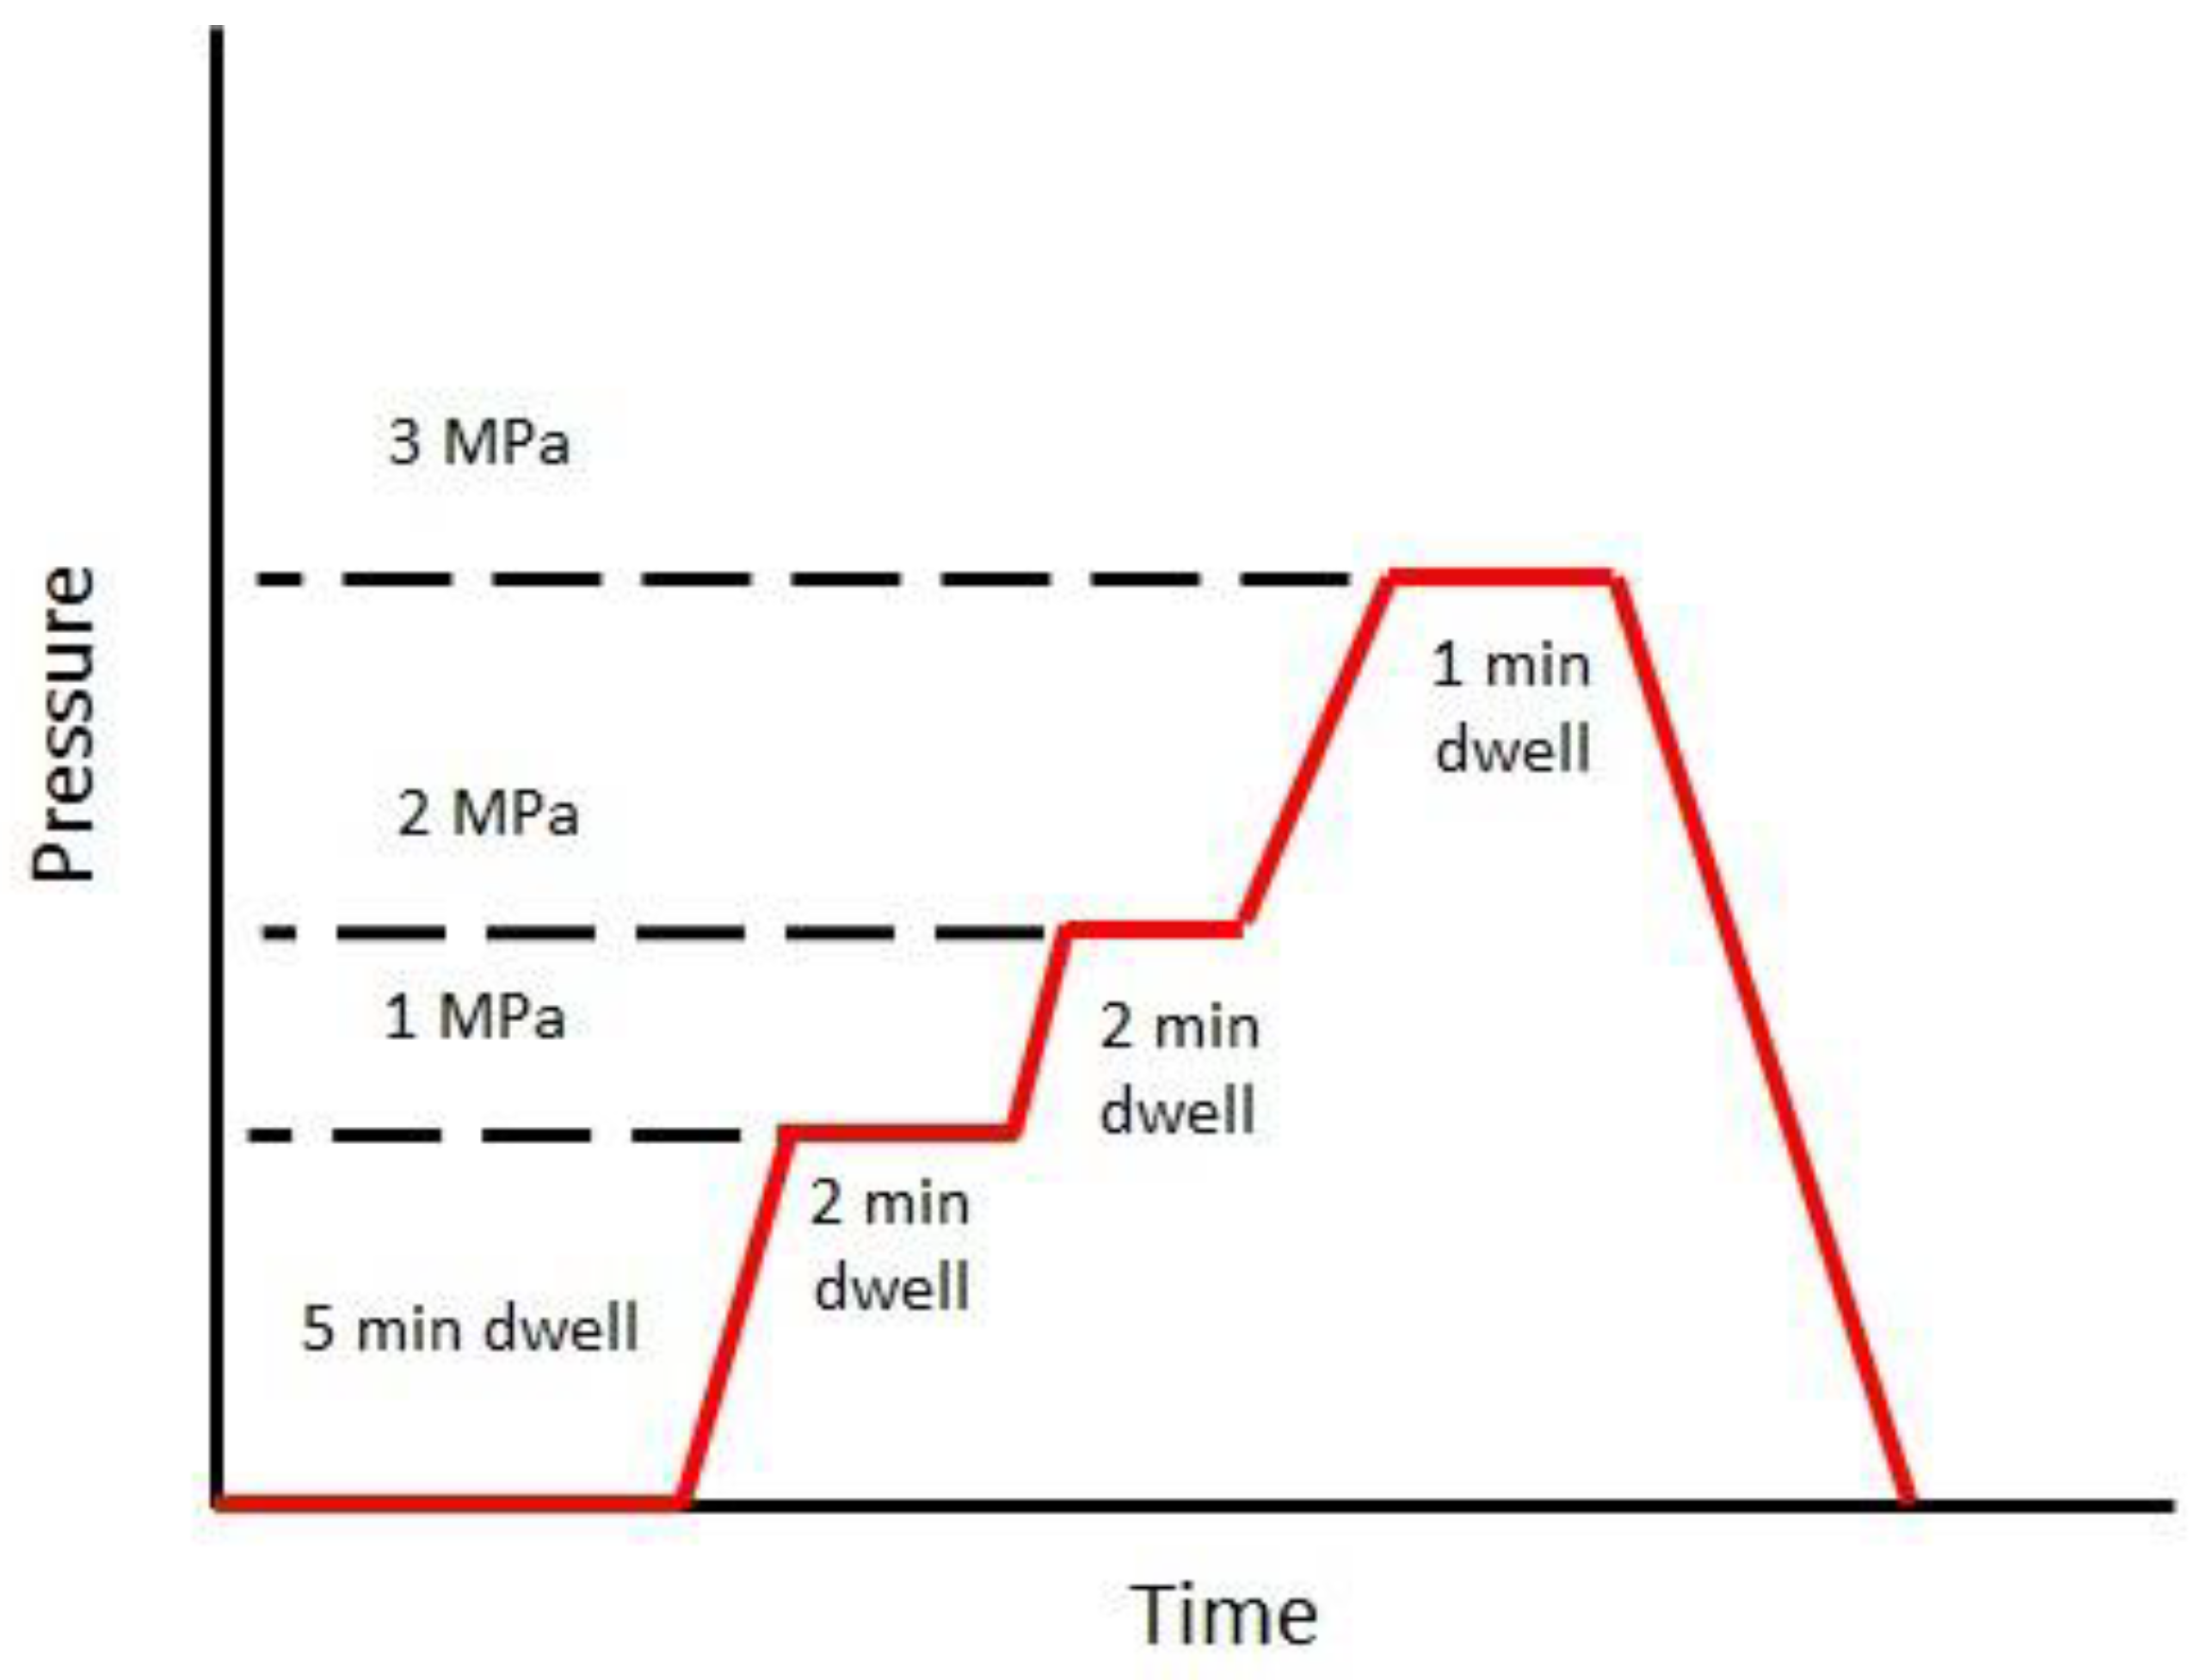
Figure 3.
Contour plots of fiber distributions in different flax/PLA non-wovens.
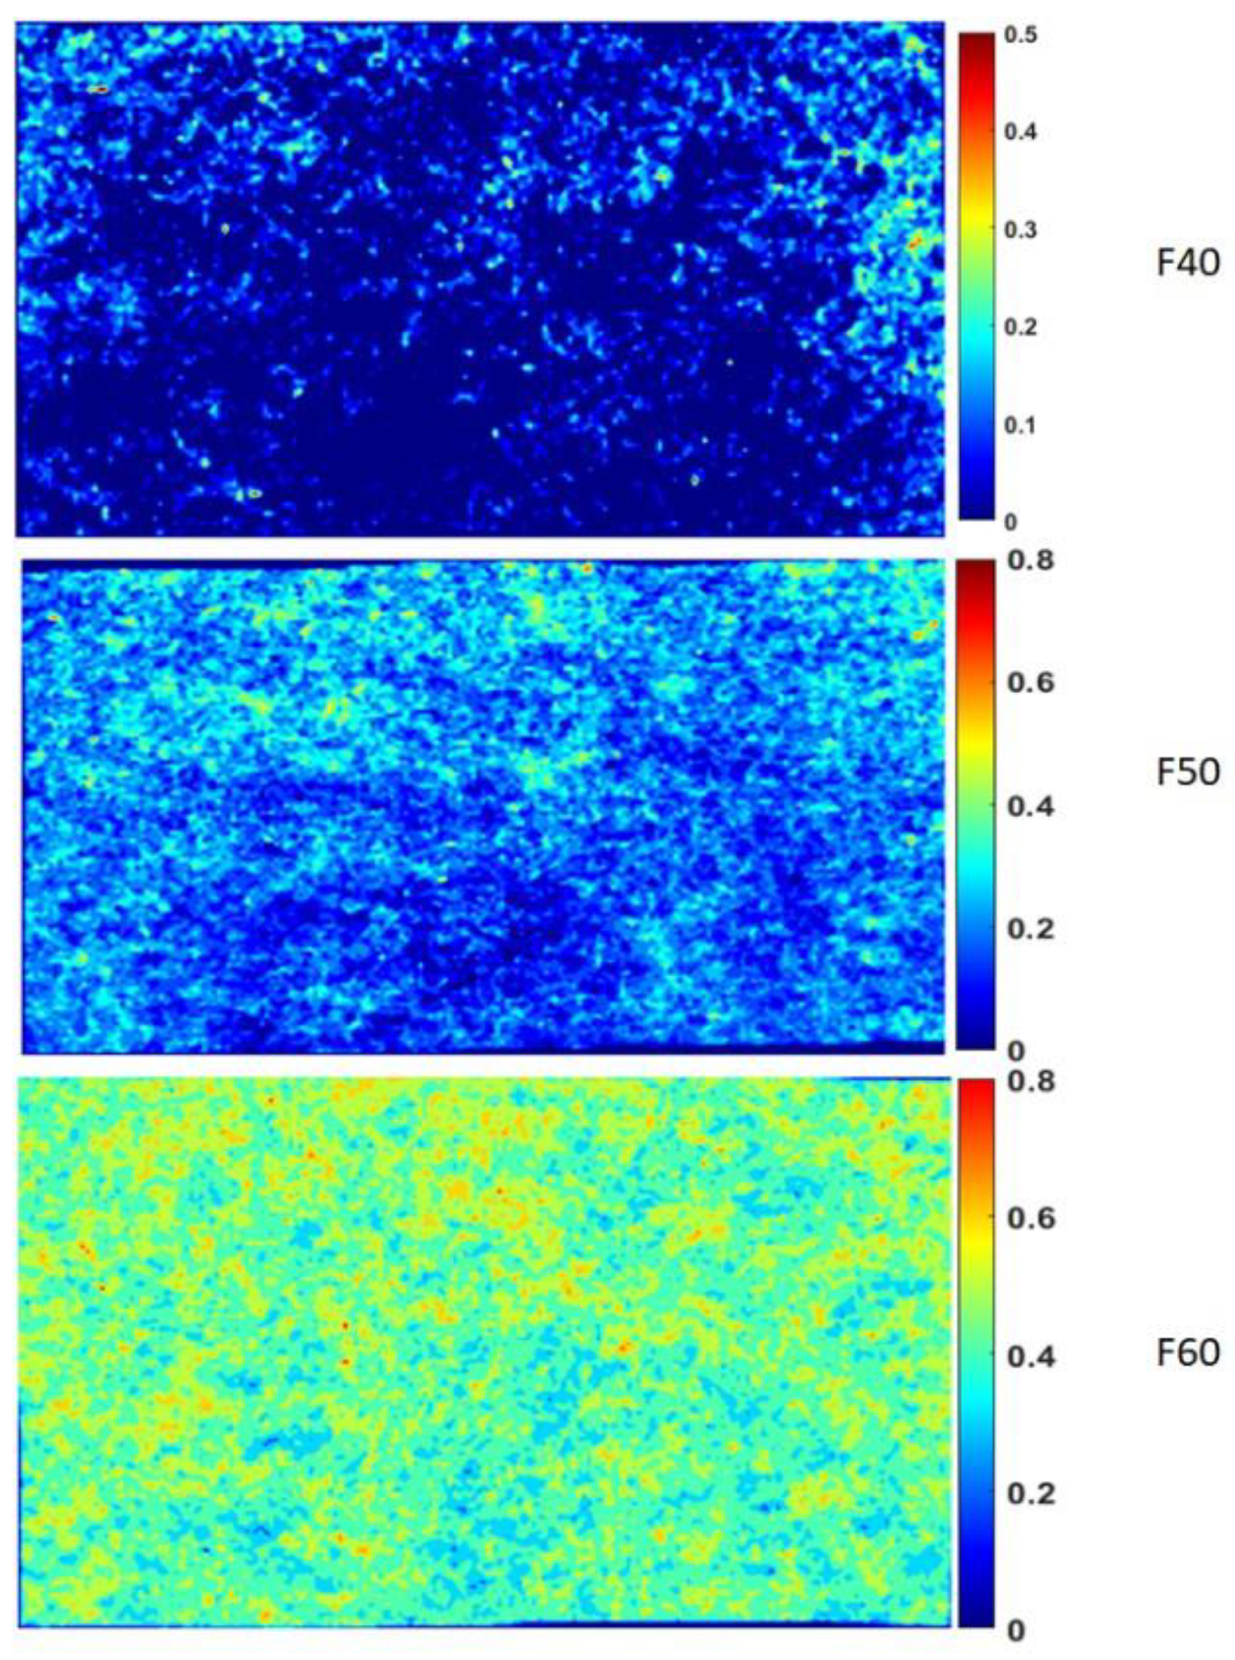
Figure 4.
Evolution of crystal growth rate with temperature.
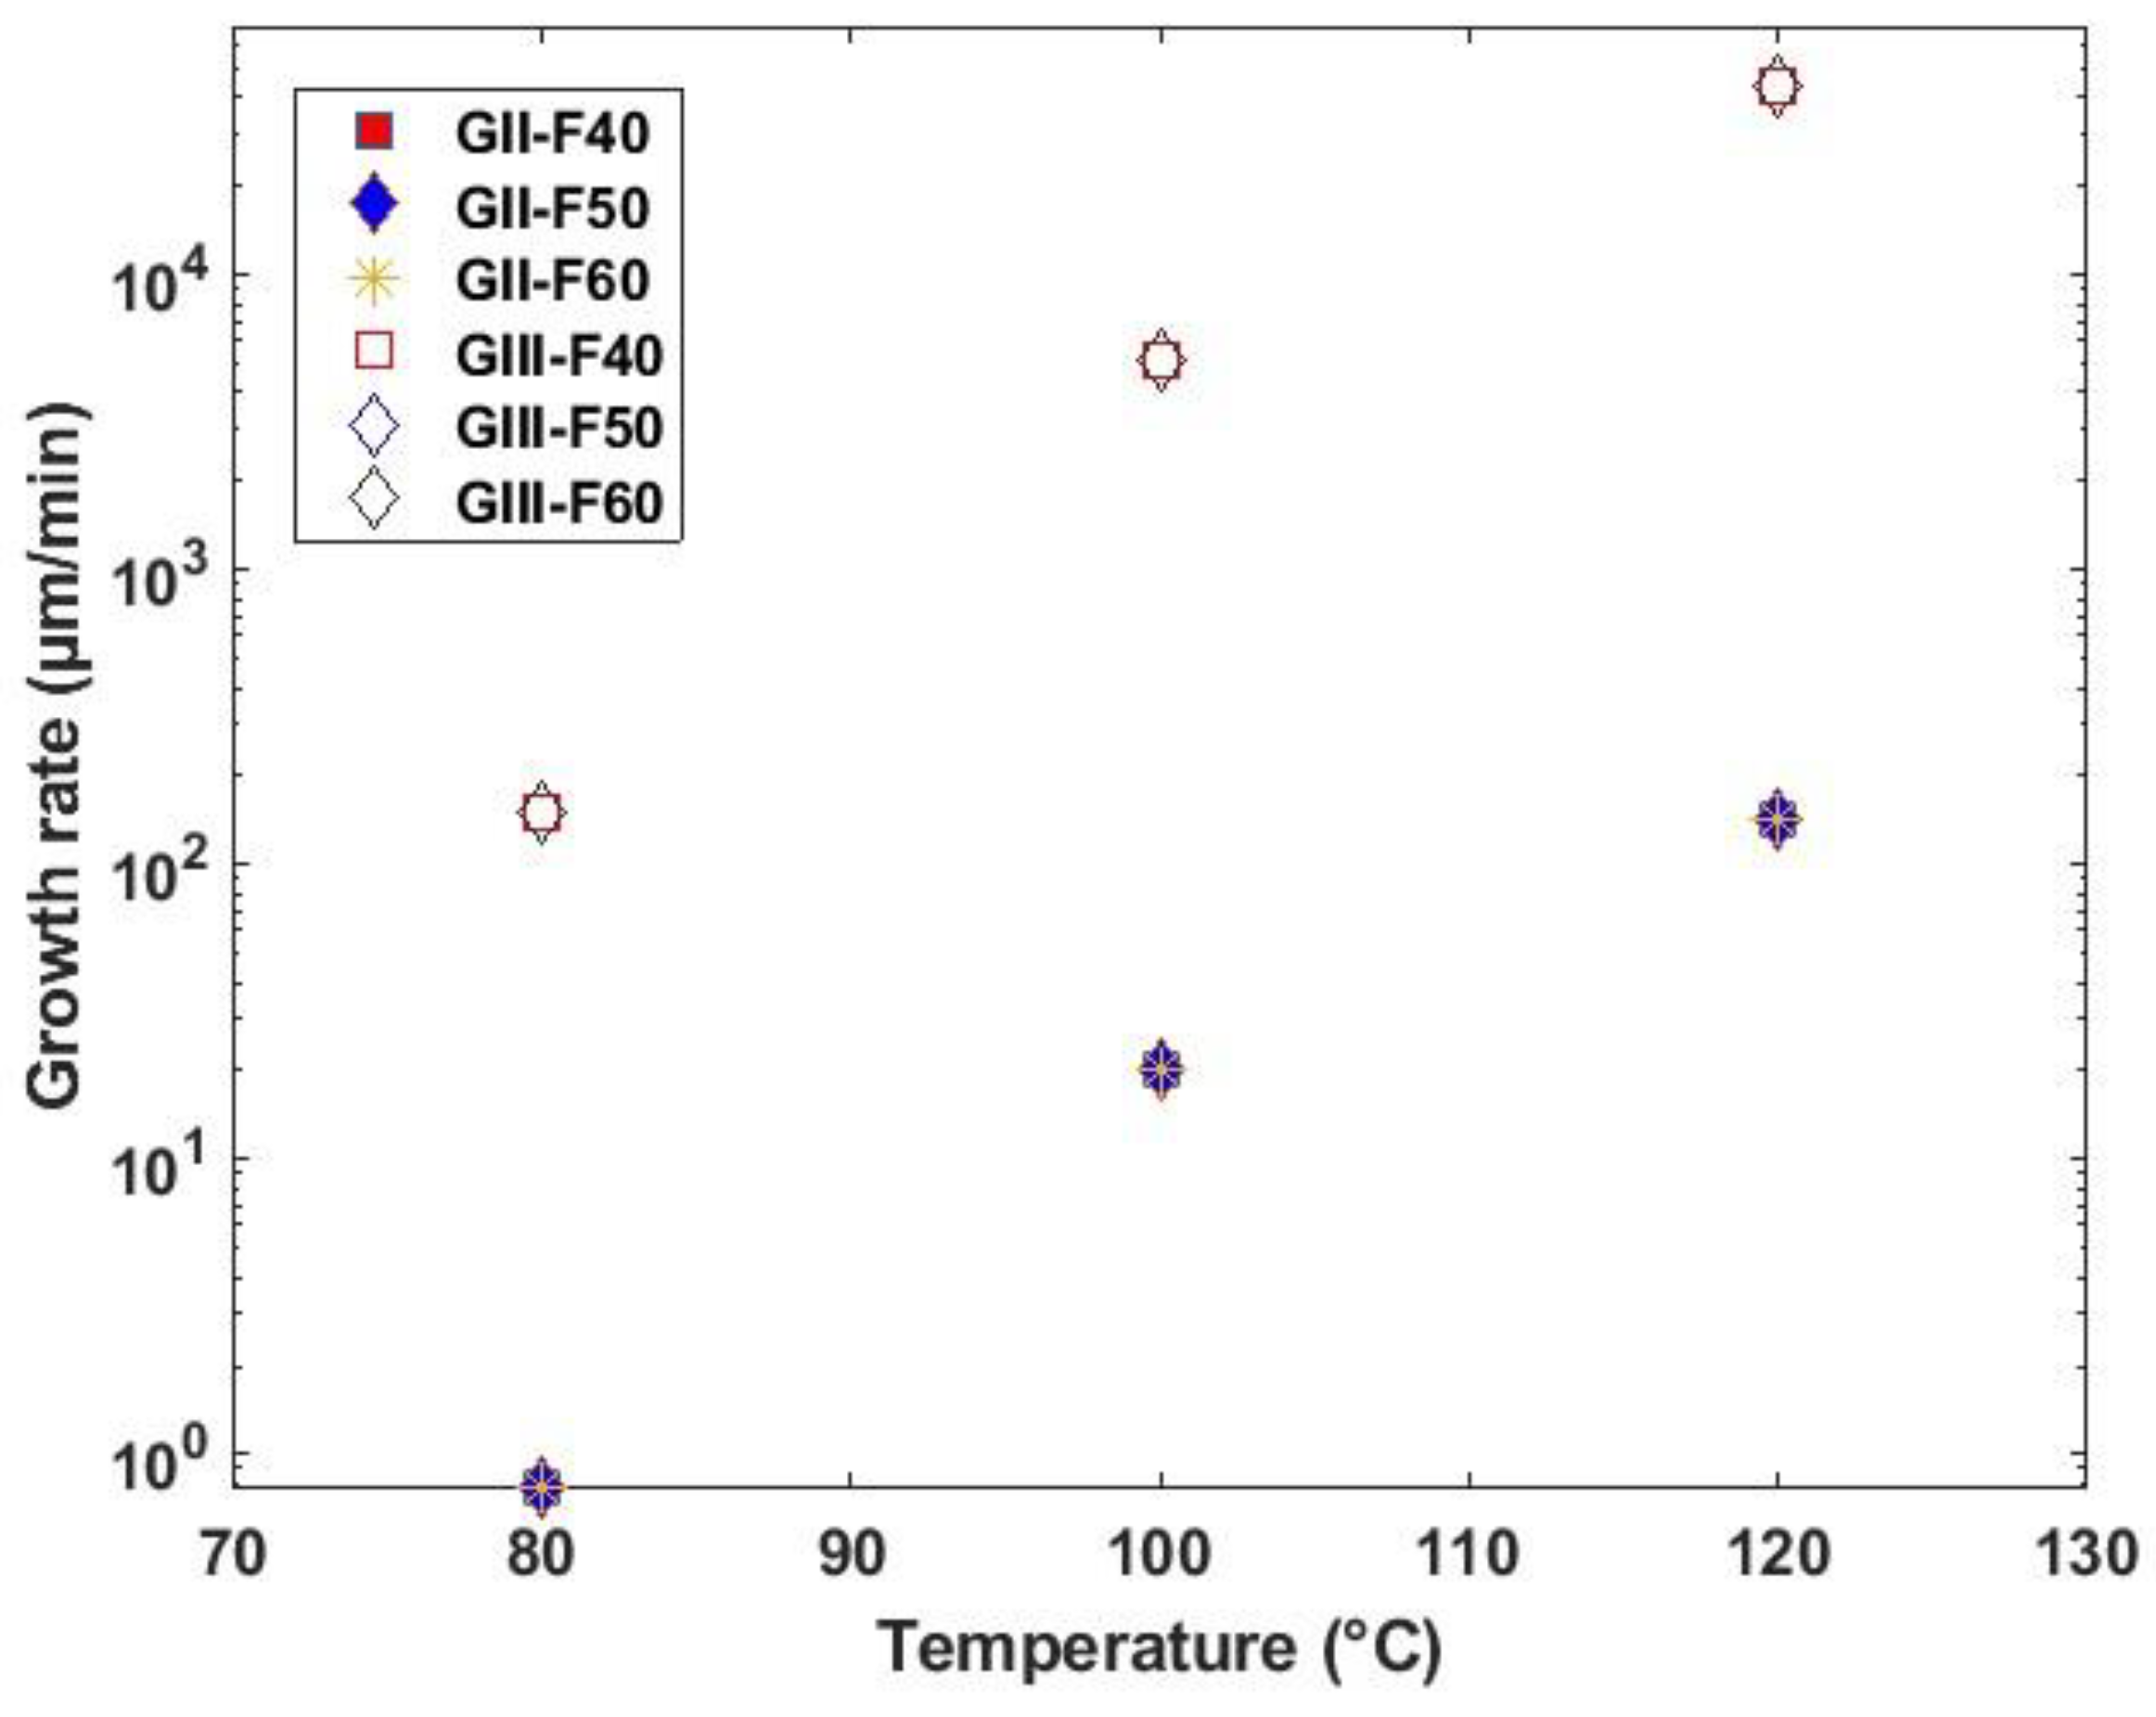
Figure 5.
Nonisothermal crystallization kinetics of flax/PLA non-woven composites.
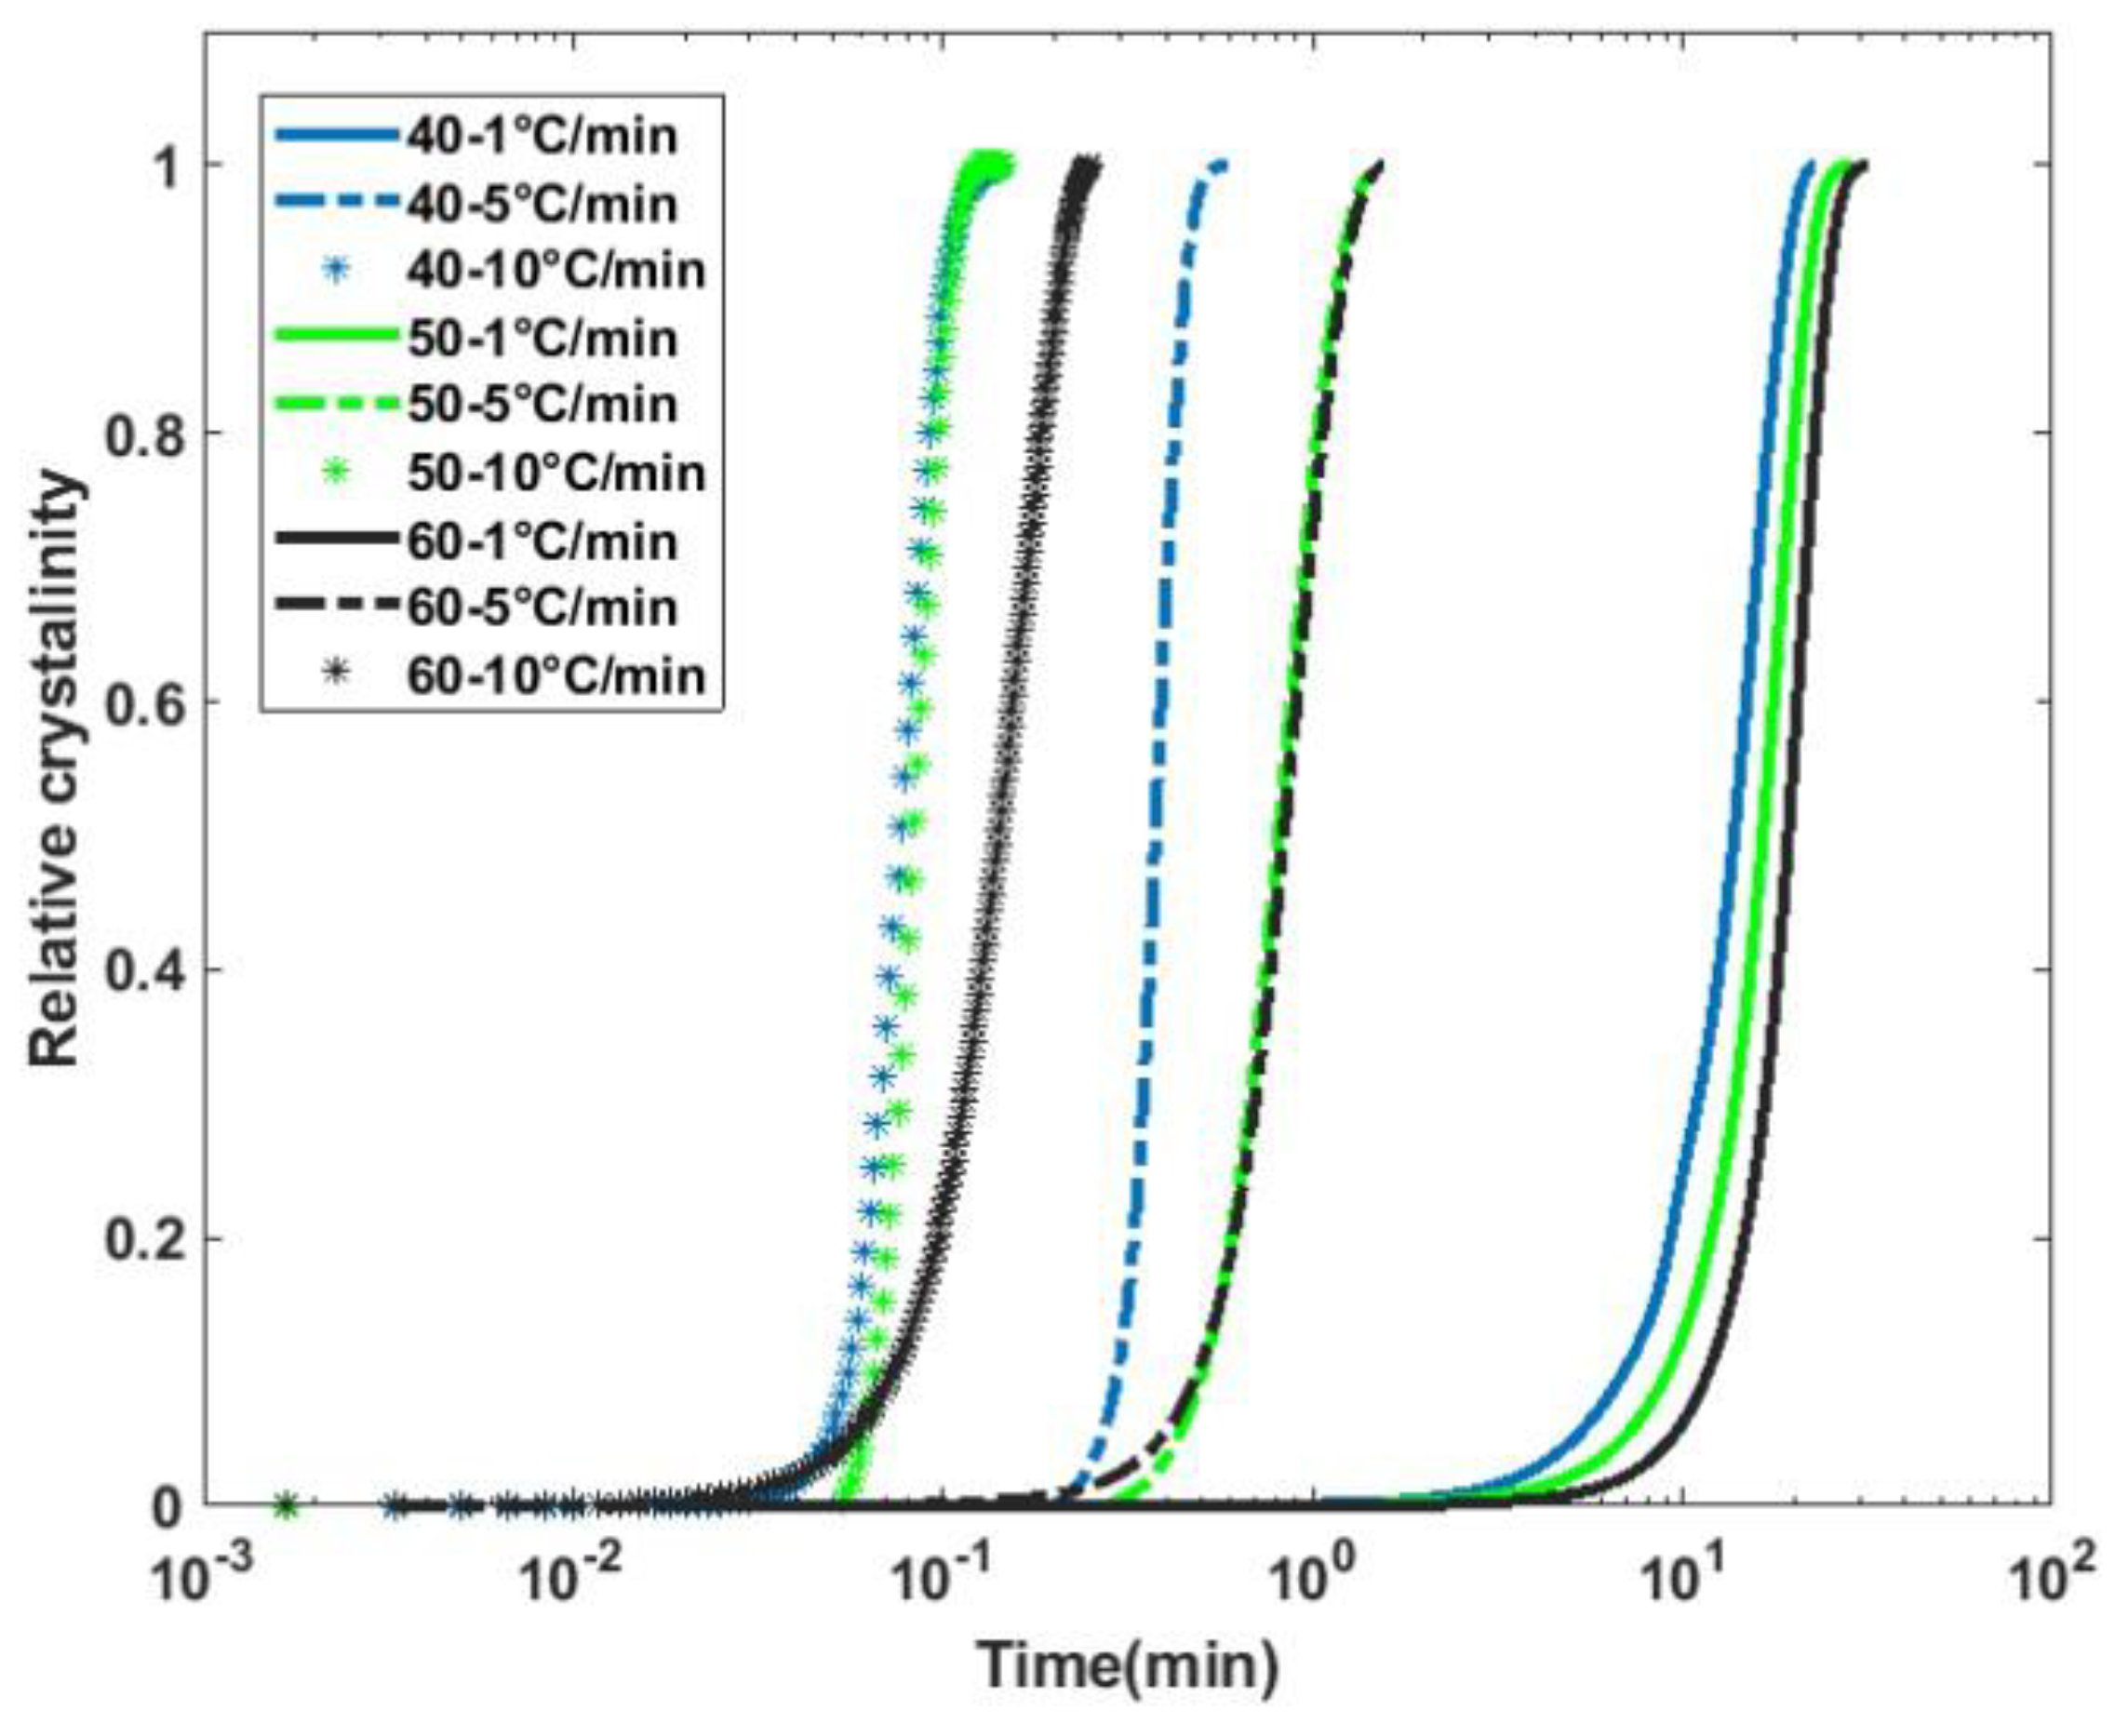
Figure 6.
Thermal behavior of flax/PLA composites.

Figure 7.
Residual void content and crystallinity of flax/PLA composites.
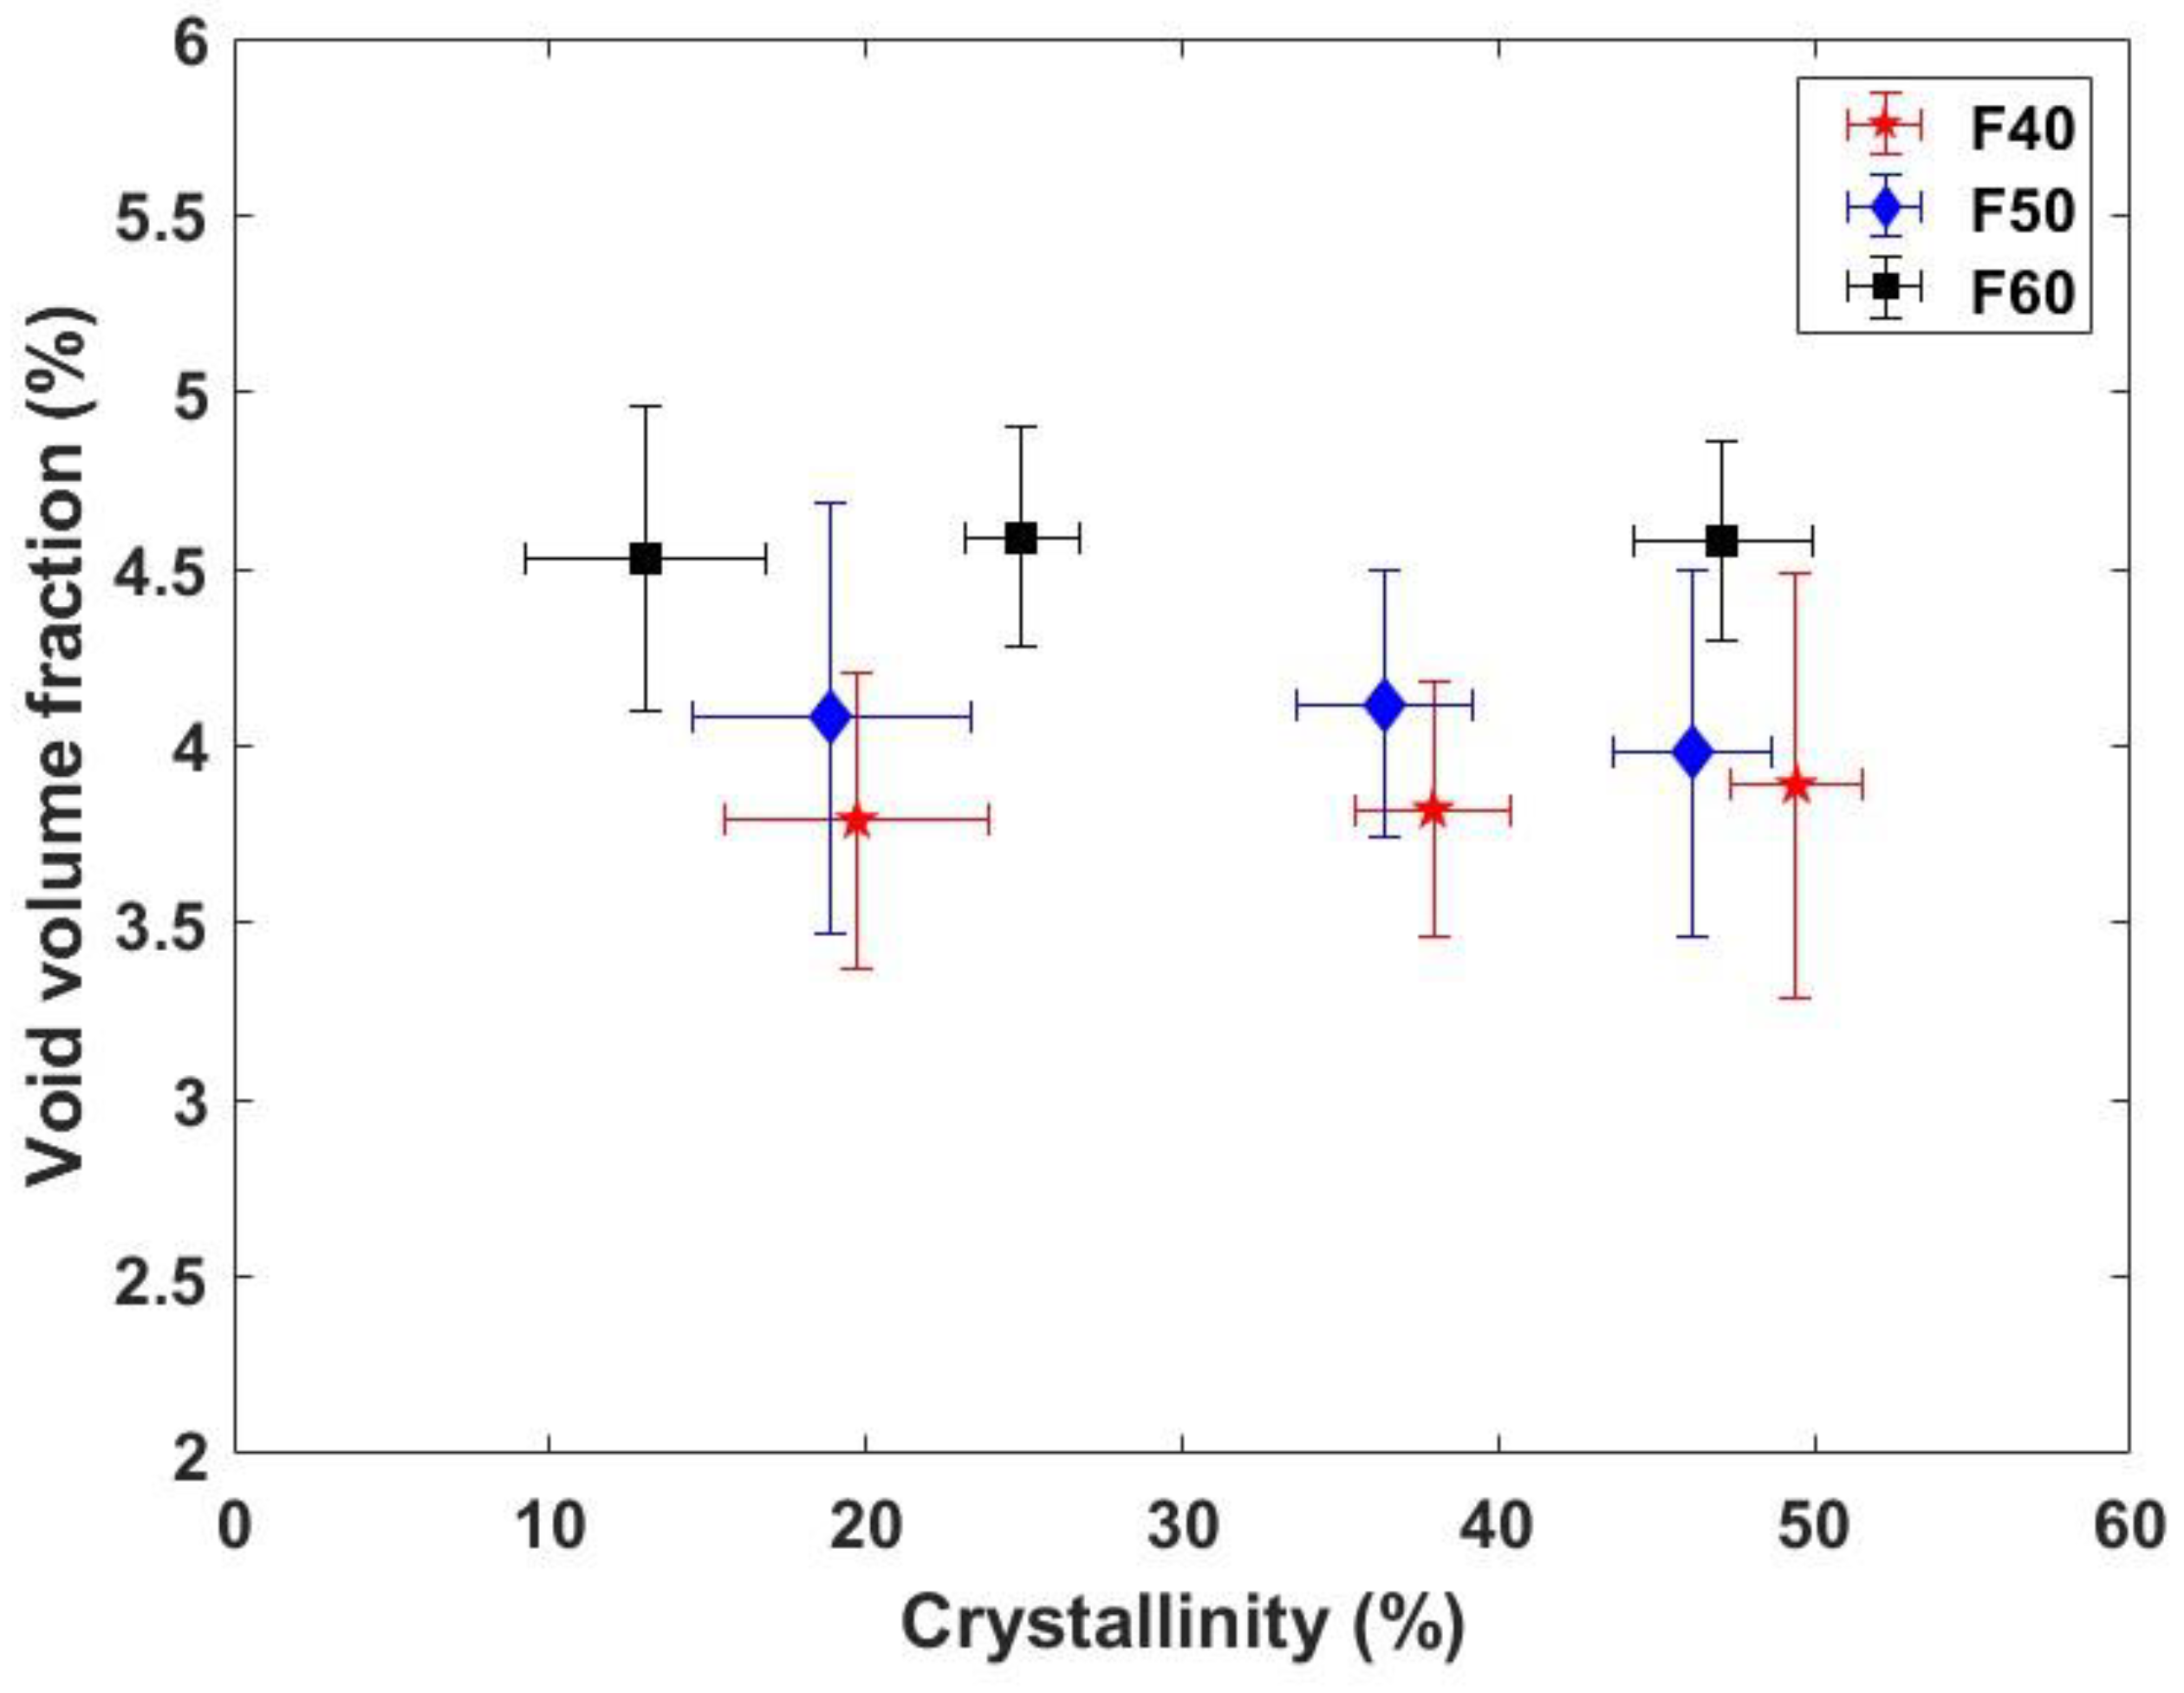
Figure 8.
Flexural properties of flax/PLA composites subjected to different cooling rates.
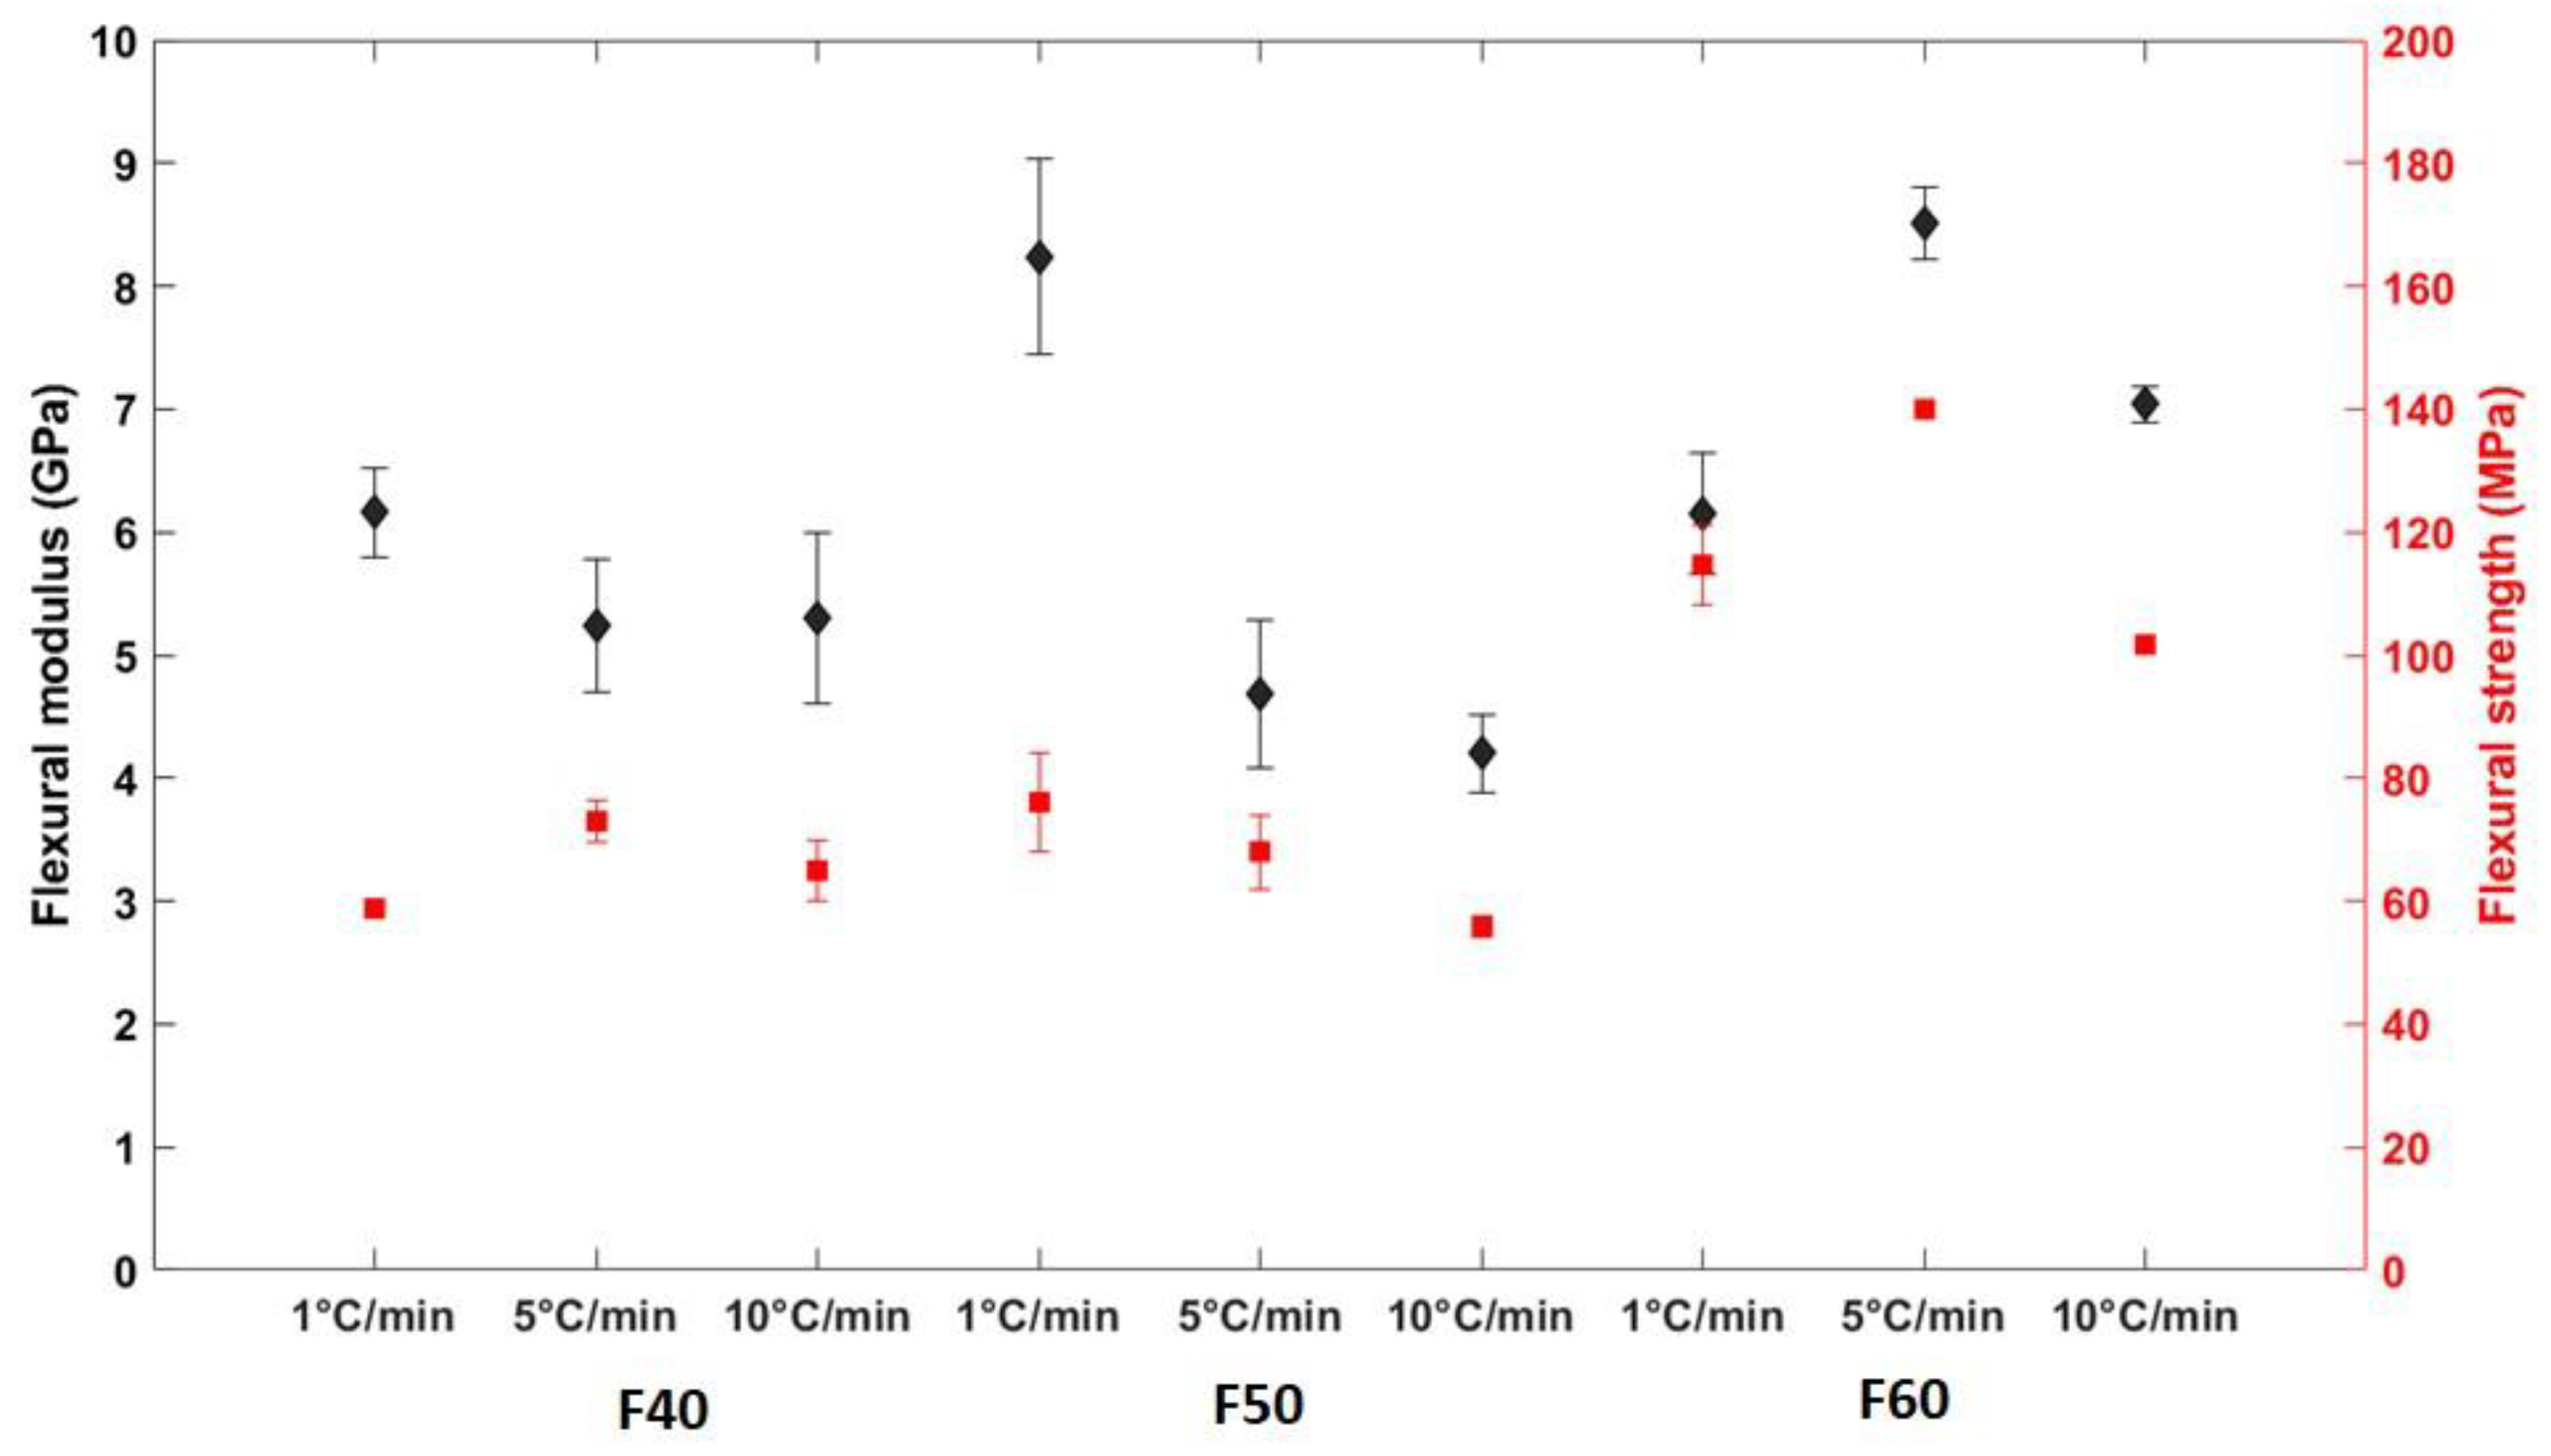
Figure 9.
Impact properties of flax/PLA composites subjected to different cooling rates.
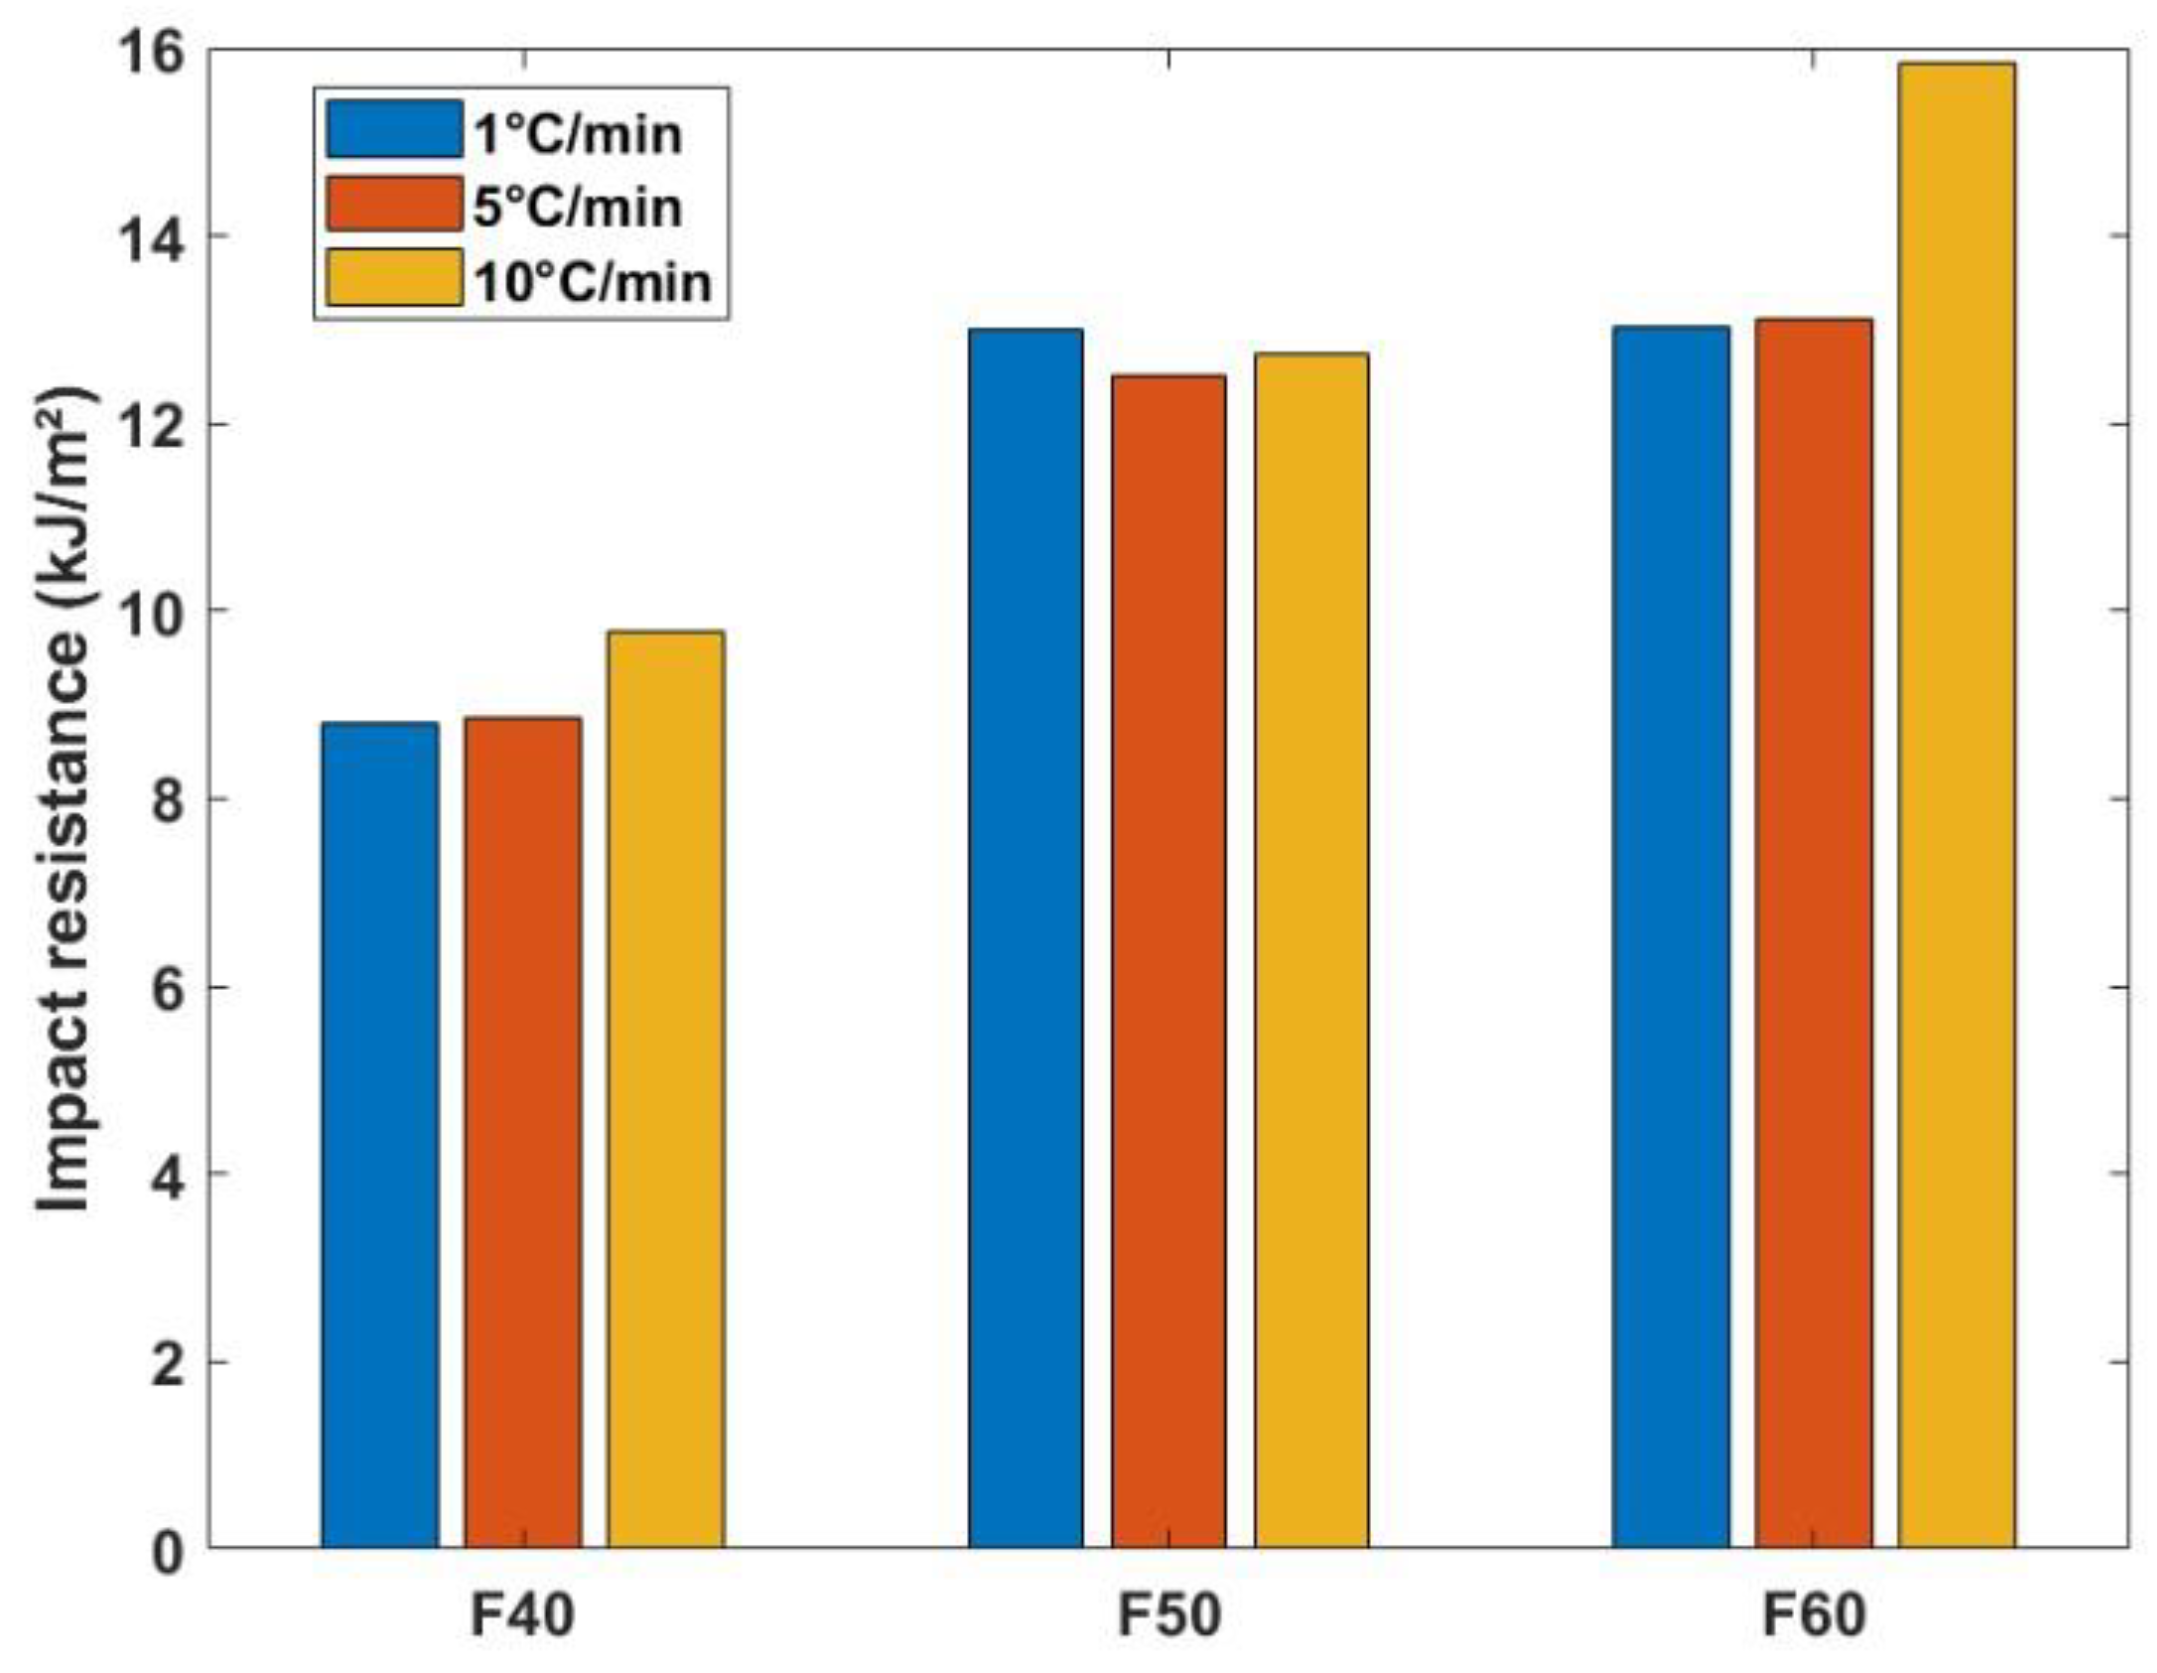

Table 1.
Non-woven properties.
| Non-Woven | Areal Weight (g/m²) | Thickness(mm) | Strength (N/50mm) | Elongation (%) | ||
|---|---|---|---|---|---|---|
| MD | CD | MD | CD | |||
| F40 | 161.67 ± 4.19 | 1.80± 0.045 | 64.0 | 117.9 | 73.0 | 43.5 |
| F50 | 183.16 ± 0.86 | 1.88± 0.01 | 52.0 | 85.9 | 70.7 | 43.1 |
| F60 | 171.67± 1.24 | 1.78± 0.02 | 41.2 | 63.9 | 72.1 | 44.3 |
Table 2.
Isothermal crystallization parameters.
| Non-Woven | Temperature (°C) | w1 | k1 (10-7 sec-1) | n1 | w2 | k2(10-7 sec-1) | n2 | |
|---|---|---|---|---|---|---|---|---|
| F40 | 80 | 0.65 | 1.083 | 2.182 | 0.344 | 2.179 | 1.369 | |
| 100 | 0.63 | 1.285 | 2.311 | 0.363 | 2.415 | 1.457 | ||
| 120 | 0.62 | 1.251 | 2.314 | 0.372 | 3.343 | 1.413 | ||
| F50 | 80 | 0.64 | 0.961 | 2.19 | 0.353 | 2.496 | 1.346 | |
| 100 | 0.62 | 1.284 | 2.307 | 0.371 | 3.071 | 1.414 | ||
| 120 | 0.62 | 1.253 | 2.311 | 0.376 | 3.975 | 1.382 | ||
| F60 | 80 | 0.64 | 0.965 | 2.195 | 0.353 | 2.336 | 1.357 | |
| 100 | 0.62 | 1.272 | 2.311 | 0.371 | 2.702 | 1.437 | ||
| 120 | 0.62 | 1.264 | 2.312 | 0.378 | 3.801 | 1.389 |
Table 3.
Input parameters from crystalline growth rate estimations.
| Parameter | Value |
|---|---|
| U | 1500 cal/mole |
| R | 1.987 cal /K.mole |
| Kg | 7.25 e +04 (Regime II) 2.28 e+05 (Regime III) |
| G0 | 5.40 e +05 (Regime II) 7.24 e+08 (Regime III) |
Table 4.
Coefficients of Mo’s model.
| F40 | F50 | F60 | PLA | |||||
|---|---|---|---|---|---|---|---|---|
| χ (%) | F(T) | a | F(T) | a | F(T) | a | F(T) | a |
| 20 | 1.042 | 0.46 | 0.9328 | 0.3723 | 1.01 | 0.3618 | 1.409 | 0.4873 |
| 40 | 1.138 | 0.448 | 1.289 | 0.444 | 1.395 | 0.4704 | 1.526 | 0.4794 |
| 60 | 1.193 | 0.4419 | 1.348 | 0.44 | 1.47 | 0.4969 | 1.606 | 0.4765 |
| 80 | 1.242 | 0.4395 | 1.393 | 0.4303 | 1.54 | 0.4835 | 1.681 | 0.4814 |
Disclaimer/Publisher’s Note: The statements, opinions and data contained in all publications are solely those of the individual author(s) and contributor(s) and not of MDPI and/or the editor(s). MDPI and/or the editor(s) disclaim responsibility for any injury to people or property resulting from any ideas, methods, instructions or products referred to in the content. |
© 2024 by the authors. Licensee MDPI, Basel, Switzerland. This article is an open access article distributed under the terms and conditions of the Creative Commons Attribution (CC BY) license (http://creativecommons.org/licenses/by/4.0/).
Copyright: This open access article is published under a Creative Commons CC BY 4.0 license, which permit the free download, distribution, and reuse, provided that the author and preprint are cited in any reuse.


