
Submitted:
27 November 2024
Posted:
28 November 2024
You are already at the latest version
Abstract
The importance of fat quality in our diet has been debated in last decades. Olive oil stands out in that category. The primary goal of the quality evaluation is to manage the key components by avoiding retail product adulteration. Health concerns are associated with their research on fatty acid profiles. Olive oil stands out among vegetable oils due to its purported health advantages and the fact that it has been the target of fraud, adulteration, and misleading labeling. We used gas chromatography with a Flame Ionization Detector and Gas Chromatography-Mass Spectrometry to examine the fatty acid profiles of several olive oils from well-known domestic brands sold in retail stores.
Under the regulations for olive oil products, the fatty acid (FA) profiles did not detect any signs of adulteration. The levels of trans-FAs were below the limit set by the European Union regulation 2568/91. In terms of weight, the oleic acid concentration of olive oils ranged from 64.71% to 75.62%. Olive oil has a low palmitic acid concentration, ranging from 8.43% to 14.26%. Linoleic acid levels ranged from 6.64 percent to 13.1 percent. Lower than 1%, the linolenic acid ranged from 0.38 to 0.94 ± 0.01%. According to analytical data, the fatty acid profile of olive oil does not reveal any signs of adulteration. Not only was it low in saturated fat, but it was also rich in monounsaturated fat.
Keywords:
Olive oil
; Retail market
; Fatty acids
; trans-Fatty Acid
; oxidative stability
; Tirana
; Albania
Introduction
The Mediterranean diet is considered the foremost dietary regimen, and its adoption is associated with preventing degenerative diseases and extending longevity (Gaforio et al., 2019). Virgin olive oil (VOO) is a staple ingredient in the Mediterranean diet, providing excellent nutritional properties due to its balanced fatty acid composition and presence of phenolic compounds, as well as unique sensory quality (Angerosa et al., 2006; Topi et al., 2019). VOO is obtained from the olive fruit solely by mechanical or other physical means under conditions, particularly thermal conditions, that do not lead to alterations in the oil and which have not undergone any treatment other than washing, decantation, centrifugation, and filtration (EC, 2568/91).
Virgin olive oils’ potential health and therapeutic benefits have been the subject of continuously increasing consumer awareness (Visioli and Galli, 1998; Topi et al., 2020). A Mediterranean Diet rich in olives decreased blood pressure, mainly due to the consumption of 10 to 50 mL per day. Lower body mass index (BMI) and a lower incidence of breast cancer have been observed (Gaforio et al., 2019). In the context of a MedDiet, virgin olive oil intake reduced the risk of CVD and mortality in older, high-cardiovascular-risk individuals (Guasch-Ferre et al., 2014).
Polyunsaturated fatty acids (PUFAs) are crucial for brain function, contributing to neuronal cell structure, memory, and cognitive processes. They contain two or more double bonds, whereas fatty acids with a single double bond are referred to as monounsaturated fatty acids (MUFAs). PUFAs like docosahexaenoic acid and eicosapentaenoic acid have anti-inflammatory, vasoconstrictive, hypotensive, hypolipidemic, hypocholesterolemic, and antioxidant properties and are (Belkouch et al., 2016; Adefegha et al., 2022).
Trans fatty acids (TFA) are naturally present in food products made from ruminant animals (rTFA) but can also be produced industrially (iTFA) (Mouratidou et al., 2014). The European Food Safety Authority (EFSA) states that ‘TFA intakes should be as low as is possible within the context of a nutritionally adequate diet’ (EFSA, 2018). Their presence is strongly associated with systemic inflammation in patients with heart disease, which suggests that attention to TFA intake may be significant for secondary prevention efforts—trans-fatty acids and systemic inflammation in heart failure (Boum et al., 2012).
Olive oils’ quality and genuineness are evaluated based on analytical data on several parameters, which must be within limit values established by the European Commission (EC Reg. No 2568/1991) and its latest amendment, EC Reg. No 1989/2003. The EC Regulations 2081/92 and 2082/92 cover the product’s authenticity by permitting the label of the area where the extra virgin olive oil is produced.
This study was focused on olive oils (OO) of domestic origin. The quality of the marketed product ‘olive oil’ is confronted with the EC regulation 2568/91 on the content of fatty acids and the presence of trans fatty acids to give evidence on the category of the olive oils present in the market.
Materials and Methods
Sample Collection
Commercially sourced olive oils were acquired from the retail markets of Tirana city throughout 2021. The samples were chosen according to the specifications of label information, brand name, manufacturing technique, and kind of olive oil. All examined OO samples were sourced from a domestic origin. A total of 40 samples from 8 different brand-name olive oils were evaluated in this investigation. All samples were maintained in their original bottles at 4 °C in a dark environment from collection until chemical analyses.
Analytical Methods
As Internal Standard was used pentadecanoic acid, direct basic transesterification in fatty acid methyl esters (FAME) were made via according to EU regulation 2568/91 (1991). An HP-6890 gas chromatograph fitted with a Flame Ionization Detector (GC-FID) was used to perform the FAME test. AOCS Official Method Ce 1b-89 was used in the calculations (Fyrestone D. 1994). Pure standards (Sigma-Aldrich, Supelco) were used to identify the fatty acids based on retention time comparisons. The proportion of total fatty acids was used to calculate fatty acids. Every sample was examined three times.
Statistical Analysis
The complete data was evaluated by randomized block design, with three replicates from fatty acid analysis. Results were displayed as mean values and standard error (n=3). The significance of the differences among the values was determined by Analysis of Variance using a One-way ANOVA test, with a significance level of P<0.05.
Results and Discussions
Studying the quality of the products relevant to the consumers’ destination is essential for health protection. Expensive products such as ‘Virgin Olive Oil’ is fragile toward the fraud of the product. The fatty acid profiles obtained by the brand name VOO contribute to consumer health protection and inform producers about the quality of their marketed products.
Main fatty acids present in OO are palmitic (C16:0), oleic (C18:1), linoleic (C18:2), and minor fatty acids, such as: palmitoleic (C16:1), stearic (C18:0), linolenic (C18:3). myristic (C14:0), heptadecanoic and eicosanoic acids found in trace amounts (Topi, Thomai, Halimi, 2012). The fatty acid composition may differ from sample to sample, depending on the production zone, latitude, climate, variety, and the fruit’s maturity stage. Greek, Italian, and Spanish olive oils are low in linoleic and palmitic acids and have a high percentage of oleic acid. Tunisian olive oils are high in linoleic and palmitic acids and lower in oleic acid (Boskou, Blekas, & Tsimidou, 2006).
Unique in its nutritional and sensory characteristics, VOO is considered the primary source of fat in the traditional Mediterranean diet (Topi et al., 2020). Kalinjot, the most important native olive cultivar, contributes to the national level of OO production obtained from different locations in the Vlora and Mallakastra regions during different harvesting years in the last decade (Velo & Topi, 2016; Topi et al., 2021). Oleic acid is 68.03–76.83%; the linoleic acid interval is 7.85–14.22%, and the palmitic acid is 8.54–13.62%. The linolenic acid content range is 0.63–0.89%, indicating that VOO marketed and consumed are in compliance with the labeling information of the product offered to the consumers as OO.
Data obtained for the primary fatty acids in the Olive oils do not show fraud implications with other edible oils based on the limits established by FAO and EU Regulation No. 2568/91. The main contribution to the FA profile comes from oleic acid (C18:1), linoleic acid (C18:2), and palmitic acid (C16:0). The linolenic acid varied from 0.38 to 0.94 ± 0.01% lower than 1%. It is in the range of the linolenic acid content approved by FAO and EU Regulation No 2568/91.
The information on the geographical origin of the OO according to their code, A, B, C, F, G, and H, has produced the information that the main cultivar belongs to the Kalinjoti olive cv. The OO brand, code E, shows a different pattern, indicating that the main olive cultivar is not those mentioned above but the Nisiot olive cv (Velo & Topi, 2017; Topi et al., 2021). The olive oil brand, code D, indicates that linoleic acid is higher compared with other brands, it is an indication of geographical origin from Tirana region, where the main olive cultivar is Bardhi Tirana (Topi, Thomai & Halimi, 2012; Topi et al, 2021).

Table 1.
Fatty acid profiles of the brand name olive oil from the market (%weight oil); the values are triplicates and expressed as Mean Value±SD).
Table 1.
Fatty acid profiles of the brand name olive oil from the market (%weight oil); the values are triplicates and expressed as Mean Value±SD).
| Formula | A | B | C | D | E | F | G | H |
|---|---|---|---|---|---|---|---|---|
| 14:0 | 0.00±0.00 | 0.00±0.00 | 0.00±0.00 | 0.00±0.00 | 0.00±0.00 | 0.00±0.00 | 0.00±0.00 | 0.00±0.00 |
| 16:0 | 10.71±0.01 | 14.26±0.01 | 14.26±0.01 | 8.94±0.00 | 15.22±0.01 | 10.30±0.02 | 10.38±0.01 | 8.43±0.00 |
| 16:1(n-9) | 0.08±0.00 | 0.05±0.04 | 0.05±0.04 | 0.14±0.00 | 0.00±0.00 | 0.11±0.00 | 0.11±0.00 | 0.14±0.00 |
| 16:1(n-7) | 0.37±0.00 | 1.42±0.00 | 1.42±0.00 | 0.22±0.00 | 0.94±0.00 | 0.44±0.00 | 0.50±0.00 | 0.20±0.00 |
| 17:0 | 0.12±0.01 | 0.00±0.00 | 0.00±0.00 | 0.14±0.00 | 0.13±0.00 | 0.10±0.00 | 0.10±0.00 | 0.15±0.00 |
| 17:1 (n-7) | 0.18±0.00 | 0.00±0.00 | 0.00±0.00 | 0.20±0.00 | 0.20±0.00 | 0.17±0.00 | 0.15±0.00 | 0.22±0.00 |
| 18:0 | 3.23±0.00 | 2.23±0.01 | 2.23±0.01 | 3.27±0.01 | 2.38±0.00 | 2.76±0.01 | 2.80±0.01 | 3.04±0.01 |
| 18:1(n-9)trans | 0.03±0.00 | 0.04±0.00 | 0.04±0.00 | 0.03±0.00 | 0.06±0.00 | 0.08±0.00 | 0.04±0.00 | 0.05±0.00 |
| 18:1(n-9)cis | 75.62±0.01 | 71.65±0.03 | 71.65±0.03 | 75.41±0.01 | 64.71±0.04 | 74.98±0.02 | 74.41±0.05 | 76.92±0.02 |
| 18:1(n-7) | 1.49±0.01 | 2.90±0.00 | 2.90±0.00 | 1.28±0.00 | 2.20±0.00 | 1.72±0.00 | 1.78±0.01 | 1.20±0.00 |
| 18:2(n-6)trans | 0.01±0.00 | 0.00±0.00 | 0.02±0.00 | 0.01±0.00 | 0.00±0.00 | 0.03±0.00 | 0.01±0.00 | 0.00±0.00 |
| 18:2 (n-6)cis | 6.99±0.01 | 6.64±0.01 | 6.64±0.01 | 8.85±0.00 | 13.24±0.01 | 7.98±0.01 | 8.36±0.01 | 8.12±0.00 |
| 20:0 | 0.50±0.01 | 0.29±0.01 | 0.29±0.01 | 0.48±0.00 | 0.34±0.01 | 0.42±0.01 | 0.42±0.01 | 0.47±0.01 |
| 18:3 (n-3) | 0.48±0.00 | 0.52±0.01 | 0.52±0.01 | 0.72±0.00 | 0.54±0.00 | 0.71±0.00 | 0.69±0.00 | 0.74±0.00 |
| 20:1 (n-9) | 0.24±0.00 | 0.06±0.00 | 0.06±0.00 | 0.34±0.01 | 0.11±0.05 | 0.30±0.01 | 0.30±0.01 | 0.37±0.01 |
| 20:2 (n-6) | 0.00±0.00 | 0.00±0.00 | 0.00±0.00 | 0.00±0.00 | 0.00±0.00 | 0.00±0.00 | 0.00±0.00 | 0.00±0.00 |
| 21:0 | 0.00±0.00 | 0.00±0.00 | 0.00±0.00 | 0.00±0.00 | 0.00±0.00 | 0.00±0.00 | 0.00±0.00 | 0.00±0.00 |
| 20:3 (n-3) | 0.00±0.00 | 0.00±0.00 | 0.00±0.00 | 0.00±0.00 | 0.00±0.00 | 0.00±0.00 | 0.00±0.00 | 0.00±0.00 |
| 22:0 | 0.00±0.00 | 0.00±0.00 | 0.00±0.00 | 0.00±0.00 | 0.00±0.00 | 0.00±0.00 | 0.00±0.00 | 0.00±0.00 |
| n-6/n-3 | 14.41 | 12.86 | 12.86 | 24.51 | 24.51 | 11.18 | 12.12 | 10.98 |
| SFA | 14.56 | 16.78 | 16.78 | 18.05 | 18.05 | 13.58 | 13.70 | 12.09 |
| MUFA | 77.96 | 76.09 | 76.09 | 68.16 | 68.16 | 77.71 | 77.25 | 79.06 |
| PUFA | 7.47 | 7.16 | 7.16 | 13.78 | 13.78 | 8.70 | 9.05 | 8.86 |
| Oleic/Linoleic | 10.82 | 10.79 | 10.79 | 4.89 | 4.89 | 9.39 | 8.90 | 9.48 |
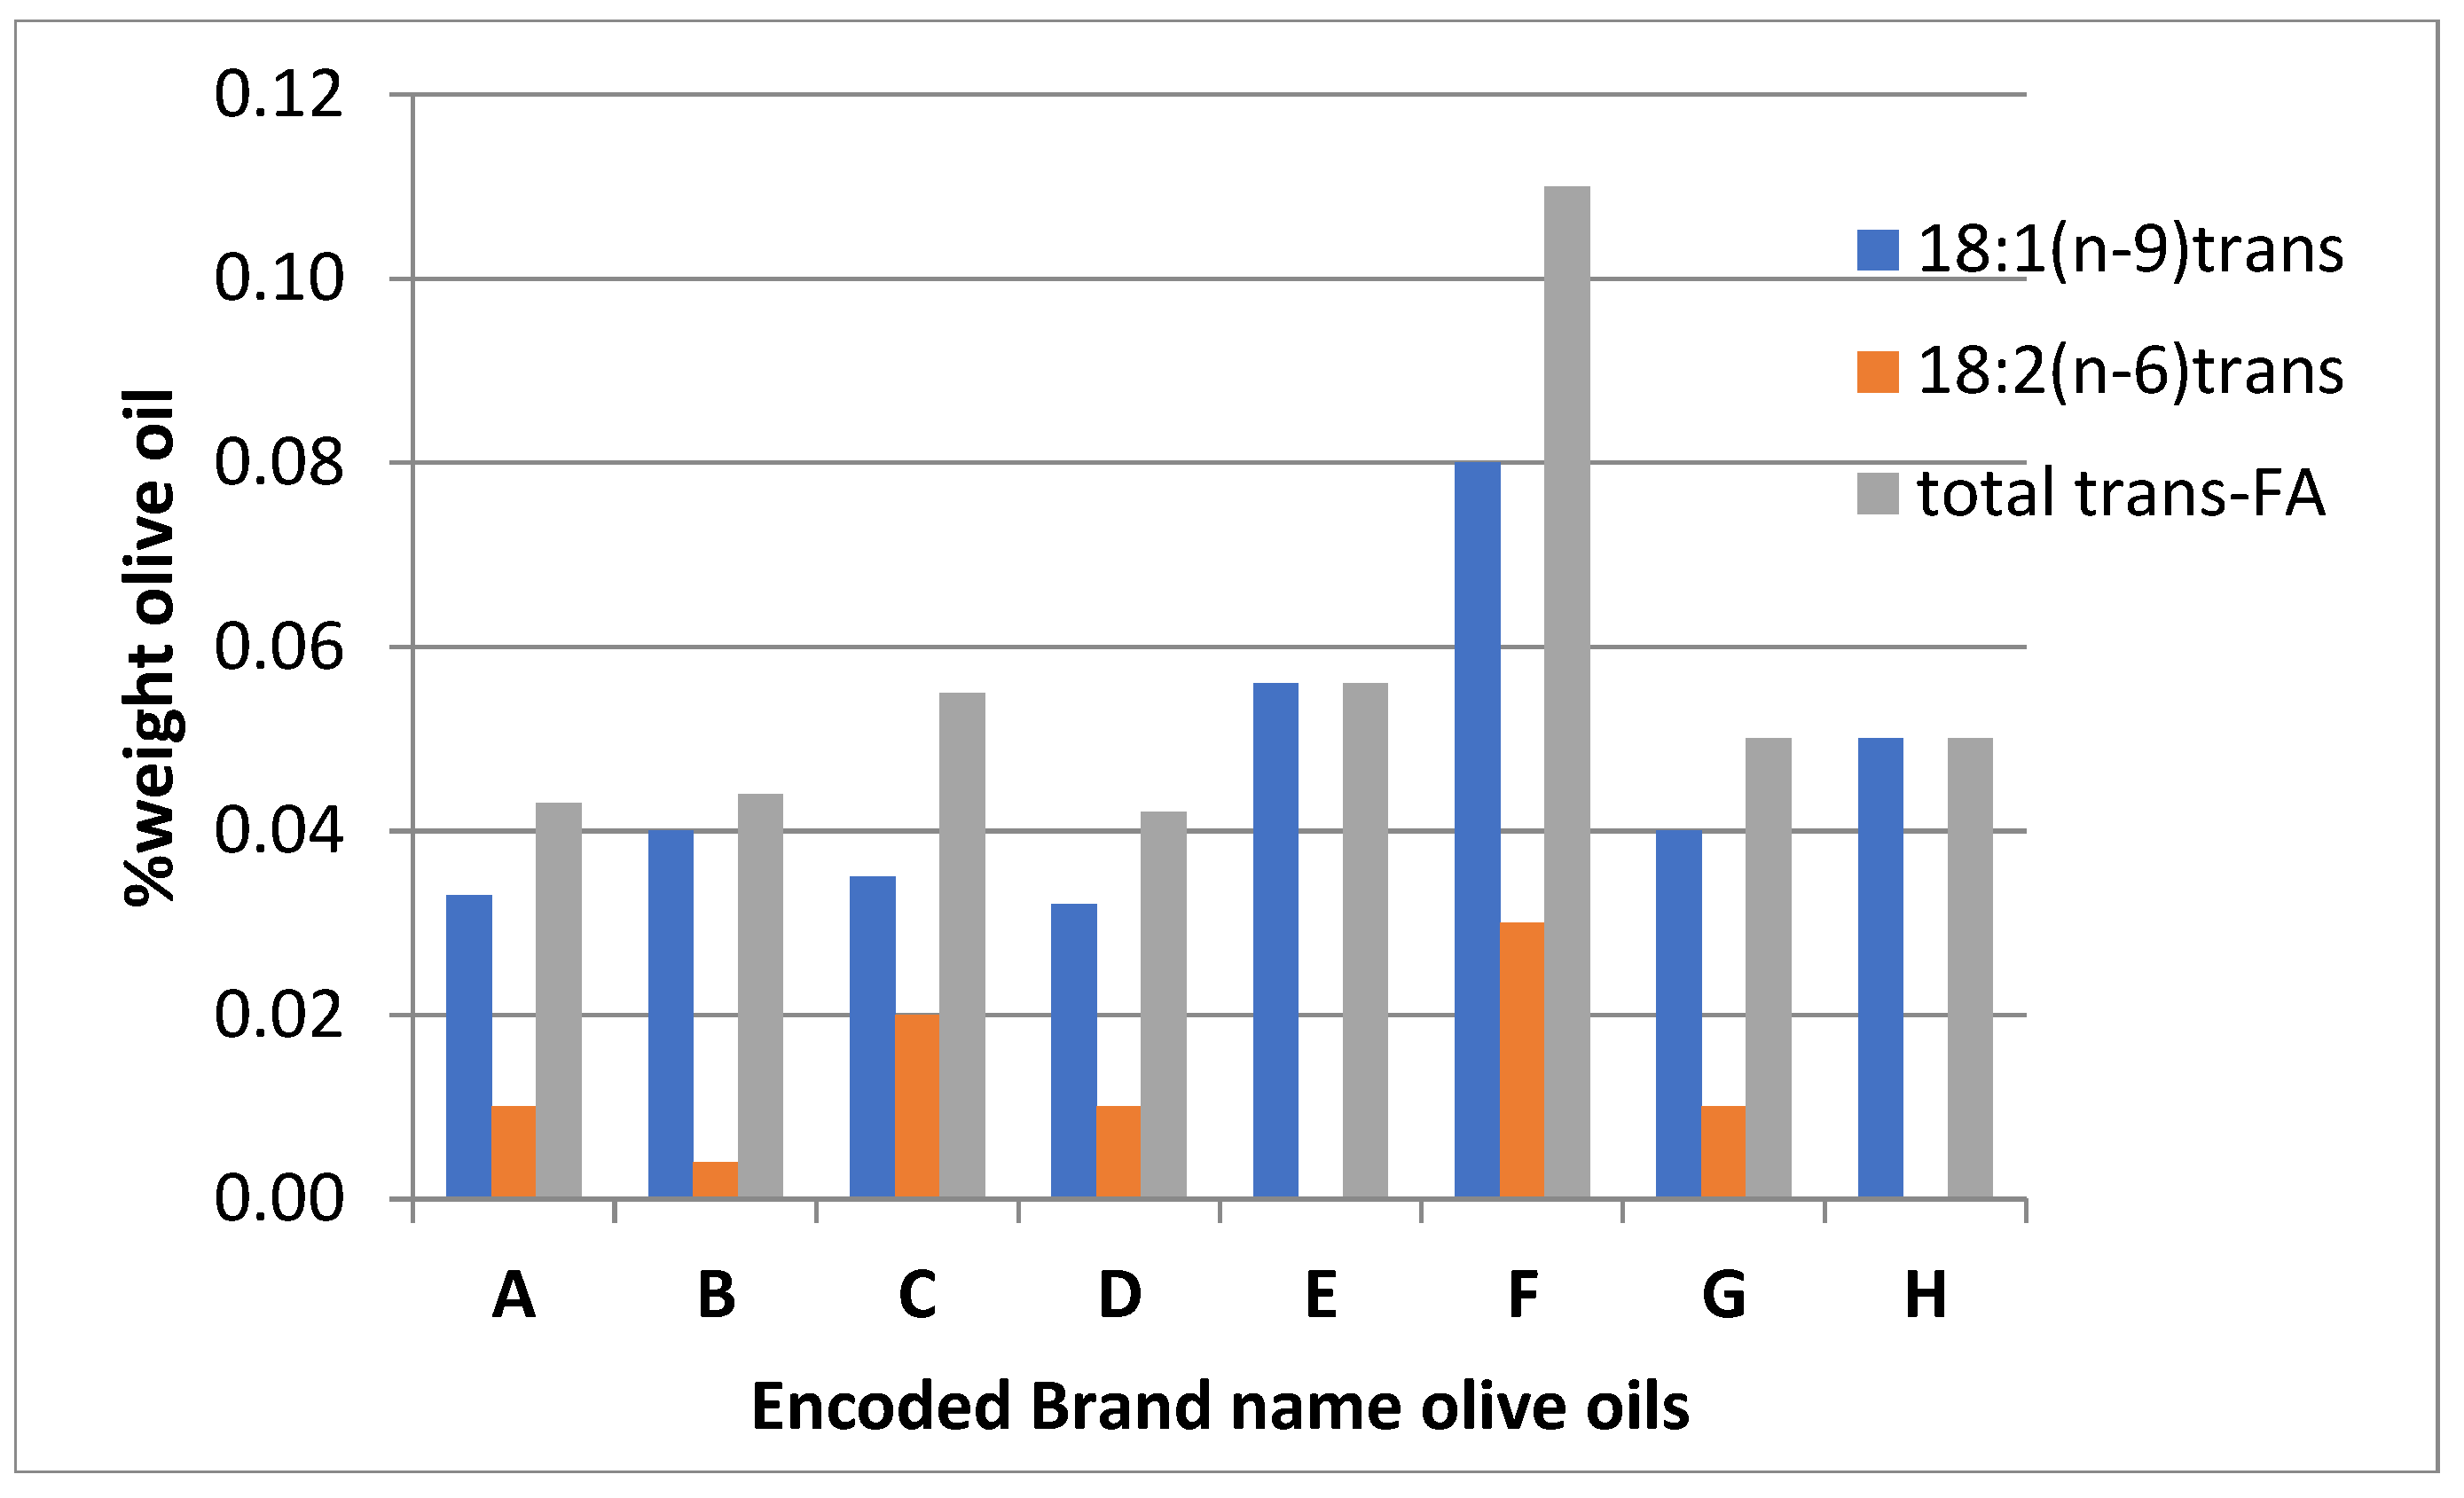
Trans-Fatty Acids Content
Studying trans-FA isomers: trans-C18:1(n-9), trans-C18:2(n-6), and trans-C18:3(n-3) on the analyzed olive oils indicates a variation of total trans-FA in the intervale 0.04 to 0.11 %. According to the EU regulation 2568/91, the threshold of trans-FA must be 0.05% w/w oil, it indicates that there is non-compliance with the information in labeling. Was found that in two cases, B and F codes, the mean values indicate that the samples need to recall and correct the pretended information in the label ‘Extra Virgin Olive Oil’.
Data from controlled intervention studies show that consuming diets containing TFA has adverse effects on blood lipids that predict an increase in coronary heart disease (CHD) risk compared with consuming diets containing cis-monounsaturated fatty acids or cis-polyunsaturated fatty acids and that the effect is dose-dependent (EFSA, 2018).
Figure 1.
Trans-FA content of the Brand name olive oils.
Fatty Acid Clusters and Health Implications
Evaluation of the olive oils indicates that the n-6/n-3 ratio, a parameter recommended by scientists on nutritional values, generally shows a good source of lipids, except for brand names D and E. It is well accepted that the consumption of SFAs increases low-density lipoprotein cholesterol (LDL-C), whereas monounsaturated fatty acids (MUFAs), and polyunsaturated fatty acids (PUFAs) do not. Now, some new evidence is questioning the health benefits of even MUFAs and PUFAs (Baum et al., 2012). The clustering of fatty acids in Saturated (SFA), Monounsaturated (MUFA), and Polyunsaturated (PUFA) groups indicates that Olive Oils of Domestic origin are rich in MUFA and SFA constituents.
Table 2.
Nutritional indicators according to the brand name of Olive Oils.
| Parameter | A | B | C | D | E | F | G | H |
|---|---|---|---|---|---|---|---|---|
| n-6/n-3 ratio | 14.41 | 12.86 | 12.86 | 24.51 | 24.51 | 11.18 | 12.12 | 10.98 |
| SFA | 14.56 | 16.78 | 16.78 | 18.05 | 18.05 | 13.58 | 13.70 | 12.09 |
| MUFA | 77.96 | 76.09 | 76.09 | 68.16 | 68.16 | 77.71 | 77.25 | 79.06 |
| PUFA | 7.47 | 7.16 | 7.16 | 13.78 | 13.78 | 8.70 | 9.05 | 8.86 |
| Oleic/Linoleic ratio | 10.82 | 10.79 | 10.79 | 4.89 | 4.89 | 9.39 | 8.90 | 9.48 |
Figure 2.
SFA, MUFA, and PUFA of studied brand name olive oils of domestic origin.
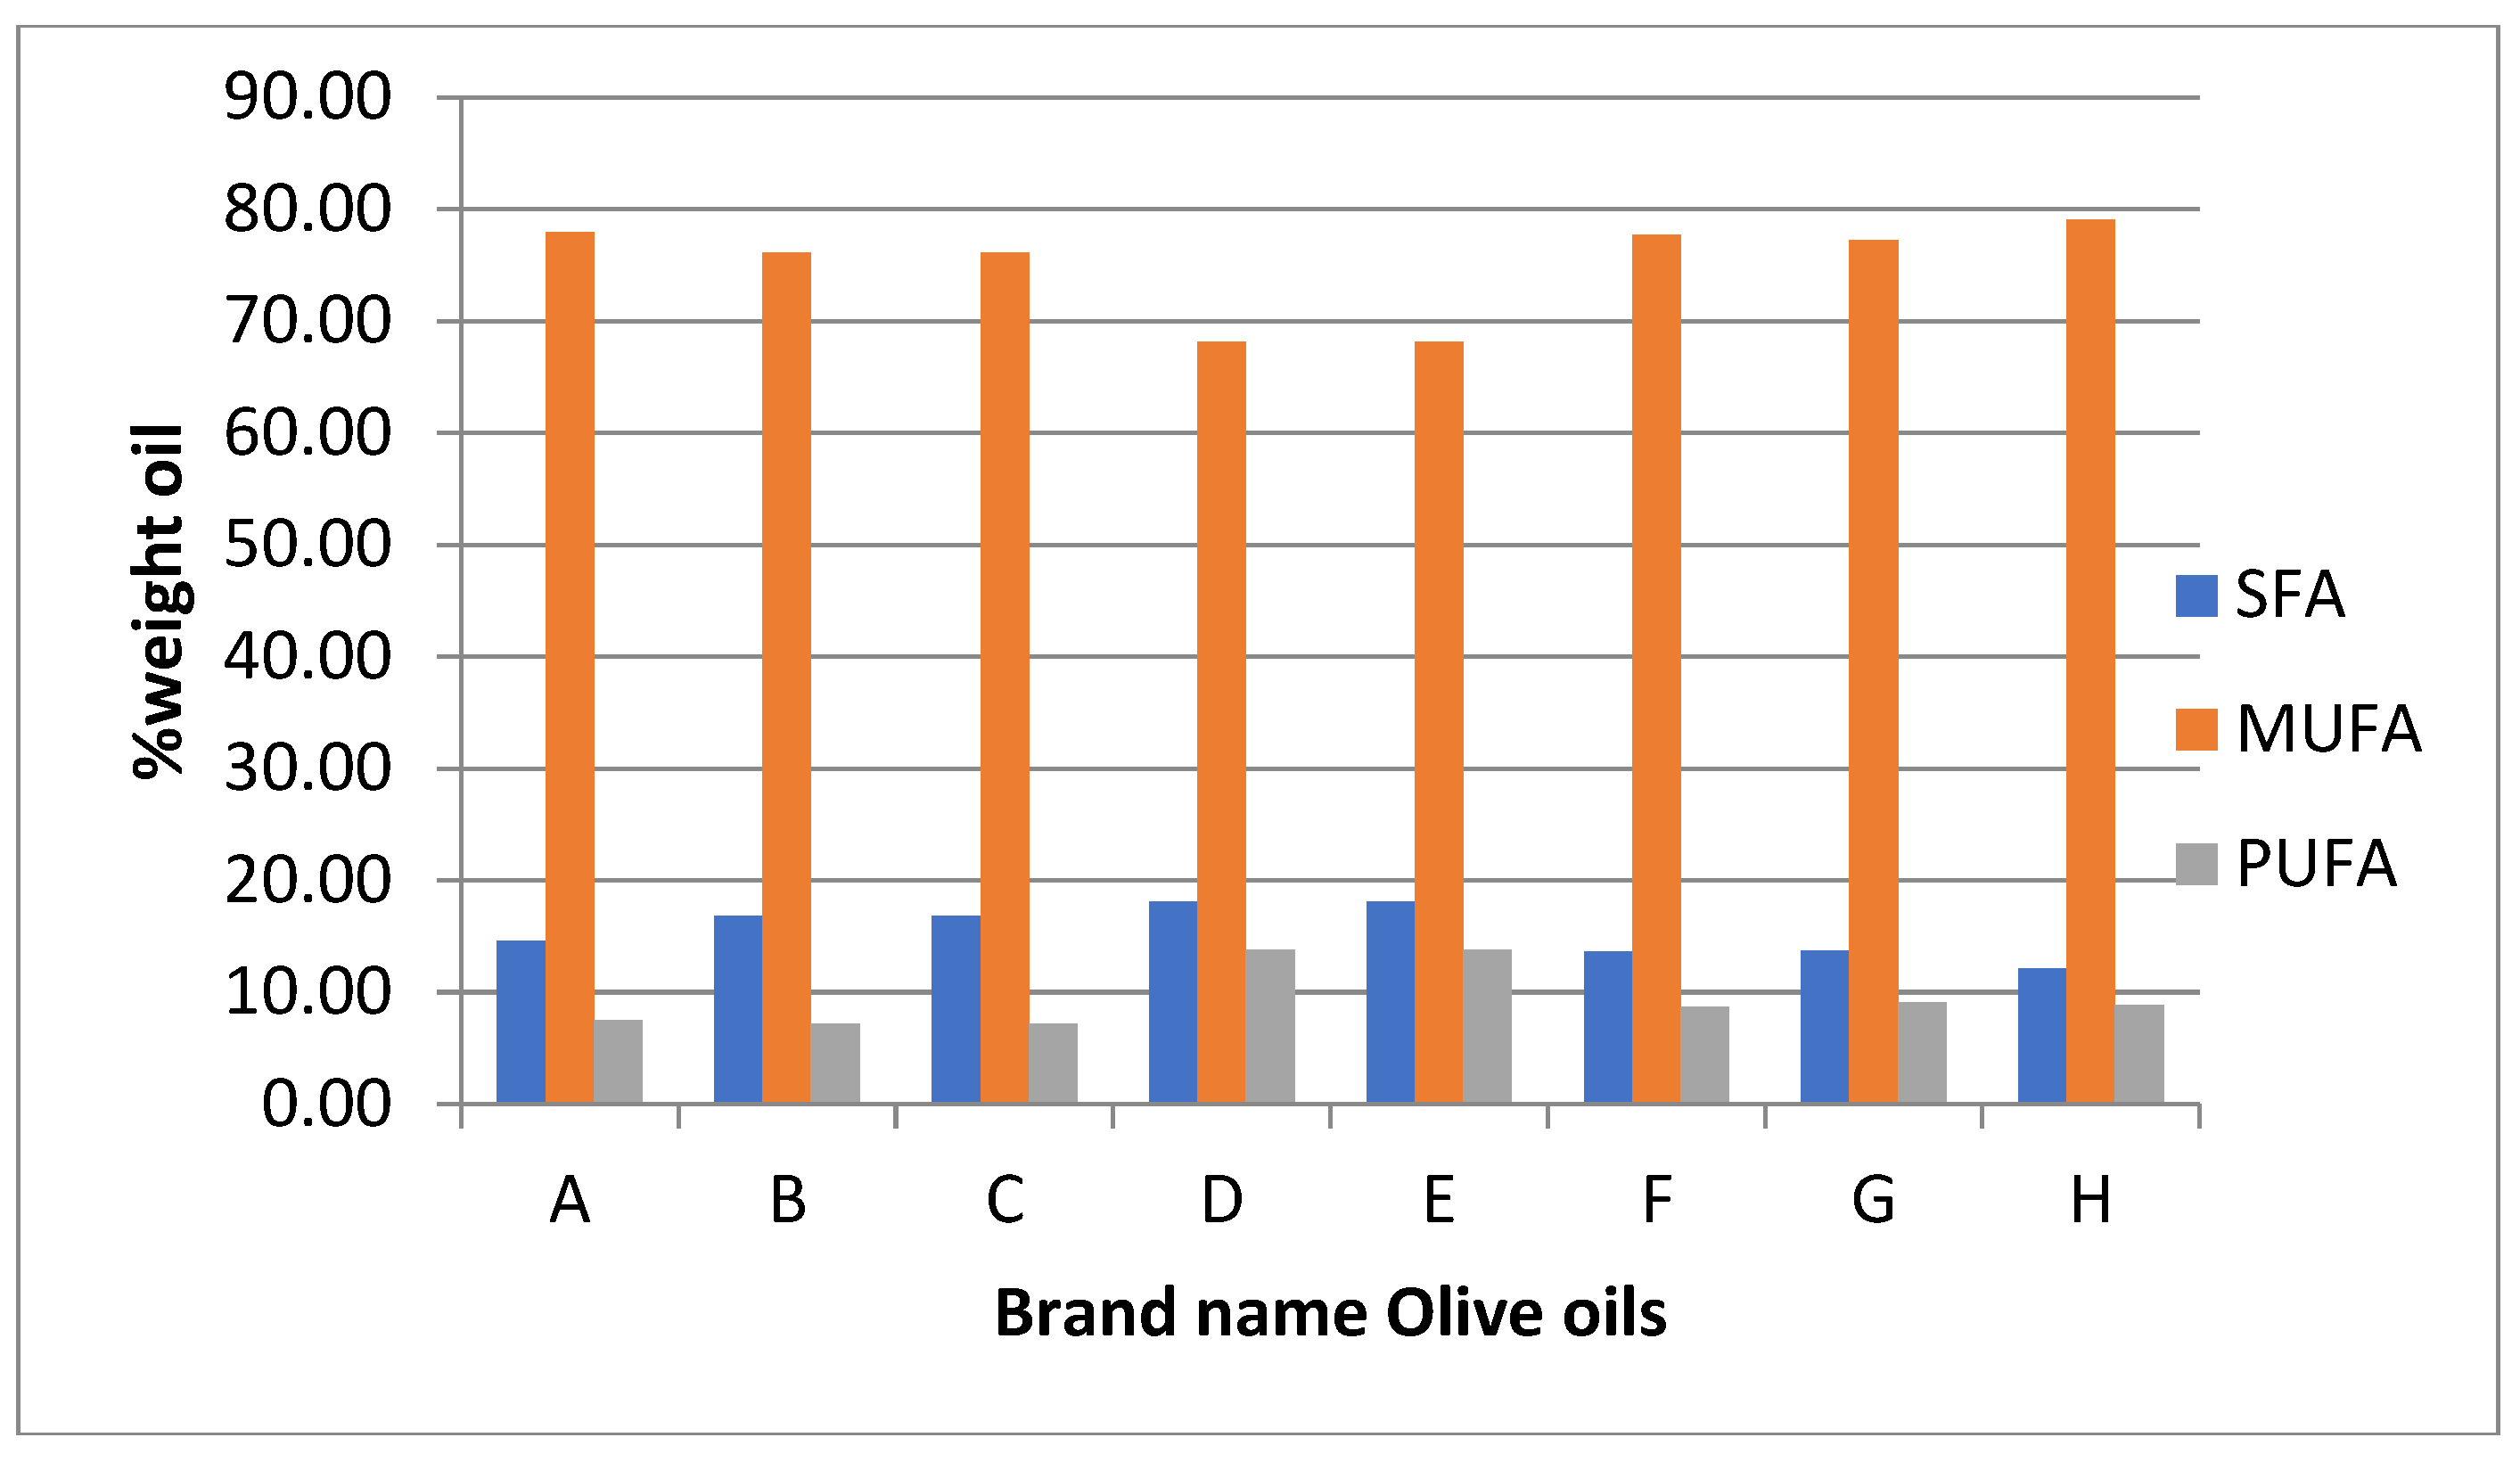
The fatty acid composition of olive oil has an important effect on the oil quality to such an extent that oils with high oleic and low linoleic acid content are preferable from a nutritional and technological point of view (Hernández et al., 2021).
VOO’s oxidative stability principally attributed to its FA composition and phenolic profile. Oils with a high oleic acid/linoleic acid ratio tend to be more stable against oxidation than oils with a low ratio between these two acids (Spatari et al., 2017). The oleic/ linoleic ratio indicates that brand names D and E show low oxidation stability compared with other brand names in the study. A proposal in that case is that according to the principal olive cv, a mixture between Kalinjoti and Nisioti olive cv., must produce VOO of high oxidation stability and a better nutritional profile. Also, the brand name mainly uses Bardhi Tirana olive cv., must mix the olive oil with other olive cvs from the region like Frantoio cv.
Conclusions
Analysis of the fatty acid content of olive oils available in the retail market in Tirana reveals that local brands do not exhibit signs of adulteration. The product’s origin on the label adheres to FA components compatible with the primary olive cultivars Kalinjot, Nisiot, and Bardhi Tirana. Nutritional profiles suggest a favorable n-6/n-3 ratio for most brands. The oxidative stability is associated with the predominant olive cultivar in the originating region. We determine that Kalinjoti olive oil may be marketed as mono-cultivar OO. However, Nisiot and Bardhi Tirana should not be marketed as mono-cultivar OO due to their reduced oxidative stability.
Acknowledgments
The authors did not receive financial support to conduct this study.
References
- Adefegha, S. A., Oboh, G., & Oluokun, O. O. (2022). Food bioactives: the food image behind the curtain of health promotion and prevention against several degenerative diseases. In Studies in Natural Products Chemistry, Ed: Atta-ur-Rahman, Elsevier, Netherlands, 72, 391-421. [CrossRef]
- Angerosa, Campestre and Giasante, (2006). Analysis and Authentication, In: Olive Oil: Chemistry and Technology. Ed by. D. Boskou, 2006, AOCS, Champaign, Illinois, USA.
- Baum, S.J., Kris-Etherton, P.M., Willett, W.C., Lichtenstein, A.H., Rudel, L.L., Maki, K.C., Whelan, J., Ramsden, C.E., Block, R.C. (2012). Fatty acids in cardiovascular health and disease: a comprehensive update. Journal of Clinical Lipidol. 6(3):216-34. Epub 2012 Apr 13. PMID: 22658146; PMCID: PMC9398216. [CrossRef]
- Belkouch, M. Hachem, M. Elgot, A. Van, A.L. Picq, M. Guichardant, M. Lagarde, M. Bernoud, H.N. (2016). The pleiotropic effects of omega-3 docosahexaenoic acid on the hallmarks of Alzheimer’s disease. Journal of Nutritional Biochemistry, 38, 1-11. [CrossRef]
- Boskou, D., Blekas, G. & Tsimidou, M. (2006). Olive Oil Composition, in: Olive Oil Chemistry and Technology 2nd Edition (Ed. Dimitrios Boskou), AOCS Press, Champaign, Illinois, USA, pp.41-72.
- Brouwer, I.A. (2016). Effect of trans-fatty acid intake on blood lipids and lipoproteins: a systematic review and meta-regression analysis. Geneva: World Health Organization; pp. 94.
- C. Tarabanis, C. Long, B. Scolaro, S. P. Heffron, (2023). Reviewing the cardiovascular and other health effects of olive oil: Limitations and future directions of current supplement formulations, Nutrition, Metabolism and Cardiovascular Diseases, 33/12, 2326-2333. [CrossRef]
- EC Reg. No 1989/2003. Amending Regulation (EEC) No 2568/91 on the characteristics of olive oil and olive-pomace oil and on the relevant methods of analysis.
- EC Reg. No 2081/92Protected designations of origin (PDO) and geographical indications (PGI) under Regulation.
- EC Reg. No 2568/91. On the characteristics of olive oil and olive-residue oil and on the relevant methods of analysis.
- EFSA (European Food Safety Authority), (2018). Scientific and technical assistance on trans fatty acids. EFSA supporting publication 2018: 15(6): EN-1433. 16 pp. [CrossRef]
- FAOSTAT, (2022). Crops and livestock products Retrieved November 19, 2024, from https://www.fao.org/faostat/en/#data/QCL.
- Gaforio, J.J., Visioli, F., Alarcón-de-la-Lastra, C., Castañer, O., Delgado-Rodríguez, M., Fitó, M., Hernández, A.F., et al. (2019). Virgin Olive Oil and Health: Summary of the III International Conference on Virgin Olive Oil and Health Consensus Report, JAEN (Spain) 2018. Nutrients, 11(9), 2039 . [CrossRef]
- Guasch-Ferre M., Hu F.B., Martinez-Gonzalez M.A., Fito M., Bullo M., Estruch R., et al. (2014). Olive Oil Intake and Risk of Cardiovascular Disease and Mortality in the PREDIMED Study. BMC Medicine, 12/78 . [CrossRef]
- Hernández, M.L., Sicardo, M.D., Belaj, A., Martínez-Rivas, J.M. (2021). The Oleic/Linoleic Acid Ratio in Olive (Olea europaea L.) Fruit Mesocarp Is Mainly Controlled by OeFAD2-2 and OeFAD2-5 Genes Together With the Different Specificity of Extraplastidial Acyltransferase Enzymes. Frontiers in Plant Science, 8/12, 653997 . [CrossRef]
- 16. MAFCP. (2009). Study on actual Olive cultivation and its developing perspectives. Ed: Ministry of Agriculture, Food and Consumer Protection. Tirana. Albania.
- Map of Land Use in Albania. http://www.lib.utexas.edu/maps/atlas_east_europe/albania-landuse.jpg) University of Texas. 1990.
- Mouratidou T, Livaniou A, Martin Saborido C, Wollgast J, Louro Caldeira S. Trans fatty acids in Europe: where do we stand. EUR 26795. Luxembourg (Luxembourg): Publications Office of the European Union; 2014. JRC91353.
- Spatari, C., De Luca, M., Ioele, G., & Ragno, G. (2017). A critical evaluation of the analytical techniques in the photodegradation monitoring of edible oils. LWT – Food Science and Technology, 76, 147–155. [CrossRef]
- Topi, D., Amanpour, A., Kelebek, H., Selli, S. (2019). Screening of aroma profiles in Albanian cvs. Kalinjot and Bardhi Tirana olive oils using purge and trap extraction technique. RISG Rivista Italiana Sostanze Grasse, 96(2), 101-108.
- Topi, D., Guclu, G., Kelebek, H., & Selli, S. (2020). Comparative elucidation of phenolic compounds in Albanian olive oils using LC-DAD-ESI-MS/MS. Journal of Liquid Chromatography & Related Technologies, 43(5–6), 203–212 . [CrossRef]
- Topi, D., Guclu, G., Kelebek, H., & Selli, S. (2021). Olive Oil Production in Albania, Chemical Characterization, and Authenticity. In Olive Oil-New Perspectives and Applications (Eds. Akram, M.). IntechOpen. Rijeka, Croatia . [CrossRef]
- Topi, D., Thomaj, F., Carvalho, A.P. and Gomes, A., (2011). Characterization of olive varieties from Albania: Fatty acid profile and total phenolic content. 7th International Congress of Food Technologists, Biotechnologists and Nutritionists, 20-23 September 2011, Opatija, Croatia. pp. 185.
- Topi, D.; Thomaj, F.; Halimi, E. (2012): Virgin Olive Oil Production From The Major Olive Varieties In Albania. Agriculture and Forestry, 58(2), 87-95.
- Velo, S. & Topi, D. (2016). Analytical study of Kalinjot olive cultivar in the Southern Regions of Albania. III International Congress, “Food Technology, Quality and Safety”, 25-27 October 2016, Novi Sad, Serbia. Proceedings, pp. 429–433.
- Velo, S. & Topi, D. (2017). Characterization of Kalinjoti and Nisioti Monocultivar Virgin Olive Oils produced in Albania. Asian Journal of Chemistry, 29(6), 1347-1350. [CrossRef]
Disclaimer/Publisher’s Note: The statements, opinions and data contained in all publications are solely those of the individual author(s) and contributor(s) and not of MDPI and/or the editor(s). MDPI and/or the editor(s) disclaim responsibility for any injury to people or property resulting from any ideas, methods, instructions or products referred to in the content. |
© 2024 by the authors. Licensee MDPI, Basel, Switzerland. This article is an open access article distributed under the terms and conditions of the Creative Commons Attribution (CC BY) license (http://creativecommons.org/licenses/by/4.0/).
Copyright: This open access article is published under a Creative Commons CC BY 4.0 license, which permit the free download, distribution, and reuse, provided that the author and preprint are cited in any reuse.


