Submitted:
26 November 2024
Posted:
28 November 2024
You are already at the latest version
Abstract
A ready-to-use spectrometer-based product, focusing on data acquisition using a BeagleBone board and a Hamamatsu C12666 spectrometer module is presented. The device meets stringent requirements, including the ability to measure the visible light spectrum over a wide range of intensities, be compact and lightweight, and have customizable electronics to suit different application needs. The system’s primary component is a Hamamatsu C12880 spectrometer module, with a measurement range of 341 nm to 780 nm, supplemented by supporting electronics such as a microcontroller and an analog-to-digital converter. The development encompasses hardware design, the fabrication of a control board, and software development for spectral acquisition and visualization. The software controls the spectral measurement process and facilitates data processing and analysis. The results demonstrate that the designed system can accurately capture spectra and fulfill the specified requirements. Additionally, this work investigates and evaluates the potential migration of the data acquisition system to Field-Programmable Gate Array technology. Such a migration offers several advantages, including real-time processing, parallel data handling capabilities, reduced latency, and greater flexibility in adapting to various spectrometer configurations as well as the possibility to work in a synchronized way with other devices. These improvements would significantly expand the system’s potential applications in real-time spectroscopy and other demanding optical measurement tasks. The proposed system thus provides a foundation for future enhancements that could exploit Field-Programmable Gate Array technology, potentially revolutionizing the efficiency and application scope of portable spectrometry devices.
Keywords:
spectrometer
; readout system
; acquisition electronics
1. Introduction
The development of a ready-to-use product based on a Hamamatsu C12666 spectrometer module, designed to measure the visible light spectrum across a wide range of light intensities is presented in this work. The device is compact and lightweight, featuring customizable electronics tailored to specific application requirements [1]. The key components include the spectrometer module, which has a measurement range of 341 nm to 780 nm, along with supporting electronics such as a microcontroller and an analog-to-digital converter (ADC). The accompanying software will control the spectral measurement process and facilitate data processing and analysis. Additionally, the evaluation of Field Programmable Gate Arrays (FPGAs) has been considered for enhancing the device’s real-time processing [2] and flexibility [3]. To achieve these objectives, the work involves investigating principles and methods for quantifying light, analyzing the operational principles of the Hamamatsu module, determining requirements for measurement electronics to ensure accurate performance, designing and fabricating a control board for the module, developing software for spectral measurements, and conducting measurements to validate the device’s performance against the specified requirements. The application of such systems varies from measuring the fluorescence intensity of used cooking oil, achieving a response peak at 625 nm for olive oil [4], study the effect of environmental sunlight color and shadow colors to brain perception [5], to evaluate saffron quality with the measurement of spectral reflectance in the range of 350–750 nm under white LED illumination [6], or collect and process spectral signals of fruit surface pigment, detecting fruit maturity with high precision and ease of use [7].
2. Spectrometer Fundamentals
MEMS-based spectrometers offer a compact and portable design, utilizing low-voltage driven translational MEMS micro-mirrors, which enable sub-millisecond scan times and provide robustness against shock and vibrations [8,9]. Their small form factor allows integration into handheld devices and even smartphones, making them suitable for on-site spectroscopic analysis [8,10]. These spectrometers achieve high spectral resolution and cover a wide operational range; for example, MEMS-based Fourier Transform Spectrometers (FTS) can reach 0.55 nm spectral resolution at a 531.9 nm wavelength [11]. The application of compressive sensing theory further enhances resolution while reducing the need for long actuator travel ranges [12]. The versatility of MEMS spectrometers allows for real-time qualitative and quantitative measurements of absorbance and emission spectra, enabling the detection of multiple analyses simultaneously [9]. Integration with fiber-optic sensors expands their application scope for smart sensor solutions. Advanced optical components such as Fabry-Perot interferometers and diffractive MEMS devices improve performance through high image contrast, rapid switching speeds, and large active areas [13]. These components enable the selection of arbitrary spectral bands, enhancing spectrometer performance for remote sensing and environmental monitoring applications [13]. The miniaturization and batch fabrication capabilities of MEMS technology make these spectrometers cost-effective and scalable for mass production [14]. Their small size and reduced cost facilitate integration into smartphones and IoT devices, broadening their range of applications [8,10].
2.1. C12666: The Chosen Spectrometer
The C12666 spectrometer used in this work (see Figure 1 offers several advantages, including its compact size, low power consumption, and fast data acquisition speed [15]. These features enable real-time functionality and portability, making it ideal for field applications. Additionally, its integrated design simplifies integration into portable systems. To fulfill the specified requirements, the information provided by Hamamatsu specifications has been followed. The main features of the C12666 include its ultra-compact size, which is less than half the volume of its predecessor (C10988MA-01), allowing integration into various portable and mobile measurement devices. It has a spectral response range of 340 to 780 nm, making it suitable for a wide range of applications in color monitoring and spectral analysis. The spectral resolution is typically 12 nm, with a maximum of 15 nm. Additionally, the hermetic package provides high reliability against moisture, which is critical for use in variable environments, such as the case of the main application where the present device will be used, as it will be operated in field measurements. The device also features a linear CMOS image sensor with an integrated optical slit, enhancing sensitivity and measurement accuracy. The C12666 spectrometer is ideal for a variety of applications, including water quality monitoring to detect contaminants and assess water purity, environmental measurement instruments for analyzing air quality and other parameters, and mobile measurement equipment that can be integrated into portable devices such as smartphones and tablets for field spectral analysis. It is also applicable in color control for printers and printing machines to ensure color accuracy, as well as in light and LED testing to evaluate the emission spectrum of light sources and LEDs [16].
3. Readout System Specifications and Architecture
The data acquisition system must satisfy several key specifications. Firstly, it must be compatible with the C12666 spectrometer, allowing it to read the signals generated by the device. The BeagleBone (BB) serves as the central processing platform, managing data acquisition, controlling the spectrometer, and performing initial signal processing [17,18]. Additionally, a high-precision ADC is included to convert the spectrometer’s analog signals into digital data [19]. An efficient communication interface is implemented to facilitate seamless interaction between the spectrometer and the BB. Furthermore, a control and acquisition software will be developed to configure and control the spectrometer, acquire and process data, and store the results. Finally, the system will feature compact PCBs designed for easy connection with the BB, ensuring an efficient and streamlined setup.
The hardware architecture of the readout system (see Figure 2) revolves around several key components, each connected to facilitate the acquisition, conversion, and processing of spectroscopic data. At the heart of the system is the C12666 Spectrometer, which captures the optical signal and generates an analog output. This analog signal is transmitted via a thicker line, indicating its critical path, to the ADC. The ADC converts the incoming analog signal into digital form, which is then routed to the BB for processing.
A custom PCB interfaces between the spectrometer, ADC, and BB, ensuring smooth communication and signal conditioning. Meanwhile, a Power Supply Unit provides the necessary power to all components, including the spectrometer, ADC, and BB. Additionally, control signals are sent from the BB to the spectrometer to manage its operation, completing the data acquisition loop. The flow of the spectrometer data from capture to processing is emphasized by the thickened lines connecting the spectrometer, ADC, and BB.
4. Implementation and Component Selection
This section provides a comprehensive overview of the components employed in the readout system, detailing not only the selected hardware but also the rationale behind their integration into the overall architecture. The design of the system prioritizes compatibility, efficiency, and performance, ensuring that all elements work seamlessly together. The main components selected for this project include the ADC, BB, digital buffer, operational amplifier, transformer, digital isolator, voltage regulator, and connectors. Each of these components plays a critical role in the data acquisition process, contributing to the accuracy and reliability of the measurements taken by the C12666 spectrometer. By selecting high-performance components, this readout system aims to enhance signal integrity, reduce noise, and provide real-time data processing capabilities, which are essential for obtaining precise spectral data. As the system is designed to be modular and scalable, there is a critical need to integrate a multiplexer into the readout system to facilitate the simultaneous readout of multiple spectrometers. This enhancement would allow the same data acquisition system to efficiently handle inputs from several C12666 spectrometers, significantly increasing the versatility and application range of the setup. The incorporation of a multiplexer would enable the selection of signals from different spectrometers while minimizing the impact on signal integrity.
4.1. FPGA-Driven Enhancements and Innovations
Additionally, a possible improvement includes expanding the system’s capacity to read from multiple spectrometers concurrently. In this context, the use of Field-Programmable Gate Arrays (FPGAs) becomes increasingly important, as they can process and manage multiple data streams in parallel. The FPGAs would allow for real-time preprocessing of the acquired data, optimizing the speed and efficiency of the signal processing tasks. By leveraging the parallel processing capabilities of FPGAs, the system can achieve higher throughput and responsiveness, making it suitable for advanced applications where real-time data analysis is crucial.
4.2. Analog-to-Digital Converter
An ADC is a crucial component in a data acquisition system, as it converts the analog signals captured by sensors into digital data that can be processed by a computer. In the case of the C12666 spectrometer, the ADC is responsible for digitizing the signals from the photodetector array.
The key parameters of an ADC include:
- Resolution: Determines the number of bits used to represent the digital signal, which affects the precision of the conversion.
- Sampling rate: Indicates the frequency at which the ADC samples the analog signal, which is critical for accurately capturing fast-changing signals.
- Linearity: Reflects the ability of the ADC to produce a digital output that is linearly proportional to the analog input.
From the spectrometer’s specifications, a 16-bit resolution is primarily required to enable precise conversion of the analog signals from the spectrometer. The chosen ADC is the ADS8689, which, in addition to offering a 16-bit resolution, has a sampling rate of up to 100 kSPS, allowing it to capture the variations in the spectrometer’s signal and provide an accurate real-time representation of the spectrum. It also has low input noise and high linearity, ensuring accurate and consistent conversions. High linearity is particularly important in spectroscopic applications to maintain data integrity across the entire measurement range.
4.3. BeagleBone Board
The BB is a low-cost, open-hardware single-board computer developed by BeagleBoard.org. It is widely used in various applications ranging from educational projects to complex embedded systems. Equipped with a powerful ARM Cortex A8 processor, the BBB is versatile and supports multiple operating systems, making it an ideal tool for both developers and hobbyists. Its capability to achieve real-time processing, such as low-latency audio and sensor data processing using Xenomai real-time kernel extensions, makes it suitable for applications that demand ultra-low latency [22]. Additionally, its use in IoT networks and machine learning applications demonstrates its ability to handle data efficiently [23,28]. Despite being less popular than other boards, the BBB offers significant performance improvements, especially in applications requiring higher processing power [21].
The key features of the BB that make it ideal for this project include:
- High-performance processor: The ARM Cortex-A8 core provides sufficient processing power to handle real-time data acquisition and processing tasks.
- Connectivity: The BB offers multiple input/output (I/O) interfaces, including USB, GPIO (General Purpose Input Output), and SPI (Serial Peripherical Interface), which facilitate integration with the spectrometer and other peripheral components.
- Support community: The extensive developer community using the BB provides numerous resources, code examples, and technical support, which can accelerate project development [28].
In this work, the BB will serve as the central platform for data acquisition and processing, managing communication with the C12666 spectrometer and running the necessary software for spectral data visualization and analysis.
4.4. Digital Buffer
As indicated in the spectrometer’s specifications, a digital buffer is needed for the Gain, CLK, ST, and EOS pins to avoid signal degradation during transmission. The digital buffer used is the SN74HC125D, which contains four independent buffers with tri-state outputs. Each gate performs the Boolean function in positive logic. The SN74HC125 device has balanced CMOS outputs that can source and sink currents similarly, allowing it to handle fast loads with rapid transitions. However, the device’s current handling capacity is higher than what it can safely support, so it is important to respect the electrical and thermal limits. Additionally, the device can handle specified maximum capacitive loads without exceeding the specifications. If a higher load is required, which is not the case in the present case, a series resistor would be recommended to limit the current and protect the device. The outputs can be put in a high-impedance state, where they neither supply nor sink current. Pull-up or pull-down resistors can be used to maintain the HIGH or LOW state during this high-impedance state. The standard CMOS inputs of the SN74HC125 have high impedance, typically modeled as a parallel resistance and input capacitance. Signals applied to these inputs should have fast transitions to avoid excessive current consumption and potential oscillations.
4.5. Operational Amplifier
The Video pin of C12666 goes to an operational amplifier before entering the ADC. This is because the signal generated by the Video pin is analog and needs to be amplified and conditioned. The increased current consumption at the video output terminal also increases the chip temperature, thereby increasing the dark current. To avoid this, an operational amplifier is connected to minimize current flow. A JFET or CMOS input operational amplifier is recommended. The chosen amplifier is the OPA320, which belongs to a new generation of CMOS amplifiers with the following main features: low noise (7 nV/), high precision, low power consumption (1.45 mA), a wide operating voltage range (1.8V to 5.5V), fast response, low input bias current, and good power supply noise immunity. These characteristics ensure that the OPA320 can provide a clear and precise signal, eliminating dark current and preserving the quality of the acquired spectral data. The OPA320AIDBVR is a wideband amplifier. To achieve the device’s full operational performance, a high-frequency PCB design is required. Bypass capacitors should be connected between each source pin and ground as close as possible to the device. Figure 3 shows the block diagram of the chosen ADC.
4.5.1. Transformer
The transformer used will be the SN6501, as previously mentioned, it is recommended by the ADS8689 manufacturer. This transformer is a monolithic oscillator/power controller designed specifically for small form factor isolated power supplies in isolated interface applications. The device drives a low-profile center-tapped primary transformer from a 3.3V or 5V DC power source. The secondary can be wound to provide any isolated voltage based on the transformer’s turns ratio. The SN6501 consists of an oscillator followed by a gate control circuit that provides complementary output signals to drive N-channel power switches with ground reference [27].
4.5.2. Digital Isolator
The digital isolator also recommended by the ADS8689 manufacturer is the ISO7640FM, which will allow digital signals to be transferred between two parts of a circuit while maintaining electrical isolation between them. This isolation is crucial for protecting sensitive circuits and improving signal integrity in noisy environments or when there are potential differences between the parts of the circuit. The ISO7640FM provides galvanic isolation up to 6 KVpk for 1 minute by UL and VDE standards. The device is also certified up to 5 KVrms, with reinforced isolation at 400 Vrms according to the final equipment standards EN/UL/CSA 60950-1 and 61010-1, meaning digital signals can be transferred between two circuits without direct electrical connection. This protects sensitive components from potentially dangerous voltage differences [24]. The ISO7640FM offers four isolation channels, allowing the simultaneous transmission of multiple digital signals across an isolation barrier. Each isolation channel includes an input and output logic buffer, separated by a silicon dioxide (SiO2) isolation barrier. When used with isolated power sources, these devices prevent noise currents on a data bus or other input circuits from interfering with or damaging sensitive circuitry. The devices have TTL input thresholds and can operate with supplies of 2.7V, 3.3V, and 5V. All inputs tolerate up to 5V when powered with 3.3V or 2.7V supplies [24]. This digital isolator supports data rates up to 150 Mbps, which is sufficient for most high-speed digital communication applications. With a typical propagation delay of 10 ns, the ISO7640FM ensures fast signal transmission, maintaining synchronization in critical applications. It also has low power consumption, which is beneficial for portable applications or those where energy efficiency is a priority. Its high noise immunity ensures that digital signals are transmitted without interference [24].
4.5.3. Voltage Regulator
The selected voltage regulator belongs also to the family recommended by the ADC manufacturer, the TPS7A4700RGWT. This model is part of a series of positive voltage linear regulators (+36 V) characterized by ultra-low noise (µVRMS) and low dropout (LDO), capable of supplying a load of 1 A. The output voltage of the TPS7A4700RGWT can be configured through a user-programmable PCB design (up to 20.5 V) or adjustable (up to 34 V) using external feedback resistors. This device is built with bipolar technology to ensure high precision, making it an ideal choice for powering operational amplifiers, ADC, digital-to-analog converters (DAC), and other high-performance analog circuits in critical applications, such as in the medical, RF, and test and measurement fields. Furthermore, the TPS7A47 is ideal for post-regulation after a DC-DC converter. By filtering the output voltage ripple inherent to DC-DC switching conversions, the maximum system performance is ensured in sensitive instrumentation, test and measurement, audio, and RF applications.
4.5.4. Connectors
Finally, the connectors used will be the TSW-123-07-G-D to connect the board to the BB, and the 3-644457-7 7-pin connector to connect the acquisition board to the board where the spectrometer will be installed, using the SAMTEC SSW-107-02-G-S-RA connector.
5. Schematic of the Spectrometer Board
The schematics design (see Figure 4) for the acquisition board focuses on ensuring components’ correct configuration and distribution in the circuit. The board is divided into two ground planes to separate power sources and reduce noise.
6. ADC PCB Design
The ADC PCB design considers the dimensions of the BB and the placement of components, such as the Ethernet connector and reset buttons, to avoid obstructions. The PCB (see Figure 5 is designed with four layers of 35 µm copper and is divided into two parts: one for digital connections and another for analog signals, as recommended by the ADC manufacturer. Components are organized so that digital ones are placed on one side and analog ones on the other, minimizing interference. The inner layers 1 and 2 are dedicated to ground planes and power supply voltages (5 V, 3.3 V, etc.) to ensure proper distribution and reduce noise.
7. Beaglebone Startup
The BB can be configured in several ways, connecting it to the PC via a USB cable or as a standalone desktop. In our case, we connect it via USB. In this configuration, the board receives power from the PC through the provided USB cable; no other cables are required. The board can be accessed either as a USB storage device or via the PC’s browser. All power for the board is supplied by the PC through the USB cable. In some cases, the PC may not be able to provide enough power to the board. In that case, an external 5V power supply can be used, but this should rarely be necessary. When connected to the PC, the board will turn on, and the board’s LED will also light up.
8. Software
8.1. SSH Connection to Beaglebone
When powered on, The BB will appear as a storage device, which we will open and click on the file named start.htm. This will open the “getting started” page in the browser, which will show a quick start guide for installing the ISO. Once the ISO is installed, the BB, while connected via USB, should be running a DHCP server that will provide the computer with an IP address, which will depend on the type of USB network adapter compatible with the operating system of the computer. The BB will reserve two IPs for itself. At this point, it is needed to establish an SSH connection to access the BB. After establishing the SSH connection, the board can be programmed using the Cloud9 IDE, which is an open-source web-based programming platform that supports various programming languages. This software is pre-installed on the BB. The code written in the web browser will be directly transferred to the BB via SSH.
8.2. Signal Acquisition
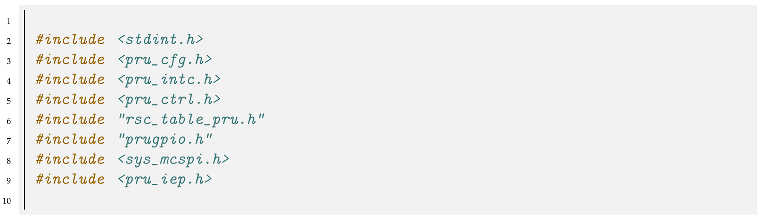
To perform the acquisition, the PRU (Programmable Real-time Unit) has been programmed. This is an independent microcontroller within the BB that allows for real-time signal capture with high precision and low latency. This code is essential for acquiring data from the sensor by configuring the appropriate registers and controlling the acquisition sequences. Before creating the main code where control and data acquisition occur, the pins need to be properly configured. The PRU has direct access to a subset of GPIOs available on the BB via registers. Knowing which bit of the register corresponds to each pin of the BB, the constants (the programmed pins as PRU inputs and outputs) can be configured. Once this is defined, the main code related to control and data acquisition using the PRU (Programmable Real-time Unit) can follow. First, all the necessary libraries for peripheral management and specific PRU configurations are included (see Listing Section 8.2), such as interrupt controllers, pin configurations, SPI, and timers. It is worth noting that these libraries, part of the main code, as well as the functions, have been obtained from GitHub projects.
| Listing 1. Definition of the libraries used by the readout system. |
 |
Then, the constants for the specific configuration of the ADC are defined. This is achieved by issuing the appropriate SPI command. In our case, the ADC is configured with internal. The next step implies the initialization of the counter and SPI communications.
9. Processing and Communication on the Server
A server in Python has been developed to facilitate the initial processing of the acquired data and its communication with the client. Using Flask together with SocketIO, the server will handle real-time requests, allowing interaction with the user interface and managing data transmission from the PRU to the front end.
The libraries used are as follows:
- Flask: A lightweight web framework for Python.
- os, base64, datetime, mmap, struct: Standard Python library modules for file handling, encoding/decoding, date management, memory mapping, and binary data manipulation, respectively.
- numpy: A library for handling arrays and mathematical operations.
- PIL: A library for image manipulation.
- io: A library for input/output operations in memory.
- flask_socketio: A Flask extension for handling real-time communications using WebSockets.
- threading: A module for handling threads in Python.
First, a constructor of the base Thread class is created to ensure that all thread properties are initialized correctly. Then, the necesary variables are set to False to indicate that the thread is neither paused nor terminated. Next, the a method is called to map the PRU memory and obtain a file descriptor and a memory view. Finally, a list of wavelengths ranging from 340 nm to 780 nm is created, divided into 256 equal parts, which represent the pixels available in the spectrometer. The next step implies the creation of the function that will open the memory device in synchronized read/write mode. Then, the map is started at the initial address. This allows direct access to the PRU memory. The run method defines the main behavior of the background thread. This method runs in an infinite loop to continuously check if the thread is paused. If the thread is not paused, it calls the main method to process the data. It then makes the thread sleep for 200 ms to prevent excessive CPU usage. If the thread is marked to exit, it terminates the thread. In the main method, the first operation establishes an offset in the PRU memory and obtains a pointer to a specific block of memory. Then, we notify the PRU that we are accessing the memory, and wait until the PRU indicates that the measurement is complete, checking that the last value in memory is 0x1 every 10ms. Once the measurement is ready, the binary values are normalized and packaged in chart_data with the wavelength labels. Finally, the data is sent to the client via WebSockets. The normalize_measures method is responsible for converting the binary values read from the PRU memory into a list of integers. To do this, an iteration over the data in 2-byte blocks is done, using struct.unpack to interpret each block as a 16-bit integer in little-endian format. The converted values are added to the adcread list. The obtained values are in counts (each count being 0.0781mV), so if they should be normalized differently, a modification of the function is needed. Next, the functions for saving/downloading/deleting the spectrum graph images have been obtained from GitHub and modified to suit the requirements.
10. Graphical Interface
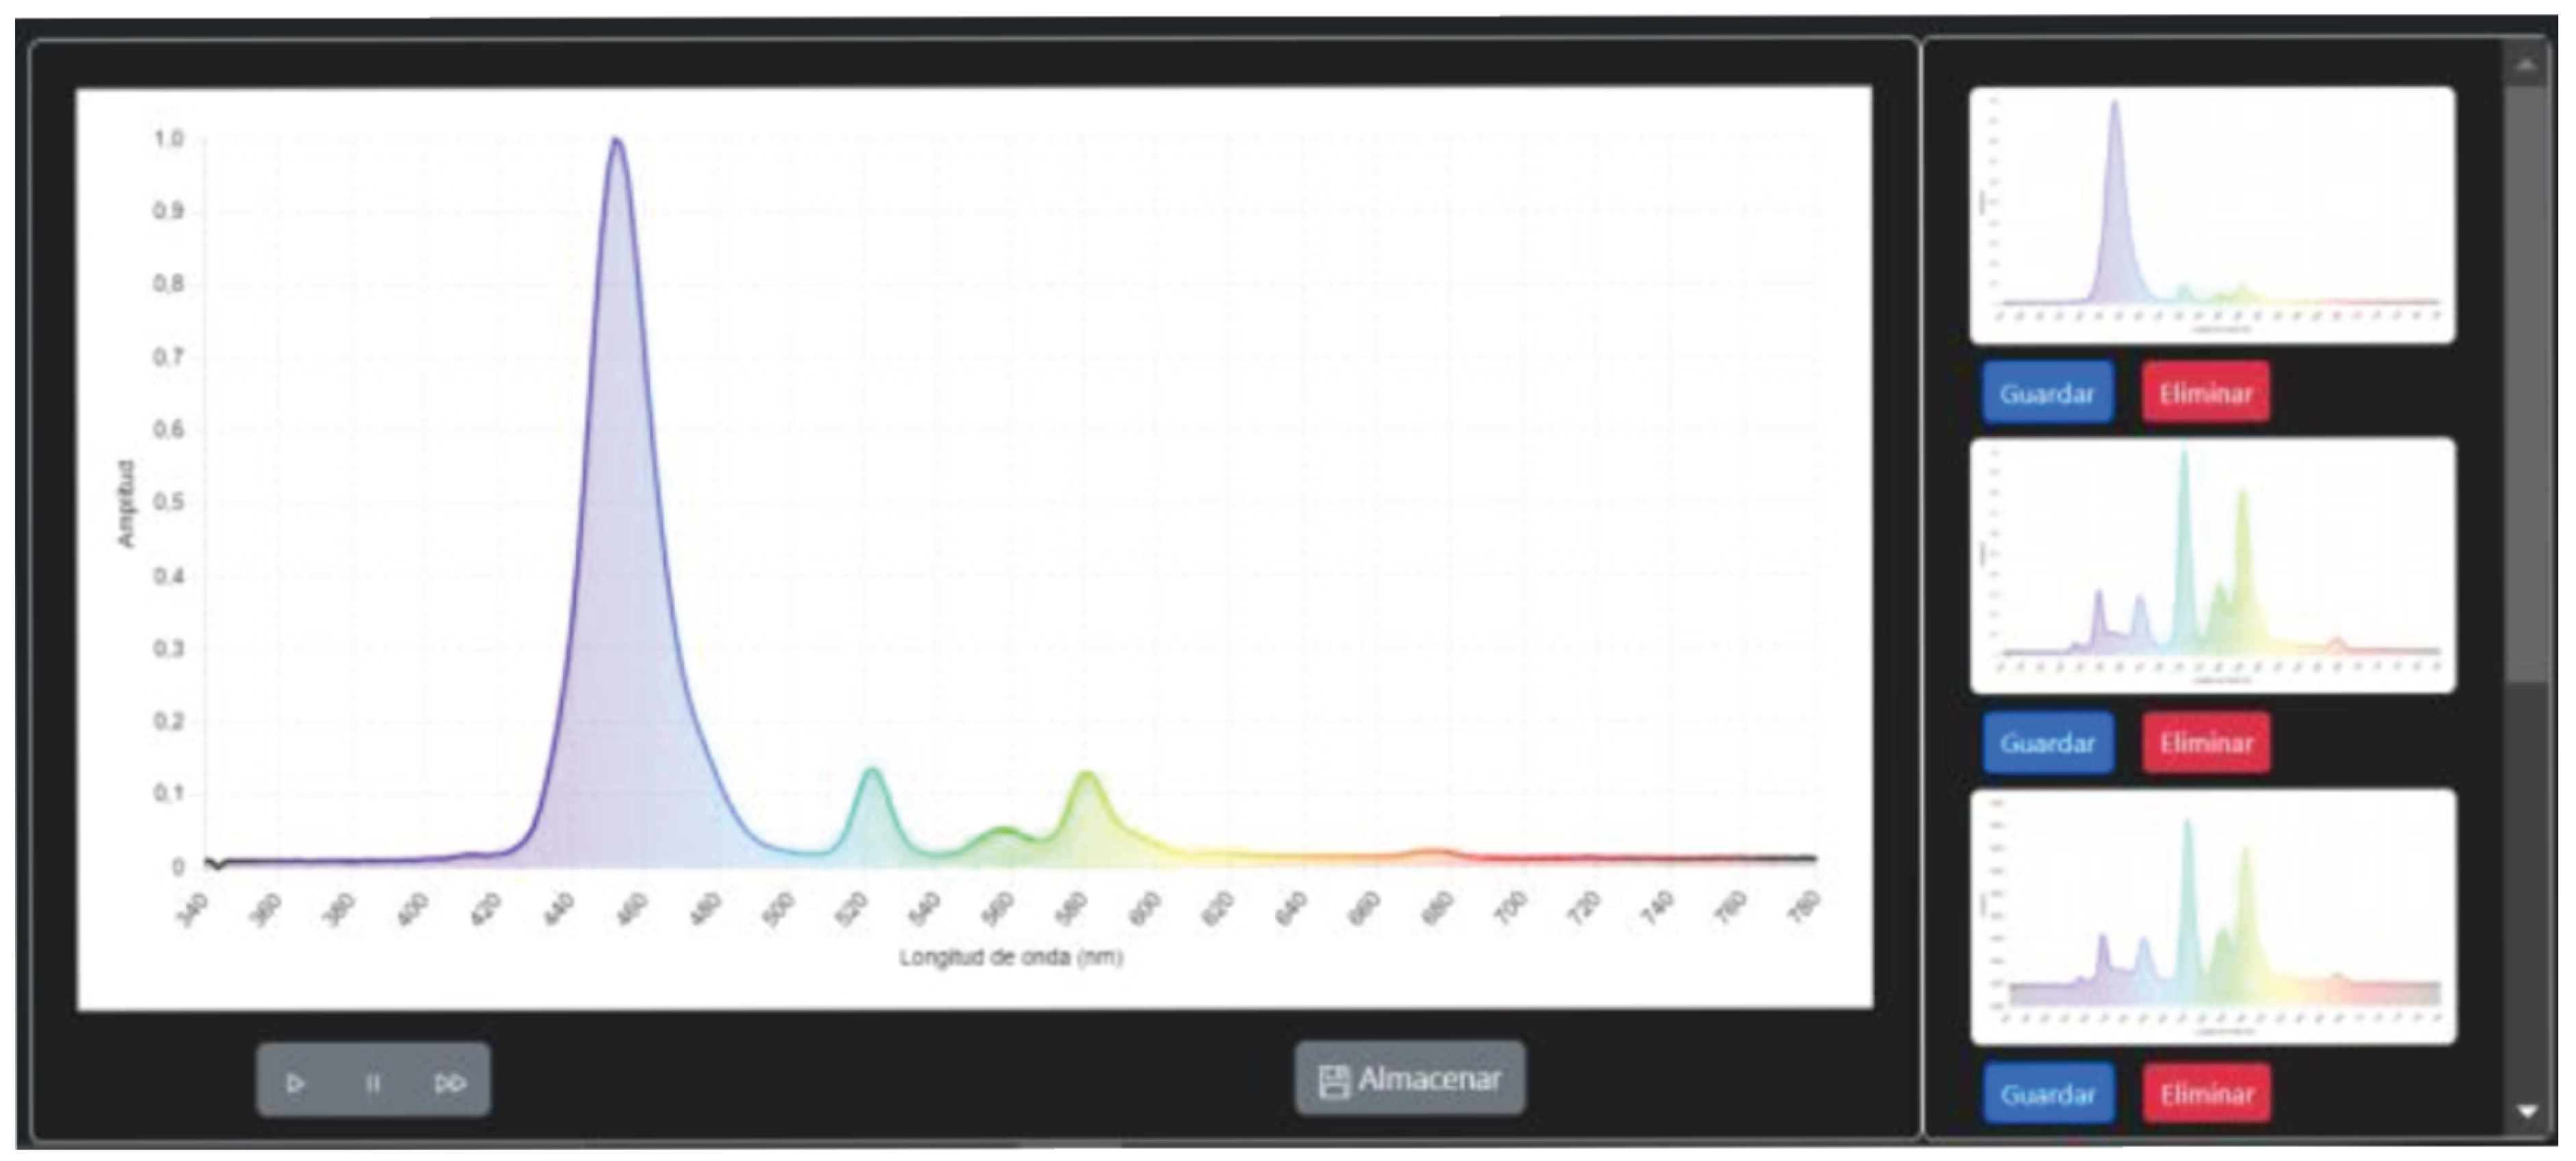
The graphical interface has been created using JavaScript, utilizing libraries like Chart.js to create a dynamic graph of the acquired data in real time. Additional functionalities have also been added to the interface, such as buttons to pause, resume, and save the generated spectrum images. To achieve this, a line chart using Chart.js has been created. The chart is configured to represent the different wavelengths and their corresponding colors for the borders and background using functions to generate gradients. Figure 6 shows an example of the spectrometer display data.
11. Results
At this stage, after verifying that the board design worked correctly by checking its continuity and obtaining the appropriate timings by programming the PRU, we proceed to evaluate the complete implementation. The process involves the following steps:
-
Initial Setup:
-
Navigate to the directory where the acquisition program was developed and load the scripts that configure the pins and load the firmware:cd /var/lib/cloud9/pspi/pru0sudo bash pins.shsudo bash loadfirm.sh
-
-
Server and Web Application Startup:
-
Move to the directory containing the code for launching the server and web application interface:cd /var/lib/cloud9/pspi/clientsudo gunicorn3 -k gevent -w 1 -b 0.0.0.0:5000 app:app
- After executing these steps, open a web browser and access the server address to observe the spectrum.
-
The amplitude is given in counts, with a resolution of 0.078125 mV per count. The data can be adjusted to normalize the amplitude from 0 to 1 (or by removing the maximum and minimum limits from the y-axis in JavaScript) for a clearer view of the spectrum. To verify that the observed spectrum is accurate, an oscilloscope has been used to check the spectrometer’s video signal (see Figure 7).
Since the signal is obtained directly from the spectrometer pin, it includes dark current, but the spectrum matches the results obtained. Finally, an LED with a specific wavelength is used to verify the calibration. In this case, a 470 nm LED was used. As shown in Figure 8, the measured wavelength closely matches the expected value.
12. Potential Improvements
12.1. Potential Improvements Using FPGA Technology
The use of a Field-Programmable Gate Array (FPGA) could significantly enhance the overall performance and capabilities of the existing system by leveraging its parallel processing capabilities and hardware-level flexibility. FPGAs are ideal for applications requiring high-speed data acquisition and real-time signal processing, making them a valuable addition to the development presented in this work. The primary benefits and potential improvements when integrating FPGA technology into the system are outlined below:
- Enhanced Data Processing Speed: The parallel processing capabilities of FPGAs allow multiple operations to be executed simultaneously. This characteristic can be exploited to accelerate the signal processing tasks, such as data normalization and digital filtering, which are currently performed in software. By implementing these algorithms directly on the FPGA, the latency introduced by software execution can be minimized, resulting in a more responsive system capable of real-time data processing.
- Improved Timing Control and Synchronization: FPGAs provide precise control over timing, making them suitable for applications that require accurate synchronization of multiple signals or devices. In the context of the PRU (Programmable Real-time Unit), FPGAs can be used to generate high-precision timing signals, ensuring that the acquisition system operates with greater accuracy. This would be particularly beneficial for coordinating the acquisition with external hardware, such as spectrometers or light sources, to achieve better measurement synchronization.
- High-Speed Data Acquisition: The FPGA’s ability to interface directly with high-speed data converters (e.g., ADCs) allows for the acquisition of data at rates significantly higher than those achievable by software-based systems. This capability can be employed to increase the temporal resolution of the measurements, enabling the system to capture rapid changes in the signal that may otherwise be missed. Additionally, FPGA-based acquisition can reduce the load on the CPU by offloading the data transfer and initial processing tasks.
- Custom Hardware Acceleration for Signal Processing: With an FPGA, it is possible to implement custom digital signal processing (DSP) algorithms in hardware. This approach allows for the acceleration of computationally intensive tasks, such as Fourier transforms or spectral analysis, which are commonly required in spectrometry applications. Hardware-accelerated processing can significantly reduce the time required to compute these operations compared to traditional software implementations.
- Increased System Flexibility and Scalability: The reconfigurability of FPGAs offers a flexible platform for future system upgrades. New functionalities, such as additional data processing algorithms or support for new sensor types, can be implemented through firmware updates without the need for major hardware changes. This adaptability facilitates rapid prototyping and iterative development, allowing for continuous improvement of the system based on experimental results.
- Lower Power Consumption for Intensive Computations: Compared to a general-purpose CPU, FPGAs can achieve lower power consumption for specific tasks by using custom hardware implementations that are optimized for the required computations. This can be particularly advantageous in embedded systems or portable devices where power efficiency is a critical consideration.
In conclusion, integrating FPGA technology into the current system would provide substantial improvements in terms of speed, precision, and flexibility. By taking advantage of the inherent parallelism and customizability of FPGAs, the data acquisition and processing tasks could be performed more efficiently, thus enhancing the performance of the spectrometer application described.
12.2. Potential Improvements Using Fuzzy Logic
Integrating fuzzy logic into the control of the spectrometer scale presents a promising opportunity to enhance performance, particularly in scenarios where light levels vary non-linearly. Currently, the manual adjustment of the scale can be cumbersome and imprecise, especially when dealing with fluctuating environmental conditions.
By implementing an autoscale function driven by fuzzy logic, the system can adapt in real-time, adjusting parameters based on the complexity of light intensity variations. Unlike traditional PID controllers, which may struggle with non-linear relationships, fuzzy logic allows for a more intuitive and flexible approach. This would enable the controller to respond appropriately across a broader range of light conditions, improving accuracy and reliability.
Moreover, fuzzy logic systems can learn from past adjustments, refining their responses over time. This adaptability not only enhances the user experience but could also streamline processes in your ongoing projects, such as AION, where precision is paramount. Ultimately, this integration could lead to a more automated and efficient system, minimizing the need for manual interventions and ensuring optimal performance under varying conditions.
12.3. Potential Improvements Using the White Rabbit Protocol
The White Rabbit (WR) protocol, a high-precision Ethernet-based network synchronization standard, can provide significant enhancements to the current system by delivering sub-nanosecond accuracy for time synchronization across distributed nodes. Originally developed for high-energy physics experiments, WR combines Precise Time Protocol (PTP) with Synchronous Ethernet (SyncE), enabling both time and frequency synchronization over standard Ethernet networks. The potential improvements that the White Rabbit protocol could bring to the development presented are outlined as follows:
- High-Precision Time Synchronization: The White Rabbit protocol offers sub-nanosecond accuracy in time synchronization, which would allow the system to align measurements across different hardware components with extreme precision. This is especially important in spectrometry applications where the timing of data acquisition must be synchronized with external events, such as triggering light sources or coordinating multiple sensors. The improved timing accuracy could result in more consistent and reliable measurement results, enhancing the overall quality of the data collected.
- Improved System Coordination and Distributed Data Acquisition: By enabling precise time alignment across multiple nodes, the White Rabbit protocol facilitates the coordination of distributed measurement systems. In cases where multiple acquisition units are used to capture different aspects of a phenomenon (e.g., multi-spectral or multi-channel data), the protocol ensures that all units are synchronized to the same time base. This capability supports the development of distributed spectrometric systems or sensor networks, where time-coordinated data from various locations can be integrated seamlessly.
- Reduced Timing Jitter and Enhanced Signal Integrity: In traditional synchronization methods, timing jitter can introduce errors in the measurement, affecting the accuracy and repeatability of the results. The White Rabbit protocol significantly reduces jitter through a combination of frequency locking (using SyncE) and phase alignment (using PTP). This would enhance the signal integrity of the spectrometer by minimizing timing uncertainties, thereby improving the fidelity of time-dependent measurements such as transient spectral analysis [29].
- Simplified Integration with Existing Network Infrastructure: As an Ethernet-based protocol, White Rabbit can be implemented over existing network infrastructure without the need for specialized cabling. This simplifies the system’s integration with existing network hardware while still achieving high-precision synchronization. It also allows for greater flexibility in expanding the system, as additional synchronized nodes can be added to the network without significant changes to the physical setup.
- Support for Real-Time Data Processing and Feedback Loops: With sub-nanosecond synchronization, the White Rabbit protocol can enable real-time feedback mechanisms in the system, allowing for dynamic adjustments based on the acquired data. For example, if the system detects rapid changes in the spectral signal, it can trigger immediate adjustments to measurement parameters (e.g., acquisition speed or exposure time). Such real-time processing is crucial in applications requiring adaptive control, such as active spectroscopy or automated calibration.
- Increased Scalability and Modularity for Large-Scale Systems: The White Rabbit protocol allows for the synchronization of a large number of nodes across a wide area while maintaining precise timing. This makes it suitable for scaling the system to accommodate more measurement channels or distributed sensor arrays without sacrificing synchronization accuracy. The modularity provided by this protocol supports the development of complex measurement systems where components can be added or removed with minimal reconfiguration.
In summary, implementing the White Rabbit protocol in the current development would bring substantial improvements to the accuracy and coordination of time-sensitive tasks. By providing high-precision synchronization and reducing timing uncertainties, the protocol would enable more reliable and coordinated spectrometric measurements, thus enhancing the overall performance and scalability of the system.
13. Conclusions
This study presents a versatile and compact spectrometer-based data acquisition system utilizing a Hamamatsu C12666 spectrometer module and a BeagleBone board, effectively meeting the stringent requirements for visible light spectrum measurement. The device’s design emphasizes portability and customization, catering to various application needs while ensuring high accuracy across a measurement range of 341 nm to 780 nm.
The integration of supporting electronics, including a microcontroller and an analog-to-digital converter (ADC), enables seamless data acquisition and processing. The accompanying software not only facilitates spectral measurement control but also enhances data visualization and analysis, showcasing the system’s robustness in capturing high-fidelity spectral data.
The exploration of migrating the data acquisition system to Field-Programmable Gate Array (FPGA) technology presents significant advantages. FPGA integration can enhance real-time processing capabilities, reduce latency, and allow parallel data handling. These features are crucial for applications requiring immediate feedback, such as fluorescence intensity monitoring and environmental assessments. The ability to adapt the system to various spectrometer configurations and synchronize with other devices further expands its applicability across diverse fields, from food quality evaluation to environmental monitoring.
Author Contributions
Conceptualization, D.R., L.A., and D.C.; methodology, D.R., D.C., L.A., and J.B.; validation, J.B., M.M., and A.M; formal analysis, J.B., M.M. and A.M; investigation, D.R, D.C., J.B., M.M. and A.M; resources, D.R.; writing—original draft preparation, D.R. and J.B.; writing—review and editing, D.R., D.C., J.B., M.M. and A.M; visualization, J.B., M.M. and A.M; project administration, L.A.; funding acquisition, L.A. and D.R. All authors have read and agreed to the published version of the manuscript.
Funding
The authors acknowledge the financial support of the Ministerio de Ciencia e Innovación for PID2021-124591NB-C41 and PDC2023-145913-I00, funded by MCIN/AEI/10.13039/ 501100011033 and by “ERDF A way of making Europe”, for ASFAE/2022/014, ASFAE/2022 /023 and AST22_6.2. We also acknowledge funding from the EU NextGenerationEU (PRTR-C17.I01), PDC2023-145913-I00, CSIC-INFRA23013, Generalitat Valenciana for CIDEGENT/2018/034, /2019/043, /2020/049, /2021/23, for CIDEIG/ 2023/20 and for GRISOLIAP/2021/192 and EU for MSC/101025085, Spain.
Institutional Review Board Statement
Not applicable.
Informed Consent Statement
Not applicable.
Data Availability Statement
Dataset available on request from the authors.
Conflicts of Interest
The authors declare no conflict of interest.
References
- Szolga, L.A.; Sascau, C.S. VIS Spectrometer Based on the Diffraction Grating and Raspberry Pi Camera. In Proceedings of the International Conference on Sensing and Electronic Control (ICSEC); 2023. [Google Scholar] [CrossRef]
- Liu, Y.; Xiong, H.; Dong, C.; Zhao, C.; Zhou, Q.; Li, S. Real-time signal processing in field programmable gate array based digital gamma-ray spectrometer. Rev. Sci. Instruments 2020, 91, 104707. [Google Scholar] [CrossRef]
- Mukhopadhyay, D. Field Programmable Gate Arrays (FPGA). 2016. [CrossRef]
- Sperandio, P.; De Luca, M.; Catini, A. The greenBag, the new solution in waste separation. Int. J. Adv. Sci. Eng. Inf. Technol. 2018, 9, 1238–1243. [Google Scholar] [CrossRef]
- Yamamoto, M.; Shimojo, S. The Brain Knows enough to take into account Light and Shadow. bioRxiv Cold Spring Harbor Laboratory. 2020. [Google Scholar]
- Capuano, R.; Serafini, C.; Papale, L.; Allegra, V.; Di Natale, C.; Catini, A. Multi-Sensor System for Saffron Quality Identification. Proceedings 2024, 97, 103. [Google Scholar] [CrossRef]
- Jiao, Y.; Zhang, Q.; Luo, X.; Liang, Z. ; Fruit ripeness detection based on miniature spectral sensor. In Proceedings of the 2021 International Symposium on Computer Technology and Information Science (ISCTIS); 2021; pp. 93–98. [Google Scholar] [CrossRef]
- Sabry, Y.M.; Hassan, K.; Anwar, M.; Alharon, M.H.; Medhat, M.; Adib, G.A.; Dumont, R.; Saadany, B.; Khalil, D. Ultra-compact MEMS FTIR spectrometer. 2017.
- Kraft, M.; Kenda, A.; Sandner, T.; Schenk, H. MEMS-based compact FT-spectrometers - a platform for spectroscopic mid-infrared sensors. 2008 IEEE Sensors, 2008; 130–133. [Google Scholar] [CrossRef]
- A. Kenda, et al., "MEMS-based spectrometric sensor for the measurement of dissolved CO2," 2008 IEEE Sensors, 2008.
- Wang, W.; Chen, J.; Zivkovic, A.S.; Xie, H. A Fourier Transform Spectrometer Based on an Electrothermal MEMS Mirror with Improved Linear Scan Range. Sensors 2016, 16, 1611. [Google Scholar] [CrossRef] [PubMed]
- Zhou, G.; Qi, Y.; Lim, Z.H.; Zhou, G. Single-Pixel MEMS Spectrometer Based on Compressive Sensing. IEEE Photonics Technol. Lett. 2020, 32, 287–290. [Google Scholar] [CrossRef]
- J. Newman, et al., "MEMS programmable spectral imaging system for remote sensing," 2006.
- Algamili, A.S.; Khir, M.H.; Dennis, J.O.; Ahmed, A.Y.; Alabsi, S.S.; Ba Hashwan, S.S.; Junaid, M.M. A Review of Actuation and Sensing Mechanisms in MEMS-Based Sensor Devices. Nanoscale Res. Lett. 2021, 16, 16. [Google Scholar] [CrossRef] [PubMed]
- https://www.hamamatsu.com/content/dam/hamamatsu-photonics/sites/documents/99_SALES_ LIBRARY/ssd/c12666ma_kacc1216e.
- Real, D.; Calvo, D. Nanobeacon: A time calibration device for KM3NeT. EPJ Web Conf. 2019, 207, 07002. [Google Scholar] [CrossRef]
- Wright, A. An inexpensive acoustic data acquisition system using a single-board microcomputer. J. Acoust. Soc. Am. 2017, 142, 2729. [Google Scholar] [CrossRef]
- McPherson, A.; Zappi, V. An environment for submillisecond-latency audio and sensor processing on BB. J. Audio Eng. Soc. 2015. [Google Scholar]
- Lee, S.; Lee, H. Design of portable functional near-infrared spectroscopy-based brain monitoring system. In Proceedings of the 2019 International Conference on Electronics, Information, and Communication (ICEIC); 2019; pp. 1–2. [Google Scholar] [CrossRef]
- S. Barrett et al., Bad to the Bone: Crafting Electronic Systems with BB, Second Edition, 2015.
- Y. Barbosa et al., BB for X8-VB Quadcopter Attitude Control, IECON 2019 - 45th Annual Conference of the IEEE Industrial Electronics Society, 2019.
- A. Mcpherson et al., An Environment for Submillisecond-Latency Audio and Sensor Processing on BB, Journal of The Audio Engineering Society, 2015.
- J. Bogacz et al., Convolution Neural Network on BB Wireless for Machine Learning Applications, 2022 IEEE MIT Undergraduate Research Technology Conference (URTC), 2022.
- N. He et al., Experience of teaching embedded systems design with BB board, 2016 IEEE International Conference on Electro Information Technology (EIT), 2016.
- C. Gang-qiang et al., The Debug Environment of TI-RTOS Based on BB, 2019 12th International Conference on Intelligent Computation Technology and Automation (ICICTA), 2019.
- N. He et al., The Use of BB Board in Engineering Design and Development, 2014.
- S. Chakravarty et al., LoRa Mesh Network with BB, 2020 Fourth World Conference on Smart Trends in Systems, Security and Sustainability (WorldS4), 2020.
- V. S. Machhi et al., IoT Based Environment Parameter Monitoring Using BB, INROADS- An International Journal of Jaipur National University, 2016.
- Real, D.; Calvo, D.; Zornoza, J.d.; Manzaneda, M. White Rabbit Expansion Board: Design, Architecture, and Signal Integrity Simulations. Electronics 2023, 12, 3394. [Google Scholar] [CrossRef]
Figure 1.
Structure of the chosen spectrometer.
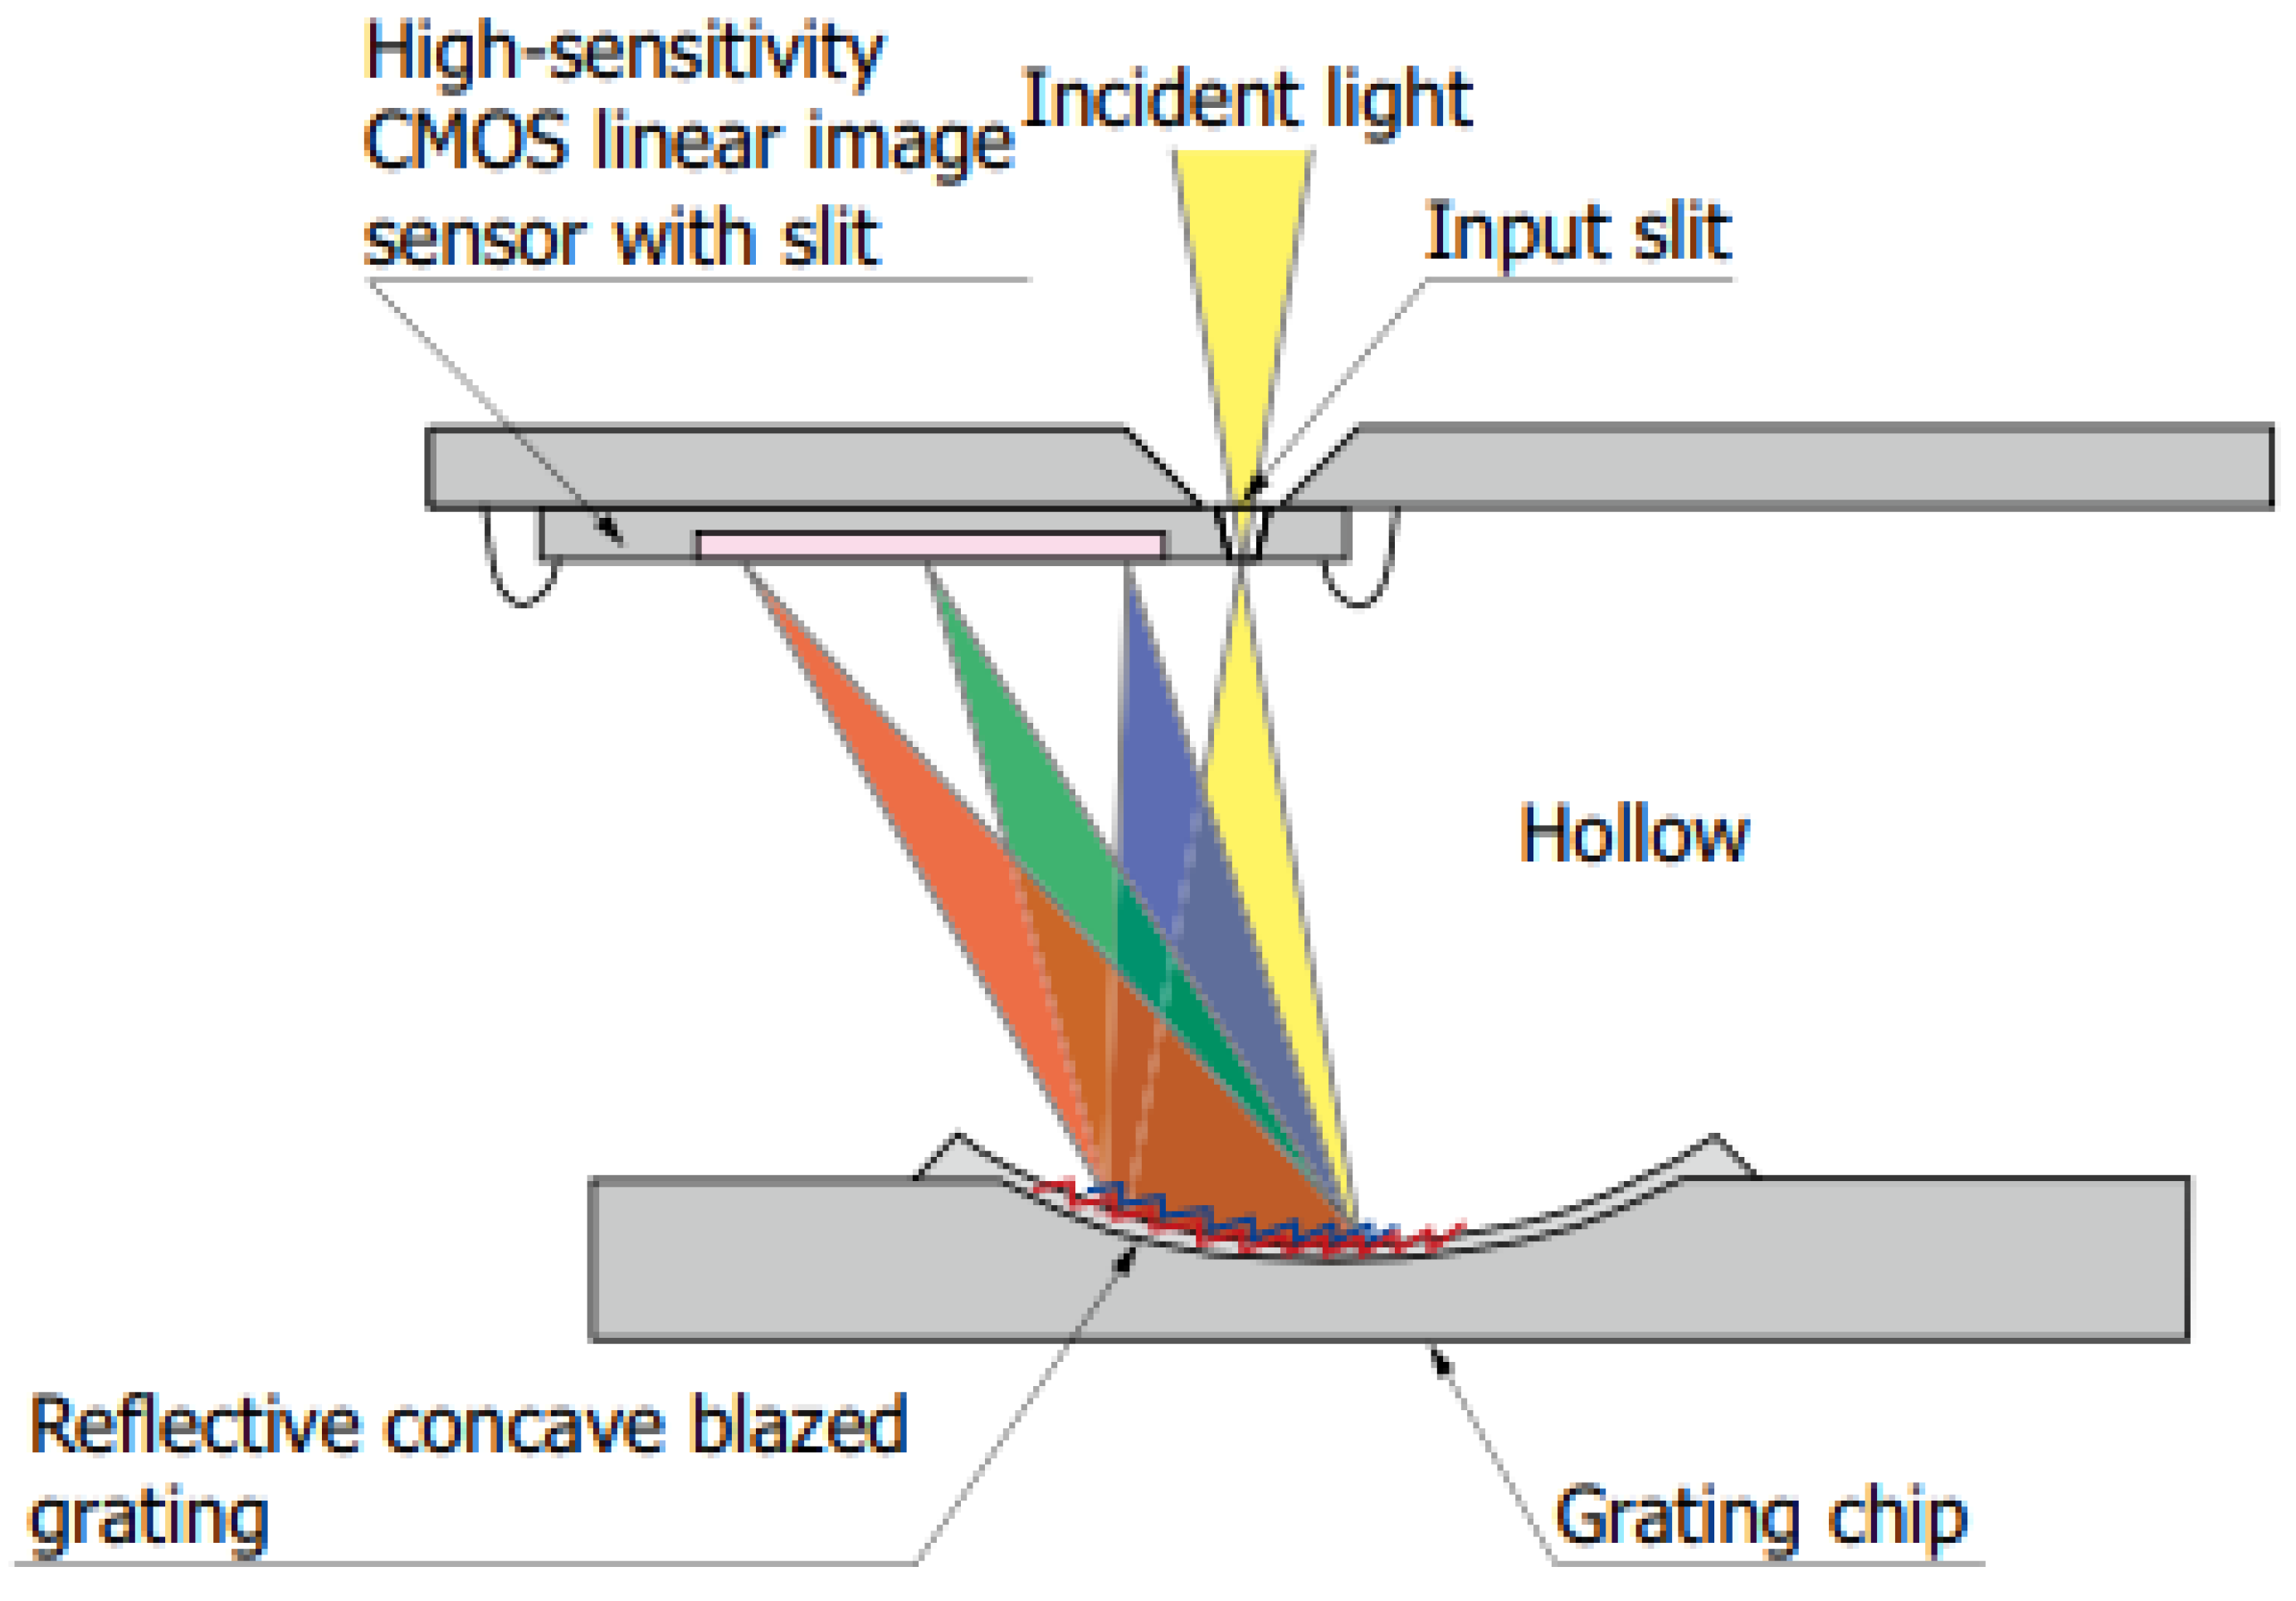
Figure 2.
Hardware Architecture of the Data Acquisition System. The thicker line shows the path of the acquired spectrometer data.
Figure 2.
Hardware Architecture of the Data Acquisition System. The thicker line shows the path of the acquired spectrometer data.
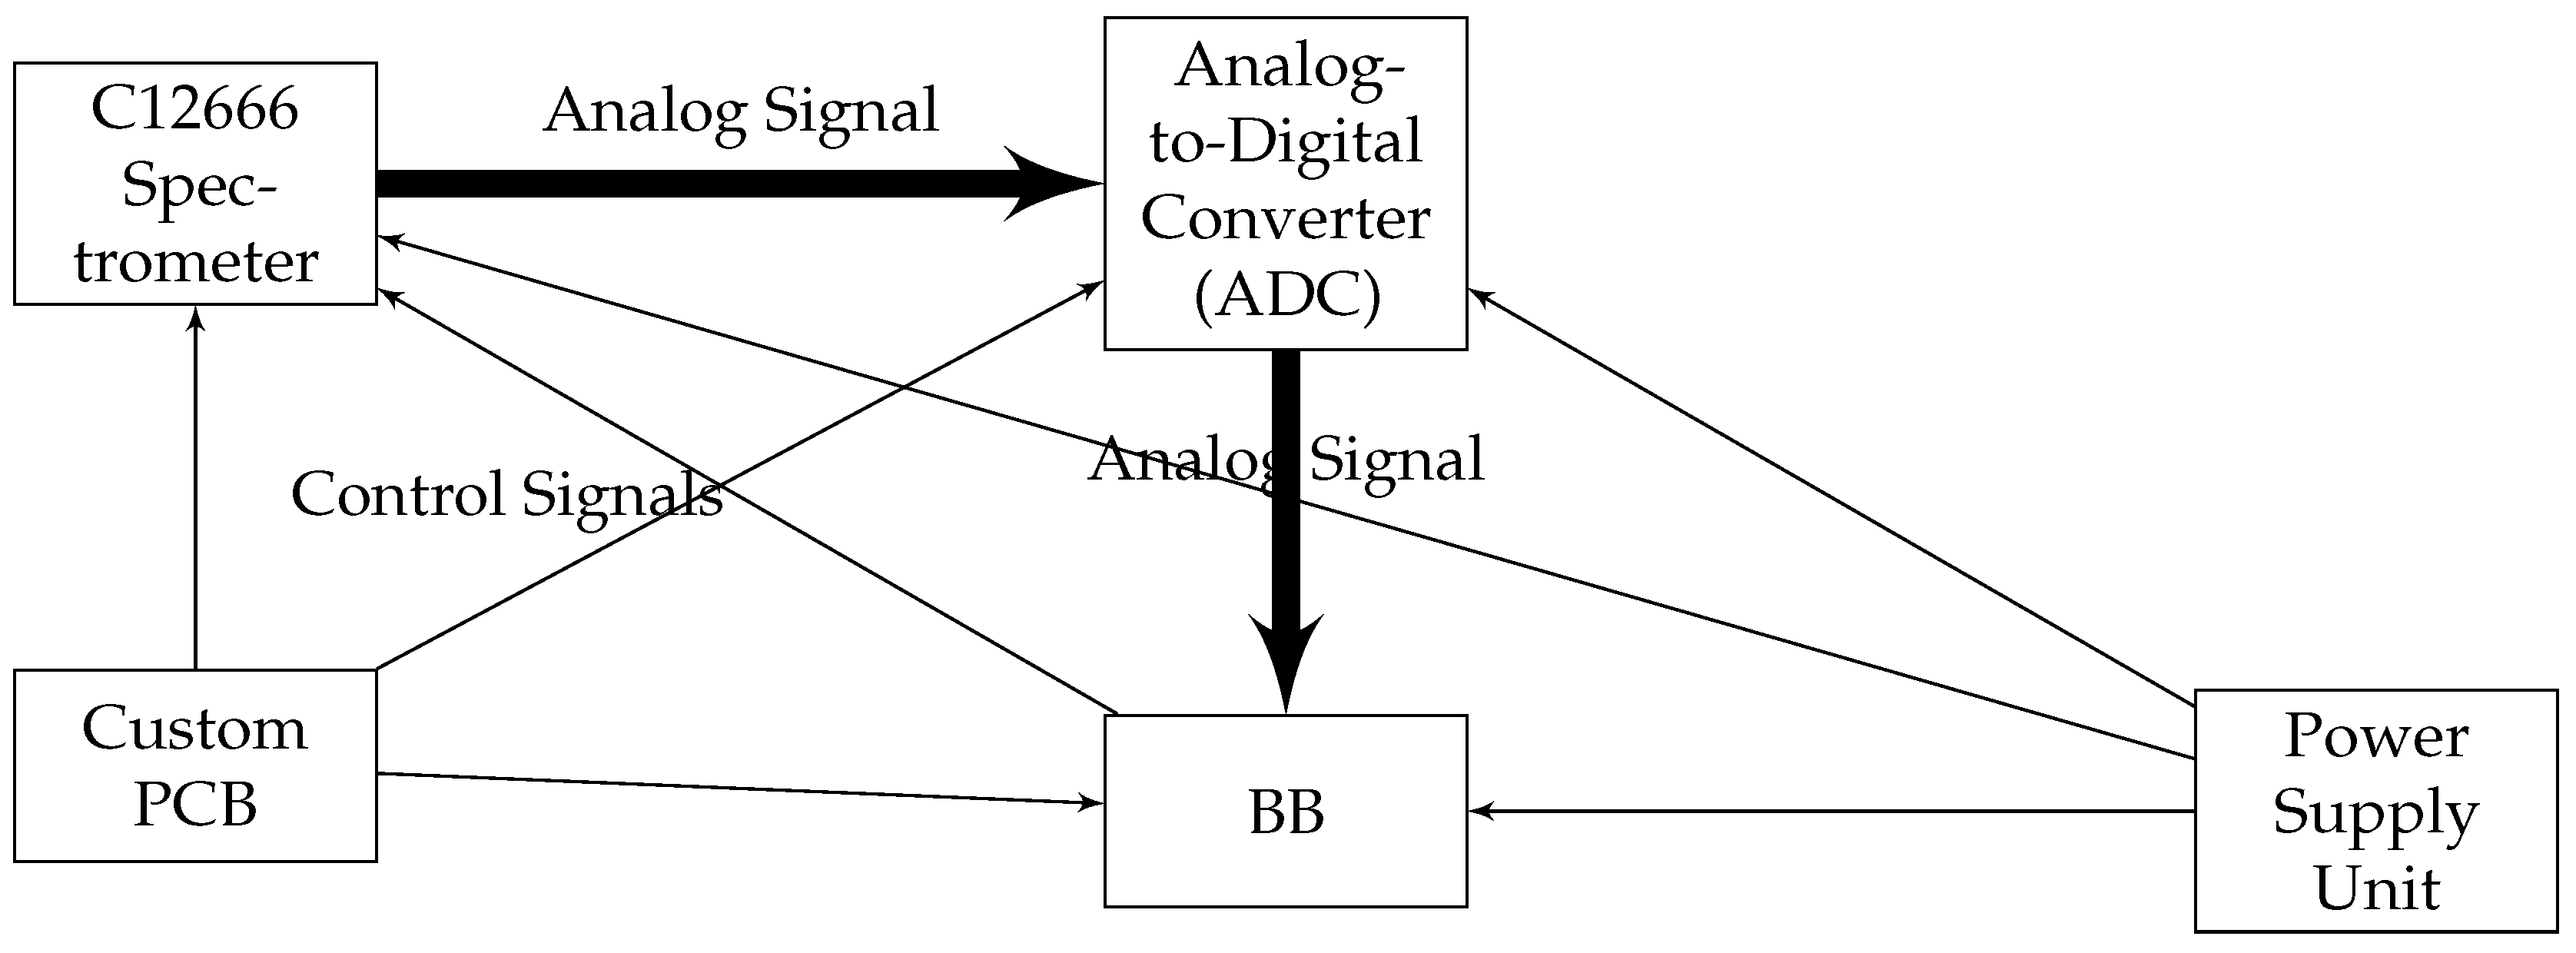
Figure 3.
Schematics of the ADC used in the present work.
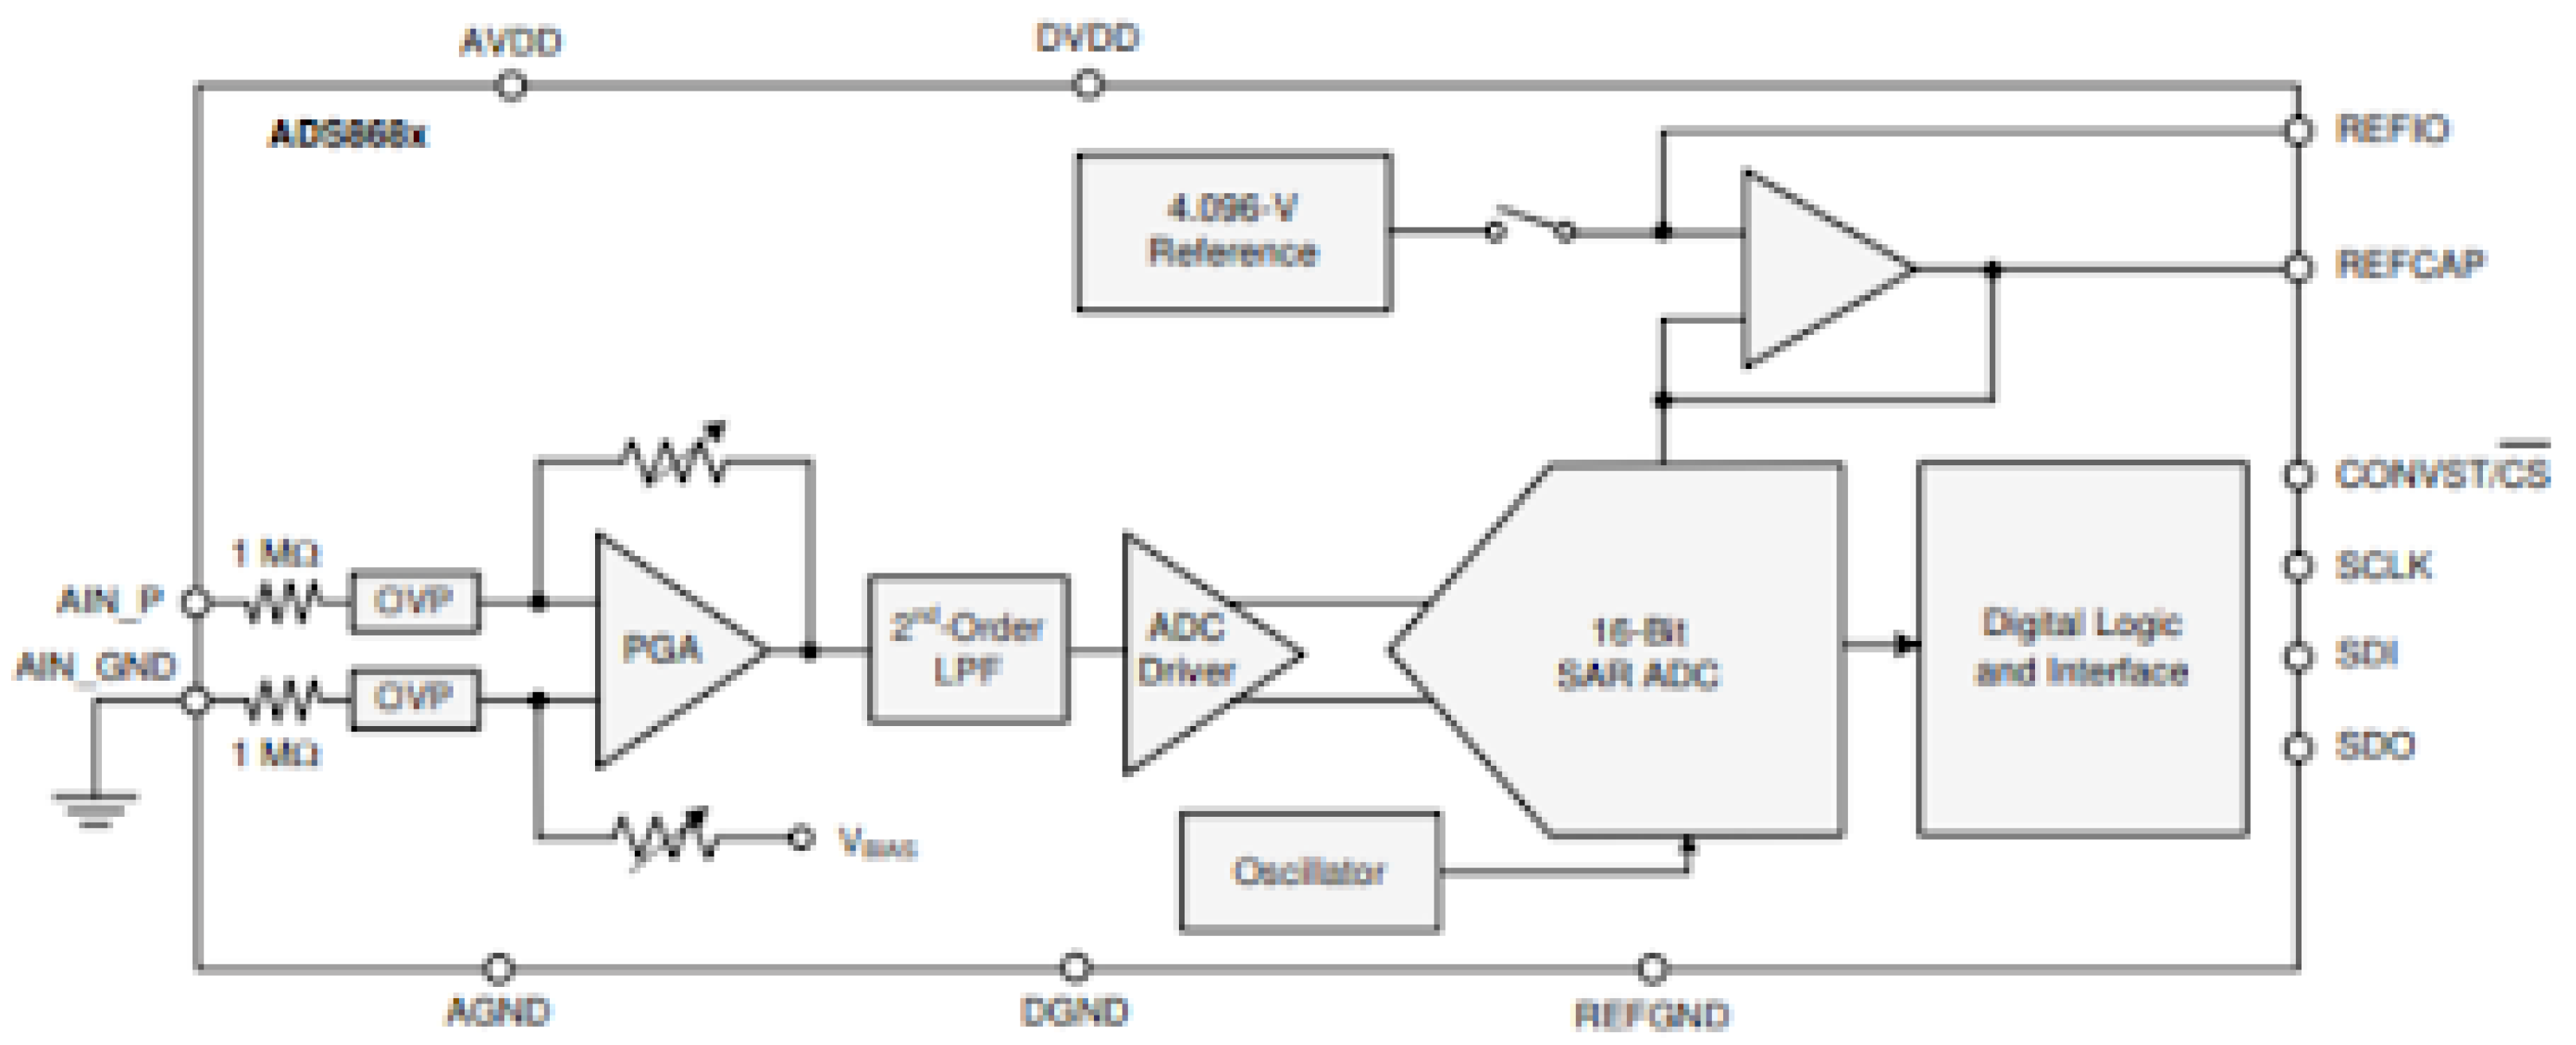
Figure 4.
Schematics of the ADC board.
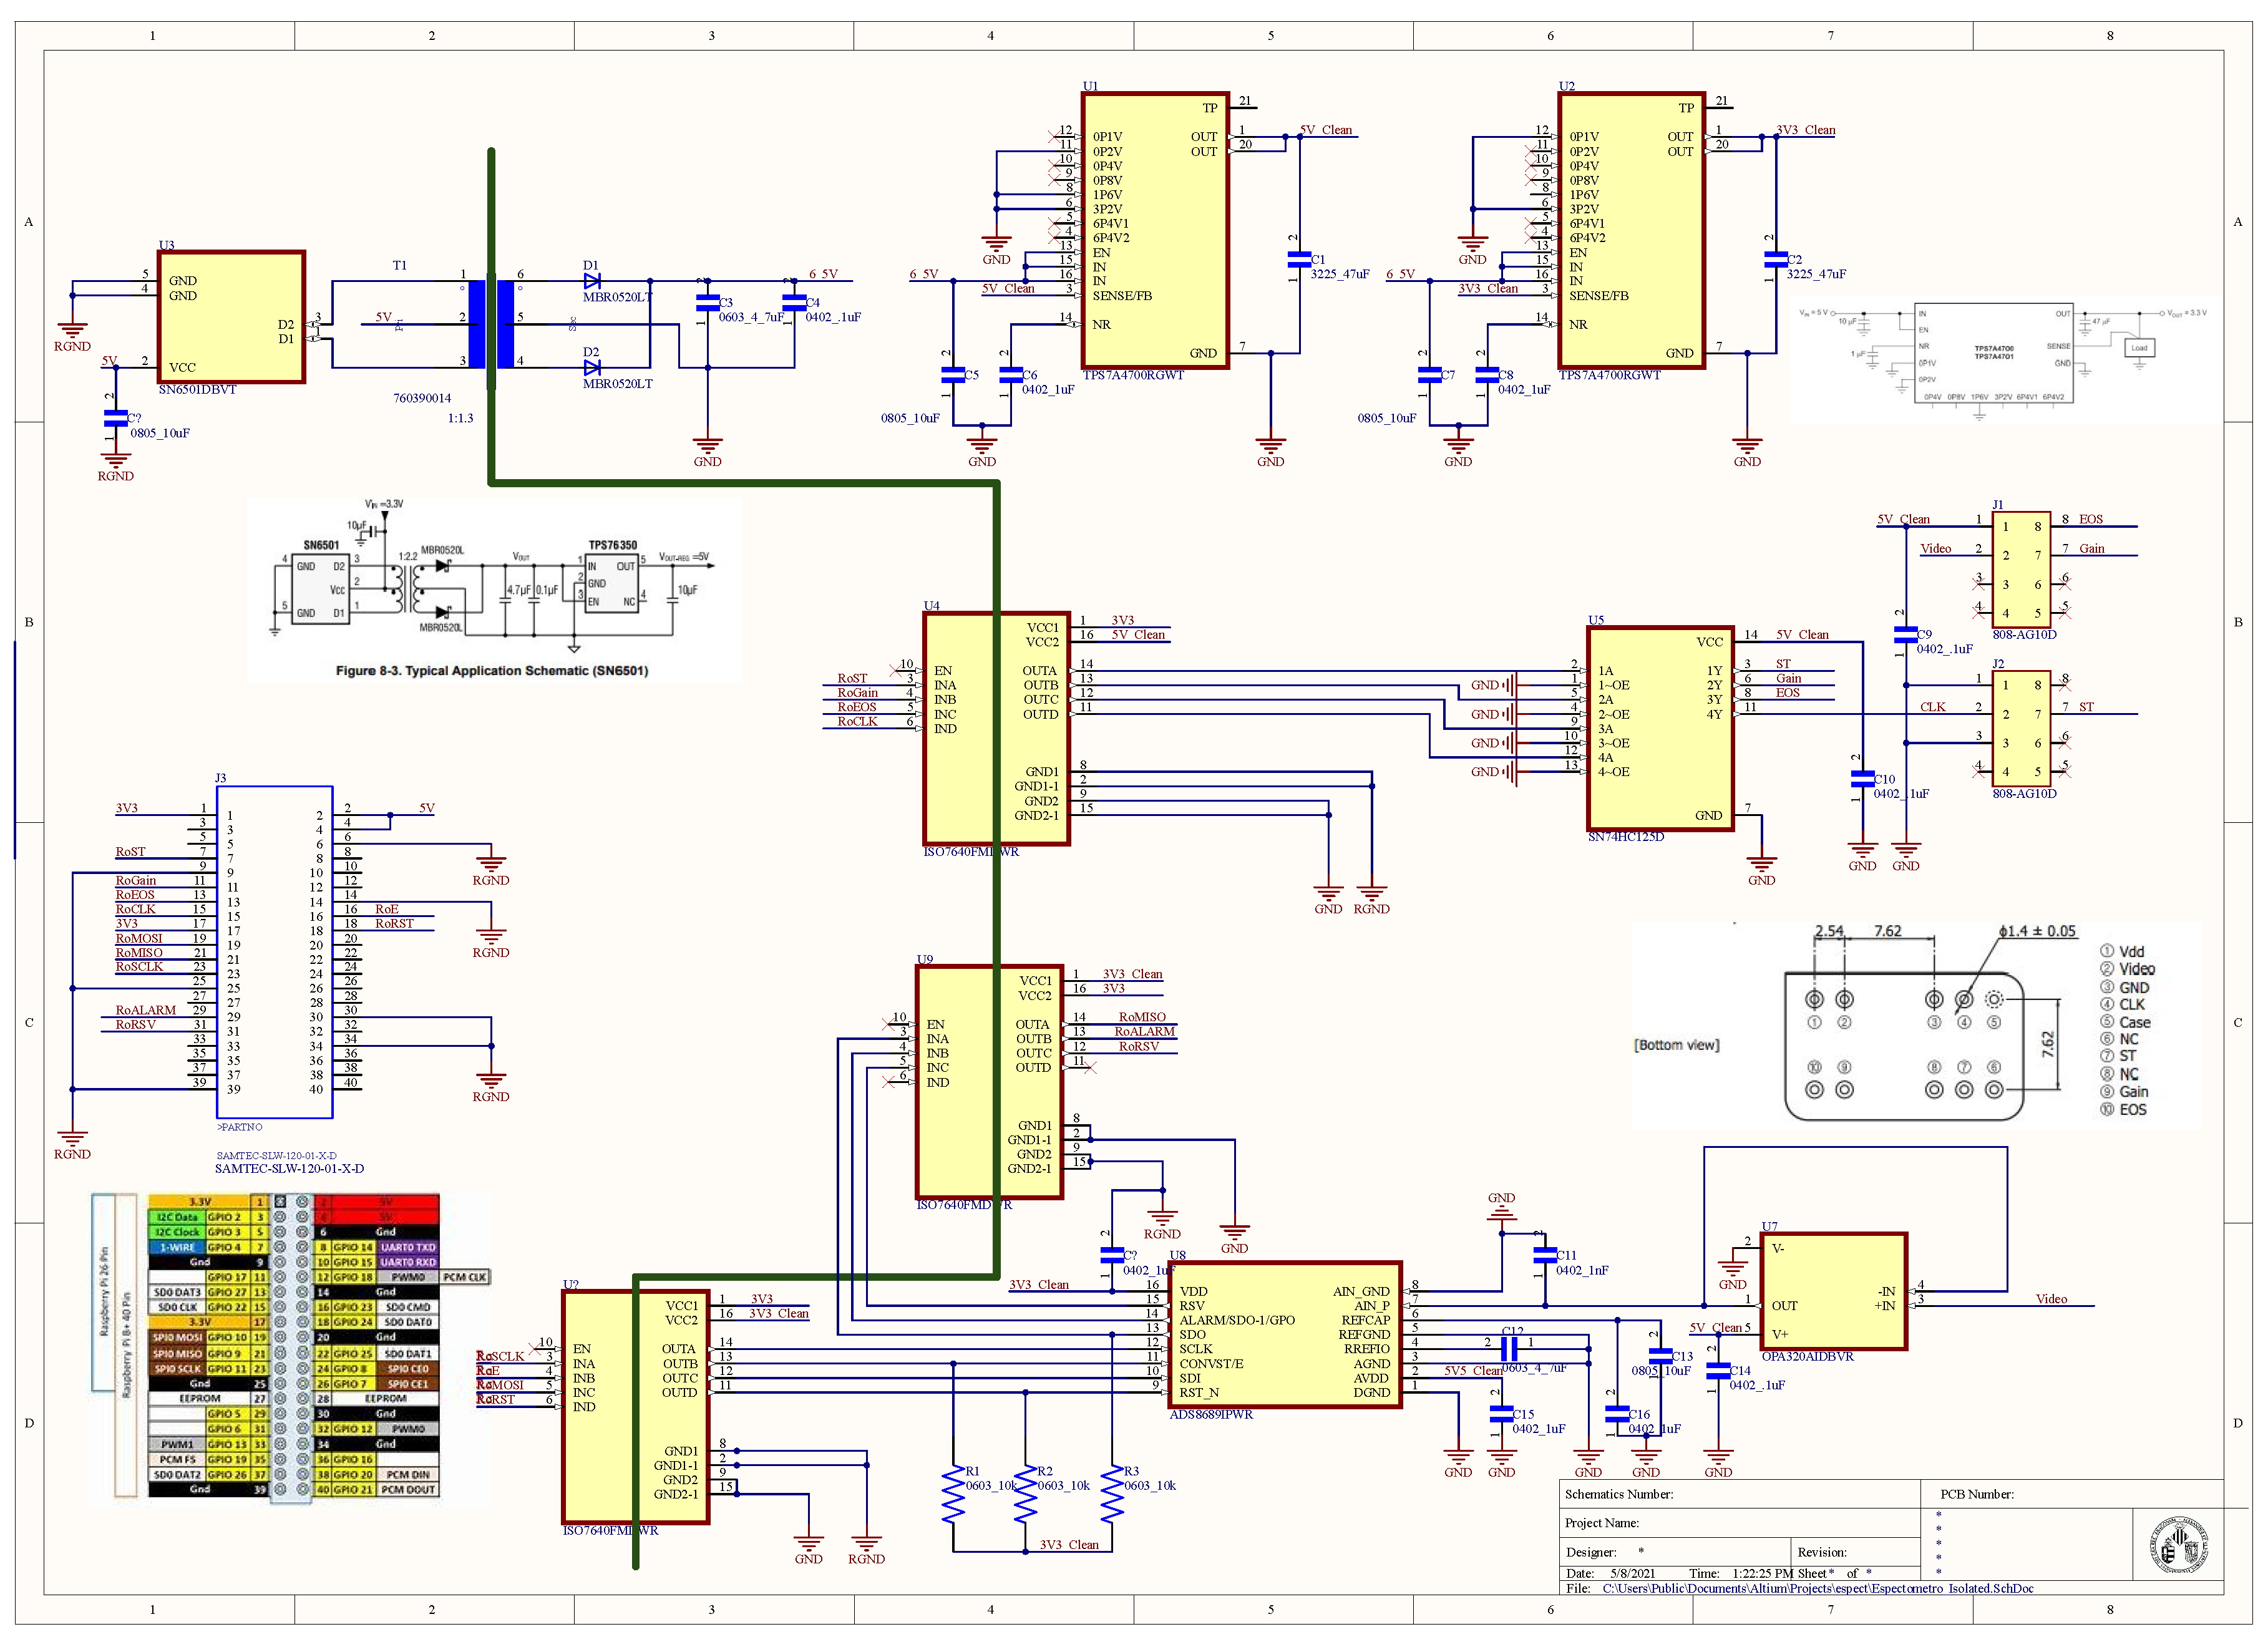
Figure 5.
PCB Layout. It has been implemented in 4 layers.
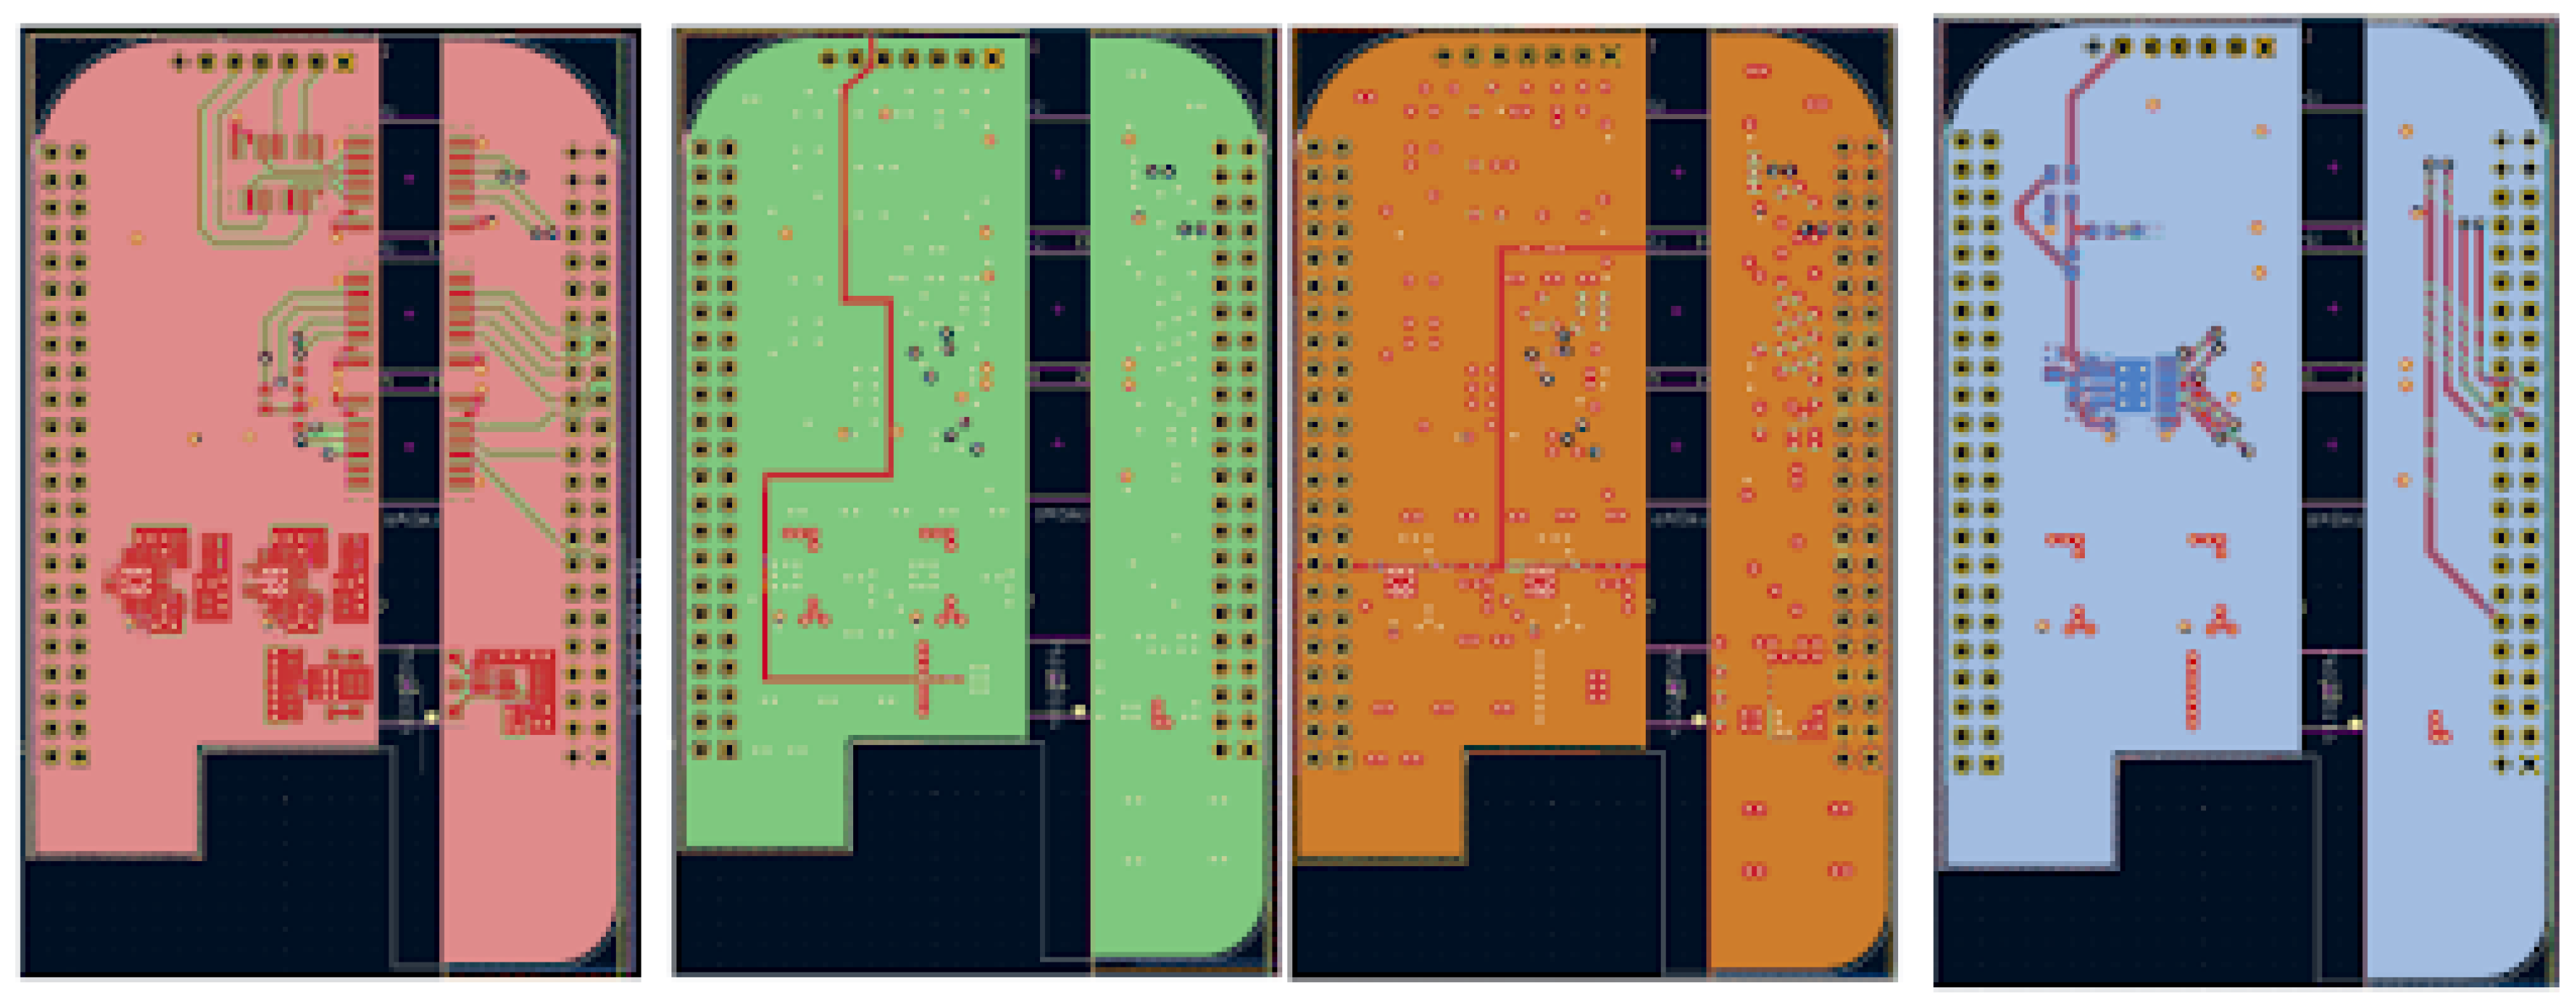
Figure 6.
Signal of the spectrometer as treated in the Graphical User Interface
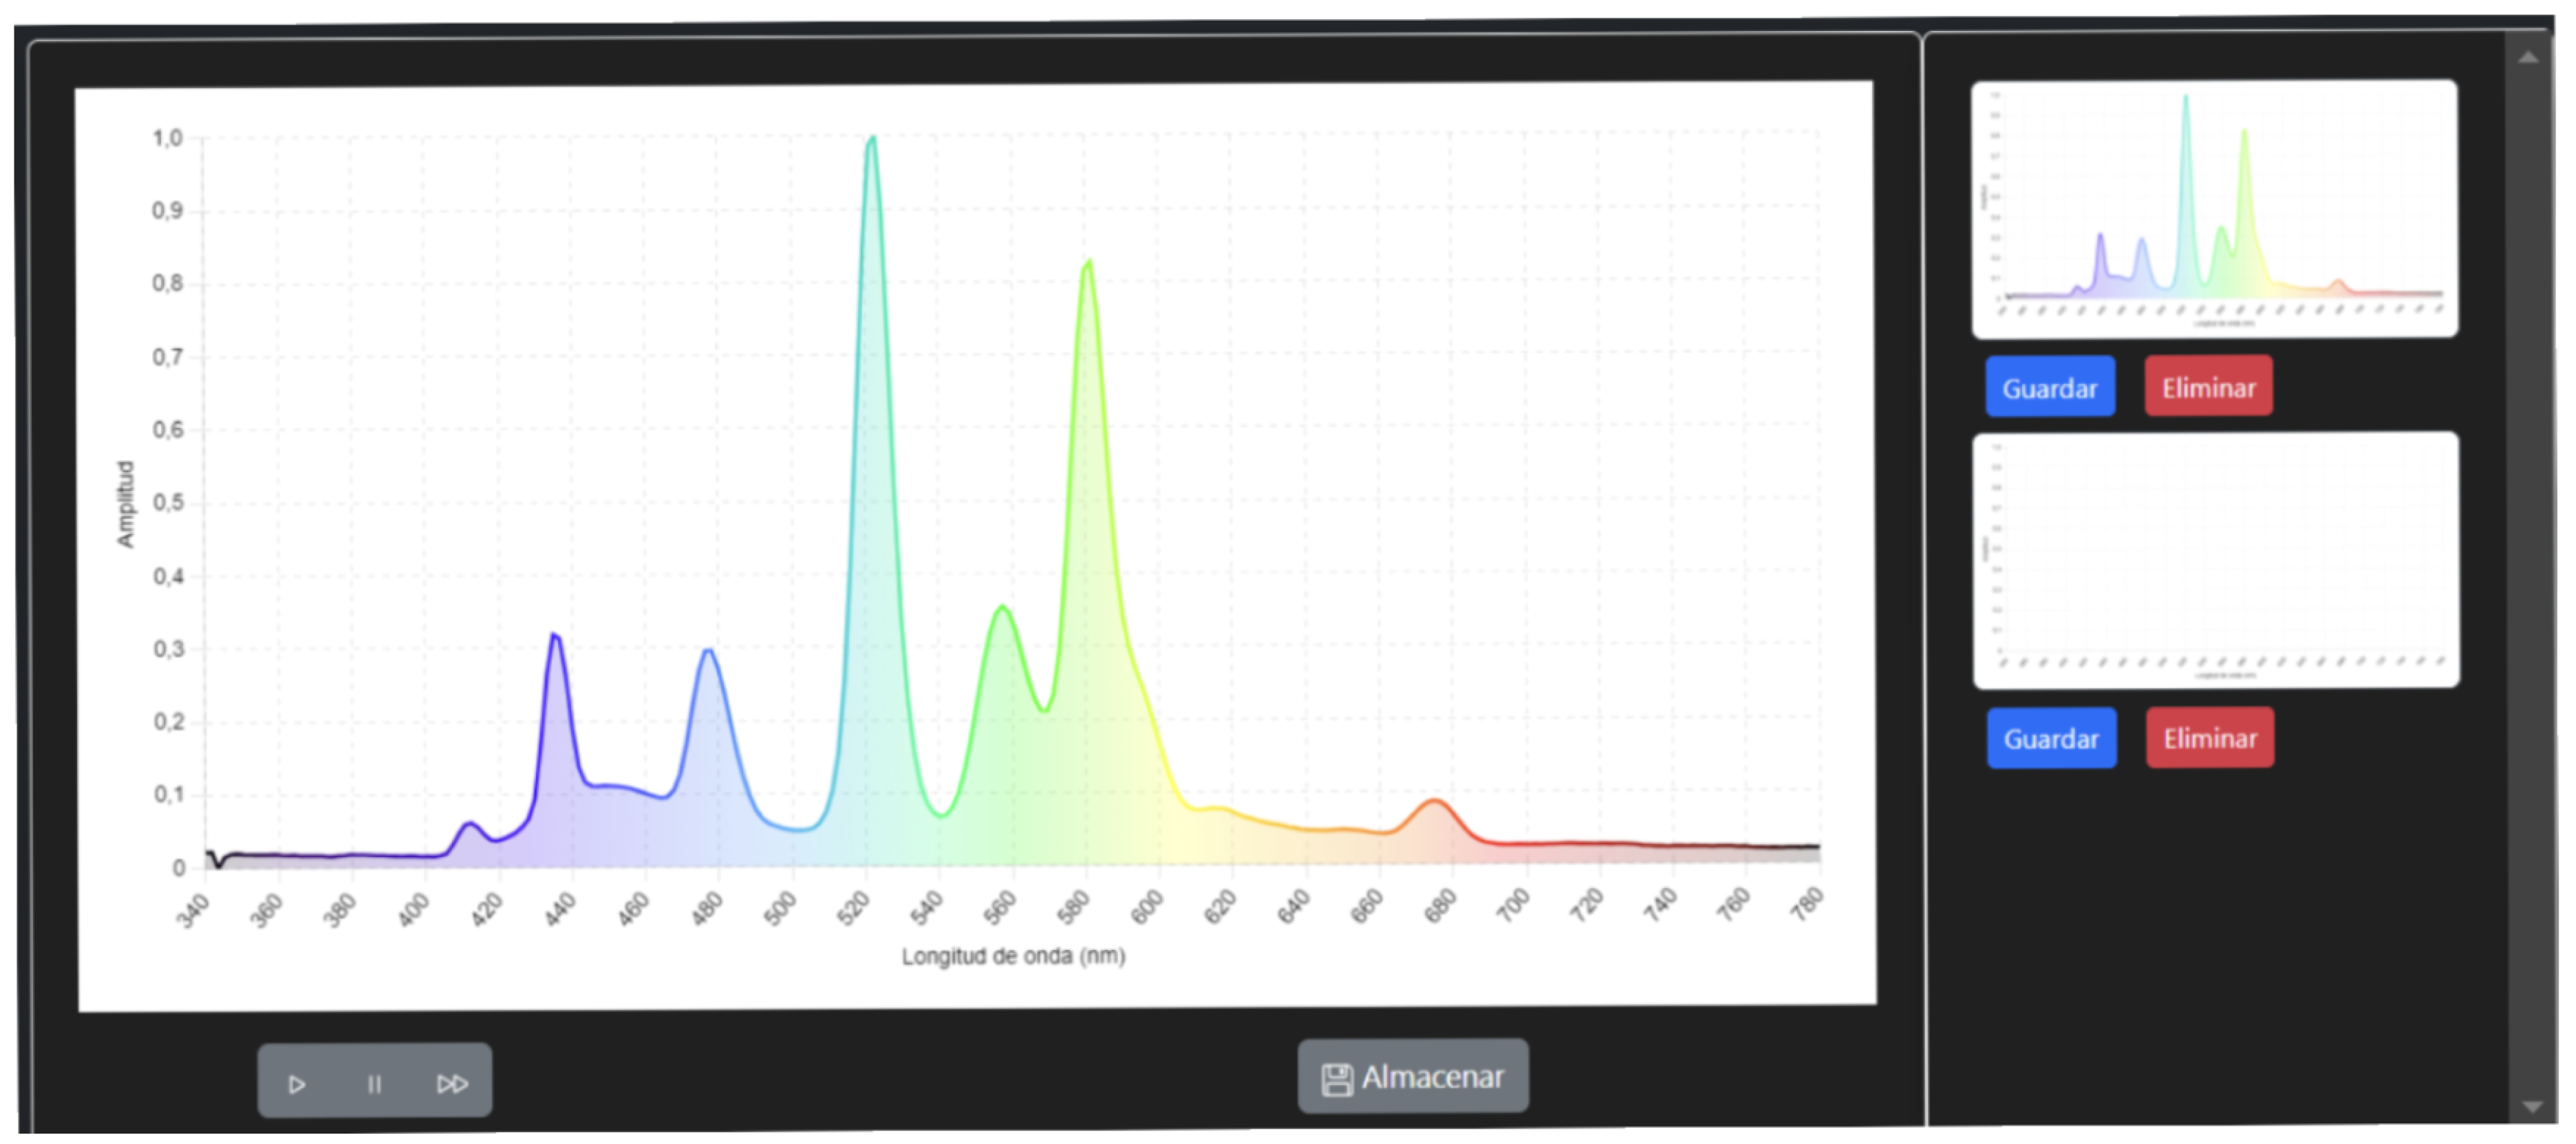
Figure 7.
Video signal of the spectrometer
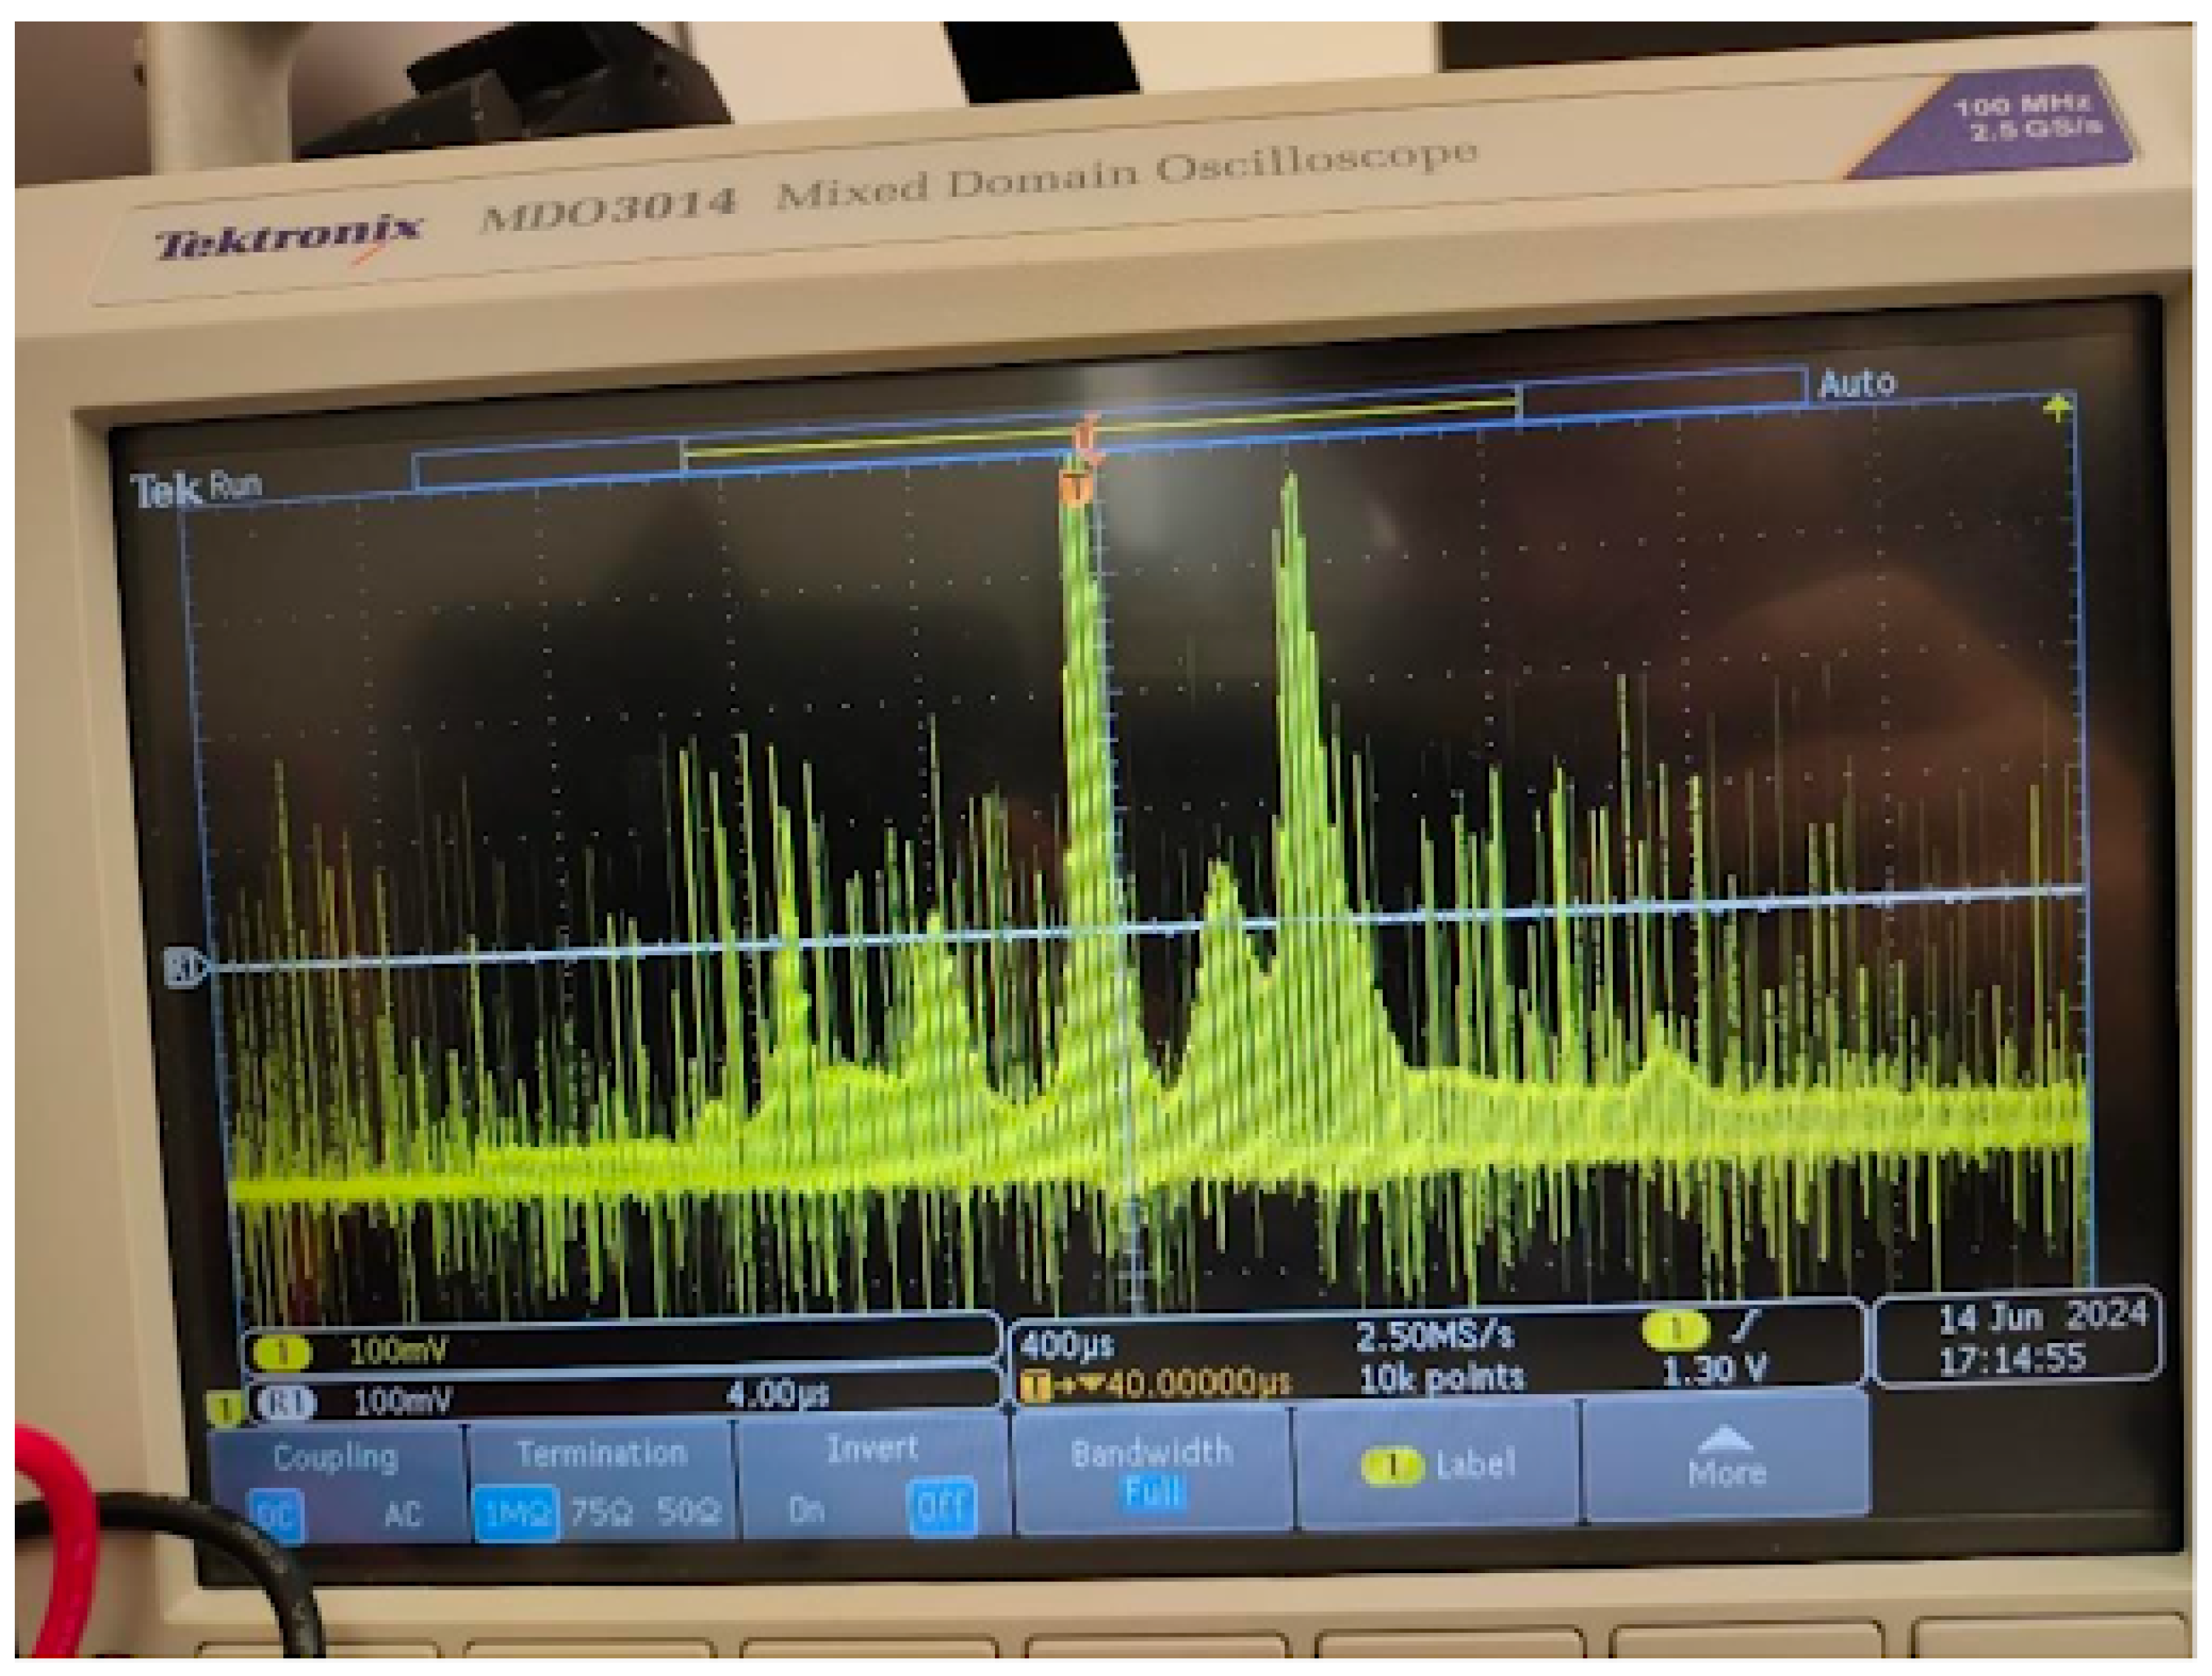
Figure 8.
spectrum measured of a monochromatic light at 470 nm.
Disclaimer/Publisher’s Note: The statements, opinions and data contained in all publications are solely those of the individual author(s) and contributor(s) and not of MDPI and/or the editor(s). MDPI and/or the editor(s) disclaim responsibility for any injury to people or property resulting from any ideas, methods, instructions or products referred to in the content. |
© 2024 by the authors. Licensee MDPI, Basel, Switzerland. This article is an open access article distributed under the terms and conditions of the Creative Commons Attribution (CC BY) license (http://creativecommons.org/licenses/by/4.0/).
Copyright: This open access article is published under a Creative Commons CC BY 4.0 license, which permit the free download, distribution, and reuse, provided that the author and preprint are cited in any reuse.


