Submitted:
26 November 2024
Posted:
27 November 2024
You are already at the latest version
Abstract
In recent years, with the development of science and technology in China, the financial industry has also undergone significant changes. In the diversified financial field, the diversified financial system headed by financial technology gradually occupies a dominant position. The cash of financial technology has played a very important role in improving the efficiency of financial services. However, fintech goes hand in hand with fintech risks. This paper uses AHP + fuzzy comprehensive evaluation model, seeks 50 financial experts to comprehensively quantify the risk of financial industry, and explores the leading factors of China's financial industry risks at present, so as to make predictable intervention. It is found that technical risk, moral risk and legal risk, with a weight of 76% and a fuzzy evaluation index of "high", are the main factors affecting financial technology risks, while traditional financial risks account for the majority but only account for 24%. Although the weight ratio is not large, it still cannot be ignored. The purpose of this paper is to quantify the vague financial industry risks, explore the dominance of financial technology risks and traditional financial risks in the current financial industry, and conclude that in the face of the future development of China's financial industry, it is necessary to pay more attention to intervening in the risks brought by financial technology, so as to optimize resource allocation, but traditional financial risks cannot be ignored.
Keywords:
Analytic hierarchy process(AHP)
; Fuzzy Comprehensive Evaluation Model
; Financial risk
; Fintech
1. Introduction
In recent years, with the continuous development of China's economy and the increasing complexity of the financial market, the risks faced by China's financial industry are constantly evolving and increasing. With the rapid development of China's financial market, a variety of potential risk points are gradually exposed, which not only threaten the stability of the financial system, but also have an important impact on economic growth and social stability [1,2]. Therefore, a comprehensive and in-depth analysis of the risk factors of China's financial industry is of great significance to ensure the sustained and healthy development of China's economy.
The risk analysis of China's financial industry not only involves traditional financial institutions such as banks, securities and insurance, but also covers emerging fields such as shadow banking, local government debt and real estate market. There are various types of risks in these fields, including technical risk, moral risk, management risk, operational risk, credit risk, market risk, legal risk, etc. Each risk may have different degrees of impact on the financial system.
With the rapid development of the financial industry in recent years, financial technology has combined finance and technology, which has greatly changed the financial industry and continued to reshape the modern financial system [3]. As defined by the Financial Stability Board (FSB), FinTech refers to emerging business models, new technology applications, new products and services driven by emerging cutting-edge technologies such as big data, blockchain, cloud computing and artificial intelligence, which have a significant impact on financial markets and the supply of financial services. The development of financial technology has played a very important role in improving the efficiency of financial services [4,5,6]. However, financial technology development goes hand in hand with financial technology risks. Financial technology risks have brought new challenges, problems and new requirements to financial supervision [7]. And fintech has not changed the nature and risk attributes of financial business. Its openness, interoperability, science and technology and other characteristics make the concealment, contagiousness, universality and sudden characteristics of financial risks more obvious, and the potential systemic risks more complicated.
Fintech has led to fundamental changes in the financial industry from institutional operating models to financing models and even money itself [8,9], making financial innovation more active. However, financial innovation may also blur existing industry boundaries, subvert the industry structure, accelerate financial disintermediation, and induce new financial risks [10,11]. The rapid development of financial technology has had a huge impact on traditional financial businesses. The process of integration of finance and technology has not only changed the terminology conversion, credit conversion, income conversion and risk conversion of traditional financial business, but also greatly reshaped the risk characteristics of the financial system itself [12]. Based on the existing research and the reality of financial technology development, financial technology may trigger traditional financial risks, such as credit risk, liquidity risk and operational risk [13], due to its own characteristics, it includes risks caused by non-financial factors such as underlying information technology and technical ethics [14].
Many innovations in fintech have greatly promoted the openness, online and virtualization of modern financial services, with customers transacting remotely and real-time capital flows, which has also increased the dependence of financial markets on the Internet and information technology [15]. Once there are technical loopholes in Internet business operation process, technical management and network maintenance, it may lead to information technology risks such as data theft, privacy infringement and website attacks, which may bring serious economic losses to customers and enterprises. Obviously, financial technology has not only changed the traditional form of financial risks, but also changed the distribution and weight of financial risks, making the technical risks brought by the technical loopholes of financial technology, such as incomplete technology, data security risks and network security risks, increasingly serious.
Therefore, through a comprehensive analysis of China's financial industry risks, this paper aims to reveal the main risk points and potential risk trends faced by China's financial market at present, quantify the known financial industry risks, and comprehensively measure the financial industry risks by using the AHP+fuzzy comprehensive evaluation model, so as to provide decision-making reference for financial institutions, regulatory authorities and investors, and jointly promote the healthy and stable development of China's financial industry. As an emerging format, financial technology risks are difficult to measure. Existing research mostly focuses on traditional financial risk prevention and the impact of financial technology on financial institutions, regional financial risks, and the real economy. Scholars believe that, Improper use of financial technology will lead to the dual superposition effect of traditional financial risks and financial technology risk [16]. Therefore, in this article, we will comprehensively analyze and measure traditional financial risks and financial technology risks.
According to the existing literature, scholars have conducted a lot of valuable studies: First, examine the new risks brought by the introduction of financial technology into the traditional financial system [17,8]; The second is to clarify the risk characteristics of financial technology and build a risk control mechanism [19]; The third is to discuss the risk prevention of financial technology platform operation [20,21,22,23].
On the basis of existing research, the incremental work of this paper may lie in: (1) The existing research focuses on the identification and classification of financial industry risks, lacking necessary quantification. We try to comprehensively evaluate the traditional risks contained in financial technology and the new risks brought by factors such as information technology; (2) We also use AHP + fuzzy comprehensive evaluation model to comprehensively measure financial technology risks, and find that technical risks, ethical risks and legal risks are the leading factors affecting financial industry risks; However, other prominent credit risks, market risks and operational risks in the traditional financial field account for a small proportion, but they can't be ignored. The specific research process of this paper is shown in Figure 1.
2. Model Settings
2.1. Establishment of Financial Industry Risk Assessment System Based on Delphi Method
The Delphi method is a structured, anonymous, multi-round expert consultation method. By repeatedly soliciting and summarizing expert opinions, a consensus is finally reached or the probability of a certain future event is predicted. The definition of risk in the financial industry is a qualitative concept [24,25]. Different personnel have different views and lack uniform quantitative standards. Therefore, in this paper, experts who have studied related aspects are sought to make the definition results more authoritative. In this paper, 50 experts in the financial field are invited to score and modify the first-level indicators in two rounds, and finally a second-level financial industry risk assessment system is designed, and then the second-level financial indicators are scored again. As shown in Table 1.
2.2. Determining the Weight of Financial Industry Risk Indicators According to Analytic Hierarchy Process
Analytic Hierarchy Process (AHP) divides people's thinking process into target layer, criterion layer and scheme layer, and analyzes it with the help of mathematical model. It is a practical decision analysis method that effectively combines the qualitative judgment and quantitative calculation of decision makers. This method is systematic, flexible and simple to use, and is suitable for organized large-scale complex systems. Especially when the system is huge in scale, complex in structure, diverse in attributes and objectives, and many elements in the system have only qualitative relations, it is very efficient to use AHP for evaluation and decision-making.
The basic principle is to divide complex problems into hierarchical structures according to dominant relations, and each level is composed of interrelated elements. The relative importance of each element in the hierarchy is quantified by pair-by-pair comparison method, and finally the total relative importance is ranked [26,28]
2.2.1. Establishing Multi-Level Hierarchical Structural Model
According to the dominant relationship, the evaluation index system is established in three levels from top to bottom:
- The highest level: also known as the target level or target level, it is the goal or result that the system wants to achieve, and it is the primary criterion of systematic evaluation. The main purpose of this paper is to quantify the risks of China's financial industry, so the highest level established in this paper is the main financial industry risk indicators (such as Technical risk: U1) and the secondary financial industry risk indicators (such as Network system security risk: u11).
- Criteria layer: It is the criteria, sub-criteria, etc. set up to achieve the target layer. See Table 4 Financial Industry Risk Judgment Matrix in 3.1.1 for the establishment of the criterion layer in this paper.
- The lowest layer: also called the scheme layer. It is a variety of programs, measures, etc. taken to achieve the goal.
2.2.2. Constructing a Judgment Matrix
Satty (American operations research scientist) proposed to use the numbers 1-9 as a scale to judge the relative importance of the two indicators [27], as shown in Table 2.
Using the results in Table 2, by comparing the risk factors contained in each first-level index and second-level index, the relative importance of each risk is obtained, and the first-level judgment matrix and the second-level judgment matrix are constructed.
2.2.3. Calculate Indicator Weights
(1) Establish factor judgment matrix A
Matrix,Is the element judgment matrix. The ratio of the relative importance of element i and element j in judgment matrix A is expressed by aij, and has the following relationship:
The larger the aij ratio, the higher the importance of i. The specific importance is shown in Table 2 above.
Use the root method to calculate the approximate value of the eigenvector of the judgment matrix. The formula is as follows:
(3) Normalize the feature vector to obtain the weight vector, the formula is as follows:
2.2.4. Check the Consistency of Fuzzy Judgment Matrix
First, the maximum eigenvalue λmax is calculated according to the judgment matrix, and the formula is as follows:
Where (AW) i denotes the i-th component of the vector AW.
Then, after passing the calculated λmax and the corresponding eigenvector, it is necessary to check the consistency of the judgment matrix. If the consistency test passes, the eigenvector can be regarded as the relative weight of the next-level index to the upper-level index. Otherwise, the values of each element in the judgment matrix should be readjusted until the consistency test is met. The results are checked by calculating the consistency ratio CR, and the calculation formula of CR is:
Among them, CI is the consistency index and RI is the random consistency index. The formula for calculating CI is:
RI values are shown in Table 3. The consistency ratio CR is < 0.1, and the consistency test passes.
2.3. Quantifying the Risk of Financial Industry by Fuzzy Comprehensive Evaluation Method
2.3.1. Determine the Evaluation Factor Set
Assuming that the risk factor set of the financial industry is u, according to the evaluation system in Table 1:
U = {technical risk U1, ethical risk U2, management risk U3, operational risk U4, credit risk U5, market risk U6, legal risk U7} Each factor can be further decomposed into:
U1 = {network system security risk u11, technical support risk u12, technical ethics risk u13}
U2 = {social ethical risk u21, responsibility ethical risk u22, technology ethical risk u23}
U3 = {consumer operational risk u31, supplier operational risk u32, intermediary operational risk u33, payment method innovation risk u34}
U4 = {internal management risk u41, liquidity risk u42, associated risk u43}
U5 = {internal fraud risk u51, external fraud risk u52, credit risk u53, credit information abuse risk u54}
U6 = {interest rate risk u61, exchange rate risk u62, price change risk u63}
U7 = {risk of absence of laws and regulations u71, risk of regulatory vacancy u72, risk of subject qualification u73, risk of virtual currency u74, risk of network money laundering u75}
2.3.2. Determine the Evaluation Set
The evaluation set refers to the fuzzy evaluation grade set of risks in various financial industries. The set evaluation set is:
V = {V1, V2, V3, V4, V5} = {very high, high, medium, low, very low},
The scores corresponding to V1, V2, V3, V4 and V5 are 9, 7, 5, 3 and 1, respectively.
2.3.3. Establishment of Single-Factor Fuzzy Evaluation Matrix
Establish a fuzzy relationship matrix Ri between U and V, which is expressed as:
The membership degree, expressed by r11, reflects the membership relationship between the evaluation factor set (various risks of Internet finance) and the evaluation set (risk fuzzy evaluation grade). The membership degree Rij of the i-th risk in the factor set to the evaluation set {V1, V2, V3, V4, V5} is the probability that the i-th risk belongs to the j-th risk level.
2.3.4. Fuzzy Comprehensive Evaluation
First, the evaluation set T is obtained:
Where Wi is the weight set of each secondary, and Ri is the membership matrix. Calculate the values of T1, T2, … T3, Tm respectively, and then arrange Ti (i = 1, 2, 3 … m) in order to obtain the first-order index evaluation matrix as the row vector.
The fuzzy comprehensive evaluation matrix B can be obtained from the primary weight W, and the fuzzy comprehensive evaluation formula is as follows:
bi is the probability that the evaluation object U (financial industry risk) evaluates the evaluation set {V1, V2, V3, V4, V5} for the ith time by combining each index. According to the principle of maximum membership, taking b = Max (b1, b2, b3, …, bn), then the risk level corresponding to b is the risk level of the whole Internet finance.
3. Empirical Analysis of Financial Industry Risk Based on Fuzzy Analytic Hierarchy Process
Fuzzy comprehensive evaluation provides evaluation for practical comprehensive evaluation problems with the help of some concepts of fuzzy mathematics, that is, fuzzy comprehensive evaluation is a method based on fuzzy mathematics and applies the principle of fuzzy relation synthesis to quantify some factors with unclear boundaries and difficult quantification, and then carry out comprehensive evaluation [28].
3.1. Determine Indicator Weights
3.1.1. Weights of Key Indicators
Based on the satty1-9 scoring standard and the opinions of 50 experts, this paper obtains the judgment matrix of the first-level index, as shown in Table 4
According to the above financial industry risk judgment matrix, according to the mathematical formula, we can get:
The weight matrix W is:
The results of the weight calculation (based on the root-square method) of the analytic hierarchy process showed that the weight of U1 was 38.703%, U2 was 18.636%, U3 was 8.375%, U4 was 5.24%, U5 was 6.871%, U6 was 3.573% and U7 was 18.602%, where the maximum weight of the index was U1 (38.703) and the minimum value was U6 (3.573).
3.1.2. Secondary Indicator Weight
(1) Technical risks. Similar to the weight calculation method of main indicators, the judgment matrix and indicators of technical risk are:
The results of weight calculation of analytic hierarchy process (based on square root method) show that the weight matrix of each secondary index under technical risk is (unit: percentage): W1 =The weight of U11 is 8.522%, that of U12 is 27.056%, and that of U13 is 64.422%, where the maximum value of the index weight is U13 (64.422) and the minimum value is U11 (8.522).
(2) Ethical risk. The judgment matrix and indicators of ethical risk are:
The results of weight calculation of analytic hierarchy process (based on square root method) show that the weight matrix of each secondary index under ethical risk is (unit: percentage): W2 =The weight of U21 is 21.764%, that of U22 is 9.14%, and that of U23 is 69.096%, where the maximum weight of the index is U23 (69.096) and the minimum value is U22 (9.14).
(3) managing risks. The judgment matrix and indicators for risk management are as follows:
The results of the weight calculation of the analytic hierarchy process (based on the square root method) show that the weight matrix of each secondary indicator under the management risk is (unit: percentage): W3 =The weight of U31 is 5.761%, U32 is 24.664%, U33 is 11.143%, and U34 is 58.431%, where the maximum weight of the index is U34 (58.431) and the minimum value is U31 (5.761).
(4) Operational risk. The judgment matrix and indicators of operational risk are as follows:
The results of the weight calculation of the analytic hierarchy process (based on the square root method) show that the weight matrix of each secondary index under operational risk is (unit: percentage): W4 =The weight of U41 is 13.65%, that of U42 is 62.501%, and that of U43 is 23.849%, where the maximum value of the index weight is U42 (62.501) and the minimum value is U41 (13.65).
(5) Credit risk. The judgment matrix and indicators of credit risk are:
The results of the weight calculation of the analytic hierarchy process (based on the square root method) show that the weight matrix of each secondary index under credit risk can be determined as (unit: percentage): W5 =The weight of U51 is 7.195%, that of U52 is 10.175%, that of U53 is 21.584%, and that of U54 is 61.047%, where the maximum weight of the index is U54 (61.047) and the minimum value is U51 (7.195).
(6) Market risk. The judgment matrix and indicators of market risk are:
The weight calculation results of the analytic hierarchy process (based on the square root method) show that the weight matrix of each secondary index under market risk is (unit: percentage): W6 =The weight of U61 is 21.764%, that of U62 is 9.14%, and that of U63 is 69.096%, where the maximum weight of the index is U63 (69.096) and the minimum value is U62 (9.14).
(7)Legal risks. The judgment matrix and indicators of legal risk are as follows:
The weight calculation results of the analytic hierarchy process (based on the square root method) show that the weight matrix of each secondary index under market risk is (unit: percentage): W7 =The weight of U71 is 6.415%, U72 is 4.45%, U73 is 13.135%, U74 is 26.146% and U75 is 49.853%, where the maximum value of the index weight is U75 (49.853) and the minimum value is U72 (4.45).
3.2. Consistency Test
3.2.1. Consistency Test Of Main Indicators
By calculating the score of the main index of the judgment matrix, the eigenvector λ is obtained:
Where the largest characteristic root is 7.576,According to the RI table, the corresponding RI value is 1.341, so CR = CI/RI = 0.072 ≤ 0.1, which passes the one-time test.
3.2.2. Secondary Index Consistency Test
By calculating the score of the secondary index of the judgment matrix, the maximum characteristic root matrix and the corresponding RI value matrix of each secondary index are obtained as follows:
According to the formula , CR = CI/RI, and the obtained CR value matrix is:
Figure 2.
Consistency test chart of secondary risk indicators
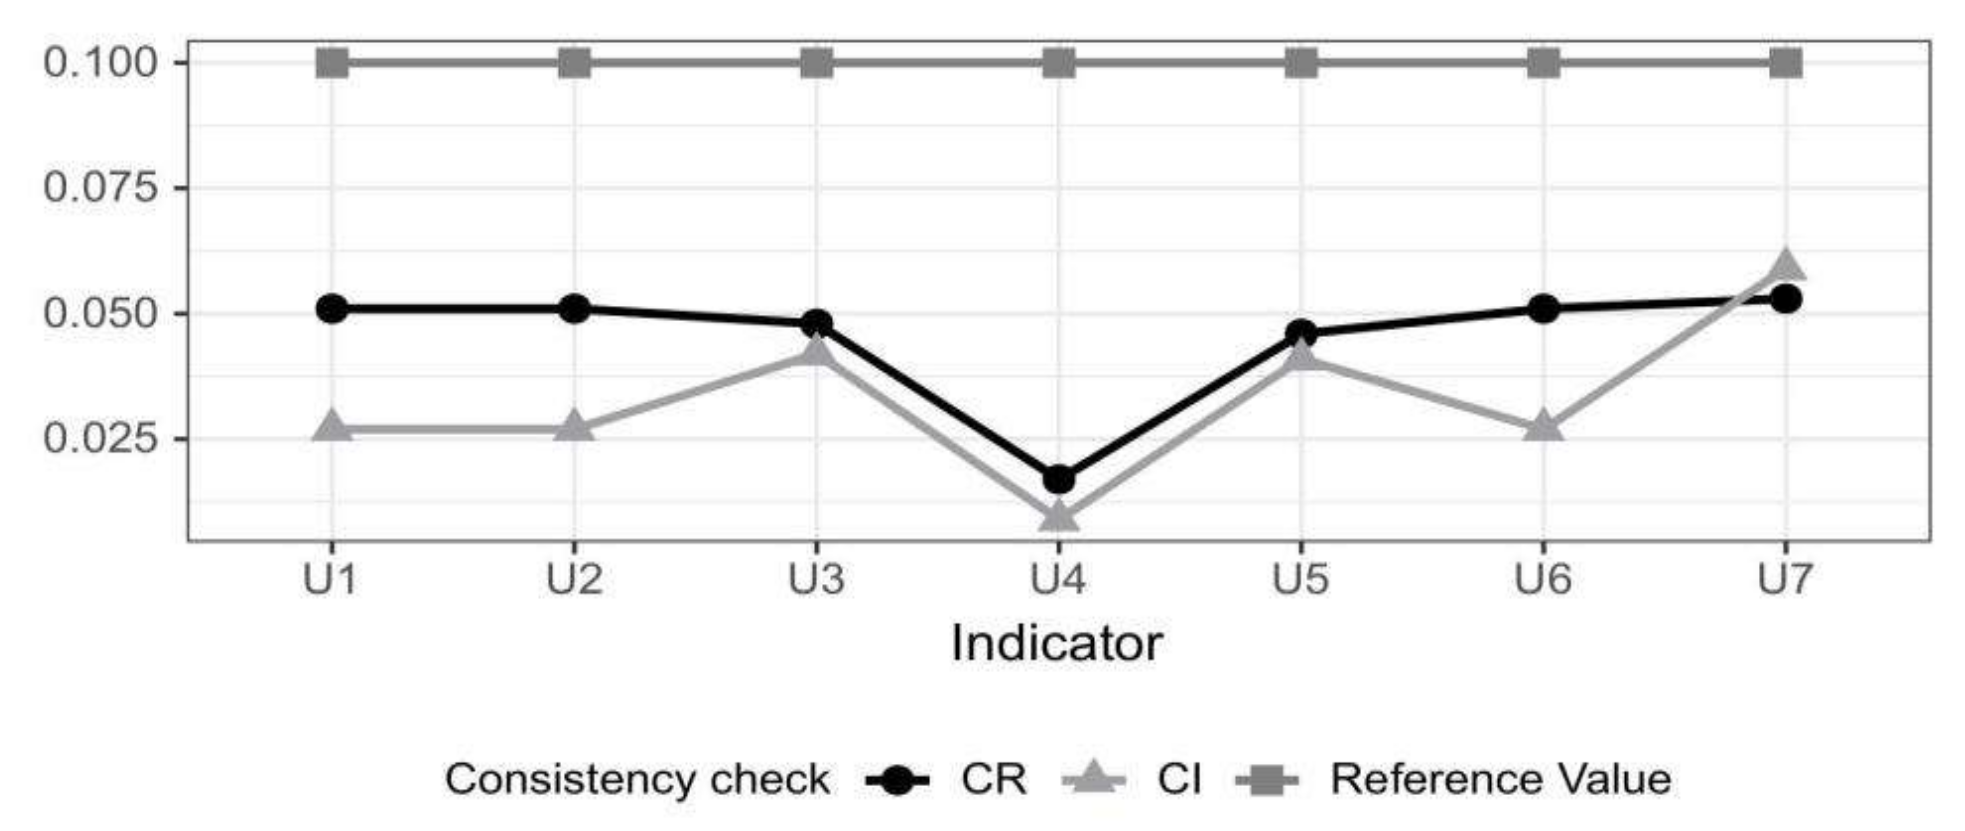
According to the above data and chart analysis, the CR values corresponding to each secondary index are less than 0.1, which passes the one-time test. Therefore, the index weights determined in 3.1 are all effective values, and the next fuzzy comprehensive evaluation can be carried out.
3.3. Fuzzy Comprehensive Evaluation
This paper invites 50 experts in the risk field of financial industry to score the membership degree of each secondary indicator. The results are shown in Table 5.
According to the fuzzy comprehensive evaluation formula Ti=Wi·Ri, the evaluation results of each secondary index are as follows:
Since the weight distribution of the standard layer indicator is:
According to the calculation formula of comprehensive fuzzy evaluation matrix B: B = W·T, we can obtain:
From the above results, it can be seen that for 7 indicators (Technical risk, Ethical risk, Legal risk, Management risk, Credit risk, Operational risk, Market risk) and 5 comments (Very High, High, Medium, Low, Very low) Fuzzy comprehensive evaluation is carried out, and the weighted average M (*, +) operator is used for research; Firstly, from the evaluation index weight vector A (which can be obtained from the custom weight), a 7X5 weight judgment matrix R is constructed, and finally the membership degrees of five comment sets are obtained by analysis, which are 0.031, 0.324, 0.324, 0.25 and 0.07 respectively. Therefore, it can be obtained that the general weight of the five comment sets is the highest, and the rule of maximum membership degree of the set can be obtained. The final comprehensive evaluation result is "High". Therefore, the financial technology risk is obtained, that is, the corresponding first risk level is "High", so the overall evaluation level of financial technology risk is "High".
Further, the calculation results of fuzzy comprehensive evaluation of each index can be obtained that the fuzzy evaluation matrix Bi under each first-level index is:
According to the principle of maximum membership degree, that is, the value is Max (b1, b2, b3, …, b4), so the fuzzy evaluation results under each first-level index will be obtained. See the following main index analysis for specific results.
3.4. Analysis of Fuzzy Evaluation Results
3.4.1. Quantitative Conclusion Analysis: Analysis of Main Indicators
First, According to the weight results of major financial industry risk indicators above, the weight value of Technical risk is 38.703%, accounting for the largest proportion, followed by Ethical risk, accounting for 18.636%. The third is Legal risk, accounting for 18.602%. The weights of the remaining risk indicators (Management risk, Operational risk, Credit risk, Market risk) are 8.375%, 5.24%, 6.871%, and 3.573% respectively.
Secondly, Italian economist Vilfredo Pareto put forward it in the late 19th and early 20th centuries. He believes that in any group of things, the most important accounts for only a small part of it, about 20%, and the remaining 80%, although majority, are secondary. This phenomenon has been widely used and embodied in many fields such as economics, management, sociology, etc. [29]. In this article, it can be seen that although there are only three risk indicators, Technical risk, Ethical risk and Legal risk account for nearly 76% of the weight, while the remaining four indicators only account for 24%. From this, we need to focus on the financial industry problems caused by Technical risk, Ethical risk and Legal risk, and control the financial industry risks most effectively by optimizing resource allocation.
Finally, as can be seen from the above table, for three indicators (Network system security risk: u11, Technical support risk: u12, Date transmission security risk: u13) and five comments (Very High, High, Medium, Low, Very low) Fuzzy comprehensive evaluation is carried out, and the weighted average M (*, +) operator is used for research; Firstly, from the evaluation index weight vector A (which can be obtained from the custom weight), a 3X5 weight judgment matrix R is constructed, and finally the membership degrees of five comment sets are obtained by analysis, which are 0.046, 0.516, 0.264, 0.166 and 0.009 respectively. Therefore, it can be obtained that the general weight of the five comment sets is the highest, and the rule of maximum membership degree of the set can be obtained. The final comprehensive evaluation result is "High". That is, in terms of Technical risk, according to the evaluation result B1 =And the risk assessment value is 0.516, and the corresponding risk assessment grade is "High".
According to the fuzzy comprehensive evaluation analysis and the principle of maximum membership degree, the risk evaluation value matrix MaxBi is obtained as follows:
Therefore, the corresponding risk assessment grades are obtained, namely: Technical risk, Ethical risk and Legal risk, and the corresponding risk assessment grades are all "High"; The risk assessment level corresponding to Management risk and Operational risk is "Medium"; The risk assessment levels corresponding to Credit risk and Market risk are all "Low".
Figure 3.
(a)Ranking chart of main risks in the financial industry;(b)Fuzzy comprehensive evaluation membership degree
Figure 3.
(a)Ranking chart of main risks in the financial industry;(b)Fuzzy comprehensive evaluation membership degree
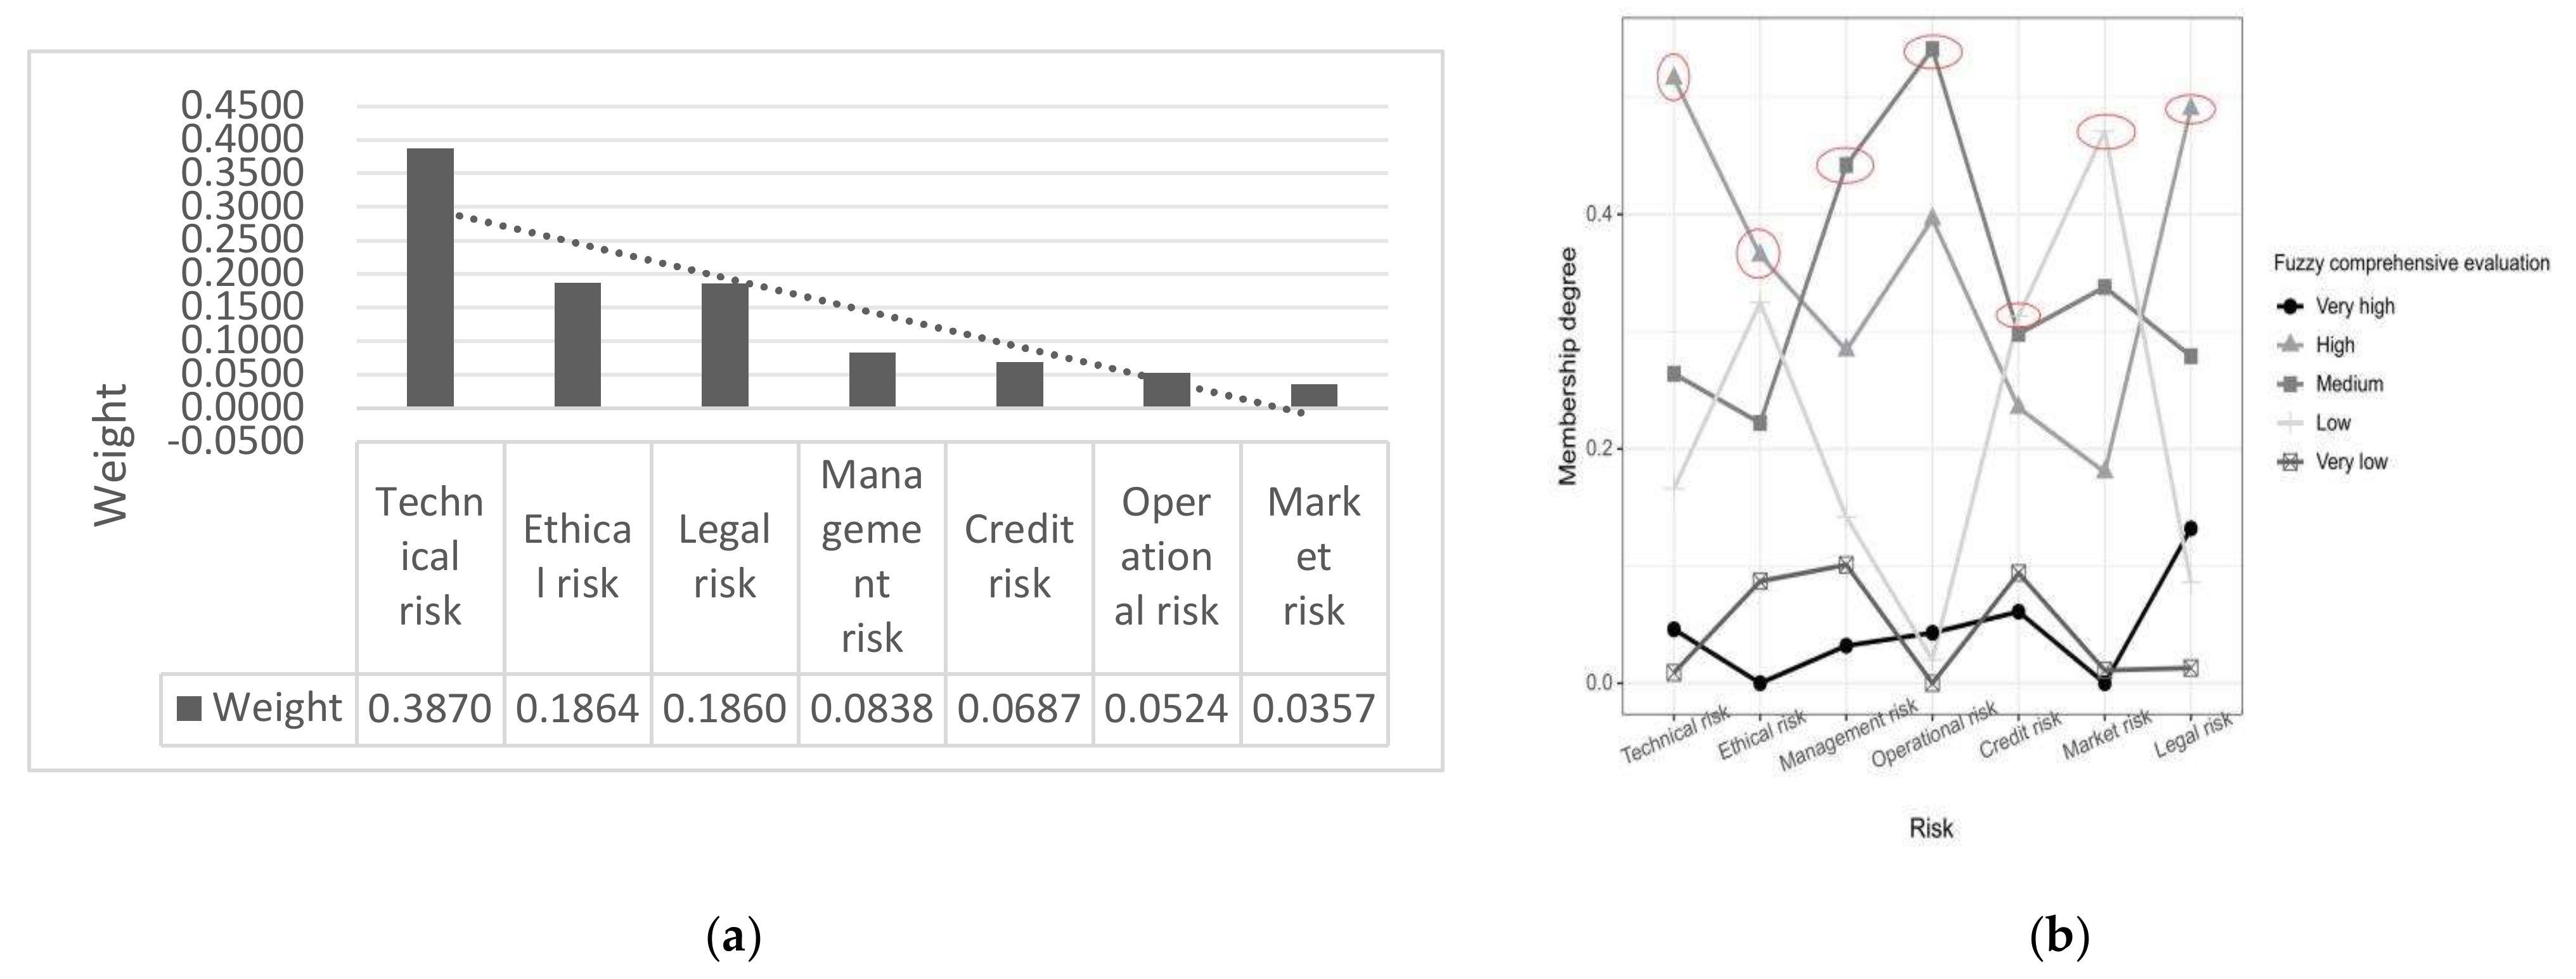
According to the above chart, the final ranking is: Technical risk > Legal risk > Ethical risk > Operational risk > Management risk > Credit risk > Market risk, which is roughly consistent with the conclusion of weight analysis. The higher the risk assessment level of each risk level, the more conducive it is to improve the overall risk of financial industry risks.
3.4.2. Empirical Conclusion Analysis: Secondary Index Analysis
(1) Technical risk (W = 38.703%)
First, from W1 =,It can be seen that Date transmission security risk accounts for the largest proportion, at 64.422%. Date transmission security risk has a far-reaching and serious impact on the financial industry. As an intensive industry of data processing and transmission, the financial industry's business operations are highly dependent on the stability of information systems and data security. The reasons why Date transmission security risk has a great impact on the financial industry are mainly due to the financial industry's high dependence on information technology, the protection needs of sensitive information, business continuity and stability requirements, regulatory compliance pressure, and technical challenges and vulnerabilities. These factors collectively determine the importance and urgency of Date transmission security risk in the financial industry.
The second is Technical support risk, accounting for 27.056%. , the impact of technical support risk on the financial industry is multifaceted, including business operation interruption, data security and privacy leakage, compliance and legal risks, hindered technological innovation and declined competitiveness, and declined customer trust and damaged brand reputation. Therefore, financial institutions need to attach great importance to the management and control of technology-enabled risks to ensure the robustness and sustainability of their business operations. While the weighting is relatively modest, financial institutions need to place high priority on the management and control of technology-enabled risks to ensure the robustness and sustainability of their business operations.
Finally, Network system security risk accounts for 8.522%. Although Network system security risk has a potential impact on the financial industry, its impact may be relatively small due to financial institutions' high emphasis on cyber security, the application of advanced technologies, strict compliance requirements, emergency response and resilience capabilities, customer education and prevention awareness, industry cooperation and information sharing, and risk diversification and diversification efforts. However, this does not mean that financial institutions can relax their vigilance and management of network security risks. On the contrary, they should continue to strengthen network security construction to ensure the security of customer data and transactions.
(2) Ethical risk (W = 18.636%)
First, according to the weight distribution W2 =,Technical ethical risk is the most significant risk, accounting for 69.096%. Technology ethical risk has a huge impact on the financial industry because it directly involves data security and privacy protection, fairness and transparency of algorithm decision-making, risk of technology abuse, and regulatory lag and compliance issues. These problems not only affect the reputation and business stability of financial institutions, but also threaten the fairness and stability of the whole financial market.
Followed by Social ethical risk, accounting for 21.764%. Although the weight of Social ethical risk is relatively modest, Social ethical risk involves aspects such as social behavior, ethical norms and values, and when these aspects go wrong, it may have a negative impact on the financial industry. This includes, but is not limited to, practices such as fraud, embezzlement, corruption, conflicts of interest, unfair dealings, and the impact of these practices on the financial institution's reputation, customer trust, and business stability.
Finally, Liability ethical risk accounts for 9.14%. While the impact of Liability ethical risk on the financial industry may be relatively small, its existence still cannot be ignored. Financial institutions should strengthen their awareness of social responsibility, improve internal control and risk management, strengthen customer communication and trust building, and actively participate in industry self-discipline and regulatory cooperation, so as to cope with potential ethical risks of responsibility and promote the healthy development of the financial industry.
(3) Managing risk (W = 8.375%)
First, according to the weight distribution W3 =, the most important risk is the Payment method innovation risk, accounting for 58.431%. The second is Supplier operational risk, accounting for 24.664%.
Finally, there are Mediator operational risk and Consumer operational risk, accounting for 11.143% and 5.761%, respectively. Under management risks, since Payment method innovation risk accounts for the largest proportion of management risks in the financial industry, empirical analysis shows that because of the increasing diversification and complexity of payment methods, the uncertainty brought about by technological innovation, supervision lags behind innovation, the risks of cross-border payments and cross-platform payments, and changes in user behavior and security awareness, etc. In order to effectively manage these risks, the financial industry needs to continuously strengthen technological innovation and regulatory cooperation, improve users' safety awareness, and establish a sound risk management system. For other indicators, although the weight of other analyses is small, the same cannot be ignored.
(4) Operational risk (W = 5.240%)
First, according to the weight value W4 =, Liquidity risk is the most important risk, accounting for 62.501%. The reasons why Liquidity risk accounts for the largest proportion of operational risks in the financial industry mainly include the essential characteristics of the financial industry, the complex and changeable market environment, improper liquidity management within financial institutions, the influence of investor behavior and market confidence, globalization and interconnected financial markets and other factors. In order to effectively manage and prevent liquidity risk, financial institutions need to take a series of measures to strengthen liquidity risk management and prevention
The second is Associated risk and Internal management risk, accounting for 23.849% and 13.65% respectively. Although the weight of these two is small, they can't be ignored equally, and they also play an important role in the risk analysis of the financial industry.
(5) Credit risk (W = 6.871%)
First, according to the weight value W5 =, Credit information abuse risk is the most prominent among credit risks, accounting for 61.047%. The reasons why Credit information abuse risk accounts for the largest proportion of credit risk in the financial industry mainly include lack of supervision and imperfect laws and regulations, weak internal control of financial institutions, information asymmetry and profit-driven factors. In order to reduce this risk, it is necessary to strengthen the construction of laws and regulations, strengthen the internal control of financial institutions, improve the accuracy of credit information evaluation, and strengthen public education and awareness raising.
The second is Credit risk, accounting for 21.584%. Finally, there are External fraud risk and Internal fraud risk, accounting for 10.175% and 7.195% respectively. Although the weight of the two is small, the same cannot be ignored. Whether it is external fraud or internal fraud, it will lead to a crisis of public trust in financial institutions. This crisis of confidence may make it difficult for financial institutions to gain the trust of customers and investors, thus affecting their business development and market competitiveness.
(6) Market risk (W = 3.573%)
First, according to the weight distribution W6 =, the most important risk is the Price movement risk, accounting for 69.096%. Followed by Interest rate risk, accounting for 21.764%. Finally, there is Exchange rate risk, which accounts for 9.14%.
(7) Legal risk (W = 18.602%)
First, from W7 =, it can be seen that the most important risk is that Online money laundering risk accounts for the largest proportion, at 49.853%. According to the weight analysis, the impact of Online money laundering risk on the financial industry is far-reaching and complex. Through concrete empirical analysis, it can be seen that this risk will damage the reputation, compliance and operational risks of financial institutions, the fluctuation of financial market, abnormal capital flow and systemic financial risks, as well as the difficulty, means and technology update and cost increase of financial supervision. Therefore, financial institutions and regulatory agencies need to work together to strengthen anti-money laundering work and improve risk prevention capabilities to maintain the stability and healthy development of financial markets.
Followed by Virtual currency risk and Subject qualification risk, accounting for 26.146% and 13.135% respectively.
Finally, there are Laws and regulations absence risk and Regulatory vacancy risk, accounting for 6.415% and 4.45%.
The significance of modeling in this paper lies in the level of each risk level obtained by empirical analysis, so as to carry out risk prevention targeted and targeted. The higher the risk assessment value, the greater the prevention should be.
4. Discussion
According to the above quantitative conclusion analysis and empirical conclusion analysis, it can be concluded that although Technical risk, Ethical risk and Legal risk only account for three risk indicators, they account for nearly 76% of the weight, while the remaining four indicators only account for 24%. However, these three risk indicators are just brought about by the emerging financial technology risks brought about by the combination of finance and technology with the development of science and technology in the times, while most of the other traditional financial risks account for a relatively small proportion. This data reflects that with the emergence of financial technology, the fundamental changes in China's financial product design logic and financial market operation mechanism, and the complexity of financial technology business model leads to the continuous update of the manifestations and connotations of financial risks, increasing the difficulty of risk identification and the speed of risk transmission. Technology itself is not only the driving force for the development of financial technology, but also the risk point of financial technology.
Looking forward to the future, facing China's financial industry, financial technology uses advanced technologies such as big data, artificial intelligence, and blockchain to greatly improve the efficiency and convenience of financial services. However, the rapid development of these technologies has also brought many uncertainties, such as system security, data security and other issues, which have increased financial technology risks. Therefore, we need to pay more attention to the potential financial technology risks brought about by technological development. However, although the risks of the traditional financial industry account for a relatively small proportion under the judgment of financial experts, they also constitute a part of the risks of the financial industry and cannot be ignored.
References
- Ma, Y.; Liu, D. Introduction to the Special Issue on Crowdfunding and FinTech. Financ. Innov. 2017, 3, 8. [Google Scholar] [CrossRef]
- Khudiakova, L.S.; Sidorova, E.A. Eu Single Financial Market: Illusion or Reality? MIROVAYA Ekon. MEZHDUNARODNYE Otnos. 2020, 64, 63–72. [Google Scholar] [CrossRef]
- Pi, T.; Hu, H.; Lu, J.; Chen, X. The Analysis of Fintech Risks in China: Based on Fuzzy Models. Mathematics 2022, 10, 1395. [Google Scholar] [CrossRef]
- Scholtens, B.; van Wensveen, D. A Critique on the Theory of Financial Intermediation. J. Bank. FINANCE 2000, 24, 1243–1251. [Google Scholar] [CrossRef]
- Boyd, J.; Smith, B. Intermediation and the Equilibrium Allocation of Investment Capital - Implications for Economic-Development. J. Monet. Econ. 1992, 30, 409–432. [Google Scholar] [CrossRef]
- Grohmann, A.; Kluehs, T.; Menkhoff, L. Does Financial Literacy Improve Financial Inclusion? Cross Country Evidence. WORLD Dev. 2018, 111, 84–96. [Google Scholar] [CrossRef]
- Li Zhan. Research on Measurement and Supervision of Fintech Risk in China. Ph.D., Beijing Jiaotong University, 2023. [CrossRef]
- Murinde, V.; Rizopoulos, E.; Zachariadis, M. The Impact of the FinTech Revolution on the Future of Banking: Opportunities and Risks. Int. Rev. Financ. Anal. 2022, 81, 102103. [Google Scholar] [CrossRef]
- Wilson, J.P.; Campbell, L. Financial Functional Analysis: A Conceptual Framework for Understanding the Changing Financial System. J. Econ. Methodol. 2016, 23, 413–431. [Google Scholar] [CrossRef]
- (Mansour, N. The Impact of Fintech Development on Commercial Banks’ Profitability. J. Organ. END USER Comput. 2024, 36, 349933. [Google Scholar] [CrossRef]
- Brunner-Kirchmair, T.M.; Wiener, M. Knowledge Is Power - Conceptualizing Collaborative Financial Risk Assessment. J. RISK FINANCE 2019, 20, 226–248. [Google Scholar] [CrossRef]
- Li, J.; Li, J.; Zhu, X.; Yao, Y.; Casu, B. Risk Spillovers between FinTech and Traditional Financial Institutions: Evidence from the U.S. Int. Rev. Financ. Anal. 2020, 71, 101544. [Google Scholar] [CrossRef]
- Zhou, H.; Li, S. Effect of COVID-19 on Risk Spillover between Fintech and Traditional Financial Industries. Front. Public Health 2022, 10. [Google Scholar] [CrossRef] [PubMed]
- Virglerova, Z.; Dvorsky, J.; Kozubikova, L.; Cepel, M. Perception of Non-Financial Risk Determinants in SMEs in Visegrad Countries. OECONOMIA Copernic. 2020, 11, 509–529. [Google Scholar] [CrossRef]
- Lee, I.; Shin, Y.J. Fintech: Ecosystem, Business Models, Investment Decisions, and Challenges. Bus. Horiz. 2018, 61, 35–46. [Google Scholar] [CrossRef]
- Vives, X. Endogenous Public Information and Welfare in Market Games. Rev. Econ. Stud. 2017, 84, 935–963. [Google Scholar] [CrossRef]
- Xu, C.; Shiina, T. Financial Investment, Financial Risk and Risk Management. In RISK MANAGEMENT IN FINANCE AND LOGISTICS.; Translational Systems Sciences; Springer-Verlag Singapore Pte Ltd: Singapore, 2018; pp. 3–11. [Google Scholar] [CrossRef]
- Zhu, H.; Liu, X. The Financial Risk Index System and Early-Warning Research. In PROCEEDINGS OF THE 3RD INTERNATIONAL CONFERENCE ON MECHATRONICS, ROBOTICS AND AUTOMATION (ICMRA 2015); Yarlagadda, P., Ed.; ACSR-Advances in Comptuer Science Research; Atlantis Press: Paris, 2015; Vol. 15, pp 443–447.
- Breidbach, C.F.; Keating, B.W.; Lim, C. Fintech: Research Directions to Explore the Digital Transformation of Financial Service Systems. J. Serv. THEORY Pract. 2019, 30, 79–102. [Google Scholar] [CrossRef]
- Kou, G.; Akdeniz, O.O.; Dincer, H.; Yuksel, S. Fintech Investments in European Banks: A Hybrid IT2 Fuzzy Multidimensional Decision-Making Approach. Financ. Innov. 2021, 7, 39. [Google Scholar] [CrossRef]
- Kong, M.-Q.; Tang, J.-X.; Yu, S.-M. Financial Risk Assessment of an Ocean Shipping Company Based on the AHP. J. Coast. Res. 2020, 481–485. [Google Scholar] [CrossRef]
- Ferreira, F.A.F.; Santos, S.P.; Dias, V.M.C. An Ahp-Based Approach to Credit Risk Evaluation of Mortgage Loans. Int. J. Strateg. Prop. Manag. 2014, 18, 38–55. [Google Scholar] [CrossRef]
- Hou, X.; Gao, Z.; Wang, Q. Internet Finance Development and Banking Market Discipline: Evidence from China. J. Financ. Stab. 2016, 22, 88–100. [Google Scholar] [CrossRef]
- Brady, S.R. Utilizing and Adapting the Delphi Method for Use in Qualitative Research. Int. J. Qual. METHODS 2015, 14. [Google Scholar] [CrossRef]
- Barrios, M.; Guilera, G.; Nuno, L.; Gomez-Benito, J. Consensus in the Delphi Method: What Makes a Decision Change? Technol. Forecast. Soc. CHANGE 2021, 163, 120484. [Google Scholar] [CrossRef]
- Bodin, L.; Gass, S.I. On Teaching the Analytic Hierarchy Process. Comput. Oper. Res. 2003, 30, 1487–1497. [Google Scholar] [CrossRef]
- Zhu, L. Research and Application of AHP-Fuzzy Comprehensive Evaluation Model. Evol. Intell. 2022, 15, 2403–2409. [Google Scholar] [CrossRef]
- Chan, H.K.; Sun, X.; Chung, S.-H. When Should Fuzzy Analytic Hierarchy Process Be Used Instead of Analytic Hierarchy Process? Decis. SUPPORT Syst. 2019, 125, 113114. [Google Scholar] [CrossRef]
- Cato, S. Pareto Principles, Positive Responsiveness, and Majority Decisions. THEORY Decis. 2011, 71, 503–518. [Google Scholar] [CrossRef]
Figure 1.
Research flow chart.
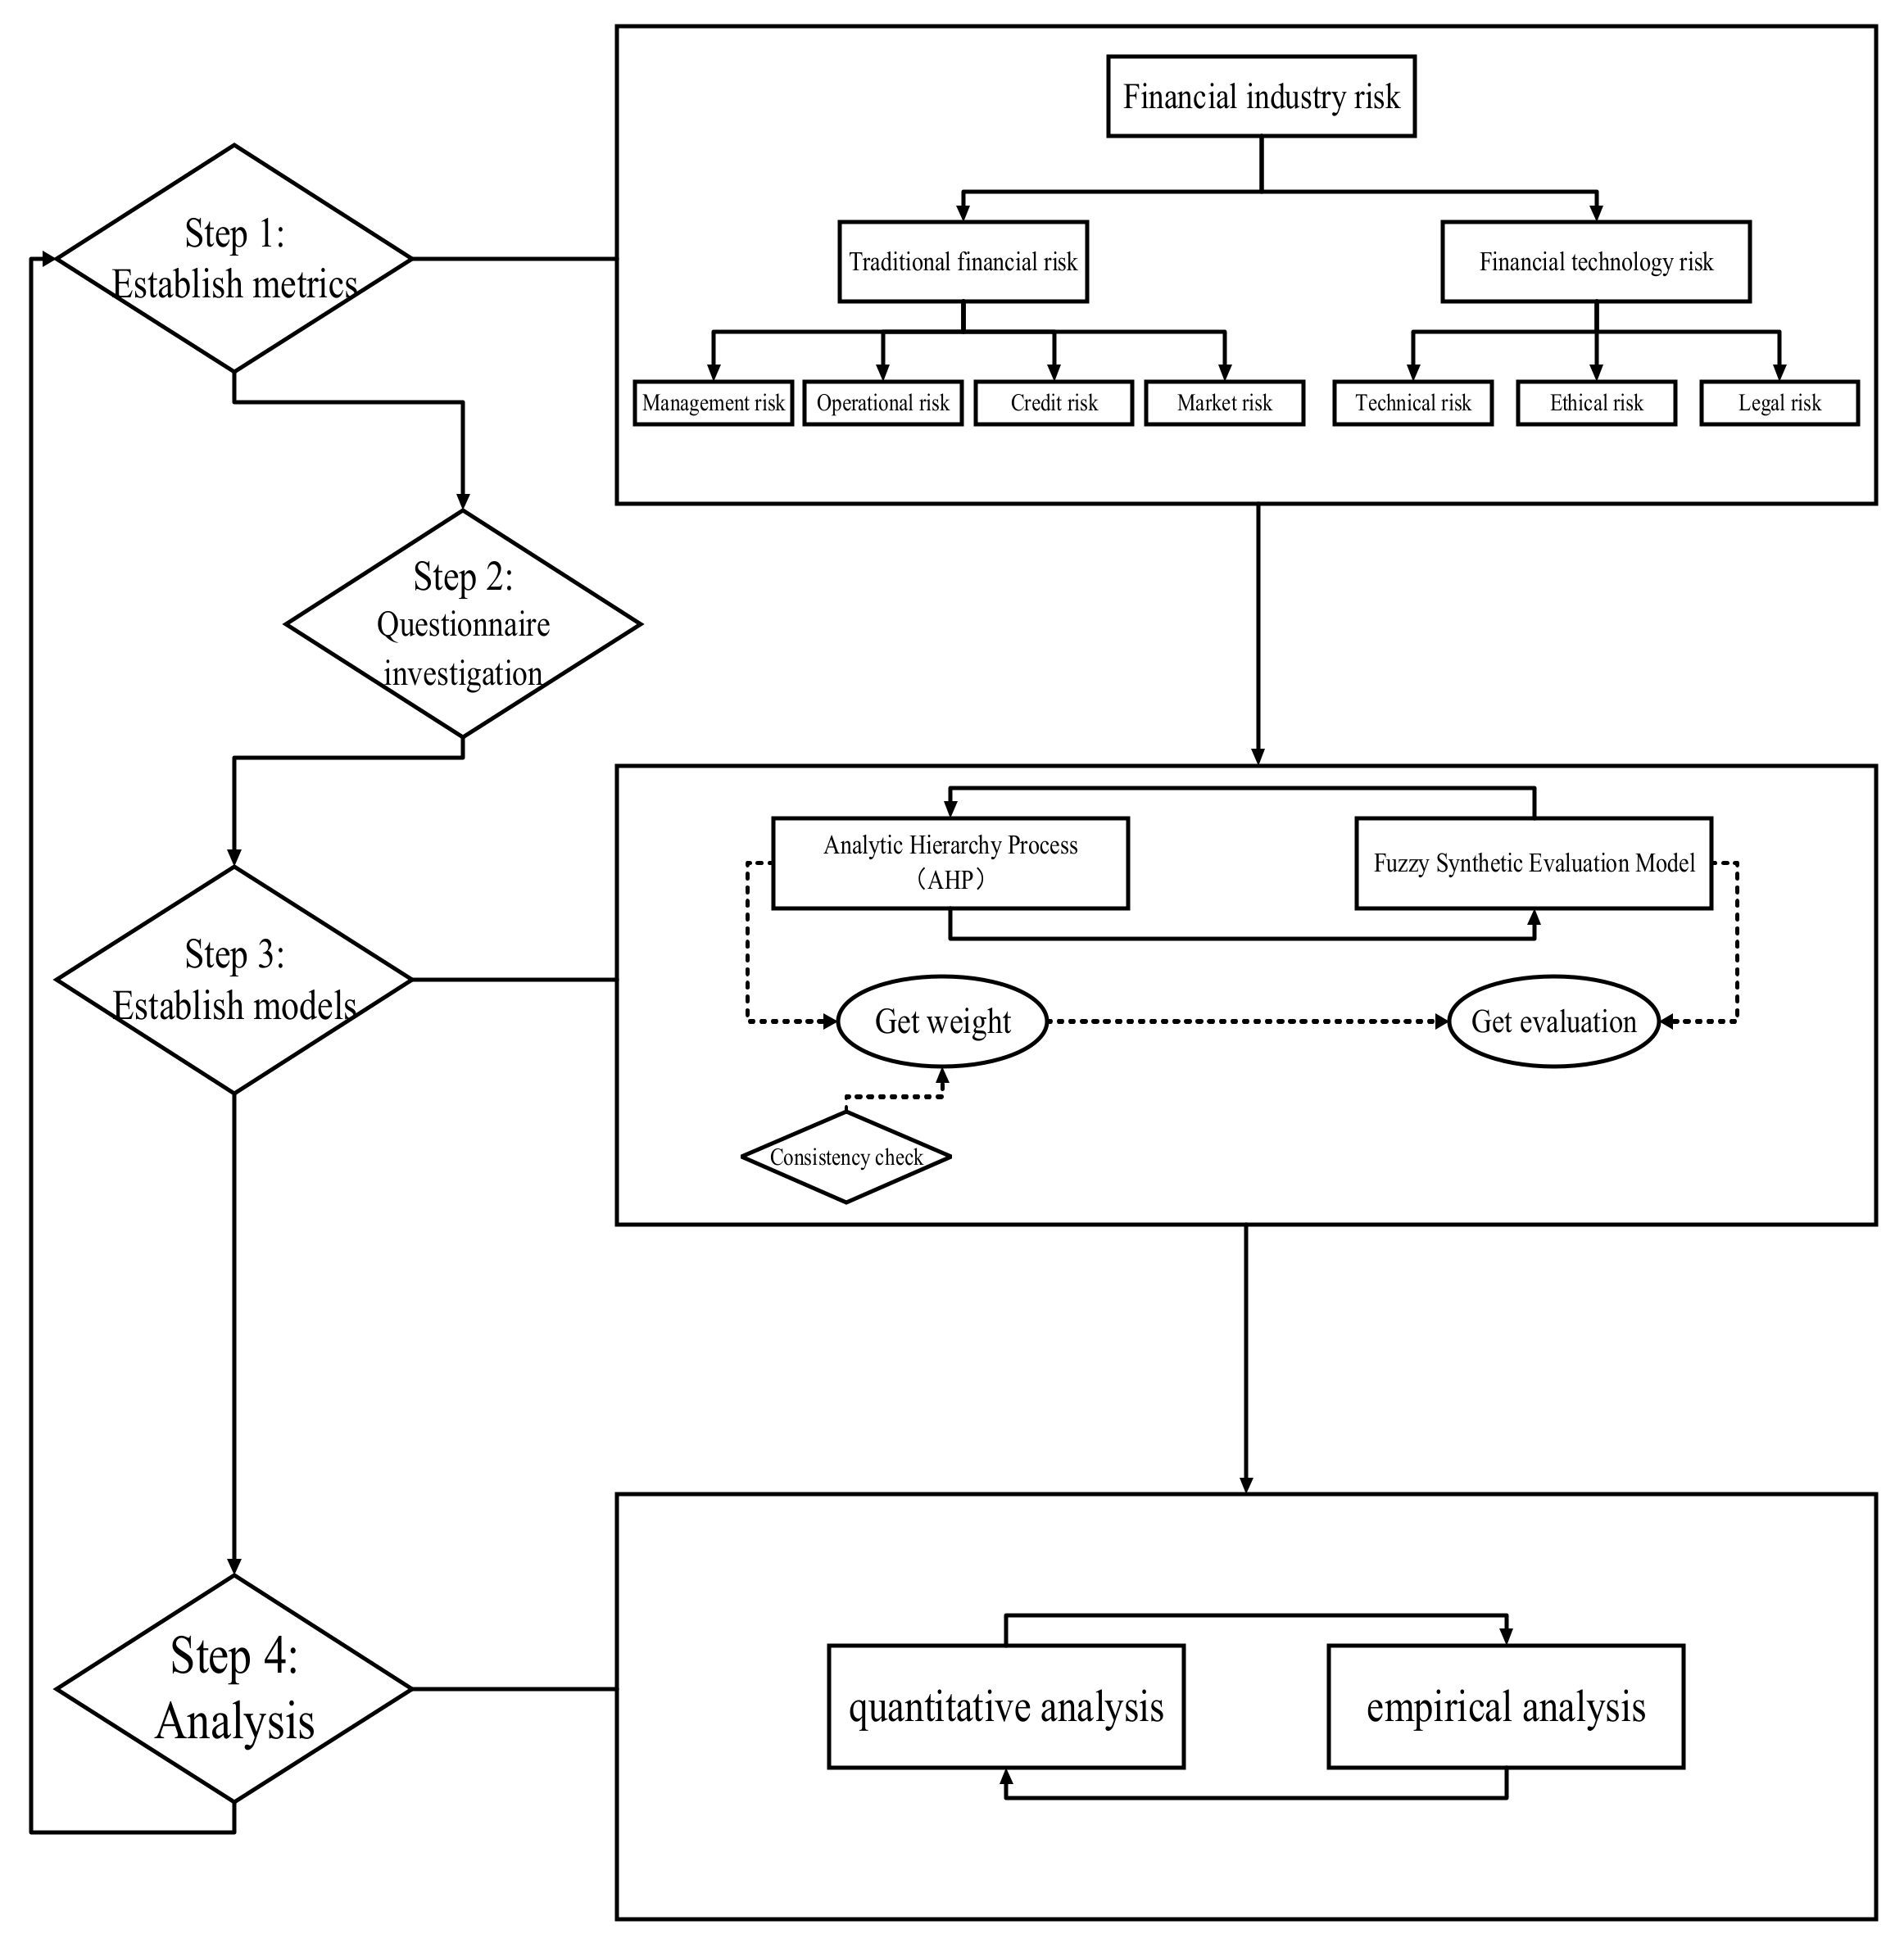

Table 1.
Financial industry risk assessment system
| Evaluation object | Primary indicator | Secondary indicator |
|---|---|---|
| Fintech risk: U | Technical risk: U1 | Network system security risk: u11 |
| Date transmission security risk: u13 | ||
| Date transmission security risk: u13 | ||
| Ethical risk: U2 | Social ethical risk: u21 | |
| Liability ethical risk: u22 | ||
| Technical ethical risk: u23 | ||
| Management risk: U3 | Consumer operational risk: u31 | |
| Supplier operational risk: u32 | ||
| Mediator operational risk: u33 | ||
| Payment method innovation risk: u34 | ||
| Operational risk: U4 | Internal management risk: u41 | |
| Liquidity risk: u42 | ||
| Associated risk: u43 | ||
| Credit risk: U5 | Internal fraud risk: u51 | |
| External fraud risk: u52 | ||
| Credit risk: u53 | ||
| Credit information abuse risk: u54 | ||
| Market risk: U6 | Interest rate risk: u61 | |
| Exchange rate risk: u62 | ||
| Price movement risk: u63 | ||
| Legal risk: U7 | Laws and regulations absence risk: u71 | |
| Regulatory vacancy risk: u72 | ||
| Subject qualification risk: u73 | ||
| Virtual currency risk: u74 | ||
| Online money laundering risk: u75 |
Table 2.
Satty analytic hierarchy process scale 1-9
| Scale aij | Meaning |
|---|---|
| 1 | i factor is as important as j factor |
| 3 | i factor is slightly more important than j factor |
| 5 | Compare with factor j, factor i is obviously more important than factor j |
| 7 | i factor is more important than j factor |
| 9 | i factor is absolutely more important than j factor |
| 2,4,6,8 | Intermediate value of the above adjacent judgment |
| Reciprocal | Indicates that the former is less important than the latter |
Table 3.
Random consistency indicator RI values.
| n | 1 | 2 | 3 | 4 | 5 | 6 | 7 | 8 | 9 | 10 | 11 |
|---|---|---|---|---|---|---|---|---|---|---|---|
| RI | 0 | 0 | 0.58 | 0.90 | 1.12 | 1.24 | 1.32 | 1.41 | 1.45 | 1.49 | 1.51 |
Table 4.
Risk judgment matrix of financial industry.
| U | U1 | U2 | U3 | U4 | U5 | U6 | U7 |
|---|---|---|---|---|---|---|---|
| U1 | 1 | 4 | 5 | 5 | 5 | 6 | 3 |
| U2 | 1/4 | 1 | 3 | 4 | 3 | 3 | 2 |
| U3 | 1/5 | 1/3 | 1 | 2 | 2 | 3 | 1/4 |
| U4 | 1/5 | 1/4 | 1/2 | 1 | 1/2 | 3 | 1/5 |
| U5 | 1/5 | 1/3 | 1/2 | 2 | 1 | 3 | 1/4 |
| U6 | 1/6 | 1/3 | 1/3 | 1/3 | 1/3 | 1 | 1/4 |
| U7 | 1/3 | 1/2 | 4 | 5 | 4 | 4 | 1 |
Table 5.
SIngle-factor fuzzy evaluation of financial industry risk
| Primary indicator | Secondary indicator | Membership degree | ||||
|---|---|---|---|---|---|---|
| Technical risk: U1 (38.703%) |
Network system security risk: u11(8.522%) | 0.00 | 0.15 | 0.25 | 0.50 | 0.10 |
| Technical support risk: u12(27.056%) | 0.05 | 0.55 | 0.30 | 0.10 | 0.00 | |
| Date transmission security risk: u13(64.422%) | 0.05 | 0.55 | 0.25 | 0.15 | 0.00 | |
| Ethical risk: U2 (18.636%) |
Social ethical risk: u21(21.764%) | 0.00 | 0.40 | 0.30 | 0.30 | 0.00 |
| Liability ethical risk: u22(9.14%) | 0.00 | 0.40 | 0.20 | 0.20 | 0.20 | |
| Technical ethical risk: u23(69.096%) | 0.00 | 0.35 | 0.20 | 0.35 | 0.10 | |
| Management risk: U3 (8.375%) |
Consumer operational risk: u31(5.761%) | 0.05 | 0.15 | 0.50 | 0.30 | 0.00 |
| Supplier operational risk: u32(24.664%) | 0.00 | 0.10 | 0.50 | 0.20 | 0.20 | |
| Mediator operational risk: u33(11.143%) | 0.00 | 0.15 | 0.50 | 0.15 | 0.20 | |
| Payment method innovation risk: u34(58.431%) | 0.05 | 0.40 | 0.40 | 0.10 | 0.05 | |
| Operational risk: U4 (5.24%) |
Internal management risk: u41(13.65%) | 0.05 | 0.35 | 0.45 | 0.15 | 0.00 |
| Liquidity risk: u42(62.501%) | 0.00 | 0.50 | 0.50 | 0.00 | 0.00 | |
| Associated risk: u43(23.849%) | 0.15 | 0.15 | 0.70 | 0.00 | 0.00 | |
| Credit risk: U5 (6.871%) |
Internal fraud risk: u51(7.195%) | 0.00 | 0.30 | 0.30 | 0.30 | 0.10 |
| External fraud risk: u52(10.175%) | 0.00 | 0.30 | 0.40 | 0.30 | 0.00 | |
| Credit risk: u53(21.584%) | 0.00 | 0.00 | 0.10 | 0.50 | 0.40 | |
| Credit information abuse risk: u54(61.047%) | 0.10 | 0.30 | 0.35 | 0.25 | 0.00 | |
| Market risk: U6 (3.573%) |
Interest rate risk: u61(21.764%) | 0.00 | 0.30 | 0.20 | 0.45 | 0.05 |
| Exchange rate risk: u62(9.14%) | 0.00 | 0.50 | 0.20 | 0.30 | 0.00 | |
| Price movement risk: u63(69.096%) | 0.00 | 0.10 | 0.40 | 0.50 | 0.00 | |
| Legal risk: U7 (18.602%) |
Laws and regulations absence risk: u71(6.415%) | 0.05 | 0.35 | 0.45 | 0.15 | 0.00 |
| Regulatory vacancy risk: u72(4.45%) | 0.10 | 0.20 | 0.70 | 0.00 | 0.00 | |
| Subject qualification risk: u73(13.135%) | 0.00 | 0.30 | 0.70 | 0.00 | 0.00 | |
| Virtual currency risk: u74(26.146%) | 0.00 | 0.65 | 0.20 | 0.10 | 0.05 | |
| Online money laundering risk: u75(49.853%) | 0.25 | 0.50 | 0.15 | 0.10 | 0.00 | |
Disclaimer/Publisher’s Note: The statements, opinions and data contained in all publications are solely those of the individual author(s) and contributor(s) and not of MDPI and/or the editor(s). MDPI and/or the editor(s) disclaim responsibility for any injury to people or property resulting from any ideas, methods, instructions or products referred to in the content. |
© 2024 by the authors. Licensee MDPI, Basel, Switzerland. This article is an open access article distributed under the terms and conditions of the Creative Commons Attribution (CC BY) license (http://creativecommons.org/licenses/by/4.0/).
Copyright: This open access article is published under a Creative Commons CC BY 4.0 license, which permit the free download, distribution, and reuse, provided that the author and preprint are cited in any reuse.


