
Submitted:
26 November 2024
Posted:
27 November 2024
You are already at the latest version
Abstract
Atopic dermatitis (AD) is a chronic inflammatory skin disorder influenced by proteins involved in skin barrier maintenance and vitamin D metabolism. This study compares protein expression in intra-lesional (IL) and peri-lesional (PL) skin biopsies from AD patients and examines associations between protein levels, vitamin D status, and clinical features. Forty-four biopsies from 22 AD patients were analyzed using antibody microarrays targeting 12 proteins. IL samples had significantly higher total protein levels than PL samples, with a mean difference of 77.7% (p<0.001). Several proteins, including cathelicidin, cingulin, occludin, filaggrin, and the vitamin D receptor, were upregulated in IL samples. Patients with vitamin D levels below 30 ng/ml showed higher expression of CYP24A (p=0.054), alpha-catenin (p=0.043), and haptoglobin (p=0.033). Increased EASI scores (≥16) were associated with elevated expression of CYP24A (p=0.024), CYP27B (p=0.044), filaggrin (p=0.027), occludin (p=0.049), and claudin-1 (p=0.052). Multivariate regression analysis identified significant correlations between protein expression, skin prick test (SPT) positivity, and low vitamin D levels. These findings suggest that proteins related to epithelial barrier function and vitamin D metabolism are highly upregulated in IL skin regions, offering potential therapeutic targets for improving both skin barrier function and overall disease severity in AD patients.
Keywords:
atopic dermatitis
; vitamin D receptor
; skin barrier maintenance
; protein expression
1. Introduction
Atopic dermatitis (AD) is a chronic inflammatory skin condition that often coexists with other atopic disorders, including allergic rhinitis, food allergies, and asthma [1,2]. Affecting up to 20% of children and 14% of adults, the prevalence of AD varies across ethnicities and geographic regions [3]. The complex pathogenesis of this disease is primarily marked by alterations in the skin barrier, the immune system, and the microbiome. Tight junctions (TJs) and adherens junctions also contribute to skin barrier integrity by controlling the passage of substances and preventing nerve fiber extension, reducing itching [4,5].
Vitamin D plays a crucial role in skin health, influencing processes such as keratinocyte proliferation, differentiation, and immune regulation [6,7,8,9]. Its actions in the skin are mediated by the vitamin D receptor (VDR) [10]. Vitamin D helps regulate antimicrobial peptides, such as cathelicidin (CAMP), which protect against infection by disrupting microbial membranes [10]. Skin injury enhances local vitamin D synthesis, increasing CAMP production and boosting skin defense [11].
Skin biopsies remain the preferred method for analyzing AD’s immune and barrier characteristics [12]. Previous studies have shown significant molecular and cellular differences between lesional and non-lesional AD skin, including inflammatory cell infiltration and protein expression [12,13,14,15]. We have recently identified associations between VDR and tight junction proteins, showing a negative relationship between serum 25(OH)D levels and zonulin-1 expression in AD patients [16]. The aim of this cross-sectional exploratory study was to compare the expression of range proteins involved in cell junctions and epithelial barriers, vitamin D, and immune response and inflammation from lesional and peri-lesional AD biopsies to further explore their role in the disease’s pathogenesis and their clinical significance.
2. Results
2.1. Patient Characteristics
A total of 22 adult participants with AD, (59.1% male), were included (Table 1). The majority of patients (N=17; 77.3%) had moderate-to-severe disease, characterized by an EASI score ≥16 or <16 with face or hand involvement (Table 1). Most patients presented with generalized AD (N=8; 36.4%), and childhood onset was predominant, reported by 59.1% (N=13). Comorbid asthma and rhino-conjunctivitis were observed in 90.9% (N=20) and 68.2% (N=15) of patients, respectively, while both conditions coexisted in a subset of patients. Skin prick tests (SPT) were positive in 54.5% (N=12), and total IgE levels were ≥100 IU/ml in 54.5% (N=12). Additionally, 72.7% (N=16) of patients had insufficient serum vitamin D levels (<30 ng/ml) 25(OH)D.
2.2. Comparison of Protein Concentrations in Intra and Peri-lesional Biopsies
Protein concentrations from both PL and IL samples for each patient were compared (Supplementary Table S2). Mean total protein concentration was higher in IL samples (6.8±1.3 mg/ml) compared to PL samples (4.0±1.0 mg/ml, p<0.001) (Supplementary Figure S1a). For each patient, the protein concentration was also consistently higher in IL samples than in PL samples (Supplementary Figure S1b), equating to a mean percentage increase of 77.7±50.1%.
Hierarchical clustering analysis of protein expression profiles from PL and IL biopsy samples revealed two main clusters: one containing only PL samples and the other encompassing all IL samples and a few PL samples (Figure 1). This primary clustering was further subdivided into two distinct subclusters within each main group, indicating molecular differences within the main sample categories. The unique clustering of PL samples suggests a specific set of proteins associated with the peri-lesional environment, reflecting the biological processes in the tissue surrounding lesions. In contrast, IL samples exhibited a separate clustering pattern, identifying proteins potentially involved in the intra-lesional microenvironment.
2.3. Differential Protein Expression
Analysis of protein expression revealed significant differences among several proteins in IL samples compared to PL samples (Figure 2 and Table 2 and Supplementary Figure S2). CAMP revealed the highest log fold change (logFC = 1.79) and an average expression (AveExp) of 12.82 (adjusted p-value = 5.510−18) (Table 2). Other proteins such as cingulin, (logFC=1.08, AveExp=10.11, adj.p=5.3×10⁻¹²), occludin-1 (logFC=0.99, AveExp = 10.48, adj.p=5.5×10⁻⁷), and filaggrin (logFC=0.96, AveExp=10.46, adj.p=8.9×10⁻¹⁷) also demonstrated marked (~2-fold increase) differences (Table 2).
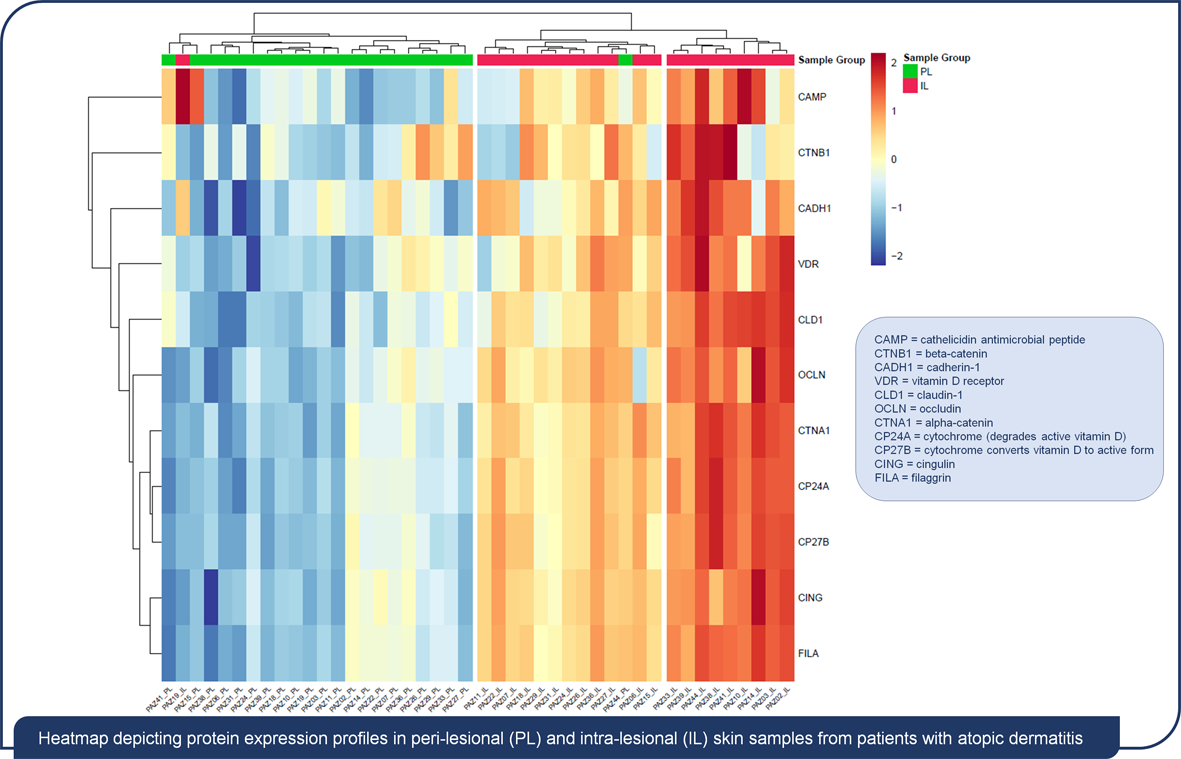
Analysis of protein expression profiles using heatmapping revealed distinct patterns between PL and IL skin samples from individuals with AD (Figure 3). Similarly, the clustering of proteins showed patterns of co-regulation, with some proteins such as CAMP, VDR, and beta-catenin forming groups that are more highly expressed in IL samples, while others cluster together due to their lower expression in IL regions.
2.4. Association Between Clinical Characteristics and Protein Expression from Intra- and Peri-Lesional Areas
Sub analysis of different patient characteristics revealed significant differences in levels of protein expression that were predominantly derived from IL areas (Table 3). Levels of beta-catenin expression were found to be significantly higher in females than in males (p=0.034). Patients with 25(OH)D levels <30 ng/ml showed higher expression of CYP24A (p=0.054), alpha-catenin (p=0.043), and haptoglobin (p=0.033) compared to those with 25(OH)D ≥30 ng/ml. Similarly, patients with serum 25(OH)D <20 ng/ml had significantly elevated haptoglobin expression (p=0.021). In SPT positive patients, VDR (p=0.006), CYP24A (p=0.025), CYP27B (p=0.022), filaggrin (p = 0.027), alpha-catenin (p=0.022), and cingulin (p = 0.052) expression levels were significantly higher compared to SPT negative patients. Furthermore, patients with IgG levels ≥100 IU/mL exhibited increased levels of VDR (p=0.007), occludin-1 (p=0.011), and beta-catenin (p=0.041) expression. EASI scores of ≥16 were also found to be associated with higher expression of CYP24A (p=0.024), CYP27B (p=0.044), filaggrin (p=0.027), occludin-1 (p=0.049), and claudin-1 (p=0.052).
In PL areas, although fewer significant findings emerged (Supplementary Table S3), haptoglobin expression was found to be higher in patients with 25(OH)D <20 ng/ml (p=0.034) and in SPT positive patients (p=0.016). Alpha-catenin expression was also higher in patients with IgG ≥100 IU/mL (p=0.035).
Multivariate regression analysis confirmed several significant associations identified by sub analysis (Table 4). CAMP expression was negatively associated with childhood AD onset (β= -0.26, p=0.0396), while claudin-1 (β= 2.06, p=0.048) and alpha-catenin (β= -4.16, p=0.016) were linked to flexural phenotype. Haptoglobin expression correlated negatively with asthma/rhino-conjunctivitis (β= -0.39, p 0.05), and low 25(OH)D levels (<30 ng/ml) were associated with claudin-1 (β= -2.04, p=0.0077) and occludin-1 (β= 0.43, p=0.002). In skin prick test-positive patients, claudin-1 (β= -1.93, p=0.046), CAMP (β=0.26, p=0.027), and occludin-1 (β= -0.33, p=0.044) expression showed significant associations with the phenotype. In PL areas (Supplementary Table S4), younger age was associated with lower cingulin levels (β= -1.62, p=0.0061), and higher EASI scores correlated with increased alpha-catenin (β=3.99, p=0.026).
3. Discussion
In this cross-sectional exploratory study, we observed significant differences in protein concentration and expression between IL and PL biopsies in patients with AD. Cluster analysis revealed a clear distinct profile in protein expression between IL and PL samples, and the differential expression of proteins involved in epithelial barrier, vitamin D metabolism and immune response pathways was strongly associated with disease severity. Higher levels of protein expression in IL areas correlated with positive SPT, elevated IgE levels, and EASI scores ≥16. Multivariate regression demonstrated a negative correlation between low vitamin D levels and the expression of specific TJs proteins.
TJs are recognized as a key component of the complex epidermal barrier, located in the stratum granulosum (SG), where they regulate the passage of ions and molecules [17,18,19]. claudin-1, occludin-1, and cingulin are among the primary proteins forming these junctions [20]. We observed increased expression of these proteins in IL compared to PL samples. However, evidence from previous studies presents conflicting data regarding their expression.
To date, in literature, some report wide variability in claudin-1 levels in healthy skin [21], others have noted decreased claudin-1 expression in lesional compared to non-lesional and normal skin [22,23,24].
The finding that levels of occludin-1 expression were increased in perilesional skin align with Bergmann et al., who also observed upregulation in lesional skin [23]. In contrast, Gruber et al. [22] did not observe any significant alterations in occludin levels. To our knowledge, differences in cingulin protein expression between IL and PL skin have not been reported previously in AD. Similarly, proteins involved in adherens junctions (cadherin-1, beta-catenin and alpha-catenin) were overexpressed in IL compared to PL in our study, although there are limited reports in the literature. Nelson et al. [25] observed unaltered cadherin-1 expression in a small set of AD lesions. Filaggrin, another key protein involved in maintenance of skin barrier integrity [26], was among the most highly expressed proteins observed in IL compared to PL in our study. These findings are in contrast with several other studies that report reduced filaggrin expression in lesional skin [27,28,29]. These differences between our findings and other studies may be explained by differences in samples that were compared. Our analysis compared IL (lesional skin) and PL (perilesional skin adjacent to the lesion), while other studies frequently compared lesional skin to non-lesional skin, defined as skin distant from the lesion. Perilesional skin, as noted by Knor et al. [30], exhibits distinct characteristics, such as altered pH and hydration, compared to non-lesional skin, potentially explaining the observed differences in protein expression. In addition, cluster analysis in our study also revealed a clear and distinct map between IL and PL samples pointing towards unique differences in the molecular diversity between these two regions.
It could also be hypothesized that the increased expression of skin barrier proteins in IL regions may represent a compensatory response aimed at maintaining barrier integrity amidst the heightened turnover associated with inflammation in AD. Alternatively, this increased level of protein expression may reflect an attempt to repair the damaged barrier, even though ongoing dysfunction likely perpetuates inflammation. Besides, in AD, the chronic inflammation, may be related to an increased level of interleukins (IL)-4, IL-13 and IL-31, which can cause alterations in both the structure and expression of occludin-1, cingulin and claudin-1, with the aim of re-establishing the barrier function, although with limited efficacy [31,32,33]. Furthermore, the overexpression of these proteins in IL areas does not necessarily guarantee functional barrier integrity. Elevated levels may instead represent a compensatory mechanism counteracting the loss of barrier function. It is worth noting that filaggrin deficiency, for example, does not directly affect TJ barrier integrity [21]. Studies in filaggrin knockout mice showed no alterations in TJ morphology, expression, or function, suggesting that underlying inflammation, rather than protein loss, drives TJ dysfunction [34]. This dysfunction leads to SC damage and increased permeability to bacterial and allergenic molecules, creating a vicious cycle of barrier dysfunction and skin inflammation [34].
Taken together, these observations may also have a future therapeutic counterpart, highlighting the importance of restoring the skin barrier through topical (emollients and moisturizers) and systemic treatments, supporting tight junctions and improving skin integrity.
We observed higher expression of VDR and vitamin D metabolism enzymes in IL areas compared to PL. Similarly, Weise et al. [35] reported increased VDR and CYP24A1 expression in the lesional and non-lesional skin of AD patients compared to healthy controls. Moreover, we found higher levels of CAMP in IL areas compared to PL, which aligns with its role in responding to barrier disruption or infection [10]. CAMP expression increases following skin injury and is linked to enhanced CYP27B1 expression and local synthesis of active vitamin D [10]. This increased expression may reflect an amplified immune response aimed at controlling inflammation, although it may also contribute to chronic underlying inflammation in AD. The direct regulation of CAMP by the 1,25(OH)D-VDR complex, as well as vitamin D’s broader role in modulating CAMP synthesis, highlights its involvement in skin defense and supports the overexpression of both VDR and CAMP in IL in our study.
We also identified some specific associations between protein expression AD disease severity. Higher levels of skin barrier and vitamin D metabolism proteins were observed in patients with positive SPT, IgE ≥100 IU/ml, and EASI scores ≥16, indicative of moderate-severe eczema [36]. Supporting this, we found fewer associations between these clinical data and protein levels in PL regions, suggesting that these correlations are absent where disease severity is low grade/absent. In line with our findings, Grieco et al. [16]. previously reported a correlation between TJ protein expression and positive SPT (OR: 8.23, 95% CI 1.04–65.5, p=0.046). Additionally, in children with AD, oral 1,25(OH)2D3 supplementation was associated with improved vitamin D status, AD severity, and increased VDR expression in lesional skin, but not in non-lesional skin [37].
We also observed a negative correlation between low vitamin D levels and the expression of claudin-1 by multivariate regression. In ulcerative colitis, an inflammatory disease characterized by gut barrier dysfunction, claudin-1 protein was found to be upregulated [38]. In patients with ulcerative colitis, treatment with 1,25(OH)2D3 decreased claudin-1 protein levels in both inflamed and non-inflamed tracts [38]. This suggests that increasing vitamin D levels could reduce the expression of TJ proteins, potentially lowering inflammation and the compensatory mechanisms that lead to their increased expression.
3.1. Limitations
There are some limitations of this study that should be noted. The small sample size limits the generalizability of the findings. While we compared IL and PL areas, distant non-lesional skin was not included as a control. The cross-sectional design prevents drawing conclusions about causal links between protein expression and AD severity. Additionally, variability in sample collection and environmental factors such as seasonal changes or treatments were not fully controlled for.
4. Materials and Methods
4.1. Study Design and Patients
This was a monocentric, cross-sectional, exploratory study involving 22 adult patients with acute-phase atopic dermatitis (AD), a subset of the cohort previously enrolled at the Dermatology Clinic of Policlinico Umberto I, Sapienza University of Rome, Italy [16]. Inclusion and exclusion criteria and patient characteristics are described elsewhere [16]. Briefly, this study included males and females aged ≥18 with mild or moderate-severe atopic dermatitis. Exclusion criteria were other inflammatory/autoimmune skin diseases, calcium/bone metabolism issues, recent corticosteroid use, severe diseases, certain infections, organ transplants, dementia, psychosis, substance abuse, pregnancy, anticoagulation, and recent sun exposure. No dietary restrictions were imposed. During the initial screening, data collection included demographic information (gender, age, BMI), medical and pharmacological history, age of AD onset, AD phenotype, disease severity (assessed by EASI [39]), and the presence of comorbid conditions such as asthma or allergic rhinitis. Blood samples were also collected at this stage. Within 10 days of screening visit, patients returned for further evaluation, including skin biopsy for protein expression analysis. This study was conducted in accordance with the Declaration of Helsinki and adhered to Good Clinical Practice (GCP), International Council for Harmonisation guidelines, and applicable national regulations. The study protocol was approved by the Ethics Committee (Identification Code: DERM/AT/01).
4.2. Biopsy Sampling
At the initial visit, all AD patients underwent a single biopsy of the skin lesion (intra-lesional, IL) and of another in the peri-lesional region (PL). After antiseptic preparation using povidone iodine, local anesthesia was administered with 2% mepivacaine. A tissue sample, measuring up to 10×5 mm was excised. The biopsy site was then closed with 1-3 nylon (3.0) sutures, and a medicated bandage was applied. Patients were prescribed antibiotic prophylaxis consisting of 1g amoxicillin combined with clavulanic acid, taken every 12 hours for five days. Sutures were removed between 7- and 15-days post-biopsy.
4.3. Protein Extraction
Protein extraction was performed from 44 skin samples using scioExtract buffer (Sciomics GmbH, 69,151 Neckargemünd, Germany) according to their standard operating procedures. After extraction and quality control of samples, protein concentrations were measured using a standard bicinchoninic acid assay. A reference sample was prepared by pooling equal volumes from each individual sample, and protein concentrations were calculated for each sample group.
4.4. Sample Labelling and Data Analysis
For protein labeling, samples were adjusted to a specific concentration and incubated with scioDye 2 (Sciomics GmbH) for two hours. The reference sample was labeled with scioDye 1 (Sciomics GmbH). Following labeling, the reaction was stopped and the buffer was exchanged for phosphate-buffered saline (PBS). Labeled protein samples were then stored at -20°C until further analysis. Samples were analyzed using a dual-color approach on 44 custom antibody microarrays (Sciomics GmbH) targeting 12 different proteins (Supplementary Table S1), with each antibody represented in four replicates. Arrays were blocked with scioBlock (Sciomics GmbH) using a Hybstation 4800 (Tecan, 5082 Grödig, Austria), and samples were incubated competitively with the reference sample. After a three-hour incubation, slides were washed with 1×PBSTT, rinsed with 0.1× PBS and water, and dried with nitrogen. Data acquisition was performed using a Powerscanner (Tecan, Austria) with consistent laser power and photomultiplier tube settings. Spot segmentation was performed using GenePix Pro 6.0 (Molecular Devices, 94,587 Union City, CA, USA). Raw data were analyzed using the LIMMA package in R-Bioconductor, with median signal intensities.
4.5. Statistical Analysis
Clinical characteristics of patients are presented as number and percent. Protein concentrations in IL and PL samples were compared using paired t-tests to assess differences in means. Hierarchical clustering analysis was employed to identify distinct patterns in protein expression profiles between IL and PL samples. For protein analysis, statistical analysis involved fitting a one-factorial linear model, with results presented as two-sided t-tests or F-tests based on moderated statistics. P-values were adjusted for multiple comparisons using the false discovery rate method by the Benjamini and Hochberg procedure [40]. Proteins were considered differentially expressed if |logFC| >0.5 and the adjusted p-value <0.05. Changes in protein abundance between samples or groups are reported as log-fold changes (logFC), where a logFC of 1 indicates a two-fold increase compared to the control group, and a logFC of -1 indicates a two-fold decrease.
Sub-analysis was performed to evaluate the potential association between demographic factors and vitamin D levels on protein expression assessed by unpaired t-tests for normally distributed variables and chi squared test for categorical variables. Multivariate regression was used to evaluate the association between protein expression and clinical features in AD patients. Results are reported as correlation coefficients and 95% confidence intervals (CI). A p-value of <0.05 was considered statistically significant. Statistical analysis was performed using MedCalc Software (Broekstraat, Mariakerke, Belgium).
5. Conclusions
Our findings suggest the molecular landscape of IL areas in AD patients differs from PL regions, showing higher inflammation and a stronger compensatory response to skin barrier dysfunction. Significant associations between protein expression in IL areas and clinical markers, IgE levels and EASI scores, suggest that these proteins may serve as biomarkers for AD progression. The negative correlation between vitamin D levels and TJ protein expression highlights the complex interplay between vitamin D metabolism and skin barrier integrity in AD. Larger cohorts and longitudinal studies are needed to validate these results.
Supplementary Materials
The following supporting information can be downloaded at: Preprints.org, Supplementary Figure S1: Protein concentration distributions in Intra-Lesional (IL) and Peri-Lesional (PL) biopsy groups (a) and for each patient (b).; Supplementary Figure S2: Box and whisker plots comparing protein expression levels between peri-lesional (PL) and intra-lesional (IL) skin samples in patients with atopic dermatitis; Supplementary Table S1: Summary of proteins involved in pathways related to cell junctions, immune response, and vitamin D metabolism, whose expression was investigated in this study; Supplementary Table S2: Description of skin samples and measured protein concentrations; Supplementary Table S3: Sub-analysis of the correlation between protein expression and clinical features in peri-lesional (PL) areas of patients with atopic dermatitis; Supplementary Table S4: Multivariate regression analysis to assess the relationship between protein expression levels in peri-lesional areas and clinical parameters.
Author Contributions
Conceptualization: E.M., G.P., F.N., S.B., M.A., M.A., E.T., S.T., G.P. S.C., data collection: T.G., E.M., G.P., C.C., A.S., S.T., G.P., S.C., data analysis: E.M., G.P., C.G.E., M.M., S.T., S.B and S.C., writing—original draft preparation—E.M., G.P., C.G.E., M.M., S.T., S.B., S.C., writing—review and editing—all authors. All authors have read and agreed to the published version of the manuscript.
Funding
This work was supported by Abiogen Pharma S.p.A, Pisa, Italy.
Institutional Review Board Statement
This study was conducted according to the guidelines of the Declaration of Helsinki and approved by the head of Unit of the Dermatological Clinic of the Policlinico Umberto I, University of Rome La Sapienza.
Informed Consent Statement
The Study Protocol has received the approval of the Ethics Committee (Identification Code: DERM/AT/01 - Sponsor: Abiogen Pharma SPA - CRO: Ricerche Nuove Srl).
Data Availability Statement
The original contributions presented in this study are included in the article/supplementary material. Further inquiries can be directed to the corresponding author.
Conflicts of Interest
The authors declare no conflicts of interest.
References
- Eichenfield, L.F.; Stripling, S.; Fung, S.; Cha, A.; O’Brien, A.; Schachner, L.A. Recent Developments and Advances in Atopic Dermatitis: A Focus on Epidemiology, Pathophysiology, and Treatment in the Pediatric Setting. Paediatr Drugs 2022, 24, 293–305. [Google Scholar] [CrossRef] [PubMed]
- Bieber, T. Atopic Dermatitis. New England Journal of Medicine 2008, 358, 1483–1494. [Google Scholar] [CrossRef] [PubMed]
- Bylund, S.; Kobyletzki, L.B.; Svalstedt, M.; Svensson, Å. Prevalence and Incidence of Atopic Dermatitis: A Systematic Review. Acta Derm Venereol 2020, 100, adv00160. [Google Scholar] [CrossRef] [PubMed]
- Sakamoto, H.; Nishikawa, M.; Yamada, S. Development of Tight Junction-Strengthening Compounds Using a High-Throughput Screening System to Evaluate Cell Surface-Localized Claudin-1 in Keratinocytes. Sci Rep 2024, 14, 3312. [Google Scholar] [CrossRef] [PubMed]
- Takahashi, S.; Ishida, A.; Kubo, A.; Kawasaki, H.; Ochiai, S.; Nakayama, M.; Koseki, H.; Amagai, M.; Okada, T. Homeostatic Pruning and Activity of Epidermal Nerves Are Dysregulated in Barrier-Impaired Skin during Chronic Itch Development. Sci Rep 2019, 9, 8625. [Google Scholar] [CrossRef]
- Bouillon, R.; Manousaki, D.; Rosen, C.; Trajanoska, K.; Rivadeneira, F.; Richards, J.B. The Health Effects of Vitamin D Supplementation: Evidence from Human Studies. Nat Rev Endocrinol 2022, 18, 96–110. [Google Scholar] [CrossRef]
- Giannini, S.; Giusti, A.; Minisola, S.; Napoli, N.; Passeri, G.; Rossini, M.; Sinigaglia, L. The Immunologic Profile of Vitamin D and Its Role in Different Immune-Mediated Diseases: An Expert Opinion. Nutrients 2022, 14, 473. [Google Scholar] [CrossRef]
- Charoenngam, N. Vitamin D and Rheumatic Diseases: A Review of Clinical Evidence. Int J Mol Sci 2021, 22, 10659. [Google Scholar] [CrossRef]
- Kongsbak, M.; Levring, T.; Geisler, C.; von Essen, M. The Vitamin D Receptor and T Cell Function. Frontiers in Immunology 2013, 4. [Google Scholar] [CrossRef]
- Umar, M.; Sastry, K.S.; Al Ali, F.; Al-Khulaifi, M.; Wang, E.; Chouchane, A.I. Vitamin D and the Pathophysiology of Inflammatory Skin Diseases. Skin Pharmacol Physiol 2018, 31, 74–86. [Google Scholar] [CrossRef]
- Schauber, J.; Dorschner, R.A.; Coda, A.B.; Büchau, A.S.; Liu, P.T.; Kiken, D.; Helfrich, Y.R.; Kang, S.; Elalieh, H.Z.; Steinmeyer, A.; et al. Injury Enhances TLR2 Function and Antimicrobial Peptide Expression through a Vitamin D-Dependent Mechanism. J Clin Invest 2007, 117, 803–811. [Google Scholar] [CrossRef] [PubMed]
- Mikhaylov, D.; Del Duca, E.; Guttman-Yassky, E. Proteomic Signatures of Inflammatory Skin Diseases: A Focus on Atopic Dermatitis. Expert Rev Proteomics 2021, 18, 345–361. [Google Scholar] [CrossRef] [PubMed]
- Mitamura, Y.; Reiger, M.; Kim, J.; Xiao, Y.; Zhakparov, D.; Tan, G.; Rückert, B.; Rinaldi, A.O.; Baerenfaller, K.; Akdis, M.; et al. Spatial Transcriptomics Combined with Single-Cell RNA-Sequencing Unravels the Complex Inflammatory Cell Network in Atopic Dermatitis. Allergy 2023, 78, 2215–2231. [Google Scholar] [CrossRef]
- Zolotas, M.; Schleusener, J.; Lademann, J.; Meinke, M.C.; Kokolakis, G.; Darvin, M.E. Atopic Dermatitis: Molecular Alterations between Lesional and Non-Lesional Skin Determined Noninvasively by In Vivo Confocal Raman Microspectroscopy. Int J Mol Sci 2023, 24, 14636. [Google Scholar] [CrossRef] [PubMed]
- Pavel, A.B.; Zhou, L.; Diaz, A.; Ungar, B.; Dan, J.; He, H.; Estrada, Y.D.; Xu, H.; Fernandes, M.; Renert-Yuval, Y.; et al. The Proteomic Skin Profile of Moderate-to-Severe Atopic Dermatitis Patients Shows an Inflammatory Signature. J Am Acad Dermatol 2020, 82, 690–699. [Google Scholar] [CrossRef]
- Grieco, T.; Moliterni, E.; Paolino, G.; Chello, C.; Sernicola, A.; Egan, C.G.; Nannipieri, F.; Battaglia, S.; Accoto, M.; Tirotta, E.; et al. Association between Vitamin D Receptor Polymorphisms, Tight Junction Proteins and Clinical Features of Adult Patients with Atopic Dermatitis. Dermatol Pract Concept 2024, 14, e2024214. [Google Scholar] [CrossRef]
- Ishida-Yamamoto, A.; Kishibe, M.; Murakami, M.; Honma, M.; Takahashi, H.; Iizuka, H. Lamellar Granule Secretion Starts before the Establishment of Tight Junction Barrier for Paracellular Tracers in Mammalian Epidermis. PLoS One 2012, 7, e31641. [Google Scholar] [CrossRef]
- Kirschner, N.; Houdek, P.; Fromm, M.; Moll, I.; Brandner, J.M. Tight Junctions Form a Barrier in Human Epidermis. Eur J Cell Biol 2010, 89, 839–842. [Google Scholar] [CrossRef]
- Yoshida, K.; Yokouchi, M.; Nagao, K.; Ishii, K.; Amagai, M.; Kubo, A. Functional Tight Junction Barrier Localizes in the Second Layer of the Stratum Granulosum of Human Epidermis. J Dermatol Sci 2013, 71, 89–99. [Google Scholar] [CrossRef]
- Benedetto, A.D.; Rafaels, N.M.; McGirt, L.Y.; Ivanov, A.I.; Georas, S.N.; Cheadle, C.; Berger, A.E.; Zhang, K.; Vidyasagar, S.; Yoshida, T.; et al. Tight Junction Defects in Patients with Atopic Dermatitis. Journal of Allergy and Clinical Immunology 2011, 127, 773–786.e7. [Google Scholar] [CrossRef]
- Katsarou, S.; Makris, M.; Vakirlis, E.; Gregoriou, S. The Role of Tight Junctions in Atopic Dermatitis: A Systematic Review. J Clin Med 2023, 12, 1538. [Google Scholar] [CrossRef] [PubMed]
- Gruber, R.; Börnchen, C.; Rose, K.; Daubmann, A.; Volksdorf, T.; Wladykowski, E.; Vidal-y-Sy, S.; Peters, E.M.; Danso, M.; Bouwstra, J.A.; et al. Diverse Regulation of Claudin-1 and Claudin-4 in Atopic Dermatitis. The American Journal of Pathology 2015, 185, 2777–2789. [Google Scholar] [CrossRef] [PubMed]
- Bergmann, S.; von Buenau, B.; Vidal-y-Sy, S.; Haftek, M.; Wladykowski, E.; Houdek, P.; Lezius, S.; Duplan, H.; Bäsler, K.; Dähnhardt-Pfeiffer, S.; et al. Claudin-1 Decrease Impacts Epidermal Barrier Function in Atopic Dermatitis Lesions Dose-Dependently. Sci Rep 2020, 10, 2024. [Google Scholar] [CrossRef] [PubMed]
- Yuki, T.; Tobiishi, M.; Kusaka-Kikushima, A.; Ota, Y.; Tokura, Y. Impaired Tight Junctions in Atopic Dermatitis Skin and in a Skin-Equivalent Model Treated with Interleukin-17. PLoS One 2016, 11, e0161759. [Google Scholar] [CrossRef]
- Nelson, W.J. Regulation of Cell–Cell Adhesion by the Cadherin–Catenin Complex. Biochem Soc Trans 2008, 36, 149–155. [Google Scholar] [CrossRef]
- Drislane, C.; Irvine, A.D. The Role of Filaggrin in Atopic Dermatitis and Allergic Disease. Annals of Allergy, Asthma & Immunology 2020, 124, 36–43. [Google Scholar] [CrossRef]
- Myers, J.M.B.; Sherenian, M.G.; kyzy, A.B.; Alarcon, R.; An, A.; Flege, Z.; Morgan, D.; Gonzalez, T.; Stevens, M.L.; He, H.; et al. Events in Normal Skin Promote Early-Life Atopic Dermatitis - the MPAACH Cohort. J Allergy Clin Immunol Pract 2020, 8, 2285–2293.e6. [Google Scholar] [CrossRef]
- Broccardo, C.J.; Mahaffey, S.; Schwarz, J.; Wruck, L.; David, G.; Schlievert, P.M.; Reisdorph, N.A.; Leung, D.Y.M. Comparative Proteomic Profiling of Patients with Atopic Dermatitis Based on History of Eczema Herpeticum Infection and Staphylococcus Aureus Colonization. J Allergy Clin Immunol 2011, 127, 186–193, 193.e1-11. [Google Scholar] [CrossRef]
- J, S.; K, K.; H, Y.; S, I.; T, S.; M, A.; K, T.; T, F.; M, S.; T, Y.; et al. Proteome Analysis of Stratum Corneum from Atopic Dermatitis Patients by Hybrid Quadrupole-Orbitrap Mass Spectrometer. The Journal of allergy and clinical immunology 2014, 134. [Google Scholar] [CrossRef]
- T, K.; A, M.-F.; A, M. Stratum Corneum Hydration and Skin Surface pH in Patients with Atopic Dermatitis. Acta dermatovenerologica Croatica : ADC 2011, 19. [Google Scholar]
- Guttman-Yassky, E.; Nograles, K.E.; Krueger, J.G. Contrasting Pathogenesis of Atopic Dermatitis and Psoriasis--Part II: Immune Cell Subsets and Therapeutic Concepts. J Allergy Clin Immunol 2011, 127, 1420–1432. [Google Scholar] [CrossRef]
- Hammad, H.; Lambrecht, B.N. Barrier Epithelial Cells and the Control of Type 2 Immunity. Immunity 2015, 43, 29–40. [Google Scholar] [CrossRef] [PubMed]
- Tsoi, L.C.; Rodriguez, E.; Degenhardt, F.; Baurecht, H.; Wehkamp, U.; Volks, N.; Szymczak, S.; Swindell, W.R.; Sarkar, M.K.; Raja, K.; et al. Atopic Dermatitis Is an IL-13-Dominant Disease with Greater Molecular Heterogeneity Compared to Psoriasis. J Invest Dermatol 2019, 139, 1480–1489. [Google Scholar] [CrossRef] [PubMed]
- Yokouchi, M.; Kubo, A.; Kawasaki, H.; Yoshida, K.; Ishii, K.; Furuse, M.; Amagai, M. Epidermal Tight Junction Barrier Function Is Altered by Skin Inflammation, but Not by Filaggrin-Deficient Stratum Corneum. J Dermatol Sci 2015, 77, 28–36. [Google Scholar] [CrossRef] [PubMed]
- Weise Christin ; Worm Margitta and Rühl Ralph Increased Vitamin D Signalling Markers in the Skin of Atopic Dermatitis Patients. JOJDC 2020, 3. [CrossRef]
- Charman, C.R.; Venn, A.J.; Ravenscroft, J.C.; Williams, H.C. Translating Patient-Oriented Eczema Measure (POEM) Scores into Clinical Practice by Suggesting Severity Strata Derived Using Anchor-Based Methods. Br J Dermatol 2013, 169, 1326–1332. [Google Scholar] [CrossRef]
- Cabalín, C.; Pérez-Mateluna, G.; Iturriaga, C.; Camargo, C.A.; Borzutzky, A. Oral Vitamin D Modulates the Epidermal Expression of the Vitamin D Receptor and Cathelicidin in Children with Atopic Dermatitis. Arch Dermatol Res 2023, 315, 761–770. [Google Scholar] [CrossRef]
- Stio, M.; Retico, L.; V, A.; Ag, B. Vitamin D Regulates the Tight-Junction Protein Expression in Active Ulcerative Colitis. Scandinavian journal of gastroenterology 2016, 51. [Google Scholar] [CrossRef]
- Hanifin, J.M.; Thurston, M.; Omoto, M.; Cherill, R.; Tofte, S.J.; Graeber, M. The Eczema Area and Severity Index (EASI): Assessment of Reliability in Atopic Dermatitis. EASI Evaluator Group. Exp Dermatol 2001, 10, 11–18. [Google Scholar] [CrossRef]
- Benjamini, Y.; Hochberg, Y. Controlling the False Discovery Rate: A Practical and Powerful Approach to Multiple Testing. Journal of the Royal Statistical Society: Series B (Methodological) 1995, 57, 289–300. [Google Scholar] [CrossRef]
Figure 1.
Hierarchical clustering of protein expression profiles from Peri-Lesional (PL) and Intra-Lesional (IL) biopsy samples using the complete protein data set. The dendrogram illustrates the clustering of all proteins extracted from PL and IL samples. The x-axis represents individual samples, while the y-axis indicates the distance measure used for clustering.
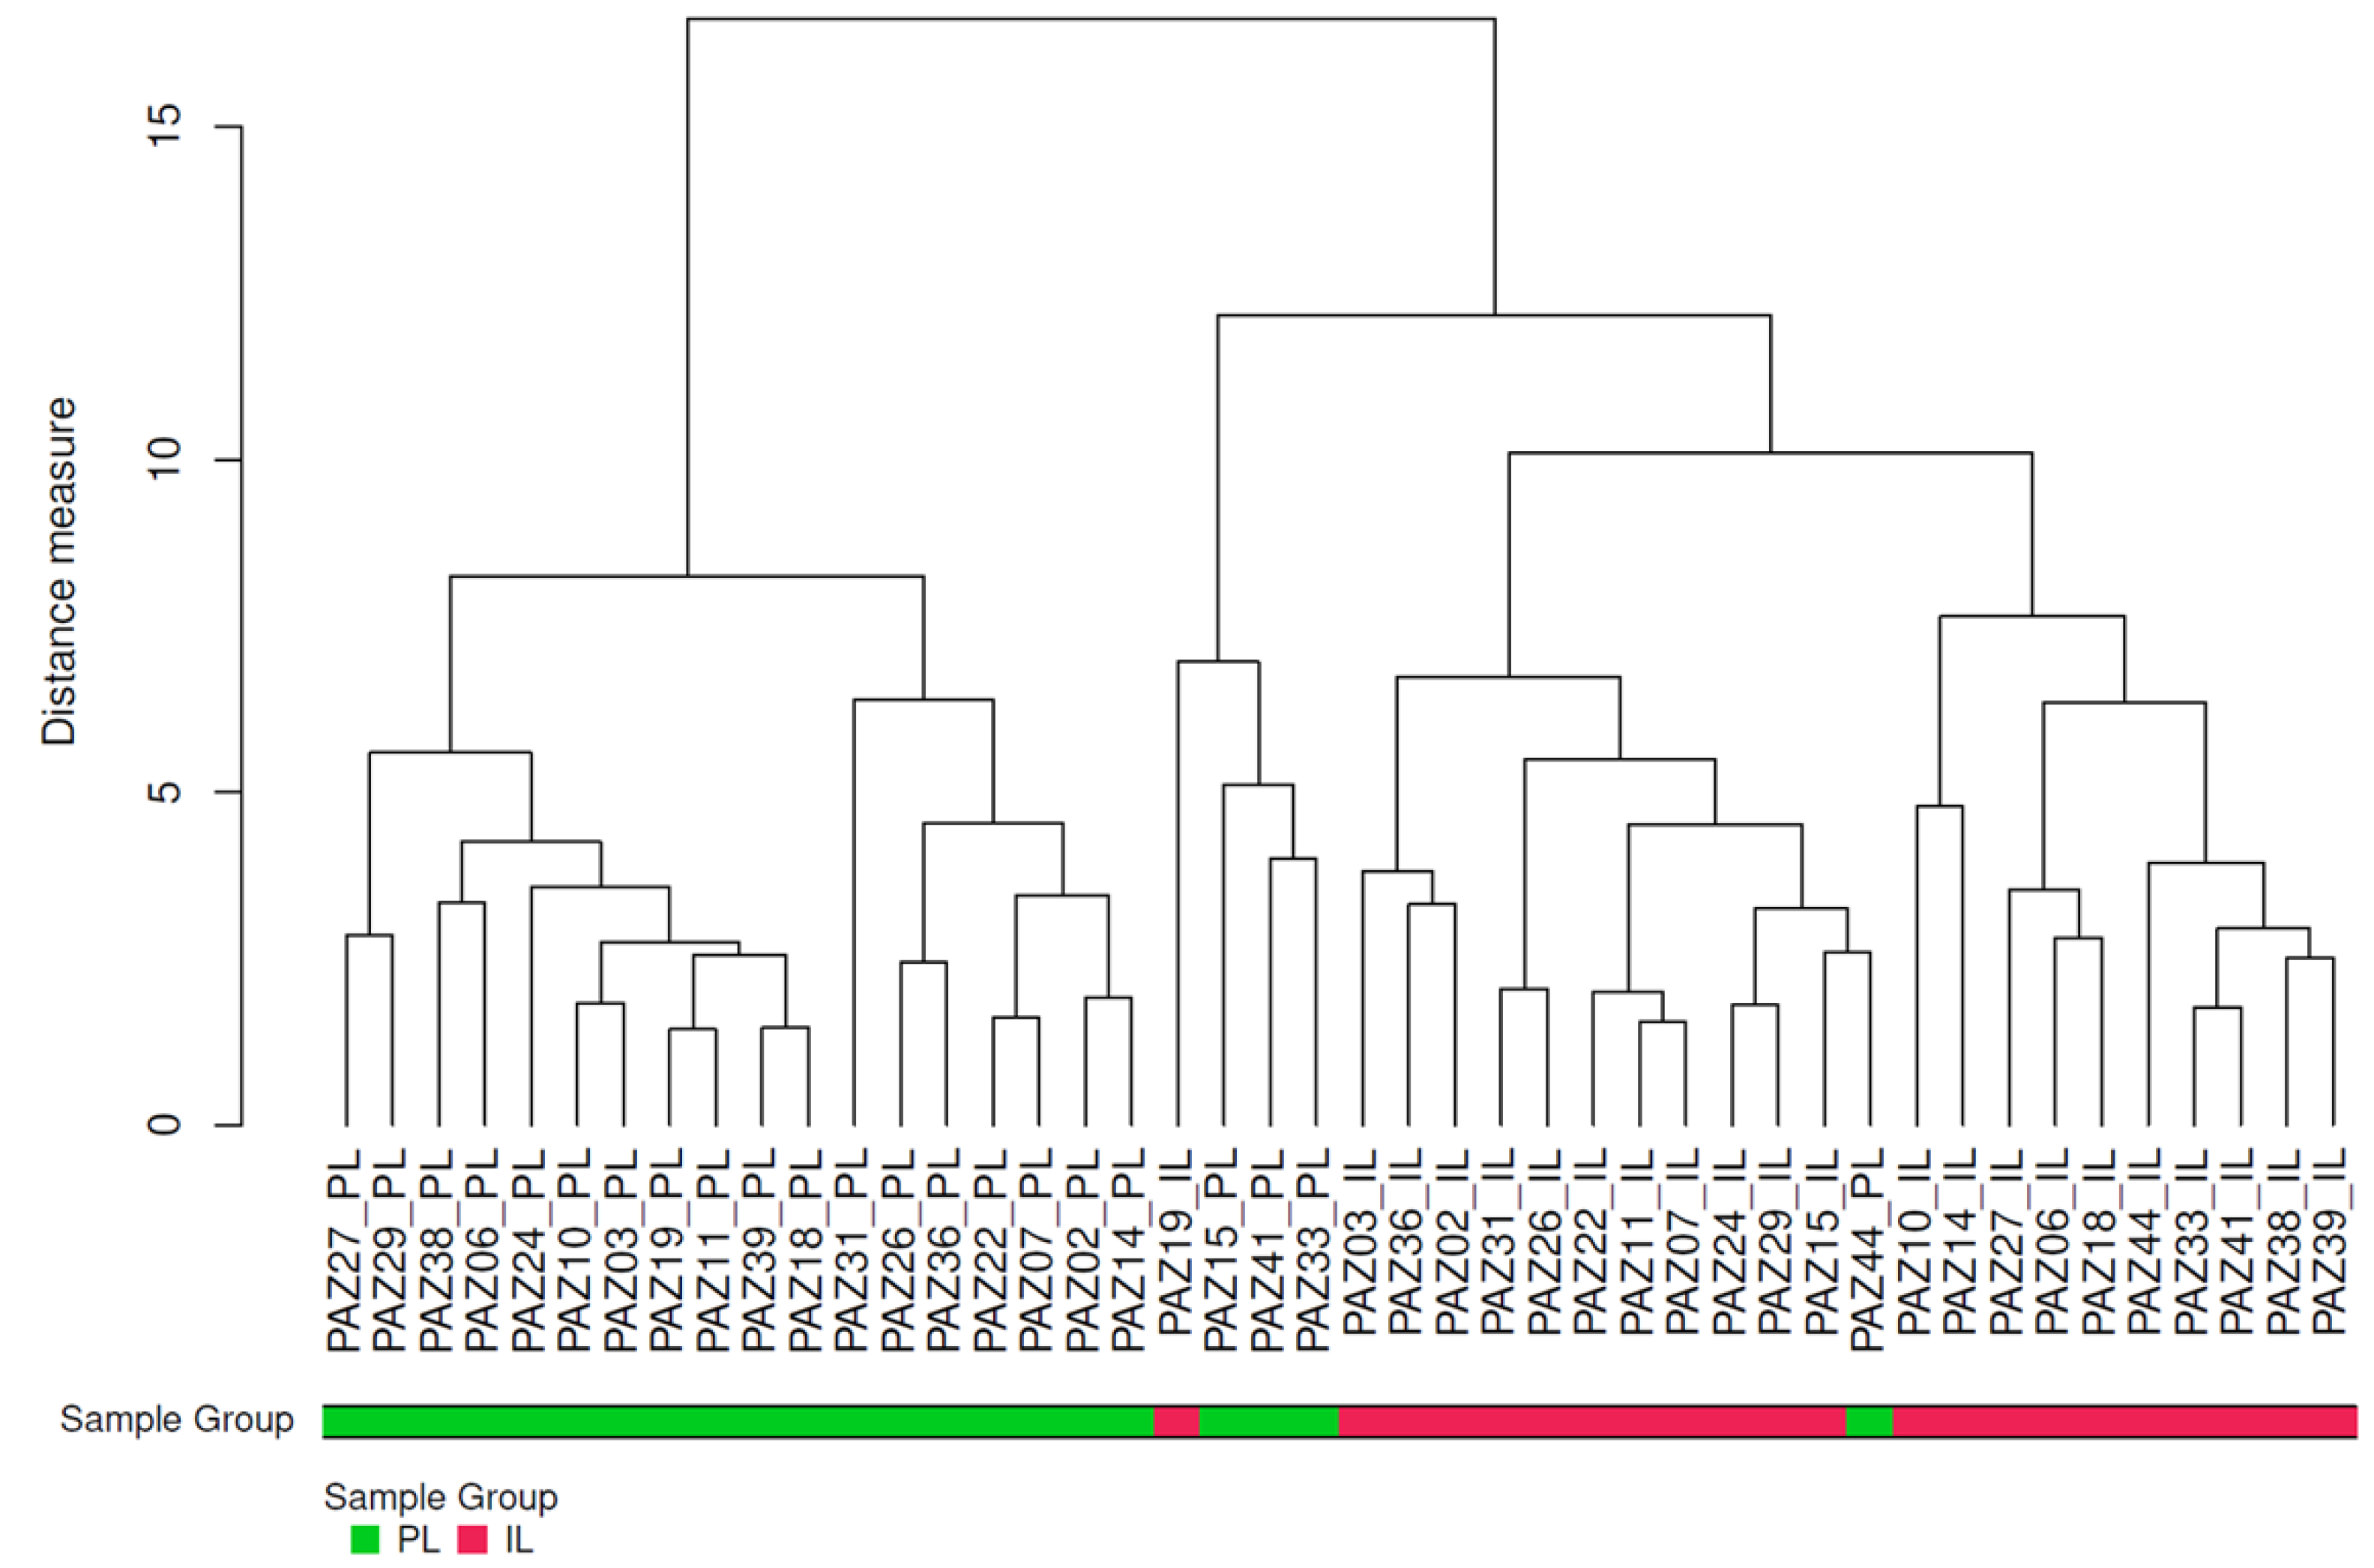
Figure 2.
Distribution pattern of protein expression in IL and PL samples from AD patients. Volcano plot presents the adjusted p-values and corresponding log-fold changes (logFC). The significance level of adjusted p-value = 0.05 is indicated by a horizontal red line. Vertical lines denote the logFC cutoffs. Proteins with a positive logFC are more abundant in IL samples, whereas those with a negative logFC are more abundant in PL samples. Proteins with |logFC| > 0.5 and a significant adj. p-value are considered differential and are displayed with blue names. Proteins with |logFC| > 0 but not reaching the significance threshold are indicated with green names. PL, Peri-Lesional; IL, Intra-Lesional. CAMP = cathelicidin; CADH1 = Cadherin-1; CING = cingulin; CLD1 = claudin-1; CTNA1 = alpha-catenin; CTNB1 = beta-catenin; CYP24A1 = Cytochrome P450 family 24 subfamily A member 1; CYP27B1 = cytochrome P450 family 27 subfamily B member 1; FILA = filaggrin; HPT = haptoglobin; OCLN = occluding; VDR = vitamin D receptor.
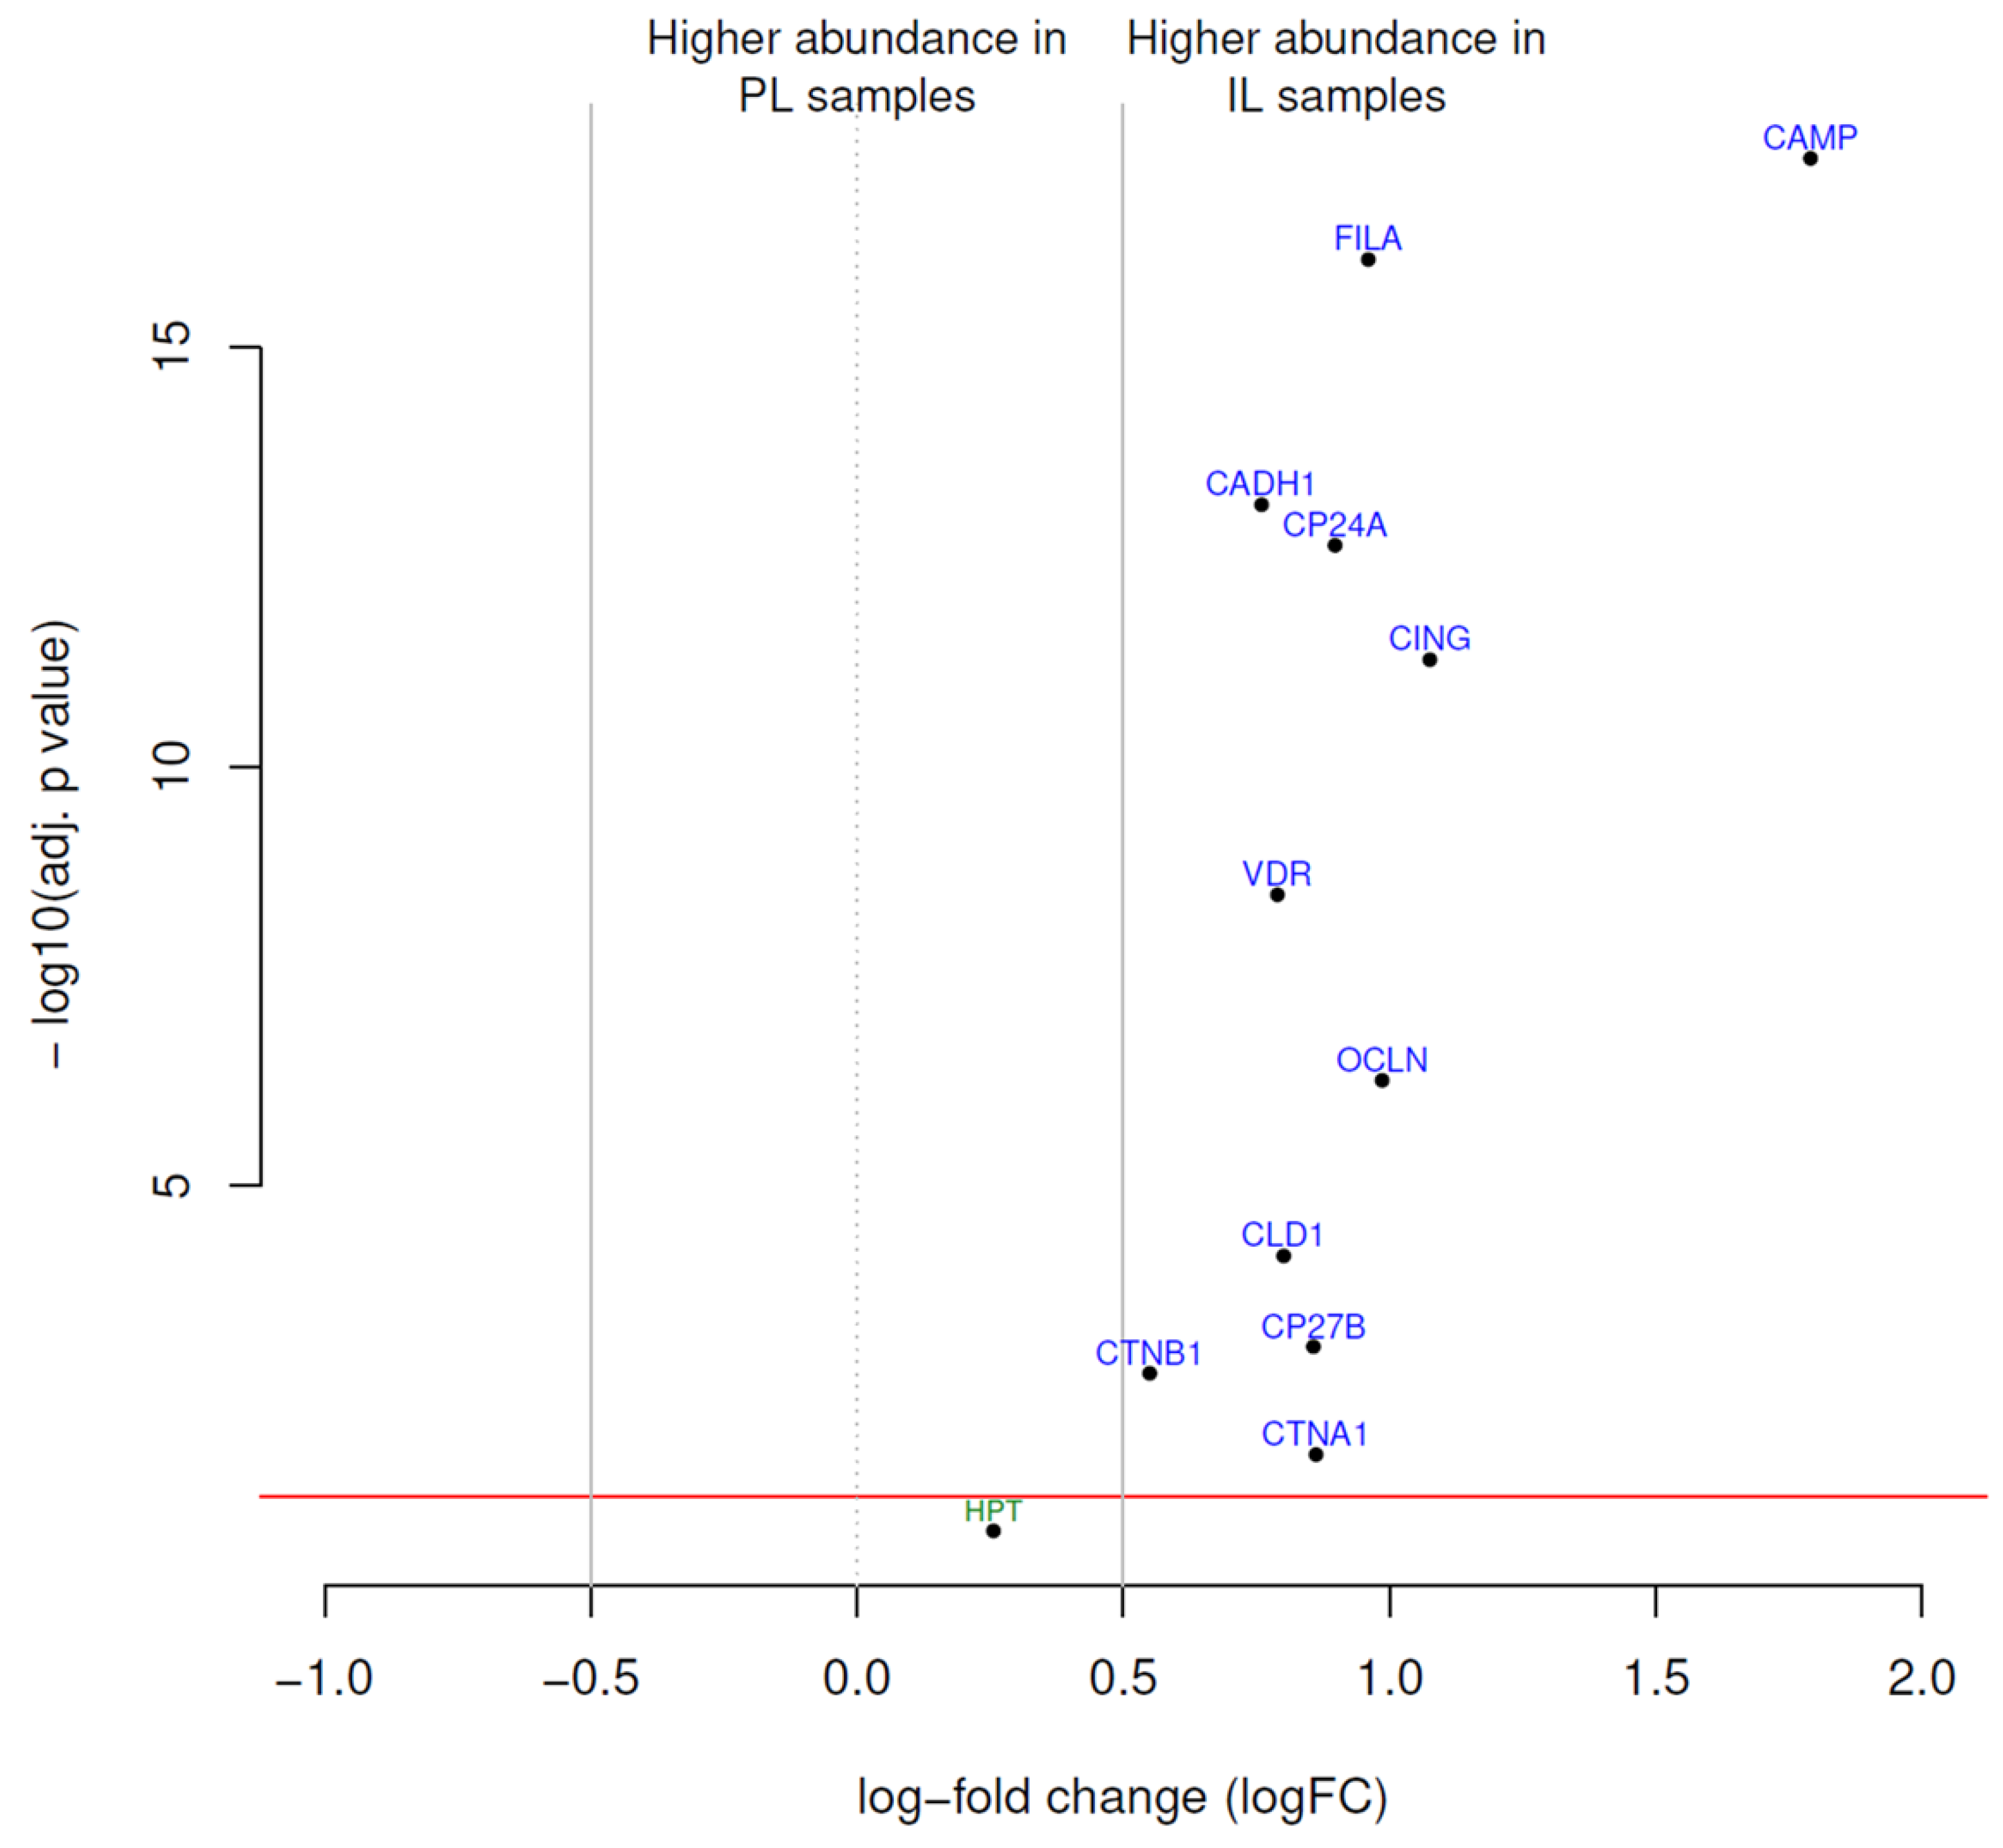
Figure 3.
Heatmap depicting protein expression profiles in peri-lesional (PL) and intra-lesional (IL) skin samples from patients with atopic dermatitis. The heatmap displays the log fold change (logFC) of protein expression levels, with red hues indicating higher expression and blue hues indicating lower expression. CAMP = cathelicidin; CADH1 = Cadherin-1; CING = cingulin; CLD1 = claudin-1; CTNA1 = alpha-catenin; CTNB1 = beta-catenin; CYP24A1 = Cytochrome P450 family 24 subfamily A member 1; CYP27B1 = cytochrome P450 family 27 subfamily B member 1; FILA = filaggrin; OCLN = occluding; VDR = vitamin D receptor.
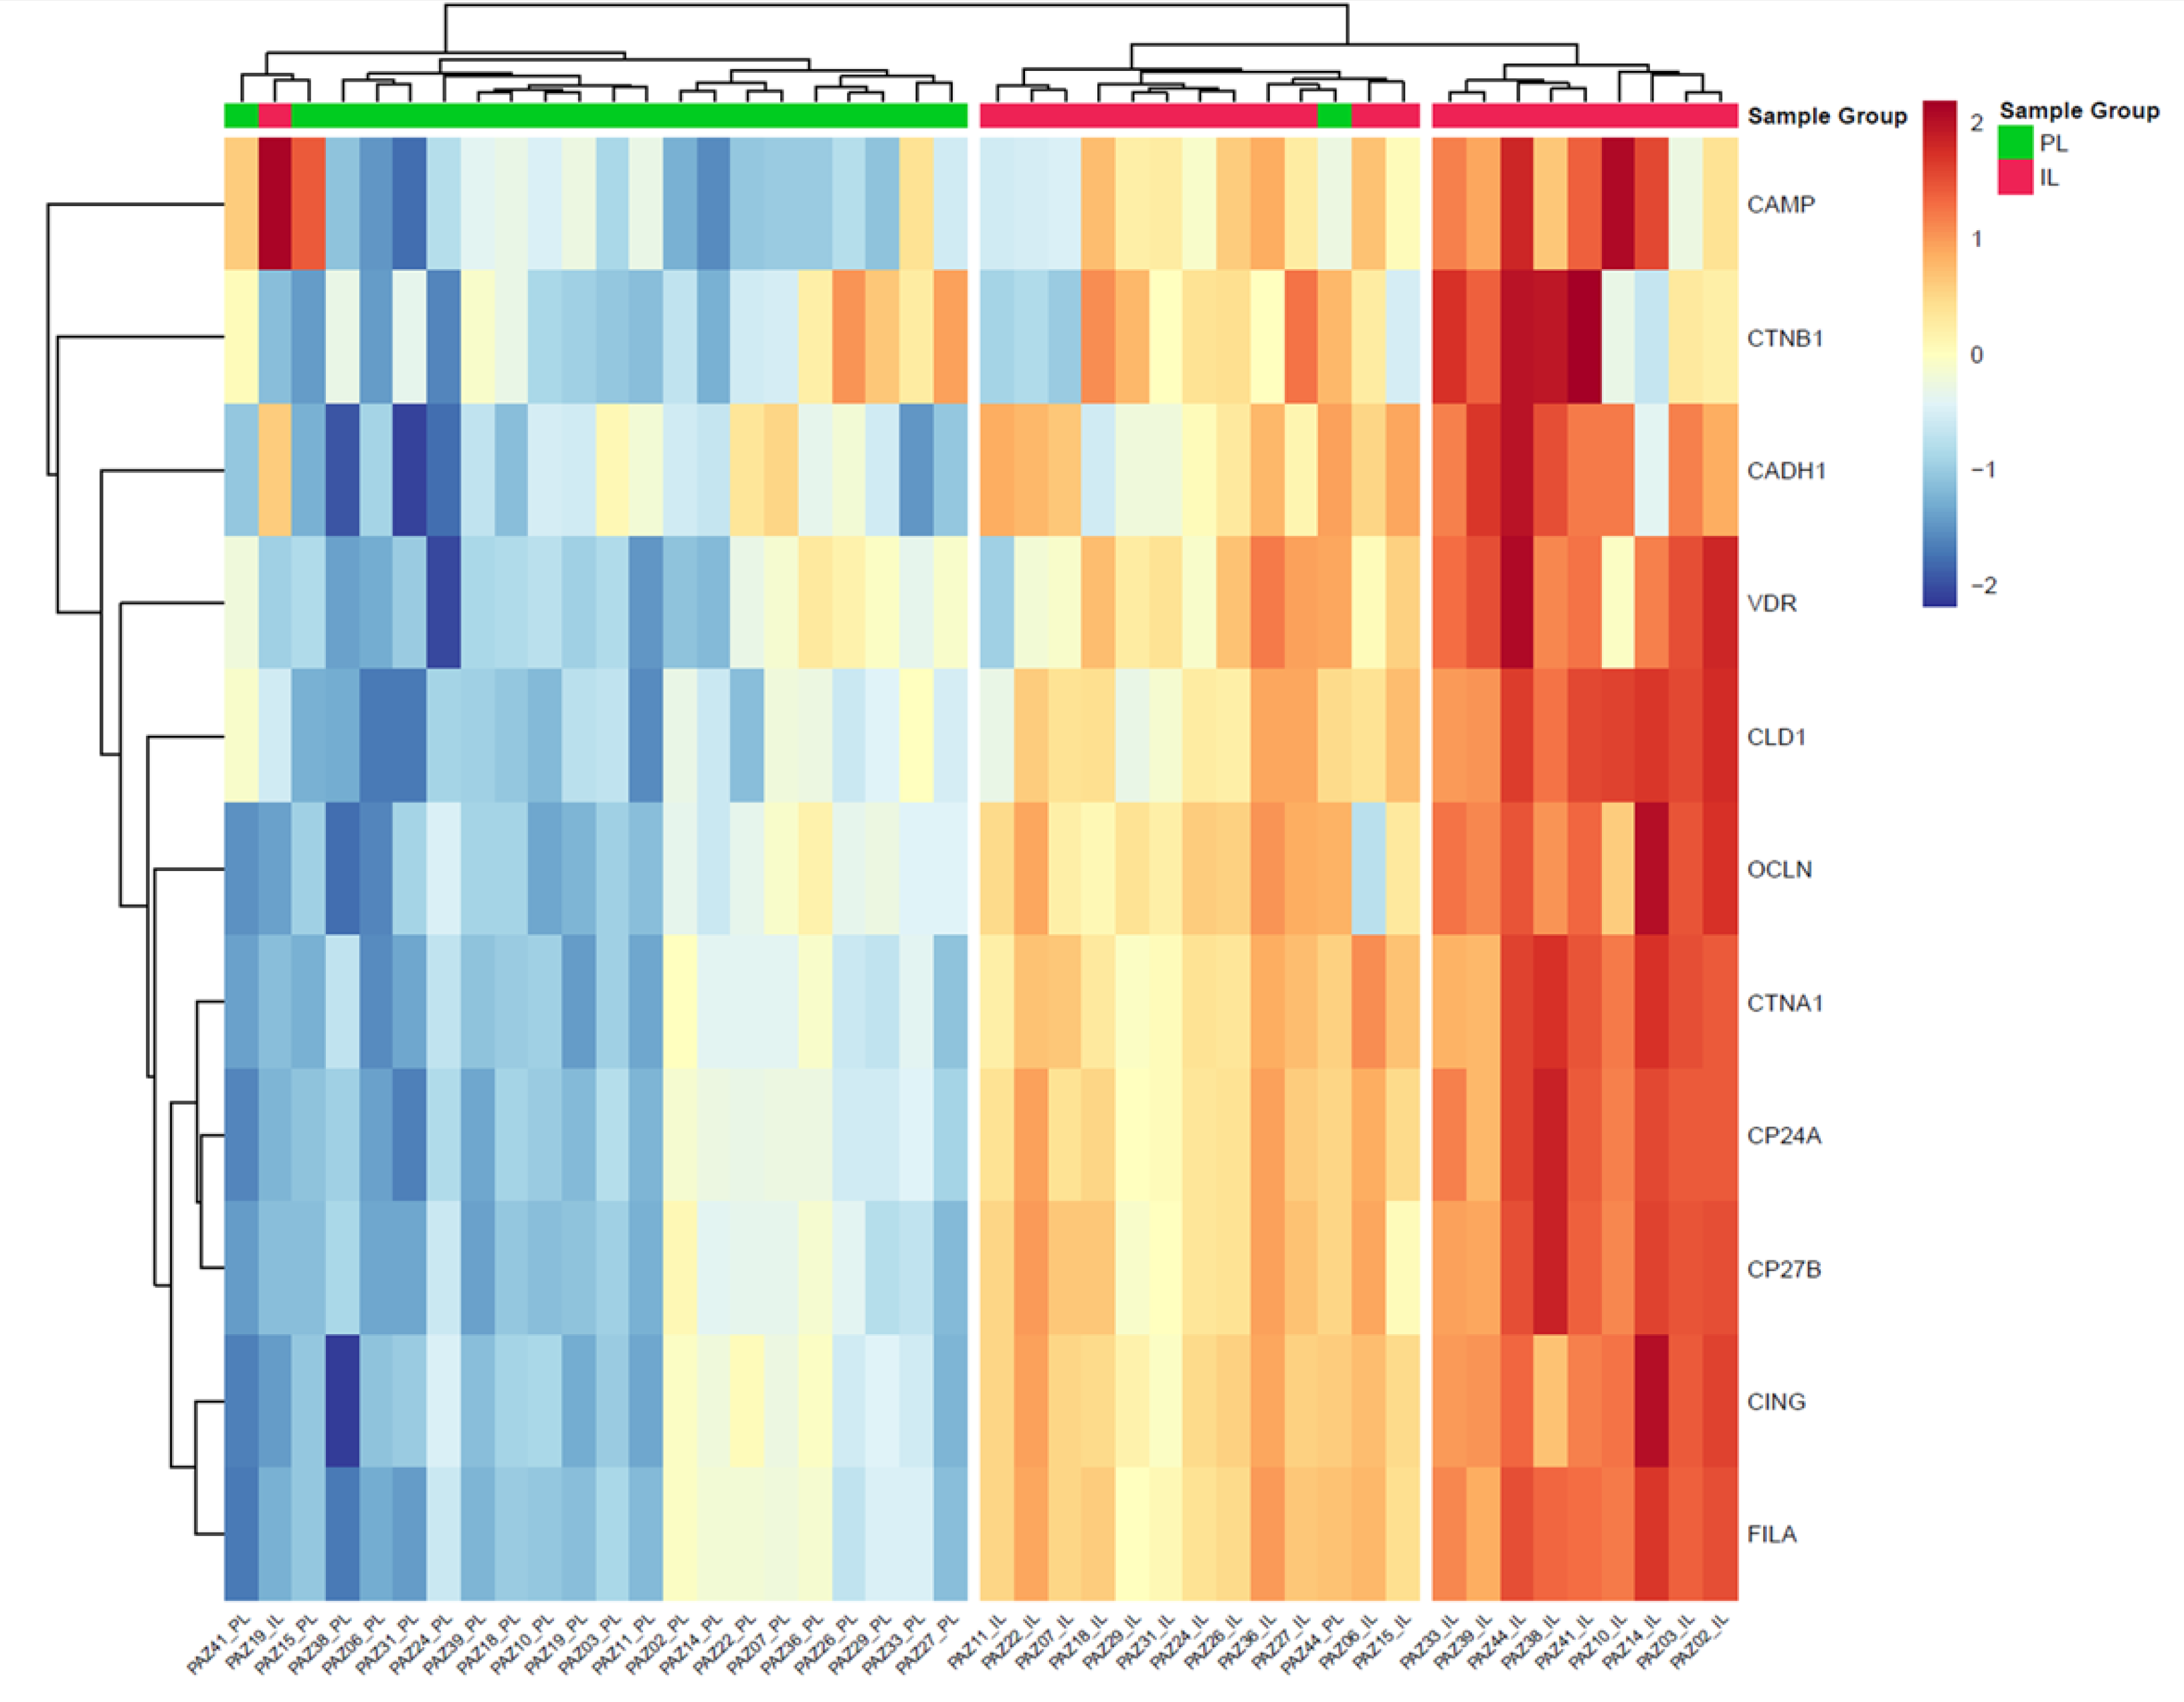

Table 1.
Clinical characteristics of AD patients (N=22).
| Characteristic | N (%) |
|---|---|
| Gender, n (%) | |
| Male | 13 (59.1) |
| Female | 9 (40.9) |
| Age | |
| <60 years | 19 (86.4) |
| ≥60 years | 3 (13.6) |
| EASI score | |
| Mild (EASI <16) | 5 (22.7) |
| Moderate-to-severe (EASI ≥16 or <16 with face/hand involvement) |
17 (77.3) |
| Phenotype (localisation), n (%) | |
| Generalised | 8 (36.4) |
| Head/neck | 7 (31.8) |
| Flexural sites | 6 (27.3) |
| Hands | 1 (4.5) |
| Age of disease onset, n (%) | |
| Childhood | 13 (59.1) |
| Adulthood | 9 (40.9) |
| Asthma, n (%) | |
| Present | 20 (90.9) |
| Absent | 2 (9.1%) |
| Rhino conjunctivitis, n (%) | |
| Present | 15 (68.2) |
| Absent | 7 (31.8) |
| Skin prick test, n (%) | |
| Present | 12 (54.5) |
| Absent | 10 (45.5) |
| Total IgE (IU/ml), n (%) | |
| ≥100 IU/ml | 12 (54.5) |
| <100 IU/ml | 10 (45.5) |
| 25(OH)D vitamin D | |
| ≥30 ng/ml | 6 (27.3) |
| <30 ng/ml | 16 (72.7) |
EASI = Eczema Area and Severity Index. Data presented as number and %.
Table 2.
Proteins with differential abundance in IL samples and PL samples. Proteins with a positive logFC value had a higher abundance in IL samples, proteins with a negative value in PL samples.
Table 2.
Proteins with differential abundance in IL samples and PL samples. Proteins with a positive logFC value had a higher abundance in IL samples, proteins with a negative value in PL samples.
| Protein | Antibody ID | Uniprot Entry* | HGNC | logFC | AveExp | p-adjusted |
|---|---|---|---|---|---|---|
| CAMP | ab1184 | P49913 | CAMP | 1.79 | 12.82 | 5.50×10⁻¹⁸ |
| CING | ab1193 | Q9P2M7 | CGN | 1.08 | 10.11 | 5.30×10⁻¹² |
| OCLN | ab1169 | Q16625 | OCLN | 0.99 | 10.48 | 5.50×10⁻⁷ |
| FILA | ab1199 | P20930 | FLG | 0.96 | 10.46 | 8.90×10⁻¹⁷ |
| CP24A | ab1156 | Q07973 | CYP24A1 | 0.9 | 10.82 | 2.30×10⁻¹³ |
| CTNA1 | ab1187 | P35221 | CTNNA1 | 0.86 | 10.66 | 0.016 |
| CP27B | ab1185 | O15528 | CYP27B1 | 0.86 | 10.7 | 8.30×10⁻⁴ |
| CLD1 | ab1158 | O95832 | CLDN1 | 0.8 | 10.35 | 6.90×10⁻⁵ |
| VDR | ab1080 | P11473 | VDR | 0.79 | 11.12 | 3.40×10⁻⁹ |
| CADH1 | ab1182 | P12830 | CDH1 | 0.76 | 14.71 | 7.50×10⁻¹⁴ |
| CTNB1 | ab1183 | P35222 | CTNNB1 | 0.55 | 13.24 | 0.0017 |
| HPT | ab1194 | P00738 | HP | 0.26 | 14.77 | 0.13 |
Change in protein abundance between samples or groups are reported as log-fold changes (logFC), where a logFC of 1 indicates a two-fold increase compared to the control group, and a logFC of -1 indicates a two-fold decrease. FC, Fold change; HGNC, HUGO Gene Nomenclature Committee; IL = intra lesional and PL = peri lesional biopsies. AveExp, Average Expression. CAMP = cathelicidin; CADH1 = Cadherin-1; CING = cingulin; CLD1 = claudin-1; CTNA1 = alpha-catenin; CTNB1 = beta-catenin; CYP24A1 = Cytochrome P450 family 24 subfamily A member 1; CYP27B1 = cytochrome P450 family 27 subfamily B member 1; FILA = filaggrin; HPT = haptoglobin; OCLN = occluding; VDR = vitamin D receptor. *https://www.uniprot.org/uniprotkb?query=*.
Table 3.
Sub-analysis of protein expression and clinical features in intra-lesional areas of patients with atopic dermatitis.
Table 3.
Sub-analysis of protein expression and clinical features in intra-lesional areas of patients with atopic dermatitis.
| Vitamin D metabolism | Epithelial barrier | Immune response and inflammation | ||||||||||||
| n | VDR | CYP24A | CPY27B | FILA | CLD1 | OCLN | CADH1 | CTNB1 | CTNA1 | CING | HPT | CAMP | ||
| Gender | male | 13 | 0.5(0.5) | 0.8(0.4) | 0.9(0.4) | 0.8(0.5) | 0.7(0.4) | 0.6(0.7) | 0.7(0.3) | 0.4(0.6) | 0.9(0.4) | 0.9(0.6) | 0.4(0.9) | 0.9(1.2) |
| female | 9 | 0.5(0.6) | 0.8(0.4) | 0.9(0.4) | 0.8(0.3) | 0.7(0.4) | 0.8(0.3) | 0.9(0.5) | 1(0.7) | 0.9(0.4) | 0.9(0.3) | 0.9(0.9) | 1.2(1.2) | |
| p-value | 0.343 | 0.366 | 0.392 | 0.414 | 0.477 | 0.275 | 0.100 | 0.034 | 0.469 | 0.454 | 0.082 | 0.278 | ||
| Localizzation | not flexural | 16 | 0.5(0.5) | 0.9(0.3) | 0.9(0.3) | 0.8(0.3) | 0.7(0.4) | 0.7(0.5) | 0.8(0.4) | 0.7(0.8) | 1(0.3) | 0.9(0.4) | 0.8(0.8) | 1.1(1.1) |
| flexural | 6 | 0.5(0.6) | 0.7(0.6) | 0.8(0.5) | 0.7(0.6) | 0.7(0.5) | 0.6(0.8) | 0.7(0.3) | 0.4(0.6) | 0.8(0.5) | 0.8(0.8) | 0.2(1.1) | 0.8(1.3) | |
| p-value | 0.431 | 0.215 | 0.287 | 0.233 | 0.363 | 0.289 | 0.262 | 0.156 | 0.147 | 0.264 | 0.087 | 0.342 | ||
| 25(OH)D levels | ≥30 ng/ml | 6 | 0.4(0.6) | 0.6(0.5) | 0.7(0.5) | 0.6(0.6) | 0.6(0.5) | 0.4(0.7) | 0.6(0.4) | 0.4(0.5) | 0.7(0.5) | 0.6(0.8) | 0(1.3) | 1.6(1.2) |
| < 30 ng/ml | 16 | 0.5(0.5) | 0.9(0.3) | 0.9(0.3) | 0.9(0.3) | 0.8(0.3) | 0.8(0.5) | 0.9(0.4) | 0.7(0.8) | 1(0.3) | 1(0.3) | 0.8(0.7) | 0.8(1.1) | |
| p-value | 0.241 | 0.054 | 0.065 | 0.072 | 0.215 | 0.068 | 0.101 | 0.178 | 0.043 | 0.075 | 0.033 | 0.078 | ||
| ≥20 ng/ml | 16 | 0.5(0.6) | 0.8(0.4) | 0.8(0.4) | 0.8(0.5) | 0.7(0.4) | 0.7(0.6) | 0.8(0.4) | 0.5(0.7) | 0.9(0.4) | 0.9(0.6) | 0.4(0.9) | 1.1(1.2) | |
| < 20 ng/ml | 6 | 0.4(0.4) | 0.9(0.3) | 1(0.3) | 0.9(0.2) | 0.8(0.3) | 0.7(0.5) | 0.8(0.3) | 1(0.8) | 1(0.3) | 0.9(0.2) | 1.2(0.6) | 0.7(1) | |
| p-value | 0.326 | 0.179 | 0.152 | 0.307 | 0.392 | 0.446 | 0.491 | 0.094 | 0.167 | 0.466 | 0.021 | 0.209 | ||
| Skin Prick Test | negative | 10 | 0.2(0.5) | 0.6(0.4) | 0.7(0.4) | 0.6(0.5) | 0.6(0.4) | 0.5(0.5) | 0.7(0.3) | 0.4(0.6) | 0.7(0.4) | 0.7(0.6) | 0.9(0.6) | 0.7(1.4) |
| positive | 12 | 0.7(0.4) | 1(0.3) | 1(0.3) | 0.9(0.3) | 0.8(0.3) | 0.8(0.5) | 0.9(0.4) | 0.9(0.8) | 1.1(0.3) | 1(0.4) | 0.4(1.1) | 1.3(0.9) | |
| p-value | 0.006 | 0.025 | 0.022 | 0.027 | 0.061 | 0.065 | 0.122 | 0.060 | 0.022 | 0.052 | 0.090 | 0.118 | ||
| IgG levels | <100 IU/mL | 11 | 0.2(0.5) | 0.7(0.4) | 0.8(0.4) | 0.7(0.4) | 0.6(0.4) | 0.4(0.6) | 0.8(0.3) | 0.4(0.8) | 0.8(0.4) | 0.7(0.5) | 0.8(0.7) | 1(1.4) |
| ≥100 IU/mL | 11 | 0.8(0.4) | 0.9(0.4) | 1(0.4) | 0.9(0.4) | 0.8(0.4) | 0.9(0.4) | 0.8(0.5) | 0.9(0.6) | 1(0.4) | 1(0.5) | 0.4(1.1) | 1(0.9) | |
| p-value | 0.007 | 0.113 | 0.133 | 0.120 | 0.168 | 0.011 | 0.393 | 0.041 | 0.143 | 0.106 | 0.142 | 0.440 | ||
| EASI | <16 | 5 | 0.2(0.5) | 0.5(0.5) | 0.6(0.5) | 0.5(0.5) | 0.5(0.3) | 0.3(0.7) | 0.6(0.3) | 0.5(0.8) | 0.6(0.4) | 0.5(0.7) | 0.7(1.4) | 1(1.4) |
| ≥16 | 17 | 0.6(0.5) | 0.9(0.3) | 0.9(0.3) | 0.9(0.3) | 0.8(0.4) | 0.8(0.5) | 0.9(0.4) | 0.7(0.7) | 1(0.3) | 1(0.4) | 0.6(0.8) | 1(1.1) | |
| p-value | 0.111 | 0.024 | 0.044 | 0.027 | 0.059 | 0.049 | 0.052 | 0.294 | 0.013 | 0.025 | 0.393 | 0.490 | ||
Data are presented as levels of protein expression involved in vitamin D metabolism, epithelial barrier, and immune response and inflammation, stratified by gender, localization, 25(OH)D levels, skin prick test results, IgG levels, EASI score (Eczema Area and Severity Index). p-values < 0.05 are highlighted in bold. Data expressed as mean Log2 (sample/reference) expression and (SD). CAMP = cathelicidin; CADH1 = Cadherin-1; CING = cingulin; CLD1 = claudin-1; CTNA1 = alpha-catenin; CTNB1 = beta-catenin; CYP24A1 = Cytochrome P450 family 24 subfamily A member 1; CYP27B1 = cytochrome P450 family 27 subfamily B member 1; FILA = filaggrin; HPT = haptoglobin; OCLN = occluding; VDR = vitamin D receptor.
Table 4.
Multivariate regression to evaluate the association between protein expression levels in intra-lesional areas and clinical parameters.
Table 4.
Multivariate regression to evaluate the association between protein expression levels in intra-lesional areas and clinical parameters.
| Vitamin D metabolism | Epithelial barrier | Immune response and Inflammation |
|||||||||||
| CYP24A | CYP27B | VDR | OCLN | CING | CLD1 | FILA | CADH1 | CTNA1 | CTNB1 | CAMP | HPT | ||
| Age of onset (childhood) |
β (95% CI) |
-0.56 (-6.28,5.16) |
0.46 (-2.63,3.55) |
0.34 (-0.74,1.42) |
-0.52 (-1.51,0.48) |
-0.54 (-3.36,2.29) |
1.14 (-0.99,3.26) |
-1.34 (-8.62,5.93) |
-0.04 (-0.74,0.65) |
2.06 (-1.26,5.38) |
-0.04 (-0.70,0.62) |
-0.26 (-0.51,-0.02) |
-0.05 (-0.41,0.31) |
| S.E. | 2.53 | 1.37 | 0.48 | 0.44 | 1.25 | 0.94 | 3.22 | 0.31 | 1.47 | 0.29 | 0.11 | 0.16 | |
| T | -0.22 | 0.34 | 0.72 | -1.17 | -0.43 | 1.21 | -0.42 | -0.15 | 1.41 | -0.15 | -2.40 | -0.31 | |
| p-value | 0.83 | 0.74 | 0.49 | 0.27 | 0.68 | 0.26 | 0.69 | 0.89 | 0.19 | 0.88 | 0.039 | 0.76 | |
| Phenotype (Flexural site) |
β (95% CI) |
3.53 (-1.96,9.03) |
2.46 (-0.51,5.43) |
0.44 (-0.60,1.47) |
-0.85 (-1.81,0.11) |
1.37 (-1.35,4.09) |
2.06 (0.02,4.10) |
-4.56 (-11.55,2.43) |
-0.16 (-0.83,0.51) |
-4.16 (-7.34,-0.97) |
-0.17 (-0.81,0.46) |
-0.15 (-0.38,0.09) |
-0.19 (-0.54,0.15) |
| S.E. | 2.43 | 1.31 | 0.46 | 0.42 | 1.20 | 0.90 | 3.09 | 0.29 | 1.41 | 0.28 | 0.10 | 0.15 | |
| T | 1.45 | 1.87 | 0.95 | -2.00 | 1.14 | 2.28 | -1.48 | -0.55 | -2.95 | -0.62 | -1.38 | -1.28 | |
| p-value | 0.18 | 0.094 | 0.37 | 0.077 | 0.28 | 0.048 | 0.17 | 0.60 | 0.016 | 0.55 | 0.19 | 0.23 | |
| Asthma or Rhino conjunctivitis (present) |
β (95% CI) |
-0.76 (-6.95,5.54) |
1.24 (-2.11,4.59) |
0.23 (-0.94,1.40) |
-0.13 (-1.21,0.95) |
1.56 (-1.50,4.62) |
-0.26 (-2.56,2.04) |
-2.68 (-10.56,5.21) |
0.42 (-0.33,1.18) |
-0.06 (-3.65,3.53) |
0.40 (-0.32,1.11) |
-0.02 (-0.29,0.25) |
-0.39 (-0.77,-0.00) |
| S.E. | 2.74 | 1.48 | 0.52 | 0.48 | 1.35 | 1.02 | 3.48 | 0.33 | 1.59 | 0.32 | 0.12 | 0.17 | |
| T | -0.28 | 0.84 | 0.45 | -0.27 | 1.15 | -0.25 | -0.77 | 1.28 | -0.04 | 1.26 | -0.19 | -2.26 | |
| p-value | 0.79 | 0.42 | 0.66 | 0.79 | 0.28 | 0.80 | 0.46 | 0.23 | 0.97 | 0.24 | 0.86 | 0.05 | |
| Skin prick test (positive) |
β (95% CI) |
-2.69 (-7.75,2.37) |
1.87 (-0.87,4.60) |
0.60 (-0.35,1.56) |
-0.00 (-0.88,0.88) |
-0.23 (-2.73,2.27) |
-1.93 (-3.81,-0.05) |
0.04 (-6.40,6.48) |
0.40 (-0.21,1.02) |
2.61 (-0.32,5.55) |
0.09 (-0.49,0.68) |
0.26 (0.04,0.47) |
-0.33 (-0.64,-0.01) |
| S.E. | 2.24 | 1.21 | 0.42 | 0.39 | 1.11 | 0.83 | 2.85 | 0.27 | 1.30 | 0.26 | 0.10 | 0.14 | |
| T | -1.20 | 1.54 | 1.43 | -0.01 | -0.21 | -2.32 | 0.01 | 1.48 | 2.01 | 0.35 | 2.64 | -2.35 | |
| p-value | 0.26 | 0.16 | 0.19 | 0.99 | 0.84 | 0.046 | 0.99 | 0.17 | 0.075 | 0.73 | 0.027 | 0.044 | |
|
25(OH)D (< 30 ng/ml) |
β (95% CI) |
0.97 (-2.68 ,4.61) |
-1.20 (-3.17,0.77) |
0.32 (-0.37,1.00) |
0.70 (0.07,1.34) |
0.53 (-1.27, 2.33) |
-2.04 (-3.39,-0.69) |
-0.91 (-5.54,3.72) |
0.26 (-0.18 ,0.70) |
1.81 (-0.30,3.92) |
-0.30 (-0.72, 0.12) |
-0.06 (-0.22, 0.10) |
0.43 (0.20,0.66) |
| S.E. | 1.61 | 0.87 | 0.3 | 0.28 | 0.8 | 0.6 | 2.05 | 0.2 | 0.93 | 0.19 | 0.07 | 0.1 | |
| T | 0.6 | -1.38 | 1.04 | 2.5 | 0.67 | -3.41 | -0.44 | 1.33 | 1.94 | -1.62 | -0.88 | 4.28 | |
| p-value | 0.56 | 0.20 | 0.32 | 0.034 | 0.52 | 0.0077 | 0.67 | 0.22 | 0.084 | 0.14 | 0.40 | 0.002 | |
The table reports only the clinical parameters in which at least one significant association (p < 0.05) was found among the analyzed proteins. Coefficients (β), 95% confidence intervals (CI), and p-values are shown for each variable. n.d., not determined; S.E., standard error: T = T statistic. CAMP = cathelicidin; CADH1 = Cadherin-1; CING = cingulin; CLD1 = claudin-1; CTNA1 = alpha-catenin; CTNB1 = beta-catenin; CYP24A1 = Cytochrome. P450 family 24 subfamily A member 1; CYP27B1 = cytochrome P450 family 27 subfamily B member 1; FILA = filaggrin; HPT = haptoglobin; OCLN = occluding; VDR = vitamin D receptor.
Disclaimer/Publisher’s Note: The statements, opinions and data contained in all publications are solely those of the individual author(s) and contributor(s) and not of MDPI and/or the editor(s). MDPI and/or the editor(s) disclaim responsibility for any injury to people or property resulting from any ideas, methods, instructions or products referred to in the content. |
© 2024 by the authors. Licensee MDPI, Basel, Switzerland. This article is an open access article distributed under the terms and conditions of the Creative Commons Attribution (CC BY) license (http://creativecommons.org/licenses/by/4.0/).
Copyright: This open access article is published under a Creative Commons CC BY 4.0 license, which permit the free download, distribution, and reuse, provided that the author and preprint are cited in any reuse.


