1. Introduction
Chronic wounds are commonly caused by underlying conditions (such as diabetes, venous diseases, and immune system disorders), local pressure, and ischemia. The healing time for these wounds typically ranges from several months to years[
1]. According to data from the World Health Organization, there are approximately four million people worldwide affected by chronic wound diseases annually. These wounds often result in discomfort symptoms such as pain and itching, and may even lead to severe complications including infection and deep tissue damage. Such complications have a significant impact on patients’ health and quality of life, imposing a substantial economic burden on healthcare systems [
2,
3,
4].
Bacterial infection is a crucial factor contributing to the non-healing of wounds. Bacteria proliferate on the surface and within wounds, forming biofilms and producing virulence factors [
5]. Biofilms consist of bacteria, extracellular matrix, and other substances that protect bacteria from external influences, provide nutrients and oxygen, and enhance bacterial resistance to antibiotics[
6,
7,
8].
P. aeruginosa is one of the most prominent pathogens found in the chronic wound environment [
9]. In a retrospective analysis by Jockenhöfer et al.,
P. aeruginosa was detected in one-third of the patients with lower limb venous ulcers[
10]. Similarly, Gjødsbøl et al. found
P. aeruginosa in more than half of the patients with persistent venous leg ulcers in their longitudinal study[
11].
P. aeruginosa commonly exists in the natural environment and adheres to wound surfaces through flagella, adhesins, and polysaccharides when the skin barrier is compromised, rapidly multiplying and forming biofilms[
12]. If left untreated, the virulence factors produced by bacteria can further invade tissues, leading to more severe complications such as sepsis and infective endocarditis, posing a greater threat to patients’ health[
13,
14].
In diagnosing wounds, clinicians primarily rely on observing patients’ clinical signs to make decisions. Signs of infection include abnormal granulation tissue, purulent exudate, elevated temperature, edema, and erythema[
15,
16]. This method heavily relies on the clinical experience of the attending physician. Wound culture is considered the gold standard for infection diagnosis. Traditional culture methods include swab culture, needle aspiration, and tissue biopsy techniques, which are relatively inexpensive and have high diagnostic efficiency. However, these methods require a longer culture time, cannot provide immediate feedback on wound infection, and are invasive, causing discomfort to patients[
17]. Various laboratory biomarkers, including C-reactive protein, procalcitonin, presepsin, and bacterial protease activity, have been quantified to assist in diagnosing infection [
18,
19,
20,
21]. Additionally, imaging techniques such as computed tomography, magnetic resonance imaging, ultrasound imaging, spatial frequency-domain imaging, thermography, automated fluorescence imaging, and biosensors have emerged for real-time diagnosis of wound infection, demonstrating unique advantages in deeper wound infection diagnosis [
22,
23,
24,
25,
26]. While these methods are non-invasive and highly accurate, they tend to be expensive and require specialized technicians to operate.
An instant handheld bacteria fluorescence imaging device can provide real-time monitoring of bacterial information within wounds, assisting clinicians in making precise clinical decisions, with
P. aeruginosa showing as green fluorescence in the images. According to a prospective clinical trial by Raizman et al., 26 out of 28 wound samples exhibited green fluorescence, and
P. aeruginosa was confirmed by culture-based diagnosis, with a positive predictive value exceeding 90% [
27]. Hurley et al. examined chronic wounds at an outpatient plastic surgery center and found that all wounds displaying green fluorescence contained
P. aeruginosa, with a sensitivity and specificity of 100%[
28]. In previous studies, pyoverdine was considered the source of green fluorescence production[
29]. Its primary function is iron uptake, and once secreted, it forms stable complexes with extracellular free ferric ions, transporting iron ions into the bacterial cells[
30]. Other studies have shown that pyoverdine plays an important role in immune evasion and biofilm formation of
P. aeruginosa [
31]. The synthesis level of pyoverdine is crucial for the localization of
P. aeruginosa in wounds. According to a recent study by Emily Pham, the synthesis of pyoverdine is closely associated with pyoverdine synthetase and sigma factor of pyoverdine expression. When the genes encoding these two factors are knocked out, the green fluorescence of
P. aeruginosa is almost completely abolished, confirming their contribution to the green fluorescence[
32].
Different types of wounds and local treatments result in diverse and complex microenvironments, reflected by changes in wound temperature, pH, and osmotic pressure [
33,
34,
35,
36].Studies by Tayiba Gillani et al. showed that temperature and pH would affect the production of pyoverdine synthesis by
P. aeruginosa. Under the optimal temperature of 37°C and the optimal pH of 7, the production of pyoverdine was the highest, and low temperature and acidic environment would reduce the synthesis of pyoverdine[
37]. Studies have shown that the growth and biofilm formation of
P. aeruginosa PAO1 are inhibited in acidic environments. In pH 6.8 and weakly alkaline environment, pH has no significant effect on the growth of PAO1, but these conditions have a positive effect on the formation of biofilm[
38].
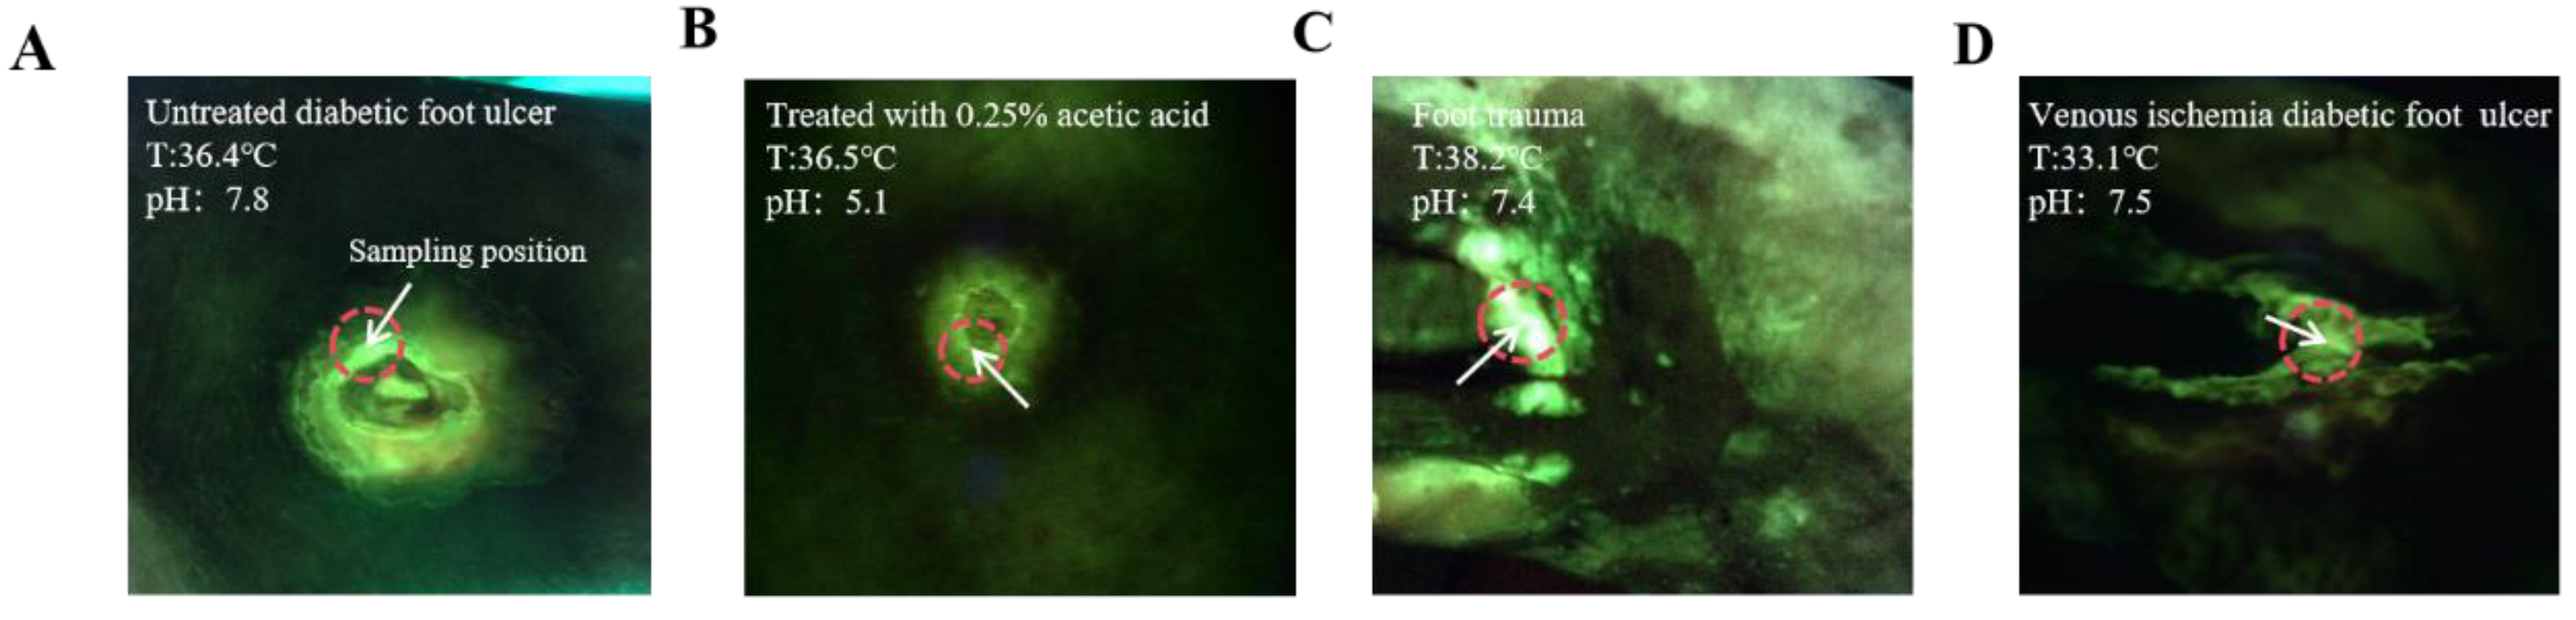
In a recent clinical observation using the MolecuLight i:X, some interesting phenomena were discovered, where wounds with the same bacterial load exhibited different intensities of green fluorescence, as shown in
Figure 1 (Photos were provided by the First Affiliated Hospital of Anhui Medical University), Under the same conditions of
P. aeruginosa infection load, the fluorescence intensity of wounds treated with 0.25% acetic acid wet gauze was significantly weaker than that of wounds not treated with 0.25% acetic acid wet gauze(
Figure 1A,B). Although the autofluorescence intensity of wound C is higher than that of wound D, bacterial load measurements indicate that both wounds harbor equivalent levels of bacteria. The distinction lies in the fact that the temperature of wound D is lower due to local vascular pathology (
Figure 1C,D).
Based on this patient’s clinical observation and previous research, whether different wound microenvironments affect the fluorescence intensity of P. aeruginosa is unclear. In this study, an in vitro bacterial culture model was established to investigate the effect of culture temperature, pH, and osmotic pressure on the fluorescence intensity of P. aeruginosa. The expression levels of pyoverdine synthetase and sigma factor of pyoverdine genes under different conditions were analyzed. The results of this study elucidate the impact of changes in wound infection microenvironment on bacterial fluorescence, thereby enhancing the accuracy and treatment effectiveness of this technology in future clinical applications.
3. Conclusions
Chronic wound infection is a common problem globally, especially in developing countries and resource-limited areas where medical conditions and sanitation facilities are relatively poor. Patients in these regions often have low awareness of wound cleanliness and proper management, making infection occurrence and transmission more likely [
39]. Previous studies have shown that
P. aeruginosa is one of the most common pathogens in chronic wounds. Early detection and clearance of
P. aeruginosa in wounds can significantly shorten wound healing time and improve patients’ quality of life. Compared to traditional bacterial detection techniques, bacterial fluorescence imaging has the advantages of instant, rapid, and non-invasive application for
P. aeruginosa detection. Based on the intuitive images provided by the instrument, doctors can make accurate diagnoses and treatment decisions[
27]. Surface and internal temperature, pH, and osmotic pressure vary among different types of wounds. Acute wounds exhibit local inflammatory reactions with higher temperature than surrounding skin. Chronic wounds typically have local tissue damage, ischemia, or inflammation, resulting in lower surface temperature than surrounding tissues. Burn wounds, due to impaired local blood circulation, also exhibit lower surface temperature [
40]. Studies have shown that the pH range of open wounds is 5.45 to 8.65, while non-healing chronic wounds mostly exhibit alkaline pH ranging from 7.15 to 8.90, and some even as high as 9.25 [
41]. Furthermore, research indicates that changing wound pH value is an effective strategy for wound treatment. Currently, acidic wound dressings and cleansing solutions are commonly used to change wound pH, promoting wound acidification, which is beneficial for controlling bacterial proliferation and stimulating granulation tissue growth [
42,
43]. For localized wound infection, it has been found that using high osmotic saline as a disinfectant can control bacterial proliferation and promote granulation tissue growth[
44]. Therefore, the wound infection microenvironment is complex and diverse.
In a recent experimental clinical observation, we found that under the same bacterial load,
P. aeruginosa exhibited different fluorescence intensities in different types of wounds. The observed phenomenon is undeniably intriguing, and the findings of this experiment suggest that the bacterial microenvironment may exert an influence on fluorescence intensity.
P. aeruginosa in infected wounds is identified and located by emitting green fluorescence. In previous studies, pyoverdine has been considered the source of green fluorescence, and the
pvdD and
pvdS genes play important roles in fluorescence production[
32]. There have been few reports on the effects of temperature, pH, and osmotic pressure on pyoverdine synthesis. In this experiment, an in vitro bacterial culture model was established, and the dynamic changes of
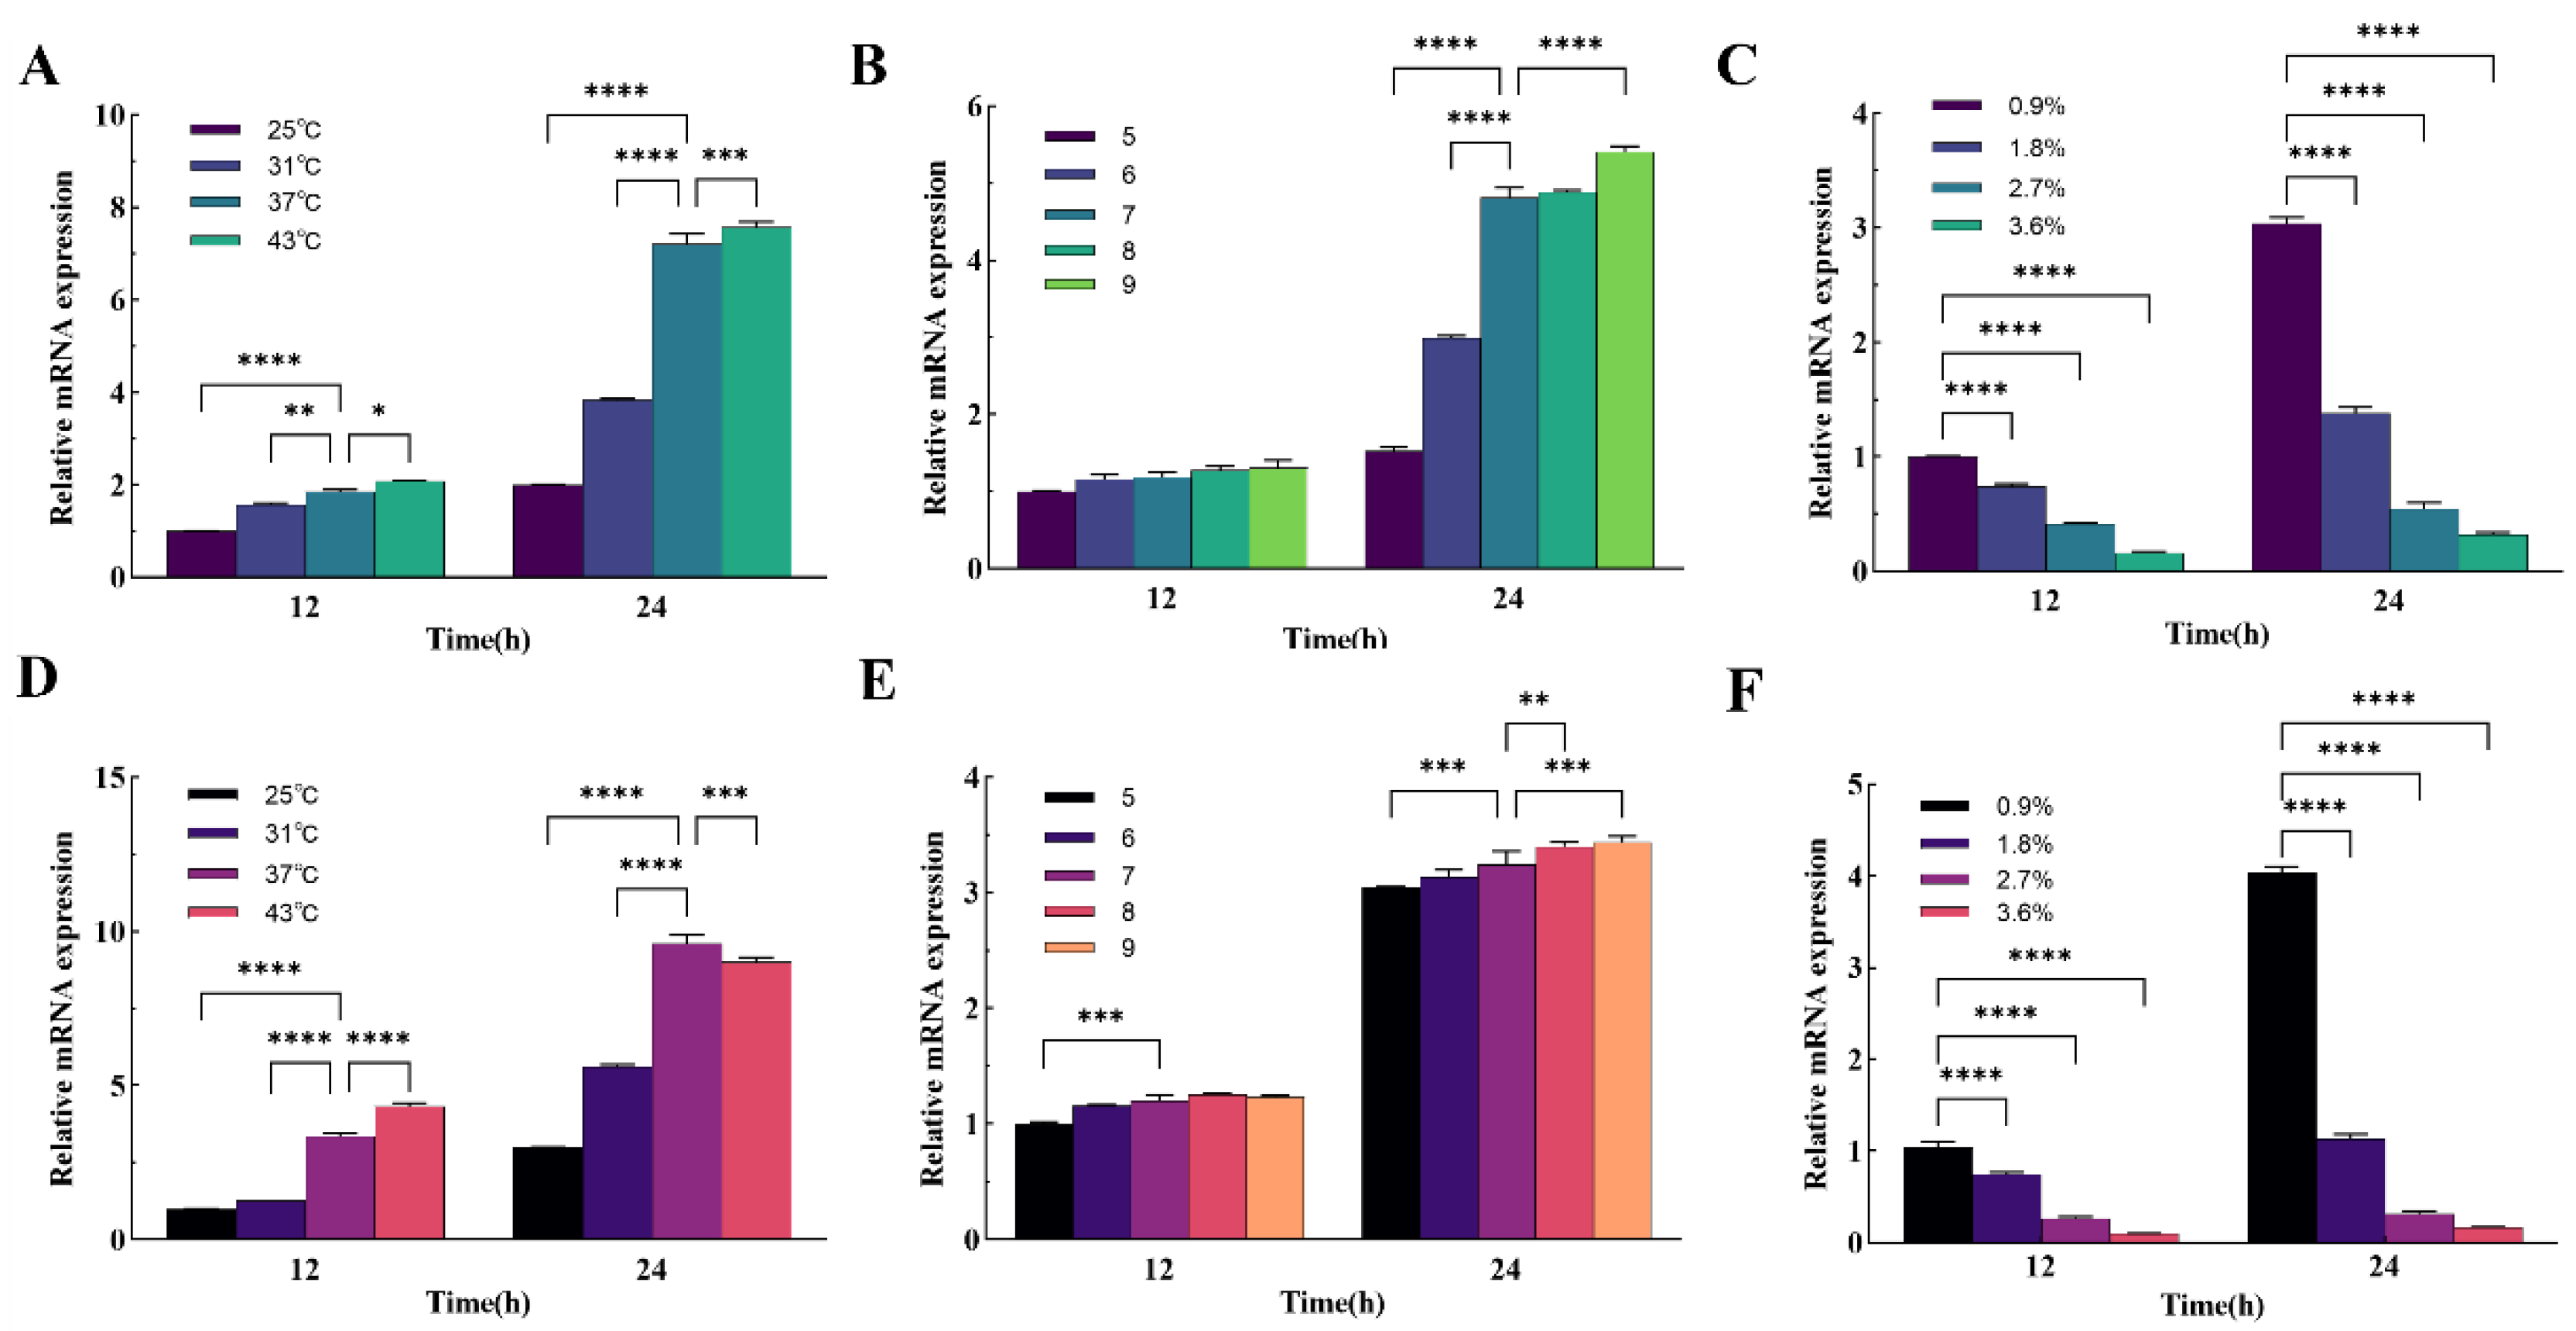
P. aeruginosa under different conditions were analyzed using Image J software. Real-time fluorescence quantitative PCR was used to detect the expression levels of key genes involved in pyoverdine synthesis, and the experimental results were subjected to correlation analysis. The results showed that temperature influenced the production of
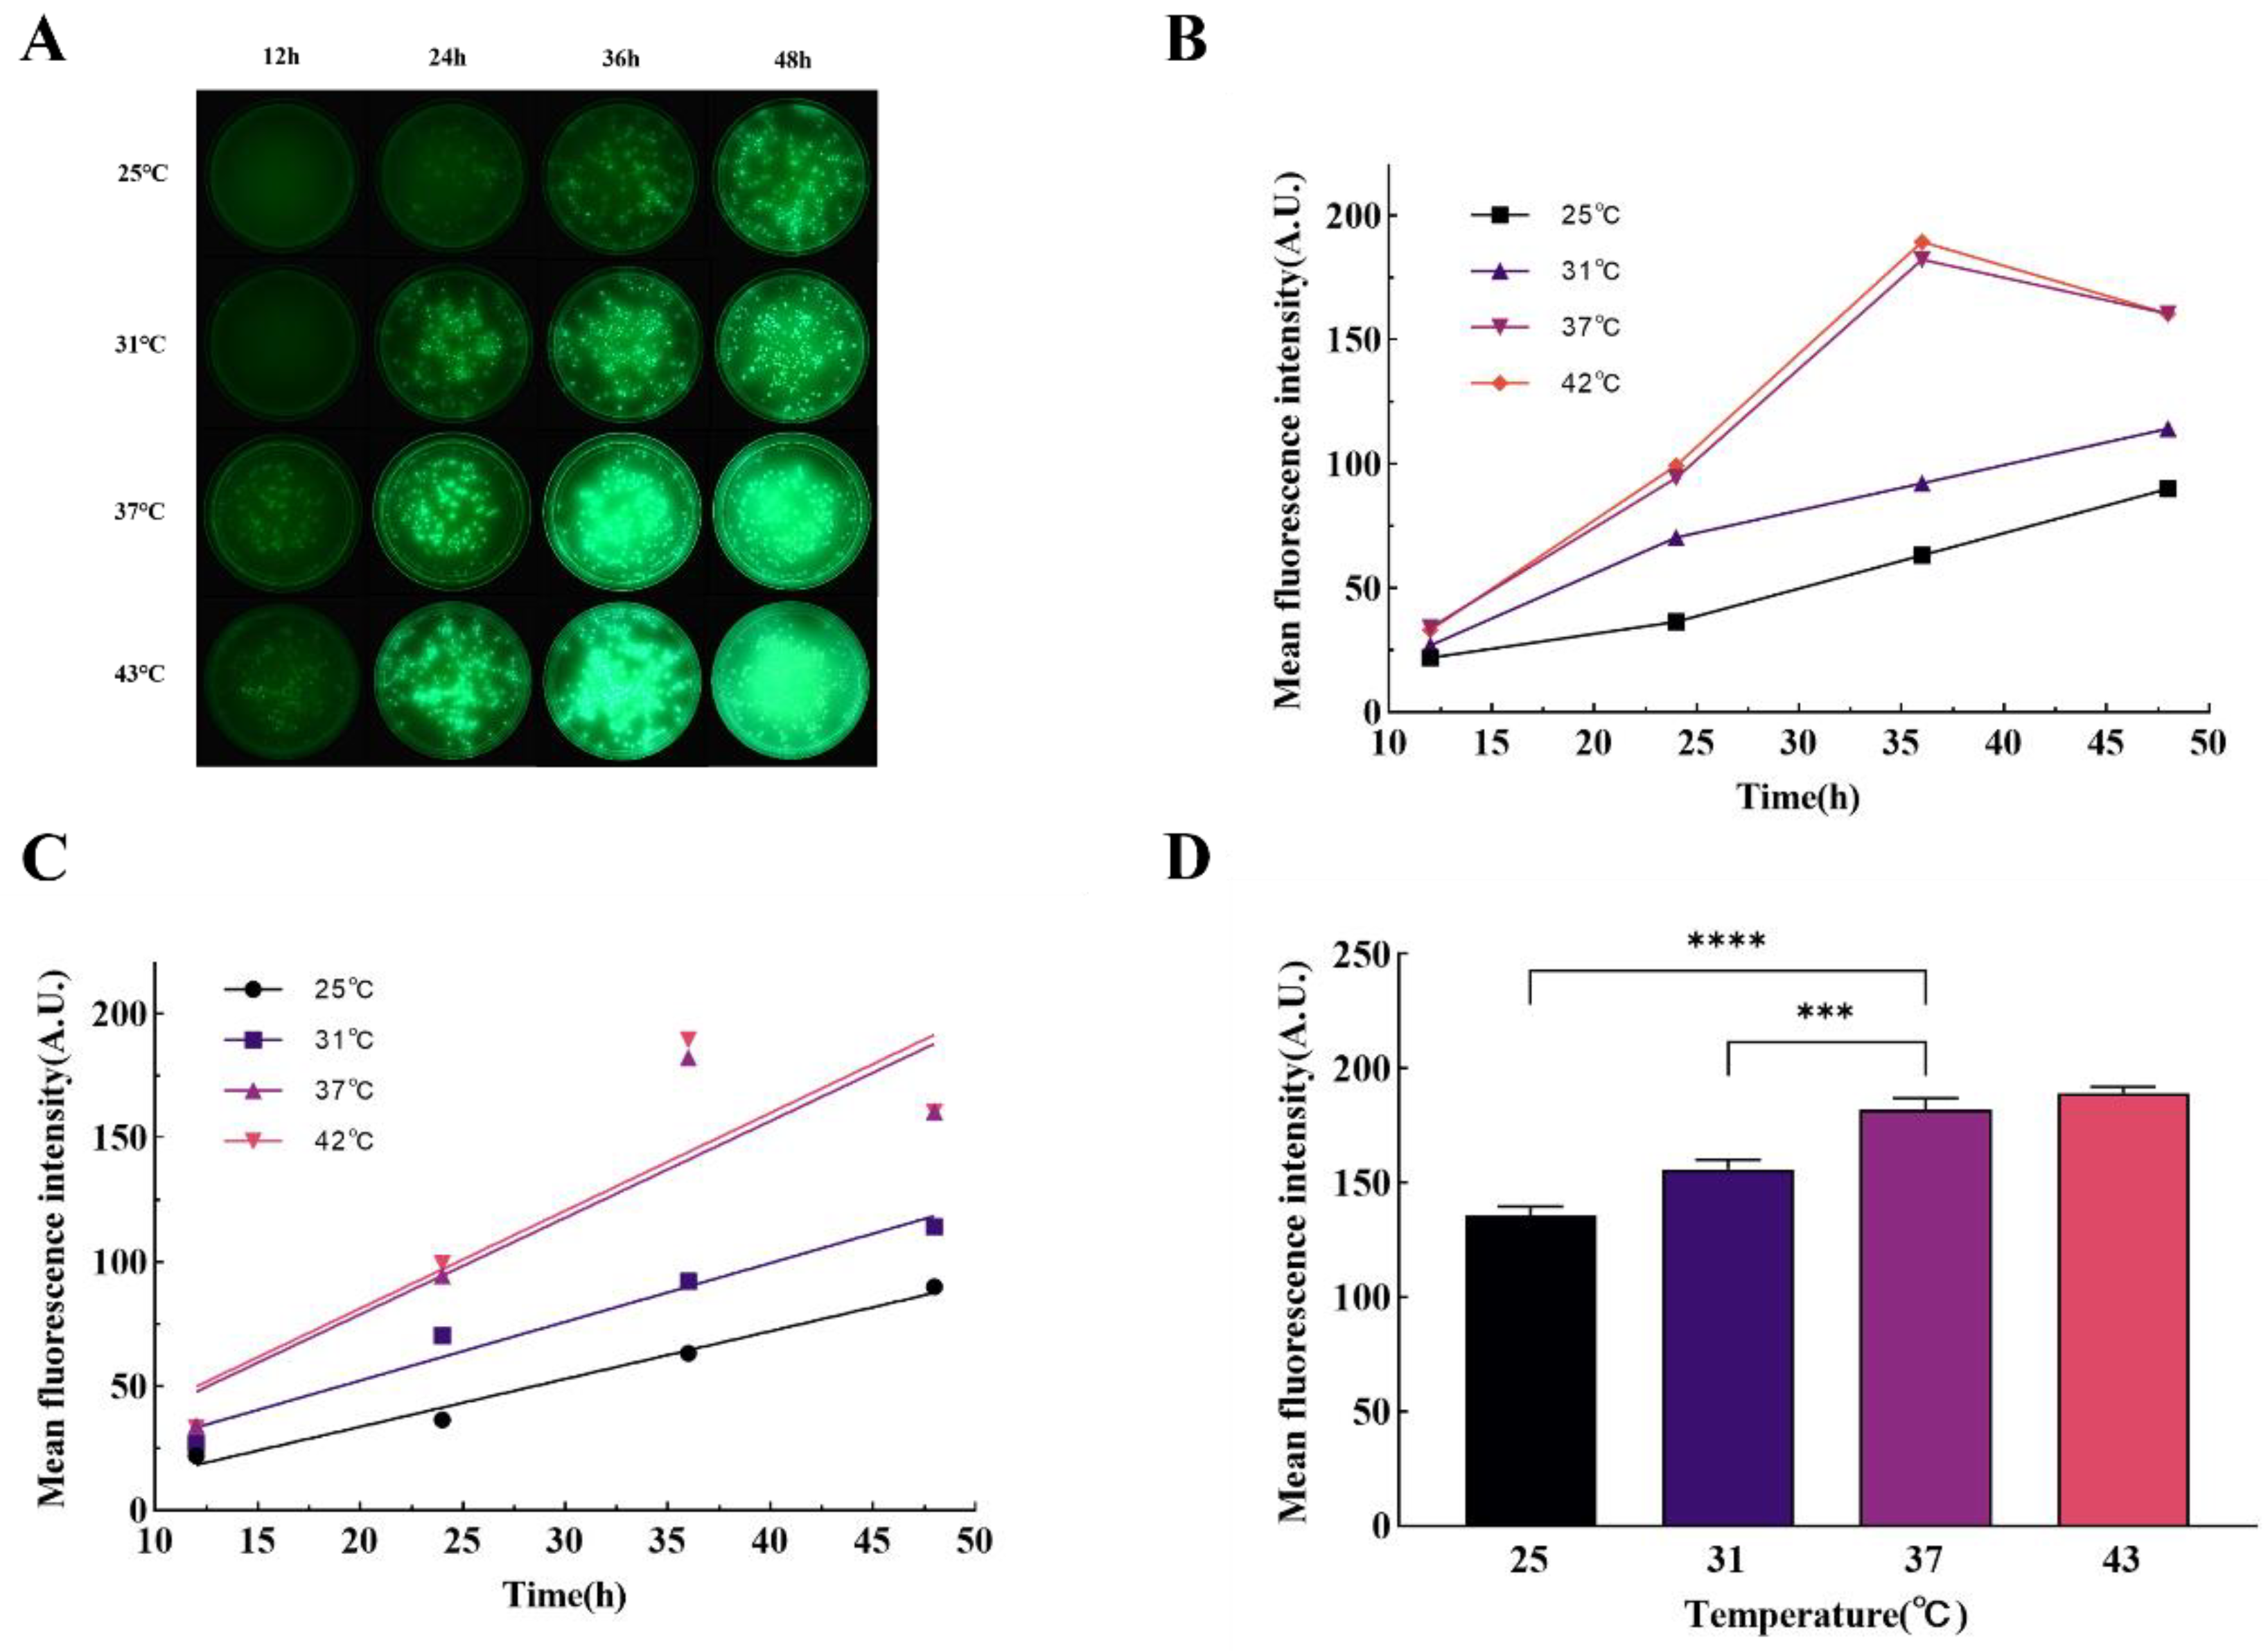
P. aeruginosa green fluorescence, with a gradual decrease in fluorescence production rate and peak intensity at temperatures below 37°C. Real-time fluorescence quantitative PCR results showed that the expression levels of the
pvdD and
pvdS genes were consistent with the fluorescence results, indicating that temperature may regulate pyoverdine synthesis by affecting the expression of these genes. The fluorescence of
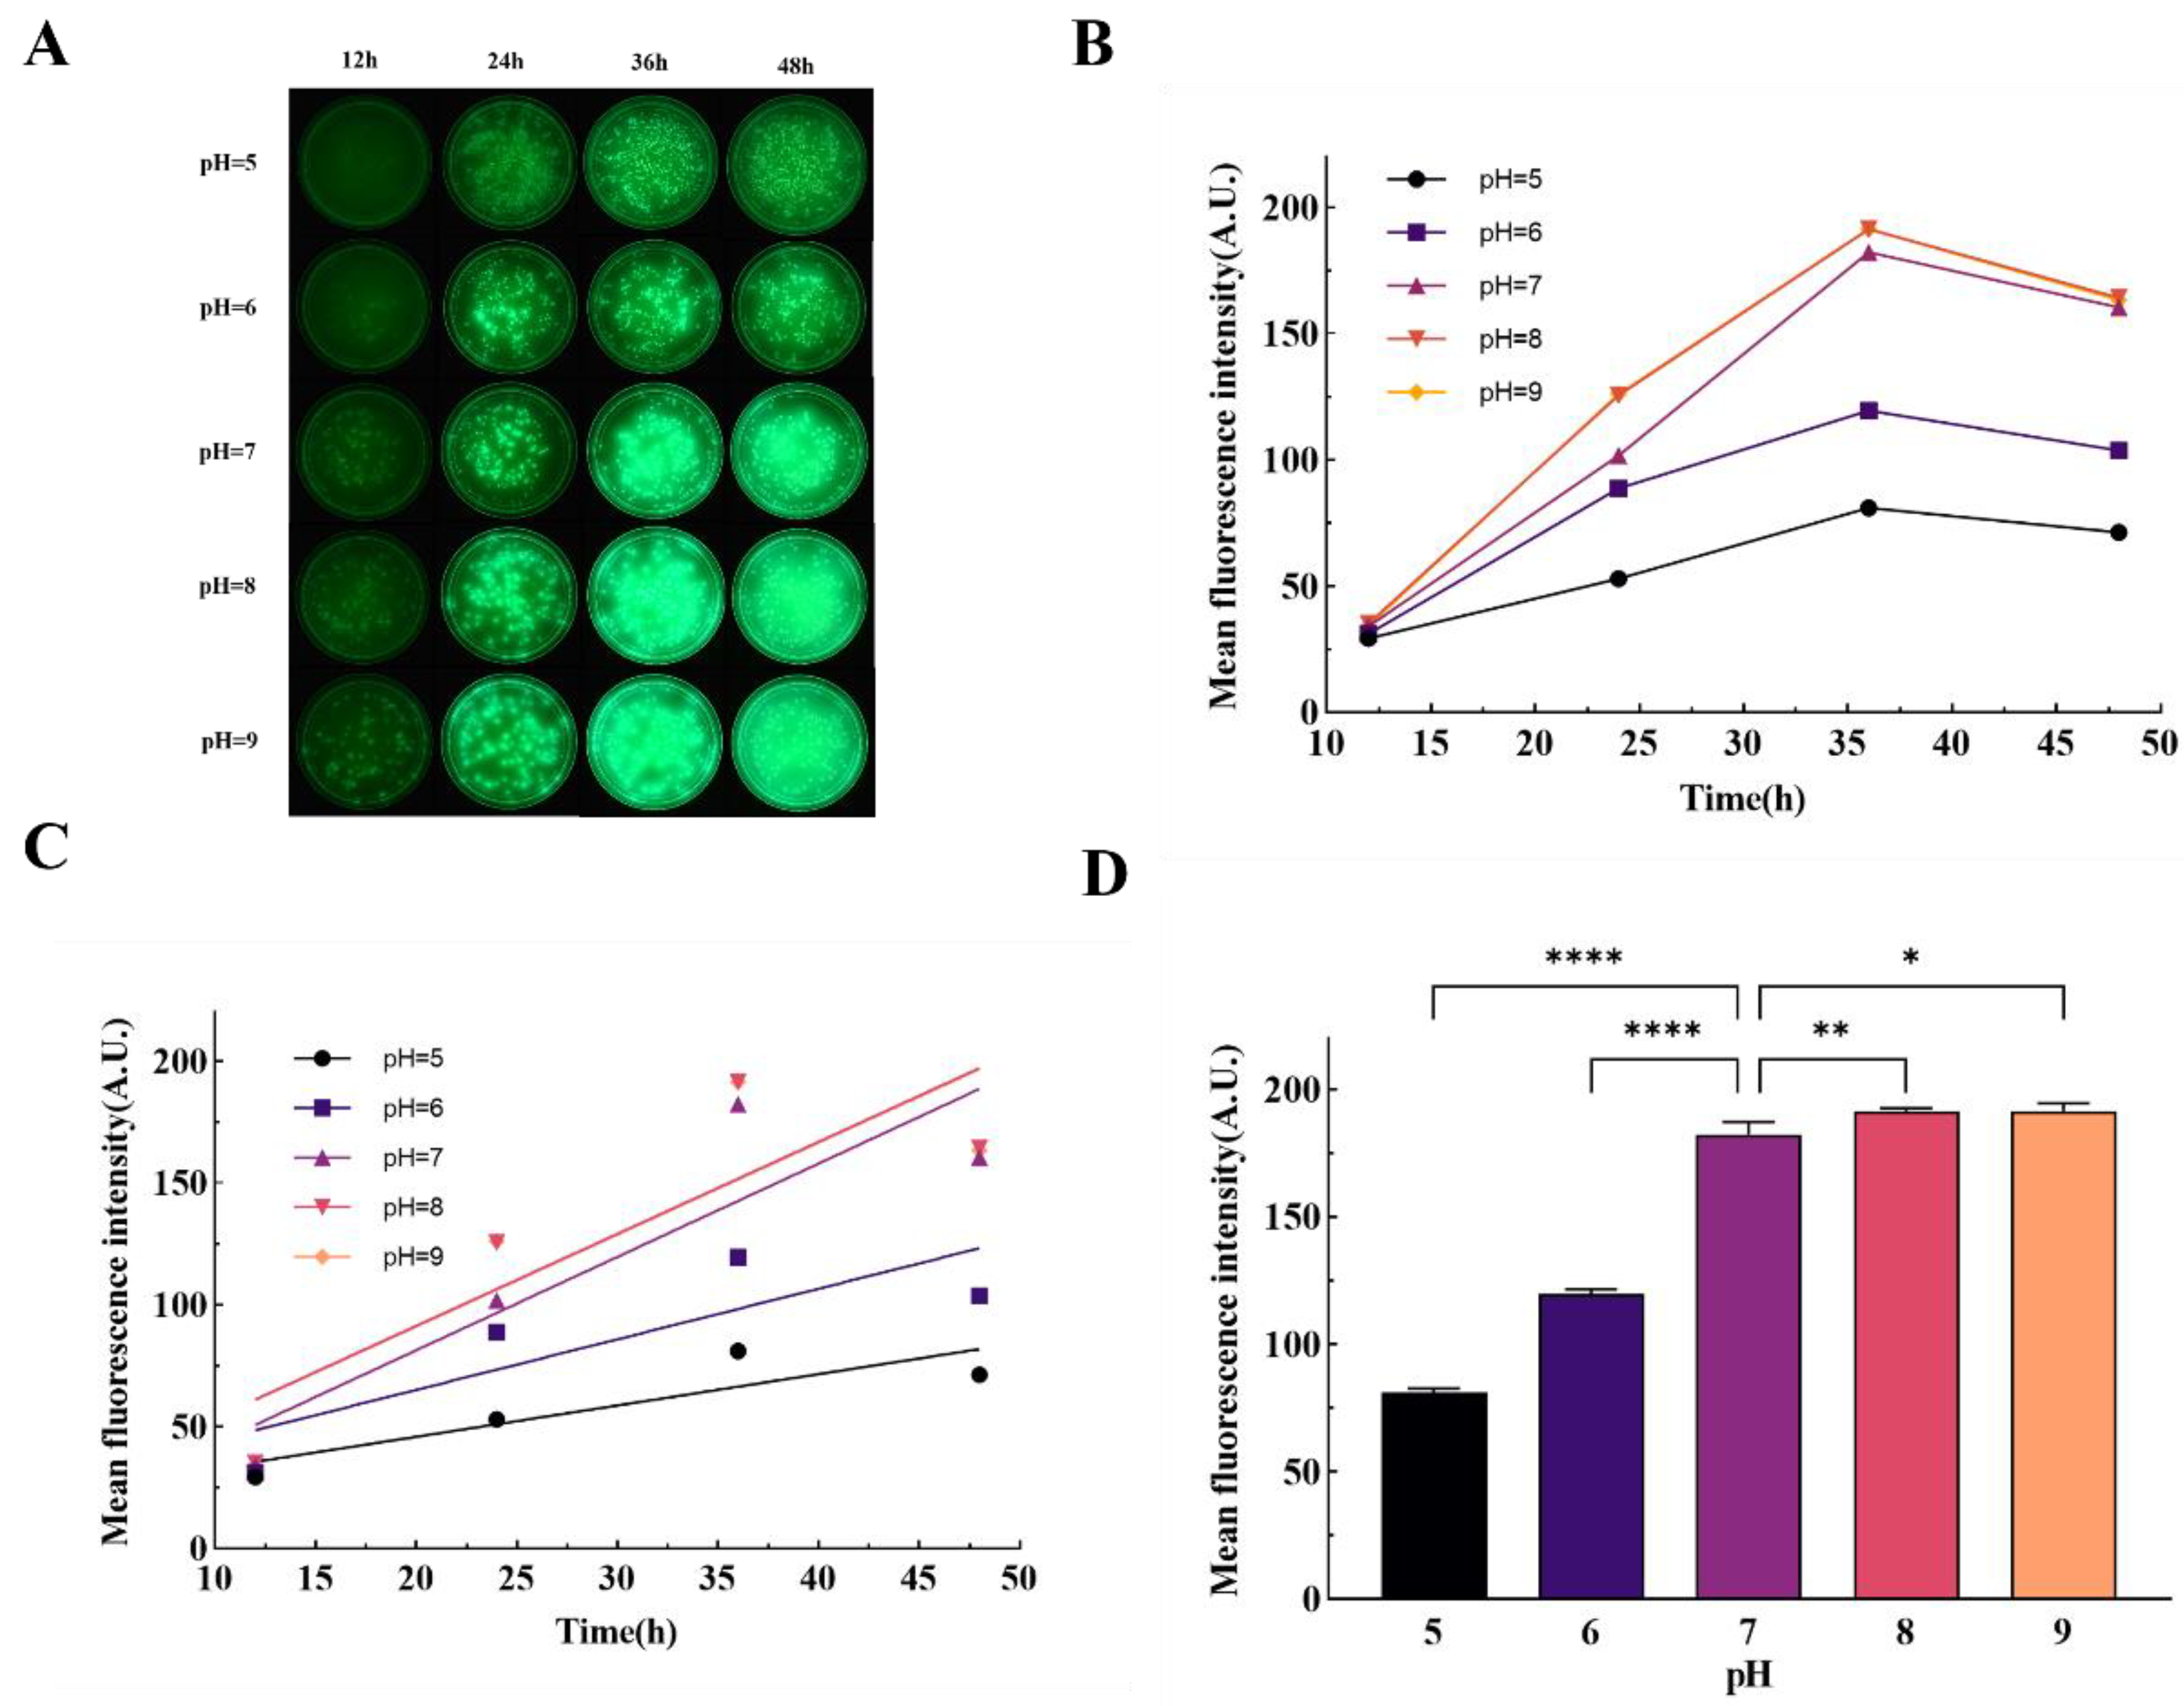
P. aeruginosa was influenced by the pH level of the culture medium. When the pH of the medium decreased from 7 to 5, the fluorescence intensity showed a weakening trend, while alkaline conditions slightly enhanced fluorescence intensity. The expression levels of the
pvdD and
pvdS genes exhibited the same trend as fluorescence intensity, with the expression of the
pvdD gene more significantly affected by pH. This suggests that the fluorescence intensity of
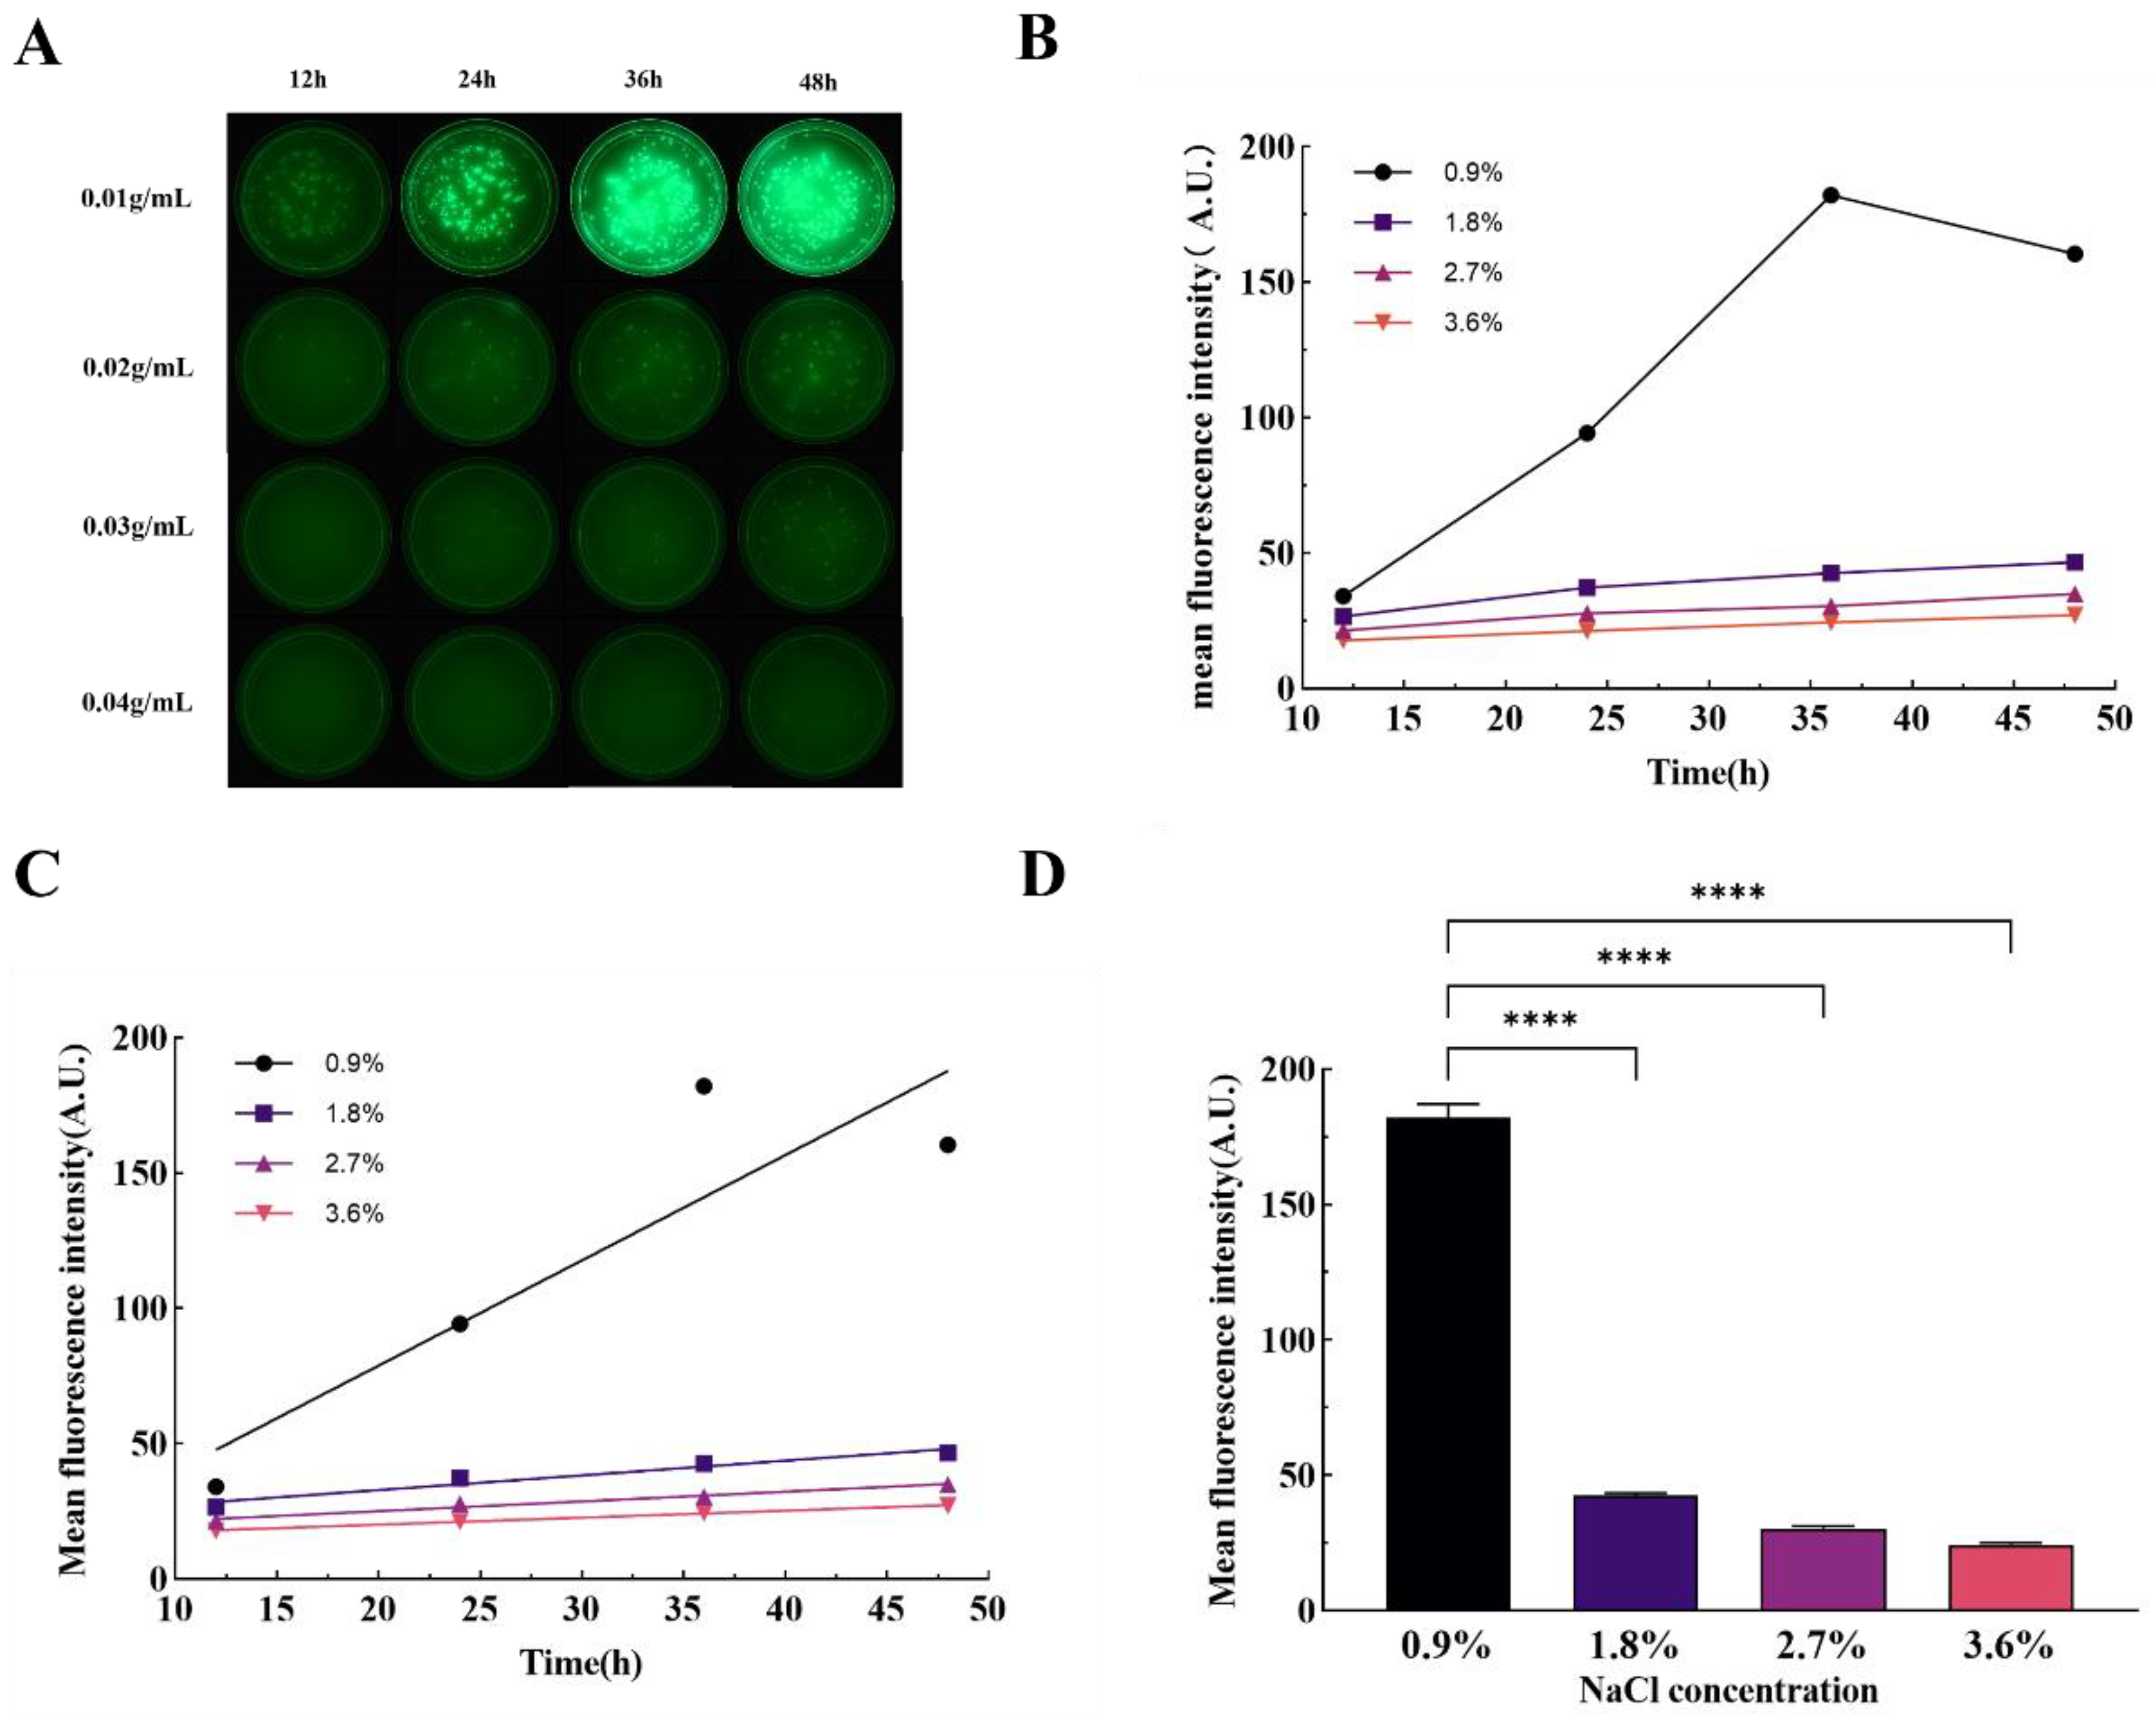
P. aeruginosa may not be affected by alkaline environments as the wound pH becomes alkaline. Although acidic solutions cannot kill bacteria, the fluorescence intensity may still weaken after acidic treatment of the wound. The osmotic pressure of the culture medium significantly affected the production of
P. aeruginosa fluorescence. When the sodium chloride concentration in the medium exceeded 1.8%, the colony area significantly decreased, indicating poor salt tolerance of
P. aeruginosa, making it difficult to survive under high osmotic conditions. At the same time point, the fluorescence intensity decreased sharply, and real-time fluorescence quantitative PCR results showed a significant decrease in the expression levels of the
pvdD and
pvdS genes, highly consistent with the changes in fluorescence intensity.
Bacterial fluorescence imaging technology demonstrates unique advantages in wound bacterial detection, and changes in the bacterial microenvironment may lead to changes in the fluorescence intensity of P. aeruginosa. Our experimental results indicate that the production of P. aeruginosa fluorescence is influenced by cultivation temperature, pH, and osmotic pressure, and corresponding gene expression patterns. The underlying mechanisms of how temperature, pH, and osmotic pressure affect pyoverdine synthesis are not clear, and the bacterial microenvironment is complex and diverse. It is still unknown whether other factors in the bacterial microenvironment, such as antibacterial adjuncts and antibiotics used, can affect bacterial fluorescence. Further research is needed to elucidate these aspects. In conclusion, our study demonstrates the dynamic changes of P. aeruginosa fluorescence under in vitro conditions influenced by temperature, pH, and osmotic pressure, and reveals the expression patterns of the pvdD and pvdS genes under different conditions. The results of this study provide valuable reference data for real-time bacterial fluorescence imaging for wound infection detection.
4. Materials And Methods
4.1. Lysogeny Broth (LB) Preparation and Bacterial Liquid Culture Method
In the preparation of Lysogeny Broth (LB), 1g of beef extract (Basebio, Hangzhou, China) and 2g of sodium chloride (Sangon, Shanghai, China) were meticulously weighed and subsequently dissolved in 200 mL of purified water. This aqueous solution was then sterilized using an autoclave (Zealway, Delaware, USA) at a temperature of 121°C for a duration of 30 minutes. Post-sterilization, the solution was cooled to ambient room temperature. A volume of 10 mL of the sterilized LB was transferred aseptically into a 15 mL centrifuge tube. To this tube, 50 μL of P. aeruginosa bacterial suspension—obtained from the General Microbial Species Preservation and Management Center, China—was added. The centrifuge tube containing the bacterial inoculum was then placed on a benchtop shaker (Boxun, Shanghai, China) and incubated at a constant temperature of 37°C for a period of 36 hours. Following incubation, optical density measurements were conducted at a wavelength of 600 nm (OD600) to determine the bacterial culture's growth density.
4.2. The Absorbence-Concentration Standard Curve of Bacteria Was Established
A 50 μL of the bacterial solution was introduced into 10 mL of LB and incubated in a benchtop constant temperature oscillator for a duration of 36 hours. Subsequently, the bacterial solution was diluted in a series from 1 to 5 times using an equal gradient with 1× Phosphate Buffered Saline (PBS) solution (Solarbio, Beijing, China). These dilutions resulted in three parallel groups of bacterial suspensions across five distinct concentrations, which were then subjected to the dilution coating plate technique to ascertain the bacterial concentration in each group. For quantitative analysis, 200 μL of each bacterial suspension was dispensed into individual wells of a 96-well plate. The optical density measurements at a wavelength of 600 nm were obtained using a multifunctional enzyme labeling instrument (Tecan, Switzerland). To ensure reliability, three iterative measurements were conducted for each sample group, and the results were averaged. The OD600 values corresponding to each sample group were plotted on the x-axis, while the respective bacterial solution concentrations were plotted on the y-axis, thereby establishing a linear standard curve that correlated bacterial solution concentration with absorbance. This curve serves as a calibration tool to calculate the concentration of bacterial suspensions based on their OD values in subsequent experimental procedures.
4.3. Image Acquisition Method
Mount the MolecuLight i:X on the carrier table such that the instrument's camera is positioned 12 cm above the desktop. Securely fasten the Petri dish in place using label paper, ensuring that the imaging area of the Petri dish is centered within the screen. Activate the UV mode of the instrument and proceed to capture images of the samples at designated time points. It is crucial to conduct the entire image acquisition process in an environment devoid of light to eliminate any confounding influence of ambient light on the experimental outcomes.
4.4. Fluorescence Imaging Under Different Culture Temperature
A mixture consisting of 2 grams of tryptone, 1 gram of beef extract powder, 2 grams of sodium chloride, and 3 grams of agar powder (all obtained from Solarbio, Beijing, China) was accurately weighed and dissolved in 200 milliliters of purified water. This solution was subsequently sterilized using an autoclave. Upon completion of the sterilization process, the inverted plate technique was employed when the solution's temperature decreased to approximately 50°C. The bacterial suspension's absorbance was ascertained after 36 hours of incubation. A volume of 100 μL from the diluted suspension, post 106-fold dilution, was introduced onto the solidified medium and spread uniformly. The inoculated medium was then placed into an electrically heated thermostatic incubator (Jinghong, Shanghai, China) for consistent temperature incubation at 25°C, 31°C, 37°C, and 43°C, respectively. Fluorescence imaging was conducted in a darkened environment every 8 hours, commencing 12 hours following the initiation of incubation, to monitor the progression of bacterial growth and fluorescence expression under varying temperature conditions.
4.5. Fluorescence Imaging Under Different Culture pH
The pH of the medium was modulated following the procedure outlined by Bruce SK et al.[
45]. Components including 2 g of tryptone, 1 g of beef extract powder, 2 g of sodium chloride and 3 g of agar powder were meticulously weighed and dissolved in 200 μL of purified water. Subsequent to autoclaving, the pH of the resultant medium was adjusted to values of 5, 6, 7, 8, and 9 respectively, utilizing hydrochloric acid and sodium hydroxide (both sourced from Aladdin, Shanghai, China).
P. aeruginosa was then inoculated into Petri dishes containing media with varying pH levels according to the previously described method. These dishes were subsequently incubated in a constant temperature incubator maintained at 37°C. Fluorescence imaging commenced in a darkened environment every 8 hours, starting after a self-incubation period of 12 hours, to monitor the influence of pH on bacterial fluorescence expression over time.
4.6. Fluorescence Imaging Under Different Culture Osmotic Pressure
The osmotic pressure adjustment of the medium was performed according to the method described by Broekman JH [
46]. Constituents including 2 g of tryptone, 1 g of beef extract powder, and 3 g of agar powder were accurately weighed, added to 200 μL of pure water, and subsequently, sodium chloride (NaCl) concentrations were adjusted to 0.9%, 1.8%, 2.7%, and 3.6% respectively. Following this adjustment, the medium was sterilized using an autoclave. Bacterial inoculation was then performed on solid media with varying osmotic pressures, ensuring an even distribution of the bacterial suspension. These inoculated media were incubated at a consistent temperature of 37°C. Fluorescence imaging was initiated in a darkened environment every 8 hours, commencing after an auto-incubation period of 12 hours, to monitor the impact of osmotic pressure on the fluorescence emission of the bacteria over time.
4.7. Image Processing and Fluorescence Intensity Calculation
For the acquired image, the edge detection algorithm within the OpenCV software (Intel, USA) was employed to identify the perimeter of the Petri dish present in the image. Subsequently, the Hough circle algorithm was utilized to determine the coordinates and radius of the Petri dish's center, which were then outputted. Utilizing the Circle function, a circular area was isolated with a specified center coordinate (1924, 1100) and a defined radius of 770 pixels. A mask was created and superimposed over the original image to eliminate interference from reflections on the Petri dish wall. In the experimental results, post-processing of the image was carried out using ImageJ software. This involved subtracting the background associated with the Petri dish by adjusting the threshold value, followed by the computation of the average fluorescence intensity within the colony area.
4.8. Bacterial RNA Extraction Procedure
The RNA extraction procedure was conducted in accordance with the guidelines provided by the RNA/DNA extraction kit (Beyotime, Shanghai, China). Initially, bacteria were harvested from the solid Petri dish and collected via centrifugation after three thorough washes with 1× PBS solution. Subsequently, the bacterial suspension was adjusted to a concentration of 1×10⁷ CFU/mL. From this suspension, 1 mL was centrifuged, the supernatant discarded, and 1 mL of lysis buffer was added. The mixture was then vortexed appropriately and incubated at room temperature for 5 minutes to ensure complete lysis of the samples. Following incubation, 0.2 mL of chloroform (Aladdin, Shanghai, China) was introduced to the lysate, mixed thoroughly through vortexing, and allowed to incubate at room temperature for an additional 3 minutes. The mixture was then centrifuged at 12000×g for 15 minutes at 4°C, resulting in the separation into a colorless aqueous phase (upper layer) and a red organic phase (lower layer). At this juncture, 0.5 mL of the lower phase was transferred to a new centrifuge tube and combined with 0.5 mL of anhydrous isopropanol (Aladdin, Shanghai, China). The sample was inverted several times to mix and left to precipitate at room temperature for 10 minutes. Afterwards, it was centrifuged at 12000g for 10 minutes at 4°C. The supernatant was discarded, and 1 mL of Wash Solution I was added, mixed by inversion. A final centrifugation step was performed at 7500g for 5 minutes at 4°C. The supernatant was again discarded, and the tube was subjected to a brief centrifugation to remove residual liquid, which was carefully aspirated. The RNA pellet was allowed to air dry slightly before being reconstituted in 50 μL of DEPC-treated water. The concentration and purity of the extracted RNA samples were assessed using a microspectrophotometer (Nanodrop 2000, Thermo Fisher, USA).
4.9. Real-Time Fluorescence Quantitative Polymerase Chain Reaction (RT-PCR) Detection of pvdD and pvdS Gene Expression Levels
The cDNA synthesis and genomic DNA elimination reactions were conducted in accordance with the protocols outlined in the PrimeScript FAST RT reagent Kit with gDNA Eraser (Takara, Japan) Reverse Transcription Kit. To initiate the process, a centrifuge tube was prepared by sequentially adding 2 μL of 8× gDNA Eraser Premix, 2 μL of RNA sample, and 12 μL of RNase-free H2O. This mixture was incubated at 42°C for 2 minutes to eliminate genomic DNA. Subsequently, 4 μL of 5× RT Premix was incorporated, and upon gentle mixing, the reverse transcription reaction proceeded under the following thermal cycle conditions: 37°C for 10 minutes, followed by 85°C for 5 seconds. This procedure yielded a cDNA product free from genomic DNA contamination. Bidirectional primers for the P. aeruginosa 16s gene, pvdD gene and pvdS gene were designed using Primer Express software. The forward primer sequence for the 16s gene was 5'-CCAGACTCCTACGGGGAGGC-3', and the reverse primer sequence was 5'-TCCTACGGGAGGCAGCAGT-3'. For the pvdD gene, the forward primer sequence was 5'- CGCTCCTCCAGGCATTCG-3', and the reverse primer sequence was 5'- GACCACATCTTCGGCTCGC-3'. For the pvdS gene, the forward primer sequence was 5'- CATGACACCGAGCAGTTCCAC-3', and the reverse primer sequence was 5'- CGGTCAGGGTCGAAGCGT-3'.The RT-PCR amplification was performed according to the instructions provided with the TB Green Premix Ex Taq™ II FAST qPCR (Takara, Japan) kit. Into each PCR tube, a reaction mix consisting of 10 μL of TB Green Premix Ex Taq™ II Fast qPCR (2×), 1 μL of PCR Forward Primer, 1 μL of PCR Reverse Primer, 2 μL of cDNA template, and 6 μL of sterilized water was assembled. Each sample set was allocated to three replicate wells, and the reaction was executed on a LightCycler 96 (Roche, Basel, Switzerland). The Real Time PCR conditions were as follows: initial denaturation at 95°C for 30 seconds; followed by 40 cycles of a two-step PCR involving denaturation at 95°C for 5 seconds and annealing/extension at 60°C for 10 seconds.
4.10. Statistical Methods
All experiments were done with 3 replications. SPSS 25.0 was used to analyze the data statistically; one-way ANOVA was used to compare the differences between multiple groups, and two-by-two comparisons within groups were made using the LSD-t test; pearson correlation analysis was used between the mean fluorescence intensity and the bacterial content. Differences were expressed as statistically significant at P < 0.05.
Author Contributions
All authors confirmed they have contributed to the intellectual content of this paper. Ao Du, Conceptualization, Data curation, Formal analysis, Investigation, Methodology, Validation, Visualization, Writing – original draft, Writing – review and editing | Xiaofen Sun, Data curation, Formal analysis, Investigation, Methodology | Meili Dong, Funding acquisition, Methodology, Formal analysis | Yong Liu , Methodology, Formal analysis | Mingwei Chen , Methodology, Formal analysis | Yuhan Wang, Methodology, Validation | Yuanzhi Zhang, Funding acquisition, Methodology, Project administration, Resources, Supervision | Yao Huang, Project administration, Supervision | Zhongsheng Li, Funding acquisition, Project administration, Formal analysis | Xiang Huang, Supervision, Funding acquisition | Yikun Wang, Supervision, Funding acquisition, Project administration, Resources | Jingshu Ni, Conceptualization, Supervision, Project administration, Resources, Writing – review and editing.