
Submitted:
25 November 2024
Posted:
26 November 2024
You are already at the latest version
Abstract
Under the new Labour leadership, the U.K. has set ambitious targets for renewable energy transition, aiming for 100% clean electricity by 2050. The government has pledged to establish a new publicly owned GB Energy company for electricity generation, raise windfall taxes on large oil and gas companies, and create a National Wealth Fund dedicated to government investment in energy transition. This paper demonstrates the economic benefits of energy transition, using regression models to analyze the role of a country’s renewable energy adoption in reducing household electricity costs and minimizing volatility in energy prices, finding a moderate correlation between these variables across the European Union markets. The larger goal of this paper is to explore how the U.K. government can reach renewable energy targets, given the country’s current budgetary constraints, while maintaining long-term economic stability. To achieve this, the paper simulates the impact of different renewable energy strategies on the U.K.’s budget deficit, before offering recommendations on the government’s energy transition approach. The paper concludes that increased government spending from pledged renewable energy initiatives could lead to an unsustainable budget deficit that is detrimental to the U.K.’s long-term economic health. Therefore, the government should consider greater reliance on private sector investment to drive energy transition efforts. The U.K.’s ability to navigate fiscal constraints while stimulating renewable energy adoption serves as a model for how increased renewable investment can benefit an economy.
Keywords:
renewable energy
; environmental economics
; U.K.
; Labour government
; energy
; budget
1. Introduction
Post Brexit, the British economy has been stagnant and further weakened by the Covid pandemic. In addition to the cost of living crisis, approximately nine million UK households are in fuel poverty and over five million citizens are unable to pay their energy bills (Gov 2023). The newly elected UK government (under Labour leadership) looks to position the UK economy for a more economically and environmentally sustainable future and expects its focus on the renewable energy industry to play a key part in its growth plans through ambitious targets. The UK government has pledged net zero emissions by 2050 and 100% clean electricity by 2035. (Labour 2024). The Labour government plans to facilitate this transition through revenue from their revamped windfall tax on oil & gas companies, a publicly owned clean power company called GB energy, and a new National Wealth Fund to stimulate private investment into renewables.
To date, the UK has been able to maintain modest growth in renewable energy usage largely due to an abundance of wind power and favorable energy subsidies. However, the UK also continues to invest heavily in the fossil fuel industry with schemes financing £88 billion worth of activity since 2015, compared to only £60 billion for renewables (Guardian 2023). This research paper will analyze how the UK can feasibly transition to their renewable targets given their current fiscal constraints and continued investment into fossil fuels. The UK government is currently operating a budget deficit of £121 billion, roughly 4.5% of the country’s GDP (Gov 2024). This paper will assess the limitations of debt financing in facilitating energy transition and bridging the gap between the UK’s renewable energy usage and some of its more successful European counterparts. The objective of this paper is to evaluate the economic effectiveness of the Labour party’s approach to renewable energy transition and explore different policies the UK government could use to facilitate this change.
Following a recession, rising inflation rates, and the current cost of living crisis, the UK’s economic condition has sparked intense debates over whether the government is doing enough to stimulate the economy. Therefore, alongside the UK economic growth plan, this research paper tackles the broader role of the government in stimulating the economy and overall trends in government intervention through fiscal policy. This paper will contrast the views of traditional economists such as Keynes with modern monetary theorists like Kelton, evaluating the relevance of their beliefs in government’s approach to economic growth and the balance between intervention and laissez-faire in modern economic policy. The paper aims to explore how the UK can successfully tackle its ongoing challenges and position itself for a more prosperous economic future.
2. Literature Review
2.1. Review of Current UK Economy and Energy Transition
Since the 2008 financial crisis, Britain has faced numerous challenges to grow its economy. In 2010, David Cameron’s austerity program looked to reduce the current account deficit of 10% of GDP that occurred under Labor, cutting public spending and increasing taxes. This strategy reduced public expenditures by over £110 billion in 2010 (IFS 2010). While the government was able to avoid a prolonged depression, these budget cuts resulted in stagnant growth of less than 1%/year and rising unemployment (Oxfam 2013). In the following years, a lack of investment into R&D caused worker productivity to fall 18% below the G7 average (Oxfam 2013). The decision to leave the EU through Brexit exacerbated these issues as decreased foreign investment and trading restrictions hampered economic growth, as shown when the Bank of England implemented interest rates of 0.25% following GDP growth of less than 1.5% that year (Gov 2016).
During the pandemic, Brexit made it difficult for Britain to import goods as the economy continued to stagnate with reduced working hours augmenting the productivity gap between Britain and the G7. Therefore, the government drastically increased public spending for Covid 19, spending upwards of £300 billion on preventative measures in an effort to minimize the economic effects of a prolonged lockdown (IMF 2020). However, even with this increased spending, poor policy management resulted in longer lockdowns and reduced economic productivity compared to European counterparts, who could easily trade within the EU.
After the pandemic, Liz Truss’s “mini budget” (a trickle-down economics policy designed to stimulate economic growth through drastic 20%+ tax cuts), caused significant economic uncertainty, sharply declining the value of the pound and increasing skepticism in the UK’s economic outlook since the government would have needed extremely high borrowing to account for the proposed tax cuts (NEISR 2023). While the program was eventually canceled, a lack of Budget Responsibility (OBR) oversight and stark changes left the UK in a dire economic situation through the early 2020s, leaving Prime Minister Sunak to deal with a cost-of-living crisis and a looming recession.
A combination of poor economic policy under conservative leadership especially regarding budget deficit spending has left the UK government with few opportunities to incentivize renewable energy programs, choosing to prolong investment into fossil fuel giants like Shell and BP. For example, renewable investment in the UK only overtook fossil fuel funding in 2023 (Jones 2023). Furthermore, there is a lack of significant private investment into British renewable energy, largely attributable to Brexit investment barriers, lack of proactivity under conservatives, and policy uncertainty in the past decade. Analysis has projected that the UK could produce 13 times more renewable energy than their current production given an abundance of renewable sources due to the UK geography. (University of Exeter 2024). The Russia-Ukraine war uncovered years of foreign energy dependence with Brexit highlighting difficulty of importing key resources like energy to the UK. Depleting oil reserves in the North Sea make it imperative that the UK prioritizes energy transition for a more economically sustainable future.
2.2. UK Energy Transition Planning + Benefits
Under Prime Minister Keir Starmer, the Labour government has made renewable targets one of their key priorities during their campaign whilst promising no increases in income and VAT for British households. The government plans to achieve this energy transition through a three-step strategy that will stimulate both public and private investment into renewables.
Firstly, the government vows to continue the 35% windfall tax on oil & gas producers, a program designed to account for the indirect benefits that these companies received following energy price spikes during the Russia-Ukraine crisis (Labour 2024). Economic theory surrounding windfall taxes indicates that benefits are not realized by the consumer as they can discourage private investment into the country (Abdul-Salam 2024). While there is historical precedent for windfall tax benefits in the UK under Gordon Brown, a shift from £14 billion subsidies to sustained 75% windfall tax burden could strain energy transition efforts through supply uncertainty during renewable transition (New Economics Foundation 2024). The increased windfall tax implies government confidence to allocate capital for renewable investments over private companies.
The new publicly owned company GB Energy will use windfall tax revenue to generate renewable electricity sources and boost renewable energy adoption similar to entities like Ørsted Statkraft (Labour 2024). The goal is to burden the UK government with the fixed costs for renewable projects and realize the benefits of economies of scale in the future with reduced household electricity prices. The fund will also provide a centralized hub for resource allocation following the theory of government intervention as a necessity to stimulate economic growth. While comparable funds in Scandinavia have proved beneficial to long-term energy transition goals, the UK government will need to initially deploy significant funds from their budget and private sector to initiate renewable projects with high upfront costs. There is also economic skepticism over state-ownership in the electricity market hampering private projects and assumption of superior government allocation over private renewable investment.
The newly founded National Wealth Sovereign Fund attempts to attract lost private investment from Brexit and the windfall tax for the renewable industry (Labour 2024). These funds are typically used to mitigate the risk of private investment into an industry and preserve capital for large infrastructure projects. Wealth funds generally need significant upfront investment to have any real impact on a country’s economy as small capital allocation will not yield significant influence on large-scale projects.
Typically, renewable transition measures follow international energy crises and fundamentally change the economic structure and social effects of energy distribution within a country (Yang 2024). For the UK, the cost of living crisis, Russia-Ukraine war, and Brexit all led to sharp increases in household electricity prices through the early 2020s (Gov 2023). Renewable sources often lead to more self-sufficient energy supply which mitigates volatility and will ultimately improve energy efficiency (Rintamäki, Siddiqui, Salo 2017). This will lead to price and supply chain security independent of political risks in energy exports. Energy transition can also reveal unrealized geographic potential of diverse renewable energy sources and potentially lead to broader geopolitical shifts with stronger energy transition in more renewable favorable countries (abundant renewable sources). Some theorists have projected that mass energy transition will lead to the de-monopolization and decentralization of energy production creating a new market structure in the energy industry (Yang, Xia, Huang, Qian 2024). However, there are questions about how this dynamic will fare with a state-owned electricity generator.
While the UK energy transition seems promising, significant capital needs to be deployed to initiate these new ventures. The UK’s economic situation has given the Labour government challenging fiscal constraints with recent understanding of the consequences of austerity on one end and government overspending on the other. Therefore, as the UK navigates its renewable energy strategy, the country needs to consider their struggling economic position, strained private investment, and high upfront costs to centralize government investment.
2.3. Economic Rationale + Theory for Debt Financing to Stimulate Economic Growth
Governments, much like individual firms, sometimes use debt to stimulate their own economic growth. The rationale is led by theorists like Keynes who believe that during periods of economic uncertainty the government can intervene to account for lost spending in the private sector to keep the economy afloat (Keynes 1936). A Keynesian economics approach suggests that this short-term government support will lead to sustained economic growth and long-term debt management. In a demand-driven economy, where there are gaps in funding for supply, the government can intervene with a modest budget deficit that aligns with GDP growth and potential short-term increases in economic uncertainty (Phelps 2022) (Keynes 1936). Some economists cite debt financing as moderately impactful on the economy due to the multiplier effect wherein government intervention can have benefits in the economy beyond its direct investment. While the debt multiplier is small under normal economic conditions, during times of economic crisis, some models predict a multiplier effect of anywhere between 0.77 and 1, meaning every one percent of debt would yield 0.77% of GDP growth. Although debt financing is not an effective measure to rely on for economic growth, it can stimulate the economy during recessions and periods of uncertainty (Albonico, Ascari, Gobbi 2021).
While Keynesian strategy is used in a majority of the world’s developed economies, over-financing with debt has led to uncomfortable debt-GDP ratios, driving up interest rates and decreasing real government spending within its budget (Kamiguchi, Tamai 2023). Modern economist Stephanie Kelton critiques Keynesian economics and its modern application in government financing and anticipates accumulated risk with increasing debt/GDP ratio which could cause the developed economies to default (Burham 2020). The accumulation of debt without a promising GDP forecast drives up interest rates and discourages investor sentiment in a country’s economy thus devaluing the currency as investors sell government bonds (Seater 1993). In the context of the UK, Liz Truss’ £45bn unaccounted tax cuts without significant promise in GDP growth made bondholders uncertain of the UK’s economic outlook, which caused devaluation of the pound and a £30bn loss in the UK treasury (ONS 2024). This effect is caused by the Ricardian equivalence, which theorizes that economic stimulation through increased debt financing will be ultimately detrimental to a country’s economy. This is because consumers realize they will have to save to pay increased future taxes (due to higher interest rates that accumulate with debt): the deficit will not stimulate the economy to its expectations.
In the context of the UK and energy transition, the Labour Party believes that centralization of energy investment through government with GB Energy and the National Wealth Fund will result in more economic growth than through the private sector. The Labour government's position on government intervention to stimulate the economy is a transition back to more Keynesian economic theory away from private investment. A potential rationale to support this decision is the idea that government allocation of renewable resources will result in more control over renewable penetration, whereas private investment might simply lead to more profit. Centralizing green initiatives will have to be incorporated into the government budget, and in a country with a relatively high debt-GDP ratio for its economic size (111%), the government will have a fine line to manage its deficit with increased renewable investment allocation (IMF 2021).
To contextualize the UK’s current debt financing position, the World Bank classifies any debt-GDP ratio above 77% as a position that can hamper long-term economic growth, with a 175% ratio as a general red line for developed nations to not default on their debt. The OECD average ratio is 78%, which puts the UK at significantly higher risk when compared to countries in the same economic position (Caner, Greenes, Köhler-Geib 2010).
3. Methodologies
3.1. First Analysis: Budget Deficit Simulation for Renewable Strategies
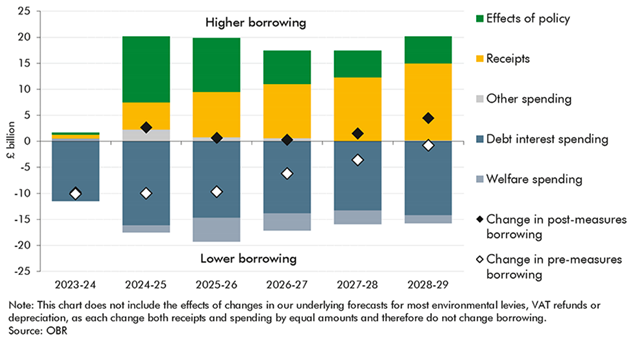
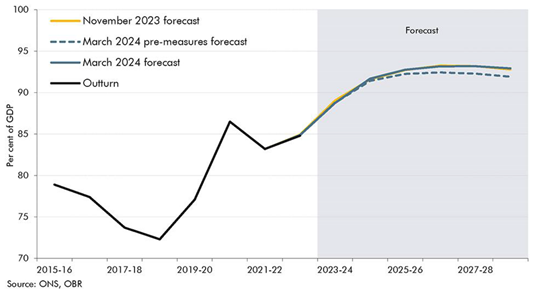
This method simulates different budget deficits and their economic impact on the UK. Using government data from the Office of Budget Responsibility (OBR), the analysis outlines different renewable strategies and their effect on the UK’s budget deficit. In the 2023-2024 FY, the UK operated at a budget deficit of 4.6% of the country’s GDP, and OBR forecasts a decrease in the next fiscal year to a deficit of 2.7% of GDP (cyclically adjusted for net borrowing) (OBR 2024). OBR predicts that the UK will operate in a budget surplus as early as 2028. Using five-year forecasts for future budget deficits and UK GDP growth, the model would need to consider government changes made in the Labour party’s agenda which promises no tax increases on consumers, likely increasing the budget deficit over this forecast. To contextualize the budget deficit, the average budget deficit within the OECD is 2.9% of GDP (OECD 2022).
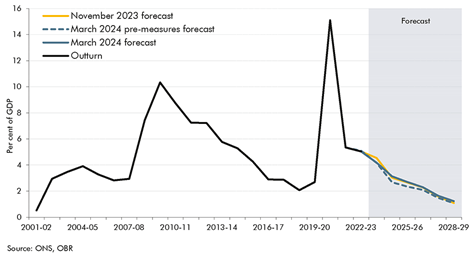
OBR Budget Deficit Forecast (2024-2029).
In terms of energy transition, the UK falls significantly behind its European counterparts, having spent only $33bn in the past three years on renewable initiatives while countries like Germany and France have spent upwards of $60bn (IEA 2024). To account for this difference, the model simulates three renewable strategies for the UK: the Labour government’s current plan, “adequate” renewable investment, and initial renewable transition pledge.
When calculating the allocation of government funding spent on renewable resources, the model does not consider National Wealth Fund expenditures as the government has pledged all windfall tax revenue to be directed towards the new Sovereign Wealth Fund. Within the budget, chancellor Rachel Reeves has identified a £22bn hole in government financing which could disrupt Labour’s budget plan (Labour 2024). This model assumes that the Labour government can account for half of the budget hole by reworking other government expenditures. The analysis predicts that the Labour party will also remove the unpopular two-child subsidy limit, which will cost roughly £2.5bn/yr (IFS 2024).
Within Labour’s current renewable energy investment strategy, they will allocate £1.7bn of funding to GB energy/year along with other renewable initiative expenditures that will total an extra £5bn/year in green investments in addition to the current £10bn/year (Labour 2024). While this extra investment will not drastically alter the budget deficit, experts believe this is insufficient investment to reach Labour’s renewable targets. The government will eventually need to invest in decarbonizing the power sector along with other aspects of the UK economy. Modest estimates from the Climate Change Committee predict that the UK needs to finance £10bn in new renewable initiatives to have a chance at meeting their climate goals (Chatham House 2024). This investment will be used as the analysis’ proxy for “adequate renewable investment.” Within Labour’s original manifesto, they pledged a £28bn/year in green funding before dropping the plan later in their election campaign (Labour 2021). This funding is more comparable to the gap between UK and German green investment per year so it can also be used as a model for adding the funding difference between the two governments.
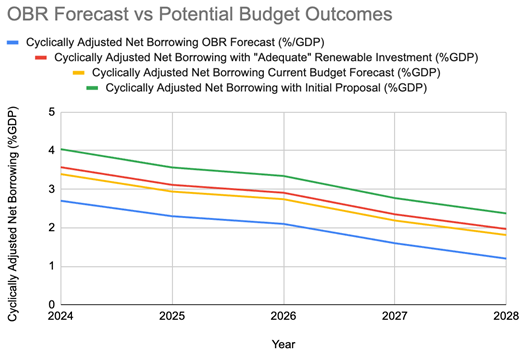
OBR Forecast vs Potential Budget Simulations (2024-2029).
After accounting for additional renewable expenditures, the analysis then considers interest accumulated on new debt by calculating the OBR forecasted interest rates and incorporating the expenses into the budget (OBR 2024).
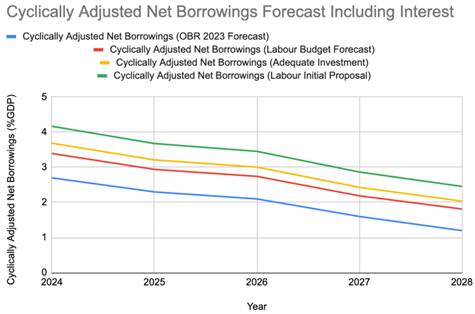
Cyclically Adjusted Net Borrowings Forecast Including Interest (2024-2029).
While including interest does not significantly increase the budget deficit YoY, interest rates could change as the UK government decides to incur more debt for green financing. When comparing the UK budget forecast to Germany, a similar size OECD with higher renewable adoption, it is evident that the UK cannot account for the difference in renewable investment. Germany is forecasted to operate with a consistent sub 2% of GDP budget deficit while the UK would operate with a budget deficit over 4% of GDP if they tried to match Germany’s renewable investment. The higher the budget deficit, the more economic uncertainty, and over prolonged periods could lead to potential inflation and economic decline as foreign investors are skeptical of the UK’s economic potential. Therefore, while the Labour government’s current strategy forecasted to stay within an adequate deficit, its rate of renewable adoption will likely not be sufficient to meet its renewable energy targets.
To improve this analysis, OBR budget deficit forecasting would need to consider Labour policies to maintain tax along with the current government financing hole, likely increasing the current budget deficit. However, the model does not consider the forecasted GDP growth from operating at this budget deficit. Furthermore, the model should also consider increasing interest rates if the Labour government decides to incur more debt along with other Labour government pledges/initiatives to stimulate the economy.
Overall, while it is difficult to predict the global market’s reaction to a UK budget deficit within these specific renewable strategies, the Labour government is forecasted to operate within a normal budget deficit over the next five years. However, if the UK tried to increase their renewable adoption, they would face problems of economic uncertainty as the deficit increases. Although Labour’s initial green strategy was not as extreme as Liz Truss’ mini budget, it would have likely led to some devaluation of the pound as investors would be skeptical seeing the UK operate with this kind of a sustained budget deficit. Currently, the UK budget forecast maintains within its economic boundaries but might not be enough to stimulate sufficient renewable energy growth within the country.
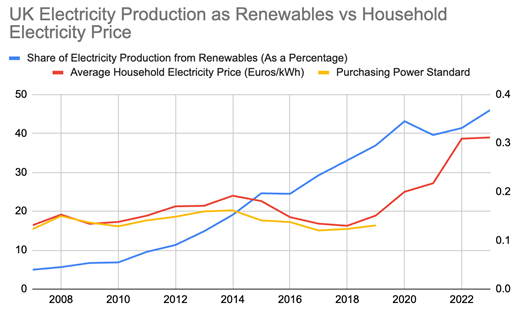
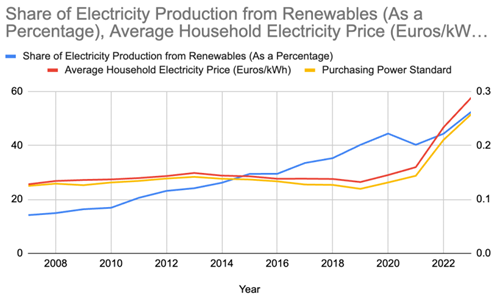
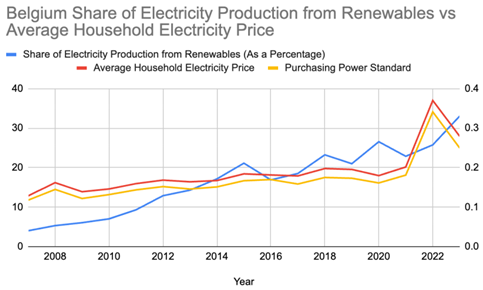
3.2. Second Analysis: Renewable Energy Adoption vs Electricity Prices
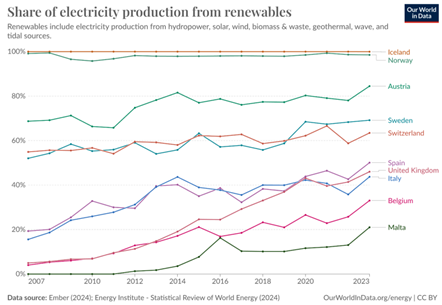
This second analysis models a correlation between the share of electricity production from renewables and average electricity price in Euros/Kilowatt hours between 2007-2023, aggregating for Purchasing Power Standard (PPS). The countries modeled are the EU27 and UK, encapsulating a range in share of electricity produced from renewable sources. On one end, countries like Iceland and Norway produce 99%+ of their electricity from renewable sources while countries like Malta only produce 20% of their electricity from renewables (Our World in Data (OWID) 2023) .
This model standardizes household electricity prices to Euro/kWh to account for differences in energy consumption that vary considerably country by country. It also does not account for taxes and levies that a government might impose onto its citizens, which is unstandardized variability dependent on government regulations. Data between 2007-2019 is generally a lot cleaner than results from the last five years due to events that have dramatically affected the energy industry like the Russia-Ukraine war and pandemic, both of which put strains on energy supply and demand dynamics to varying degrees in different countries. However, it is interesting to note the overall trend into 2023/2024 of increased share of renewables to decreasing prices as economies begin to recover from these energy surges.
The correlation model covered a range of countries: UK, Germany, Norway, Sweden, Iceland, Belgium, Spain, Austria, Malta, and Italy. When comparing countries' share of electricity on renewables to electricity price, data between 2007-2019 shows relatively flatline electricity prices as renewable energy adoption increases. However, this data using the euro currency does not account for inflation within the respective countries, which could indicate more value for money for citizens in countries with flatline electricity bills. Overall, the data shows little direct correlation between increasing renewable energy adoption and lowering electricity bills, a phenomenon which could be attributed to varying infrastructure costs of relative countries, policies surrounding fair energy pricing. While this trend follows within a country, on an absolute level, countries with renewable adoption have lower electricity prices on a Euro/kWh basis.
Example of the data collected (UK) from 2007-2008:
| Year | Share of Electricity Production from Renewables (As a Percentage) | Average Household Electricity Price (Euros/kWh) | Average Household Electricity Price (Purchasing Power Standard) | Percentage Change YoY (Euros/kWh) | Percentage Change YoY (Purchasing Power Standard) |
| 2007 | 4.96 | 0.1311 | 0.1231 | ||
| 2008 | 5.64 | 0.1530 | 0.15 | 16.7048 | 21.8522 |
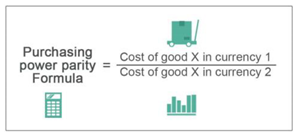
Generally, countries with extremely high renewable adoption like Norway, Sweden, and Iceland have lower average household electricity bills in absolute terms using the Euros/kWh metric. For example, Norway and Iceland had 0.1521 and 0.1274 €/kWh electricity bills respectively. These nations both boast renewable energy adoption of over 99%. On the other hand, countries like Spain and the UK with renewable adoption less than 50% have significantly higher electricity prices per kWh (0.2068 and 0.3317 €/kWh) (Eurostat 2023). However, in order to truly compare electricity bills across countries, the model has to aggregate using the purchasing power standard to account for relative economy sizes and inflation by considering economic strength and purchasing power parity. The purchasing power standard currency is calculated by dividing an economic aggregate (i.e GDP) by the country’s respective purchasing power parity (PPP) (Eurostat 2023). For example, whilst Germany and France could have similar PPPs, Germany’s higher GDP will lead to a lower PPS. PPS is used by Eurostat as a currency that can buy the same amount of goods and services in each country, taking into account relative economic strengths and inflation.
When comparing to the purchasing power standard aggregate currency, we find even more of a disparity between countries with renewable adoption and those without renewable electricity penetration. For example, using data from 2019 (the last year unaffected by the pandemic) the top five countries with the lowest electricity bills, adjusted for purchasing power, all had over 25% more renewable electricity penetration than the EU average of 34%. As we see electricity bills recover after variability caused by the pandemic and Russia-Ukraine crisis, we should see this gap widen between countries in their investment into renewable electricity penetration. However, when correlating renewables to electricity price, the methodology should also consider the financial capability of certain countries with stronger economies which will tend to have access to a significant share of electricity from renewables.
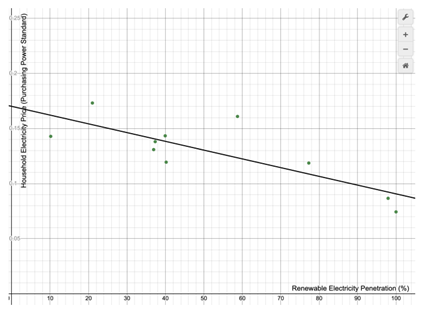
Correlation Model: Renewable Adoption vs Household Electricity Price.
Modeling renewable penetration to household electricity price (PPS) for the selection of countries, there is a moderately negative correlation with an r^2 of 0.65, indicating higher renewable penetration and established renewable infrastructure will result in long term reduced household electricity prices. Inflection points like Iceland/Norway with high renewable percentages and Belgium with lower renewable penetration augment this correlation. However, when evaluating the entire European Union to this standard, the methodology finds significantly lower correlation with an r^2 of 0.15. This is likely due to the lack of compatibility between nations of different economic development, explaining why more economically developed countries within the EU tend to follow a similar correlation as they are in similar economic situations.
When evaluating the UK using this methodology, the analysis finds relatively modest household electricity prices as renewable adoption increases from 2007-2019. However, after the UK’s poor economic decisions during and after the pandemic, electricity prices skyrocketed to 0.3117 €/kWh. Another trend we can see is a lack of growth in renewable adoption after the pandemic, likely due to the high upfront costs associated with renewables and strained renewable funds. The government hopes that increased funding in the GB energy initiative and National Wealth fund will stimulate both economic and renewable electricity adoption, helping mitigate the effects of poor policy and resource management that caused increased electricity bills. In 2022, UK low income households spent 15% of their total income on electricity bills, while this number was only 5% in Germany (Statista 2022). Correlating renewable electricity penetration with share of total income in households exacerbates the gap renewable adoption can have on an economy, but should also consider absolute electricity usage and economic strength.
3.3. Third Analysis: Renewable Energy Adoption vs Electricity Price Volatility
This third piece of analysis attempts to model the volatility of various OECD European countries based on their renewable electricity penetration. Using data from Eurostat, the analysis accounts for differences in prices through the Purchasing Power Standard currency. This allows the methodology to create more easily comparable data across countries with varying household electricity prices.
Using the same OECDs in the EU, the analysis first models household electricity percentage change YoY and evaluates the standard deviation of this percentage change and also the variability in household electricity prices. However, this proves difficult for comparison as the methodology cannot easily account for deviation of a constantly variable average electricity price. An intriguing observation from the previously attempted methodology is that Iceland, a country with 100% renewable electricity and complete energy self-sufficiency, experienced a significantly lower average percentage change YoY for household electricity prices- just 3%, compared to the sampled average of 6% (Eurostat 2023). The model shifted to understand electricity price volatility between 2021 and 2022, likely attributed to the Russia Ukraine Crisis.
Using the purchasing power currency, the analysis averages household electricity prices between 2020 and 2021 before calculating the 2022 percentage change from that average. Those results are graphed on a correlation plot to renewable electricity penetration. The plot has omitted Malta’s results from the dataset as a significant outlier that had electricity prices decrease due to high regulation in 2022. It also should be noted that the UK’s household electricity price to purchasing power standard was calculated using purchasing power parity from the OECD database rather than through Eurostat as the EU had stopped collecting data on the UK post-Brexit (OECD 2018).
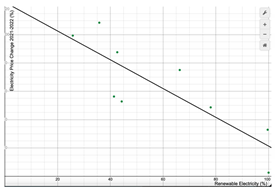
Correlation model: Renewable Energy Adoption vs Electricity Price Volatility.
The data indicates a moderately strong negative correlation between renewable energy percentage and volatility in 2022 after the Russia-Ukraine crisis with an r^2 value of 0.7. This trend can be attributed to a greater reliance on foreign sources for electricity and a potential necessity of Russian resources as key imports for electricity generation. Countries with higher renewable electricity penetration are generally more self-sufficient in energy generation and do not have to rely on foreign sources for electricity, which can be volatile due to political risks and dependence on exporting supply security (Wassénius 2023).
Understanding volatility on a country-by-country basis, the average percentage change between 2021 and 2022 was 80% for countries with less than 50% renewable electricity penetration, while it was only 40% for countries with over 50% renewable penetration. Italy and Belgium, countries with less than 35% renewable electricity percentage at the time, experienced household electricity prices increase by upwards of 100% through the purchasing power standard currency. However, countries like Norway and Iceland with 99%+ renewable electricity penetration, experienced price increases of 32% and 2.5% respectively. Increasing renewable infrastructure and thus energy self-sufficiency protects a country’s citizens from energy price volatility and dependence on foreign political instability which could affect resource prices. However, countries should also account for risks of their own supply volatility when turning to increased energy self-sufficiency.
To improve this methodology, one would need access to reliable running data for monthly electricity bills to understand variability within a smaller time frame. Future correlations could also map the percentage of electricity related imports from Russia to volatility as a way to reinforce the need for renewable electricity for energy self-sufficiency and security.
4. Conclusion + Recommendations
When evaluating the UK’s energy transition strategy to meet its renewable goals, the government’s current economic position constraints many opportunities for investment. To contextualize the UK’s economic position for renewable energy transition, it is clear that investment into renewable sources has benefits on a country’s economy such as reduced electricity prices and volatility. Furthermore, green investments provide a pathway for the government to transition depleting oil & gas resources into economic growth in the climate sector. This set of recommendations considers the UK’s fiscal constraints, urgent need to scale renewable investment, and economic position globally.
Firstly, since the government is unable to provide sufficient support through their national budget, the UK government should look to further incentivize private forms of investment into UK renewable initiatives. GB Energy’s £1.7bn high upfront cost makes it an inefficient investment to centralize British energy generation as new funds should be directed towards private renewable investment programs (i.e subsidies) (Gov 2024). This allows the UK to collect tax revenues on these new initiatives and private investments generally offer better returns with reduced risk to the Labour government. With regards to the windfall tax, the UK government should offer tax breaks to major oil & gas companies to incentivize private renewable investment projects. This will minimize the tax burden/risk associated with strained energy transition supply whilst preparing for long term renewable projects. For example, the government could issue an investment tax credit on a specific amount of renewable energy investments, allowing companies to claim the original 25% windfall tax levy rather than the current 35% rate. The windfall tax is an unsustainable revenue source and therefore the government needs to prepare for other ways to reduce energy prices and upscale their renewable infrastructure (Labour 2024).
Secondly, the UK government should re-evaluate their position on the National Wealth Fund. Sustained government revenue from windfall tax levies is not a long term solution for funding and sovereign wealth funds need extremely high capital investment for scale to have significant effects on a country’s economy. Therefore, resource reallocation into private wealth funds or tax credits dedicated to domestic renewable investment will minimize capital burden on the government, especially with fine lines surrounding budget allocation. When comparing the National Wealth Fund (£10bn) to other sovereign wealth funds (i.e German Climate Fund £100+ bn), it is clear that the UK does not have the financial capacity to support these types of large scale projects to yield the same economic and climate impact (Labour, German Ministry 2024).
While investment into the private sector could yield more profit, there is a risk of lack of government control surrounding resource allocation and potentially minimized efficiency of renewable adoption at the expense of profit. Therefore, while closing the budget deficit, the government should potentially explore different types of emissions levies. For example, by scaling an emissions trading infrastructure, the government can minimize the negative externalities of pollution in all aspects of the economy. This revenue can then be reallocated for government spending into renewable initiatives and minimize future budget deficits under Labour. If the government decides to introduce widespread emissions trading, it is likely that consumers will bear the consequences, resulting in increased inflation (Du 2013). When implementing this program, the government will have to evaluate the tradeoff of a reduced budget deficit with potential impacts on the consumer as emissions trading affects firms.
The UK’s economic outlook is promising, but the need for sufficient energy transition investment is still urgent. Once the Labour government has outlined the 2024-2025 budget, it will become easier to contextualize the UK’s economic situation with Labour’s goals and their renewable energy intentions. It is imperative that the Labour government allocates significant funding to renewable energy projects within its 2024-2025 agenda as status quo investment will not satisfy the UK’s energy transition goals. However, the government must manage its budget deficit as the UK continues to recover from the pandemic and energy price surges. Not only will this investment stabilize electricity prices for consumers, but it will also place the UK in a favorable position to meet its renewable energy targets and stimulate long term economic growth.
Appendix
Author’s Own Analysis (Eurostat 2023, Our World in Data 2023, OBR 2024).
Author’s Own Analysis (Eurostat 2023, Our World in Data 2023, OBR 2024).
Author’s Own Analysis (Eurostat 2023, Our World in Data 2023, OBR 2024).
Author’s Own Analysis (Eurostat 2023, Our World in Data 2023, OBR 2024).
OBR Borrowing Forecast 2024-2029 (OBR 2024).
OBR Real GDP 2024 Future Forecast 2024-2029 (OBR 2024).
OBR Interest Payment Forecast 2024-2029 (OBR 2024).
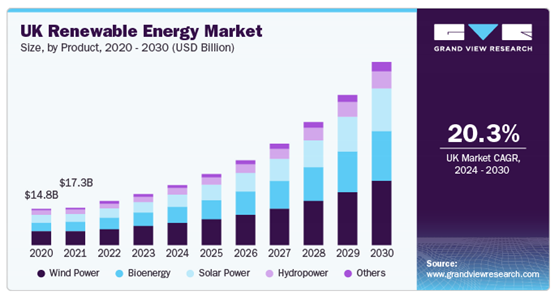
UK Renewable Market Forecast (Grand View Research 2023).
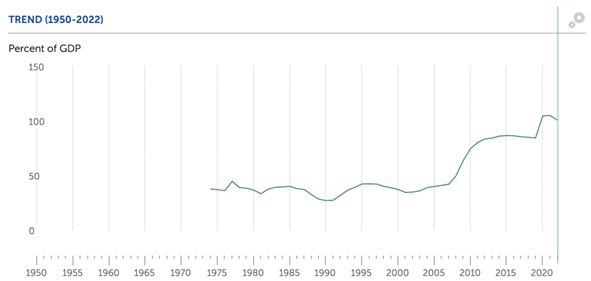
UK Debt to GDP Ratio (IMF 2023).
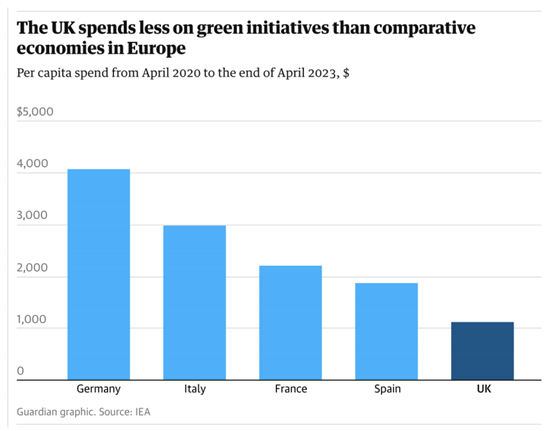
UK Per Capita Spending on Green Initiatives vs European Counterparts (IEA, Guardian 2023).
References
- Albonico, Alice, Guido Ascari, and Alessandro Gobbi. “The Public Debt Multiplier.” Journal of Economic Dynamics and Control 132 (November 1, 2021): 104204–4. [CrossRef]
- Akira Kamiguchi, and Toshiki Tamai. “Public Investment, National Debt, and Economic Growth: The Role of Debt Finance under Dynamic Inefficiency.” Journal of Macroeconomics 77 (September 1, 2023): 103535–35. [CrossRef]
- Burnham, Terence C. “Stephanie Kelton, the Deficit Myth: Modern Monetary Theory and the Birth of the People’s Economy.” Journal of Bioeconomics 22, no. 3 (September 29, 2020): 205–11. [CrossRef]
- Caner, Mehmet, Thomas J. Grennes, and Friederike (Fritzi) N. Köhler-Geib. “Finding the Tipping Point - When Sovereign Debt Turns Bad.” SSRN Electronic Journal, 2010. [CrossRef]
- Change Labour Party Manifesto 2024, n.d.
- Climate Change Committee. “The Sixth Carbon Budget Electricity Generation,” 2020. Available online: https://www.theccc.org.uk/wp-content/uploads/2020/12/Sector-summary-Electricity-generation.pdf.
- Department for. “Electricity Statistics.” GOV.UK, September 25, 2023. Available online: https://www.gov.uk/government/collections/electricity-statistics.
- Department for. “Fuel Poverty Statistics.” GOV.UK, September 18, 2013. Available online: https://www.gov.uk/government/collections/fuel-poverty-statistics.
- Du, Shaofu, Lili Zhu, Liang Liang, and Fang Ma. “Emission-Dependent Supply Chain and Environment-Policy-Making in the ‘Cap-And-Trade’ System.” Energy Policy 57 (June 1, 2013): 61–67. [CrossRef]
- Europa.eu. “Eurostat,” 2024. Available online: https://ec.europa.eu/eurostat/data/database.
- Europa.eu. “Glossary: Purchasing Power Standard (PPS) - Statistics Explained,” 2014. Available online: https://ec.europa.eu/eurostat/statistics-explained/index.php?title=Glossary:Purchasing_power_standard_(PPS).
- Friends of the Earth | Policy and insight. “How England Can Produce More Onshore Renewable Energy Fast | Policy and Insight,” 2024. Available online: https://policy.friendsoftheearth.uk/insight/how-england-can-produce-more-onshore-renewable-energy-fast.
- Grandviewresearch.com. “UK Renewable Energy Market Size | Industry Report, 2030,” 2023. Available online: https://www.grandviewresearch.com/industry-analysis/uk-renewable-energy-market-report#:~:text=The%20UK%20renewable%20energy%20market%20is%20expected%20to%20grow%20at,USD%2072.1%20billion%20by%202030.
- Harvey, Fiona. “UK Spends Least among Major European Economies on Low-Carbon Energy Policy, Study Shows.” the Guardian. The Guardian, March 5, 2024. Available online: https://www.theguardian.com/environment/2024/mar/05/uk-spends-least-among-major-european-economies-on-low-carbon-energy-policy-study-shows#:~:text=Per%20capita%20spend%20from%20April,the%20end%20of%20April%202023%2C%20%24&text=When%20spending%20on%20energy%20affordability,Germany%20and%20%241%2C880%20in%20Italy.
- Henley Business School. “Growth and Great British Energy - a Labour Dream?,” 2020.
- HM Revenue & Customs. “Bank of England Cuts Bank Rate to 0.25%.” GOV.UK, August 5, 2016. Available online: https://www.gov.uk/government/news/bank-of-england-cuts-bank-rate-to-025.
- IMF. “Policy Responses to COVID-19,” March 20, 2020. Available online: https://www.imf.org/en/Topics/imf-and-covid19/Policy-Responses-to-COVID-19.
- Imf.org, 2021. Available online: https://www.imf.org/external/datamapper/CG_DEBT_GDP@GDD/CHN/FRA/DEU/ITA/JPN/GBR/USA.
- Institute for Fiscal Studies. “How Have English Councils’ Funding and Spending Changed? 2010 to 2024,” June 7, 2024. Available online: https://ifs.org.uk/publications/how-have-english-councils-funding-and-spending-changed-2010-2024.
- Institute for Fiscal Studies. “The Two-Child Limit: Poverty, Incentives and Cost,” June 17, 2024. Available online: https://ifs.org.uk/articles/two-child-limit-poverty-incentives-and-cost.
- Jones, Florence. “In Charts: UK Clean Energy Investment Jumps in 2023 but ‘Acceleration’ Still Needed.” Sustainableviews.com, 2023.
- Keep, Matthew. “The Budget Deficit: A Short Guide.” House of Commons Library, August 20, 2024.
- Keynes, John Maynard, 1883-1946. The General Theory of Employment, Interest and Money. London: Macmillan, 1936.
- NIESR. “The Truss/Kwarteng Mini Budget: One Year on - NIESR,” 2023. Available online: https://www.niesr.ac.uk/blog/truss-kwarteng-mini-budget-one-year.
- New Economics Foundation. “The Windfall Tax Was Supposed to Rein in Fossil Fuel Profits. Instead It Has Saved Corporations Billions,” 2023.
- OECD. “Data,” 2024. Available online: https://www.oecd.org/en/data.html.
- Office for Budget Responsibility. “Economy Pages - Office for Budget Responsibility,” 2024. Available online: https://obr.uk/forecasts-in-depth/the-economy-forecast/.
- Office for Budget Responsibility. “EFOs - Office for Budget Responsibility,” 2024. Available online: https://obr.uk/economic-and-fiscal-outlooks/.
- Oxfam. “The True Cost of Austerity and Inequality UK Case Study Pre-Crisis UK,” September 2013.
- Perry, Neil, Stuart Rosewarne, and Graham White. “Clean Energy Policy: Taxing Carbon and the Illusion of the Equity Objective.” Ecological Economics 90 (June 1, 2013): 104–13. [CrossRef]
- Phelps, Edmund. “Public Debt: My Dissent from ‘Keynesian’ Theories.” Journal of Government and Economics 5 (January 1, 2022): 100029–29. [CrossRef]
- Public. “UK Government Debt and Deficit.” Ons.gov.uk. Office for National Statistics, April 29, 2024. Available online: https://www.ons.gov.uk/economy/governmentpublicsectorandtaxes/publicspending/bulletins/ukgovernmentdebtanddeficitforeurostatmaast/december2023#:~:text=View%20all%20data%20used%20in,for%20the%20general%20government%20sector.
- Pye, Steve, Nagore Sabio, and Neil Strachan. “An Integrated Systematic Analysis of Uncertainties in UK Energy Transition Pathways.” Energy Policy 87 (December 1, 2015): 673–84. [CrossRef]
- Seater, John J. “Ricardian Equivalence.” Journal of Economic Literature 31, no. 1 (1993): 142–90. Available online: http://www.jstor.org/stable/2728152.
- Statista. “Europe: Energy Costs Share in Low Income Households 2022 | Statista.” Statista, 2022. Available online: https://www.statista.com/statistics/1327716/energy-costs-share-in-low-income-households-europe/.
- Tuomas Rintamäki, Afzal S Siddiqui, and Ahti Salo. “Does Renewable Energy Generation Decrease the Volatility of Electricity Prices? An Analysis of Denmark and Germany.” Energy Economics 62 (February 1, 2017): 270–82. [CrossRef]
- Yang, Yu, Siyou Xia, Ping Huang, and Junxi Qian. “Energy Transition: Connotations, Mechanisms and Effects.” Energy Strategy Reviews 52 (March 1, 2024): 101320–20. [CrossRef]
- Yakubu Abdul-Salam. “Examining the Effect of the UK Oil and Gas Windfall Tax on the Economics of New Fields in the UKCS Province.” Resources Policy 88 (January 1, 2024): 104447–47. [CrossRef]
Disclaimer/Publisher’s Note: The statements, opinions and data contained in all publications are solely those of the individual author(s) and contributor(s) and not of MDPI and/or the editor(s). MDPI and/or the editor(s) disclaim responsibility for any injury to people or property resulting from any ideas, methods, instructions or products referred to in the content. |
© 2024 by the authors. Licensee MDPI, Basel, Switzerland. This article is an open access article distributed under the terms and conditions of the Creative Commons Attribution (CC BY) license (http://creativecommons.org/licenses/by/4.0/).
Copyright: This open access article is published under a Creative Commons CC BY 4.0 license, which permit the free download, distribution, and reuse, provided that the author and preprint are cited in any reuse.


